KFF/New York Times 2025 Survey of Immigrants: Health and Health Care Experiences During the Second Trump Administration
Editorial Note
This brief was updated on February 11, 2026 to clarify what the data on reported usual source of care for immigrant adults represent.
Findings
Actions taken by the Trump administration and Congress will likely have major impacts on health and health care for immigrant families. As of June 2025, there were 51.9 million immigrants residing in the U.S. representing diverse backgrounds and experiences. In addition, about one in four children in the U.S. has at least one immigrant parent, and the vast majority of these children are U.S. citizens. President Trump’s increased immigration enforcement activity has contributed to resounding levels of fear and uncertainty among the immigrant community, which can negatively affect the health and well-being of immigrant families and make them more reluctant to access health coverage as well as health care. Moreover, the 2025 tax and spending law and other recent policy changes will further limit access to health coverage and services for many lawfully present immigrants who already face eligibility restrictions for federally funded coverage options, amid broader projected coverage reductions and anticipated increases in health care costs.
This report provides new data on health and health care experiences of immigrant adults ages 18 and over in the U.S. amid the current policy environment. It is based on a KFF survey conducted in partnership with The New York Times in Fall 2025. It builds on the 2023 KFF/LA Times Survey of Immigrants and two additional surveys conducted by KFF in 2024 and 2025. Separate reports examine immigrants’ experiences amid increased immigration enforcement and the political implications of immigrant voters’ views on immigration enforcement.
Key Takeaways
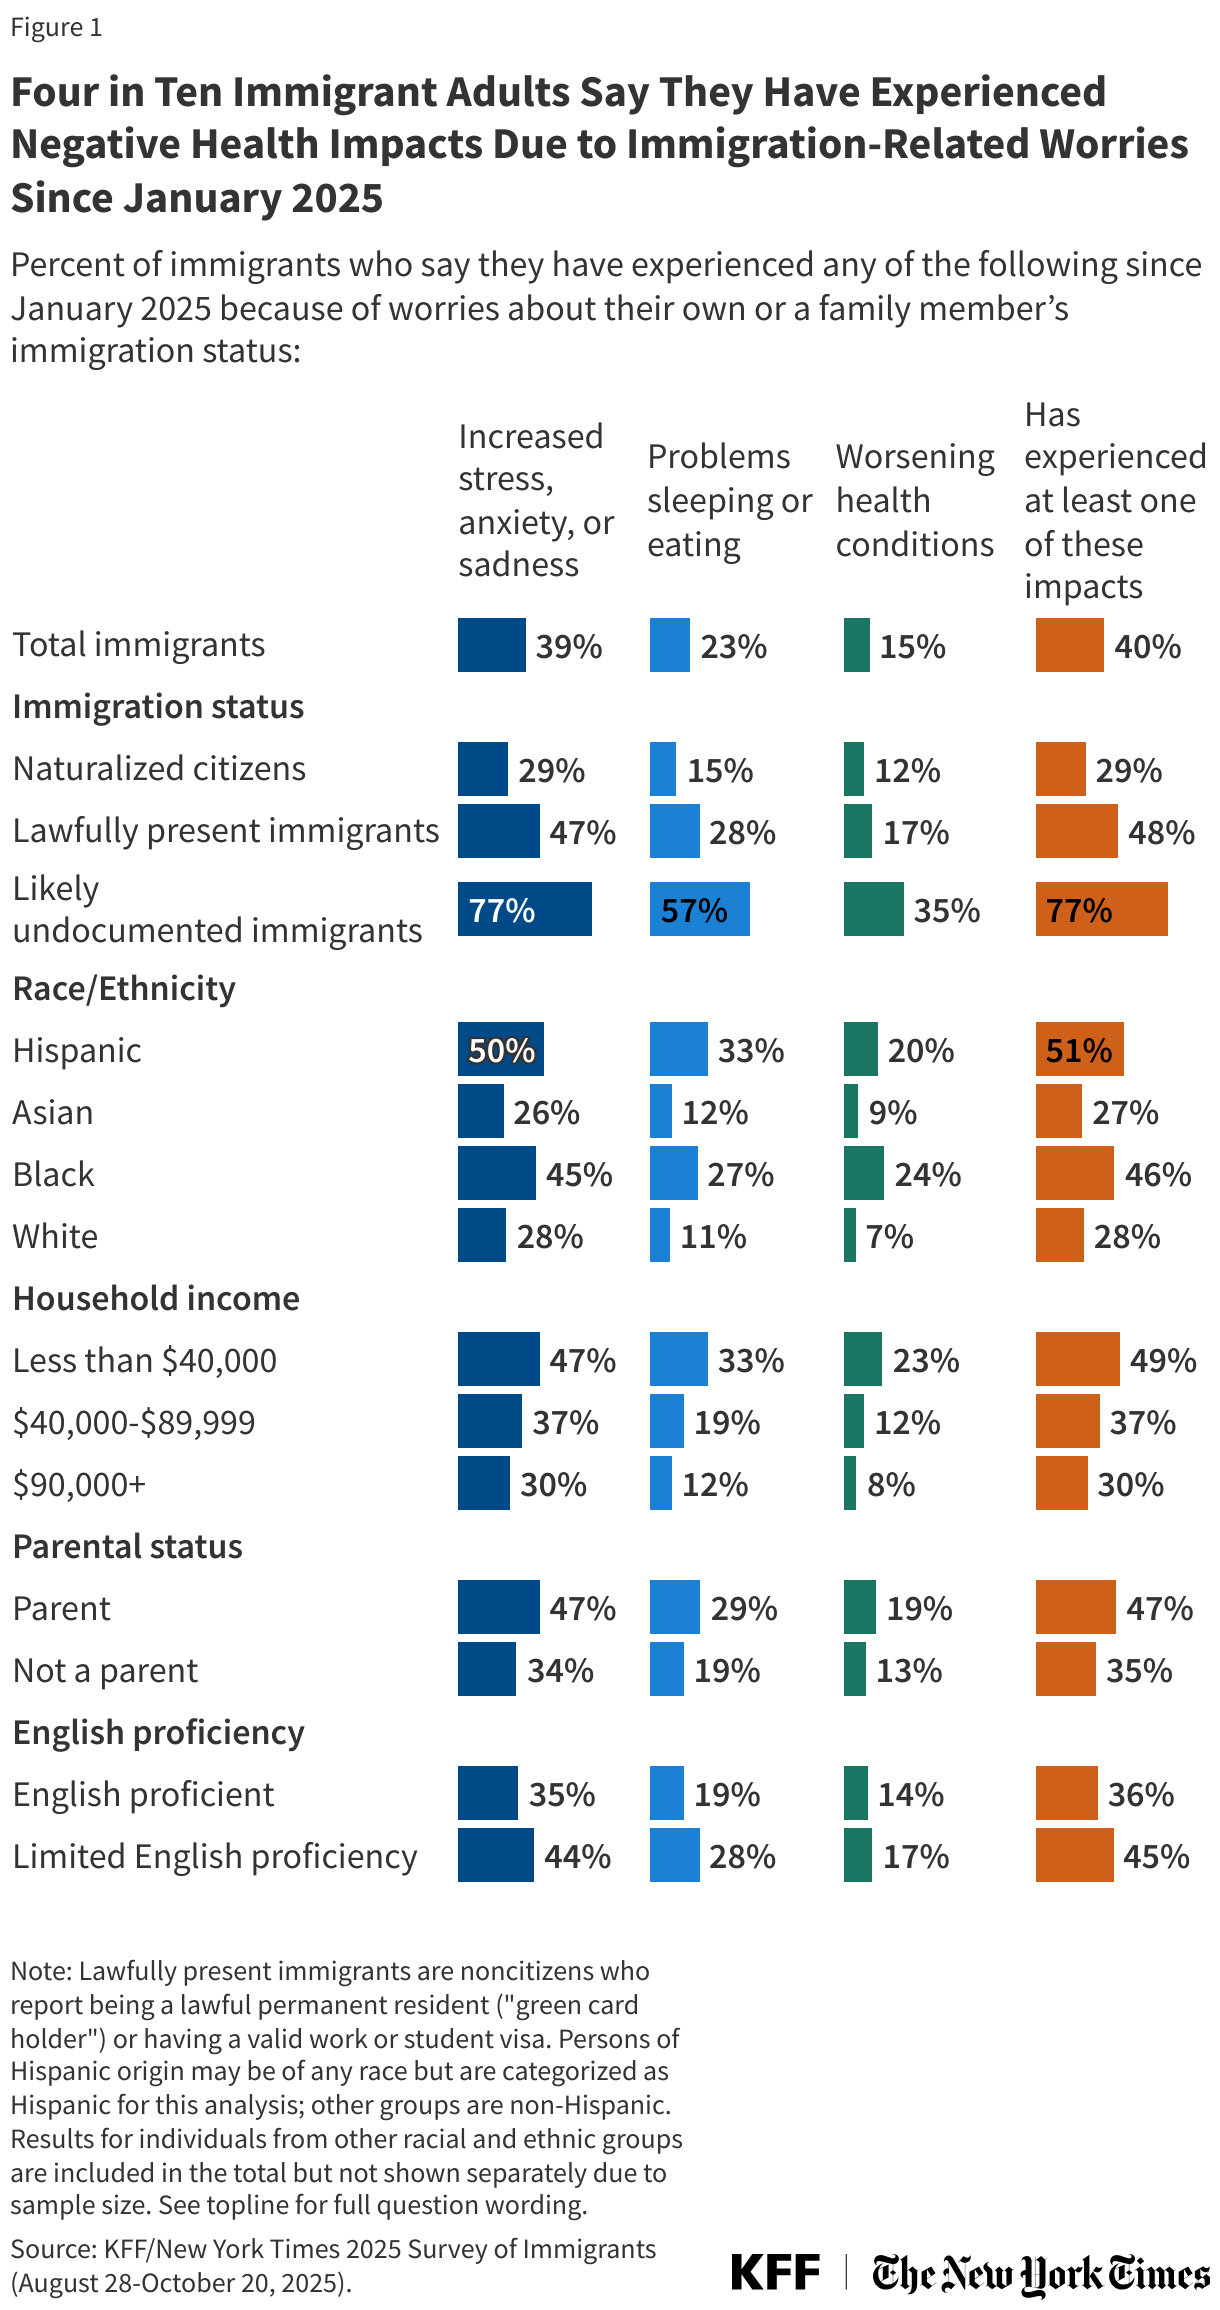
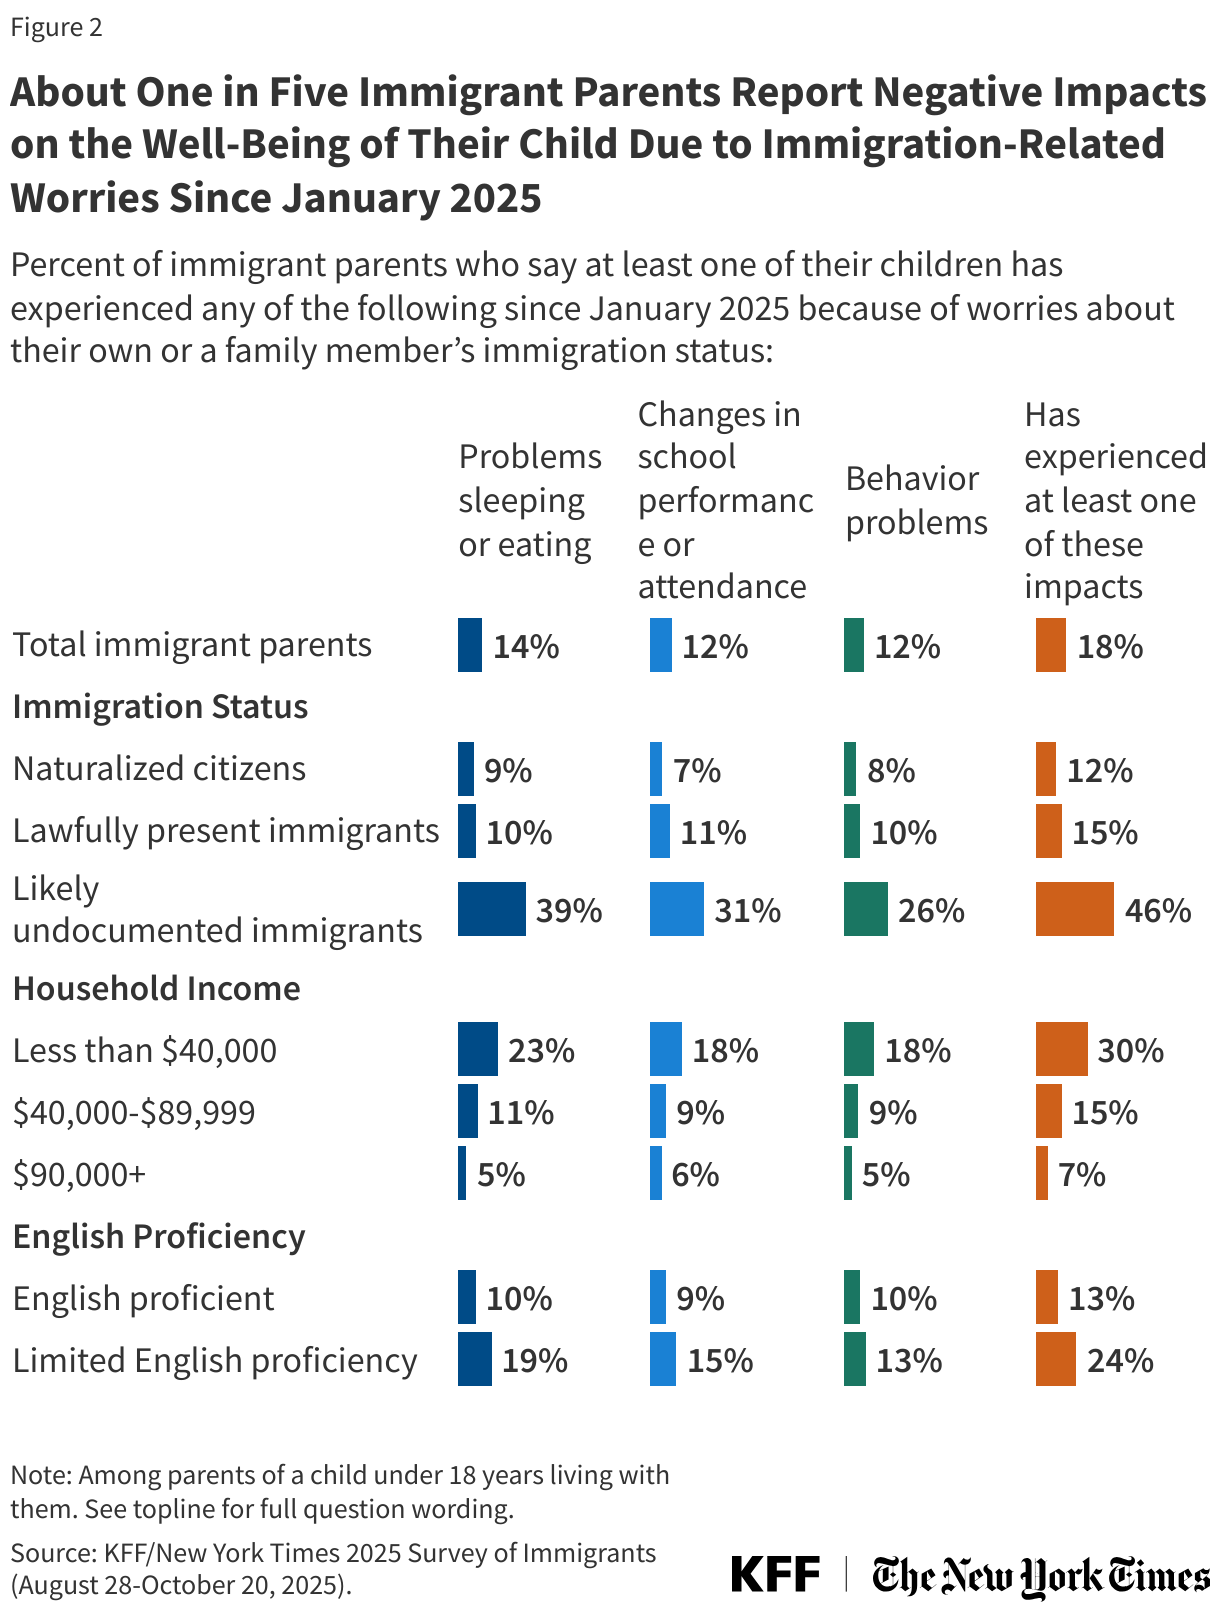
- Since President Trump took office in January 2025, four in ten (40%) immigrant adults overall and nearly eight in ten (77%) likely undocumented immigrants say they have experienced negative health impacts due to immigration-related worries. These negative impacts include increased stress, anxiety, or sadness; problems sleeping or eating; and/or worsening health conditions like diabetes or high blood pressure. Notably, nearly half (47%) of lawfully present immigrants and about three in ten (29%) of naturalized citizens report at least one of these impacts. Among immigrant parents, about one in five (18%) say that their child’s well-being has been impacted since January 2025, including problems sleeping or eating, changes in school performance or attendance, or behavior problems.
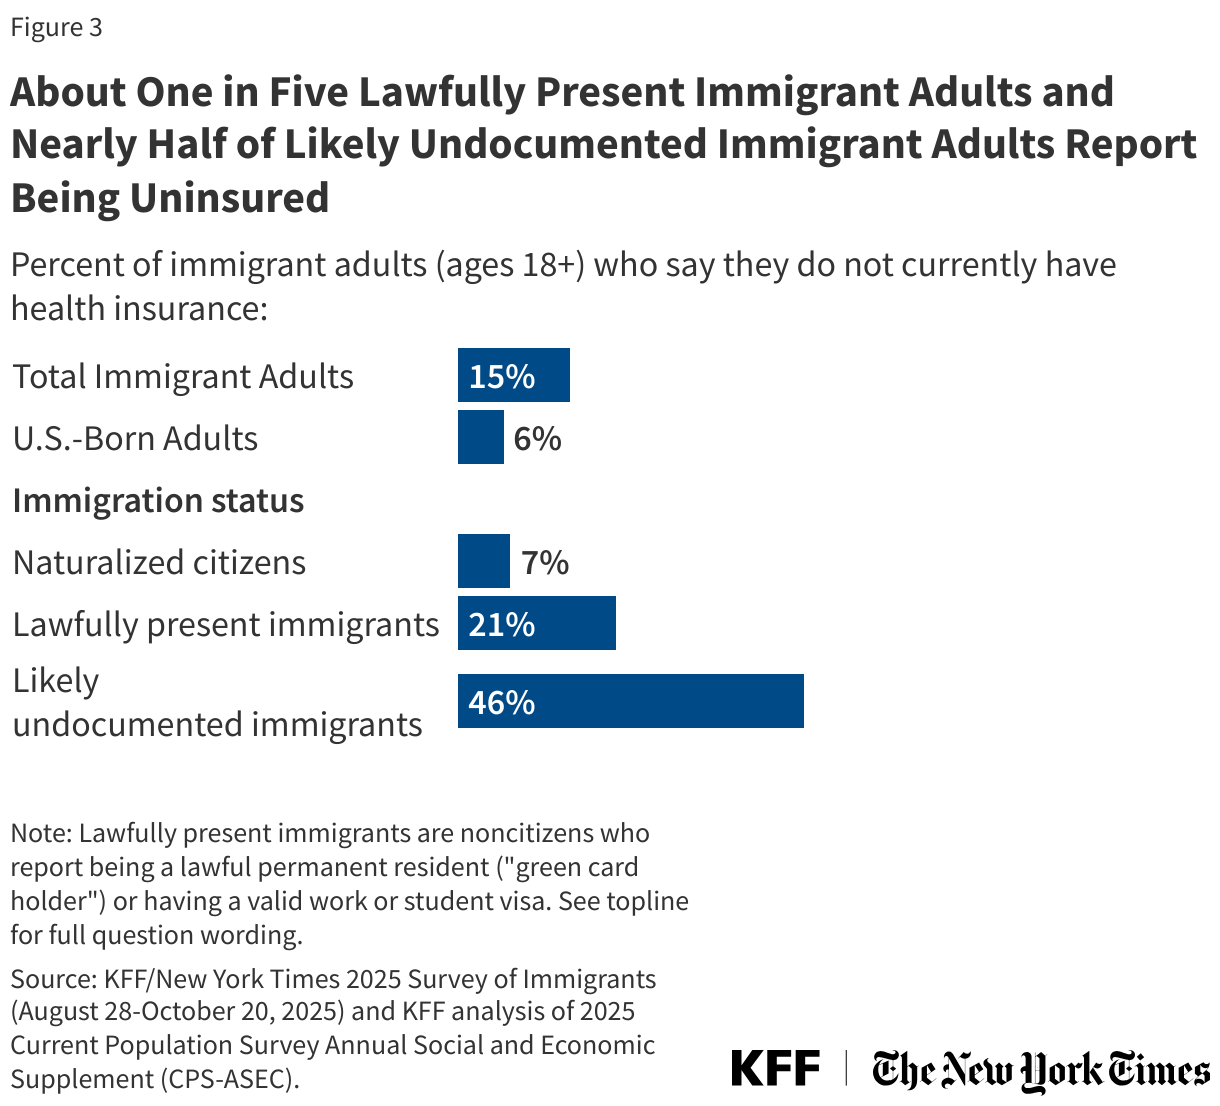
- Overall, 15% of immigrant adults report being uninsured as of 2025, with higher uninsured rates among immigrant adults who are likely undocumented (46%) and lawfully present (21%) compared to naturalized citizens (7%). This pattern reflects that undocumented immigrants are prohibited from accessing federally funded health coverage options and many lawfully present immigrants face eligibility restrictions for federally funded coverage. Among immigrant parents, 15% report at least one uninsured child, rising to over a quarter (27%) among immigrant parents who are likely undocumented. Most children of immigrants are U.S.-born citizens and therefore not subject to eligibility restrictions for immigrants
- The share of immigrant adults who said they avoided applying for a government program that helps pay for food, housing, or health care in the past 12 months because they did not want to draw attention to their or a family member’s immigration status rose from 8% to 12% between 2023 and 2025. Increases were larger among those who are likely undocumented (27% to 46%) or parents (11% to 18%). Further, 11% of immigrant adults say they have stopped participating in such a program since January 2025 because of immigration-related worries, including about four in ten (42%) of those who are likely undocumented and about one in six (17%) parents.
- The share of immigrant adults who reported skipping or postponing health care in the past 12 months increased from 22% to 29% between 2023 and 2025. Among those who went without care, about one in five (19%) immigrant adults say it was due to immigration-related concerns. However, across immigrant adults, larger shares cite cost or lack of coverage (63%) as a reason why they skipped or postponed health care. Additionally, three in ten (30%) immigrant parents say that any of their children delayed or skipped health care in the past 12 months due to immigration-related fears, cost or lack of insurance, and/or not being able to find services at a convenient time or location. The overall share rises to about six in ten (58%) of parents who are likely undocumented, with 43% of likely undocumented parents citing immigration concerns.
- Reluctance to access care may in part reflect concerns about health care providers sharing information with immigration enforcement officials. About half (51%) of immigrant adults overall and about eight in ten (78%) of those who are likely undocumented say they are “somewhat” or “very” concerned about health care providers sharing information about immigration status with immigration enforcement officials. These fears have likely been exacerbated by the Trump administration sharing noncitizen Medicaid enrollee information with the Department of Homeland Security (DHS), although this action has since been limited by court action in some states.
Immigrant adults across immigration statuses are experiencing negative impacts on their health and facing increased barriers to accessing health coverage and care for themselves and their children. These impacts are particularly pronounced for immigrants who are likely undocumented, parents, lower income, or who have limited English proficiency (LEP). These experiences will likely contribute to worse health outcomes for immigrant adults and their children, who are primarily U.S.-born citizens. Negative impacts also may have spillover effects on the U.S. economy and workforce given that immigrants play an outsized role in many occupations including health care, construction, and agriculture. Going forward, immigrant families will likely continue to experience negative impacts on their health and health care given ongoing enforcement activity and policies that will further limit access to health coverage for lawfully present immigrants.
Box 1: Key Terms and Groups
Immigrants: In this report, immigrants are defined as adults residing in the U.S. who were born outside the U.S. and its territories. This includes naturalized citizens, lawfully present immigrants, and immigrants who are likely undocumented.
Naturalized citizen: Immigrants who said they are a U.S. citizen.
Lawfully present immigrant: Immigrants who said they are not a U.S. citizen, but currently have a green card (lawful permanent status) or a valid work or student visa.
Likely undocumented immigrant: Immigrants who said they are not a U.S. citizen and do not currently have a green card (lawful permanent status) or a valid work or student visa. These immigrants are classified as “likely undocumented” since they have not affirmatively identified themselves as undocumented.
Impacts of Immigration-Related Fears on Health
Four in ten (40%) immigrant adults overall and nearly eight in ten (77%) likely undocumented immigrants say they have experienced negative health impacts due to immigration-related worries since January 2025 (Figure 1). These negative health impacts include increased stress, anxiety, or sadness; problems sleeping or eating; or worsening health conditions like diabetes or high blood pressure due to immigration-related worries. Notably, nearly half (47%) of lawfully present immigrants and about three in ten (29%) of naturalized citizens report at least one of these impacts. About half of Hispanic (51%) and Black (46%) immigrant adults, those with lower incomes (annual household income of less than $40,000) (49%), and immigrant parents (47%) report these health impacts.
When asked to describe impacts of the Trump administration’s immigration enforcement activities on themselves or their family in their own words, a number of immigrants say they and their families have experienced increased anxiety and stress due to fears, uncertainty about the future, and increased racial discrimination (Box 2). Some also mention feeling increased sadness or depression about how they and others are being treated. These responses echo experiences shared by likely undocumented Hispanic immigrants in focus groups conducted during March 2025, who described feeling anxious, stressed, depressed, isolated, and lonely due to changes in their daily lives and constantly being on high alert as well as increased feelings of sadness and fears among their children. Participants also described suffering from insomnia, loss of appetite, and symptoms such as stomach problems and migraine headaches due to fears and stress.
Box 2: In Their Own Words: How Immigrants Have Been Affected by the Trump Administration’s Immigration Enforcement Activities
“Under Trump’s administration, it has felt insecure and full of discrimination…. Many are looking at us as if we do not belong, and we receive racial slurs causing fear and anxiety.” — 39-year-old Brazilian immigrant woman in California
“Mentally we are more stressed every day even though we are legal.” — 39-year-old Chinese immigrant man in New Jersey
“We’re getting depressed and are scared of going out, we’re scared that they’ll separate us, they’ll mistreat us.” — 34-year-old Colombian immigrant woman in New York
“It created fear and stress in my family, making us feel less secure and uncertain about the future.” — 23-year-old Guinean immigrant woman in New York
“It has caused us a lot of stress. We have constant fear.” — 24-year-old Cuban immigrant man in Florida
“There’s racism and I feel a lot of sadness about how they treat people when there are raids. There’s a lot of fear and sadness.” — 52-year-old Mexican immigrant woman in California
Note: Responses are lightly edited for length and spelling, but reflect respondents’ own language and do not represent the views of KFF.
Among immigrant parents of a child under 18 years old, about one in five (18%) say their child’s well-being has been negatively impacted by immigration-related worries since January 2025. These impacts include problems sleeping or eating (14%); changes in school performance or attendance (12%); or behavior problems (12%) (Figure 2). Reports of impacts on children are particularly high among likely undocumented immigrant parents (46%), parents with lower incomes (30%), and immigrant parents with LEP (24%).
Health Coverage and Other Assistance Programs
Fifteen percent of immigrant adults age 18 and older and 19% of immigrant adults between ages 18 and 64 report being uninsured as of 2025. In comparison, 6% of U.S.-born adults ages 18 and older and 8% of U.S.-born adults ages 18-64 say they lack coverage.1 Most immigrant adults are working, but many are employed in lower income jobs and industries that are less likely to offer employer sponsored insurance, contributing to lower rates of private coverage than their U.S.-born counterparts. Medicaid coverage helps fill some of the gap in private coverage, but many lawfully present immigrants are subject to eligibility restrictions for federally funded health coverage and undocumented immigrants are not eligible for any federally-funded health coverage. As such, more than four in ten (46%) likely undocumented immigrants and about one in five (21%) lawfully present immigrant adults report being uninsured compared to 7% of naturalized citizens (Figure 3). Uninsured rates for immigrant adults remained relatively stable between 2023 and 2025 but will likely increase in future years because the 2025 tax and budget law will further restrict access to federally funded coverage for lawfully present immigrants, including Medicaid or the Affordable Care Act (ACA) Marketplaces.
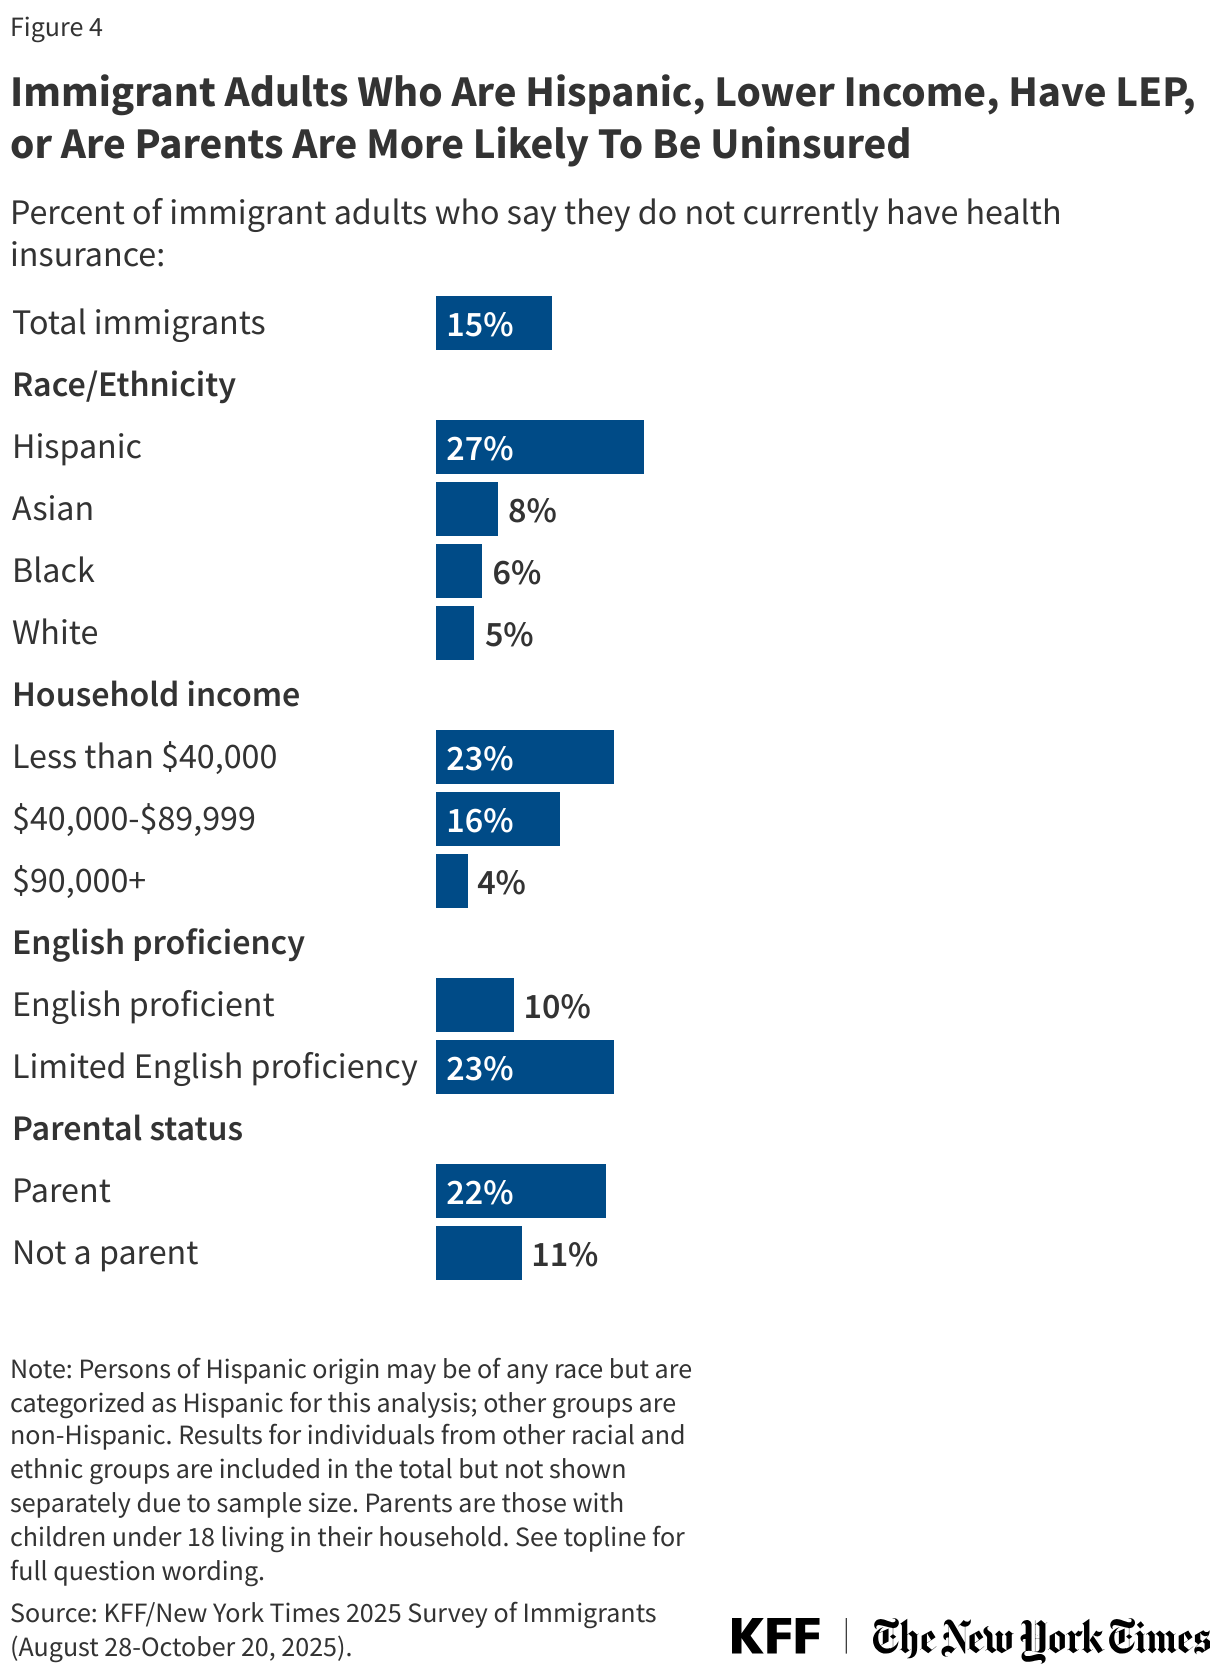
Uninsured rates among immigrant adults also vary by other factors including race or ethnicity, parental status, income, and English proficiency. Hispanic immigrant adults (27%), those with lower incomes (23%), those who have LEP (23%), and those who are parents (22%) are more likely to be uninsured compared to their White (5%), higher income (4%), English proficient (10%), and non-parent (11%) counterparts (Figure 4).
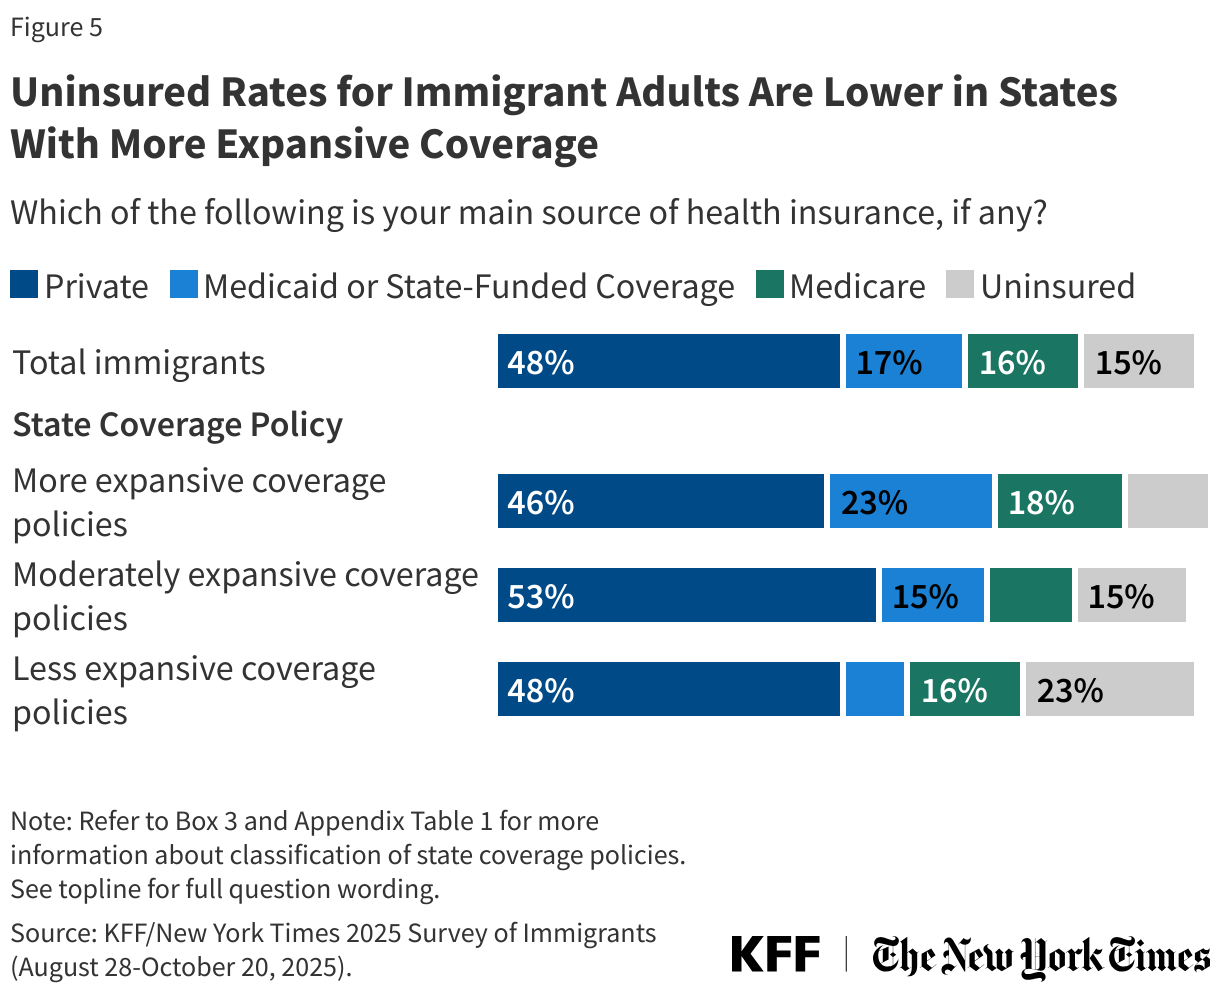
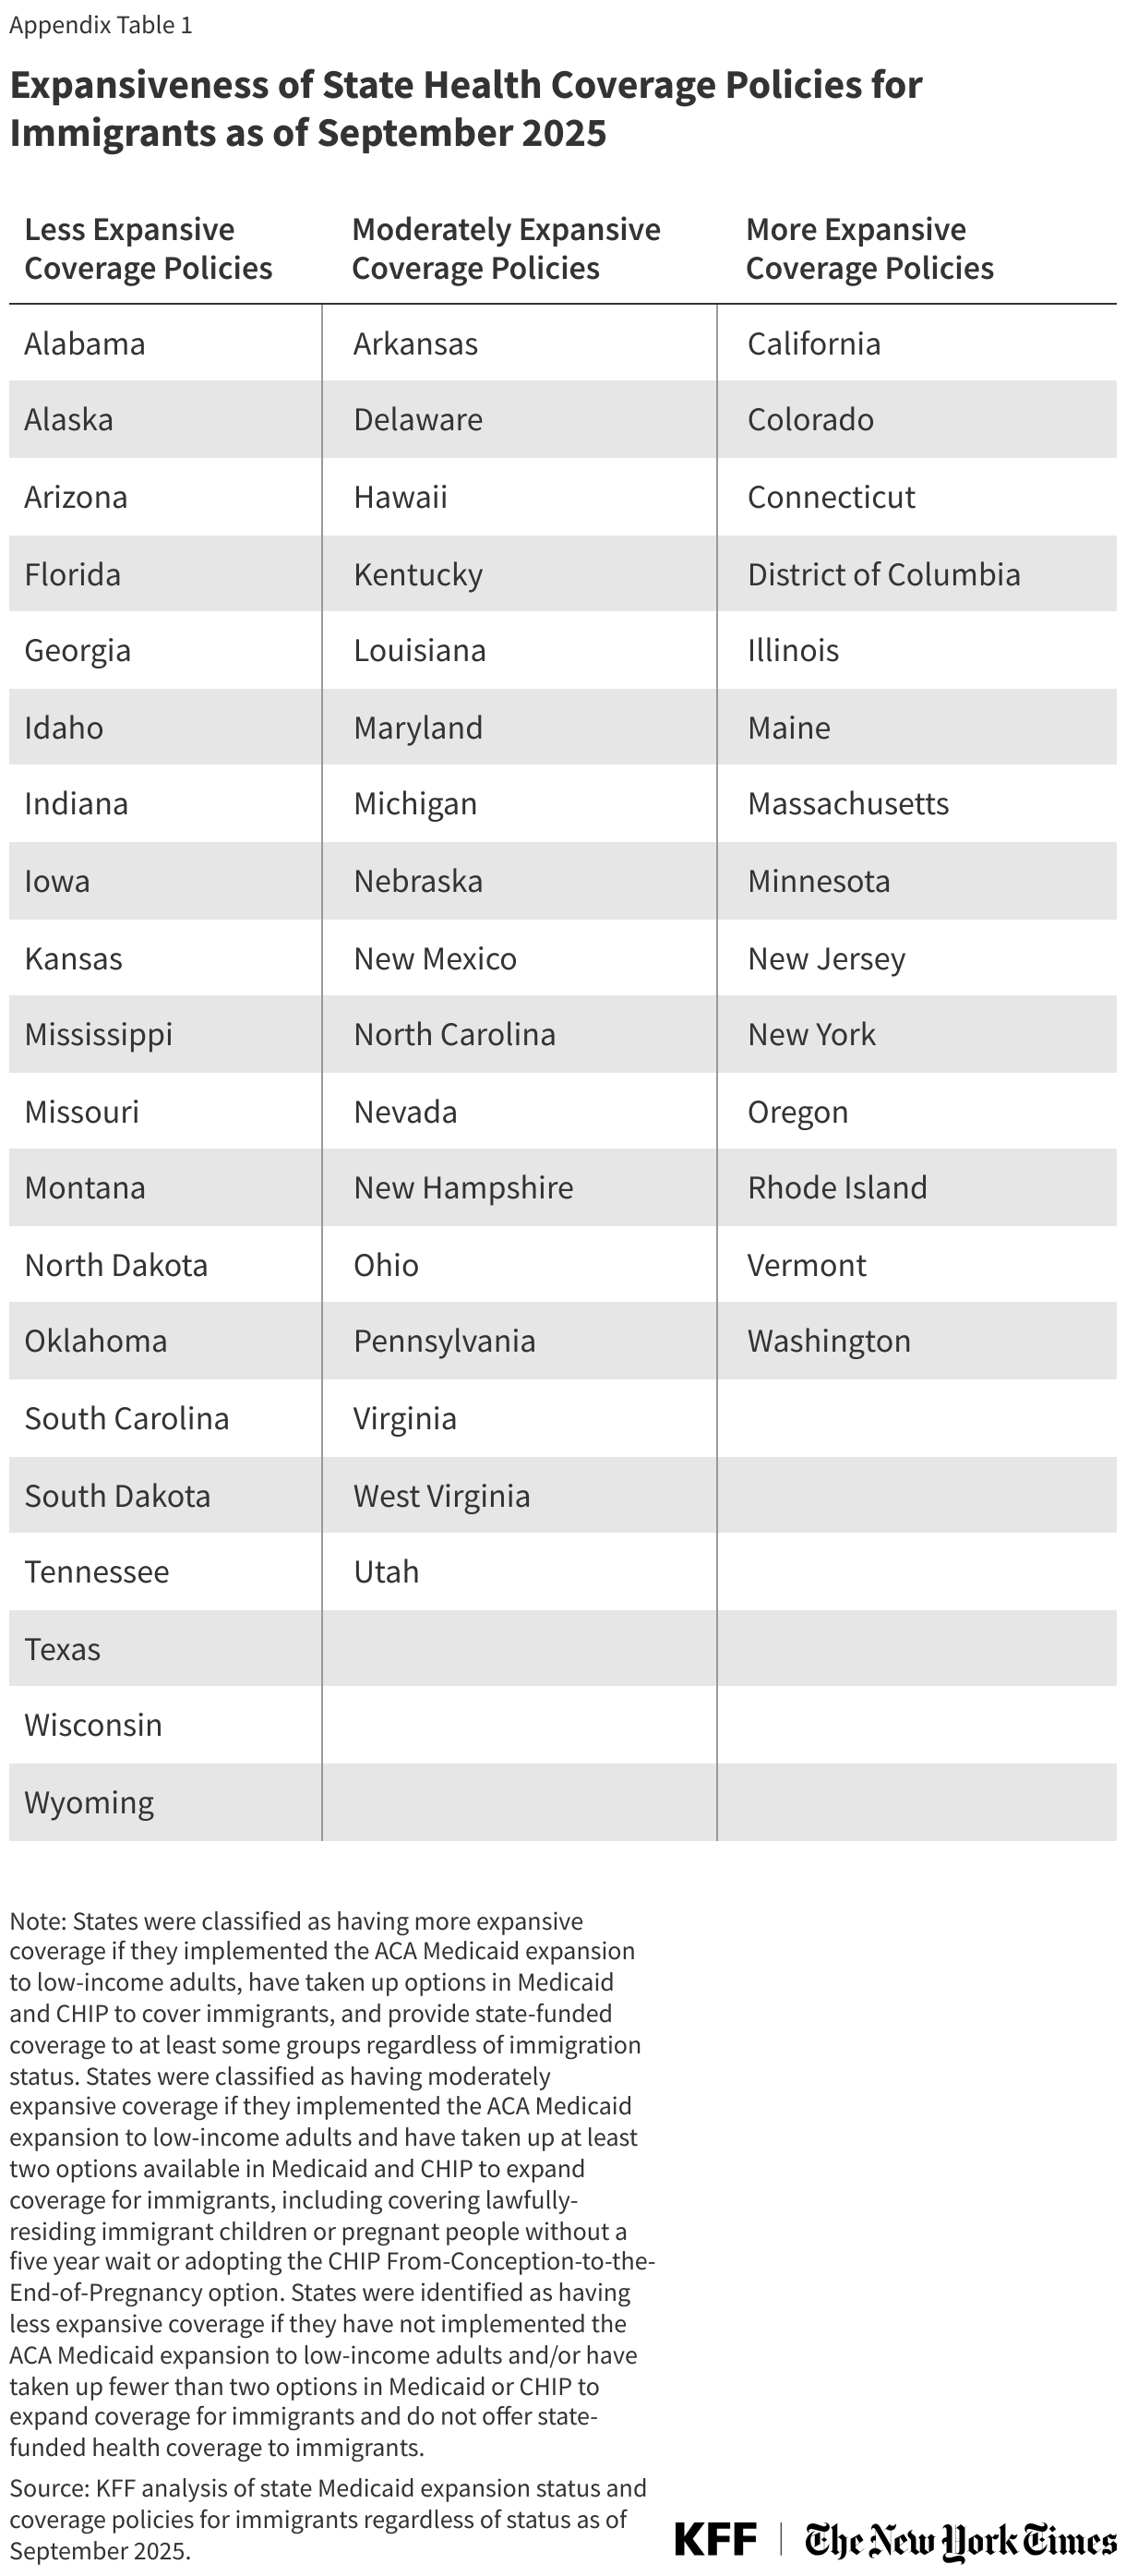
Uninsured rates among immigrant adults also vary based on where they live, in part, reflecting different coverage expansion choices by states. States vary in the coverage they provide for their low-income populations overall as well as immigrants specifically. States that have adopted the ACA Medicaid expansion have broader eligibility for low-income adults overall, but noncitizen immigrants still face eligibility restrictions for this coverage. Some states have expanded coverage for immigrants by eliminating the five-year waiting period in Medicaid and/or the Children’s Health Insurance Program (CHIP) for lawfully present children and/or pregnant people and/or extending coverage to some immigrants regardless of immigration status through fully state-funded programs, although states recently have been reducing or eliminating this coverage. Immigrant adults who live in states that provide more expansive coverage, including the ACA Medicaid expansion and immigrant coverage expansions, are about half as likely to be uninsured compared with those living in states with less expansive policies (11% vs. 23%), reflecting higher rates of Medicaid or state-funded coverage in these states (Figure 5) (see Box 3 for definition of state health coverage expansiveness).
Box 3: Classifying States by Coverage Policies
Health coverage was analyzed by expansiveness of state coverage based on state of residence reported by survey respondents. Expansiveness of coverage was classified as follows:
More expansive coverage: States were classified as having more expansive coverage if they have implemented the ACA Medicaid expansion to low-income adults, have taken up options in Medicaid and CHIP to cover lawfully present immigrants, and provide state-funded coverage to at least some groups (such as children) regardless of immigration status. Even when state-funded coverage is limited to children, the availability of this coverage may reduce fears among immigrant adults about applying for coverage for themselves if they are eligible for other options.
Moderately expansive coverage: States were classified as having moderately expansive coverage if they implemented the ACA Medicaid expansion to low-income adults and have taken up at least two options available in Medicaid and CHIP to expand coverage for immigrants, including covering lawfully-residing immigrant children or pregnant people without a five year wait or adopting the CHIP From-Conception-to-the-End-of-Pregnancy option to provide coverage to low-income citizen children regardless of their parent’s immigration status.
Less expansive coverage: States were identified as having less expansive coverage if they have not implemented the ACA Medicaid expansion to low-income adults and/or taken up fewer than two options in Medicaid or CHIP to expand coverage for immigrants and do not offer state-funded health coverage to immigrants.
See Appendix Table 1 for states groupings by these categories.
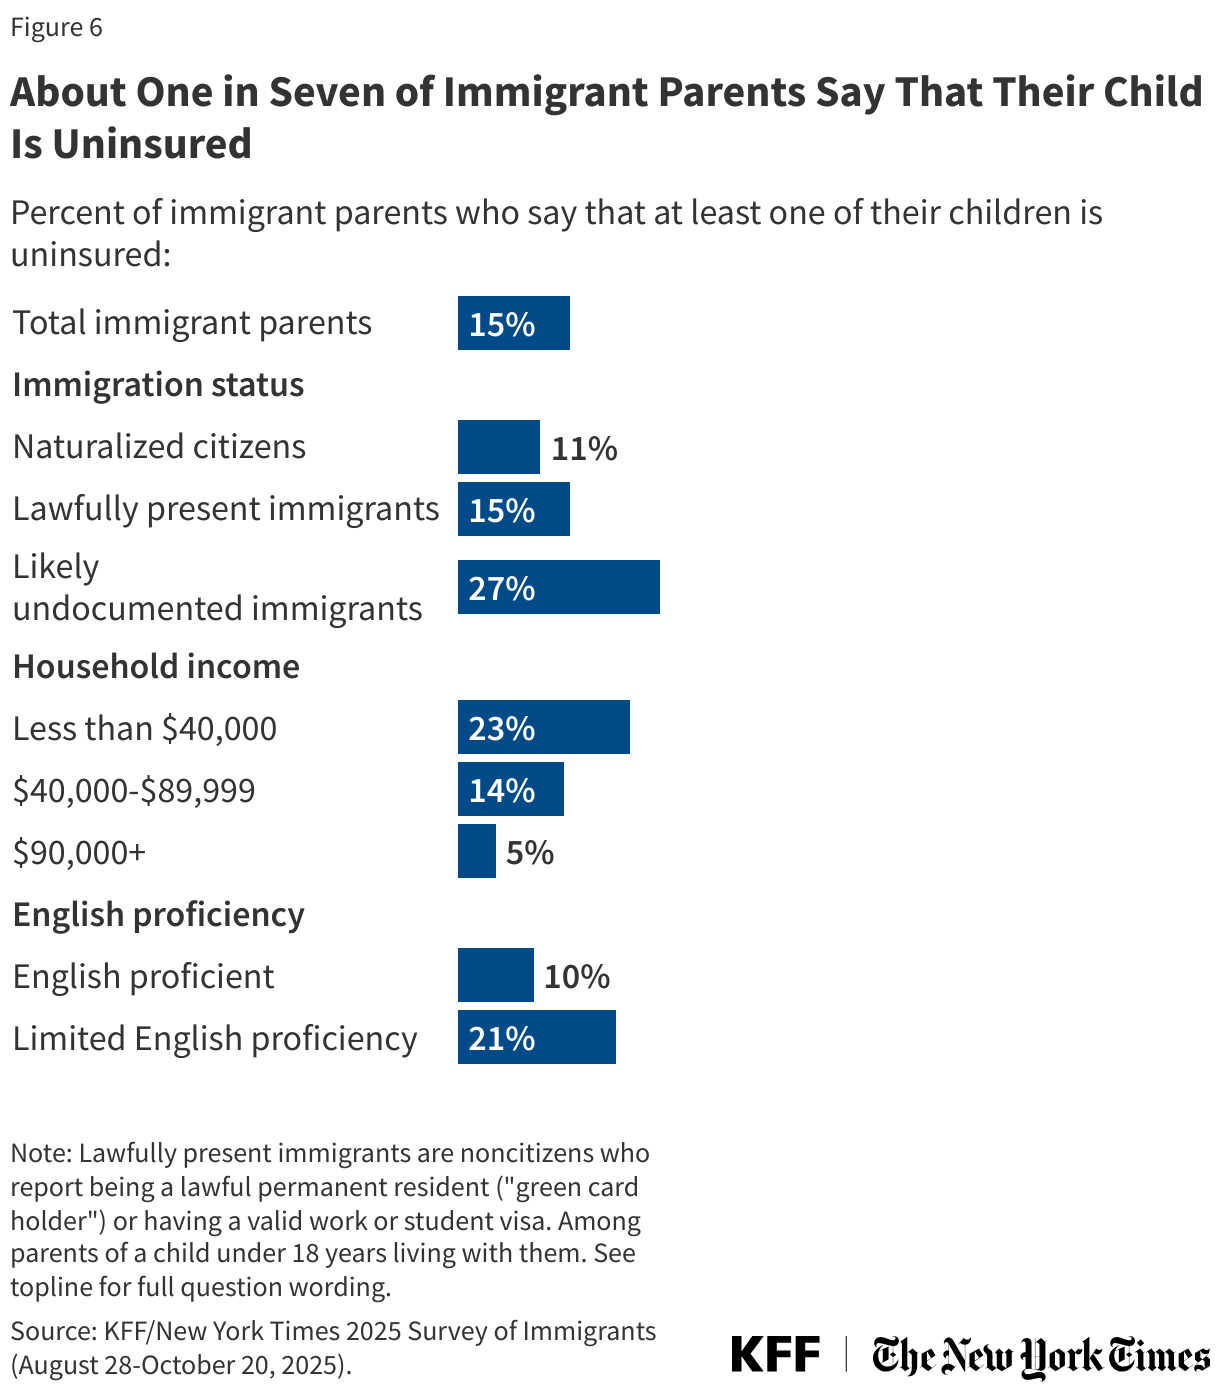
Among immigrant parents, 15% reported at least one uninsured child as of 2025 (Figure 6). This share rises to about a quarter (27%) among immigrant parents who are likely undocumented and about one in five of those with lower incomes (22%) or LEP (21%).
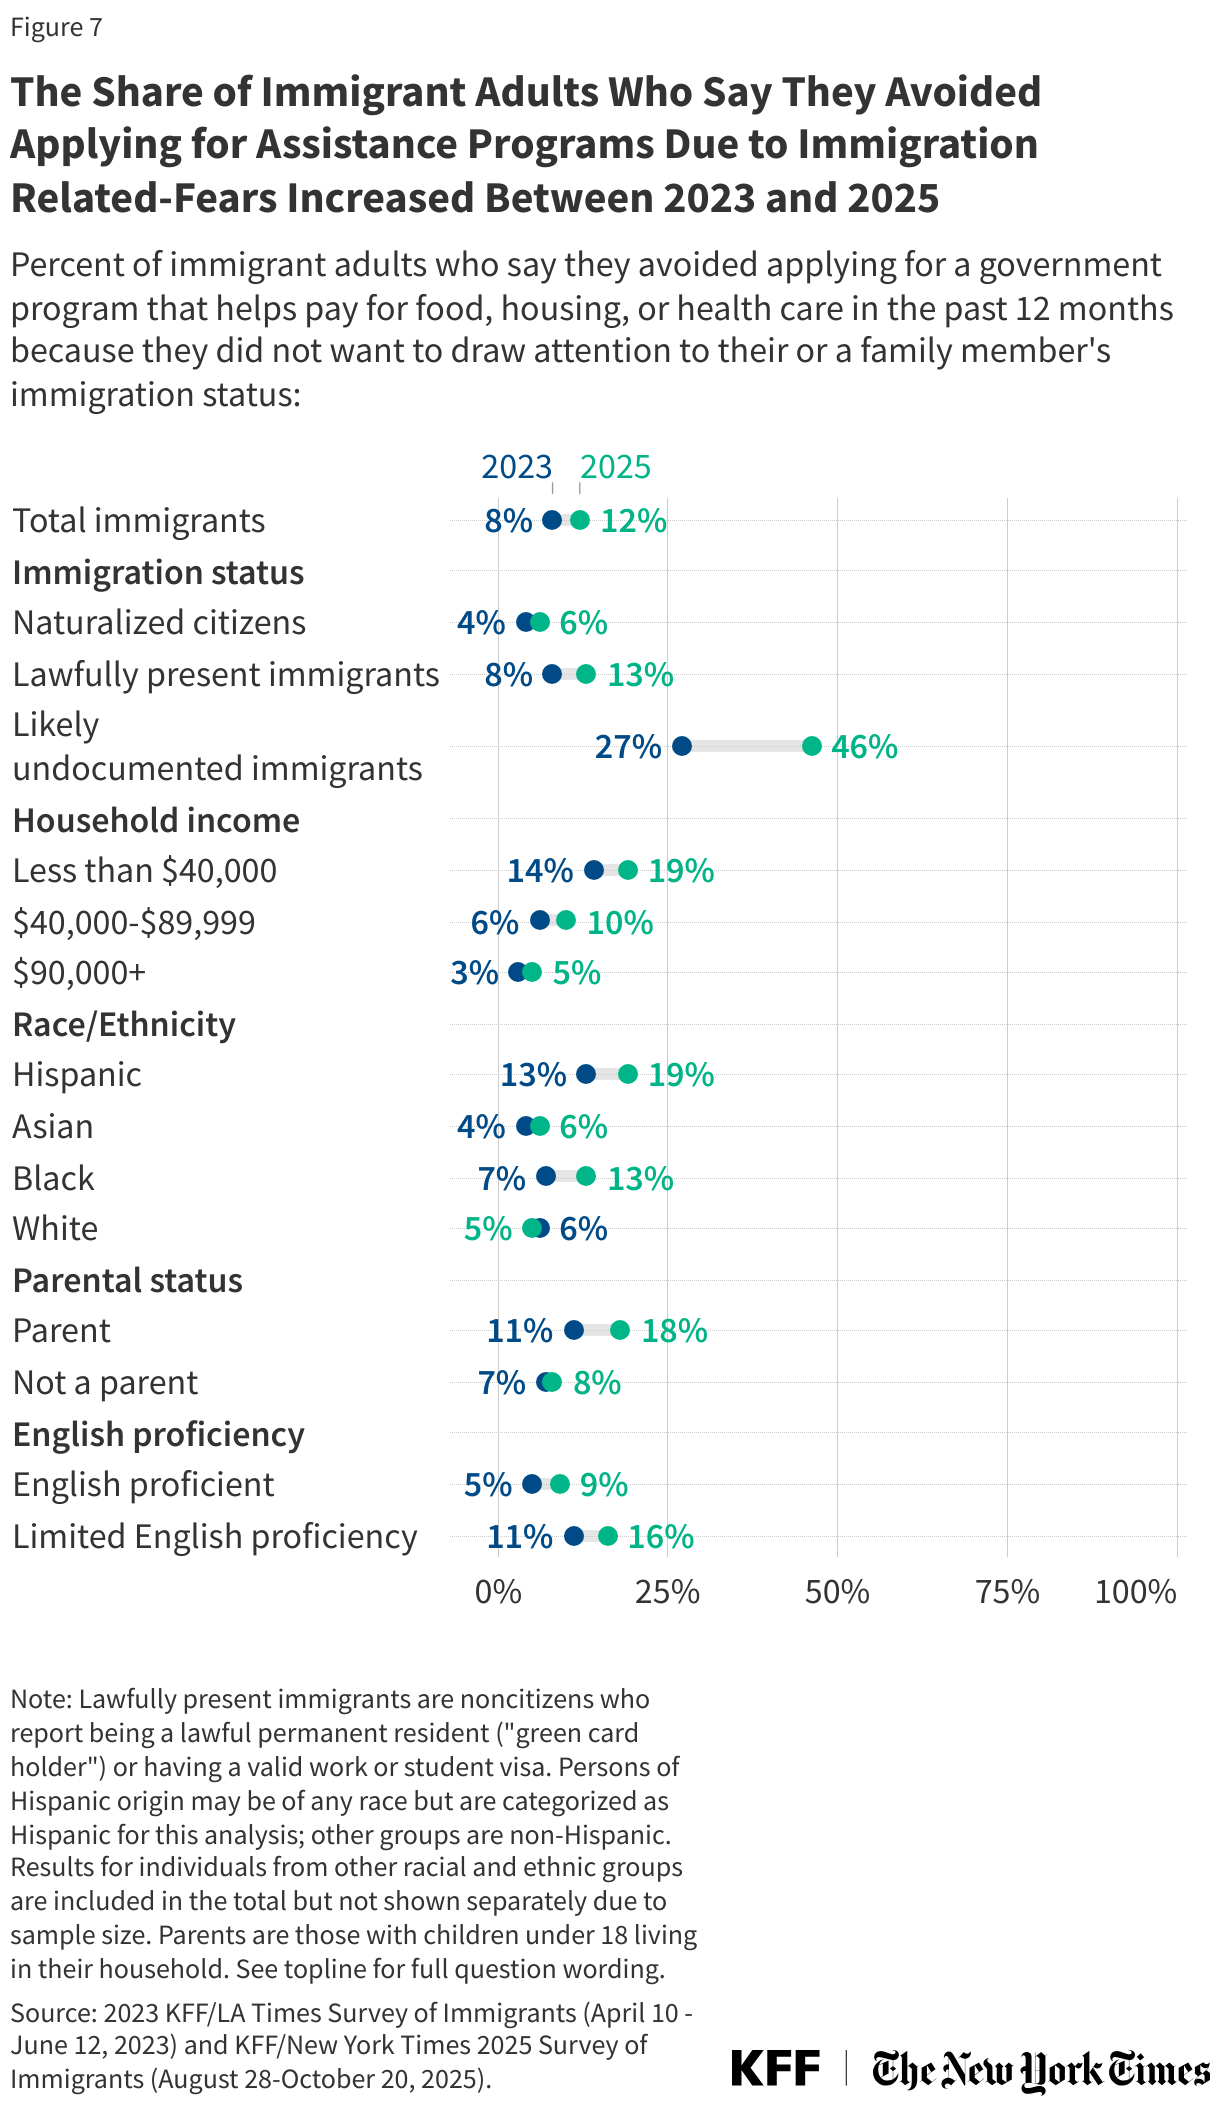
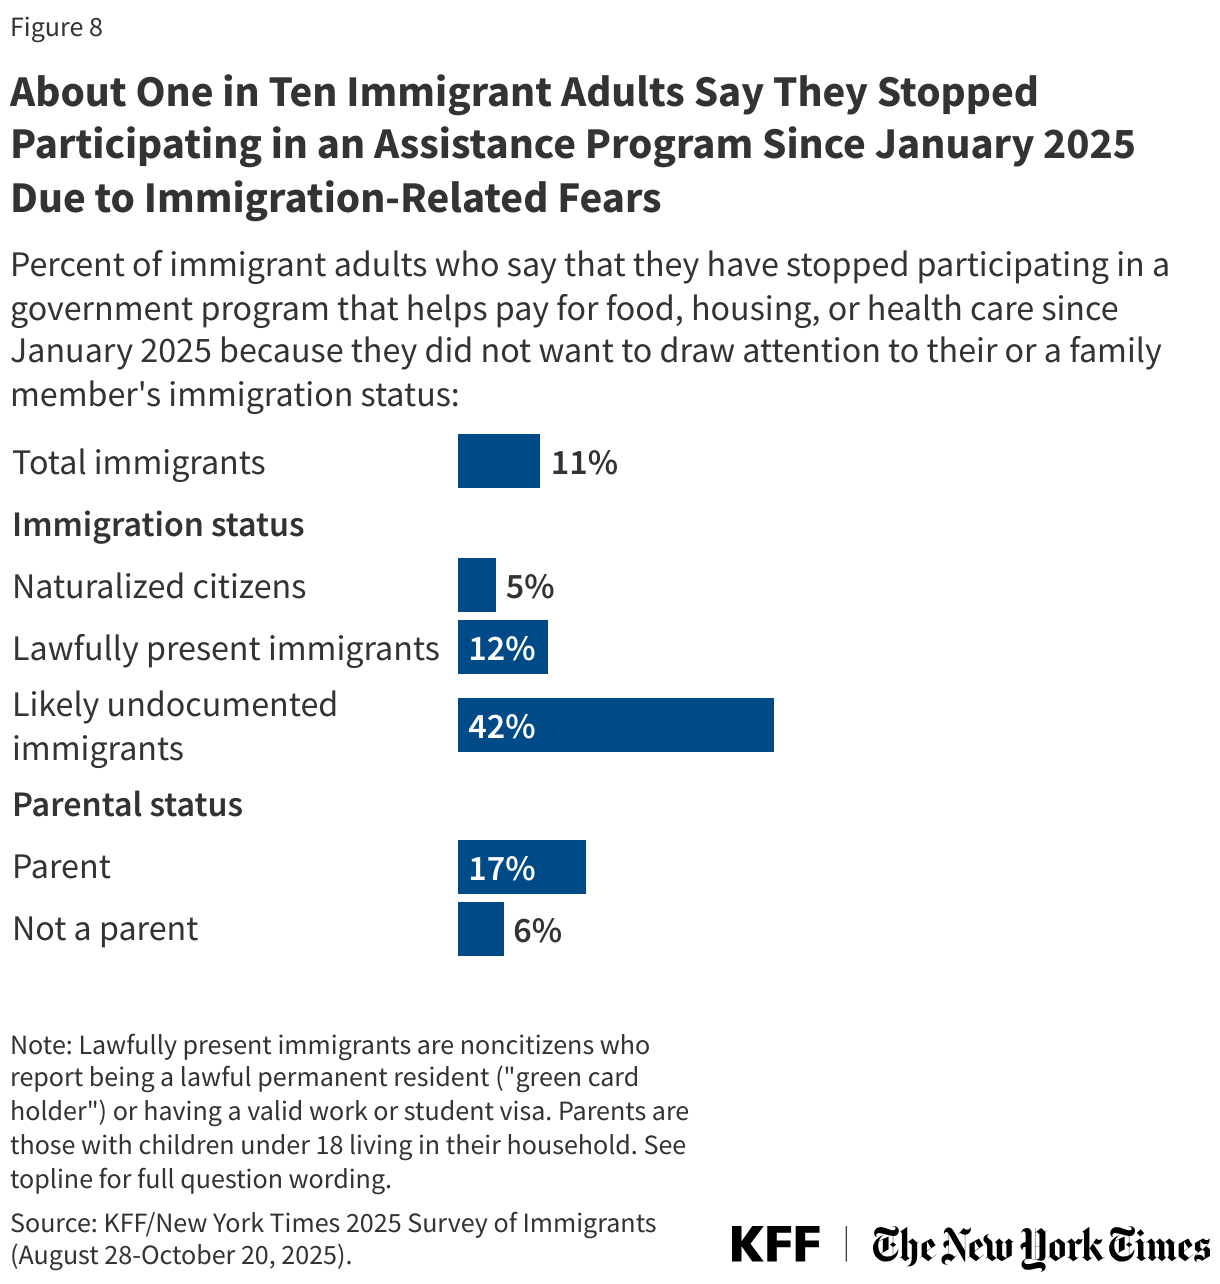
The share of immigrant adults who say that, in the past 12 months, they avoided applying for a government program that helps pay for food, housing, or health care because they did not want to draw attention to their or a family member’s immigration status increased from 8% to 12% between 2023 and 2025 (Figure 7). Increases were larger among those who are likely undocumented (27% to 46%) or parents (11% to 18%). Further, 11% of immigrant adults say that they stopped participating in a government program that helps pay for food, housing, or health care because they did not want to draw attention to their or a family member’s immigration status since January 2025, including about four in ten (42%) likely undocumented immigrants and about one in six immigrant parents (17%) (Figure 8).
Access to Health Care
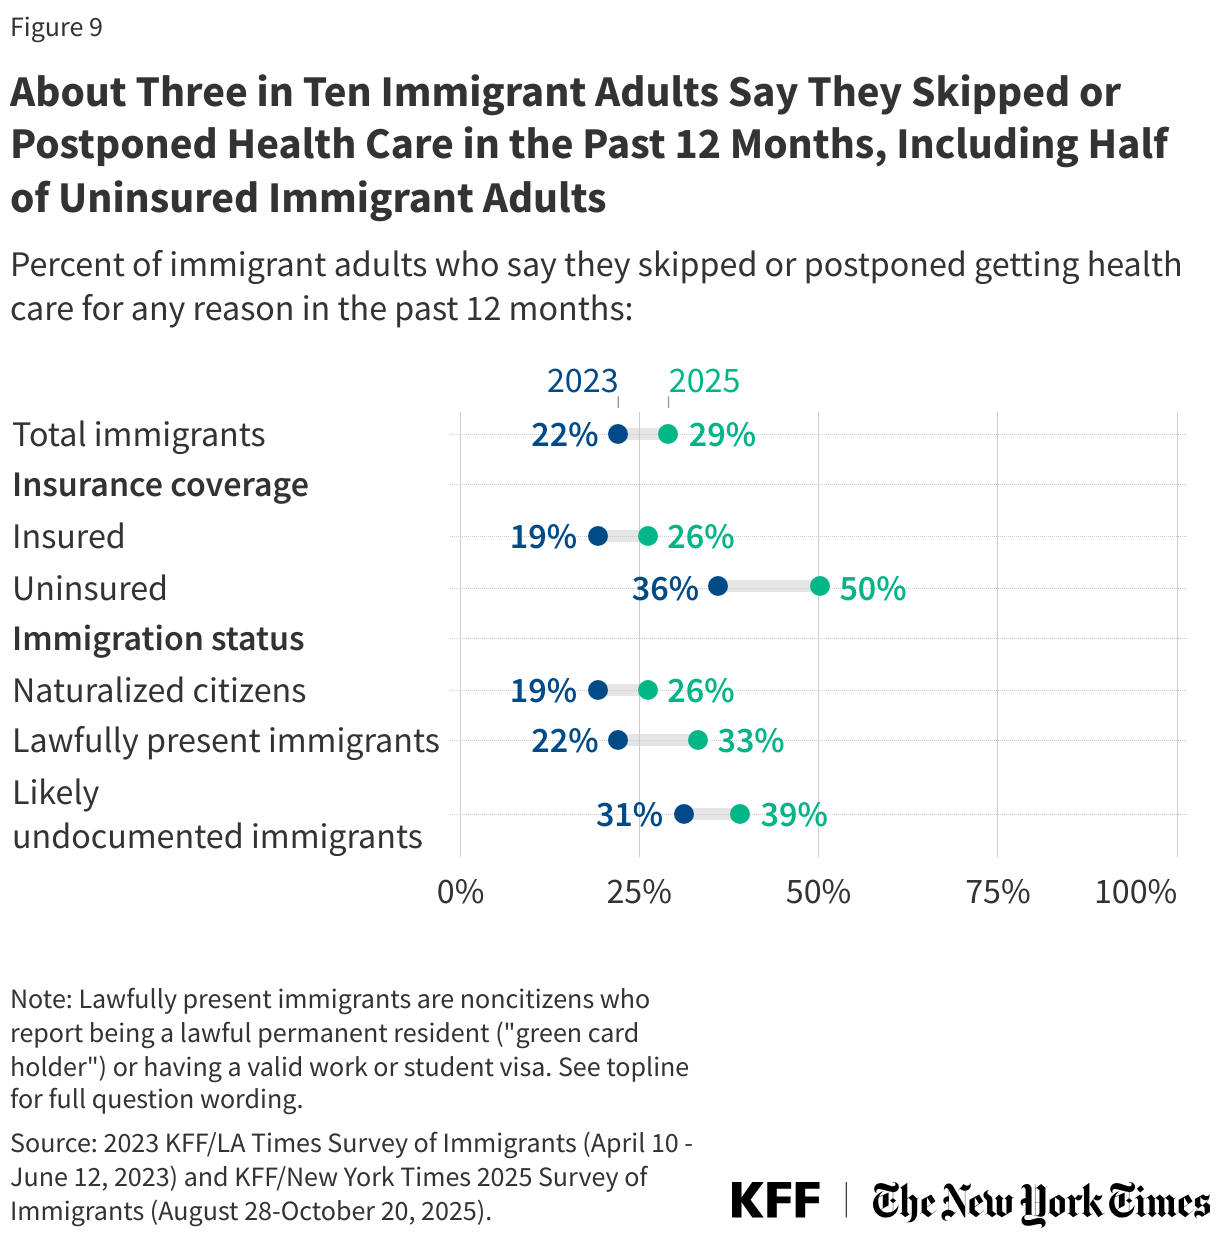
The share of immigrant adults who reported skipping or postponing health care in the past 12 months increased from 22% to 29% between 2023 and 2025. Among uninsured immigrant adults, the share reporting skipping or postponing care rose to half (50%) as of 2025, up from 36% in 2023 (Figure 9). Delaying or going without needed care can contribute to health problems becoming worse and taking more time and resources to treat. Among immigrant adults who skipped or postponed health care, 36% said their health got worse as a result (11% of all immigrant adults).
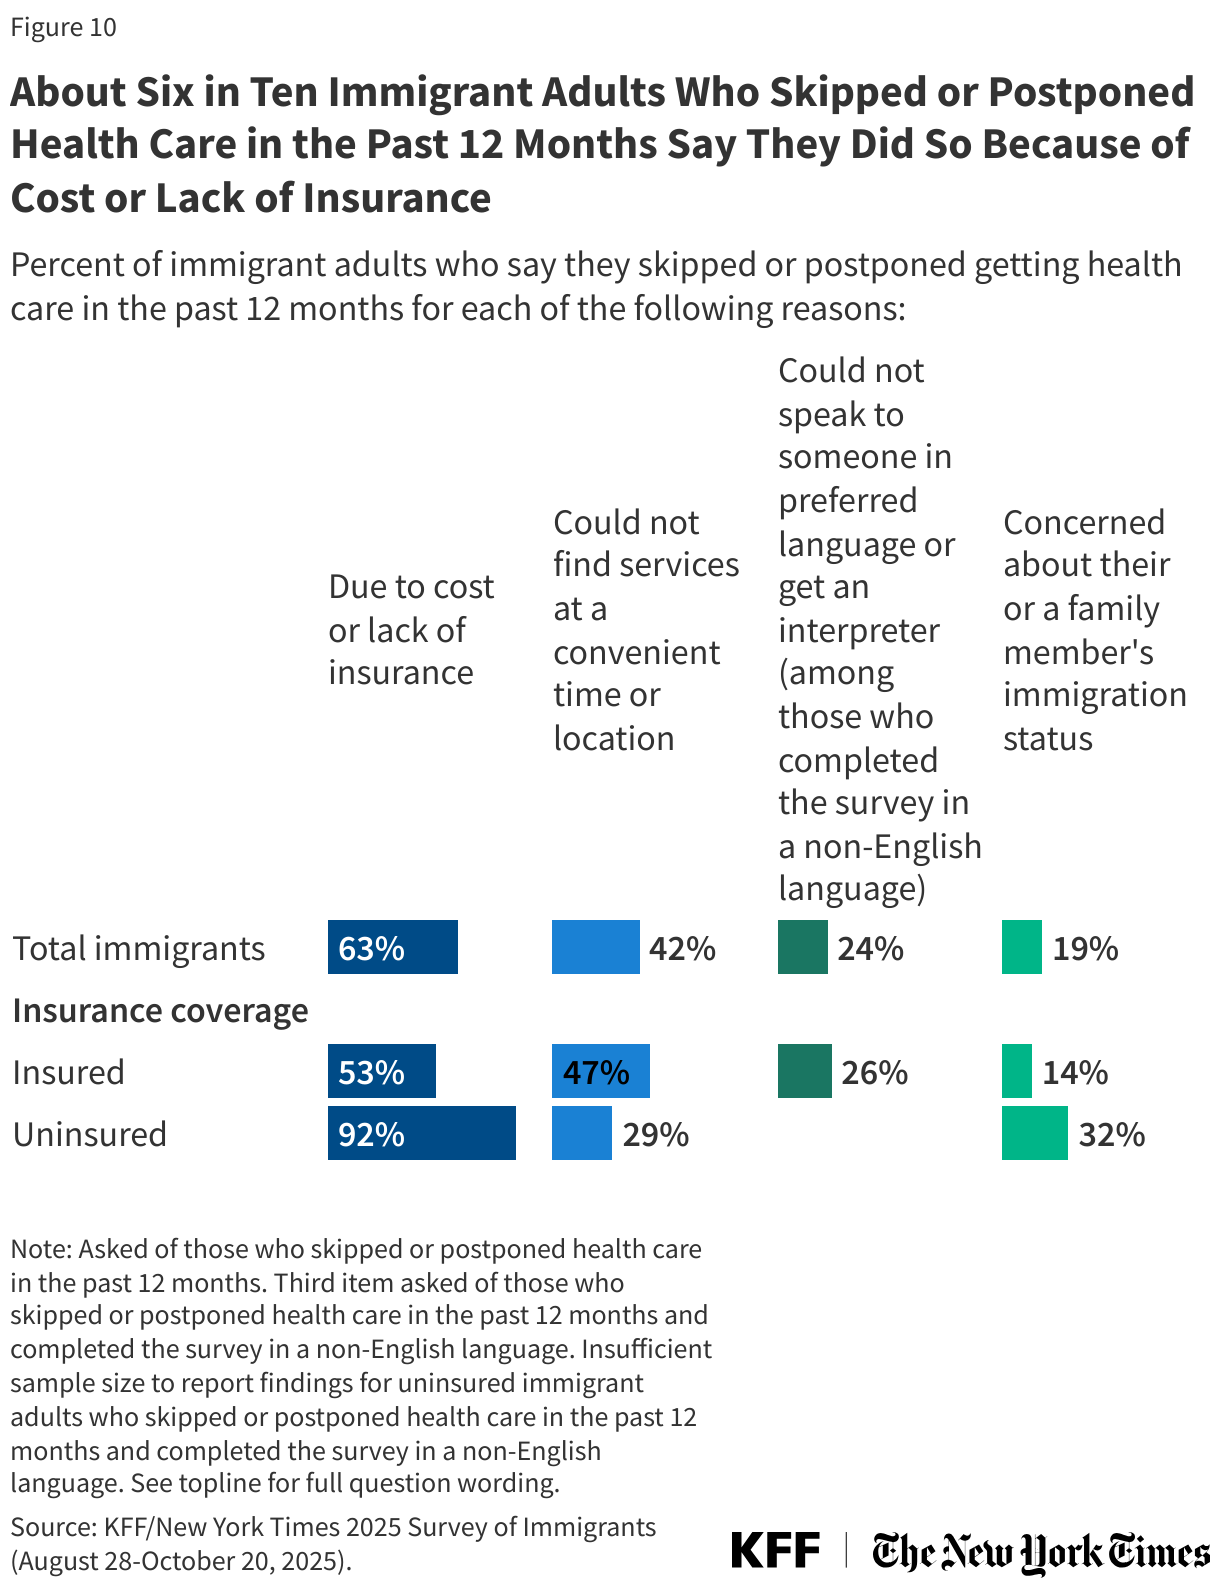
Cost and lack of coverage, limited access to care, and fears are factors contributing to immigrant adults skipping or postponing health care. About six in ten (63%) immigrant adults who skipped or postponed health care in the past year (18% of all immigrant adults) say they did so because of cost or lack of insurance, about for in ten (42%) (12% of all immigrant adults) say they did so because they were not able to find services at a time or location that worked for them, and 19% (5% of all immigrant adults) say it was because of concerns about their or a family member’s immigration status (Figure 10). Among those who completed the survey in a non-English language and also skipped or postponed care, 24% cited language access challenges. Cost or lack of coverage and immigration concerns are higher among uninsured adults who skipped or postponed care compared to those with coverage.
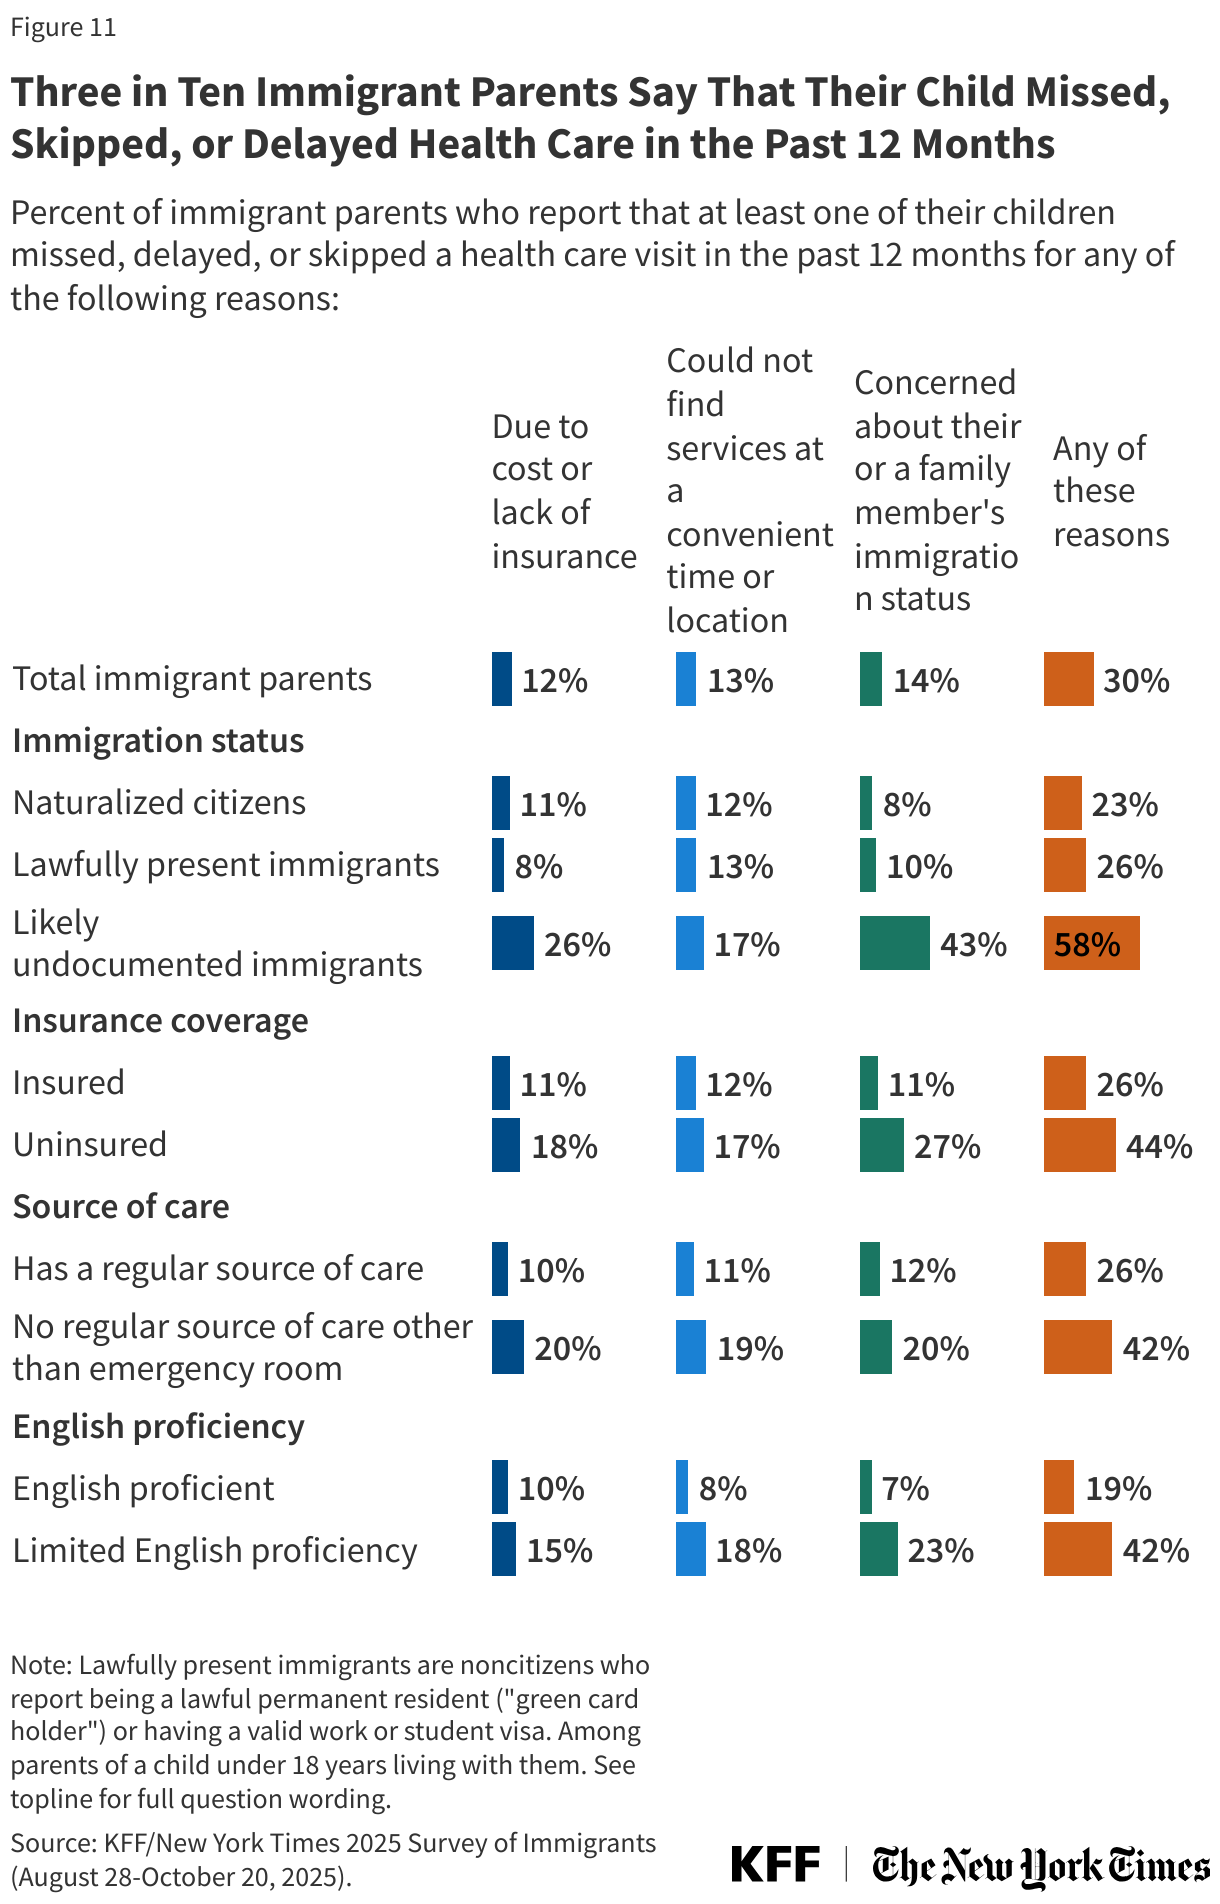
Further, three in ten (30%) immigrant parents say any of their children delayed or skipped health care in the past 12 months due to immigration-related fears (14%), not being able to find services at a convenient time or location (13%), or cost or lack of insurance (12%). Rates of delayed or skipped health care are higher among immigrant parents who are likely undocumented (58%), with 43% citing immigration concerns. They also are higher among parents who are uninsured (44%), have no regular source of care other than an emergency room (42%), or have LEP (42%) (Figure 11).
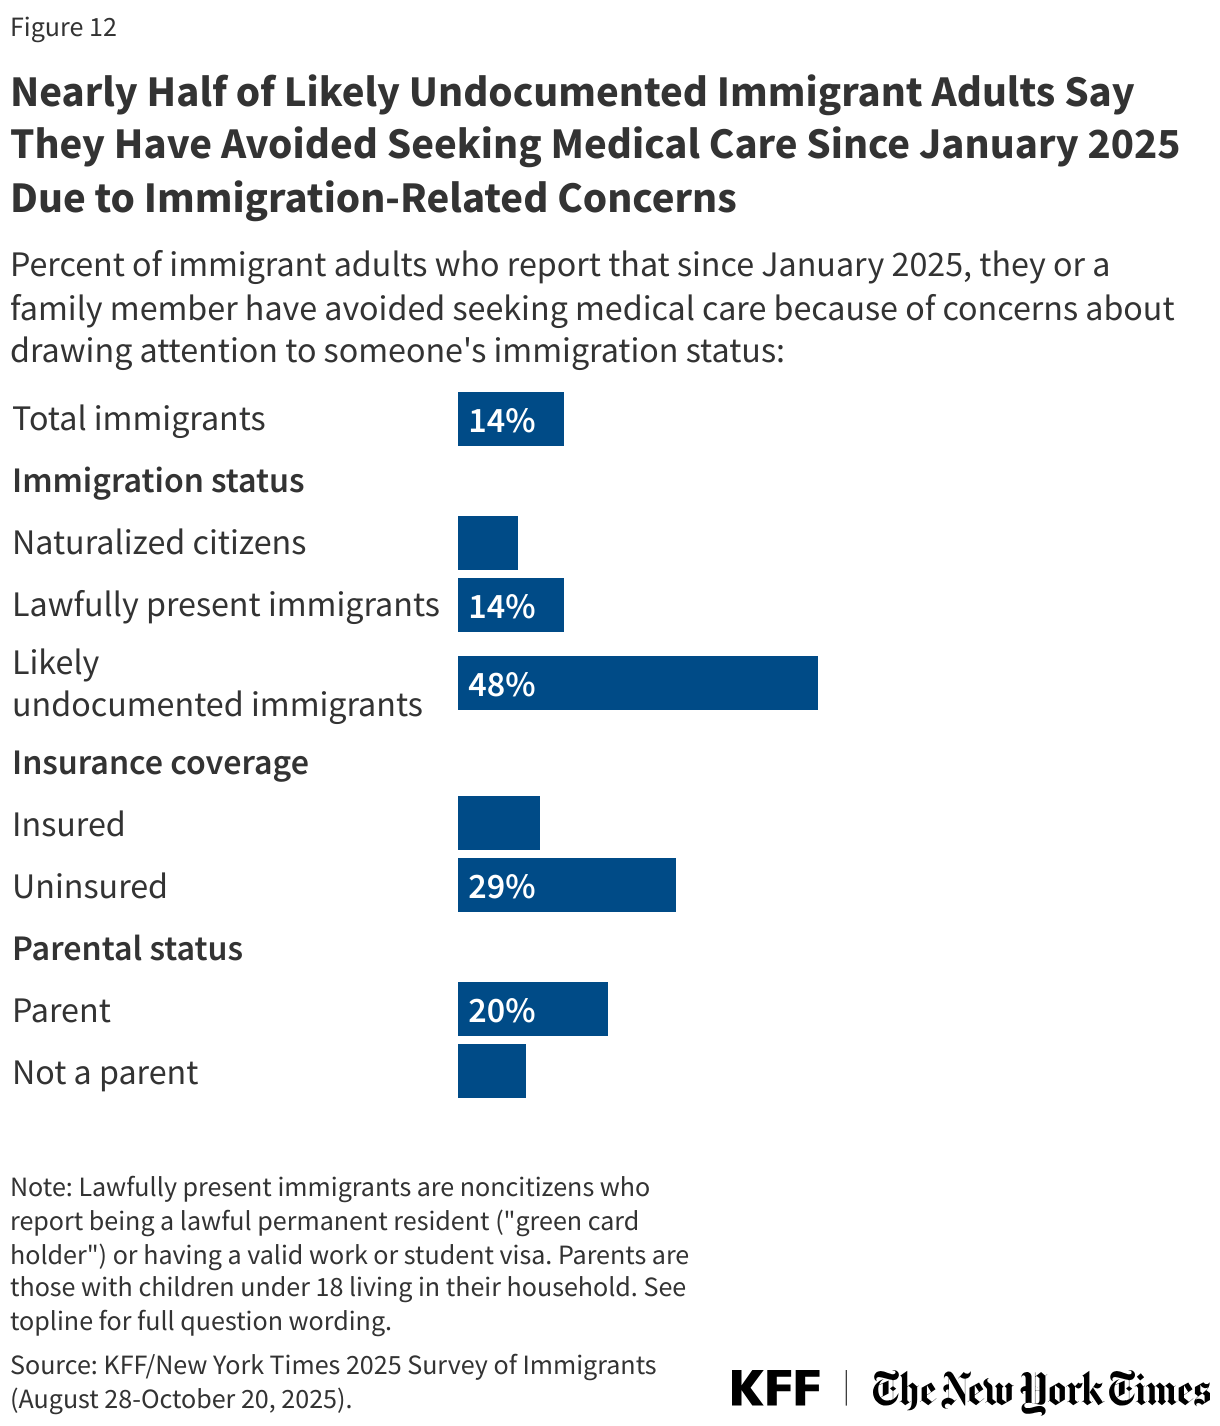
Nearly half (48%) of likely undocumented immigrants and 14% of immigrant adults overall say they or a family member have avoided seeking medical care since January 2025 due to immigration-related concerns. Uninsured immigrant adults and those who are parents are more likely to say they or a family member avoided seeking medical care due to immigration-related fears than their insured and non-parent counterparts (Figure 12). Substantial shares of immigrant adults, particularly those who are likely undocumented, also report avoiding other activities such as going to church or other community activities, going to work, or taking their child to school or school events.
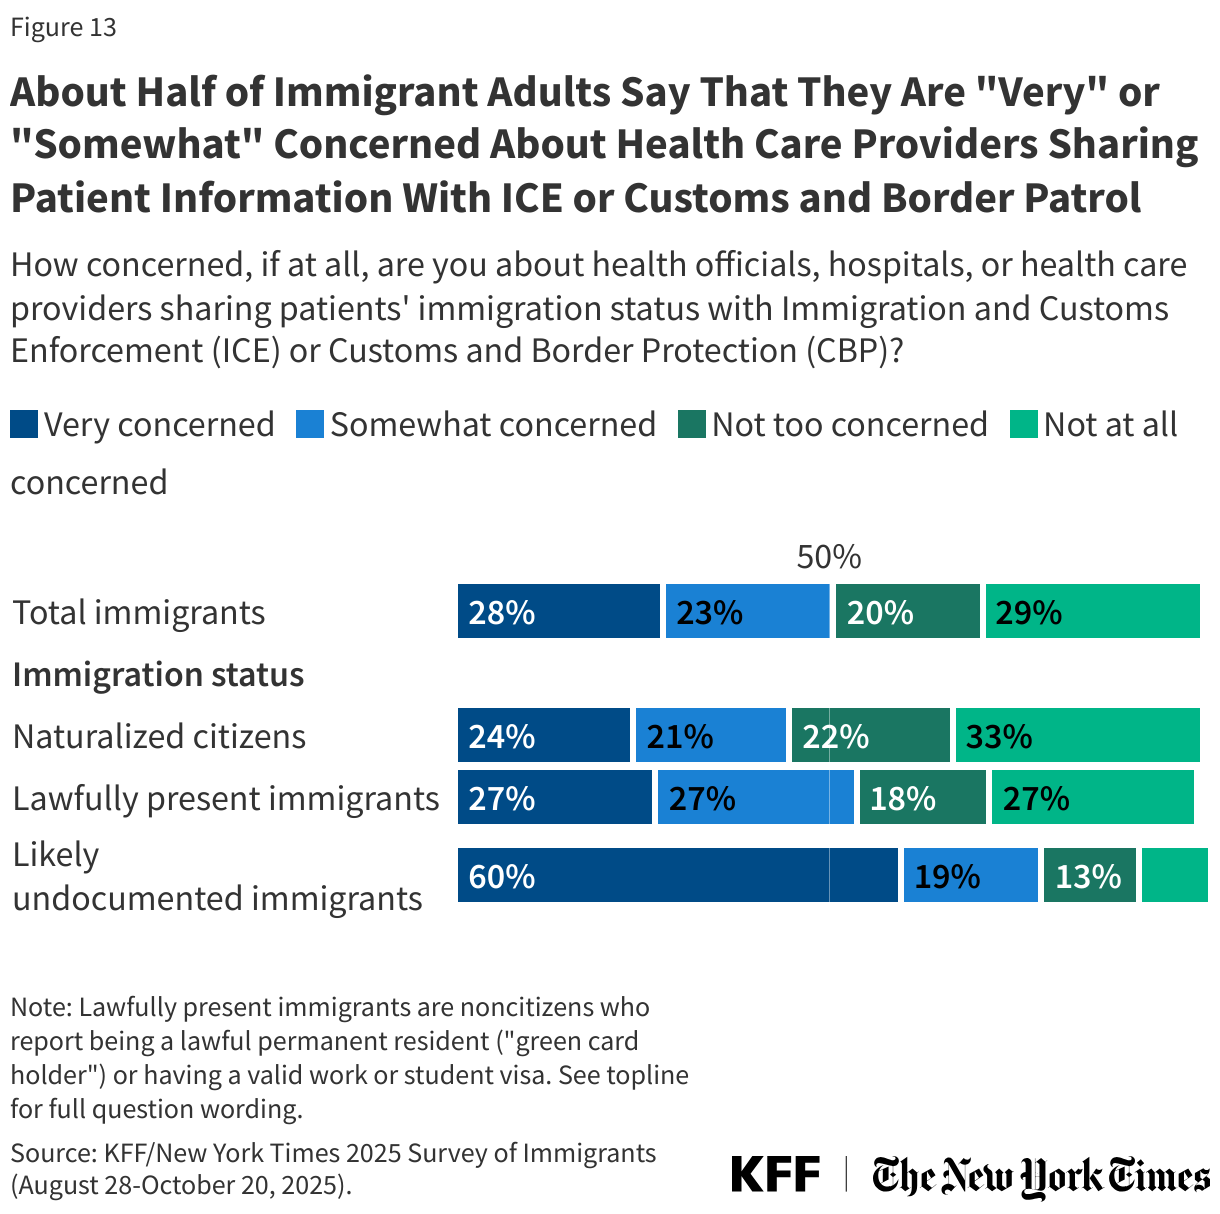
Reluctance to access health care may, in part, reflect concerns about health providers sharing information with immigration enforcement officials. About half (51%) of immigrant adults, including about eight in ten (78%) who are likely undocumented, say that they are “somewhat concerned” or “very concerned” about health officials, hospitals, or health care providers sharing patients’ information with Immigration and Customs Enforcement (ICE) or Customs and Border Protection (CBP) (Figure 13). These fears may have been exacerbated by the Trump administration’s action in June 2025 to share the personal and health data of noncitizen Medicaid enrollees with the Department of Homeland Security (DHS) for purposes of immigration enforcement despite concerns related to the violations of federal and state privacy data protections. While a federal court temporarily blocked the Trump administration from sharing enrollee data for immigration enforcement in the 20 states that filed a lawsuit, the move still likely contributes to fears.
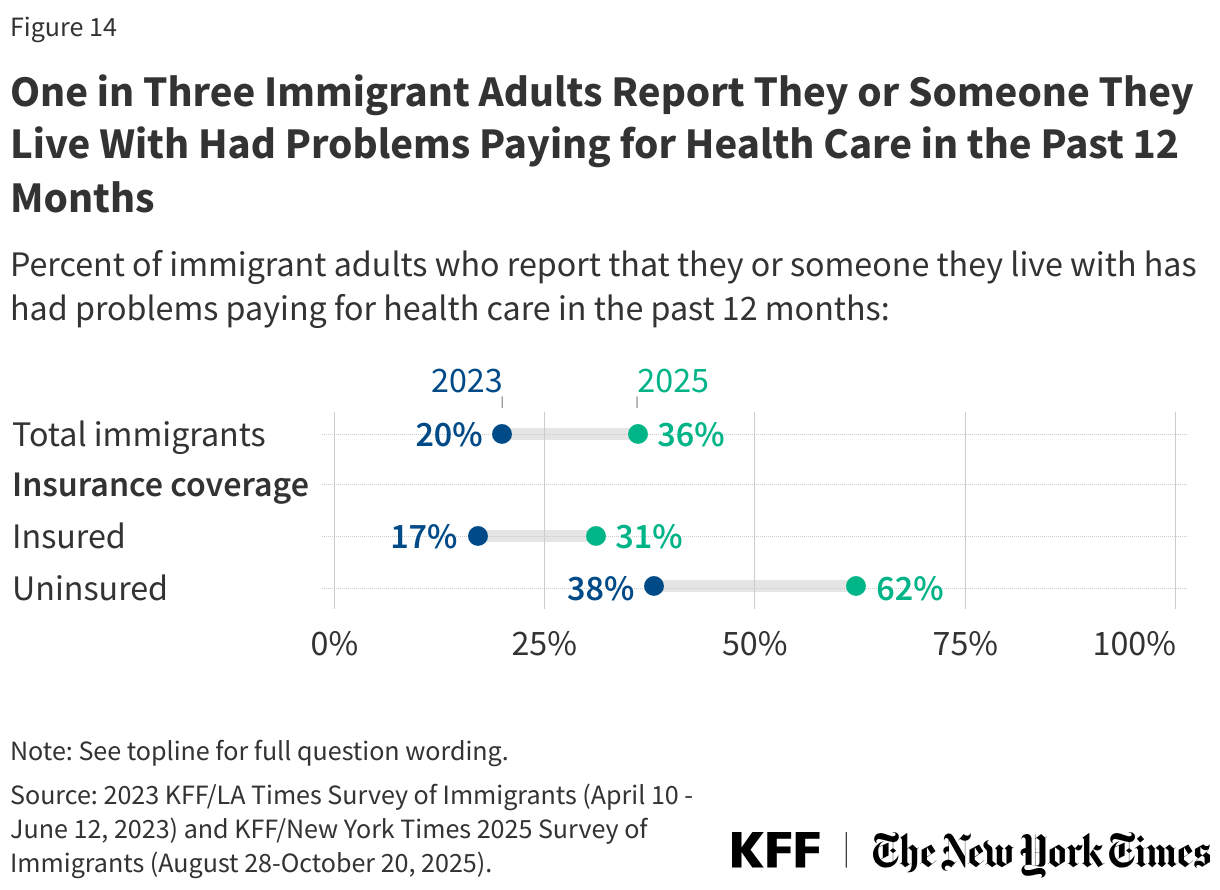
Beyond fears, health care costs remain a significant and growing concern for immigrant families as do challenges paying for other basic needs like food and housing. As of 2025, about one in three immigrant adults (36%) say that they or someone living with them had problems paying for health care in the past 12 months, up from one in five (20%) in 2023. Cost concerns are particularly high among immigrant adults who are uninsured, with about six in ten (62%) of uninsured immigrant adults reporting problems paying for health care compared to 31% of their insured counterparts and up from 38% of those who said the same in 2023 (Figure 14).
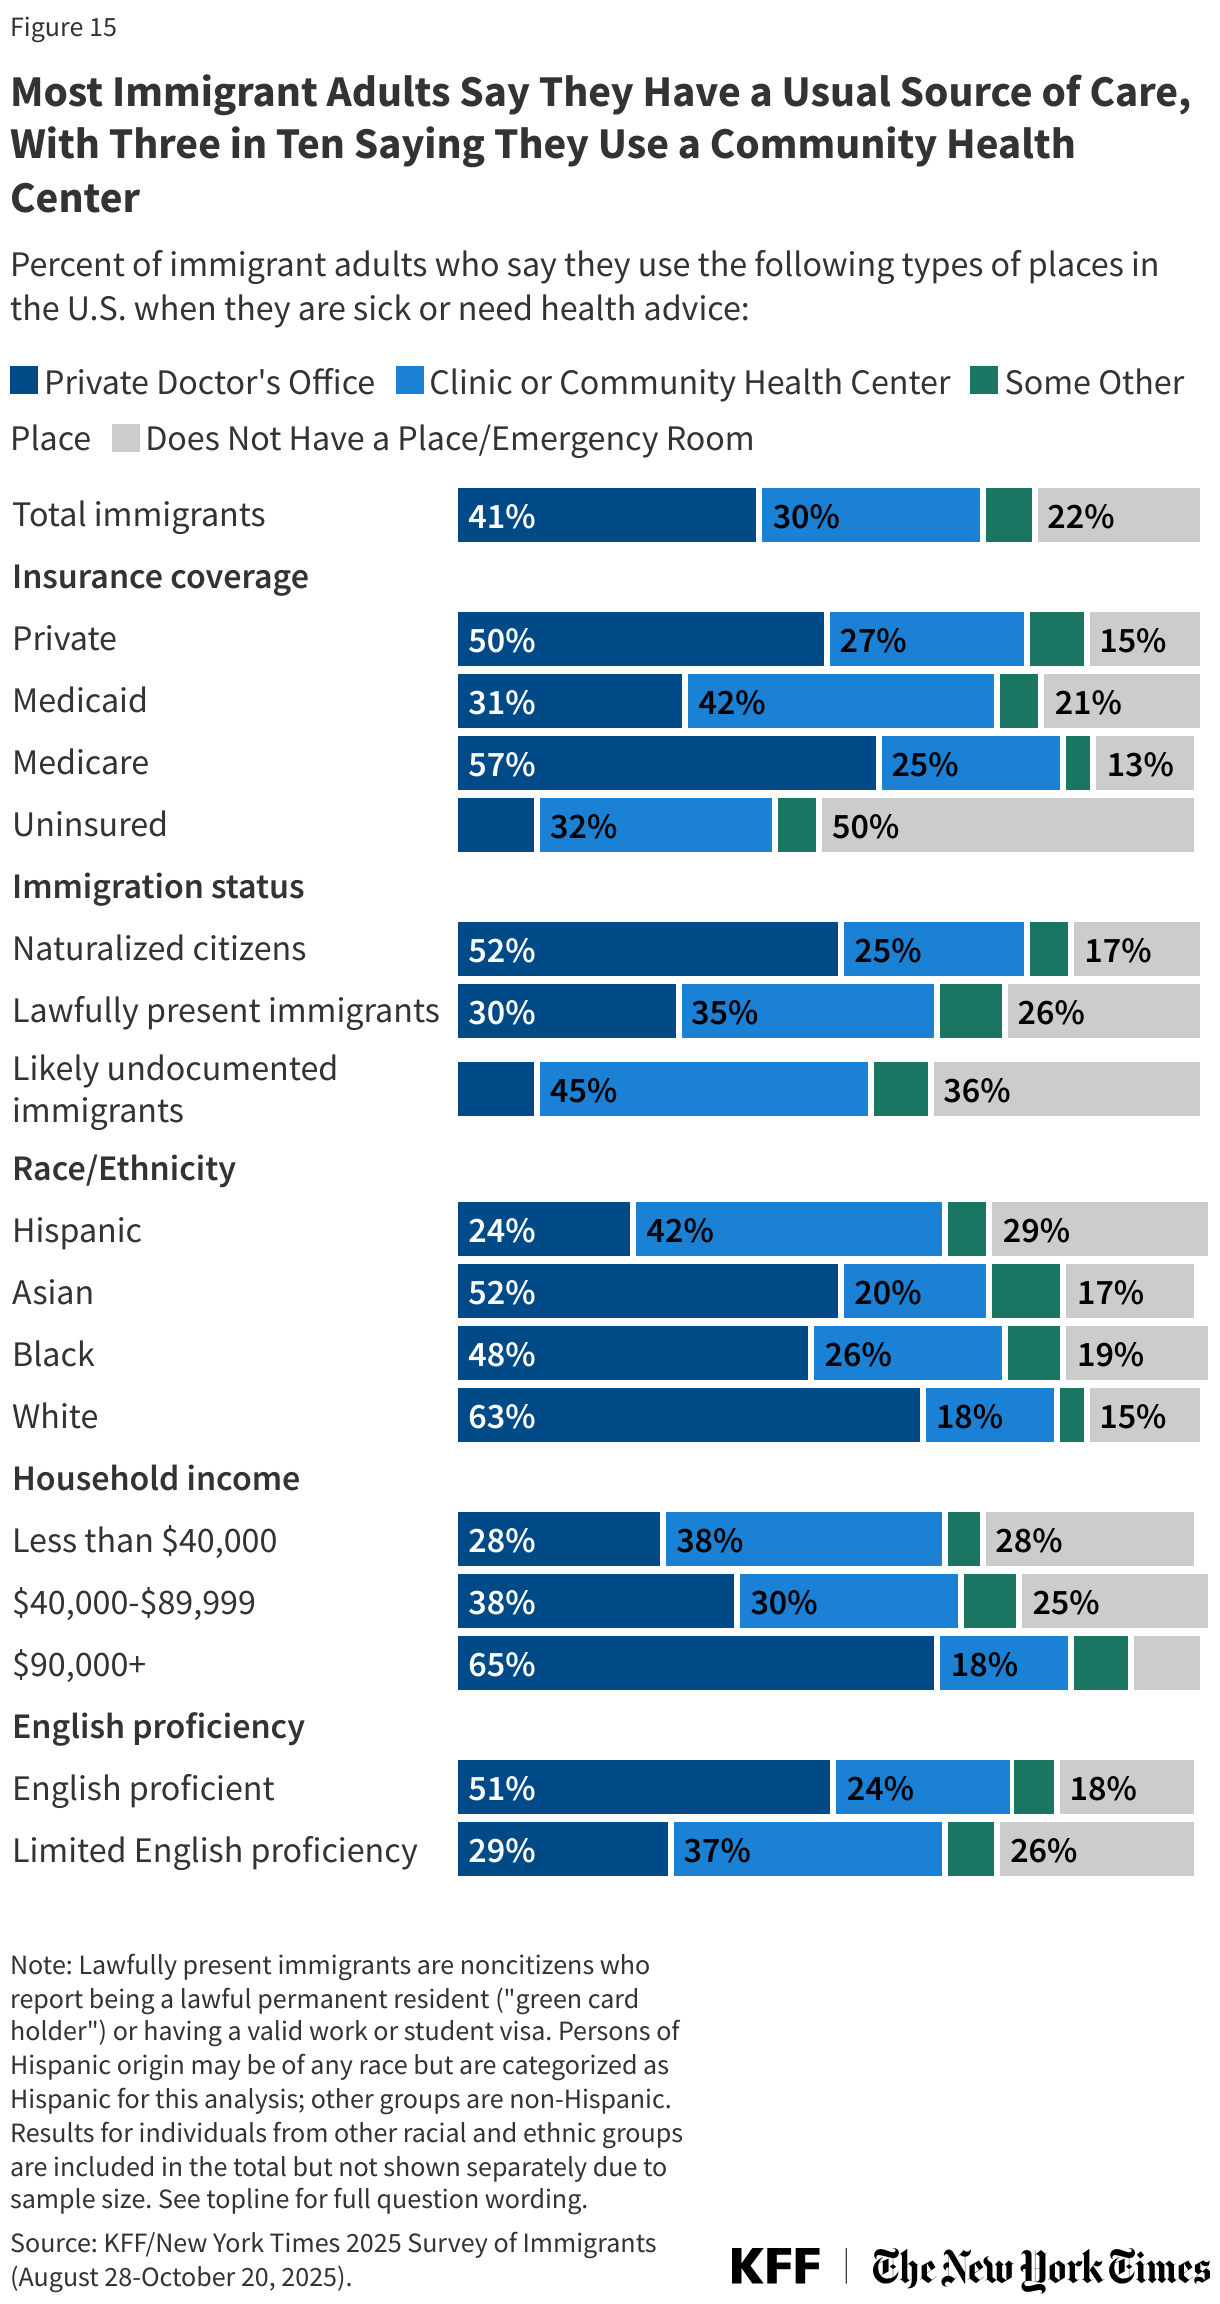
Community health centers are a primary source of care for immigrant adults but may face increased challenges serving them due to recent policy changes. Consistent with the overall adult population, most immigrant adults say they have a usual source of care other than a hospital emergency room (78%), but the share is lower among likely undocumented (64%) and uninsured immigrant adults (50%).Overall, three in ten (30%) immigrant adults report using a neighborhood clinic or community health clinic (CHC) when they are sick or need health advice (Figure 15). CHCs are a national network of over 1,300 safety-net primary care providers located in medically underserved communities and serve all patients regardless of their ability to pay. Reflecting this role, CHCs serve as a usual source of care for large shares of immigrant adults who are likely undocumented (45%), covered by Medicaid (42%), Hispanic (42%), have lower incomes (38%), or have LEP (37%). These data reflect shares of immigrant adults who report they use a CHC when they are sick or need health advice but do not reflect use of care over any specified time period and cannot be used to estimate the share of CHC patients who are immigrants in a given year. CHCs will likely face increased challenges serving patients due to Medicaid cutbacks in the 2025 tax and budget law. A Trump administration policy change also restricts access to CHCs for undocumented and some lawfully present immigrants, although implementation of this change is halted in 20 states and D.C. under a court ruling.
Methodology
The KFF/New York Times 2025 Survey of Immigrants was designed and analyzed by public opinion researchers at KFF. The survey was conducted August 28 – October 20, 2025, online, by telephone, and by mail among a nationally representative sample of 1,805 immigrants, defined as adults living in the U.S. who were born outside the U.S. Respondents had the option to complete the survey in one of six languages: English (n=1,310), Spanish (n=431), Chinese (n=38), Korean (n=21), and Vietnamese (n=5), and Haitian-Creole.
Teams from KFF and The New York Times worked together to develop the questionnaire and both organizations contributed financing for the survey. Each organization bears the sole responsibility for the work that appears under its name. Sampling, data collection, weighting, and tabulation were managed by SSRS of Glenn Mills, Pennsylvania in collaboration with public opinion researchers at KFF.
Sampling strategy
Respondents were reached through one of five sampling modes: an address-based sample, a random digit dial telephone (RDD) sample of prepaid (pay-as-you-go) cell phone numbers, a callback sample of telephone numbers that were previously selected for an RDD survey, the SSRS Opinion Panel, and the SSRS/KFF Immigrants Panel. Marketing Systems Group (MSG) provided the random samples of addresses and phone numbers utilized by each of the five sampling modes. Telephone interviewing of all sample types was managed by SSRS of Glen Mills, PA.
The address-based sample (n=646) was divided into areas (strata), defined by Census tract, based on the incidence of immigrants among the population overall and by countries of origin. Within each stratum, the sample was further divided into addresses that were flagged as possibly occupied by immigrant adults, and unflagged addresses. To increase the likelihood of reaching households with immigrant adults, strata with higher incidence of immigrants overall, and of certain countries of origin in particular, were oversampled.
The RDD prepaid sample (n=233) was disproportionately stratified to effectively reach immigrants from particular countries, based on county-level information. Among this prepaid cell phone component, 117 interviews were completed by phone and 116 were completed via web survey after being invited by short message service (SMS).
71 respondents were reached by calling back telephone numbers that were previously randomly selected for RDD surveys and had either self-reported being born outside the use (n=66), or an interviewer had noted that the respondent spoke a language other than English or Spanish (n=5). 377 respondents were reached through the SSRS Opinion Panel, a nationally representative probability-based panel, and 478 respondents were reached through the SSRS/KFF Immigrants Panel, a nationally representative probability-based panel of immigrants.
To qualify for the survey, respondents needed to specify their country of birth, and were included if they were born outside the U.S. Those born in U.S. territories including Puerto Rico did not qualify. Households in the ABS frame were invited to participate in the survey through multiple mailed, multilingual invitations, requesting that the adult in the household who had the most recent birthday complete the survey by going online, dialing a toll-free number, or returning a paper questionnaire. Interviewers also attempted calls to some telephone numbers that were matched to sampled addresses. Cases sampled through either the SSRS Opinion Panel or the SSRS/KFF Immigrants Panel additionally were asked to confirm they are the named panelist.
For the online panel components, invitations were sent to panel members by email followed by up to three reminder emails. Overall, 1,496 individuals completed the survey online, 263 completed the survey via telephone interview, and 46 completed paper questionnaires.
Incentives and data quality checks
All respondents were offered post-incentives varying in amounts of $10 to $20. The RDD live interviewer respondents received incentive via a check by mail. Those who participated online received an electronic gift card incentive by email. ABS paper respondents received a Visa gift card by mail. The online questionnaire included two questions designed to establish that respondents were paying attention. Cases that failed both attention check questions, skipped over 50% of survey questions, or participated in less than one-quarter of the mean length by mode were flagged and reviewed. Based on this criterion, 11 cases were removed.
Translation
The survey was translated by linguists at Cetra Language Solutions. To ensure accuracy of the survey program in each language, Cetra Language Solutions linguists and independent telephone interviewers reviewed each question as it appears in the program and provided feedback. The survey was revised and finalized based on this feedback.
Weighting
The combined sample was weighted to match the characteristics of the U.S. adult immigrant population, based on data from the Census Bureau’s 2023 American Community Survey (ACS). Weighting was done separately for each of the region of origin groups by sex, age, education, census region, number of adults in household, presence of children, home ownership, length of time in the U.S., and citizenship status. Some groups included other weighting parameters such as English proficiency, race/ethnicity, or relevant sub-geographies. The overall sample was also weighted to match the share of U.S. adult immigrants from each country/region of origin group The final weights take into account differences in the probability of selection for each of the five sample types. This includes adjustment for the sample design and geographic stratification, and within household probability of selection.
The margin of sampling error including the design effect for the full sample is plus or minus 3 percentage points. Numbers of respondents and margins of sampling error for key subgroups are shown in the table below. For results based on other subgroups, the margin of sampling error may be higher. Sample sizes and margins of sampling error for other subgroups are available by request. Sampling error is only one of many potential sources of error and there may be other unmeasured error in this or any other public opinion poll. KFF Public Opinion and Survey Research is a charter member of the Transparency Initiative of the American Association for Public Opinion Research.
| Group | N (unweighted) | M.O.S.E. |
|---|---|---|
| Total (2025) | 1,805 | ± 3 percentage points |
| Black immigrants | 174 | ± 11 percentage points |
| Hispanic immigrants | 742 | ± 5 percentage points |
| Asian immigrants | 545 | ± 6 percentage points |
| White immigrants | 297 | ± 7 percentage points |
| Naturalized Citizen | 1,171 | ± 4 percentage points |
| Lawfully Present (Green card or valid visa holder) | 481 | ± 6 percentage points |
| Likely undocumented | 151 | ± 10 percentage points |
| English Proficient (speaks English only or “very well”) | 1,108 | ± 4 percentage points |
| Limited English Proficient (speaks English “less than very well”) | 693 | ± 5 percentage points |
| Immigrant registered voters | 1055 | ± 4 percentage points |
| Republican voters | 229 | ± 8 percentage points |
| Democratic voters | 408 | ± 7 percentage points |
| Independent voters | 360 | ± 7 percentage points |
Acknowledgements
During the initial development of this poll, KFF consulted the following about considerations in polling immigrants: the National Immigration Law Center, UnidosUS and Dr. May Sudhinaraset. These organizations or individuals provided valuable insights in the planning and dissemination of the survey. They did not have access to any materials before the survey was released or input into the analysis of the findings.
Appendix
Endnotes
- KFF analysis of 2025 Current Population Survey Annual Social and Economic Supplement (CPS-ASEC). ↩︎
