KFF Health Tracking Poll: Health Care Issues in the Lead-Up to the 2026 Midterm Election
Findings
Key Takeaways
- With about a month to go before Election Day, the latest KFF Health Tracking Poll finds a large enthusiasm gap between partisans, with Democratic voters much more likely than Republican voters to say they are “more motivated” to vote this year than usual (63% vs. 38%). As voters make their final assessments before they cast their ballots, the Democratic Party has a clear edge over the Republican Party on who voters trust to handle many top issues in the election, including the cost of health care (42% vs. 22%) and the cost of living (39% vs. 25%). Notably, the size of the gap between the Democratic and Republican parties on health care costs has increased since April of this year, when 37% said they trusted the Democrats and 26% said they trusted the Republicans.
- Health costs continue to be a top affordability worry for voters, tied with concerns about gas prices as in recent months. Six in ten voters are worried about being able to afford their health care costs, and about half of voters say it is “extremely important” for candidates in the midterm elections to talk about the cost of health care—ranking alongside the cost of living as the top two issues voters want to hear candidates talk about in the closing weeks of the midterm campaigns.
- There is bipartisan support among the public for major changes to the country’s health care system, but partisans have vastly different views of the type of change needed. Large majorities of adults, including about nine in ten Democrats and three-quarters of Republicans, say the U.S. health care system needs either a complete overhaul or major changes. Reflecting the increased attention to Medicare-for-all in congressional races where some progressive Democrats have campaigned on it, two-thirds (66%) of U.S. adults now support Medicare-for-all, up from 53% when KFF last asked the question in October 2020. Views of a single-payer system remain highly partisan, with majorities of Democrats (84%) and independents (72%) saying they favor it, compared to 66% of Republicans who oppose such a plan.
- Despite the public’s generally favorable view of Medicare-for-all, support drops when people hear criticisms of such a plan commonly made by opponents about the potential for higher taxes, longer wait times, or threats to the current Medicare program. On the other hand, support for Medicare-for-all increases when people hear claims made by proponents, including that such a system might guarantee health coverage as a right for everyone or eliminate insurance premiums and cost-sharing. Taken together, these findings suggest that while a majority supports Medicare-for-all in the abstract, support is likely to shift over the course of any public debate in which the public hears arguments for and against such a plan. For a summary of historical KFF polling data on opinions of Medicare-for-all, see here.
What Is Motivating Midterm Voters?
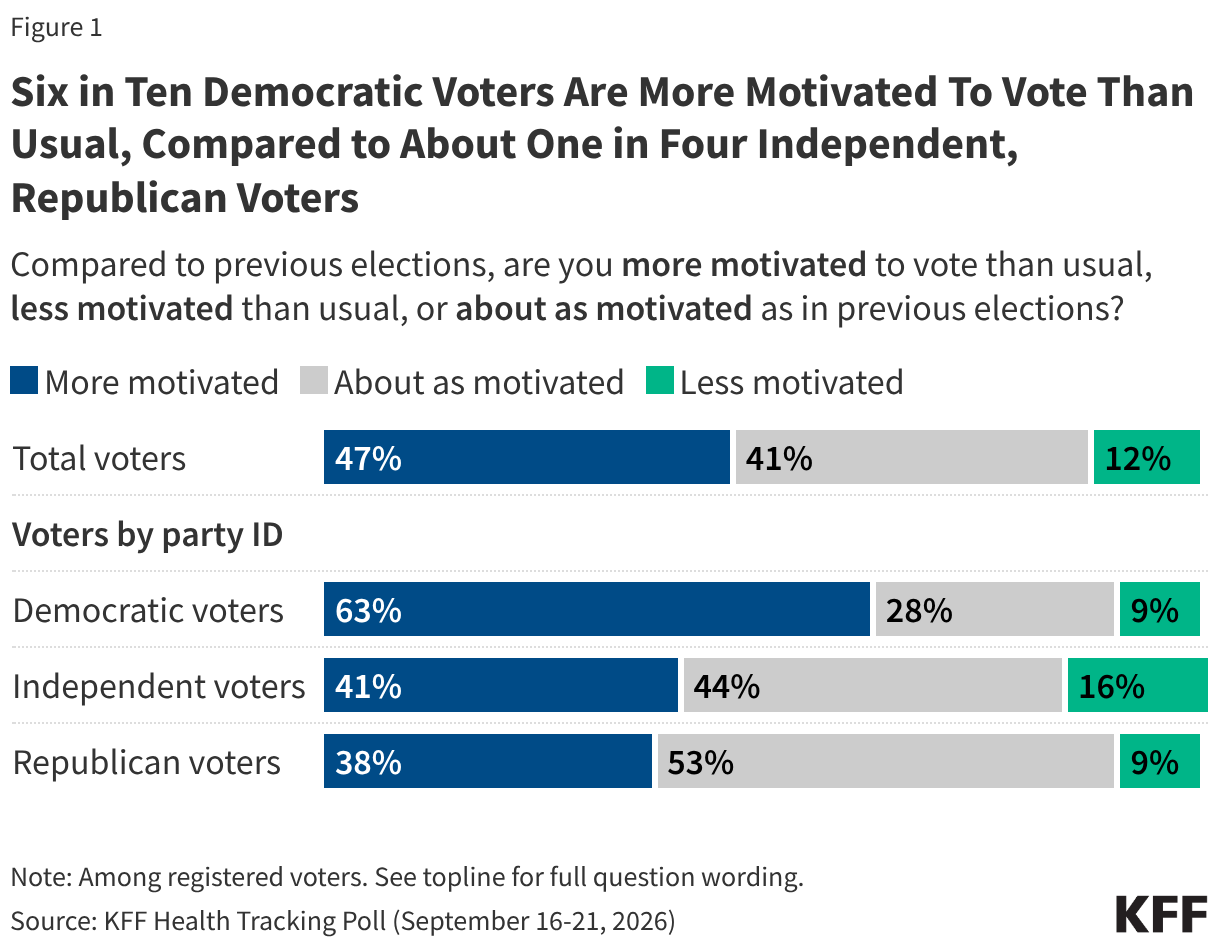
With the 2026 midterm campaigns in full swing and early voting about to begin, there is a wide enthusiasm gap between partisan voters, with Democratic voters 25 percentage points more likely than Republican voters to say they are “more motivated” than usual to vote (63% vs. 38%).
Most Republican voters (53%) say they are “about as motivated” as in previous elections, while independent voters are split, with about four in ten saying they are “more motivated” (41%) and a similar share saying they are “about as motivated” (44%) to vote as in past elections. Across partisans, one in six or fewer say they are “less motivated” to vote than usual.
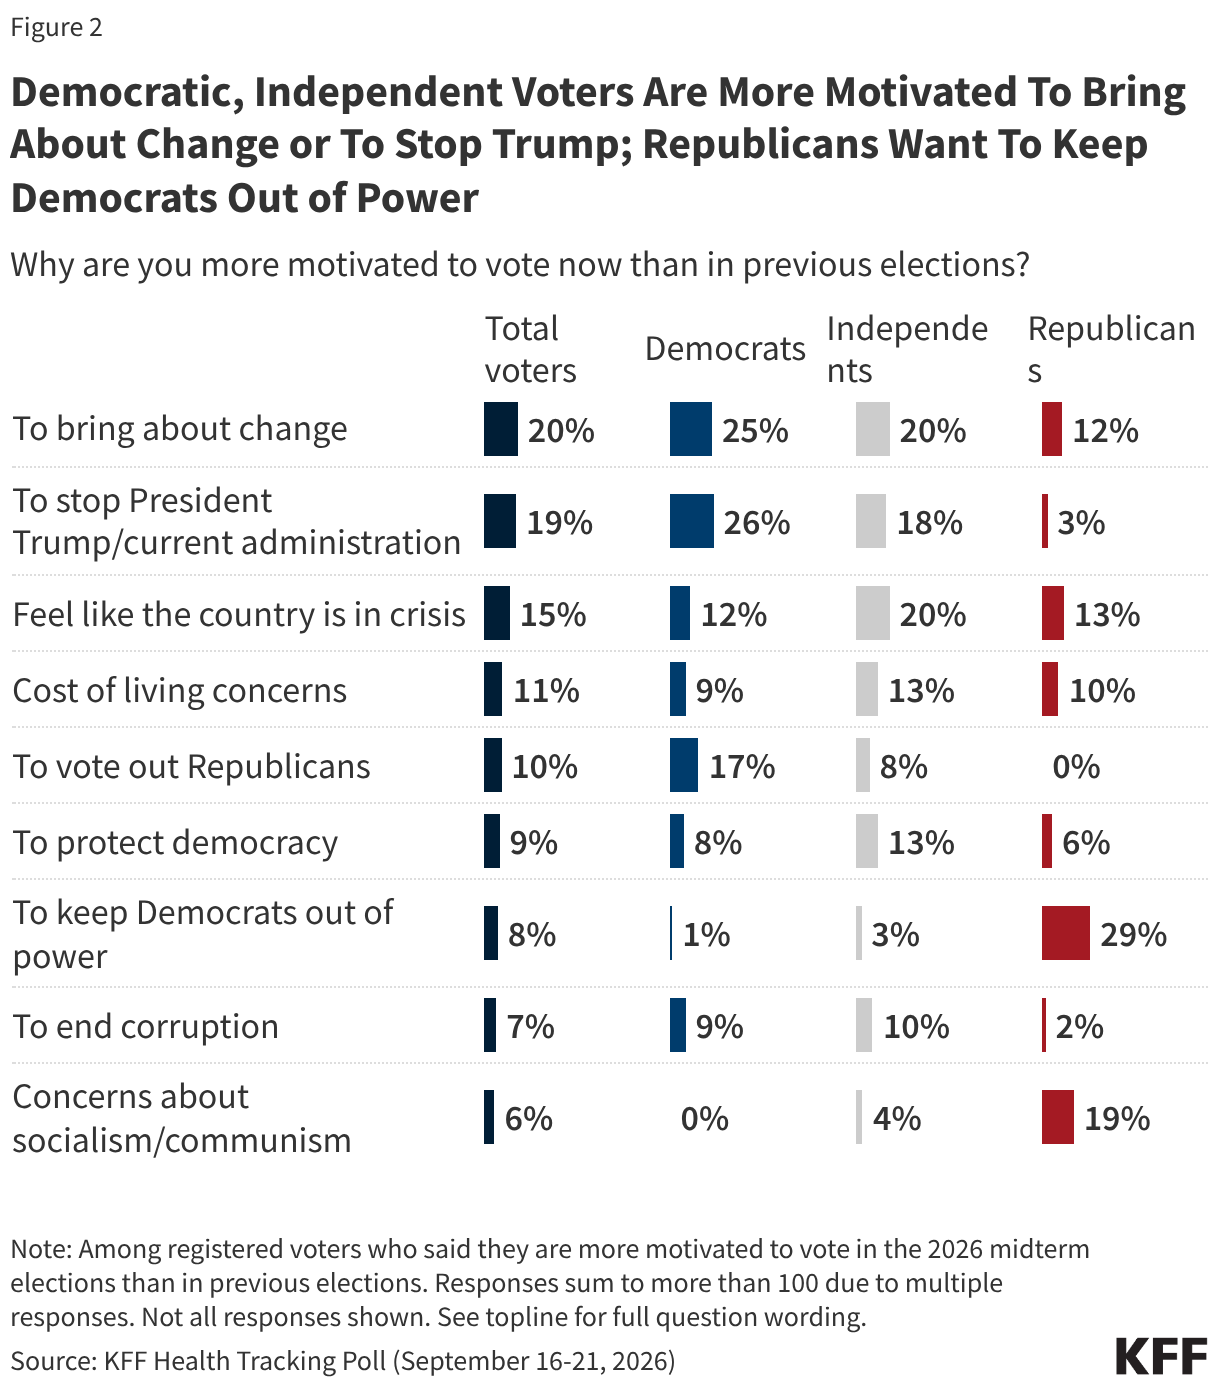
When asked specifically about why they are “more motivated” than usual, there are wide differences by partisanship, although many Democratic and Republican voters say they are motivated to keep the other party out of power. Among those who say they are more motivated, about one in five or more Democratic and independent voters say they want to bring about change (25% and 20%) or to stop the Trump administration (26% and 18%), and another 17% of Democrats say they want to vote out Republicans. Republicans, conversely, most often say they are more motivated to vote to keep Democrats out of power (29%) or because of concerns about socialism or communism (19%). Across partisanship, about one in ten say they are more motivated to vote than usual due to concerns about the cost of living.
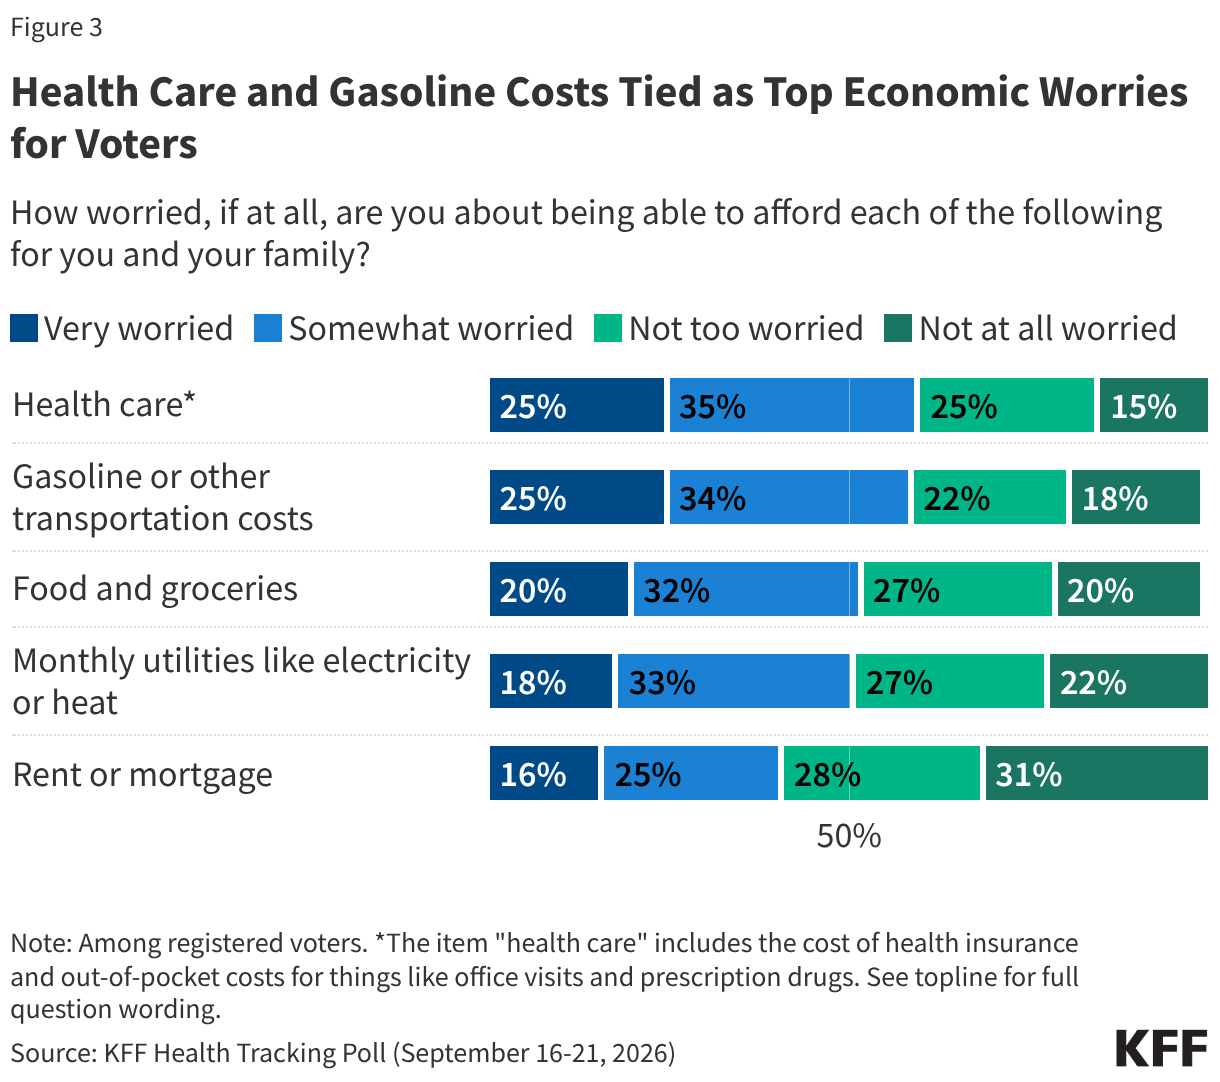
With the cost of living weighing heavily on voters, the latest KFF Health Tracking Poll finds that health care costs and gasoline and other transportation costs continue to top the list of voters’ economic worries. Six in ten voters say they are “very” (25%) or “somewhat” worried (35%) about affording health care costs for themselves and their families, including the cost of health insurance and out-of-pocket costs for things like office visits and prescription drugs. Similar shares say the same about affording gasoline and other transportation costs, following a similar pattern KFF polling has tracked this year even as gas prices continue to fluctuate amid the conflict with Iran. Somewhat smaller—but still substantial—shares of voters say they are concerned about affording other household items like food (52%), utilities (51%), or housing costs (41%).
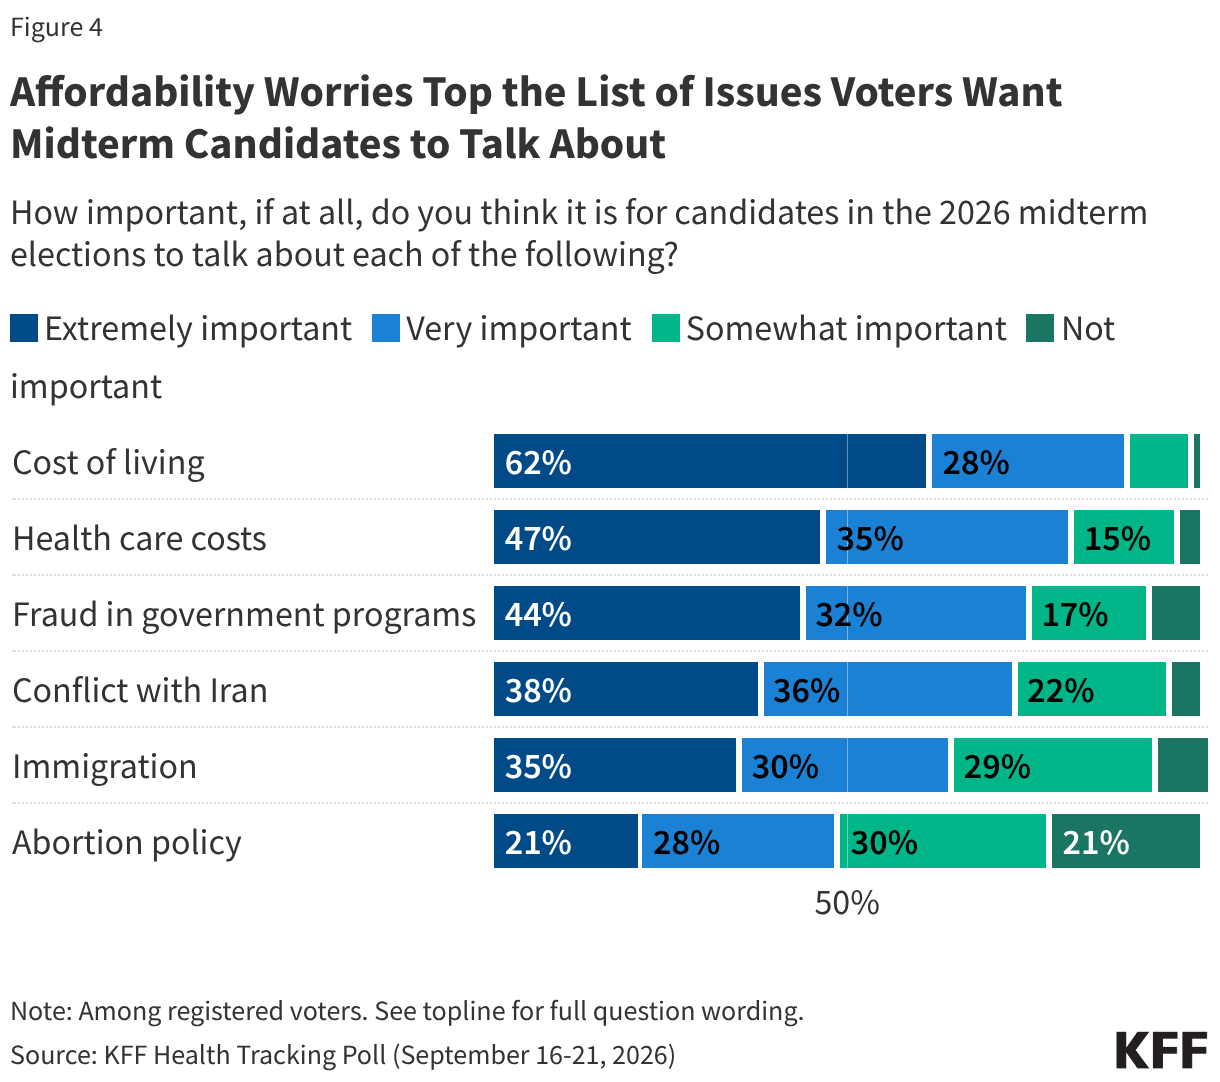
The public’s affordability worries are echoed in what issues voters say they want 2026 midterm candidates to prioritize. The cost of living is voters’ top issue they want to hear about from candidates, with six in ten (62%) saying it is “extremely important” for candidates to talk about it. The cost of health care is an important part of voters’ cost of living concerns, with about half of voters (47%) saying it is “extremely important” for candidates to talk about health care costs. About four in ten (44%) say fraud in government programs is “extremely important” for candidates to talk about, while smaller shares of voters say the same about the conflict with Iran (38%), immigration (35%), and abortion policy (21%).
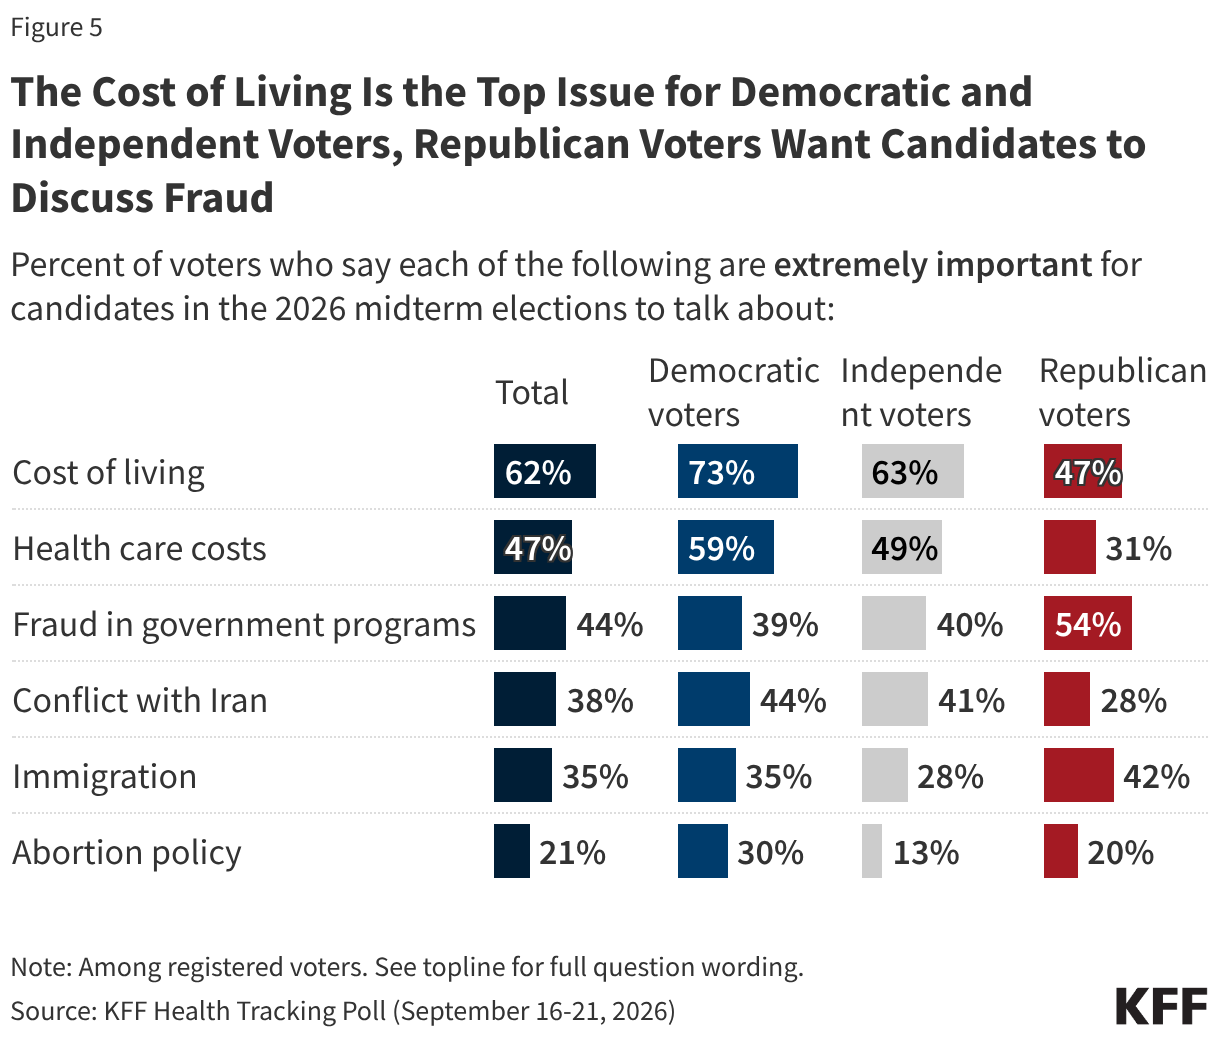
The cost of living is the top issue Democratic (73%) and independent (63%) voters want midterm candidates to discuss, while fewer Republican voters (47%) call it “extremely important.” Fraud in government programs is Republican voters’ top issue, with just over half (54%) calling it extremely important, suggesting that Republican leaders’ messaging on this topic is reaching their base. Six in ten Democratic voters (59%) and about half of independent voters (49%) say it’s extremely important for candidates to talk about health care costs, compared to a smaller share (31%) of Republican voters.
When asked to say in their own words what they want midterm candidates to talk about when it comes to health care costs, the most common responses were related to a desire to hear about candidates’ plans for how they will lower health care costs for people.
In Their Own Words: Voters Describe What They Want To Hear From Candidates About Health Care Costs
“Making health care more affordable for many people by expanding coverage for a wide range of services.” – 32-year-old Democrat, New Jersey
“Lowering [health care costs] for people who can’t afford to pay expensive costs for health care.” – 40-year-old Republican, Arkansas
“To make sure that people’s needs are met. It’s sad people have to choose between eating and getting their medicine.” – 37-year-old Democrat, Michigan
“How they are going to lower health care costs. Like medicine and doctors’ visits.” – 23-year-old Independent, Georgia
“I want free universal healthcare for everyone in this country.” –65-year-old Democrat, New Mexico
“Health care needs to be free for all citizens.” – 54-year-old Republican, North Carolina
Note: Responses are lightly edited for length and spelling. These responses reflect respondents’ own language and do not represent the views of KFF.
Democrats Have the Edge Over Republicans on Key Midterm Issues
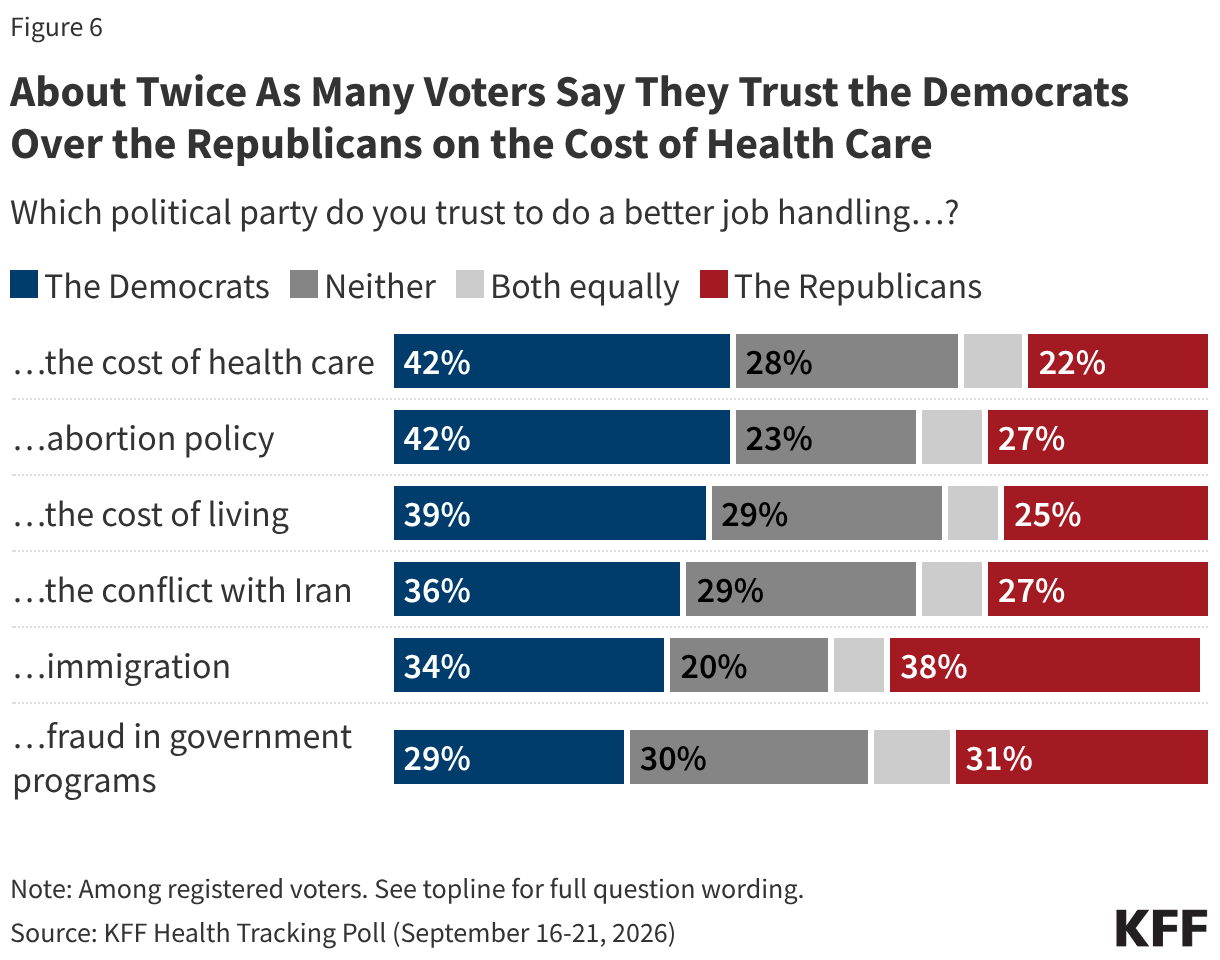
As voters make their final assessments before they cast their ballots in the midterm election, the Democratic Party has a clear edge over the Republican Party on who voters trust to handle many top issues in the election, most notably the cost of health care (42% vs. 22%) and the cost of living (39% vs. 25%). The Democrats also have an advantage over the Republicans on abortion policy (42% vs. 27%) and the conflict with Iran (36% vs. 27%). Voters are more evenly divided on which party they trust to handle immigration and fraud in government programs. On each of the issues measured, between two and three in ten voters say they trust “neither” party and about one in ten say they trust “both equally.”
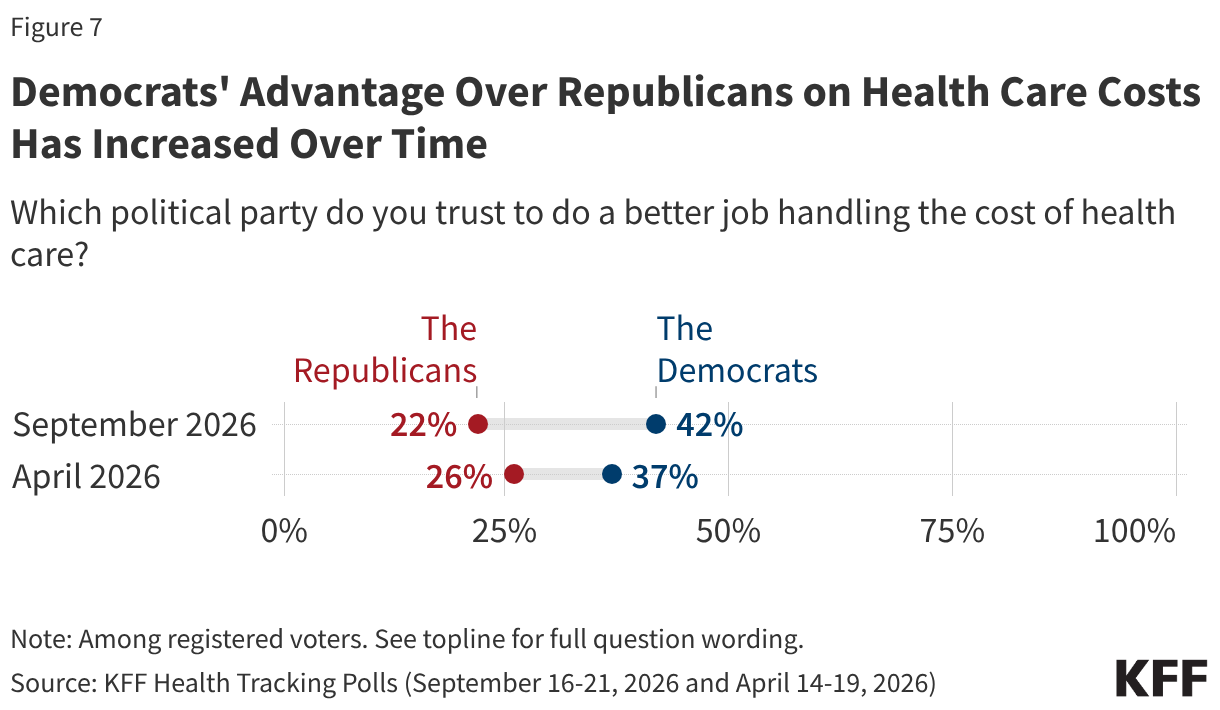
On health care costs, the Democratic Party’s advantage over the Republican Party has increased over the last six months. In April 2026, 37% of voters said they trusted the Democrats and 26% said they trusted the Republicans to do a better job addressing health care costs, a gap of 11 percentage points. In the latest poll, that gap has increased to 20 percentage points, with 42% trusting the Democrats more and 22% trusting the Republicans.
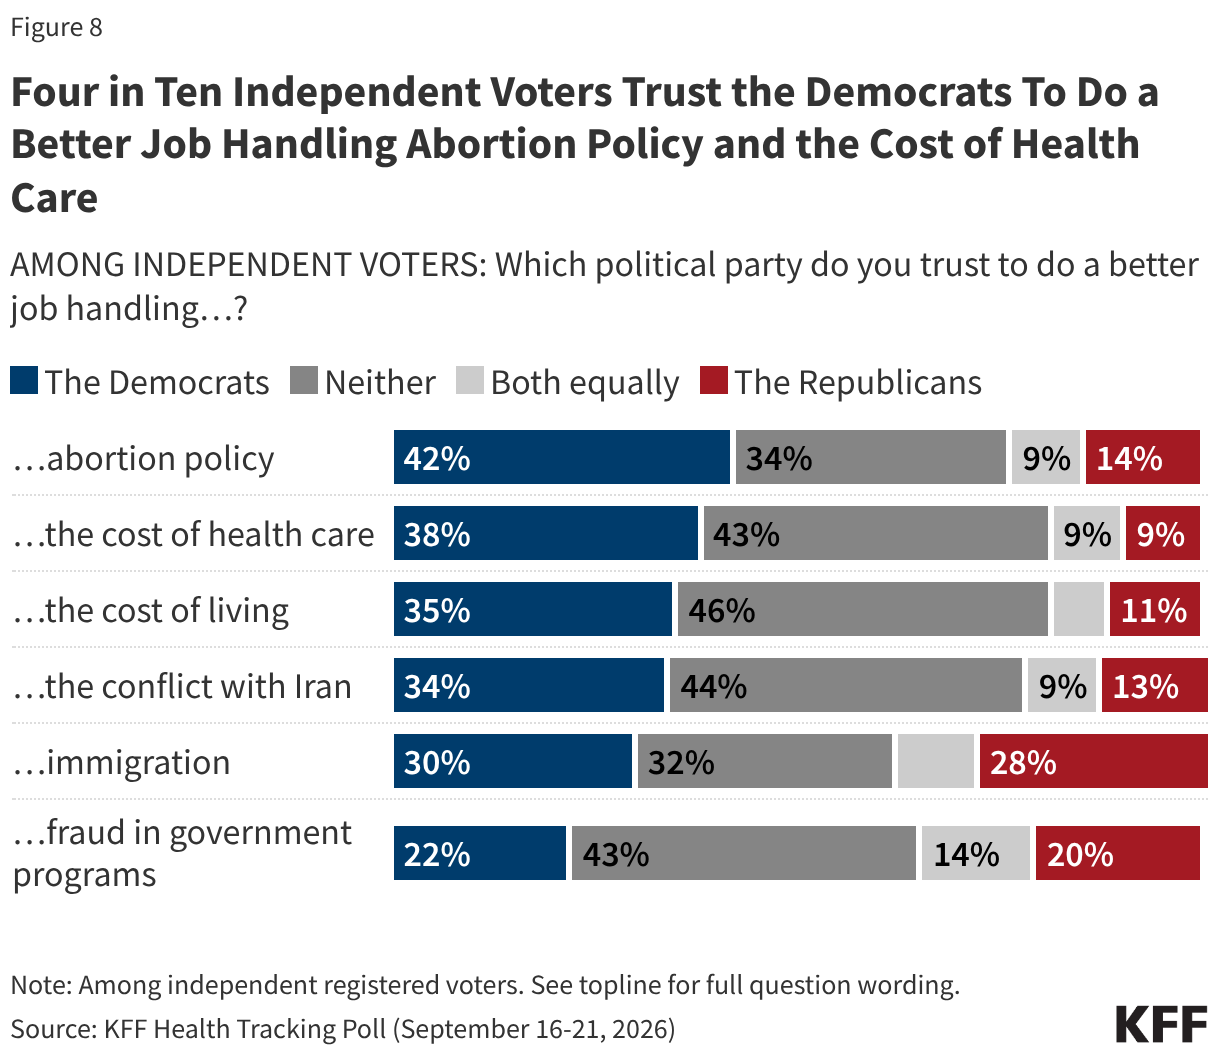
Among independent voters, the Democratic Party has at least a two-to-one advantage over the Republican Party when it comes to addressing the cost of health care (38% vs. 9%), the cost of living (35% vs. 11%), abortion policy (42% vs. 14%), and the conflict with Iran (34% vs. 13%). However, large shares of independent voters—ranging from about a third on immigration and abortion policy to more than four in ten on the cost of living, the cost of health care, the conflict with Iran, and fraud in government programs—say they trust neither party.
Two-Thirds Favor Medicare-for-All, but Opinion Shifts When Public Hears Arguments
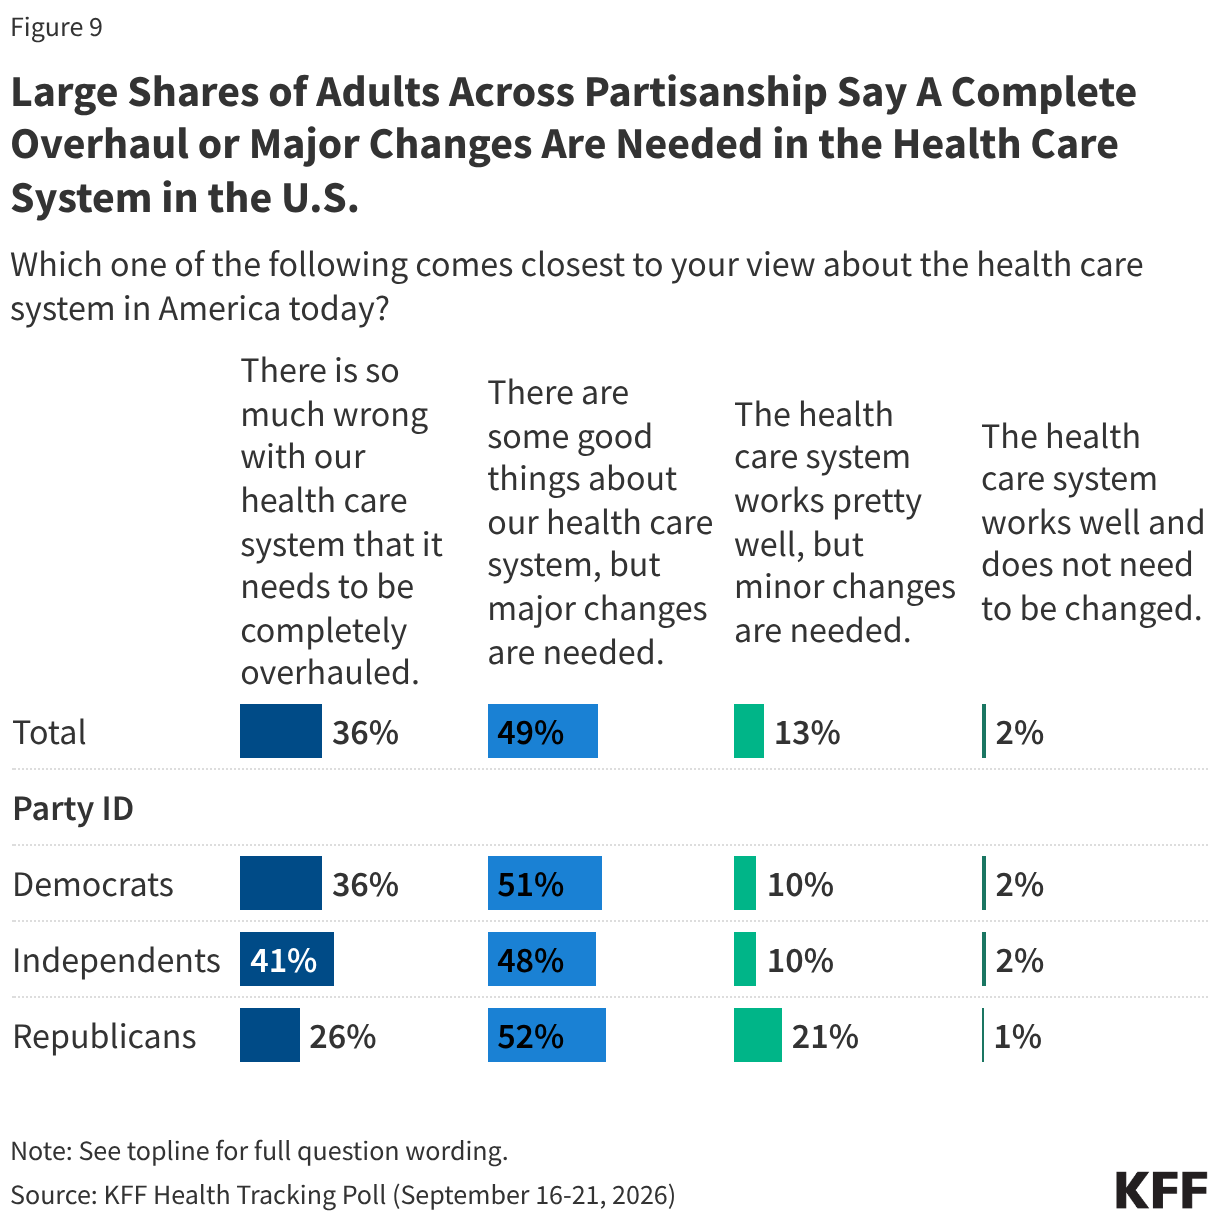
Amid frustrations about health care costs, there is bipartisan agreement among adults that major changes are needed to the U.S. health care system. About half of adults across partisanship say, “There are some good things about our health care system, but major changes are needed,” and an additional third (36%) feel even more strongly, saying, “There is so much wrong with our health care system that it needs to be completely overhauled.” Few adults (15%) say the system works well enough that only minor or no changes are needed, though Republicans are about twice as likely as Democrats and independents to say only minor changes are needed (21% vs. 10% each).
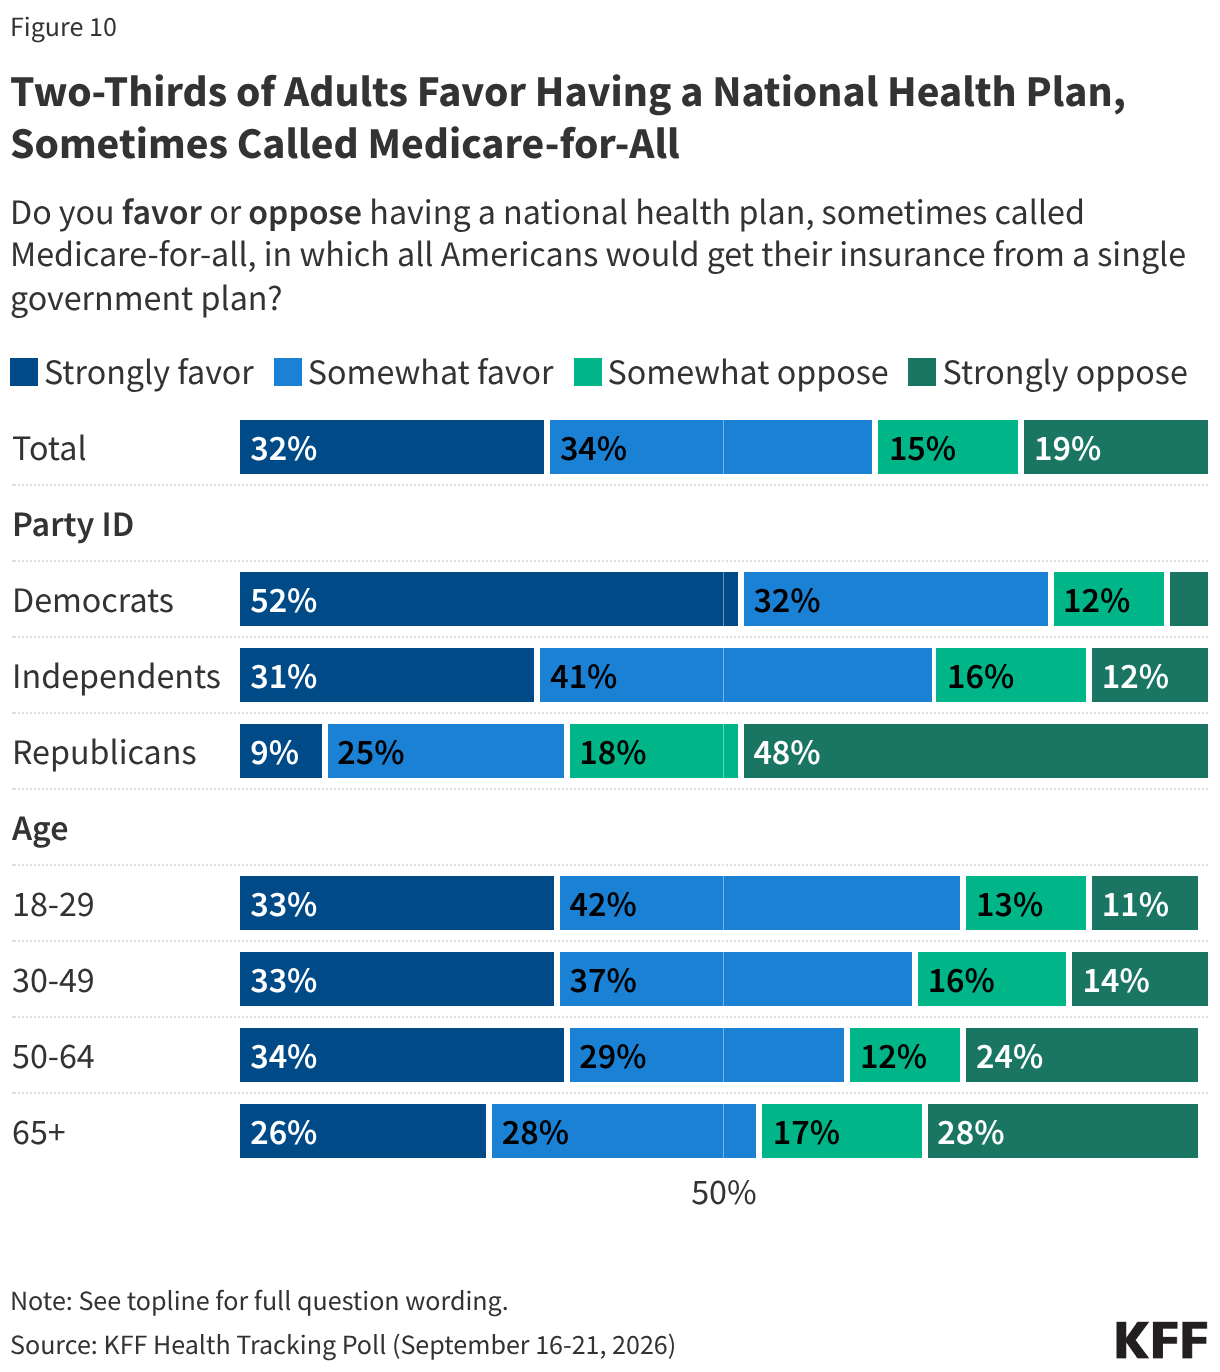
Many progressive midterm candidates have been campaigning on their support for Medicare-for-all, an idea that can take different forms but usually refers to a system in which all Americans would get their insurance from a single government plan. The latest KFF Health Tracking Poll finds that two-thirds of the public (66%) say they favor Medicare-for-all, the highest share KFF has recorded since it began polling on the idea in 2016, when Senator Bernie Sanders made the idea a core issue of his primary campaign. For a summary of current and historical polling data on Medicare-for-all and other single-payer proposals, see here.
While favorability of Medicare-for-all has risen over time, there are still wide partisan divides. Majorities of Democrats (84%) and independents (72%) favor it, while a majority of Republicans (66%) oppose it, including about half (48%) who say they “strongly oppose.” There are also key differences by age, with three-quarters of younger adults ages 18-29 (75%) favoring Medicare-for-all compared to a slim majority (54%) of adults ages 65 and older, most of whom are currently enrolled in Medicare.
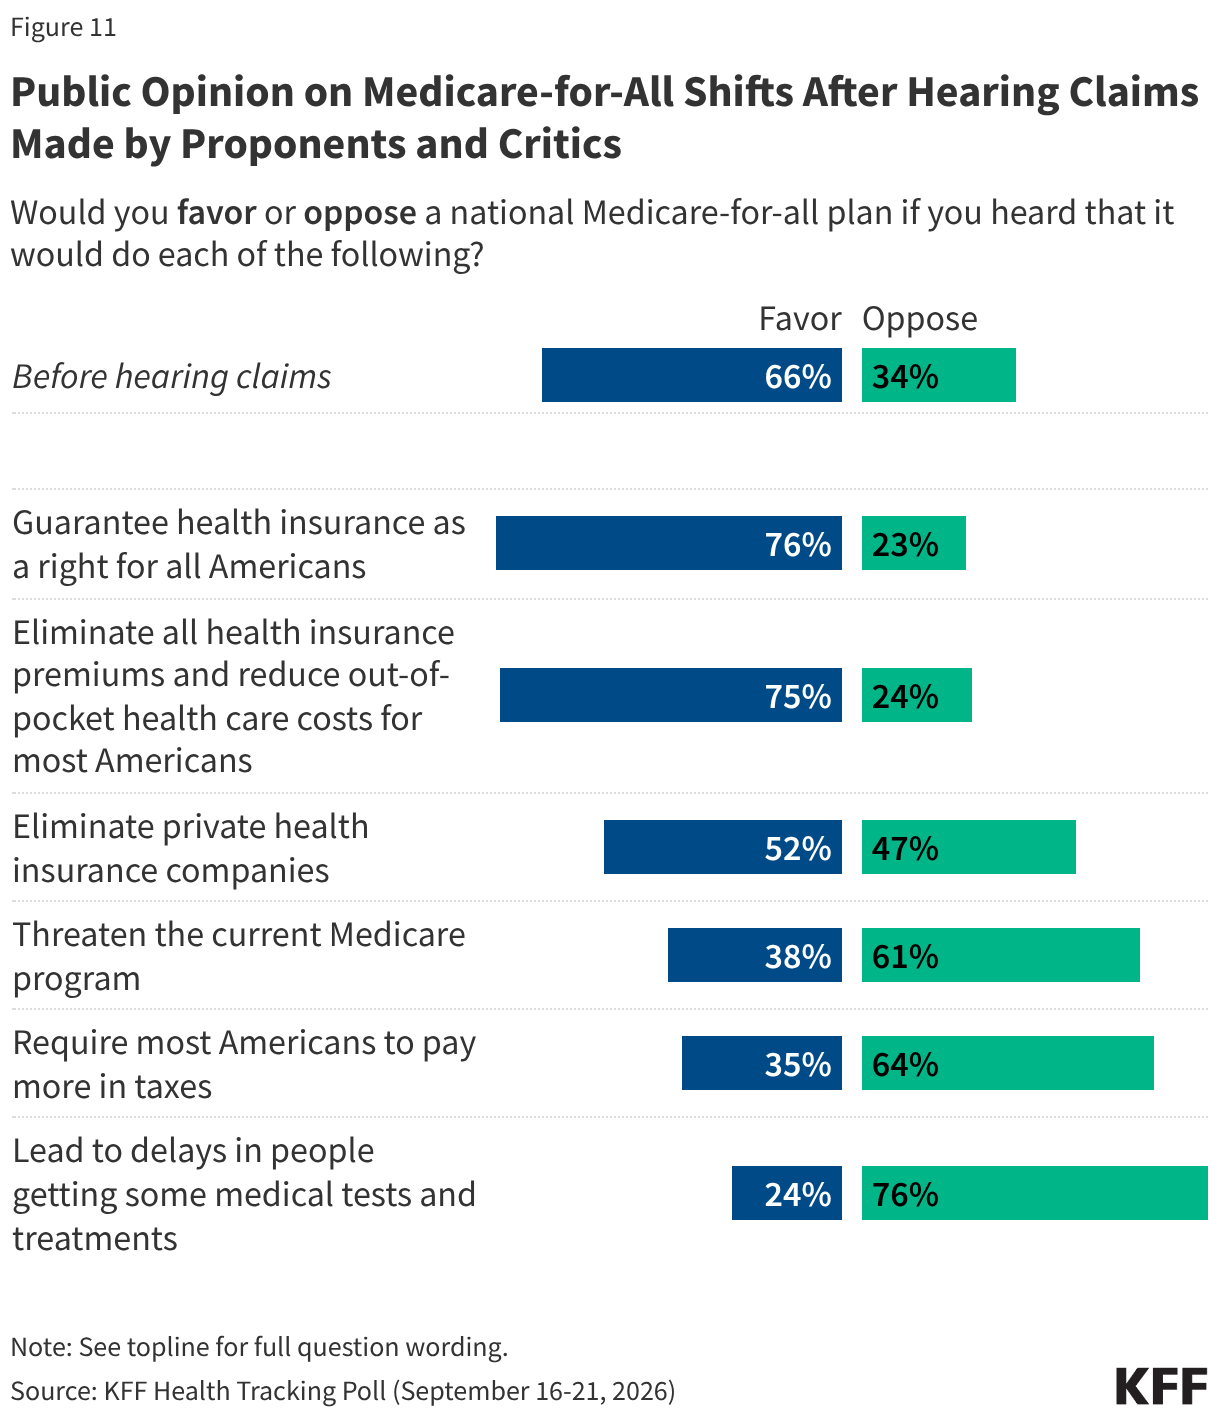
As KFF polling has consistently found over the years, support for a single-payer health system is susceptible to change as people hear about potential effects of such a plan commonly cited by proponents and critics. The latest poll finds public opposition to Medicare-for-all increases significantly when people hear that such a plan could mean potential delays in medical tests and treatments (76% oppose), an increase in taxes (64%), or threats to the current Medicare program (61%).
On the other hand, larger majorities say they would favor such a plan if it guaranteed health insurance as a right (76%) or eliminated premiums and cost-sharing (75%), demonstrating the wide appeal of universal coverage and lowering health care costs for individuals. The public is more split, with about half (52%) saying they would favor Medicare-for-all if it eliminated private health insurance companies, while 47% oppose. This marks a departure from when KFF last asked this question in October 2020, when the prospect of eliminating private insurance companies led to lower support for Medicare-for-all (37% favored, 58% opposed). Each of these claims shift opinion regardless of things like partisanship and age.
Methodology
This KFF Health Tracking Poll was designed and analyzed by public opinion researchers at KFF. The survey was conducted September 16 – September 21, 2026, online and by telephone among a nationally representative sample of 1,328 U.S. adults in English (n=1,237) and in Spanish (n=91). The sample includes 1,015 adults (n=72 in Spanish) reached through the SSRS Opinion Panel either online (n=990) or over the phone (n=25). The SSRS Opinion Panel is a nationally representative probability-based panel where panel members are recruited randomly in one of two ways: (a) Through invitations mailed to respondents randomly sampled from an Address-Based Sample (ABS) provided by Marketing Systems Groups (MSG) through the U.S. Postal Service’s Computerized Delivery Sequence (CDS); (b) from a dual-frame random digit dial (RDD) sample provided by MSG. For the online panel component, invitations were sent to panel members by email followed by up to three reminder emails.
Another 313 (n=19 in Spanish) adults were reached through random digit dial telephone sample of prepaid cell phone numbers obtained through MSG. Phone numbers used for the prepaid cell phone component were randomly generated from a cell phone sampling frame with disproportionate stratification aimed at reaching Hispanic and non-Hispanic Black respondents. Stratification was based on incidence of the race/ethnicity groups within each frame. Among this prepaid cell phone component, 142 were interviewed by phone and 171 were invited to the web survey via short message service (SMS).
Respondents in the prepaid cell phone sample who were interviewed by phone received a $15 incentive via a check received by mail or an electronic gift card incentive. Respondents in the prepaid cell phone sample reached via SMS received a $10 electronic gift card incentive. SSRS Opinion Panel respondents received a $5 electronic gift card incentive (some harder-to-reach groups received a $10 electronic gift card). In order to ensure data quality, cases were removed if they failed two or more quality checks: (1) attention check questions in the online version of the questionnaire, (2) had over 30% item non-response, or (3) had a length less than one quarter of the mean length by mode. Based on this criterion, 8 cases were removed.
The combined cell phone and panel samples were weighted to match the sample’s demographics to the national U.S. adult population using data from the Census Bureau’s 2025 Current Population Survey (CPS), September 2023 Volunteering and Civic Life Supplement data from the CPS, and the 2026 KFF Benchmarking Survey with ABS and prepaid cell phone samples. The demographic variables included in weighting for the general population sample are gender, age, education, race/ethnicity, region, civic engagement, frequency of internet use and political party identification. The weights account for differences in the probability of selection for each sample type (prepaid cell phone and panel). This includes adjustment for the sample design and geographic stratification of the cell phone sample, within household probability of selection, and the design of the panel-recruitment procedure.
The margin of sampling error including the design effect for the full sample is plus or minus 3 percentage points. Numbers of respondents and margins of sampling error for key subgroups are shown in the table below. For results based on other subgroups, the margin of sampling error may be higher. Sample sizes and margins of sampling error for other subgroups are available on request. Sampling error is only one of many potential sources of error and there may be other unmeasured error in this or any other public opinion poll. KFF public opinion and survey research is a charter member of the Transparency Initiative of the American Association for Public Opinion Research.
| Group | N (unweighted) | M.O.S.E. |
| Total | 1,328 | ± 3 percentage points |
| Total registered voters | 1,013 | ± 4 percentage points |
| Party ID | ||
| Democrats | 446 | ± 6 percentage points |
| Independents | 439 | ± 6 percentage points |
| Republicans | 347 | ± 7 percentage points |
| Registered Voters by Party ID | ||
| Democrats | 379 | ± 6 percentage points |
| Independents | 304 | ± 7 percentage points |
| Republicans | 294 | ± 7 percentage points |