Disparities in Reaching COVID-19 Vaccination Benchmarks: Projected Vaccination Rates by Race/Ethnicity as of July 4
Data Note
Introduction
In the race to vaccinate as many people in the U.S. as possible, several benchmarks have been proposed, including President Biden’s goal of reaching 70% of adults in the U.S. with at least one dose by July 4. Whether or not this is attainable is unknown, as the pace of vaccination has slowed, and progress has varied substantially across states. Moreover, even where the 70% target is reached, whether nationally or in a particular state, achievement of the goal for the overall population may mask differences in vaccination rates across groups, particularly by race/ethnicity. To date, vaccination rates among Black and Hispanic people have lagged behind those of White people, largely due to access and logistical barriers as well as concerns about safety and potential side effects. As such, even if broad national vaccination goals are achieved, these groups may remain at higher risk, which could lead to widening health disparities and limit the nation’s recovery from the pandemic.
To further explore potential disparities in meeting vaccination benchmarks, researchers at Stanford University and KFF (Kaiser Family Foundation) used current state-reported vaccination data by race/ethnicity to project vaccine coverage going forward, by state and nationally. Specifically, using the current pace of vaccination, we projected the share of people ages 12 and older who would receive at least one dose of a COVID-19 vaccine as of July 4 for four racial/ethnic groups (White, Black, Hispanic, and Asian) and assessed when 70% of each group would have received at least one dose. We were not able to include other groups in the analysis due to data limitations.
Our focus on vaccinations among those ages 12 and older differs from President Biden’s goal, which is based on those 18 and older. We use a 70% vaccination rate as an illustrative measure for examining potential disparities across groups that may underlie an overall coverage rate. We focus on those ages 12 and older due to lack of systematic data on vaccinations by race/ethnicity and age. Our projected coverage levels will be lower than those among adults given that younger adolescents have only more recently become eligible for vaccination. Reporting on race and ethnicity is incomplete and inconsistent across states. Previous reporting on racial/ethnic disparities in vaccination through the Centers for Disease Control and Prevention (CDC) and other sources has not adjusted for these data discrepancies, resulting in reported coverage levels that likely underestimate actual population coverage. Although we have adopted a standard set of definitions and rules for reconciling unknown or discrepant data elements to enable transparent and comparable estimation of coverage over time and place, results must be interpreted as approximations in the context of missing and sometimes noisy data.
Findings
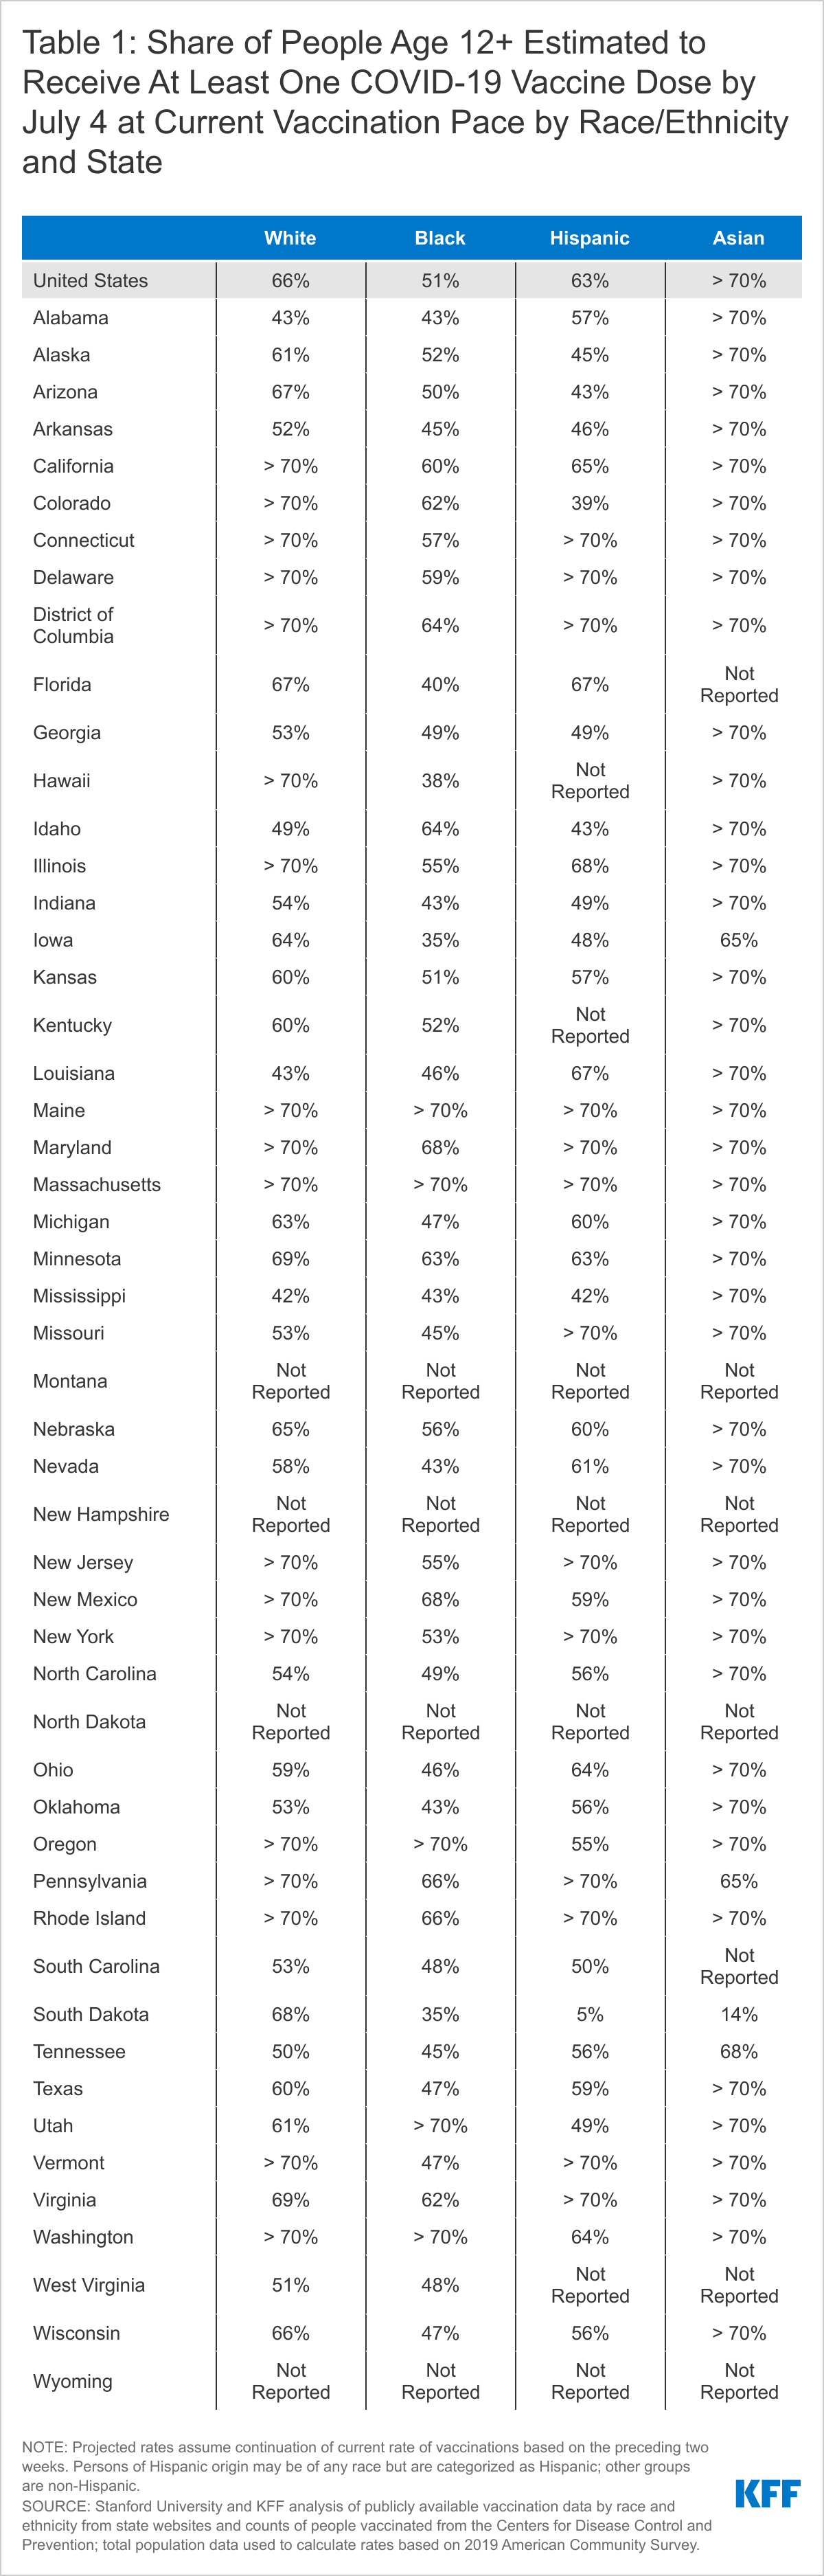
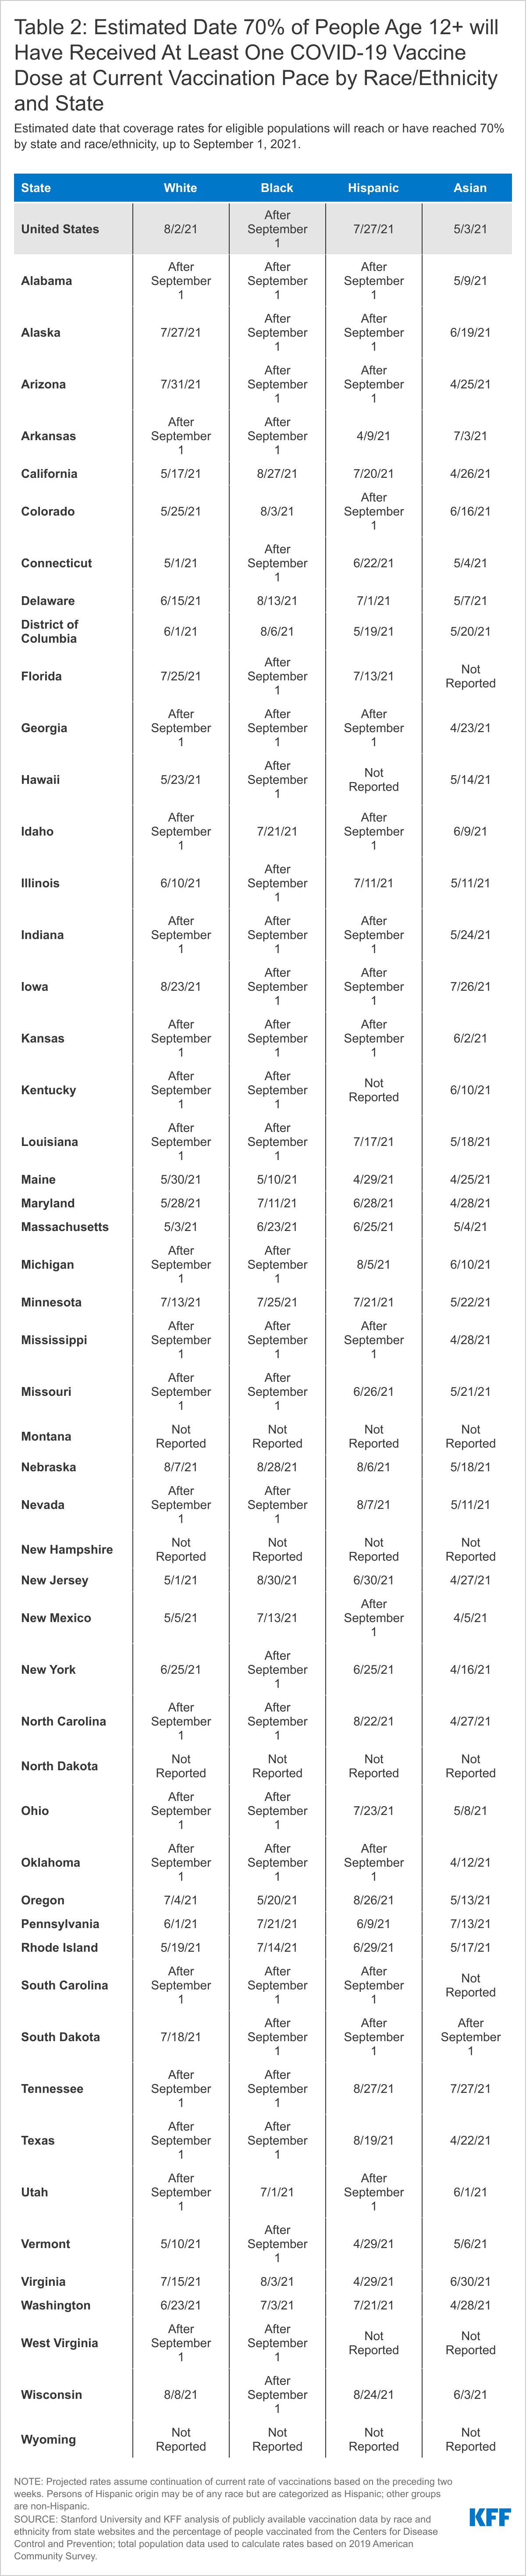
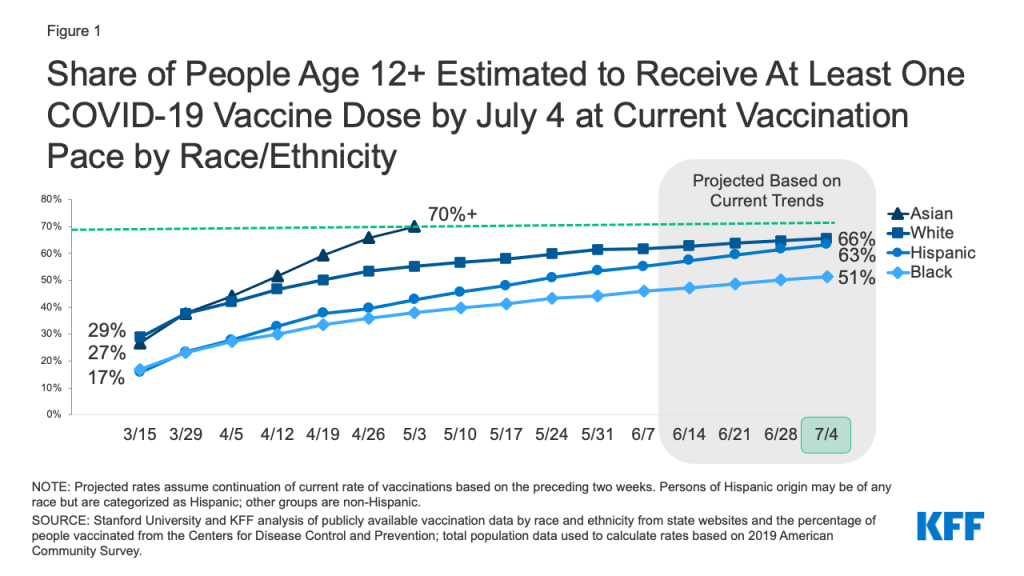
At the current pace of vaccination, 65% of those ages 12 and older would be at least partially vaccinated by July 4, but rates would be lower for Hispanic, and especially Black, people. Asian people are the only group estimated to exceed a 70% vaccination rate, while White people (66%) and Hispanic people (63%) will be shy of reaching this level, and only about half (51%) of Black people will have received at least one COVID-19 vaccine dose by July 4, based on current trends (Figure 1). If the current pace of vaccination continues, Hispanic people nationally would reach a 70% threshold by the end of July (July 27), White people would reach this threshold by early August (August 2), but Black people would still not have reached this coverage level by the beginning of September. Hispanic people are projected to reach 70% coverage faster than White people despite having a lower rate of vaccination as of July 4, because their recent pace of vaccination has been faster than White people.
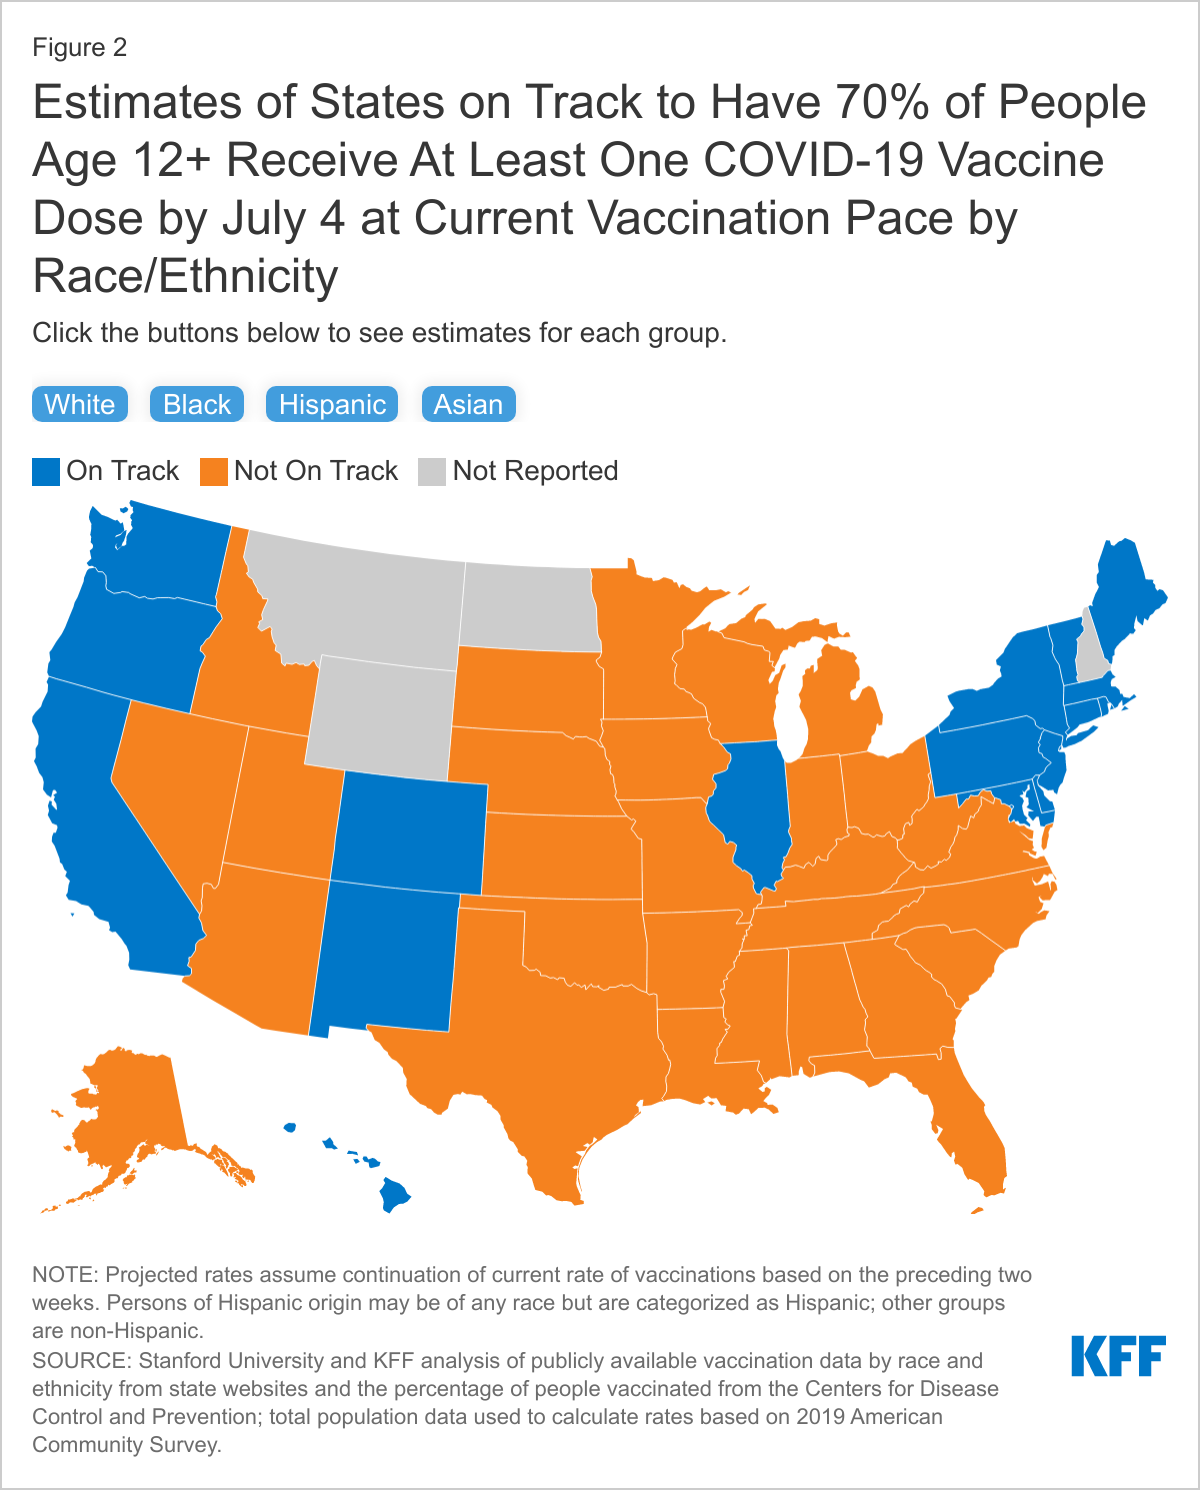
Progress toward achieving a 70% vaccination rate among those ages 12 and older by July 4, and disparities across race/ethnic groups, would also vary significantly across states. At the current vaccination pace, Asian people are on track to reach 70% of those ages 12 and older with at least one COVID-19 vaccine dose in nearly all reporting states (40 of 44), and White people are on track in just over a third of reporting states (18 of 47). Hispanic people are projected to reach this threshold in 13 of 44 reporting states, while Black people are estimated to reach this coverage level in only 5 of 47 reporting states (Figure 2, Tables 1 and 2).
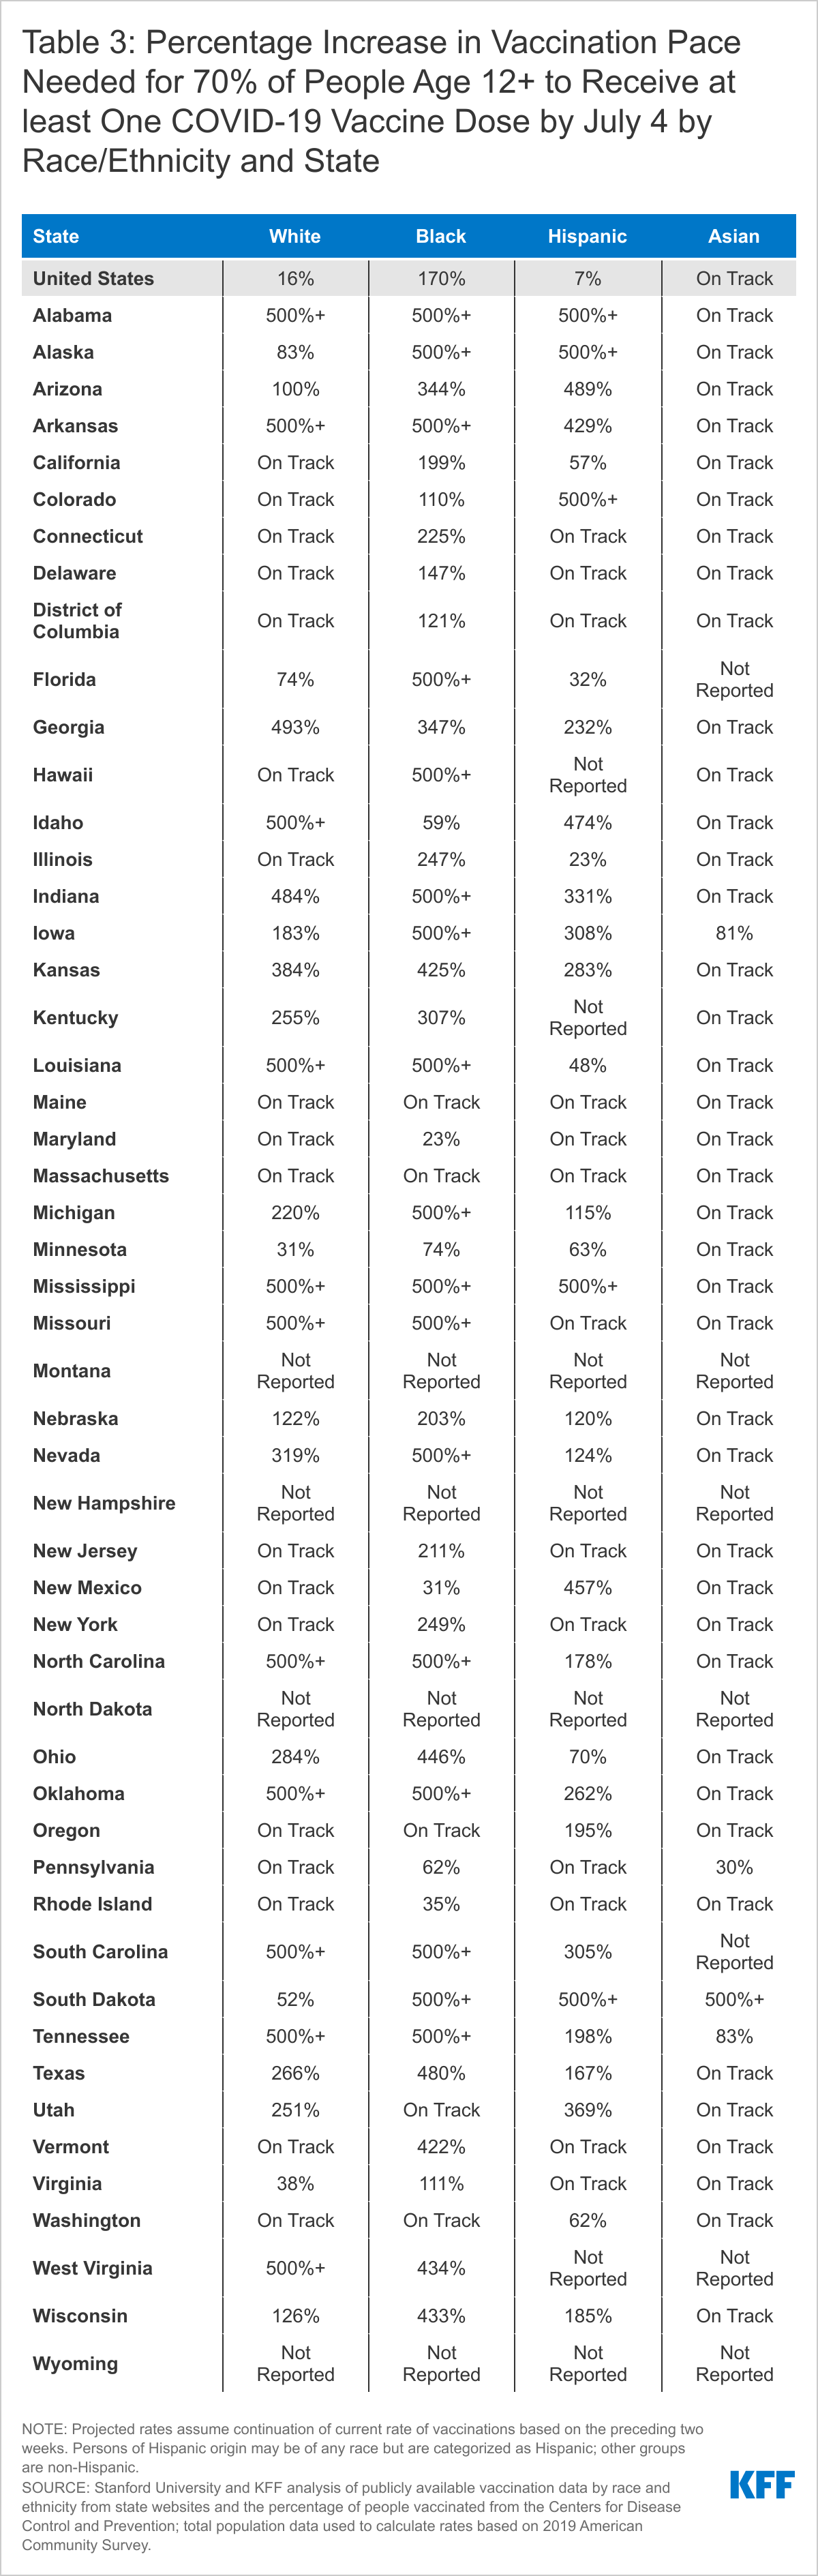
To reach a 70% vaccination rate by July 4, the pace of vaccination would need to increase substantially in many states, particularly for Black people. Nationally, the daily pace of new vaccinations would need to be 7% faster than the current pace to achieve 70% vaccination coverage among Hispanic people ages 12 and older by July 4, while the pace for Black people would need to be over two and a half times faster than the current pace. The increases in vaccination rates needed to reach this coverage level also vary across states. The pace would need to at least double in 24 of 44 states reporting data for Hispanic people, 24 of 47 states reporting data for White people, and 36 of 47 states reporting data for Black people (Table 3).
If the pace of new vaccinations continues to slow even further, disparities between groups in achieving progress toward coverage goals would persist. For example, a slowdown of 25% would mean that, overall, the share of those ages 12 and older estimated to have received at least one COVID-19 vaccine dose would drop from 65% to 64%. Asian people would still reach a 70% coverage rate, coverage among White people would remain below this threshold, with 65% receiving at least one dose, and there would be larger gaps for Hispanic and Black people, with 61% and 50% receiving at least one dose by July 4, respectively. These patterns play out at the state level as well.
Implications
It remains to be seen whether President Biden’s goal of at least 70% of adults receiving at least one COVID-19 vaccine dose by July 4 will be achieved, particularly given the slowdown in vaccinations. Regardless of when this goal is achieved, it is important to recognize that this national benchmark may mask underlying disparities. This illustrative analysis, which examines potential disparities toward achieving a 70% coverage rate among people ages 12 and older, shows that Black and Hispanic people will likely be left behind even if and when national goals are achieved, with substantial variation across the country. As such, even if the nation, overall, reaches a broad level of protection through vaccination, certain groups and communities will remain at increased risk for COVID-19. These disparities in vaccination may lead to further widening of the disproportionate impacts of COVID-19 on people of color and health disparities more broadly. These findings underscore the importance of continuing to prioritize vaccine equity and focused efforts to deliver vaccinations to underserved people and areas, as well as the importance of maintaining these efforts even after broader national goals are achieved.
Marissa Reitsma, Jeremy Goldhaber-Fiebert, Neesha Joseph, and Joshua Salomon are with Stanford University. Samantha Artiga, Jennifer Kates, Larry Levitt, and Anna Rouw are with KFF.
Methodology
Stanford University and KFF (Kaiser Family Foundation) researchers used current state-reported vaccination data by race/ethnicity to project vaccine coverage, by state and nationally, among people ages 12 and older for four racial/ethnic groups (White, Black, Hispanic, and Asian). Specifically, we used data on distribution of vaccines administered by race/ethnicity extracted from state reporting dashboards by KFF, total numbers of people who have received at least one dose from the Centers for Disease Control and Prevention, and total population data from the 2019 American Community Survey to estimate the share of people ages 12 years and older receiving one or more COVID-19 vaccination doses, by state and race/ethnicity, through June 7. We then estimated coverage rates through September 1 based on the average daily vaccination rate implied by the change in coverage between May 24 and June 7 for each racial/ethnic group, by state.
Data on vaccination coverage by race/ethnicity vary by state in terms of reporting groups and completeness. We applied the following data processing steps to produce comparable estimates. We assumed vaccinations reported as “unknown” race/ethnicity were distributed proportional to shares of vaccinations with known race/ethnicity in each state. Examining vaccinations reported as “other” race/ethnicity, we found that in most states, the shares attributed to “other” greatly exceeded population shares (implying coverage >100%). We therefore adjusted shares by assuming “other” were vaccinated proportional to eligible population, and proportionally redistributed remaining vaccinations among specified racial/ethnic groups. We adjusted shares to avoid double-counting in states that report shares by race separate from shares by ethnicity. For racial/ethnic groups not reported by specific states, we assumed these groups were vaccinated proportional to population size and scaled down shares of vaccines to reported groups accordingly. We capped coverage among any racial/ethnic group at 100% of the eligible population, and in cases where implied coverage exceeded 100%, we proportionally redistributed the excess across other groups.
A handful of states required exceptions to the standard approach. The share of vaccinations by race/ethnicity from Nebraska was unavailable on June 7. As a result, projections for Nebraska were based on race/ethnicity-specific vaccination rates spanning May 10 to May 24. The share of vaccinations by race/ethnicity from Idaho and Tennessee were unavailable from May 24. As a result, projections for these states were based on the three-week period spanning May 17 to June 7. CDC reported coverage in New Hampshire decreased slightly between May 24 and June 7, likely due to reconciling reporting issues. As a result, projections for New Hampshire were also based on the three-week period spanning May 17 to June 7. The share of vaccinations by race/ethnicity for Pennsylvania reported in the state dashboard do not include vaccinations for Philadelphia County. Since Philadelphia County includes a substantial fraction of the Black, Hispanic, and Asian population living in Pennsylvania, we separately extracted and included data from the Philadelphia County dashboard.
Limitations of this analysis include reliance on several assumptions to address incomplete and heterogeneous reporting of vaccination data by race/ethnicity across states. Previous reporting on racial/ethnic disparities in vaccination through the CDC and other sources has not adjusted for these data discrepancies, resulting in reported coverage levels that likely underestimate actual population coverage. Although we have adopted a standard set of definitions and rules for reconciling unknown or discrepant data elements to enable transparent and comparable estimation of coverage over time and place, results must be interpreted as approximations in the context of missing and sometimes noisy data. Future work should continue to update these estimates and further assess uncertainty due to model assumptions.
Replication code and data are available at: https://github.com/PPML/covid_vaccination_coverage_disparities
Tables