Examining LGBTQ+ Adults’ Experiences with Health Care Costs and Access
Findings
Key Takeaways
- LGBTQ+ adults face significantly greater challenges accessing and affording health care compared to their non-LGBTQ+ peers. They are more likely to postpone or skip needed care (58% vs. 38%), forgo prescription medications due to cost (22% vs. 12%), and struggle to pay medical bills (30% vs. 21%).
- Cost-related barriers to care are especially pronounced among certain segments of the LGBTQ+ population, most notably trans adults, younger LGBTQ+ adults, those with lower incomes, and those without health coverage. Eight in ten (82%) trans adults, three-quarters (77%) of LGBTQ+ adults without health coverage, and two-thirds (68%) of those under age 30 report not getting needed health care in the past 12 months either because they couldn’t get an appointment, couldn’t afford the cost, or for another reason. Additionally, larger shares of LGBQ+ women than men report skipping or delaying care in the past year (63% vs. 46%).
- While trans adults represent a small share of the total LGBTQ+ population, they experience outsized barriers to affording care and other access issues. Compared with other LGBQ+ groups, trans adults report the highest rates of difficulty finding providers with available appointments (53%), not taking prescription medications because of cost (39%), worsening health from postponed care (45%), struggling with medical bills (42%), and experiencing insurance delays or denials (61%). Trans adults experience these greater barriers to health cost and access even when controlling for other demographic variables such as age, income, and insurance status.
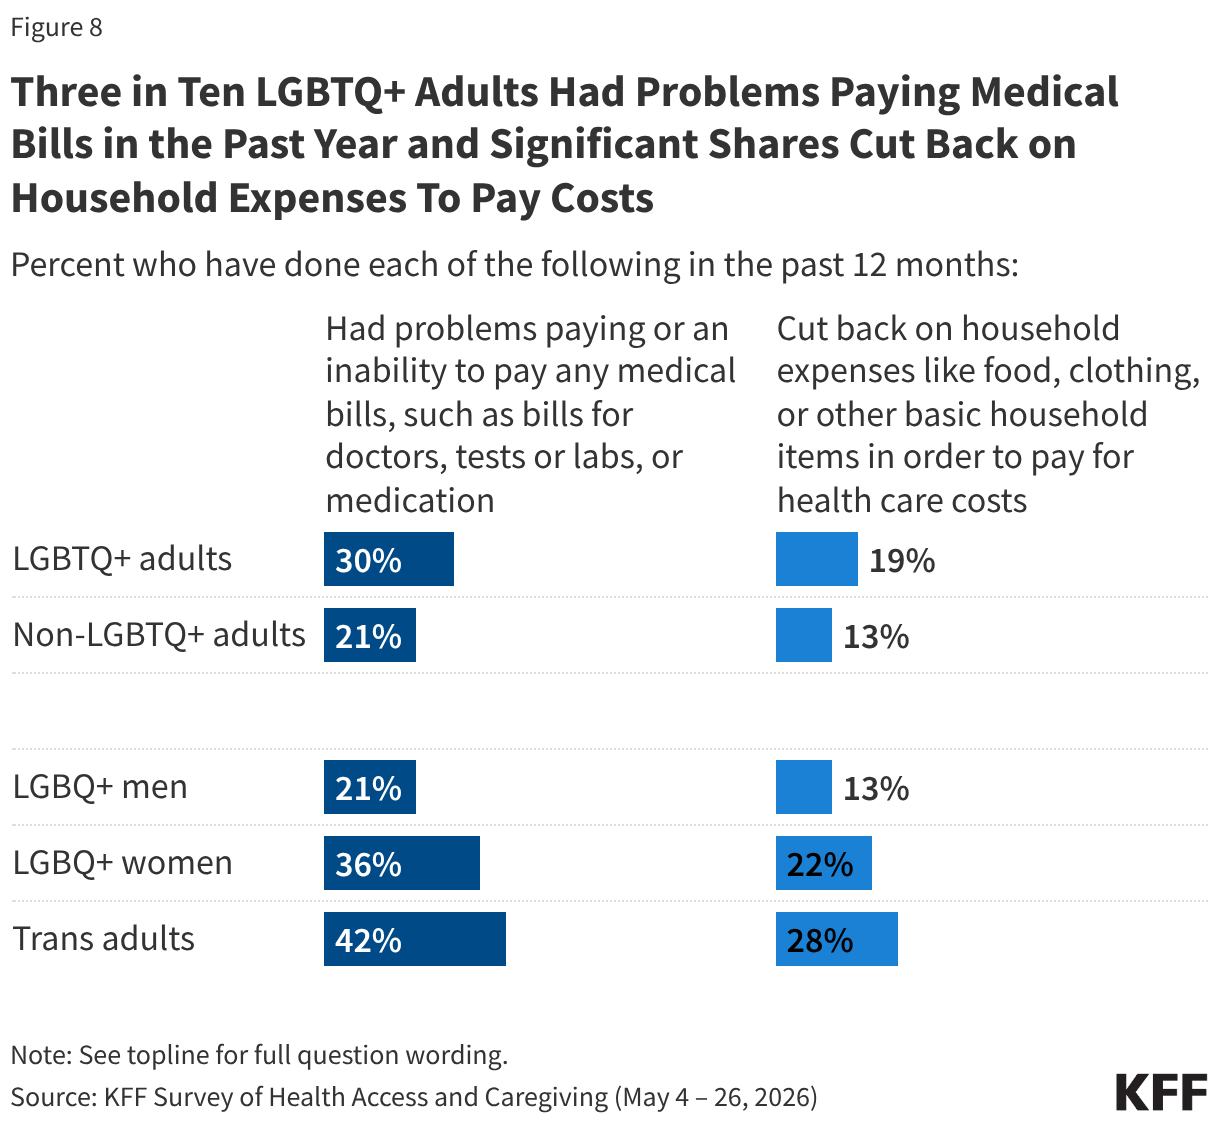
- Health care costs create significant financial strain for many LGBTQ+ adults. Three in ten (30%) report problems paying medical bills in the past year, and one in five (19%) say they cut back on household necessities such as food or clothing to pay for health care costs. Financial burdens are particularly common among younger adults, those with lower incomes, and those without health coverage.
- Having health insurance does not guarantee timely access to care. About three in ten LGBTQ+ insured adults report that their insurance delayed or denied coverage for recommended care in the past two years, a more widespread experience than among non-LGBTQ+ insured adults, with particularly high rates among trans adults and those covered by Medicaid or those with ACA marketplace coverage.
Understanding the Challenges LGBTQ+ Adults Face Affording Health Care
LGBTQ+ adults in the U.S. are a growing population who have historically faced health disparities in terms of both wellbeing and health care access and affordability. Previous research has found that LGBTQ+ adults are more likely than their non-LGBTQ+ peers to experience barriers to obtaining needed care, to struggle to afford health care costs, and to delay or forgo care because of cost. These affordability challenges often intersect with and may even be a driver of broader health disparities, including poorer mental and physical health outcomes, particularly among trans adults.
Understanding the financial challenges LGBTQ+ adults face when accessing health care can help identify persistent gaps in affordability and inform efforts to improve access to needed care and coverage.
LGBTQ+ definition and demographics
The LGBTQ+ sample included in this analysis is comprised of 2,640 adults, including 52% who identify as bisexual, 21% as gay men, 9% as lesbian women, 9% as transgender, and 9% who use some other term to identify themselves. The analysis is broken out by transgender (trans) adults (9%), lesbian, gay, bisexual or other queer identifying men (39%), and lesbian, gay, bisexual, or other queer identifying women (50%).
The LGBTQ+ community is not a monolith and beyond differences related to sexual orientation and gender identity, health care experiences can vary widely depending on age, income, and insurance status, among other factors. This analysis also examines differences by these factors. For example, regardless of LGBTQ+ identity, women tend to have more interactions with the health care system than men and therefore, may have more cost or access issues. In addition, trans adults are more likely than other groups to face barriers in health care, including discrimination and lack of providers trained to handle the health needs of trans adults. Subgroups of the LGBTQ+ population, including trans adults or older adults usually make up too small a share of national survey samples to allow for statistically reliable analysis. The large sample size of this survey provides a unique opportunity to examine these differences.
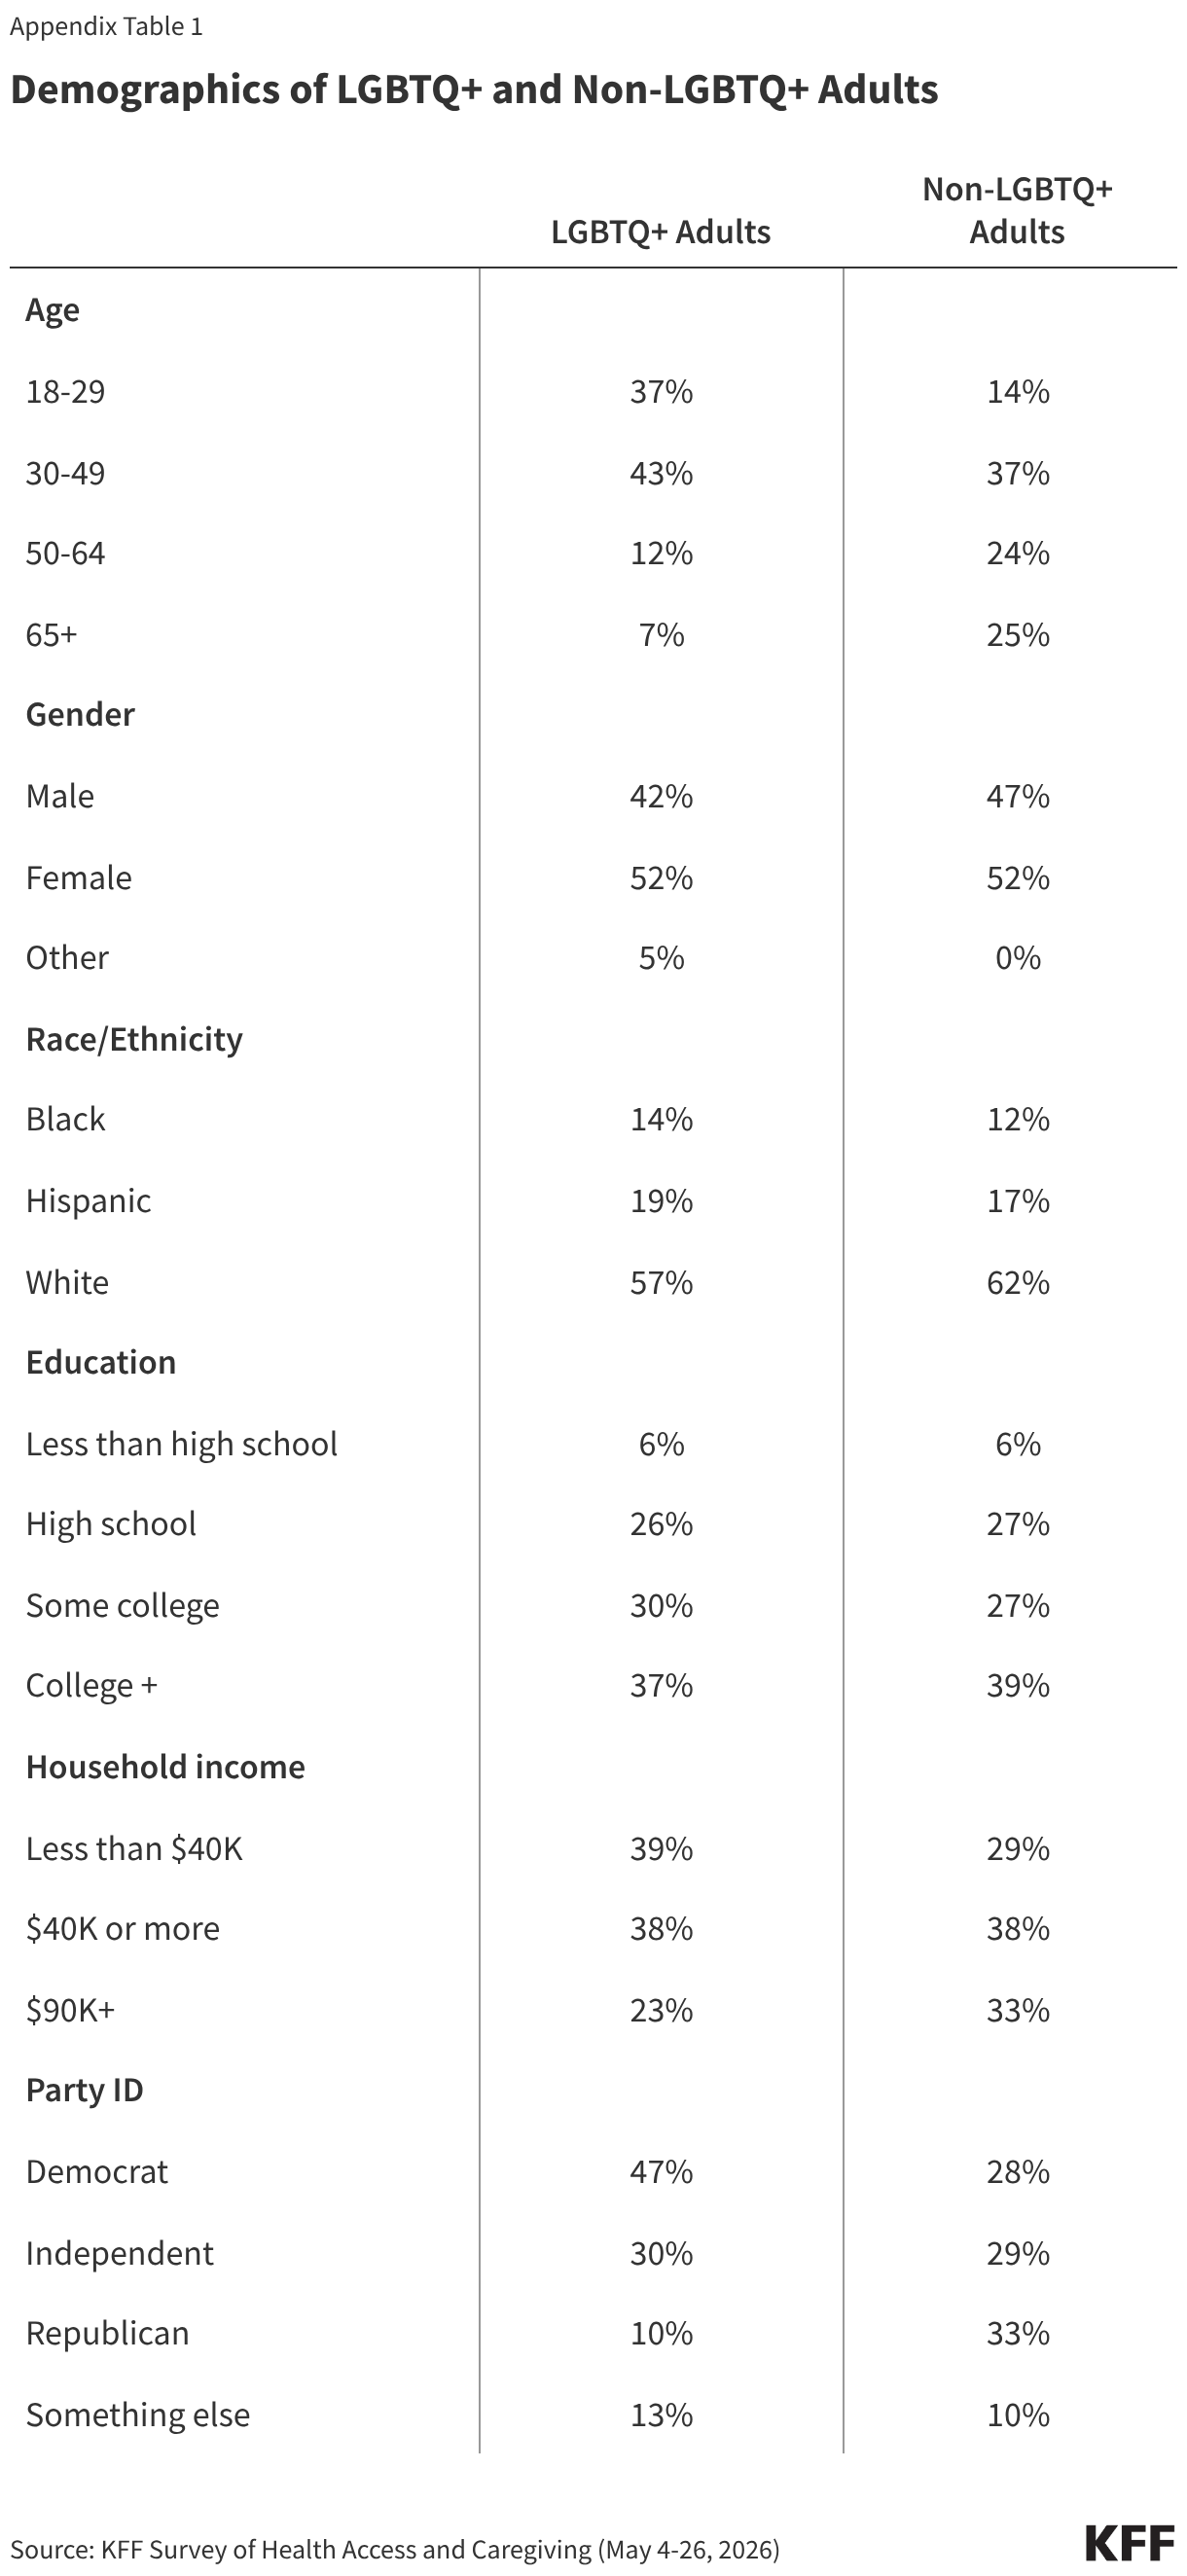
This report also compares the experiences of LGBTQ+ adults with their non-LGBTQ+ counterparts. A caveat to these comparisons is that there are key demographic differences between LGBTQ+ and non-LGBTQ+ adults that may contribute to differences in measures of health care cost and access between these populations. LGBTQ+ people are generally younger than the U.S. population overall, have lower incomes, and are somewhat more likely to be uninsured. Therefore, some findings might be more reflective of income or coverage differences, for example, than LGBTQ+ identity, though those factors are certainly intertwined. See appendix for a more detailed analysis of the demographic characteristics of the LGBTQ+ community.
Delays in Health Care for LGBTQ+ Adults
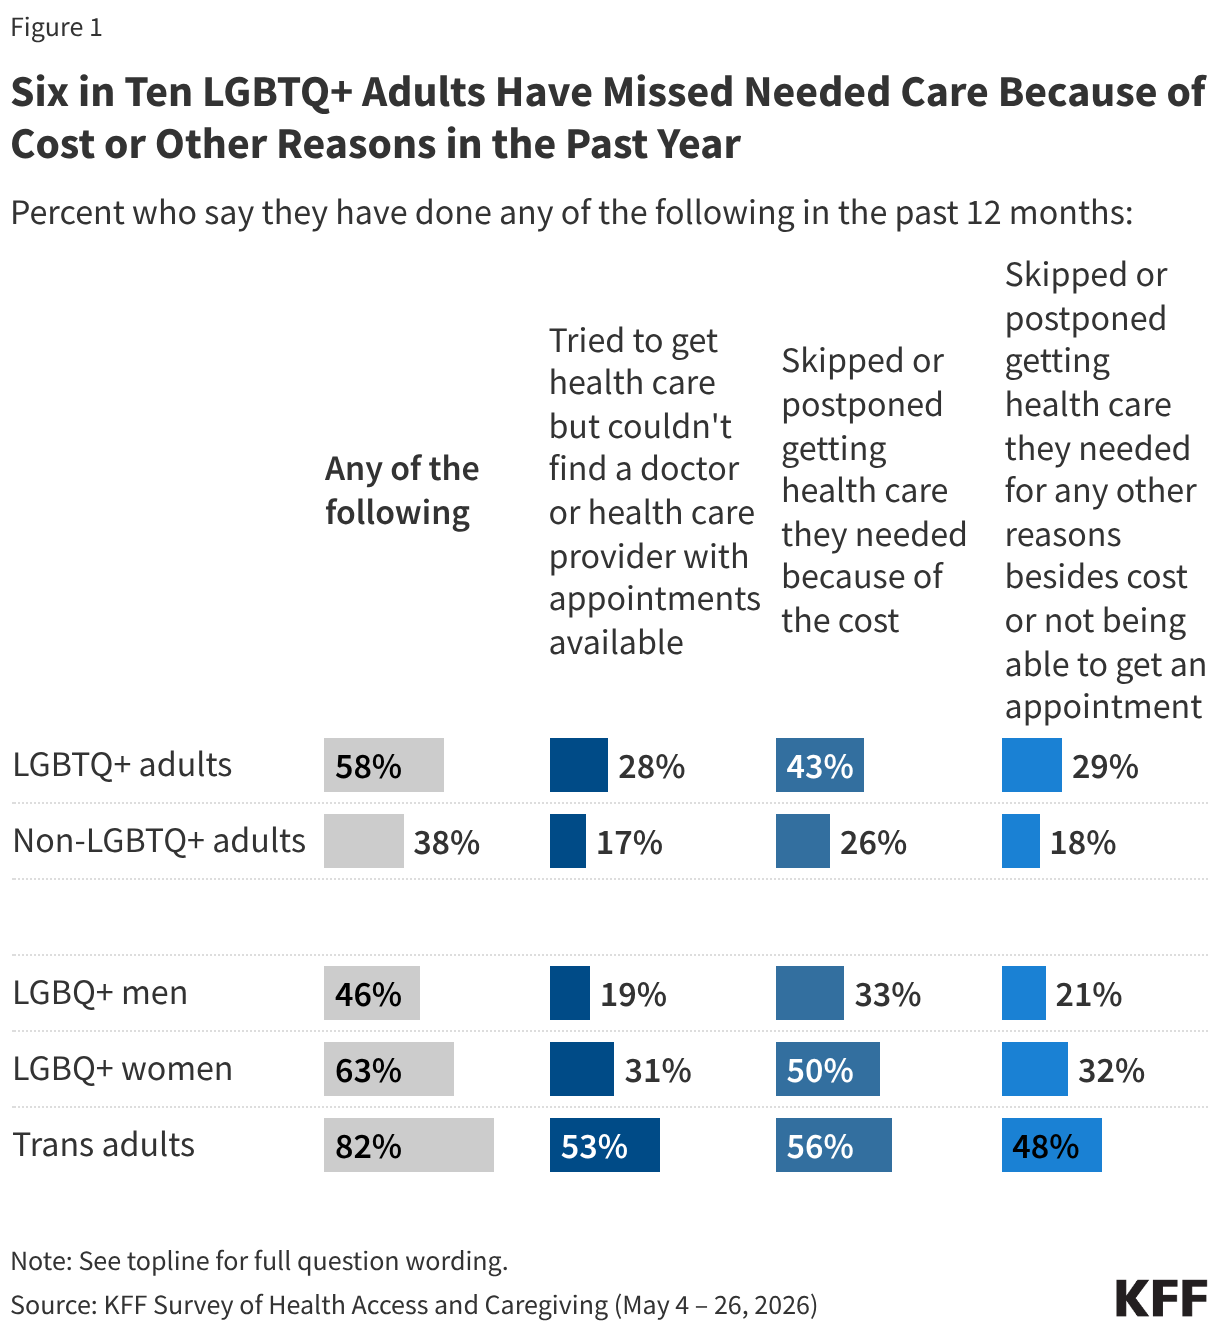
Six in ten LGBTQ+ adults (58%) say they have skipped or postponed needed health care in the past year, greater shares than their non-LGBTQ+ counterparts (38%). This includes more than four in ten (43%) LGBTQ+ adults who say they’ve skipped or delayed getting needed care because of the cost and about three in ten who said it was due to their inability to get an appointment (28%) or for some other reason (29%). LGBTQ+ adults are nearly twice as likely as non-LGBTQ+ adults (26%) to say they’ve skipped or delayed getting needed care because of the costs.
Compared to other LGBQ+ adults, trans adults are more likely to report they have put off care in the past year because of cost or other issues (82%). At least half of trans adults say they skipped or postponed getting needed health care because of the cost (56%), because they couldn’t find a doctor or health care provider with appointments available (53%), or they skipped or postponed for any other reasons (48%). There may be many reasons why trans adults are more likely to skip or delay care, but a recent KFF/Washington Post Trans Survey found significant barriers for trans adults in getting needed health care, including providers not being properly educated to provide appropriate care.
Beyond trans adults, larger shares of LGBQ+ women than men report skipping or postponing care in the past year (63% vs. 46%). This includes half of LGBQ+ women who say they skipped or postponed needed care because of the cost (compared to a third of LGBQ+ men), and roughly a third of LGBQ+ women who say they skipped or postponed care because they couldn’t get an appointment (31% vs. 19% of LGBQ+ men) or for any reason besides cost or not being able to get an appointment (32% vs. 21% of LGBQ+ men). Across all LGBTQ+ groups, non-LGBTQ+ adults less commonly reported skipping or postponing care.
Many socioeconomic and demographic factors can predict delaying or skipping care, but LGBTQ+ adults are more likely to skip or delay care even when controlling for race and ethnicity, insurance coverage, age, income, and education, suggesting this population group may have unique struggles in accessing needed health care. The differences reported in this analysis between LGBTQ+ adults and non-LGBTQ+ adults hold even when controlling for these demographic characteristics.
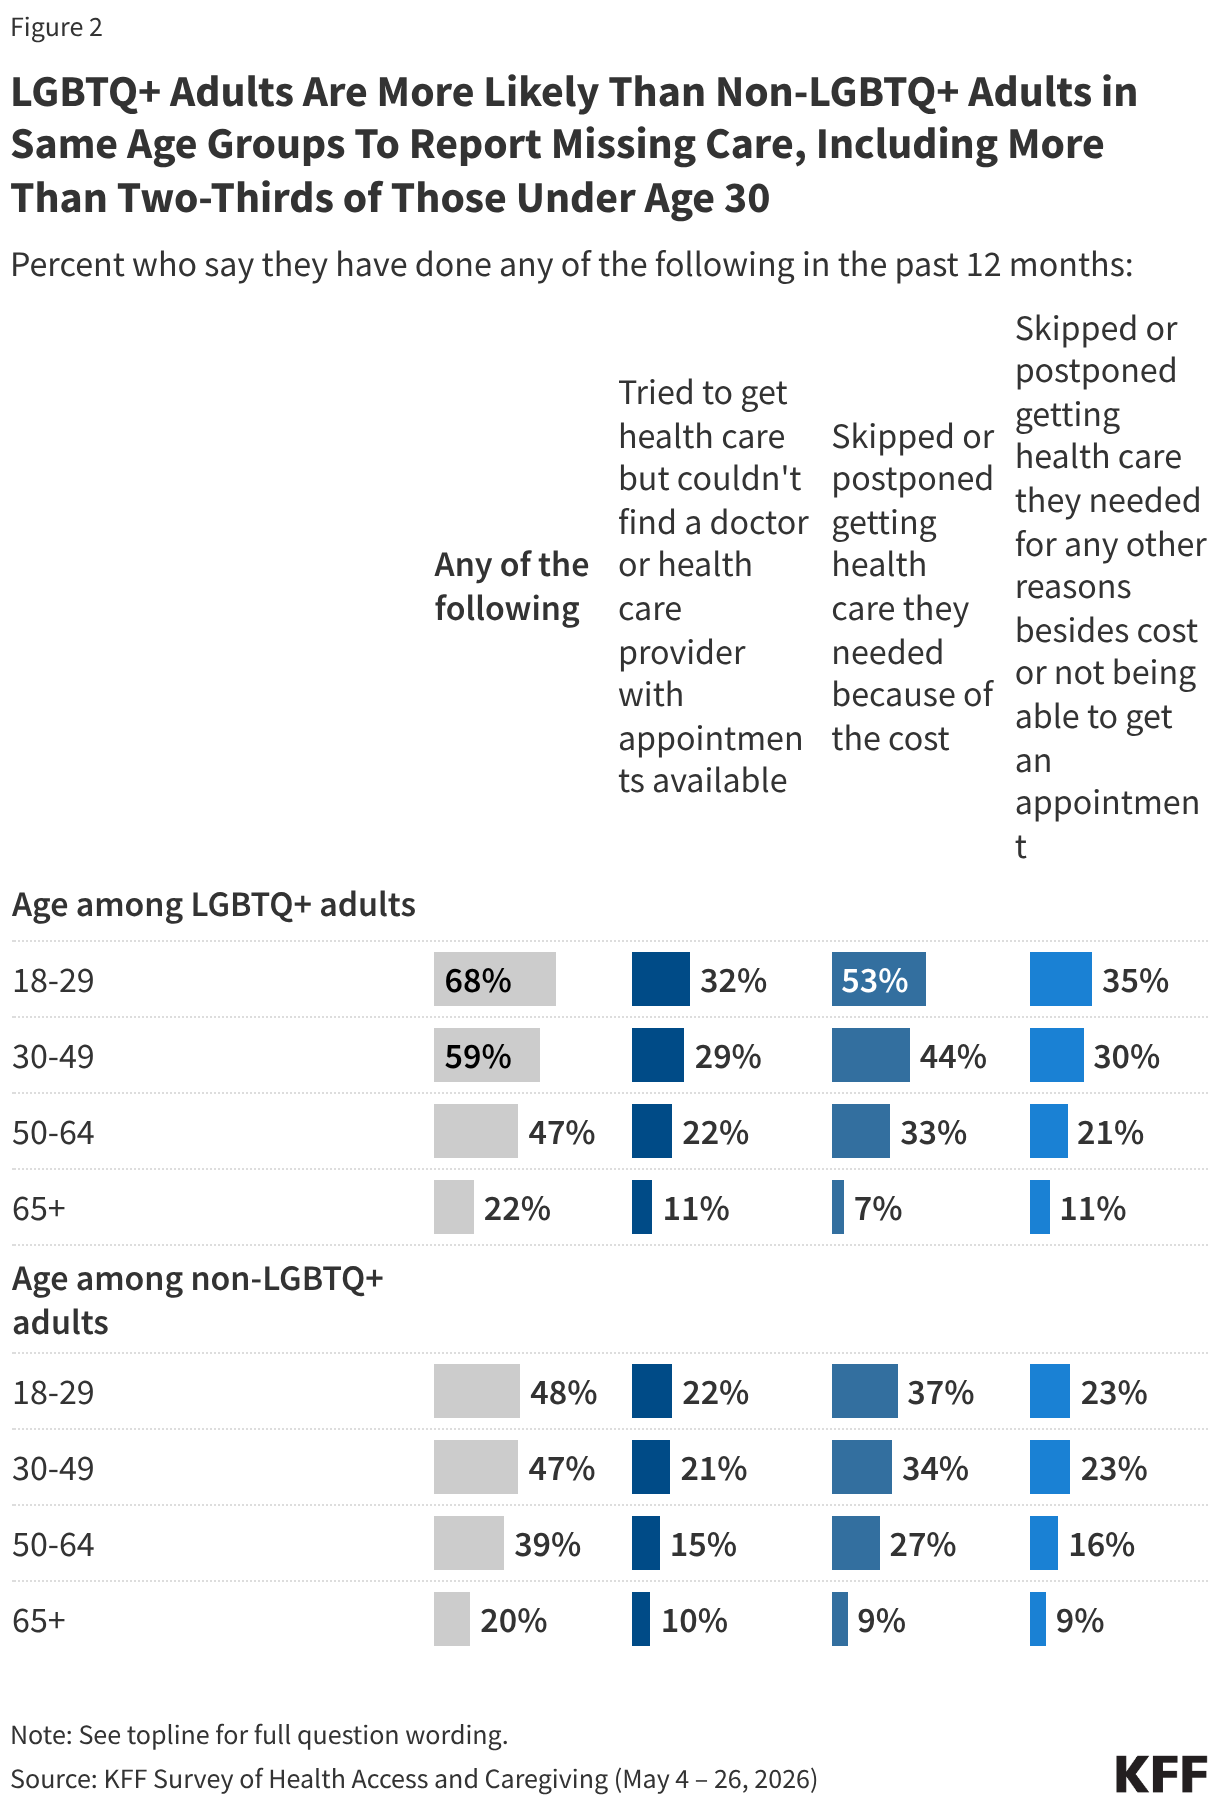
Among all LGBTQ+ adults, two-thirds (68%) of those under age 30 report having put off needed care in the past year, higher than the shares of older LGBTQ+ adults who report this. While age is a significant predictor of putting off care regardless of sexual identity, LGBTQ+ adults under age 30 are twenty percentage points more likely to report putting off care than non-LGBTQ+ adults in the same age range (48%). In fact, across most age groups, LGBTQ+ adults are more likely to report putting off or postponing needed care than their non-LGBTQ+ counterparts, except for those 65 and older. The difference between LGBTQ+ and non-LGBTQ+ adults levels out among those age 65 and older, which may be due to several factors, such as increased medical care among older adults and Medicare eligibility.
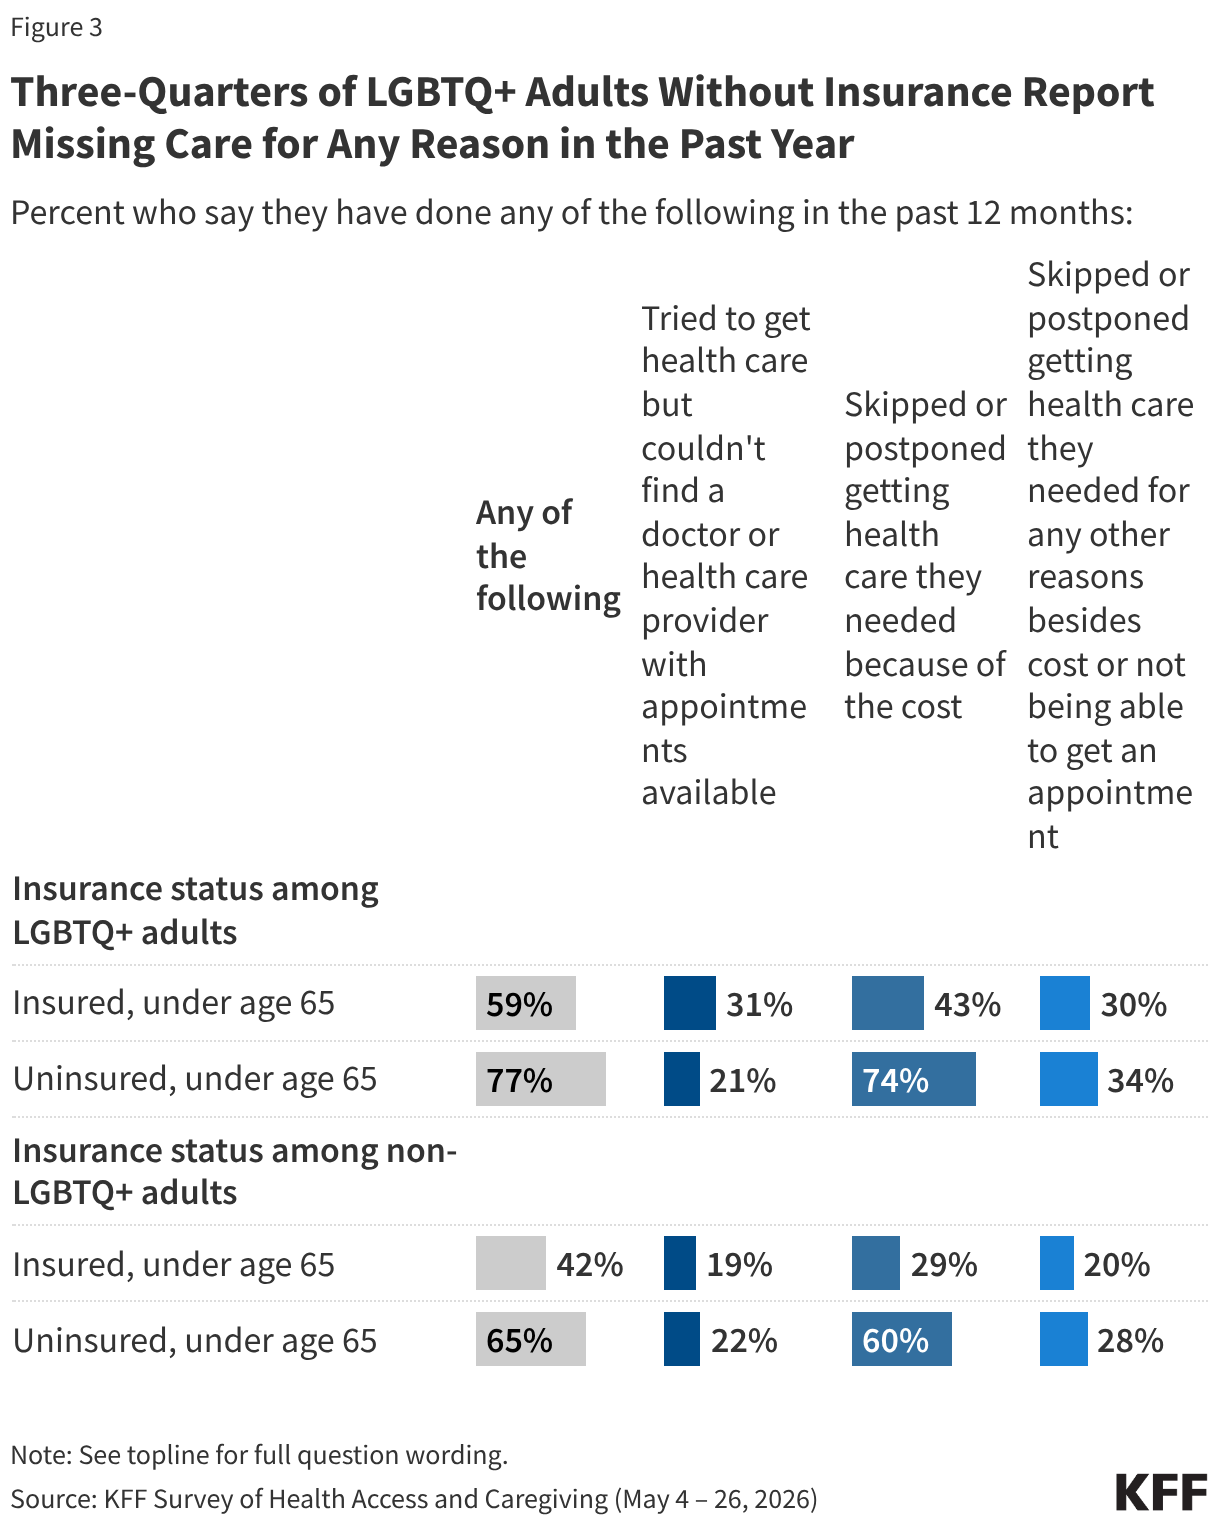
Insurance and income also play a role in accessing care. Three in four (77%) LGBTQ+ adults without health insurance report having missed or delayed care in the past year for any reason, compared to six in ten LGBTQ+ adults with health insurance. Fewer non-LGBTQ+ adults than LGBTQ+ adults without health insurance report experiencing any of the following in the past year (65% vs. 77% of uninsured LGBTQ+ adults).
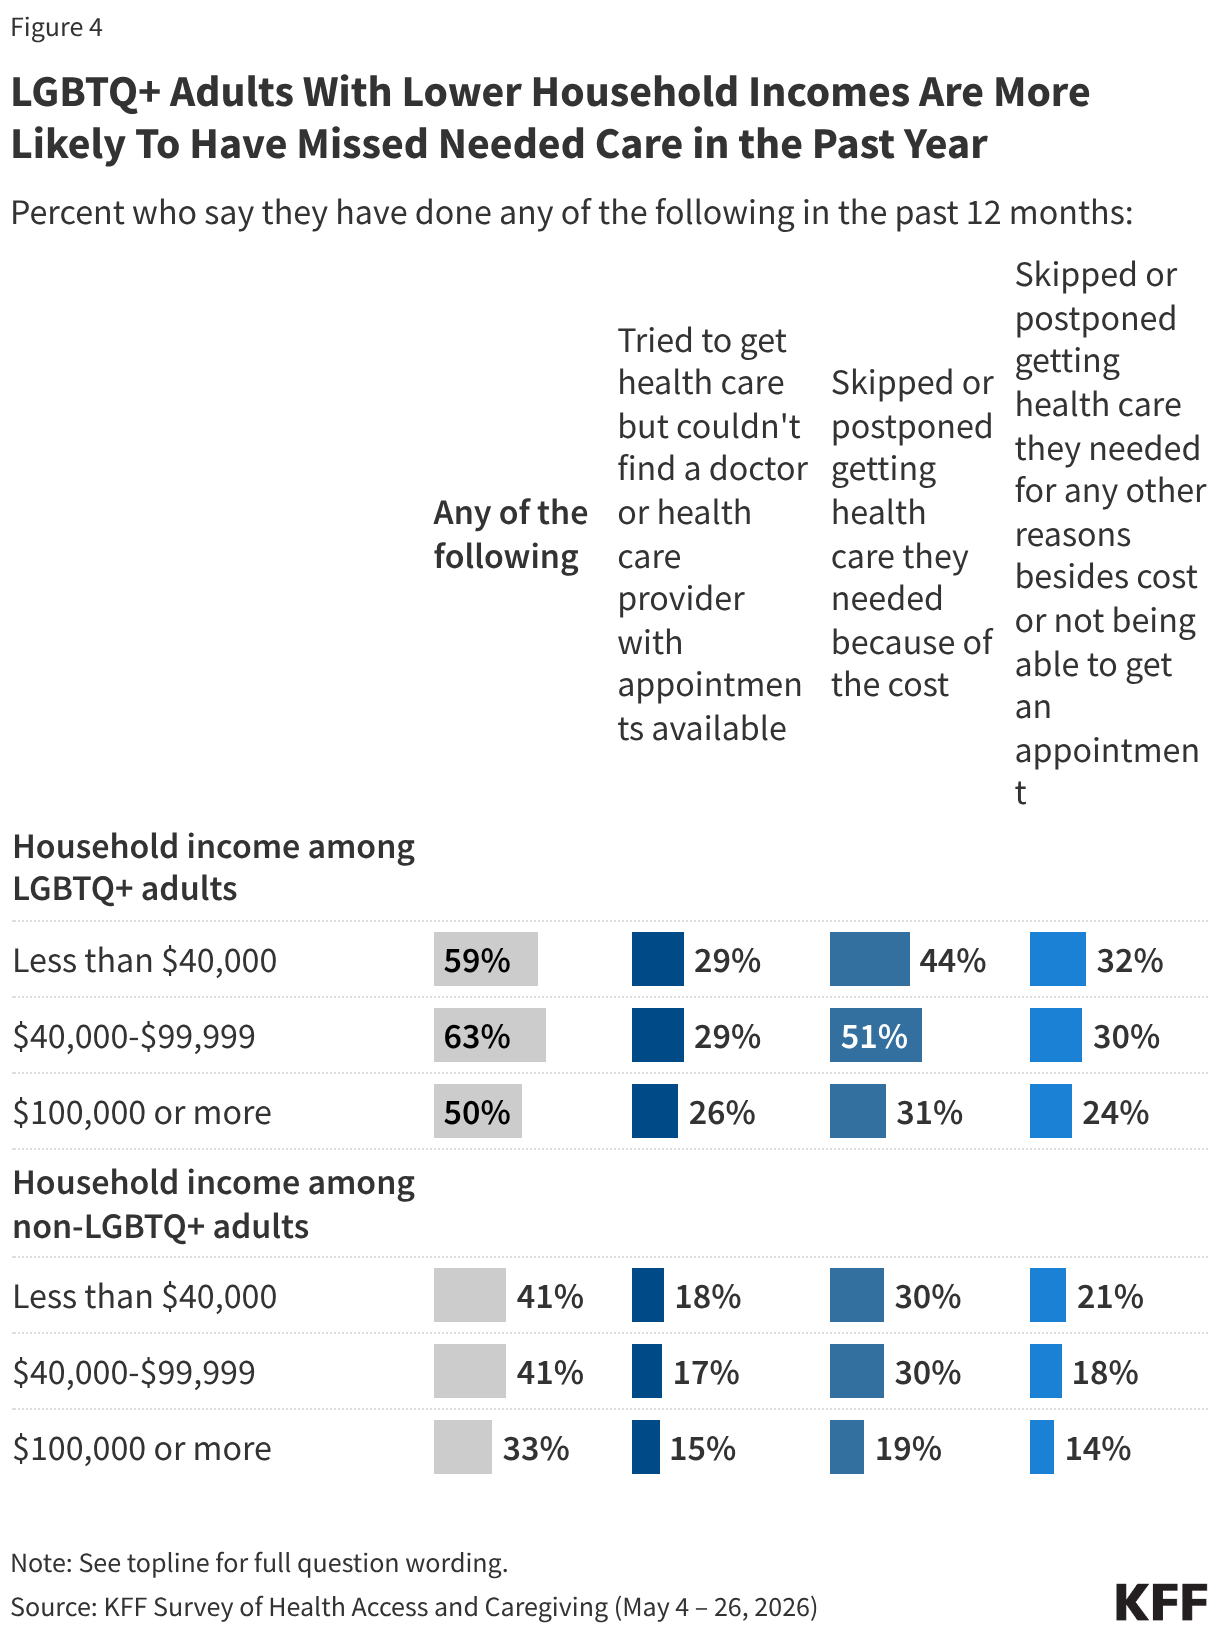
Similarly, about six in ten LGBTQ+ adults with household incomes under $40,000 a year (59%) or between $40,000 and $99,999 a year (63%) say they skipped or postponed needed care, compared to half of those with annual incomes of $100,000 or more. Even among the highest income groups or those with health insurance, LGBTQ+ adults are more likely than non-LGBTQ+ adults to say they skipped or delayed needed care in the past year.
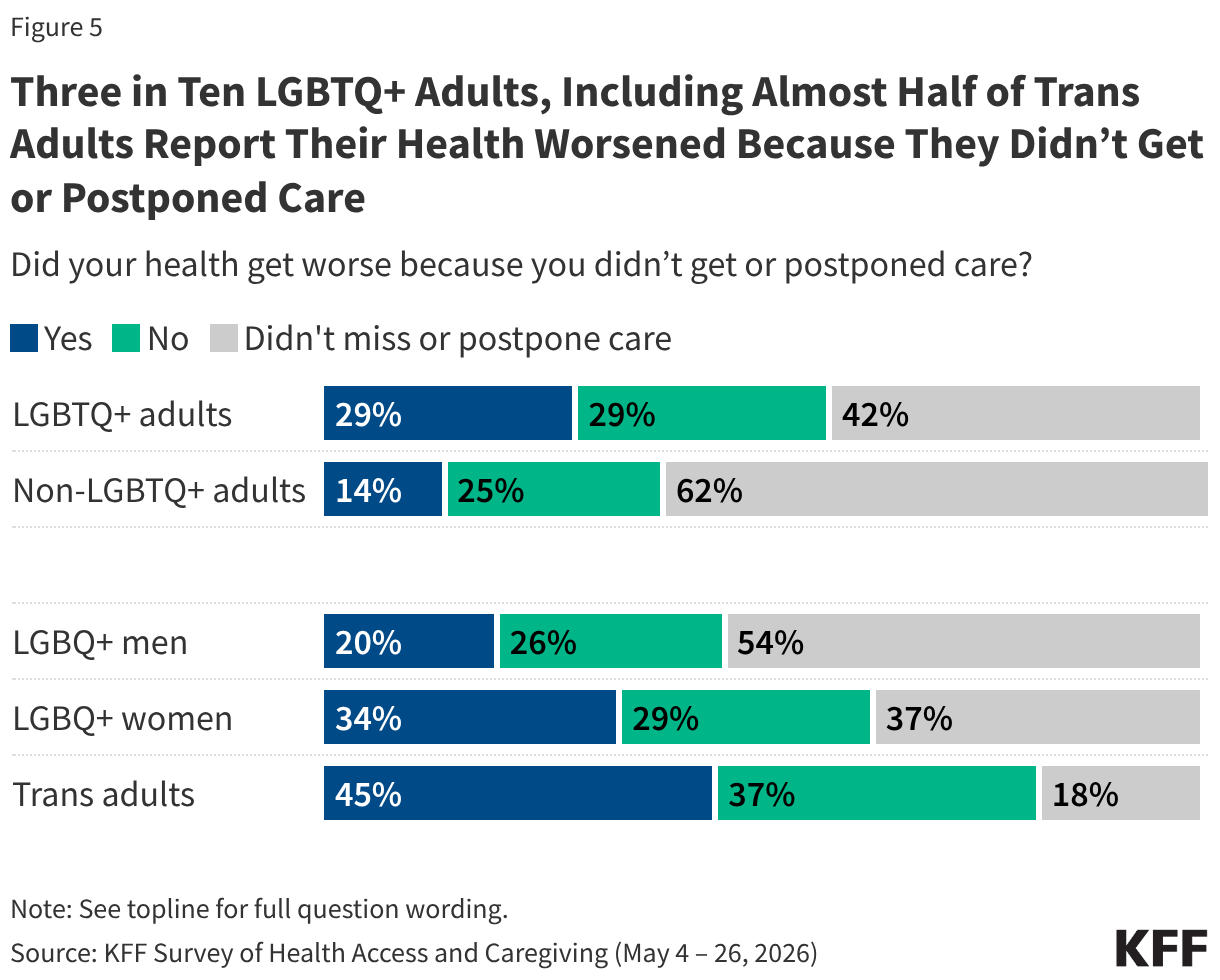
Substantial shares of LGBTQ+ adults report postponing their care worsened their health, and that number is especially pronounced among trans adults. Three in ten (29%) LGBTQ+ adults say their health got worse because they skipped or delayed care, which is about twice the share of non-LGBTQ+ adults who report the same (14%). This experience is more common among LGBQ+ women (34%) than LGBQ+ men (20%). Almost half (45%) of trans adults say they delayed or skipped care and their health got worse as a result.
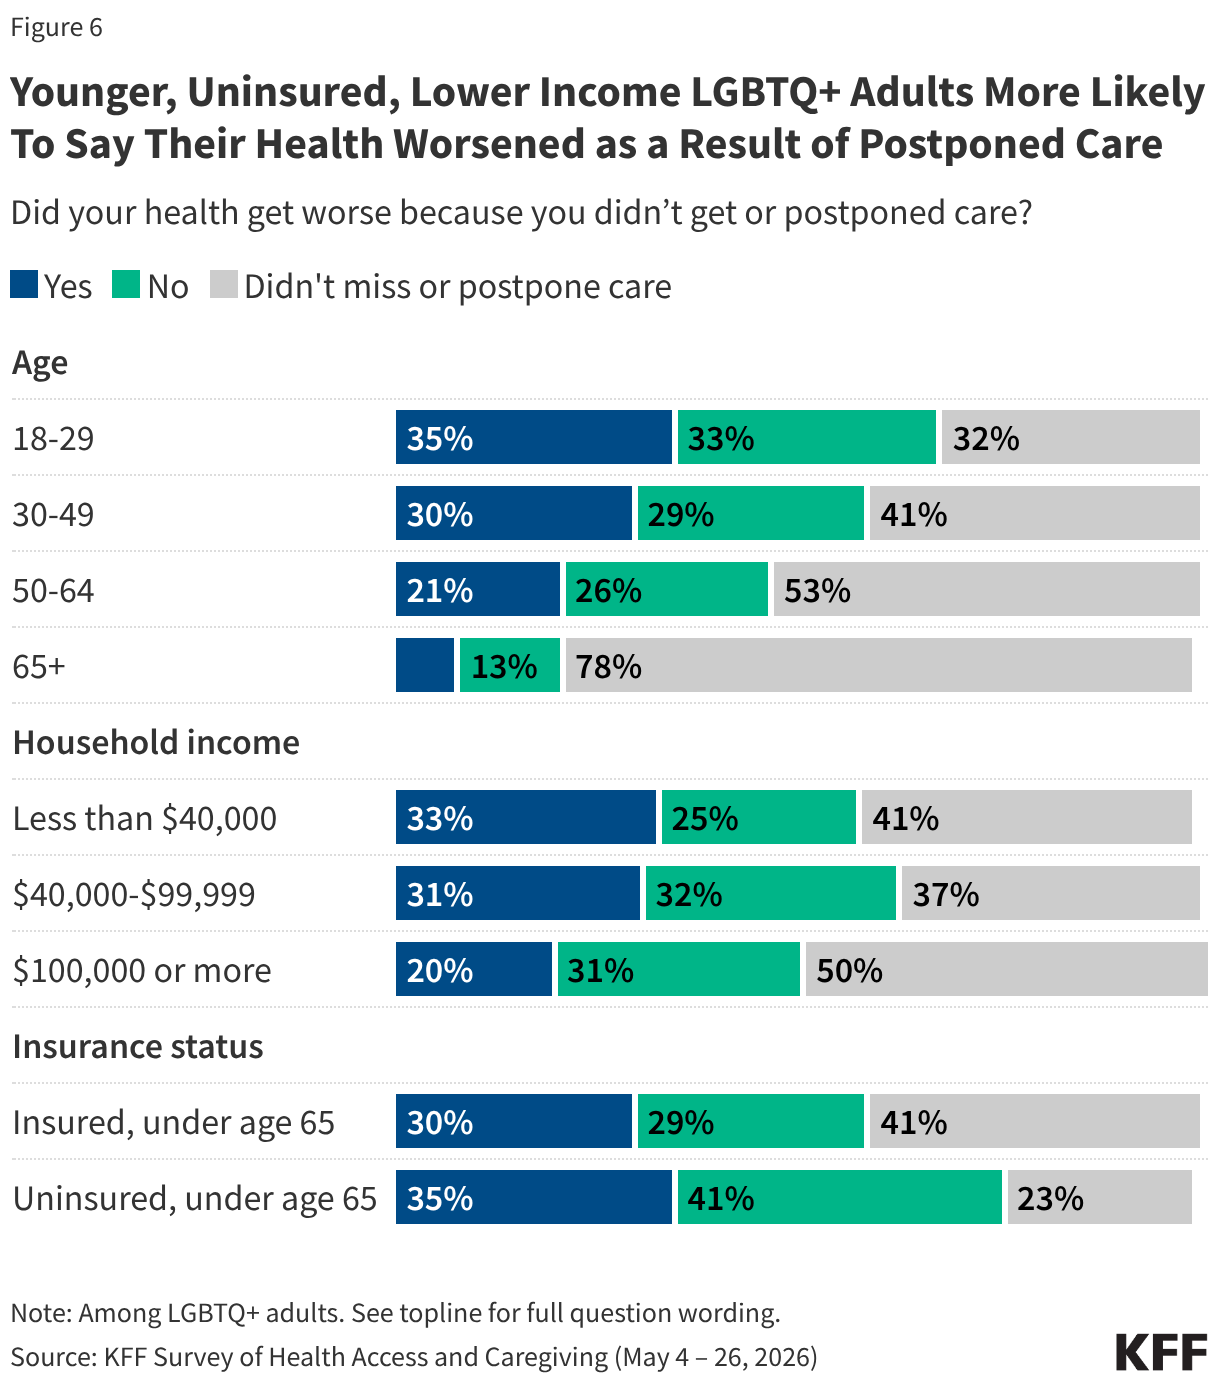
The share who say their health got worse due to postponing care also rises to roughly a third of uninsured LGBTQ+ adults (35%) and those under age 30 (35%). One-third (33%) of LGBTQ+ adults with household incomes of less than $40,000 report that their health got worse because of postponed care.
Impacts of Cost on Prescription Medications
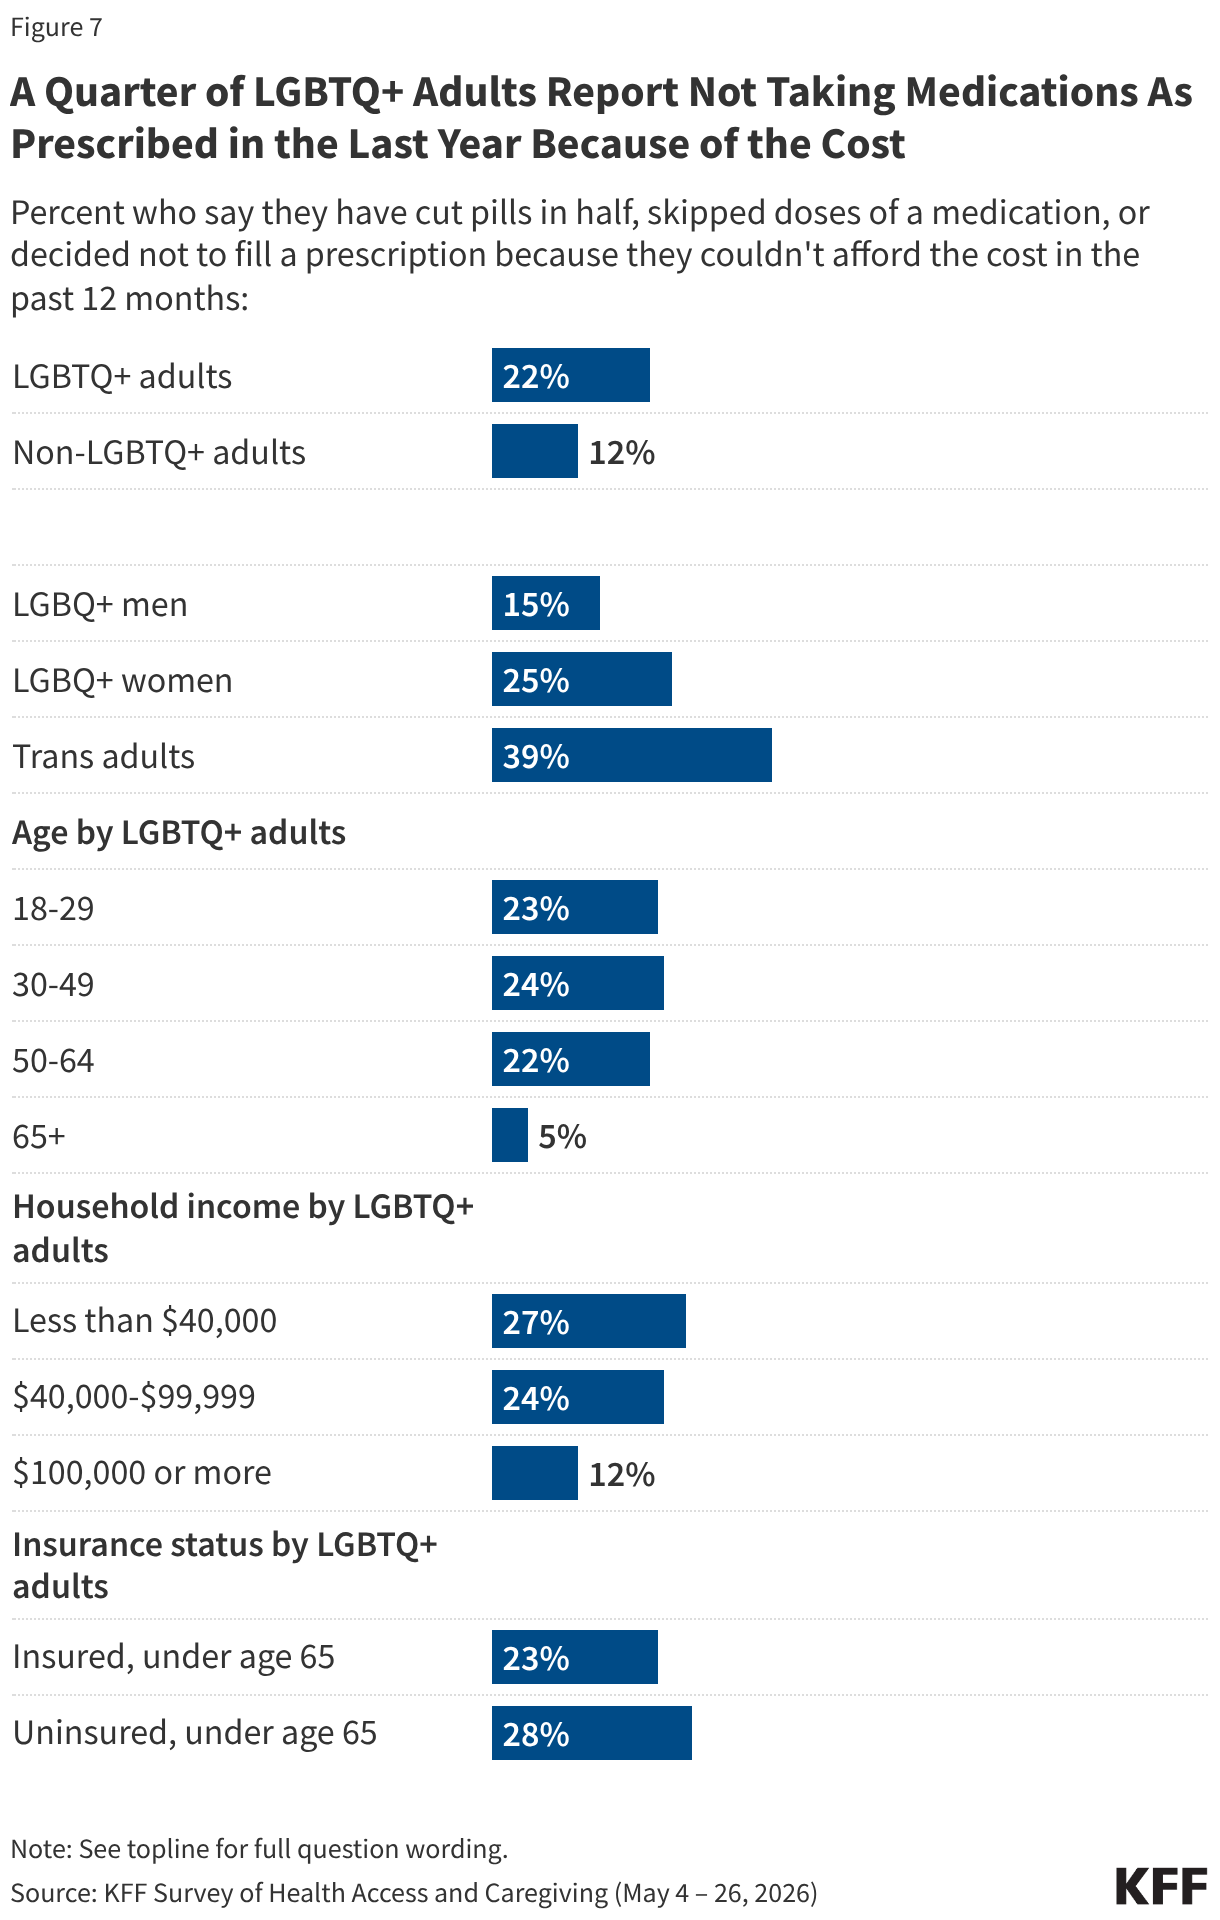
Cost barriers also affect prescription medication behavior, including among LGBTQ+ adults, with about a fifth of LGBTQ+ adults (22%) saying they’ve cut pills in half, skipped doses of a medication, or decided not to fill a prescription because they couldn’t afford the cost (compared to 12% of non-LGBTQ+ adults). Trans adults (39%), LGBTQ+ adults without insurance (28%), LGBQ+ women (25%), and younger LGBTQ+ adults (23% of those under age 30), are the most likely to report that they didn’t take their prescription medication as prescribed due to cost.
In addition, around a quarter of LGBTQ+ adults with lower incomes report cutting pills in half, skipping doses of medications, or not filling a prescription in the past year due to cost, including 27% of those with a household income of less than $40,000 a year, and 24% of those with incomes between $40,000 and $99,999 a year, compared to around one in ten (12%) of LGBTQ+ adults with incomes of $100,000 or more a year.
Difficulty Paying Medical Bills
Substantial shares of LGBTQ+ adults also report struggling with medical bills. Three in ten LGBTQ+ adults say they have had problems paying for or were unable to pay a medical bill, including bills for doctors, tests or labs, or medication in the past 12 months, higher than the 21% of non-LGBTQ+ adults who say the same. This includes four in ten (42%) trans adults, over a third (36%) of LGBQ+ women and two in ten (21%) LGBQ+ men.
Problems with bills can lead to important financial consequences for many LGBTQ+ adults. Two in ten (19%) LGBTQ+ adults, including two in ten (22%) LGBQ+ women and roughly one in ten (13%) LGBQ+ men say they’ve had to cut back on household expenses like food, clothing, or other basic household items in order to pay for health care costs. This experience is more common among trans adults, over one quarter of whom (28%) report the same. Overall, LGBTQ+ adults report they have cut back on necessities to pay for health care costs more commonly than non-LGBTQ+ adults (13%).
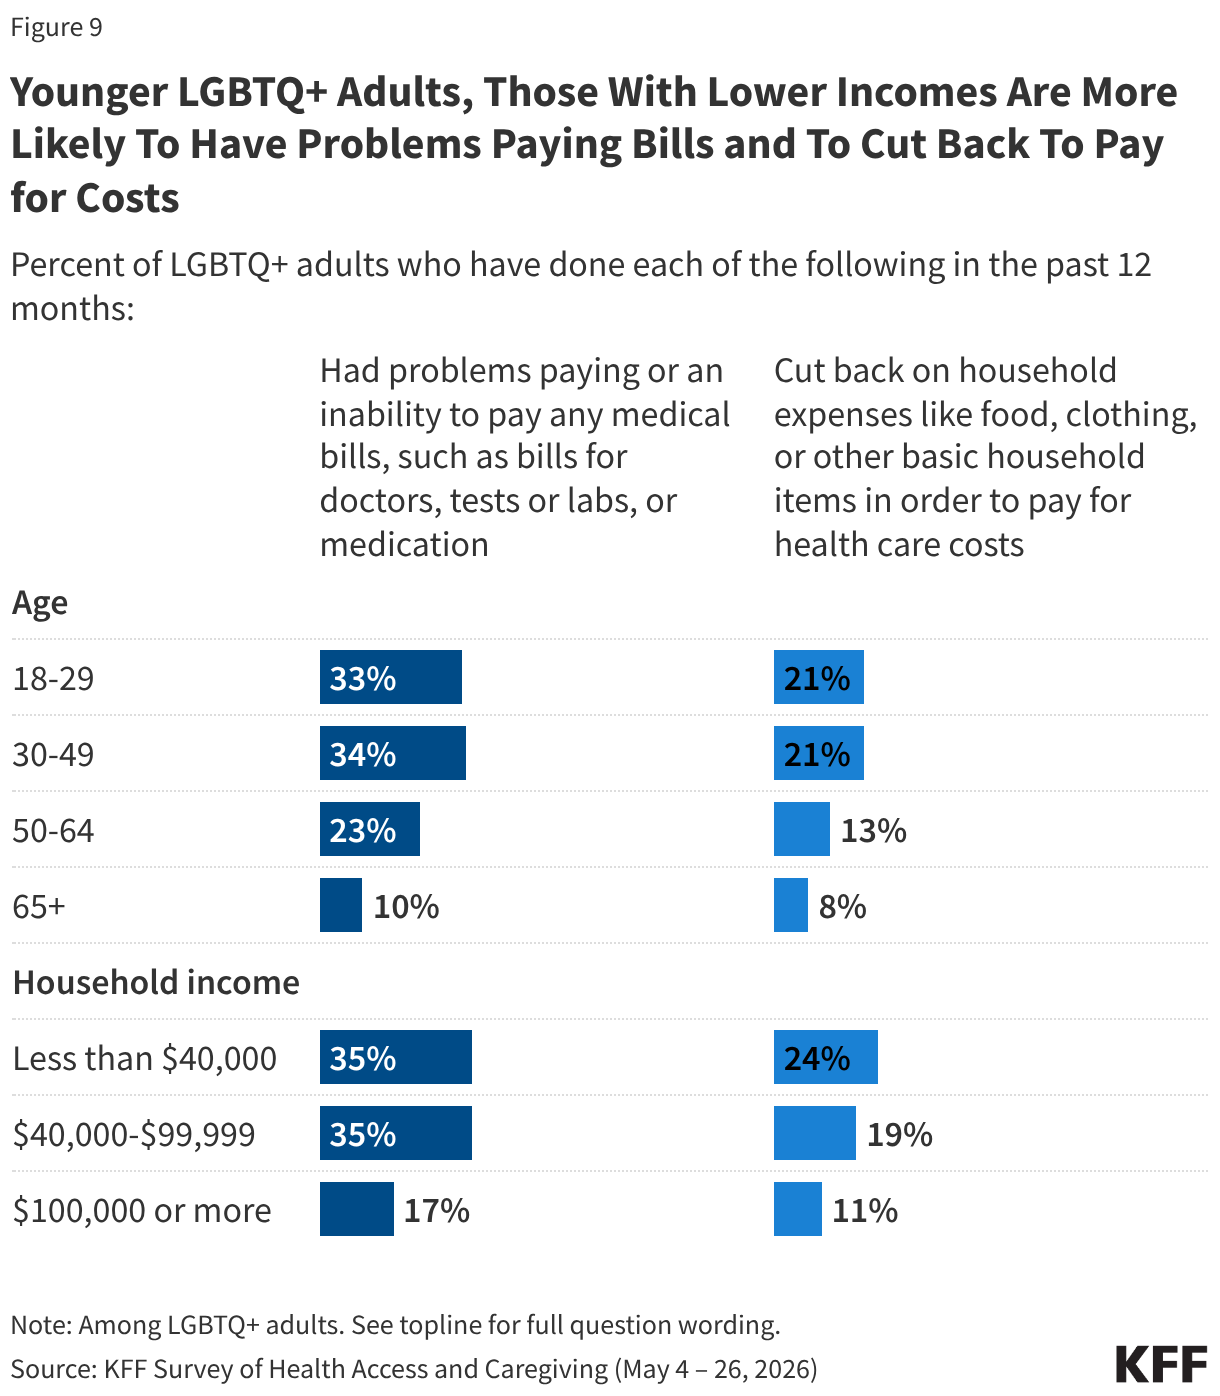
Younger LGBTQ+ adults and those with lower household incomes, two groups with considerable overlap, are among the most likely to report problems paying medical bills in the past year, with around a third of those under age 30 (33%), between 30 and 49 (34%), those with incomes of less than $40,000 a year (35%) or between $40,000 and $99,999 (35%) reporting they had problems paying or an inability to pay for any medical bills in the past year. Individuals earning over $100,000 annually and those 65 and older, who are largely covered by Medicare, are less likely to report such problems.
Younger LGBTQ+ adults and those with lower incomes are also more likely to report cutting back on expenses because of their problems paying medical bills. Overall, a quarter (24%) of LGBTQ+ adults with household incomes less than $40,000 a year say they have cut back on household expenses like food, clothing or other basic household items to pay for health care costs, compared to two in ten (19%) LGBTQ+ adults with incomes between $40,000 and $99,999 and one in ten (11%) of those with incomes of $100,000 or more a year.
Younger LGBTQ+ adults are also more likely to report cutting back on expenses because of trouble paying medical bills, including two in ten LGBTQ+ adults under age 30 and between ages 30 to 49 (21% for each) compared to one in ten (13%) LGBTQ+ adults ages 50 to 64 and one in twelve (8%) of those ages 65 and older.
Insurance Delays or Denials
Treatments or medications recommended by a provider may be delayed, and in some cases, an insurance company may deny coverage for the recommended medication or treatment after or during the care process. While insurance coverage helps some LGBTQ+ adults deal with access and cost issues, many face other challenges such as delayed or denied care.
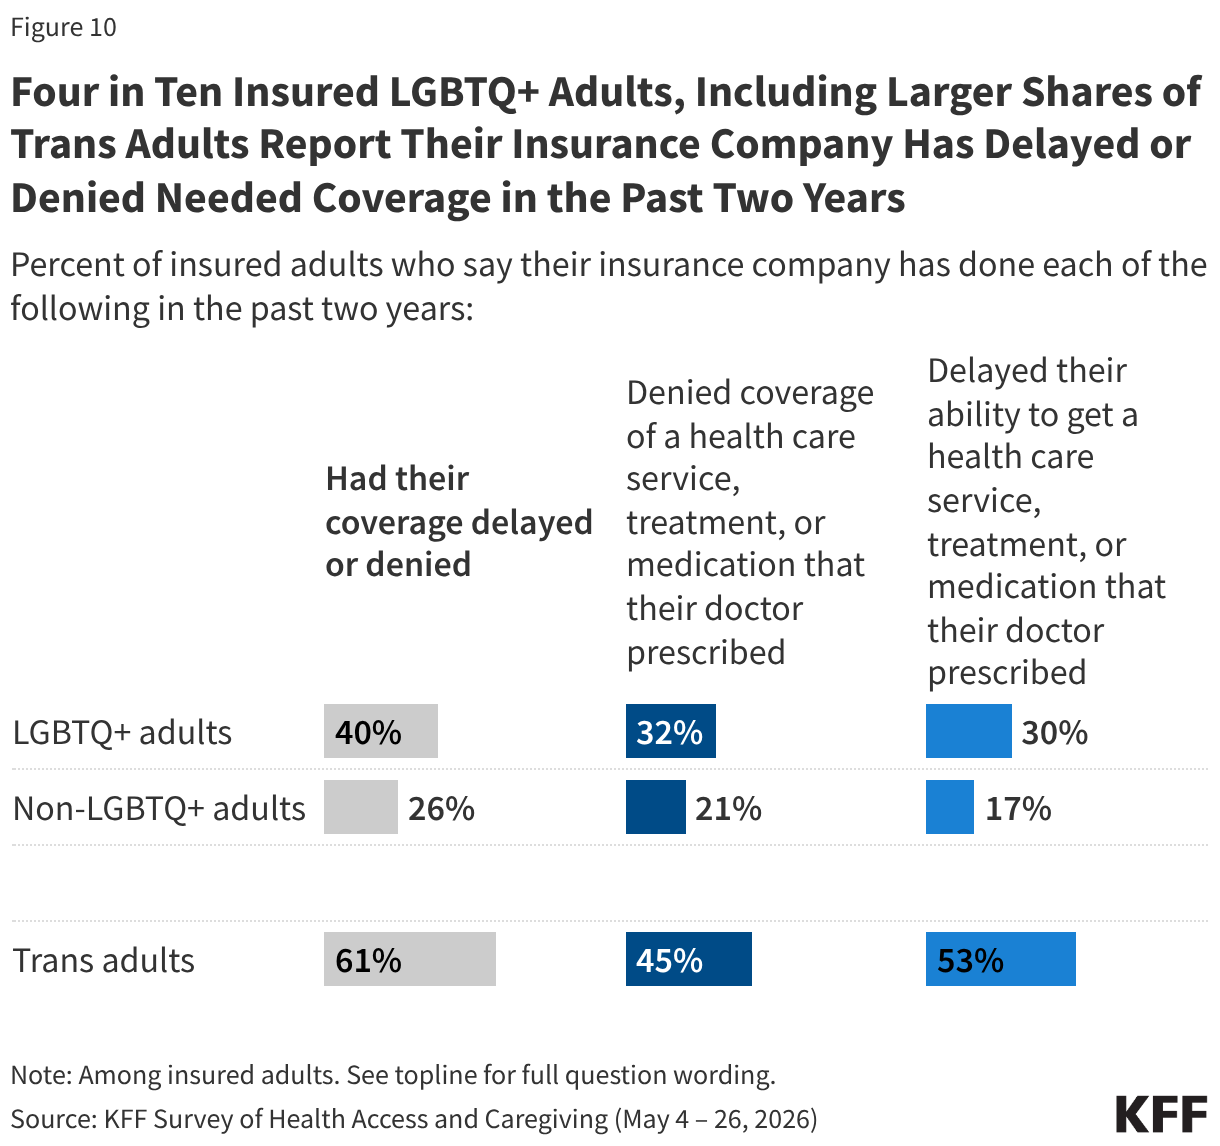
Roughly one-third of insured LGBTQ+ adults say their insurance company denied coverage (32%) or delayed (30%) their ability to get a health care service, treatment, or medication that their doctor prescribed in the past two years. Four in ten say coverage has either been delayed or denied. These shares are substantially higher than among non-LGBTQ+ adults, about a quarter (26%) of whom say they’ve experienced a denial of service (21%) or delay (17%) in the past two years.
These experiences are particularly common among trans adults, roughly six in ten (61%) of whom say they’ve been delayed (53%) or denied (45%) coverage by their insurance for a service, treatment, or medication prescribed by their doctor in the past two years.
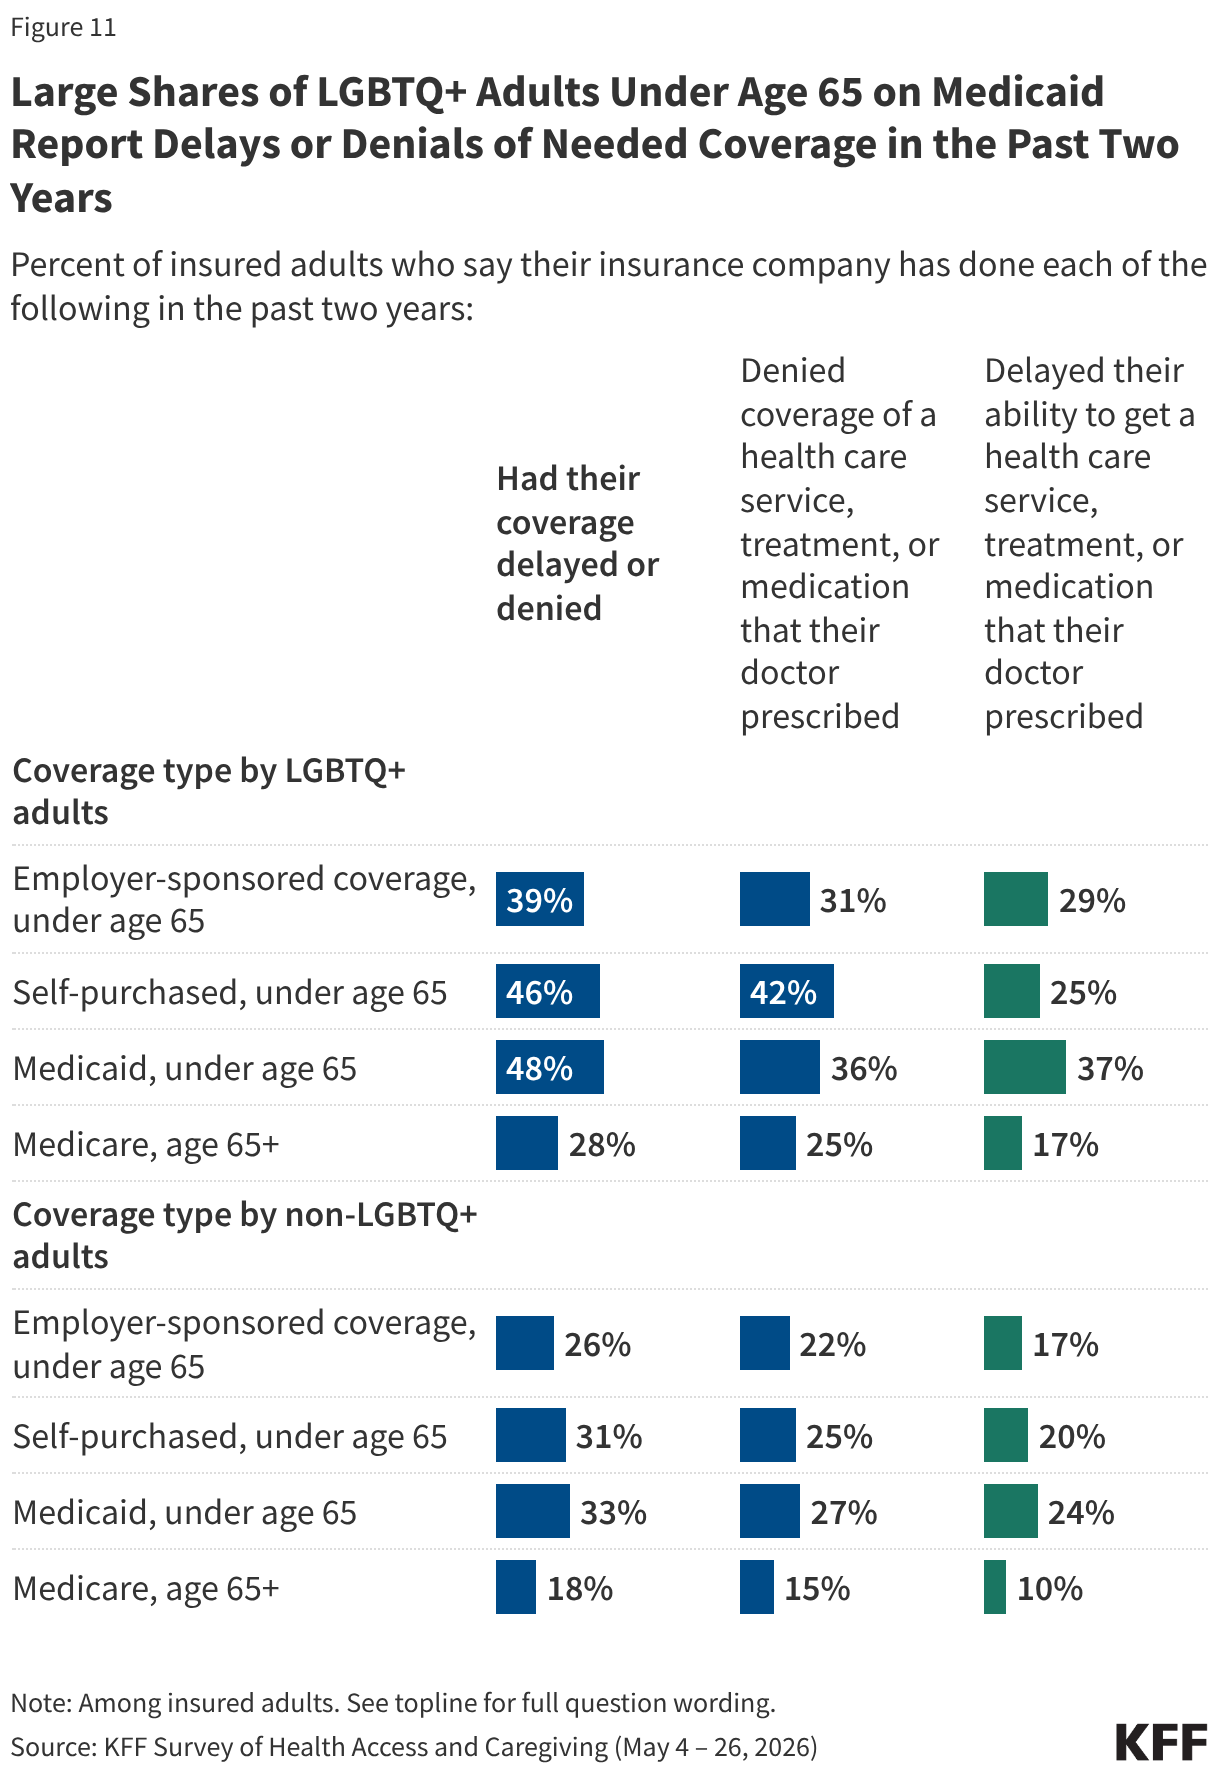
Delays and denials of coverage for LGBTQ+ adults vary based on what type of insurance they have. Individuals with either self-purchased plans or Medicaid report experiencing these most often. Roughly half (48%) of LGBTQ+ adults under age 65 who have Medicaid (48%) or self-purchased insurance (46%) say their insurance company has denied or delayed health care services, treatments, or medications in the past two years. Given that Medicaid plays a larger role in covering LGBTQ+ people, this coverage difference may in partially explain some of the disparate challenges this group faces with delays and denials.
Roughly four in ten (39%) LGBTQ+ adults under age 65 with employer-sponsored insurance say the same while just three in ten (28%) LGBTQ+ adults ages 65 and older with Medicare report experiencing recent delays and denials.
The share of LGBTQ+ adults with various types of health insurance who report delays or denials of needed care is larger than the share of non-LGBTQ+ adults who say the same. Roughly a third of those non-LGBTQ+ adults with Medicaid (33%) or self-purchased insurance (31%), around a quarter (26%) of those with employer-sponsored coverage, and around two in ten (18%) of non-LGBTQ+ adults who have Medicare and are ages 65 or older report these issues.
Methodology
The KFF Survey of Health Status and Caregiving was a series of questions designed and implemented by KFF with the SSRS Opinion Panel Mega-Omnibus. The survey was conducted May 4 – May 26, 2026, online and by telephone among a nationally representative sample of 25,873 U.S. adults in English (n=25,422) and in Spanish (n=451).
The SSRS Opinion Panel is a nationally representative probability-based panel where panel members are recruited randomly in one of two ways: (a) Through invitations mailed to respondents randomly sampled from an Address-Based Sample (ABS) through the U.S. Postal Service’s Computerized Delivery Sequence (CDS); (b) recruited via random digit dial (RDD) telephone sample of cell phone numbers connected to a prepaid cell phone. Both samples were provided by Marketing Systems Group (MSG). The combined sample was reached either online (n=24,875) or over the phone (n=998) based on the panelist’s stated preference. For the online panel component, invitations were sent to panel members by email followed by up to four reminder emails and up to two reminder text messages (if consented to receive SMS).
The questions designed by KFF were included as part of a multi-stakeholder effort designed to survey all individuals currently empaneled in the SSRS Opinion Panel, with each organization paying for and having independent editorial control over its survey questions. Substantive questions from other outside stakeholders are redacted in this report. The SSRS survey team designed the questionnaire in order to minimize potential bias from question ordering. For more information, please contact SSRS.
Respondents who completed on the web received a $5 electronic gift card incentive (some harder-to-reach groups received a $10 electronic gift card). Respondents who completed the survey on the phone received $10 via a physical check in the mail. In order to ensure data quality, cases were removed if they failed two or more quality checks: (1) attention check questions in the online version of the questionnaire, (2) had over 10% item non-response, or (3) had a length of less than 30% of the mean length by mode. Based on this criterion, 69 cases were removed.
Data were weighted to represent adults 18+ in the United States. The Panel-wide base weight adjusts for the SSRS Opinion Panel recruitment and retention process. Because all current panelists (except 2026 recruits) were invited to participate and no further sampling was performed, no further adjustments to the Panel-wide base weight were necessary before applying it to the survey data.
With the Panel-wide base weight applied, the survey-data were weighted to match the sample’s demographic profile to the same target population parameters used in the calibration of the entire SSRS Opinion Panel. The demographic variables included in weighting for the general population sample are gender, age, race/ethnicity, and education (including interactions between these categories), as well as region, civic engagement, density, frequency of internet use, voter registration, political party identification, religion, household makeup, and home ownership. Final calibrated weights are trimmed at the 2nd and 98th percentiles to prevent individual interviews from having too much influence.
The margin of sampling error including the design effect for the full sample is plus or minus 1 percentage points. Numbers of respondents and margins of sampling error for key subgroups are shown in the table below. For results based on other subgroups, the margin of sampling error may be higher. Sample sizes and margins of sampling error for other subgroups are available on request. Sampling error is only one of many potential sources of error and there may be other unmeasured error in this or any other public opinion poll. KFF public opinion and survey research is a charter member of the Transparency Initiative of the American Association for Public Opinion Research.
| Group | N (unweighted) | M.O.S.E. |
| Total | 25,873 | ±1 percentage point |
| LGBTQ+ adults | 2,640 | ± 3 percentage points |
| LGBQ+ men | 963 | ± 5 percentage points |
| LGBQ+ women | 1,440 | ± 4 percentage points |
| Trans adults | 185 | ± 11 percentage points |
| Non-LGBTQ+ adults | 23,233 | ± 1 percentage point |
Appendix