Pulling it Together: When Premiums Go Up 39%

Published: Mar 8, 2010

Our group that works on health care cost issues just updated an analysis that sheds light on what’s really happening to people in the individual health insurance market, the issue Secretary Sebelius, a former Kansas insurance commissioner, and others have put in the spotlight by calling on Anthem and other insurance companies to account for their proposed high premium increases. The analysis shows that people buying health insurance on their own in the individual market from 2004-2007 still paid 52% of their health expenses, on average, out of their own pockets. In other words, people bought insurance and paid premiums and still on average paid for about half of their health costs themselves. This compares with a much lower out-of-pocket share for employer-sponsored coverage of 30%. 1

This points to what has really been going on in the individual insurance market. There has recently been a great deal of focus on increases in individual insurance premiums such as the proposed Anthem increase in our home state. Such premium increases are eye-popping and greater scrutiny by regulators is appropriate. But there is another phenomenon in the non-group market even more pervasive than large premium hikes; it’s what is known in the industry as “buy-downs.” When insurers inform members of large premium hikes, they commonly suggest that the increase can be mitigated (or sometimes even eliminated) by switching to a lower cost policy (which  means a policy with higher deductibles and/or greater limits on benefits). Data from ehealthinsurance.com bear this out: The average deductible for family plans in the individual market increased from $2,760 in 2008 to $3,128 in 2009 — just one year later. After years of these buy-downs, you end up with what we found in our recent analysis; insurance that, on average, pays for only about half of people’s health care bills.

The trend is not unique to the individual market. We’ve experienced this choice ourselves on several occasions as a modestly-sized employer. Our annual employer survey has been documenting steady increases in high deductible plans for several years, especially in smaller firms where the percentage of workers in plans with very high deductibles increased from 16% in 2006 to 40% in 2009. All this underscores a basic point: rising health care costs and insurance company practices are leading not just to more expensive premiums, but to skimpier, less comprehensive coverage as well; slowly redefining what we have known as health insurance. To be sure, some economists argue that this is precisely what should happen, that people should have more “skin in the game.” But this is not likely how regular people see it. Appropriate cost sharing is one thing, but we may be reaching the point in the individual market where the policies many people have simply cannot be considered meaningful coverage.

These data also provide some context for the discussion at the recent health care summit about what would happen to insurance premiums under reform. The Congressional Budget Office (CBO) has estimated that individual insurance premiums would, on average, go up under reform because people will be buying better coverage. That’s not too surprising when you look at the kind of skimpy insurance people buying on their own often have today. In fact, for equivalent coverage, the CBO estimates that premiums under reform would be somewhat lower than under the status quo. And some would qualify for tax credits that would provide substantial premium relief as well.

But, affordability goes beyond what people pay in premiums. Ultimately, people may end up focusing as much, if not more on their deductibles (the share of their health expenses they have to pay before their insurance kicks in). Deductibles are not only understandable to most people, but they are important for health access and economic security as well. If they are too high, they can be a disincentive to get care, especially for the chronically ill, and a burden on family budgets. To date, the discussion of affordability in health reform has focused mainly on premiums and not as much on the bigger picture of total out-of-pocket costs, including deductibles and cost-sharing. In President Obama’s recent health care proposal, he notably improves on the affordability of the Senate health care bill; both in terms of premiums and out-of-pocket costs.

The recent premium increases in the individual market probably have done more to illustrate the cost of doing nothing in health reform in simple, graphic terms people can understand than anything so far in the health reform debate. However, as we follow the debate about proposed Anthem-like increases in the individual market, it is important to remember that the burden of those increases is felt not only in higher premiums, but often in less comprehensive health insurance coverage.1. A few technical notes for those so inclined: These figures exclude dental and vision expenses. Also, you get somewhat different results if you look at the share of costs paid out-of-pocket in the aggregate rather on average. This is because people with high expenses are weighted more heavily when costs are measured in that way, though even for those people, out-of-pocket costs are substantially higher in the individual market compared to employer coverage. While some may point to data from 2004-2007 as being old, it’s unfortunately the most recent government survey data available, and other reports suggest that things have not improved since then. All the details are in the write-up of the analysis, which I encourage you to read.

Snapshots: Comparison of Expenditures in Nongroup and Employer-Sponsored Insurance: 2004-2007

Authors: and
Published: Mar 3, 2010

Data from the insurance industry and reviews of premiums offered through on-line sellers show that premiums for nongroup health insurance are lower than premiums reported on national surveys for employer-sponsored health insurance (ESI).  This paper uses pooled data from the 2004 through 2007 Medical Expenditure Panel Survey to compare the insurance payments for and out-of-pocket payments by people with nongroup health insurance and people with ESI.  While premiums for non-group coverage are lower than ESI premiums, the average payments made by those policies on behalf of their enrollees are also lower than the average insurance payments for people with ESI.  Nongroup enrollees also pay a higher share of health expenses out-of-pocket compared to ESI.  The higher out-of-pocket shares paid by nongroup enrollees suggests that nongroup policies have higher cost sharing and/or cover fewer health expenditures than employer-sponsored insurance.  Nongroup enrollees also are more likely than ESI enrollees to report that their health status and mental health status are excellent, another factor helping to explain why nongroup premiums are lower than premiums for ESI.

The nongroup health insurance market has received an increasing amount of attention as Congress considers health reform. Expanding the nongroup market is a key element in national health reform proposals presented by Congress and the President Obama, often coupled with broader market reforms. In addition, the health reforms enacted in Massachusetts require people who do not get insurance through their work to directly purchase coverage.

Understanding the costs for and benefits provided by nongroup coverage is important for those considering policies that would build on or expand the nongroup market. This is particularly important for policies that would extend nongroup coverage to the uninsured, who disproportionately are lower income. Data from convenience samples of insurers and from on-line brokers suggest that nongroup premiums are much lower on average than premiums for employer-sponsored insurance – maybe as much as 50% lower.1 They also suggest that cost sharing may be higher, on average, in nongroup policies than in employer-sponsored plans.For policy makers, the attractiveness of the apparent low price for nongroup policies needs to be balanced against questions about of how much coverage these policies provide. Policies with high cost-sharing may not be attractive to lower income people with few resources to meet high out-of-pocket demands.

This brief looks at the amount of coverage provided in the nongroup market by comparing the spending of nonelderly people with nongroup coverage (“nongroup enrollees”) to nonelderly people with employer-sponsored health insurance (“ESI enrollees”). In particular, for each group of enrollees we look at the relative amounts paid by private insurance and at the relative percentages of spending that are out-of-pocket. The average expenditures paid by private insurance tell us how much insurance pays for each enrollee; a significant difference between the average for nongroup and the average for ESI enrollees would suggest a difference in the level of coverage between the two markets. In addition, the percentage of expenditures that people pay out-of-pocket also provides information about the level of coverage that they have. Once people have insurance, it is fair to assume that they would prefer to pay for health care that they use with their insurance rather than out-of-pocket. If we see that one group of enrollees pay for a much higher share of their health expenditures out-of-pocket than the other group of enrollees, it would suggest that the first group has a lower level of coverage.

We also look at the self-reported health status of nongroup and ESI enrollees. Another possible reason why premiums for nongroup coverage may be lower than premiums for employer-sponsored insurance is that, on average, nongroup enrollees are in better health than ESI enrollees. People in better health should use less health care, which would result in lower payments by private insurance on their behalf.

The next section of the paper describes the source of data for the analysis. The following sections compare for nongroup and ESI enrollees: (1) amounts paid by private insurance; (2) share of expenditures that are out-of-pocket; and (3) self-reported health status and mental health status. The final section concludes with some observations for policy.

Source of Data

For the analysis, we use data from Medical Expenditures Panel Survey Household Component (MEPS HC), which is a national survey conducted annually by the Agency for Healthcare Research and Quality that provides annual estimates relating to the health status, expenditures, coverage and use of the U.S. civilian non-institutionalized population.3 To increase sample size within insurance groups, we pooled data from the 2004-2007 MEPS HC. Expenditure amounts were adjusted to account for differences in spending between years.4 The amounts shown are expenditures for health care services and do not include premium payments. The analysis was done using SUDAAN (Release 10.0).

Enrollees in each coverage group were primarily covered by private insurance, and were classified as having employer coverage or nongroup coverage if the individual had 6 months or more of private, employer-sponsored or Tricare insurance, or nongroup insurance, respectively. People who had public coverage or were uninsured in any month were excluded from the analysis. On average, both nongroup enrollees and ESI enrollees had just less than 12 months of coverage during the year. Average ages were 35 for nongroup enrollees and 34 for ESI enrollees.

Comparison of Expenditures Paid by Private Insurance

Table 1 compares payments by private insurance for nongroup and ESI enrollees. Because health care spending, on average, increases with age, enrollees are divided into four age groups. Average and median values are shown for each age category.

TABLE 1

Average and Median Annual Expenditures Paid By Private Health Insurance, Nonelderly Nongroup Enrollees and ESI Enrollees, By Age


Nongroup Enrollees

ESI Enrollees

Ages


Expenditure

Private Ins. ($)

Adjusted Expenditure

Private Ins. ($)

(No Vis or Den)


Expenditure

Private Ins. ($)

Adjusted Expenditure

Private Ins. ($)

(No Vis or Den)

0 to 17Mean

$531 a

$349 c

$1,049

$838

Median

163 b

113 d

319

168

18 to 34Mean

1,209

1,118

1,563

1,405

Median

130 b

61 d

334

178

35 to 49Mean

1,226 a

1,145 c

2,122

1,931

Median

156 b

103 d

546

348

50 to 64Mean

2,293 a

2,225 c

4,050

3,825

Median

351 b

300 d

1,288

1,031

Source: Pooled MEPS 2004-2007, HC

a Differences in mean expenditures paid by private health insurance between nongroup enrollees and ESI enrollees within age group is statistically significant at p<.05.

b Difference in median expenditures paid by private health insurance for nongroup enrollees and ESI enrollees within age group is statistically significant at p<05.

c Differences in mean adjusted expenditures paid by private health insurance between nongroup enrollees and ESI enrollees within age group is statistically significant at p<.05.

d Difference in median adjusted expenditures paid by private health insurance for nongroup enrollees and ESI enrollees within age group is statistically significant at p<05.

The average and median annual amounts paid by private health insurance are higher for ESI enrollees than for nongroup enrollees for most age groups. The results are presented two ways: the first column for each enrollee group shows total annual expenditures by private health insurance and the second column for each group shows annual expenditures for private health insurance adjusted to remove payments for dental and vision services. Since dental and vision services, when covered, are often covered by separate or supplemental insurance policies, the adjusted amounts should provide a more accurate picture of expenditures for basic benefits usually covered by insurance. ESI enrollees also are much more likely than nongroup enrollees to have any health insurance payments for vision and dental services, suggesting that coverage for these services is more prevalent for people who get coverage though work than for those who must buy it directly.

Average and median amounts paid by private insurance are statistically significantly higher for ESI enrollees than nongroup enrollees in each age group, except age group 18-34. Relative to the values for nongroup enrollees, the average expenditures paid by private insurance for ESI enrollees are 98% higher for people ages 0 to 17, 73% higher for people ages 35 to 49, and 77% higher for people ages 50 to 64. The percentage differences within age groups do not change appreciably when expenditures for vision and dental services are removed.5

These very large differences in payments by private insurance for nongroup and ESI enrollees suggest that nongroup policies are providing less coverage than employer-sponsored insurance. The results are consistent with the information from insurance industry sources that suggest that nongroup policies have higher up-front cost sharing than employer-sponsored insurance,6 although health status or other differences between nongroup and ESI enrollees also could help explain the differences in the amount paid by private insurance. The next section looks at another way to measure level of coverage – the proportion of expenses that people pay out-of-pocket for people who have health expenditures.

Out-of-Pocket Spending as a Share of Total Health Expenditures

This part of the paper looks at the share of health expenditures that people pay out-of-pocket as a proxy for the level of coverage that people have – in other words would the coverage be expected to pay for a relatively smaller or larger share of the health care expenditures that a person might have. We assume that people who have insurance would rather use that insurance to pay for their health care expenses than to pay for them out-of-pocket. Therefore, people who pay for a relatively large share of their spending out-of-pocket do so because a relatively large share of their health expenditures is not covered by their insurance. This may be due to coverage restrictions or relatively high deductibles and other cost sharing.

For the people in our enrollee groups, payments from private insurance and out-of-pocket payments constitute the vast majority of their spending (99% for nongroup enrollees and 97% for ESI enrollees). The small remainder is made up of spending from other sources such as workers compensation, Veterans Administration or public programs. For this analysis, we exclude the payments made by these other sources from the calculations because they may be paying for services that would not normally be covered by health insurance, such as work-related injuries. Excluding expenditures from these sources does not materially affect the results. Therefore, “total expenditures” refers to the sum of private insurance expenditures and individual out of pocket expenditures.

We look at out-of-pocket shares three ways. In Table 2, for nongroup and ESI enrollees, we show the average total out-of-pocket expenditures as a proportion of the average total expenditures. Table 3 shows the average and median out-of-pocket shares for nongroup and ESI enrollees who have health expenditures. For this table, we calculate the out-of-pocket share for each enrollee and summarize the results. The percentages in Table 3 are higher than in Table 2 because enrollees with lower spending, who make up the majority of enrollees, have relatively high out-of-pocket shares. Enrollees with high total spending make up a small share of enrollees but a large share of total spending. These enrollees have relatively low out-of-pocket shares. Table 4 demonstrates this difference more directly by showing the average and median out-of-pocket shares for nongroup and ESI enrollees who were among the top 20% and the top 5% in total health expenditures in their respective enrollee groups.

TABLE 2

Total Out-of-Pocket Expenditures by Nonelderly as a Proportion of Total Health Expenditures, by Enrollee Group

Nongroup Enrollee Group

ESI Enrollee Group

Total Out-of-Pocket as Share of Total Expenditures (%)

Total Out-of-Pocket as Share of Total Expenditures (%)

Adjusted (No Vis or Dental)

Total Out-of-Pocket as Share of Total Expenditures (%)

Total Out-of-Pocket as Share of Total Expenditures (%)

Adjusted (No Vis or Dental)

41%

35%

20%

16%

The story is similar for each way of looking at out-of-pocket shares. Looking at aggregate spending across all nongroup and ESI enrollees, 41% of total heath expenditures by nongroup enrollees are paid out-of-pocket, as compared to 20% for ESI enrollees (Table 2). The percentages fall somewhat when expenditures for vision and dental are removed from the calculation, but the large difference between nongroup and ESI enrollees remains.

TABLE 3

Average and Median Percentages of Total Expenditures Paid Out-of-pocket by Nonelderly Nongroup and ESI Enrollees with Health Expenditures


Nongroup Enrollees

ESI Enrollees


Percentage Expenditures Paid Out-of-Pocket (%)

Percentage Adjusted Expenditures Paid Out-of-Pocket (%)

(No Vis or Den)


Percentage Expenditures Paid Out-of-Pocket (%)

Percentage Adjusted Expenditures Paid

Out-of-Pocket (%)

(No Vis or Den)

Mean

58% a

52% a

32%

30%

Median

59% b

47% b

25%

22%

Source: Pooled MEPS 2004-2007, HC

a Differences in mean percentage of expenditures paid out-of-pocket for nongroup enrollees and ESI enrollees is statistically significant at p<.05.

b Differences in median percentage of expenditures paid out-of-pocket for nongroup enrollees and ESI enrollees is statistically significant at p<.05.


For people with health expenditures, Table 3 shows that nongroup enrollees on average paid a much higher share of their health expenditures out-of-pocket than ESI enrollees. The median nongroup enrollee with expenditures also has a much higher out-of-pocket share than the median ESI enrollee with expenditures. The pattern is similar whether expenditures for vision and dental services are included or excluded.

In Table 4 we extend the analysis to see if the difference in out-of-pocket shares persists for nongroup and ESI enrollees with high health care expenditures. We looked at the out-of-pocket shares of enrollees who were among the top 20% and the top 5% in total health expenditures. These groupings are not exclusive: enrollees in the top 5% of spending are by definition also in the top 20% of spending. We find that average out-of-pocket shares and median out-of-pocket shares became smaller among both nongroup and ESI enrollees as total health spending rises (compare Tables 3 and 4), but that significant differences between nongroup and ESI enrollees persist.

TABLE 4

Average and Median Percentages of Total Expenditures Paid Out-of-pocket by Nonelderly Nongroup and ESI Enrollees with High Health Care Expenditures

Nongroup Enrollees

ESI Enrollees

Percentage of Expenditures Paid Out of Pocket

Top 20% Spenders

Top 5% Spenders

Top 20% Spenders

Top 5% Spenders

With Vision/Dental

Mean

45% a

30% a

23%

13%

Median

38% b

22% b

18%

8%

Without Vision/Dental

Mean

41% a

28% a

19%

11%

Median

35% b

17% b

14%

7%

Source: Pooled MEPS 2004-2007, HC

a Differences in mean percentage of expenditures paid out-of-pocket for nongroup enrollees and ESI enrollees within spending tier is statistically significant at p<.05.

b Differences in median percentage of expenditures paid out-of-pocket for nongroup enrollees and ESI enrollees is statistically significant at p<.05.

Tables 2 through 4 suggest that nongroup insurance is less likely than employer-sponsored health insurance to pay for health care expenditures that people have, leaving nongroup enrollees to pay for a relatively high share of their health care expenditures out-of-pocket. This is true whether looking at total spending over all nongroup and ESI enrollees or looking at the average or median out-of-pocket shares of enrollees with health spending. Even among enrollees with very high total health care expenditures, nongroup enrollees have higher average and median out-of-pocket shares than ESI enrollees. Again, these results are consistent with the information from insurance industry sources indicating that nongroup insurance policies, on average, have higher cost sharing than employer-sponsored coverage. These results also show that the size of the difference in protection is meaningful.

Health Status of Nongroup and ESI Enrollees

This section briefly looks at the self-reported health status of nongroup and ESI enrollees. Another potential reason why nongroup coverage might cost less than employer-sponsored coverage would be that nongroup enrollees are healthier on average than ESI enrollees.

The MEPS HC asks respondents to classify their health status and their mental health status on 5-point scales: excellent, very good, good, fair, or poor. Table 5 shows that nongroup enrollees are more likely than ESI enrollees to classify their health status as excellent (45% vs. 36%). Table 6 shows a similar result for mental health status. The differences in the distributions of responses between nongroup and ESI enrollees are statistically significant in both tables; the differences in the percentage of respondents reporting that their health or mental health status is excellent also are statistically significant.

Table 5

  Perceived Health Status of Nonelderly Nongroup and ESI Enrollees

Nongroup Enrollees*

ESI Enrollees
Perceived Health Status
Excellent

44.8%**

35.8%

Very Good

31.8

35.7

Good

17.7

23.0

Fair

4.7

4.4

Poor

1.0

1.0

Source: Pooled MEPS 2004-2007, HC

Note: Percentages may not add up to 100% due to rounding.

*Difference between the distributions for nongroup enrollees and ESI enrollees is statistically significant at p<.05.

**Difference in percentage reporting health status to be excellent is statistically significant at p<.05

Table 6

Perceived Mental Health Status of Nonelderly Nongroup and ESI Enrollees

Nongroup Enrollees*

ESI Enrollees
Perceived Mental Health Status
Excellent

53.6%**

45.8%

Very Good

26.1

32.0

Good

16.8

19.2

Fair

3.1

2.6

Poor

0.5

0.4

Source: Pooled MEPS 2004-2007, HC

Note: Percentages may not add up to 100% due to rounding.

* Difference between the distributions for nongroup enrollees and ESI enrollees is statistically significant at p<.05.

**Difference in percentage reporting mental health status to be excellent is statistically significant at p<.05.

These differences in perceived health may reflect the populations who are able to choose employer-sponsored and nongroup coverage, or they may reflect market rules in many states which restrict people in poorer health from enrolling in nongroup coverage. In any event, if nongroup enrollees are healthier than ESI enrollees, they may use fewer health care services, which could help explain the relatively low nongroup premiums that we see in the convenience surveys from industry sources.

Discussion

This analysis of national survey data from MEPS shows that average payments by private insurance for people with nongroup insurance are much lower than average private insurance payments for people with employer-sponsored coverage. This is consistent with information from insurance industry sources suggesting that premiums for nongroup insurance are lower on average than premiums for employer-sponsored insurance.

The analysis also suggests several reasons why private insurance payments for nongroup enrollees would be relatively low. First, nongroup enrollees pay a much higher proportion of their health expenditures out of pocket, which indicates that on average nongroup insurance provides less coverage than employer-sponsored insurance. Nongroup coverage may have higher cost sharing, may cover fewer services, or both. The supposition that nongroup insurance has relatively high cost sharing is consistent with insurance industry surveys which indicate deductible levels that are higher than we see for employer-sponsored insurance.Second, nongroup enrollees are more likely than ESI enrollees to report that their health status and mental health status are excellent. If nongroup enrollees are healthier on average than ESI enrollees, it would help explain why private nongroup insurance is relatively less expensive than employer-sponsored coverage.

These findings raise some important considerations for policy makers evaluating different options for covering the uninsured. One is the relatively high share of total health spending that is required in the nongroup market. Public policies that would provide current nongroup policies to low-income people may still leave them with quite burdensome out-of-pocket costs, and policy makers may want to consider approaches to limit the cost sharing and other out-of-pocket expenses under coverage expansions targeted to those with low incomes.

Another consideration for policymakers is that the premium levels observed in the nongroup market today may be lower than the premiums that would be necessary to provide coverage to a greater share of the population, including people who are chronically uninsured. Premiums in the nongroup market may reflect the relatively good health of the nongroup population, and the target population for expanded coverage may not share the same good health. Appendix A shows the perceived health status and mental health status of nonelderly people who do not report having any insurance during the year: people without insurance are much less likely to report their health and mental health as excellent and are more likely to report their health and mental health as fair or poor than either nongroup or ESI enrollees.8 Policymakers should be careful not to assume that they could insure many of the currently uninsured at the premium levels now observed in the nongroup market.

Appendix A

Perceived Health Status of Nonelderly Uninsured

Uninsured

Perceived Health Status
Excellent

28.7%

Very Good

31.0

Good

29.0

Fair

8.8

Poor

2.4

Source: Pooled MEPS 2004-2007, HC

Note: Percentages may not add up to 100% due to rounding.

Perceived Mental Health Status of Nonelderly Uninsured

Uninsured

Perceived Mental Health Status
Excellent

36.8%

Very Good

29.5

Good

26.6

Fair

5.6

Poor

1.5

Source: Pooled MEPS 2004-2007, HC

Note: Percentages may not add up to 100% due to rounding.

The snapshot was prepared by Bianca DiJulio and Gary Claxton of the Kaiser Family Foundation’s Health Care Marketplace Project, and is an update to an analysis originally published in 2006.

Notes:

1. A recent report from America’s Health Insurance Plans (AHIP), based on information from member companies, reported average premiums for 2009 of $2,985 for single coverage and $6,328 for family coverage; by comparison, data from the 2009 KFF/HRET Employer Health Benefits Survey shows average premiums for employer-sponsored coverage of $4,824 for single coverage and $13,375 for family coverage.

2. For example, AHIP reports that just under 30% of nongroup enrollees with single coverage had deductibles of $3,000 or more in 2009. For more information on this report, see http://www.ahipresearch.org/pdfs/2009IndividualMarketSurveyFinalReport.pdf. Data from the 2009 KFF/HRET Employer Health Benefits Survey show that only 2% of enrollees with single coverage in employer-sponsored plans had a deductible of $3,000 or more for preferred providers.

3. For more information on the Medical Expenditure Panel Survey, seehttp://www.meps.ahrq.gov/mepsweb/.

4. To normalize expenditure amounts over the four years, we multiplied expenditure amounts by the ratio of the weighted average mean per capita expenditure amount for the four years combined and the weighted per capita mean expenditure amount for that year.

5. Without expenditures for vision and dental services, average expenditures paid by private insurance for ESI enrollees are 140% higher for people ages 0 to 17, 69% higher for people ages 35 to 49, and 72% higher for people ages 50 to 64.

6. America’s Health Insurance Plans (AHIP) (October 2009). Individual Health Insurance 2009: A Comprehensive Survey of Premiums, Availability, and Benefits. Retrieved from http://www.ahipresearch.org/pdfs/2009IndividualMarketSurveyFinalReport.pdf

7. See note three for a comparison of deductibles for nongroup coverage compared to employer-sponsored coverage.

8. The differences in the distributions of health status between the uninsured and either people with nongroup insurance or ESI are statistically significant at p<.05.

Explaining Health Care Reform: Key Changes to the Medicare Part D Drug Benefit Coverage Gap

Published: Mar 1, 2010

On March 23, 2010, President Obama signed the Patient Protection and Affordable Care Act into law. The health reform law, as modified by the Health Care and Education Reconciliation Act of 2010 which passed the House of Representatives on March 21, 2010 and is under consideration in the Senate, makes several key changes to the Medicare Part D drug benefit to reduce Part D enrollees’ out-of-pocket liability when they reach the coverage gap, known as the “doughnut hole”. This explainer walks through how those provisions would work.

Issue Brief (.pdf)

Medicare Part D 2010 Data Spotlight: Prices for Brand-Name Drugs in the Coverage Gap

Authors: Juliette Cubanski, Tricia Neuman, Elizabeth Hargrave, Jack Hoadley, and Laura Summer
Published: Mar 1, 2010

This Medicare Part D data spotlight finds prices for some commonly used brand-name drugs rising in 2010 for beneficiaries who reach the coverage gap (or “doughnut hole”), with increases since 2006 far exceeding the growth in inflation.

The Part D benefit’s coverage gap generally requires enrollees to pay the full cost of their drugs after their total drug spending exceeds their initial coverage limit ($2,830 in 2010) until they reach the threshold for receiving catastrophic coverage ($6,440 in 2010). In 2007, an estimated 3.4 million Part D enrollees reached the coverage gap.

Using data posted on the government’s Medicare.gov website, the analysis looks at prices for commonly used brand-name drugs without a generic substitute for enrollees in stand-alone prescription drug plans. The prices reflect the amount that enrollees would pay for a 30-day supply after they reach the coverage gap and before catastrophic coverage begins.

This data spotlight is one in a series analyzing key aspects of the Medicare Part D drug plans that will be available to beneficiaries in 2010. The analysis was conducted jointed by Jack Hoadley and Laura Summer of Georgetown University, Elizabeth Hargrave of NORC at the University of Chicago, and Juliette Cubanski and Tricia Neuman of the Kaiser Family Foundation.

Medicaid Financial Eligibility: Primary Pathways for the Elderly and People with Disabilities

Published: Feb 25, 2010

This issue brief details the various eligibility pathways by which individuals with disabilities and the elderly can qualify for Medicaid coverage. The program, which serves as a safety net for many of the nation’s poorest and sickest individuals, provides health coverage to nearly 60 million Americans, including 8.5 million with disabilities and 8.8 million low-income frail, elderly and disabled Medicare beneficiaries who rely on Medicaid to fill Medicare’s gaps.

icon_pdf

 Issue Brief (.pdf)

News Release

Americans Remain Split On Stalled Health Care Legislation, but Some Provisions Popular Among Majorities of Democrats, Independents and Republicans

Published: Feb 23, 2010

Most See Delays As Driven By Politics Rather Than Policy

MENLO PARK, CA – The latest Kaiser Tracking Poll finds the public still split on health care reform legislation, with 43 percent in favor and 43 percent opposed.  However, the poll also finds that majorities of Americans of all political leanings support several provisions in the health reform proposals in Congress and most attribute delays in passing the legislation to political gamesmanship rather than policy disagreements.

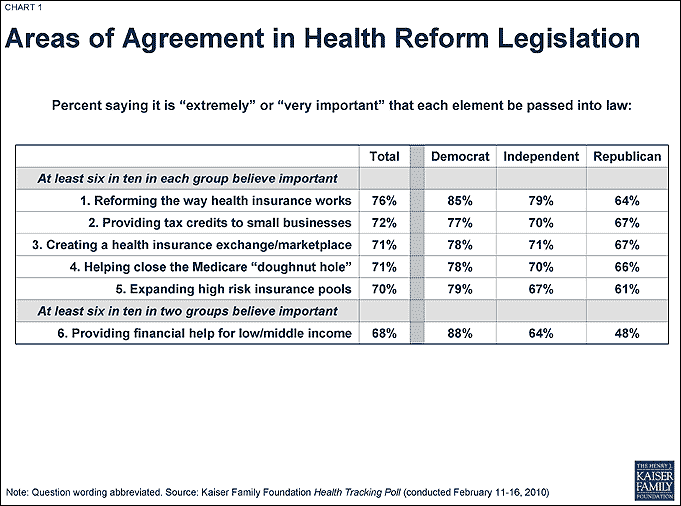
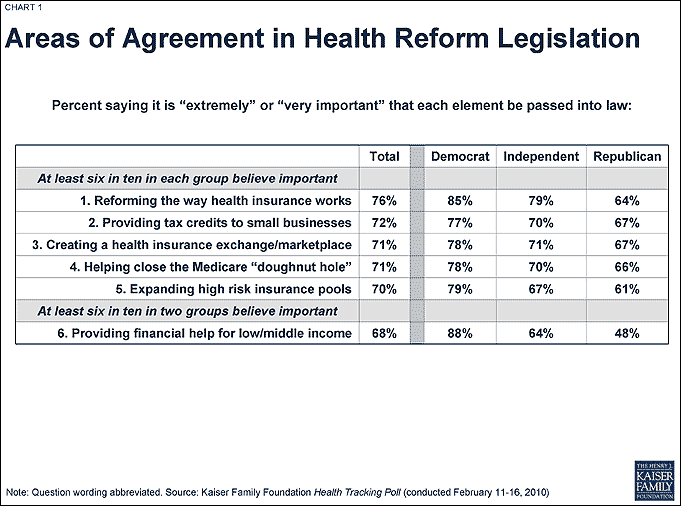
As Democratic and GOP lawmakers prepare for the upcoming health reform summit, the February Kaiser Health Tracking Poll finds that at least six of every ten Republicans, Democrats and independents back at least some of the key provisions in the reform bills that have passed the House and Senate.  They include measures that would: reform the way health insurance works, such as preventing insurers from excluding people because of pre-existing conditions; offer tax credits to small businesses to help their workers get coverage; create a new health insurance marketplace; help close the Medicare “doughnut hole” so that seniors would no longer face a period of having to pay the full cost of their medicines; and expand high-risk insurance pools for individuals who cannot get coverage elsewhere.  Providing subsidies to lower and middle income people also received strong support from Democrats and independents and near majority support from Republicans.

“While the intense debate over health care reform has divided the public, it looks like there is  bipartisan support on at least some elements of health reform legislation, and more bipartisan support outside the beltway than there is inside,” said Kaiser President and CEO Drew Altman.

areas of agreement in health reform legislation


Along with these areas of agreement were differences of opinion that broke along party lines. Expanding Medicaid received majority support from Democrats and independents, but was deemed important to pass into law by a much smaller share of Republicans, 34 percent. On the other hand, limiting malpractice lawsuit payments ranked second among priorities for Republicans, but barely cracked the top 10 for Democrats and independents.

More and Less Popular Provisions

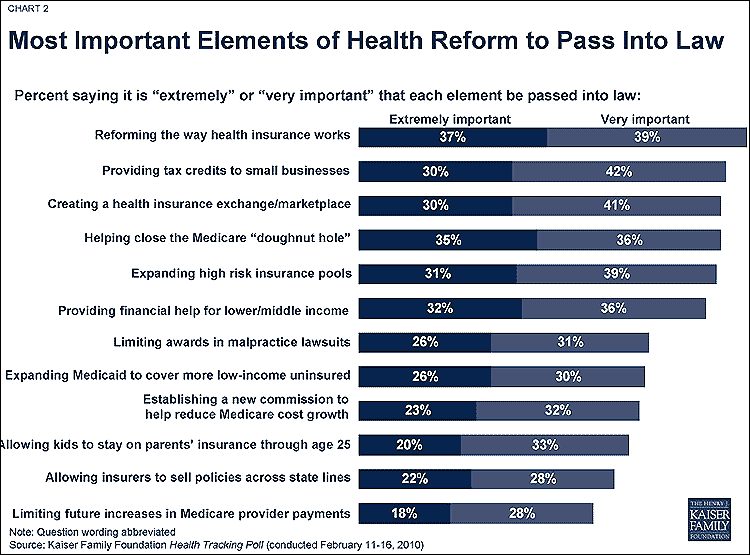
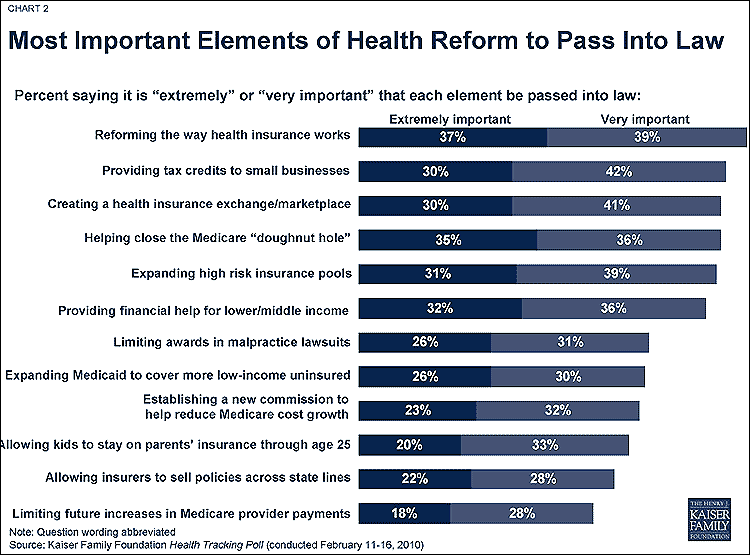
Given a list of various elements of health care reform, more than two-thirds of the public overall said it was either “extremely” or “very important” that these changes be passed into law:  reforming the way health insurance works ( 76%), providing tax credits to small businesses (72%), creating a health insurance exchange (71%), helping close the Medicare “doughnut hole” (71%), expanding high-risk insurance pools (70%), and providing financial help for lower- and middle-income people (68%). At the bottom of the list, though still receiving significant levels of support, were measures to allow insurers to sell policies across state lines (50%) or to limit future increases in Medicare provider payments (46%).

most important elements of health reform to pass into law


The February Tracking Poll did not examine public opinion on the full range of measures to finance health reform or the public option; subjects which have been addressed comprehensively in previous tracking polls.

All Sides Point to Politics as the Reason for the Delay in Passing Health Reform

Most Americans attribute the delays in passing health care reform to political gamesmanship, with 59 percent saying the delays are “more about both sides playing politics” and 25 percent saying they are “more about Republicans and Democrats having disagreements.”  This sentiment runs the political gamut, with 61 percent of Democrats, 62 percent of independents and 53 percent of Republicans fingering political considerations as the primary reason for the delays.

The large majority of Democrats reported feeling frustration and disappointment about the legislation being stalled, as did a narrow majority of independents.  Most Republicans reported feeling “relieved.”

Moving Forward from Here

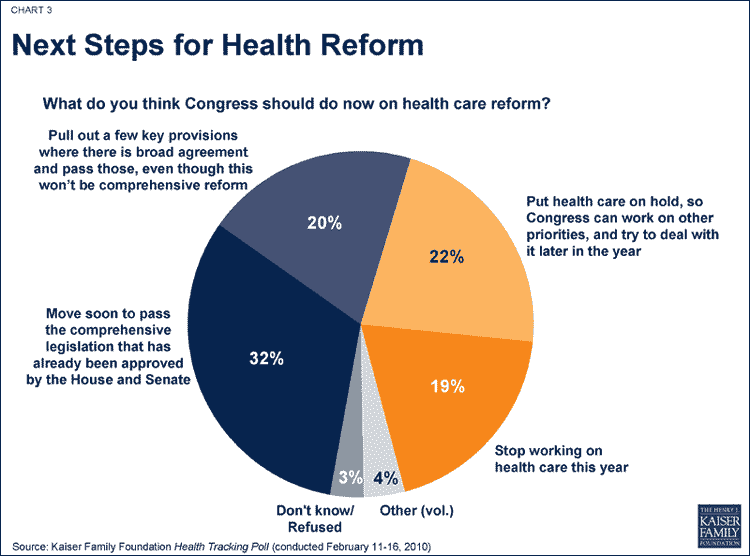
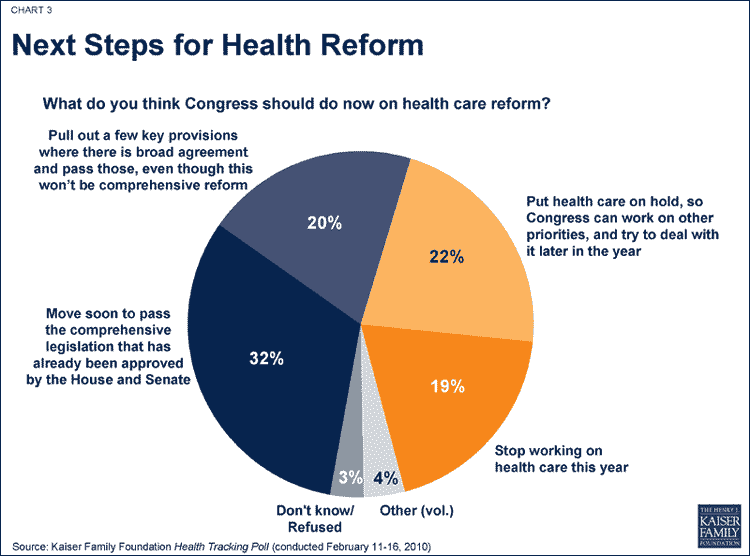
The poll shows that after a long and intense debate, the public has mixed views about how quickly and how comprehensively to move on reform, but relatively few hope the matter is dropped altogether.  Overall, 32 percent hope Congress will send some version of the House and Senate’s comprehensive overhaul legislation to the president, and another 20 percent support pulling out some key provisions on which there is broad agreement and just passing those.  Another 22 percent would rather Congress put health care on hold and deal with other priorities.  And a similar percentage (19%) would like to pull the plug on health care reform for 2010.

hr022210chart3_lg


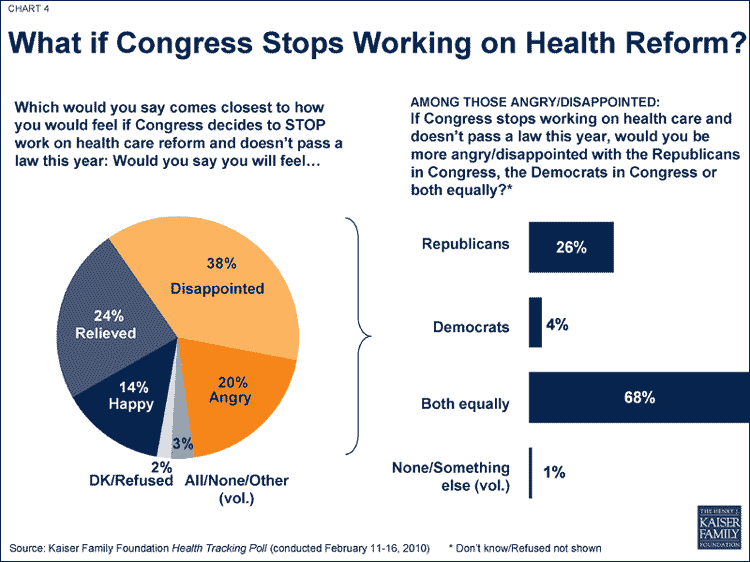
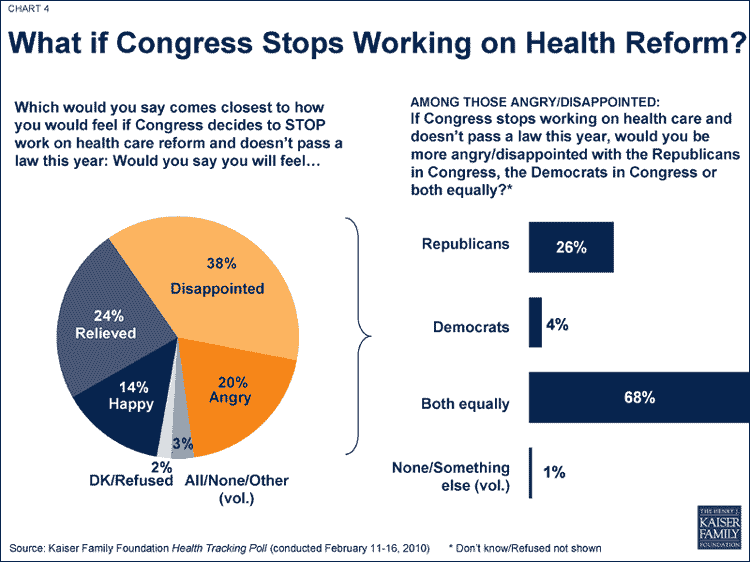
When all is said and done, 58 percent of Americans say they will be either disappointed or angry if Congress decides to stop working on health care reform.  Thirty-eight percent say they expect to feel happy or relieved.  The numbers are roughly reversed when the public is asked how they will feel if Congress passes reform, with 54 percent naming a positive emotion and 38 percent a negative one.

hr022210chart4_lg


The survey was designed and analyzed by public opinion researchers at the Kaiser Family Foundation and was conducted February 11 through February 16, 2010, among a nationally representative random sample of 1,201 adults ages 18 and older.  Telephone interviews conducted by landline (800) and cell phone (401, including 192 who had no landline telephone) were carried out in English and Spanish.  The margin of sampling error for the total sample is plus or minus 3 percentage points.  For results based on subgroups, the margin of sampling error is higher.

The full question wording, results, charts and a brief on the poll can be viewed online athttp://www.kff.org/kaiserpolls/8051.cfm .

The Kaiser Family Foundation is a non-profit private operating foundation, based in Menlo Park, California, dedicated to producing and communicating the best possible information and analysis on health issues.

Poll Finding

Americans Remain Split On Stalled Health Care Legislation, but Some Provisions Popular Among Majorities of Democrats, Independents and Republicans

Published: Feb 22, 2010

Embargoed for release until:February 23, 2010

For further information contact:Rakesh Singh, (650) 854-9400, RSingh@kff.orgChris Lee (202) 347-5270, CLee@kff.org

Americans Remain Split On Stalled Health Care Legislation, but Some Provisions Popular Among Majorities of Democrats, Independents and Republicans

Most See Delays As Driven By Politics Rather Than Policy

MENLO PARK, CA – The latest Kaiser Tracking Poll finds the public still split on health care reform legislation, with 43 percent in favor and 43 percent opposed.However, the poll also finds that majorities of Americans of all political leanings support several provisions in the health reform proposals in Congress and most attribute delays in passing the legislation to political gamesmanship rather than policy disagreements.

As Democratic and GOP lawmakers prepare for the upcoming health reform summit, the February Kaiser Health Tracking Poll finds that at least six of every ten Republicans, Democrats and independents back at least some of the key provisions in the reform bills that have passed the House and Senate. They include measures that would: reform the way health insurance works, such as preventing insurers from excluding people because of pre-existing conditions; offer tax credits to small businesses to help their workers get coverage; create a new health insurance marketplace; help close the Medicare “doughnut hole” so that seniors would no longer face a period of having to pay the full cost of their medicines; and expand high-risk insurance pools for individuals who cannot get coverage elsewhere.Providing subsidies to lower and middle income people also received strong support from Democrats and independents and near majority support from Republicans.

“While the intense debate over health care reform has divided the public, it looks like there isbipartisan support on at least some elements of health reform legislation, and more bipartisan support outside the beltway than there is inside,” said Kaiser President and CEO Drew Altman.

hr022210chart1_lg.gif

Along with these areas of agreement were differences of opinion that broke along party lines. Expanding Medicaid received majority support from Democrats and independents, but was deemed important to pass into law by a much smaller share of Republicans, 34 percent. On the other hand, limiting malpractice lawsuit payments ranked second among priorities for Republicans, but barely cracked the top 10 for Democrats and independents.

More and Less Popular Provisions

Given a list of various elements of health care reform, more than two-thirds of the public overall said it was either “extremely” or “very important” that these changes be passed into law:reforming the way health insurance works ( 76%), providing tax credits to small businesses (72%), creating a health insurance exchange (71%), helping close the Medicare “doughnut hole” (71%), expanding high-risk insurance pools (70%), and providing financial help for lower- and middle-income people (68%). At the bottom of the list, though still receiving significant levels of support, were measures to allow insurers to sell policies across state lines (50%) or to limit future increases in Medicare provider payments (46%).

hr022210chart2_lg.gif

The February Tracking Poll did not examine public opinion on the full range of measures to finance health reform or the public option; subjects which have been addressed comprehensively in previous tracking polls.

All Sides Point to Politics as the Reason for the Delay in Passing Health Reform

Most Americans attribute the delays in passing health care reform to political gamesmanship, with 59 percent saying the delays are “more about both sides playing politics” and 25 percent saying they are “more about Republicans and Democrats having disagreements.” This sentiment runs the political gamut, with 61 percent of Democrats, 62 percent of independents and 53 percent of Republicans fingering political considerations as the primary reason for the delays.

The large majority of Democrats reported feeling frustration and disappointment about the legislation being stalled, as did a narrow majority of independents. Most Republicans reported feeling “relieved.”

Moving Forward from Here

The poll shows that after a long and intense debate, the public has mixed views about how quickly and how comprehensively to move on reform, but relatively few hope the matter is dropped altogether. Overall, 32 percent hope Congress will send some version of the House and Senate’s comprehensive overhaul legislation to the president, and another 20 percent support pulling out some key provisions on which there is broad agreement and just passing those. Another 22 percent would rather Congress put health care on hold and deal with other priorities. And a similar percentage (19%) would like to pull the plug on health care reform for 2010.

hr022210chart3_lg.gif

When all is said and done, 58 percent of Americans say they will be either disappointed or angry if Congress decides to stop working on health care reform. Thirty-eight percent say they expect to feel happy or relieved. The numbers are roughly reversed when the public is asked how they will feel if Congress passes reform, with 54 percent naming a positive emotion and 38 percent a negative one.

hr022210chart4_lg.gif

The survey was designed and analyzed by public opinion researchers at the Kaiser Family Foundation and was conducted February 11 through February 16, 2010, among a nationally representative random sample of 1,201 adults ages 18 and older. Telephone interviews conducted by land-line (800) and cell phone (401, including 192 who had no land-line telephone) were carried out in English and Spanish. The margin of sampling error for the total sample is plus or minus 3 percentage points. For results based on subgroups, the margin of sampling error is higher.

The full question wording, results, charts and a brief on the poll can be viewed online at here.

Resources Examine Medicaid Enrollment Growth And State Budget Pressures

Published: Feb 18, 2010

This package of resources examines the substantial enrollment growth in Medicaid between June 2008 and June 2009 and provides a mid fiscal-year 2010 update on key state Medicaid issues, including the impacts of the economic downturn.

icon_releases.gif

News ReleaseWith the country in a deep recession, nearly 3.3 million more people were enrolled in state Medicaid programs in June 2009 compared to the previous June, according to a new analysis, Medicaid Enrollment: June 2009 Data Snapshot (updated for 2011).

It was the first time since the early 1990s that every state experienced an increase in Medicaid enrollment, and in 32 states enrollment grew at least twice as fast as the year before, according to the analysis, which includes data breakouts by state.

The increase in enrollment reflects the role that Medicaid plays in reducing the numbers of people who become uninsured when the economy falters, with many people turning to the program for help after being laid off and losing their employer-based health insurance. Millions more who were not eligible for Medicaid likely joined the ranks of the nation’s uninsured.

A companion report, Medicaid’s Continuing Crunch in a Recession: A Mid-Year Update for State FY 2010 and Preview for FY 2011, finds that 44 states are experiencing higher than expected Medicaid enrollment and spending, prompting many to consider program cuts. Enhanced federal matching money for Medicaid provided through the federal stimulus law is set to expire on Dec. 31, 2010, further complicating state budgets.

An updated fact sheet, State Fiscal Conditions and Medicaid, summarizes the relationship of Medicaid with state budgets and discusses the current fiscal situation in the states and how it is affecting Medicaid programs.Medicaid Enrollment: June 2009 Data Snapshot

Medicaid’s Continuing Crunch in a Recession: A Mid-Year Update for State FY 2010 and Preview for FY 2011

Updated Fact Sheet: State Fiscal Conditions and Medicaid

News Release

Kaiser Analysis Finds Record Medicaid Enrollment Growth in 2009

Published: Feb 18, 2010

Largest Ever One-Year Increase Illustrates Medicaid’s Role In Covering People During Economic Downturns But Further Strains Tight State Budgets

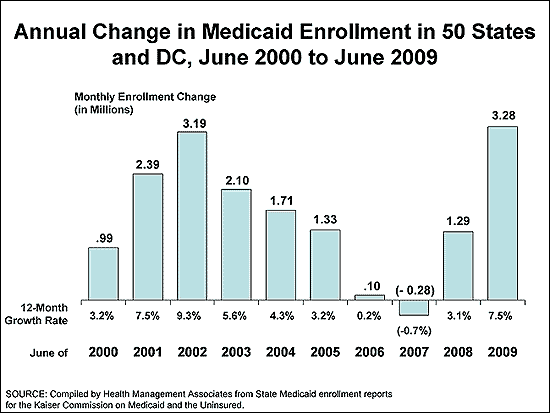
WASHINGTON, D.C.  – With the country mired in a deep recession, nearly 3.3 million more people were enrolled in state Medicaid programs in June 2009 compared to the previous June, according to a new analysis by the Kaiser Family Foundation’s Commission on Medicaid and the Uninsured.  It was the biggest ever one-year increase in terms of absolute numbers, and boosted the June monthly Medicaid enrollment by 7.5 percent to 46.9 million people.

It was the first time since the early 1990s that every state experienced an increase in Medicaid enrollment, and in 32 states enrollment grew at least twice as fast as the year before, according to the analysis, which includes data breakouts by state.

The increase in enrollment reflects the role that Medicaid plays in reducing the numbers of people who become uninsured when the economy falters, with many people turning to the program for help after being laid off and losing their employer-based health insurance.  Millions more who were not eligible for Medicaid likely joined the ranks of the nation’s uninsured.

“State Medicaid programs have been able to help millions of Americans who have nowhere else to turn in a recession,” said Diane Rowland, Executive Vice President of the Foundation and Executive Director of KCMU.  “But the states obviously face significant fiscal pressures as increases in enrollment push up costs at a time when state budgets are already severely constrained.”

A new Kaiser survey of state Medicaid directors finds that 44 states and the District of Columbia are experiencing higher than expected program enrollment, resulting in increased spending for fiscal year 2010.  At least 29 states say they are considering additional mid-year cuts in provider rates and program benefits.

Enhanced federal matching money for Medicaid provided through the American Recovery and Reinvestment Act of 2009 has proved critical in helping states maintain coverage.  But that money is scheduled to expire on Dec. 31, 2010, which will increase the strain on state fiscal year 2011 budgets, Medicaid directors reported.

021810_kcmu


Although Medicaid enrollment is on the rise, costs of the program as measured on a per-person basis are not climbing at a faster rate than health costs more generally. (See “An Actuarial Rorschach Test”). Moreover, in past recessions, after the economy has improved, Medicaid enrollment growth has slowed and sometimes contracted, suggesting that the record rate of enrollment growth seen in 2009 will eventually subside.

The enrollment analysis is part of a package of resources released today in advance of a joint Kaiser Commission on Medicaid and the Uninsured (KCMU)-Alliance for Health Reform briefing on state budgets, Medicaid and the economy on Feb. 22.

The Kaiser Family Foundation is a non-profit private operating foundation, based in Menlo Park, California, dedicated to producing and communicating the best possible information, research and analysis on health issues.

The Kaiser Commission on Medicaid and the Uninsured provides information and analysis on health care coverage and access for the low-income population, with a special focus on Medicaid’s role and coverage of the uninsured. Begun in 1991 and based in the Kaiser Family Foundation’s Washington, D.C. office, the Commission is the largest operating program of the Foundation. The Commission’s work is conducted by Foundation staff under the guidance of a bipartisan group of national leaders and experts in health care and public policy.