The Massachusetts Health Care Landscape
This fact sheet summarizes the Massachusetts health care landscape, including data on demographics, population health, the uninsured and the state Medicaid program.
Fact Sheet (.pdf)
The independent source for health policy research, polling, and news.
This fact sheet summarizes the Massachusetts health care landscape, including data on demographics, population health, the uninsured and the state Medicaid program.
Fact Sheet (.pdf)
In 2006, then-Gov. Mitt Romney signed Massachusetts’ comprehensive health reform designed to provide near-universal health insurance coverage for state residents. Building on a long history of health reform efforts, the state embarked on an ambitious plan to promote shared individual, employer, and government responsibility.
This brief examines Massachusetts’ experience with coverage and access to care over the last six years, as well as the state’s ongoing efforts to deal with persistent high health-care costs. The brief also compares Massachusetts health reform with the national reforms included in the Affordable Care Act (ACA) signed into law by President Obama in 2010.
Issue Brief (.pdf)
This brief summarizes and examines the implications of recent Section 1115 Medicaid waiver activity. Section 1115 waivers provide states flexibility to test new approaches in Medicaid that differ from federal program rules and can have significant impacts for beneficiaries, providers, and states. While recent waivers and waiver proposals vary in their specific goals and approaches, some key themes are emerging, including using Section 1115 waiver authority to get a jump start on the 2014 Medicaid expansion and to restructure delivery and payment systems, particularly for high-need individuals.
Brief (.pdf)
NEWS RELEASEMay 24, 2012
WASHINGTON, D.C. – The Henry J. Kaiser Family Foundation has elected 15 individuals as the 2012 Barbara Jordan Health Policy Scholars. These Scholars will have the opportunity to learn first-hand about health policy and the policymaking process during 11 weeks in Washington, DC, working in Congressional offices, participating in seminars and site visits organized by the Foundation, and completing a health policy analysis project.
The Foundation established the Barbara Jordan Scholars Program in memory of former U.S. Congresswoman Barbara Jordan — the first African American woman elected to Congress from Texas and a member of the Foundation’s board of trustees when the modern day Kaiser Family Foundation was established in the early 1990s.
“The Barbara Jordan Health Policy Scholars Program helps today’s promising students become tomorrow’s health policy leaders,” said Foundation President and CEO Drew Altman. “This program honors Barbara’s legacy by providing real-world opportunities in public service for these outstanding Scholars.”
The program introduces rising college seniors and recent graduates with an interest in issues affecting racial and ethnic minorities and underserved communities to the federal legislative process and current issues in health policy. In addition to working on Capitol Hill, Scholars will have the opportunity to participate in seminars and site visits organized by the Foundation to broaden their knowledge of health care issues. Under the guidance of the Foundation’s staff, the Scholars will also write and present a policy memo that provides an in-depth analysis of a health care issue.
This year’s Scholars were chosen from about 200 applicants. The program operates in partnership with Howard University, which provides administrative support and houses the scholars in D.C.
More information about the Barbara Jordan Health Policy Scholars Program is available online.
The 15 Barbara Jordan Health Policy Scholars for 2012 are:
Mr. Robiel AbrahaHometown: Houston, TexasSchool: University of Texas, AustinMajor: SociologyPlacement: Rep. Sheila Jackson Lee
Ms. Maria AbricaHometown:Watsonville, CaliforniaSchool: University of California, LAMajor: SociologyPlacement: Rep. Karen Bass
Ms. Huda AdemHometown: Tracy, CaliforniaSchool: University of California, BerkeleyMajor:Int’l Health & DevelopmentPlacement: Rep. John Lewis
Ms. Brittany BrathwaiteHometown:Brooklyn, New YorkSchool: Syracuse UniversityMajor:Women and Gender StudiesPlacement: Rep. Edolphus Towns
Ms. Jessica BroadusHometown: Marietta, GeorgiaSchool: U. North Carolina, Chapel HillMajor: Health Policy ManagementPlacement: Sen. Olympia Snowe
Ms. Lovelee BrownHometown:Roseville, CaliforniaSchool: Stanford UniversityMajor:AnthropologyPlacement: Rep. Barbara Lee
Mr. James CalderwoodHometown:Chevy Chase, MarylandSchool: University of PennsylvaniaMajor:Nursing and Health Care MgmtPlacement: Sen. Tom Udall
Mr. Brandon IbarraHometown:Blackfoot, IdahoSchool: Seattle UniversityMajor:NursingPlacement: Rep. Joe Baca
Ms. Noereem MenaHometown:Providence, Rhode IslandSchool: University of Rhode IslandMajor:Nutrition and DieteticsPlacement: Rep. Joseph Crowley
Ms. Natasha MurphyHometown:Harlem, New YorkSchool: Howard UniversityMajor:Health Management SciencesPlacement: Rep. Charles Rangel
Mr. Bryan RodriguezHometown:Dorchester, MassachusettsSchool: Tufts UniversityMajor:International RelationsPlacement: Senate HELP Committee(Sen. Harkin)
Mr. Edward SmithHometown:Hampton, VirginiaSchool: University of VirginiaMajor:Government and Foreign AffairsPlacement: Rep. Bobby Scott
Ms. Whitney TuckerHometown:Elgin, South CarolinaSchool: Vanderbilt UniversityMajor:Public Policy StudiesPlacement: Rep. Jesse Jackson, Jr.
Ms. Mai VangHometown:Brooklyn Park, MinnesotaSchool: Minnesota State University, MankatoMajor:Community Health SciencePlacement: Rep. Keith Ellison
Mr. Trenton WhiteHometown:Hahira, GeorgiaSchool: Mercer UniversityMajor:Int’l Health and DevelopmentPlacement: Rep. Eleanor Holmes Norton
The Kaiser Family Foundation, a leader in health policy analysis, health journalism and communication, is dedicated to filling the need for trusted, independent information on the major health issues facing our nation and its people. The Foundation is a non-profit private operating foundation, based in Menlo Park, California.
Publish Date: 2012-05-24
This article explores the current state of the U.S. Global Health Initiative (GHI). The GHI, announced by President Obama shortly after taking office, represents the bulk of the U.S. global health budget for activities in more than 80 countries. It examines the successes and challenges experienced by the GHI in the three years since it was announced, including issues with its funding and leadership structure, as well as difficulties posed by the global economic crisis.
Authored by the Foundation’s Jennifer Kates and Joshua Michaud, the piece was published as a commentary in the May 26, 2012 issue of The Lancet.
The Kaiser Family Foundation 2012 Survey of Americans on the U.S. Role in Global Health is the fourth in a series of surveys designed, conducted, and analyzed by the Kaiser Family Foundation in order to shed light on the American public’s perceptions, knowledge, and attitudes about the role of the United States in efforts to improve health for people in developing countries. The Foundation’s first major survey on this topic was conducted in early 2009, and updates were released in the fall of 2009 and in 2010. This latest survey updates trends from Kaiser’s previous work, and explores in greater detail what the public thinks about the U.S. role in the world, perceptions of spending on foreign aid in general and global health in particular, and the extent to which information may change opinions. We also explore new questions in this survey about how the public views U.S. support for global health compared with that of other donor nations, and perceptions about the potential effects of decreased U.S. funding.
Overall, our survey finds a majority of the American public believes the U.S. has a major role to play in the world, though many remain confused about the size and composition of U.S. foreign assistance. We also find that providing people with accurate information has the potential to move opinion significantly. For example, when survey respondents are told that only about one percent of the federal budget is spent on foreign aid (far less than what most believe when asked to estimate an amount) opinion moves from a majority saying the current level of spending is too high to the public being most likely to say spending is currently too low. And as we’ve seen in the past, people are also more supportive of foreign aid spending when a specific purpose is mentioned—in this case, improving the health of people in developing countries—than they are of the idea of foreign aid in general. Our analysis also shows that even when controlling for other factors, those who possess more accurate knowledge about how much the U.S. spends on foreign aid are more likely to support an increase in U.S. spending on health in developing countries.
Improving health in developing countries is one of many priorities the public sees as important for the president and Congress to address in world affairs, though security concerns, such as limiting the spread of nuclear weapons and fighting terrorism, rise somewhat above other priorities. Within health, basic needs such as providing clean water and reducing hunger, along with improving children’s health, are seen as the top priorities, though every health issue asked about in the survey is seen as important by a large majority of the public.
As has been the case since we began tracking opinion on global health several years ago, most Americans feel that the current level of U.S. spending to improve health in developing countries is either too low or about right. When it comes to the level of U.S. spending, global health appears to be one area where there is more bipartisan consensus than others. For example, while modest partisan differences exist on some aspects of U.S. global health involvement, these differences are much smaller than we find on questions of domestic health care policy and spending. Although Democrats are more likely than Republicans to place a top priority on certain issues within global health, majorities across parties feel that the current level of U.S. spending on health in developing countries is either too low or about right. The lack of deeper partisan divisions may be related to the fact that Americans seem to view global health as a moral issue; while most recognize various potential benefits to the U.S., the top reason people give for the U.S. to engage in efforts to improve health in developing countries is because “it’s the right thing to do.”
However, the public’s support for spending comes with some important caveats. Economic conditions at home make people hesitant to increase spending abroad, with two-thirds saying that given the serious economic problems facing the country and the world right now, the U.S. cannot afford to increase spending on health in developing countries. The public also remains divided on whether more spending will make a meaningful difference in improving health, and is deeply skeptical about how much U.S. money actually reaches people on the ground. Currently, the average American believes that less than a quarter of every U.S. dollar spent on health in developing countries actually reaches those who need it, and that nearly 50 cents of each dollar is lost through corruption.
Most Americans feel that the U.S. is already doing its fair share or more compared to other donor countries, and perhaps related to this, the public prefers multilateral approaches to aid and strongly supports giving through international organizations like the Global Fund to Fight AIDS, Tuberculosis and Malaria, the United Nations, and the World Health Organization. Still, most recognize the important role the U.S. plays, and majorities feel that if the president and Congress were to decrease spending on foreign assistance, there would be an increase in illness and death in developing countries, and that other wealthier countries would not step in to fill the gap. More broadly, the public sees lack of money and resources as a bigger barrier to improving health compared with lack of knowledge about how to treat health conditions in developing countries.
An ongoing challenge for those looking to increase the public’s level of interest in and support for U.S. global health efforts is grabbing the public’s attention in a competitive news environment. Since 2010, the share of the public saying they have heard any information about U.S. involvement in global health issues, as well as reported attention to health in developing countries generally, have both declined. In an election year and one in which the news continues to be dominated by domestic economic problems, garnering public attention for international health issues is likely to continue to be a struggle. One bright spot is that the public expresses at least some appetite for more coverage of these issues, with just over half saying the news media spends too little time covering health in developing countries, up from four in ten in 2010.
A solid majority of the public (60 percent) want the U.S. to play at least a “major” role in world affairs, but just 17 percent want the U.S. to play the “leading” role. Fewer than four in ten would prefer to see our country play only a minor role (26 percent) or no role at all (11 percent) in solving international problems.
| Figure 1: What Role Should the U.S. Play in Trying to Solve International Problems? | |
| Percent who say the U.S. should take… | |
| The leading role in world affairs | 17% |
| A major role, but not the leading role | 43 |
| A minor role | 26 |
| No role at all in world affairs | 11 |
| Don’t know/Refused | 3 |
Previous Kaiser surveys have documented the public’s level of misunderstanding when it comes to the amount the U.S. spends on foreign aid. The 2012 survey again finds that the vast majority of the public overestimates the size of the federal budget that is spent on foreign aid, with just five percent correctly saying that foreign aid makes up one percent or less of the federal budget.1 A majority (57 percent) give answers above 10 percent, including 28 percent who think that foreign aid makes up more than 30 percent of the federal budget. On average, Americans answer that 27 percent of the federal budget is spent on foreign aid. In reality, this is closer to the amount spent on Medicare, Medicaid, and the Children’s Health Insurance Program, combined with the interest on the national debt.2
| Figure 2: Just Your Best Guess, What Percentage of the Federal Budget is Spent on Foreign Aid? | |
| 0-1% of the federal budget | 5% |
| 2-5% | 11 |
| 6-10% | 13 |
| 11-20% | 17 |
| 21-30% | 12 |
| 31-40% | 10 |
| 41-50% | 7 |
| 51% or more | 11 |
| Don’t know/Refused | 13 |
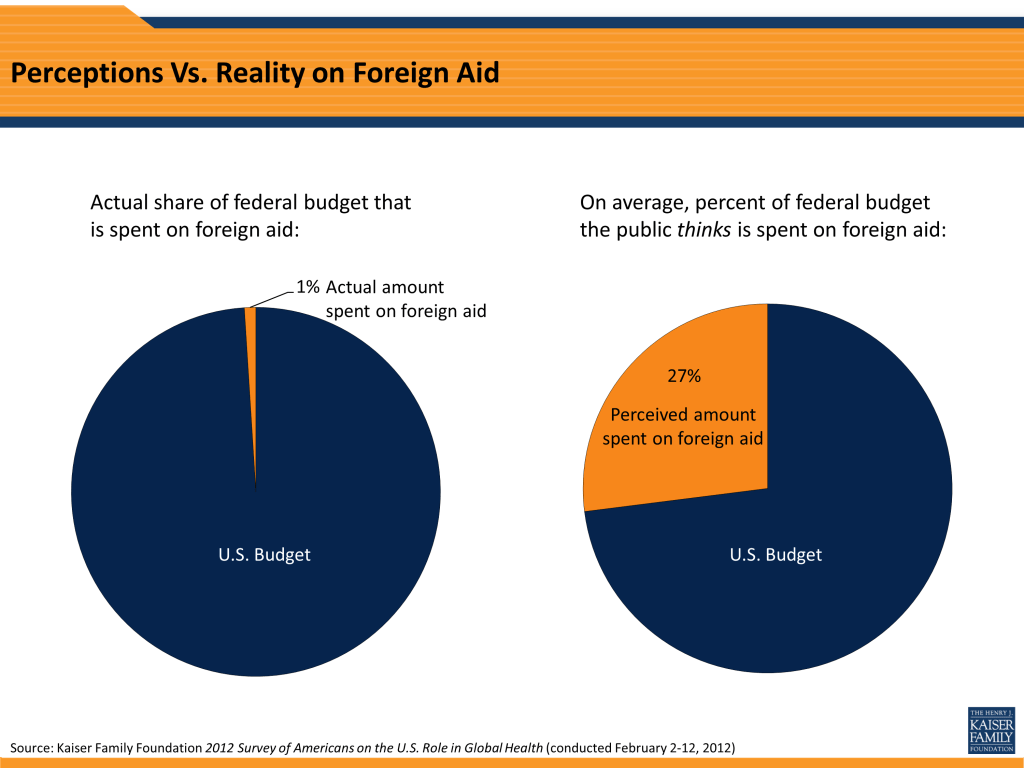
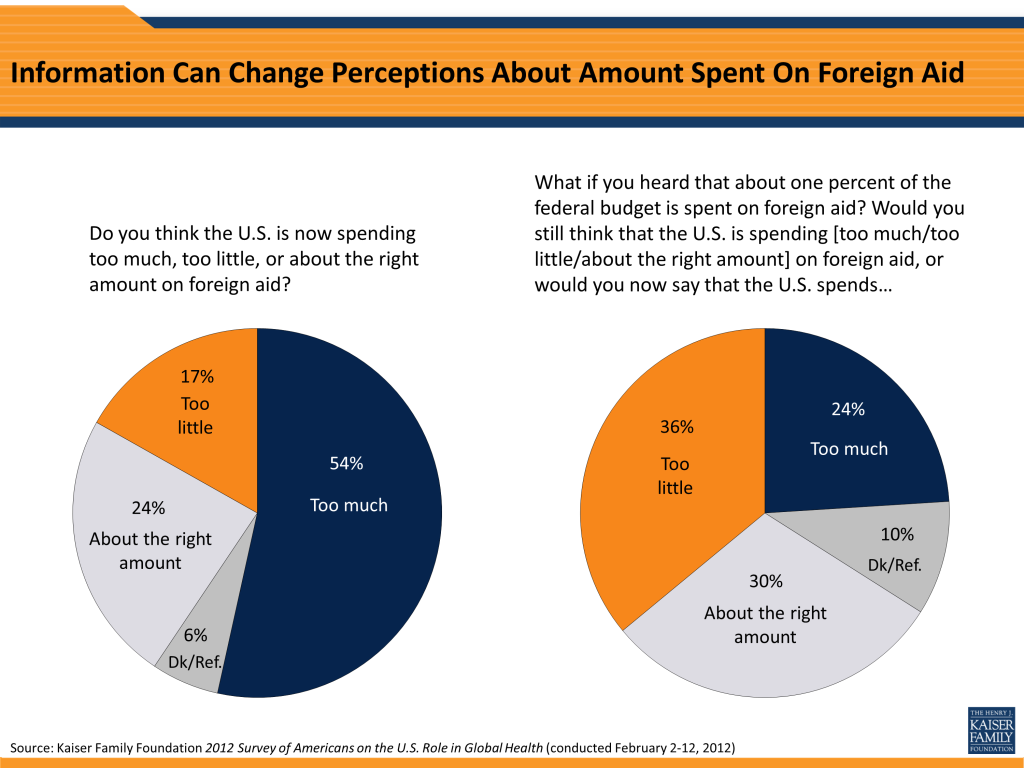
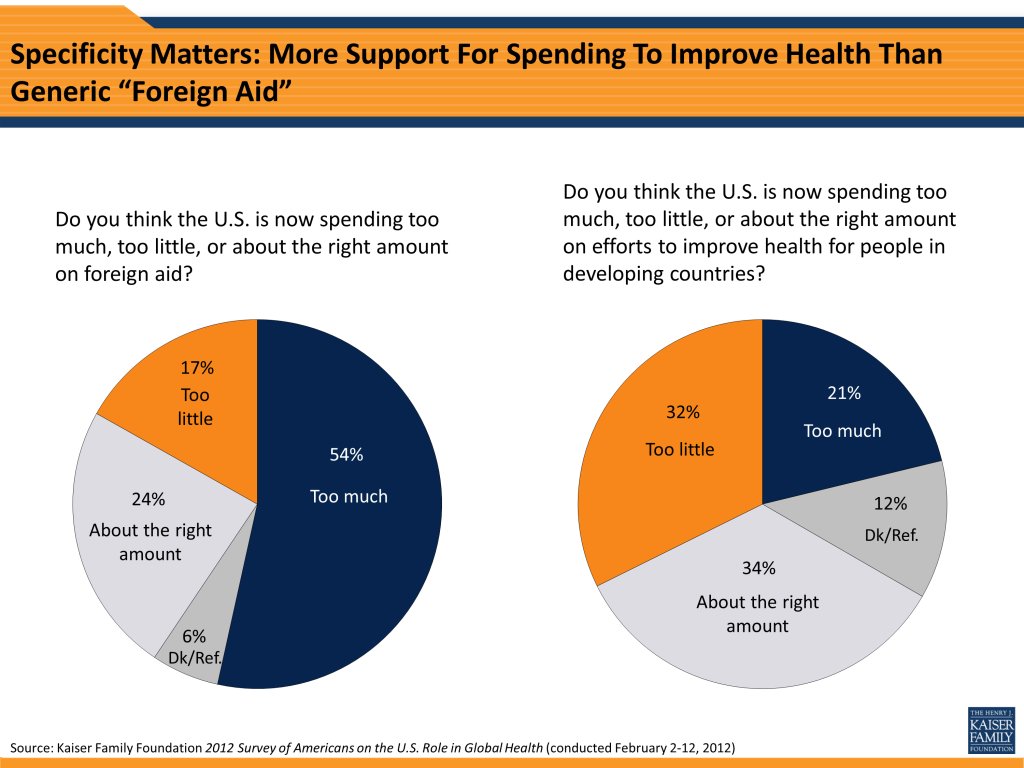
At the same time as they overestimate the amount of foreign aid spending, a majority of the public (54 percent) thinks the U.S. is now spending too much on foreign aid, and just 17 percent say we are spending too little, a finding that is consistent with previous Kaiser surveys. However, in this survey we took the additional step of giving respondents accurate information by telling them that about one percent of the federal budget is spent on foreign aid, and we found that this information has the potential to shift opinion dramatically. After hearing this information, the share saying the U.S. spends too little on foreign aid more than doubles, from 17 percent to 36 percent, while the share saying we spend too much drops in half, from 54 percent to 24 percent. Another three in ten think that one percent is about the right amount for the U.S. to be spending on foreign aid.3
Perceptions—and misperceptions—about the amount of foreign aid spending may also be related to the public’s beliefs about what this money is spent on. When asked to name in their own words the types of things U.S. foreign aid pays for, military support is near the top of the list, tied with health care at 21 percent, and just behind food (31 percent). Other common responses include diplomacy, basic needs such as clothing and shelter, disaster relief, and education. When the question is framed around U.S. spending “to help developing countries” rather than “foreign aid,” food remains at the top, but responses related to health care and education move further up the list, while fewer people mention military aid (10 percent).
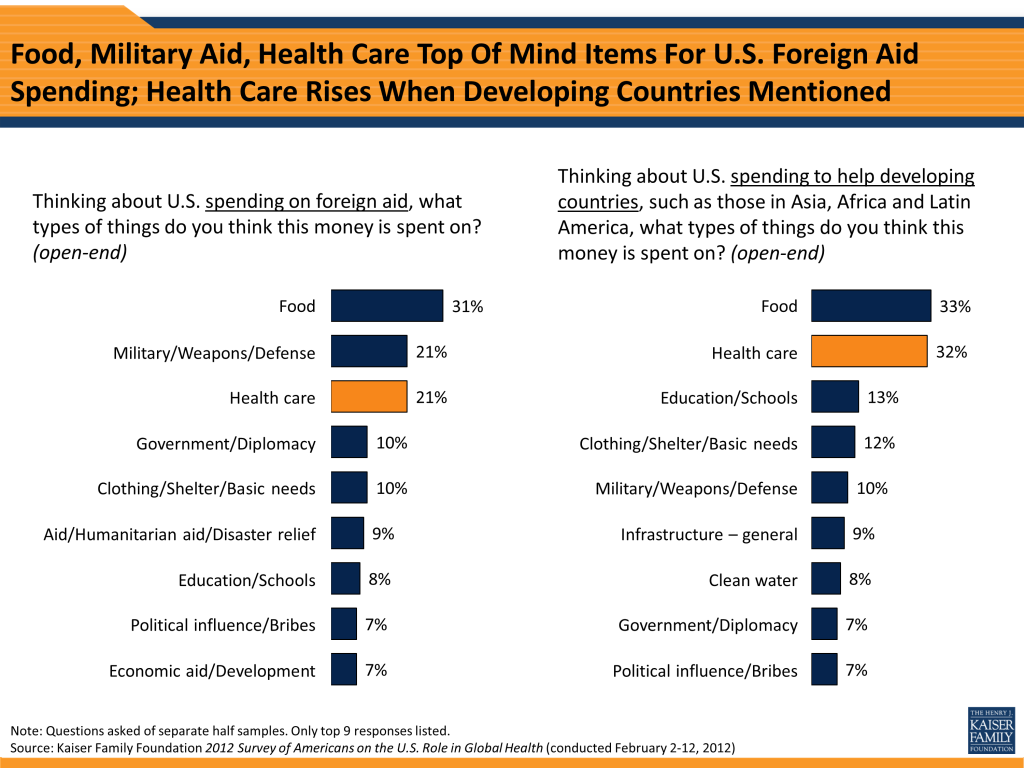
There is some evidence that these top-of-mind perceptions of how aid is spent are tied to people’s level of support for foreign aid spending. For example, those who think the U.S. spends too much on foreign aid are less likely to mention things like food and health care, and more likely to mention diplomacy and bribes/using money to gain political influence.
Framing also matters when it comes to how the spending question is asked. Kaiser surveys have consistently found that Americans are more likely to support U.S. spending for global health specifically than they are when asked about foreign aid in general. While most don’t possess accurate knowledge about the actual amount of U.S. spending, when asked their own perceptions, a majority of the public says the U.S. is now spending too little (32 percent) or about the right amount (34 percent) on efforts to improve health for people in developing countries, while about one in five (21 percent) say we are spending too much.
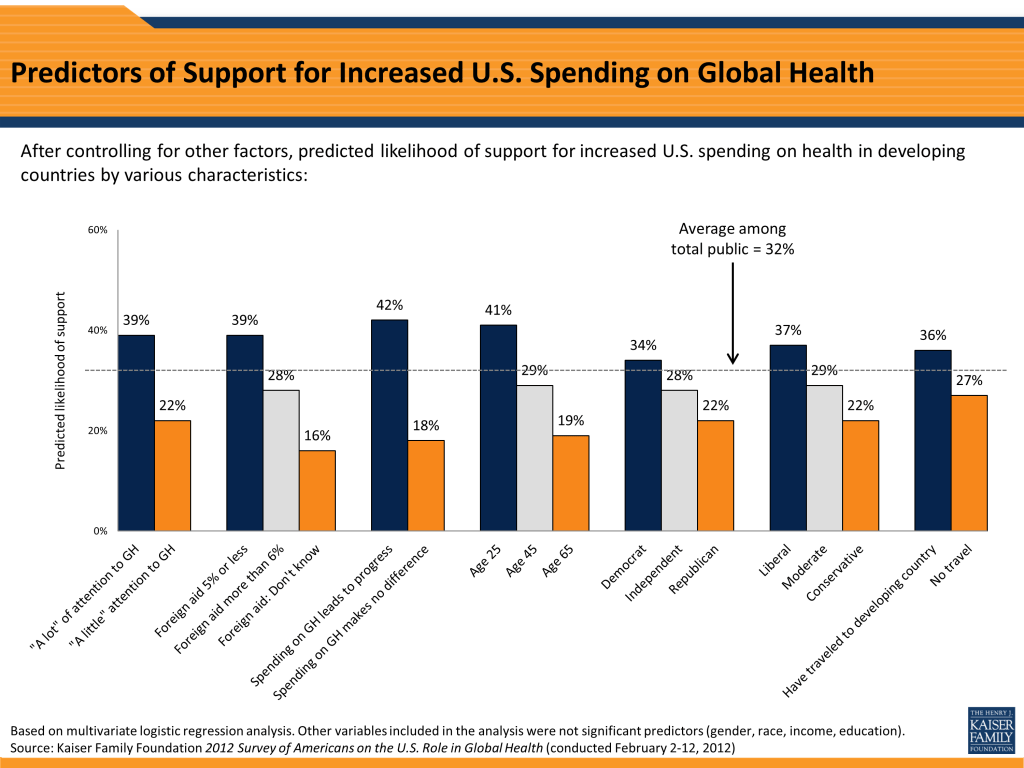
To address the question of which groups are most likely to support increased U.S. spending on improving health in developing countries, we analyzed which factors are associated with saying the U.S. currently spends “too little” on efforts to improve health in developing countries (32 percent of the public overall). We used multivariate logistic regression to look at the impact of demographic factors (gender, age, race/ethnicity, income, education, party identification, and ideology), as well as knowledge about foreign aid spending as a share of the federal budget, level of attention paid to global health issues, experience traveling to a developing country, and the belief that more spending will lead to meaningful progress.
After controlling for all these factors, we found that higher levels of attention to global health issues, more accurate knowledge about the share of the federal budget spent on foreign aid, and believing that more spending will lead to meaningful progress in improving health are all positively associated with support for increased U.S. spending on health in developing countries. To illustrate these differences, the chart below compares the predicted likelihood of support for increased spending for different groups, when all other factors are held constant. So, for example, the “average” person who pays a lot of attention to global health issues is almost twice as likely as the average person who pays just a little attention to support increased spending on global health (39 percent vs. 22 percent). Similarly, the average person who believes that more spending from the U.S. and other donor countries will lead to meaningful progress is more than twice as likely as the average person who thinks more spending won’t make a difference to support increased spending on global health (42 percent vs. 18 percent). And there is a similar difference between those with a more accurate perception of foreign aid spending and those with a less accurate perception. We also found several demographic factors to be positively associated with support for increased spending on global health, including younger age, identifying as a liberal or Democrat, and experience traveling to a developing country in the past five years.
This analysis reinforces another finding from this survey—that correcting misconceptions about foreign aid spending has the potential to change opinions. It also suggests that increasing the visibility of global health issues among the public, and convincing people of the effectiveness of such spending could be potentially successful strategies for those looking to gain broader support for U.S. global health efforts.
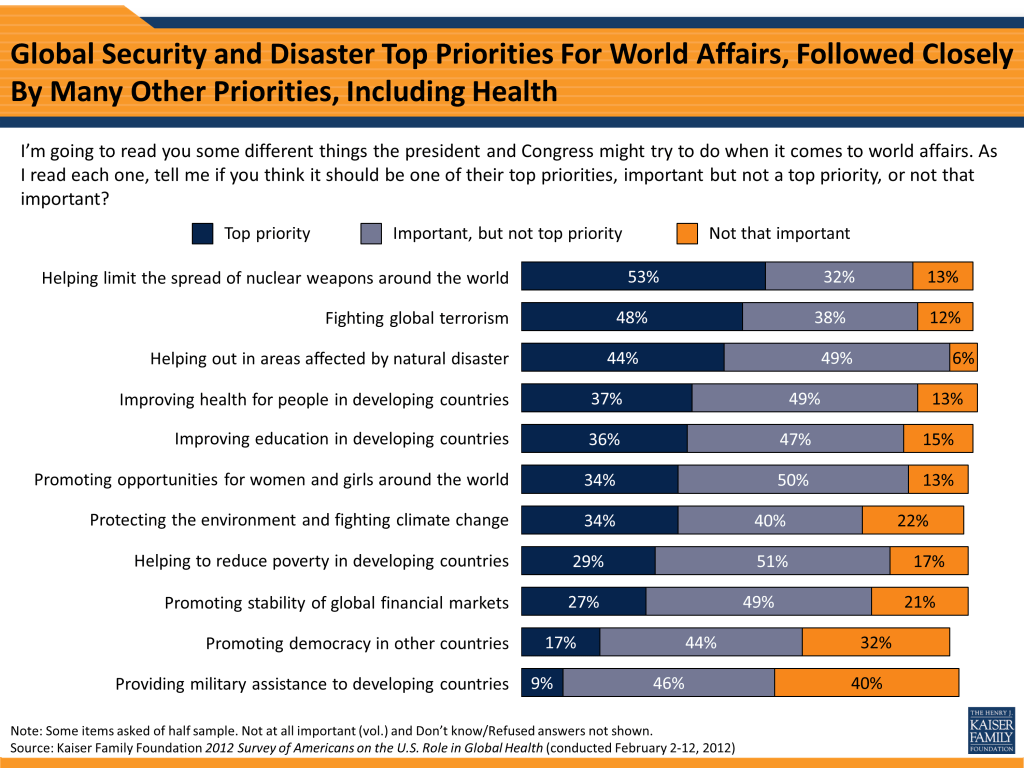
When it comes to different ways in which the U.S. might engage in world affairs, issues of safety and security, such as limiting the spread of nuclear weapons (53 percent) and fighting global terrorism (48 percent), top the public’s priority list, closely followed by disaster relief (44 percent). Following this is a cluster of issues seen as top priorities by more than a third of the public, including improving health in developing countries (37 percent), improving education (36 percent), promoting opportunities for women and girls (34 percent), and fighting climate change (34 percent). Almost three in ten place a top priority on reducing poverty in developing countries (29 percent) and promoting global financial stability (27 percent), while fewer prioritize promoting democracy (17 percent) and providing military assistance to developing countries (9 percent).
When asked about a variety of different priorities for U.S. efforts to improve health in developing countries, large majorities believe each area is important, and between a quarter and two-thirds say each should be “one of the top” priorities.

Highest on the list of those considered top priorities are popular causes such as improving access to clean water (67 percent), reducing hunger and malnutrition (58 percent), and children’s health, including vaccinations (58 percent). Several other areas are seen as top priorities by about four in ten Americans, including preventing and treating HIV/AIDS (43 percent), improving training and expanding the supply of medical professionals (40 percent), building and improving health care facilities (39 percent), combating global pandemic diseases like swine flu (38 percent), and reducing maternal deaths (37 percent). Somewhat lower on the list of top priorities (though still considered important by sizable majorities) are preventing and treating malaria (34 percent), improving access to family planning and other reproductive health services (33 percent), preventing and treating tuberculosis (32 percent), eradicating polio (28 percent), and preventing and treating chronic diseases (26 percent).
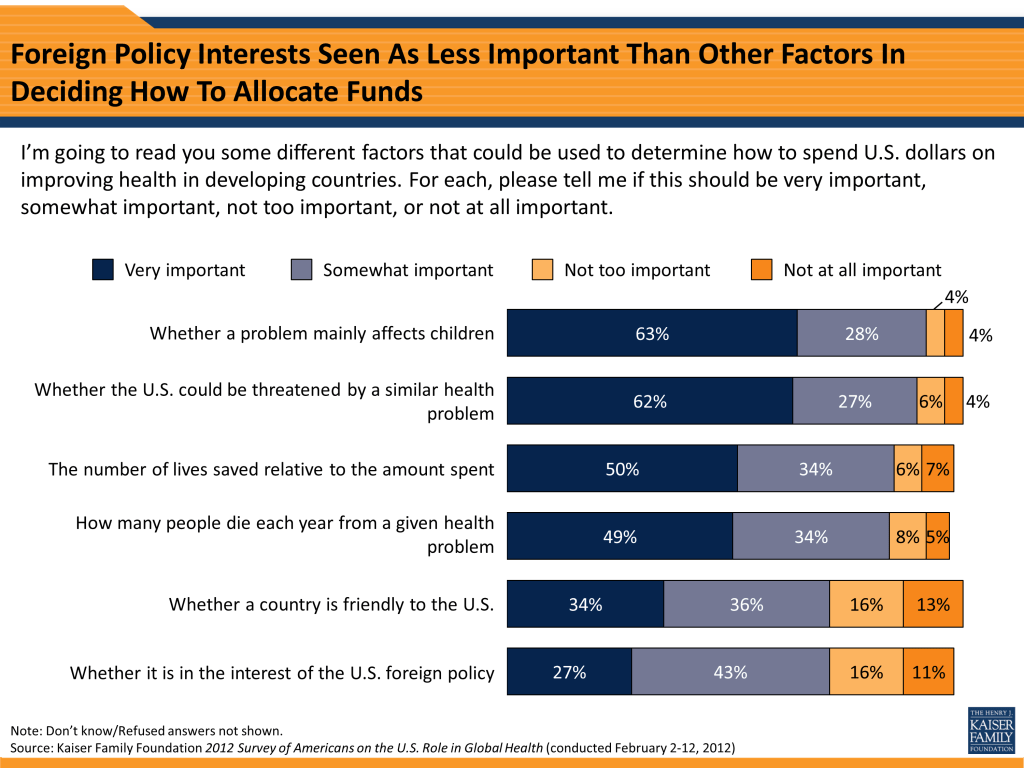
In terms of which criteria should be used to determine allocation of U.S. spending on health in developing countries, the public ranks two factors at the top of the list: whether a problem mainly affects children, and whether the U.S. could be threatened by a similar health problem (six in ten say each of these should be “very important” in determining how U.S. dollars are spent). Roughly half also say “the number of lives saved relative to the amount spent” and (50 percent) “how many people die each year from a given health problem” (49 percent) should be very important criteria. U.S. foreign policy concerns rank lower on the list, with about a third (34 percent) placing great importance on whether a country is friendly to the U.S., and just over a quarter (27 percent) saying the same about whether it is in the interest of U.S. foreign policy.
When it comes to the problems Americans perceive to be facing developing countries, hunger and lack of food top the list in an open-ended question (28 percent), followed by health and disease (15 percent), economic problems (12 percent), government corruption (12 percent), and poverty (11 percent). Hunger is also top-of-mind for many people when it comes to health specifically. When asked to name the most urgent health problems facing developing countries, HIV/AIDS (28 percent) and hunger/malnutrition (26 percent) are at the top of the list, followed by access to health care (14 percent), clean drinking water (12 percent), and obesity/lack of good nutrition (12 percent).
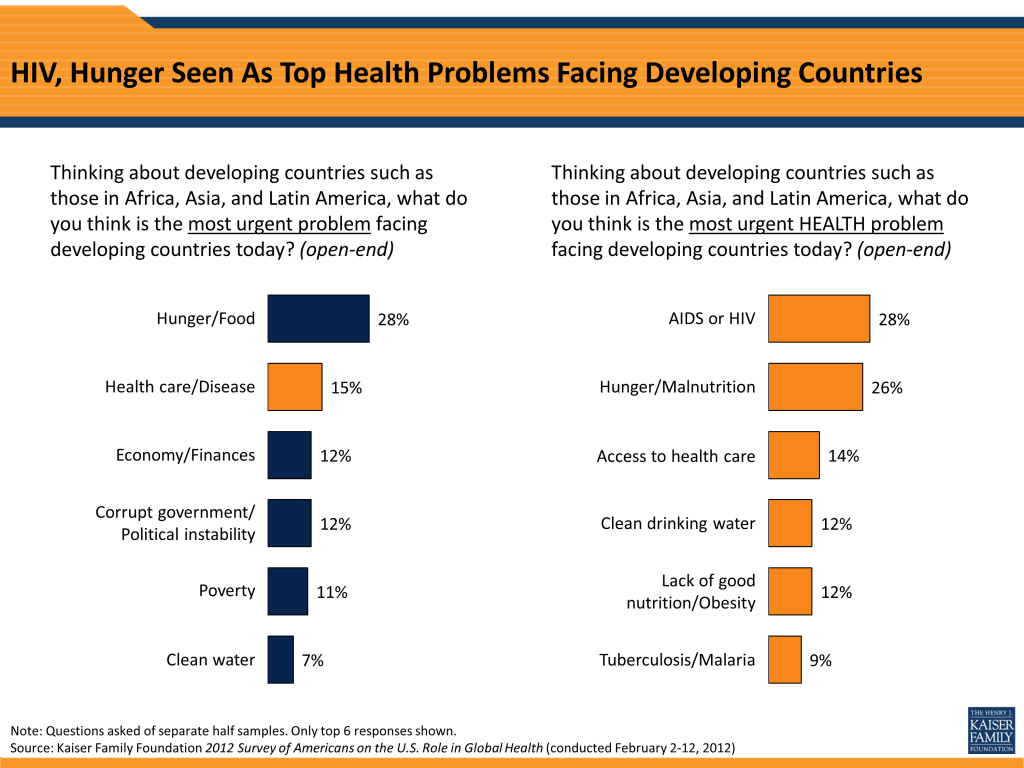
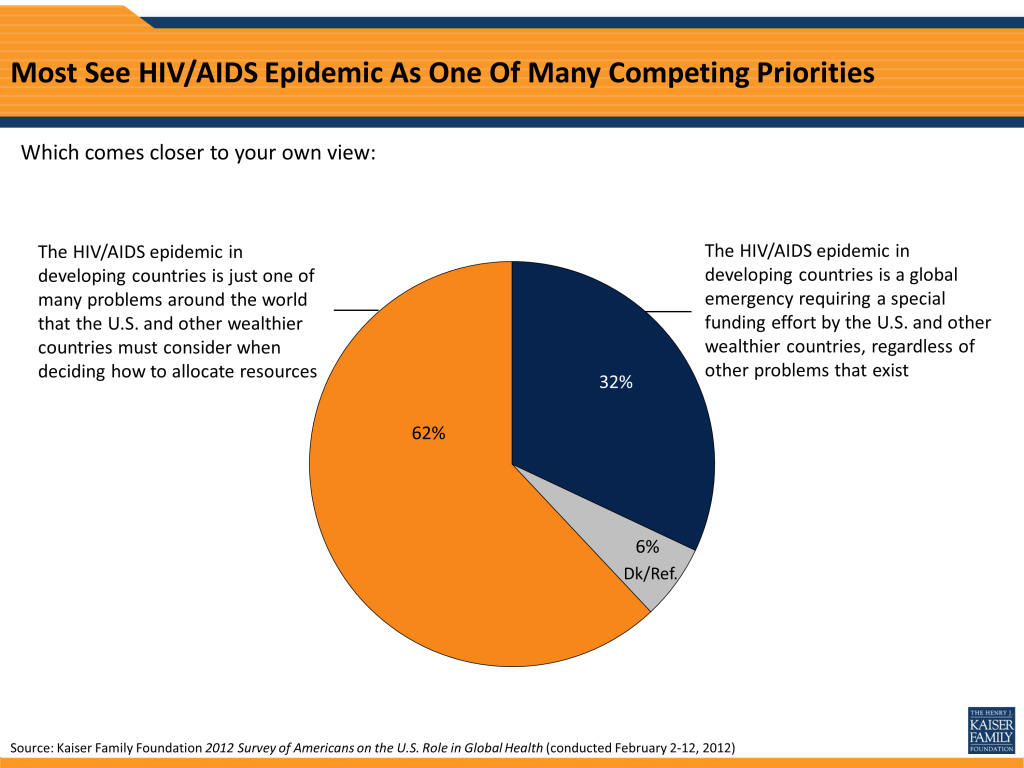
While HIV/AIDS continues to be at the top of the list of health problems perceived as most urgent for developing countries, the share mentioning HIV fell from 44 percent in 2010 to 28 percent in 2012. When asked more specifically how they view the HIV/AIDS epidemic in developing countries and the U.S. response, six in ten Americans (62 percent) say HIV/AIDS is “just one of many problems around the world that the U.S. and other wealthier countries must consider when deciding how to allocate resources,” while about half as many—32 percent—view it as “a global emergency requiring a special funding effort by the U.S. and other wealthier countries, regardless of other problems that exist.”
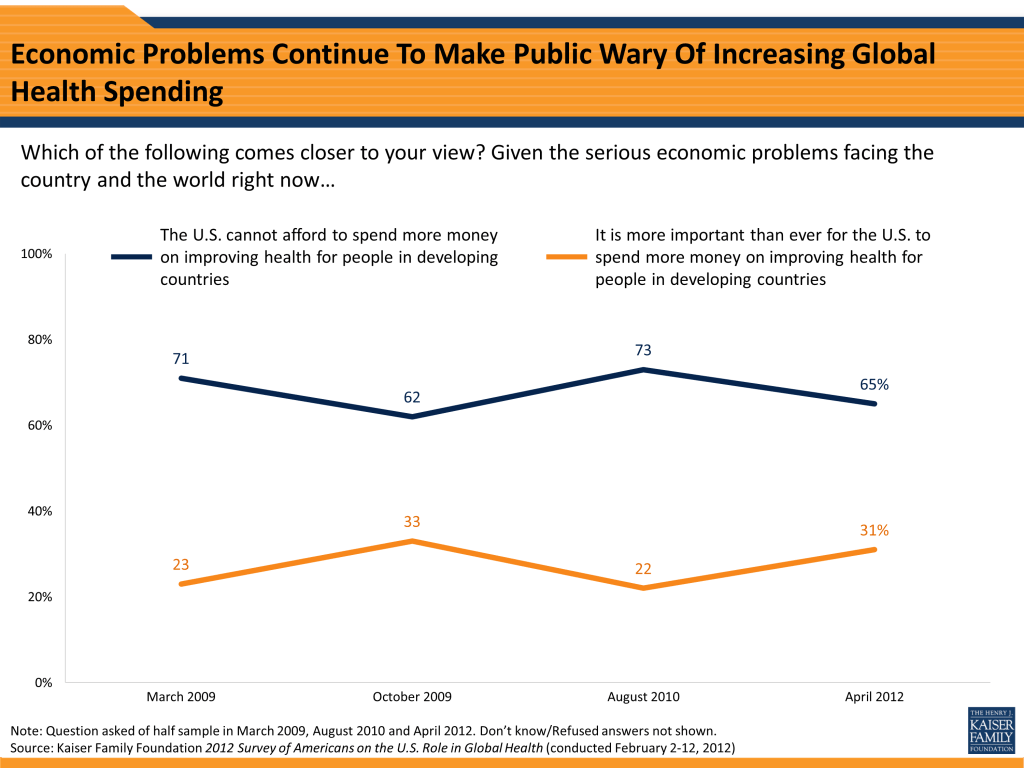
While two-thirds of Americans say that the current level of U.S. spending to improve health in developing countries is too little or about right, economic concerns continue to make the public wary of the idea of increasing spending abroad. In 2012, nearly two-thirds (65 percent) say that given the serious economic problems facing the country and the world, the U.S. cannot afford to spend more money on health in developing countries, while three in ten feel the current economic conditions make it more important than ever for the U.S. to increase such spending.
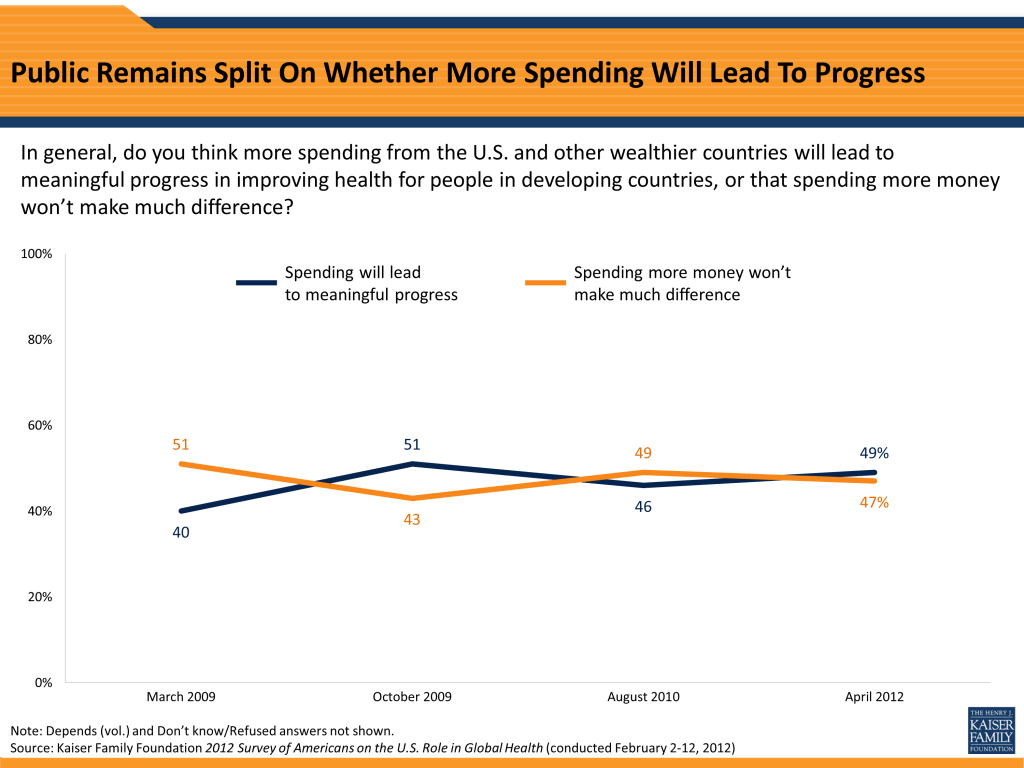
As previous Kaiser surveys have also shown, the public’s reluctance to increase U.S. spending on global health efforts may be related to the fact that Americans are divided as to whether more spending from the U.S. and other wealthier countries will lead to meaningful progress in improving health in developing countries (49 percent) or won’t make much difference (47 percent).
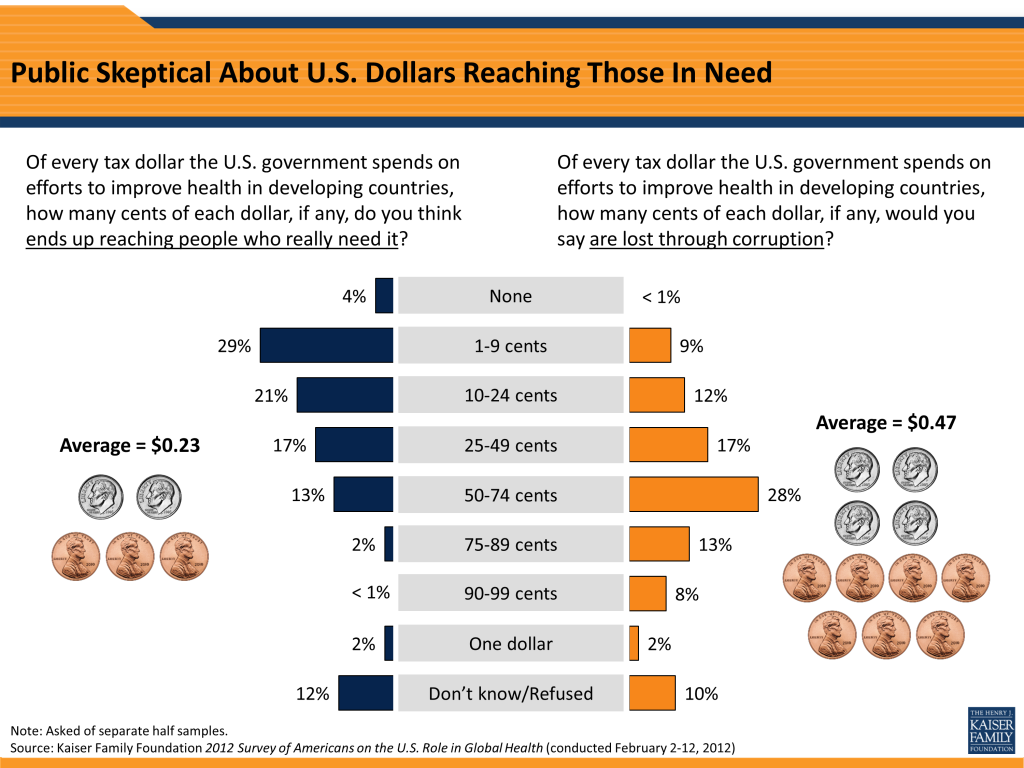
This skepticism about the ability of additional spending to lead to progress ties in with another key finding from the survey: many Americans do not believe that U.S. money is getting to where it needs to be on the ground, and most perceive that a large share of this money is being lost through corruption. On average, Americans believe just 23 cents of every tax dollar the U.S. spends on improving health in developing countries ends up reaching people who really need it. The public believes twice as much money—47 cents of every tax dollar spent on these efforts—is lost through corruption.
On several measures of attitudes toward U.S. spending on health in developing countries, Americans’ views appear to have gotten somewhat more generous since the summer of 2010. For example, 32 percent now say the U.S. spends too little in this area, up 9 percentage points since 2010, and 31 percent now say the economic crisis makes it more important than ever for the U.S. to spend more on health in developing countries, also up 9 percentage points. These marks do not represent new high points in support for increased spending, however, but rather a return to the levels seen in the fall of 2009.
| Figure 16: Trends in Views on U.S. Global Health Spending | |||||
| Mar 2009 | Oct 2009 | 2010 | 2012 | ||
| Amount U.S. spends to improve health in developing countries is… | |||||
| …too much | 23% | 25% | 28% | 21% | |
| …about right | 39 | 32 | 42 | 34 | |
| …too little | 26 | 34 | 23 | 32 | |
| U.S. should spend its tax dollars on improving health… | |||||
| …in the U.S. only | n/a | n/a | 48 | 42 | |
| …in the U.S. and globally | n/a | n/a | 49 | 55 | |
| Given the serious economic conditions facing the country and world… | |||||
| …U.S. cannot afford to spend more on health in developing countries | 71 | 62 | 73 | 65 | |
| …it is more important than ever for the U.S. to spend more | 23 | 33 | 22 | 31 | |
While many questions of U.S. policy, particularly those that involve spending, tend to be polarizing and characterized by large differences by political party, partisan differences in opinion on U.S. spending to improve health in developing countries appear to be more modest. For example, while those who identify as Republicans are somewhat more likely to favor a decrease in current levels of spending and Democrats are more likely to favor an increase, a healthy majority of Democrats (74 percent), independents (66 percent), and Republicans (59 percent) perceive current levels of spending to be too little or about right.
Framing the question in terms of U.S. tax dollars produces somewhat more of a division, with a majority of Democrats (60 percent) and independents (57 percent) saying tax dollars should be spent on improving health in the U.S. and globally, while Republicans are more split between spending tax dollars on improving health in the U.S. only (48 percent) or at home and abroad (47 percent). Still, these partisan differences are much smaller than the differences that surveys tend to measure on many other policy issues, such as recent debates about the domestic health reform law.
Some underlying partisan differences in perceptions of the impact of U.S. spending on health in developing countries may help explain the small but measurable differences in support for spending. For example, while a majority (57 percent) of Democrats believe that more spending from the U.S. and other wealthier countries will lead to meaningful progress in improving health, a similar share of Republicans (58 percent) feel that more spending won’t make much difference. And across the board, Democrats are more likely than Republicans to feel that spending money on health in developing countries brings benefits to the U.S., including protecting the health of Americans, improving the U.S. image in the world, helping U.S. national security, and helping the U.S. economy by creating new markets for U.S. goods.
When asked about various priorities for U.S. efforts to improve health in developing countries, majorities across all parties say each of the 13 priorities asked about in the survey is important. However, there are certain areas that Democrats are more likely than Republicans to rank as “top priorities.” The biggest partisan differences are in the share placing a top priority on reducing hunger and malnutrition (76 percent of Democrats vs. 39 percent of Republicans), improving access to family planning and reproductive health services (40 percent vs. 16 percent), preventing and treating heart disease and other chronic diseases (35 percent vs. 12 percent), and improving access to clean water (76 percent vs. 58 percent).
| Figure 17: Views on U.S. Global Health Spending by Political Party ID | |||||
| Total | Dems | Inds | Reps | D-R | |
| Amount U.S. spends to improve health in developing countries is… | |||||
| …too much | 21% | 15% | 22% | 28% | -13 |
| …about right | 34 | 34 | 32 | 40 | -6 |
| …too little | 32 | 40 | 34 | 19 | +21 |
| TOTAL TOO LITTLE OR ABOUT RIGHT | 66 | 74 | 66 | 59 | +15 |
| U.S. should spend its tax dollars on improving health… | |||||
| …in the U.S. only | 42 | 38 | 42 | 48 | -10 |
| …in the U.S. and globally | 55 | 60 | 57 | 47 | +13 |
| More spending from the U.S. and other countries… | |||||
| …will lead to meaningful progress in improving health | 49 | 57 | 50 | 37 | +20 |
| …won’t make much difference | 47 | 38 | 48 | 58 | -20 |
| Percent who say spending money on health in developing countries… | |||||
| Helps protect the health of Americans | 70 | 82 | 66 | 62 | +20 |
| Helps the U.S. economy | 42 | 50 | 42 | 35 | +15 |
| Helps U.S. national security | 45 | 51 | 43 | 39 | +12 |
| Helps improve the U.S. image in the world | 58 | 63 | 59 | 52 | +11 |
| Percent who say each of the following should be “one of the top priorities” for U.S. efforts to improve health in developing countries: | |||||
| Reducing hunger and malnutrition | 58 | 76 | 54 | 39 | +37 |
| Improving access to family planning and reproductive health services | 33 | 40 | 35 | 16 | +24 |
| Preventing and treating heart disease and other chronic diseases | 26 | 35 | 26 | 12 | +23 |
| Improving access to clean water | 67 | 76 | 65 | 58 | +18 |
| Efforts to improve training and expand the supply of medical professionals | 40 | 47 | 40 | 31 | +16 |
| Preventing and treating malaria | 34 | 39 | 34 | 23 | +16 |
| Eradicating polio | 28 | 34 | 26 | 18 | +16 |
| Children’s health, including vaccinations | 58 | 64 | 59 | 50 | +14 |
| Preventing and treating HIV/AIDS | 43 | 47 | 45 | 37 | +10 |
| Efforts to reduce the number of women who die during childbirth | 37 | 38 | 38 | 31 | +7 |
| Building and improving hospitals and other health care facilities | 39 | 40 | 39 | 34 | +6 |
| Combating global pandemic diseases like swine flu | 38 | 44 | 36 | 39 | +5 |
| Preventing and treating tuberculosis | 32 | 31 | 31 | 30 | +1 |
At the same time that they are skeptical about more spending leading to progress, a majority of the public (62 percent) agrees that if the president and Congress decide to reduce spending on assistance to developing countries, there would be an increase in the number of illnesses and deaths, while a third (33 percent) think such a decrease would not have a significant impact on the health of people in these countries. Further, two-thirds (67 percent) feel that a decrease in spending on assistance to developing countries would not have much impact on the federal budget deficit, while three in ten (29 percent) believe the deficit would be significantly reduced.
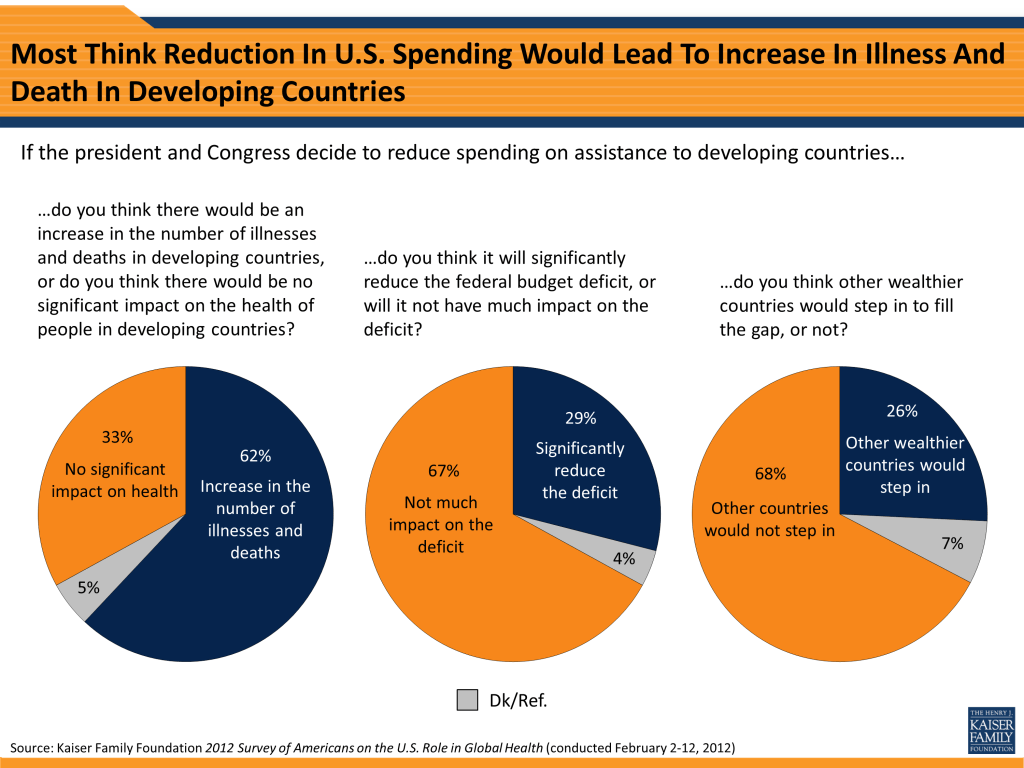
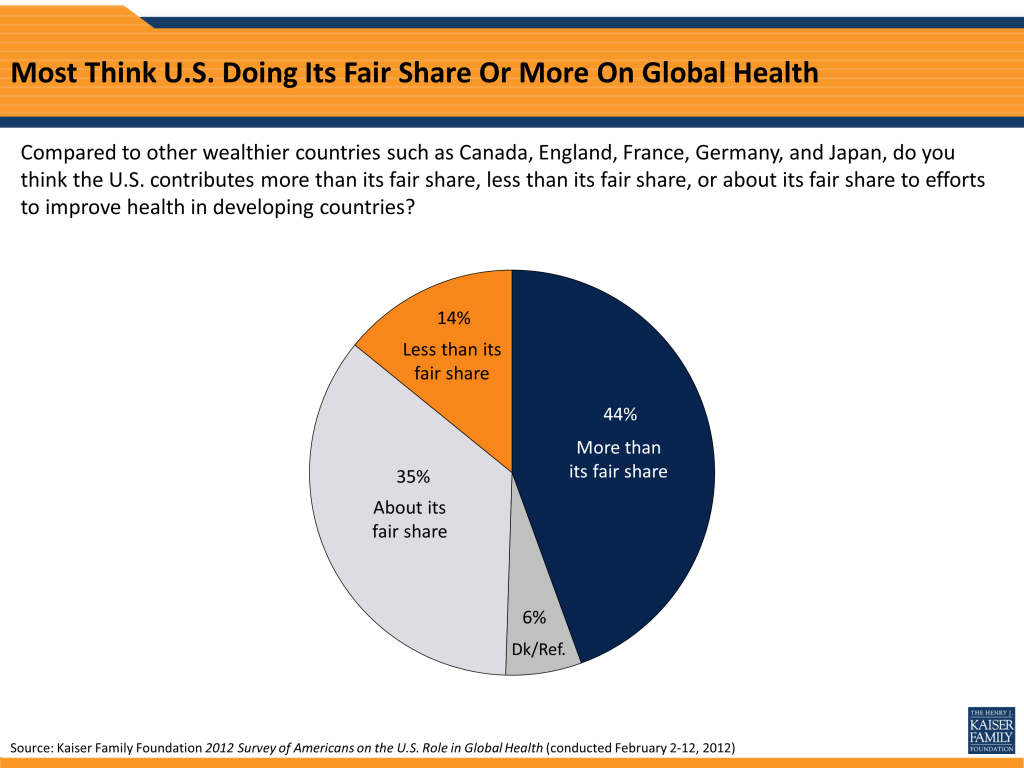
Only about a quarter (26 percent) of the public believes that if the U.S. were to decrease spending on assistance to developing countries, other wealthier countries would step in to fill the gap. In fact, the largest share of Americans—44 percent—believe that compared to other wealthier countries, the U.S. already contributes more than its fair share to efforts to improve health in developing countries. Another third (35 percent) believe the U.S. share is about right, while just 14 percent feel the U.S. currently contributes less than its fair share. 4
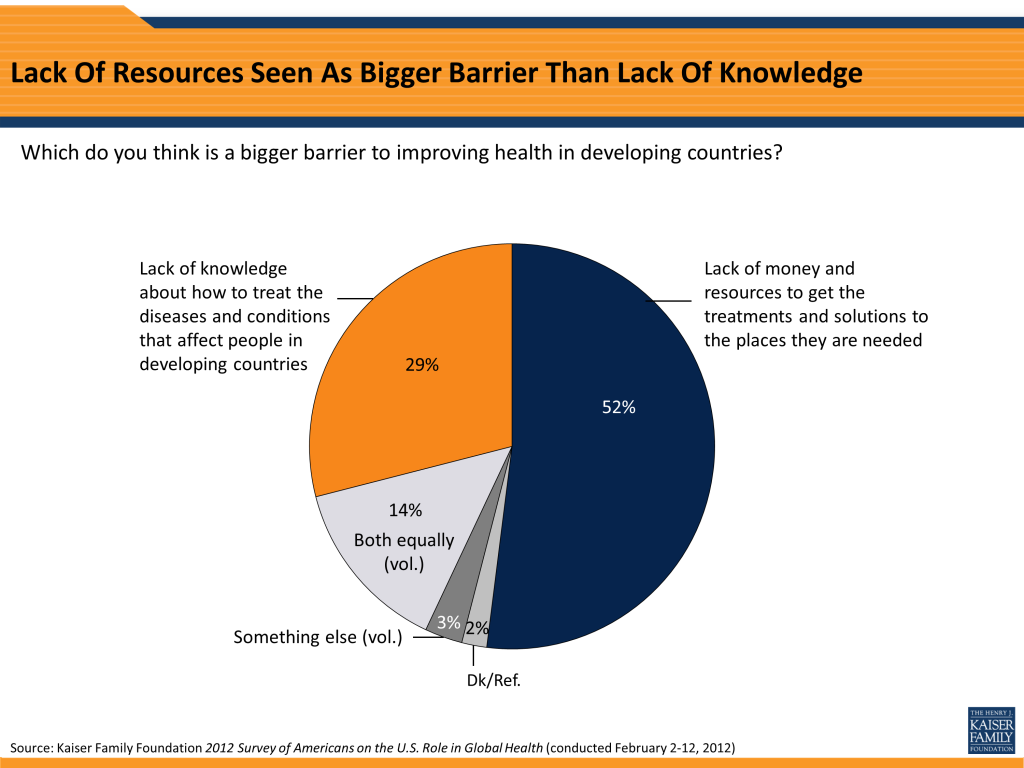
More generally, Americans seem to recognize that lack of resources is a major roadblock to making progress on health. When asked which is the bigger barrier to improving health in developing countries, more than half (52 percent) choose lack of money and resources, while three in ten (29 percent) choose lack of knowledge about how to treat the diseases and conditions affecting people in these countries.
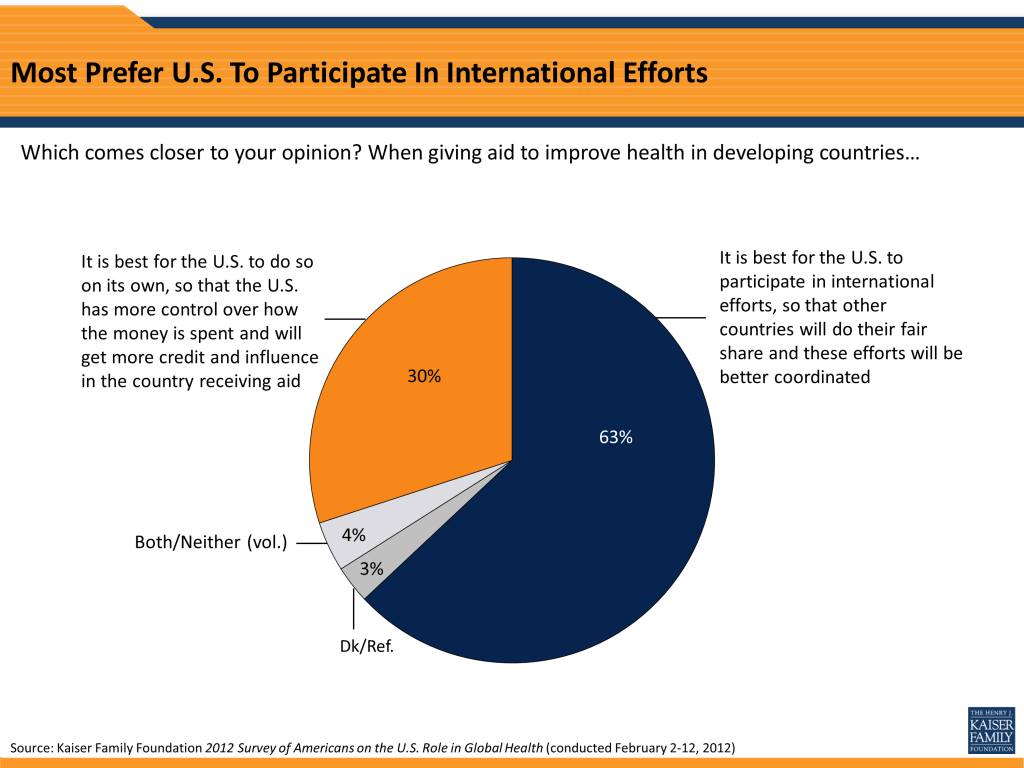
Perhaps related to the sense that the U.S. is already bearing more than its fair share of the burden, Americans continue to prefer multilateral approaches to global health aid. More than six in ten (63 percent) say that when giving aid to improve health in developing countries, “it is best for the U.S. to participate in international efforts, so that other countries will do their fair share and these efforts will be better coordinated,” while half as many (30 percent) say it is best for the U.S. “to do so on its own, so that the U.S. has more control over how money is spent and will get more credit and influence in the country receiving aid.”
In another show of support for coordinated, multilateral efforts, large shares say that the U.S. should give money to international organizations. Support is high regardless of whether the specific organizations mentioned in the question are the Global Fund to Fight AIDS, Tuberculosis and Malaria (73 percent say we should give money) or the United Nations and the World Health Organization (71 percent). Two-thirds (67 percent) also think the U.S. should give directly to U.S.-based non-profits operating programs in developing countries. The public is somewhat more divided on whether the U.S. should give money directly to local non-profits that are based in developing countries and not in the U.S. (42 percent say we should, 47 percent say we shouldn’t). And about half (51 percent) would prefer the U.S. not give directly to religious or faith-based organizations, while just over a third (38 percent) say we should. Perhaps not surprisingly, Evangelical Christians (50 percent) and those who place a strong personal importance on religion (53 percent) are more likely than others to favor giving to faith-based organizations. The public comes down clearly against giving money directly to governments in developing countries, with 67 percent saying we should not.
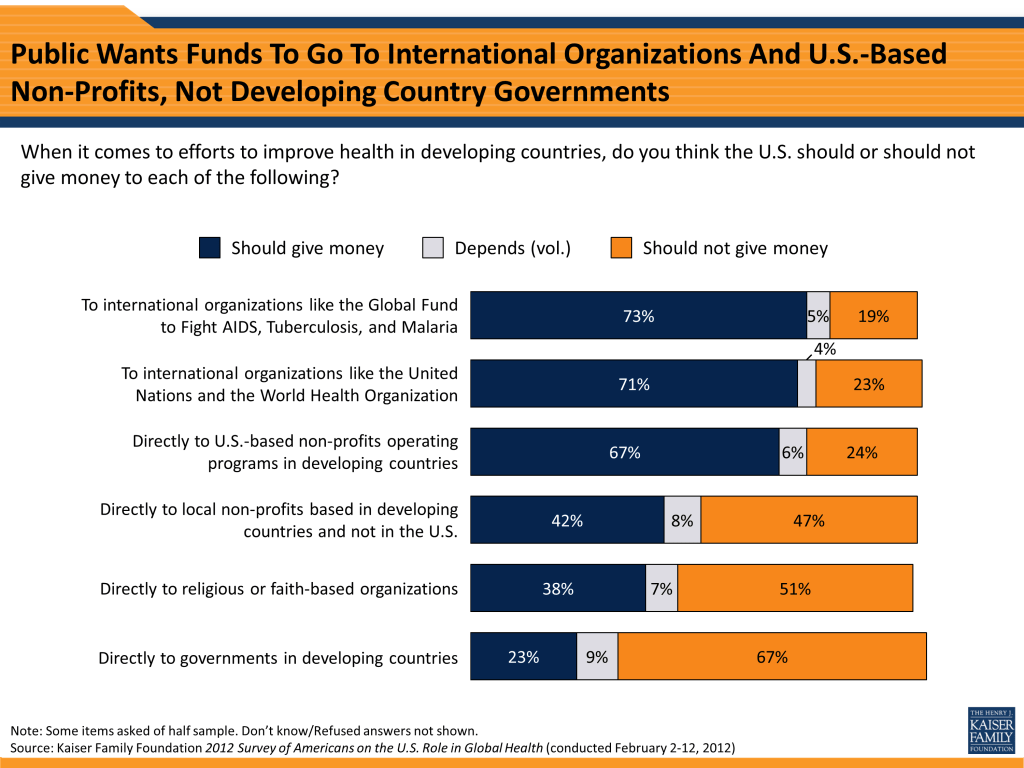
While majorities across political party affiliation support multilateral approaches to aid, there are some measurable partisan differences in attitudes in this area. Though it is a minority view across all parties, a larger share of Republicans (37 percent) compared with Democrats (24 percent) say it is better for the U.S. to give aid on its own, in order to retain control over how money is spent and receive more credit in the countries receiving aid. Republicans (55 percent) are also more likely than Democrats (38 percent) to feel that the U.S. is already contributing more than its fair share to global health efforts compared to other donor countries. And while still a majority, smaller shares of Republicans than Democrats say that when giving money to improve health in developing countries, the U.S. should give money to international organizations like the United Nations, the World Health Organization, and the Global Fund.
| Figure 23: Views on Multilateral Approaches by Political Party | |||||
| Total | Dems | Inds | Reps | D-R | |
| When giving aid to improve health in developing countries, it is best for the U.S. to… | |||||
| …participate in international efforts | 63% | 70% | 64% | 54% | +16 |
| …do so on its own | 30 | 24 | 31 | 37 | -13 |
| Compared to other wealthier countries, the U.S. contributes… | |||||
| …more than its fair share | 44 | 38 | 44 | 55 | -17 |
| …about its fair share | 35 | 37 | 34 | 34 | +3 |
| …less than its fair share | 14 | 18 | 16 | 6 | +12 |
| U.S. should/should not give money to international organizations like UN and WHO… | |||||
| …should | 71 | 87 | 73 | 52 | +35 |
| …should not | 23 | 10 | 23 | 42 | -32 |
| U.S. should/should not give money to international organizations like the Global Fund… | |||||
| …should | 73 | 84 | 73 | 63 | +21 |
| …should not | 19 | 10 | 23 | 23 | -13 |
Americans see several clear benefits to the U.S. from engaging in global health efforts. Seven in ten believe that spending money on health in developing countries helps protect the health of Americans at home by preventing the spread of diseases like SARS, bird flu, and swine flu, and nearly six in ten (58 percent) say such spending helps improve the U.S. image around the world.
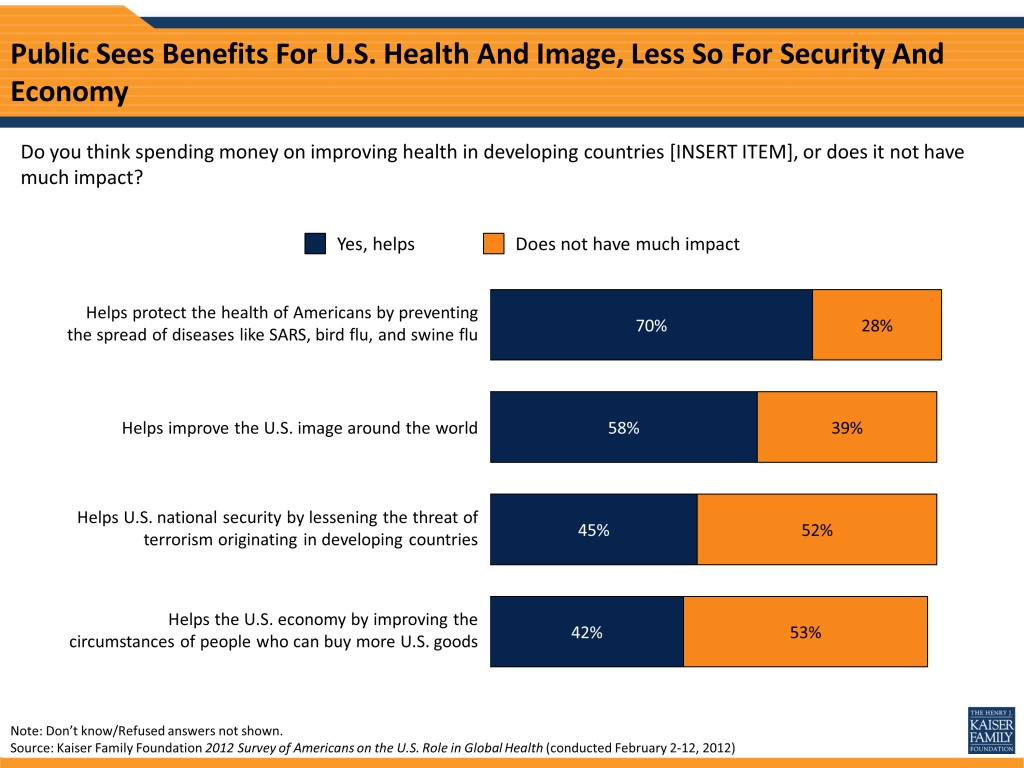
The public is somewhat less convinced that U.S. spending on health in developing countries helps U.S. national security by lessening the threat of terrorism originating in these countries (45 percent say it does, 52 percent say it does not), and that it helps the U.S. economy by creating new markets for U.S. goods (42 percent say it does, 53 percent say it does not).
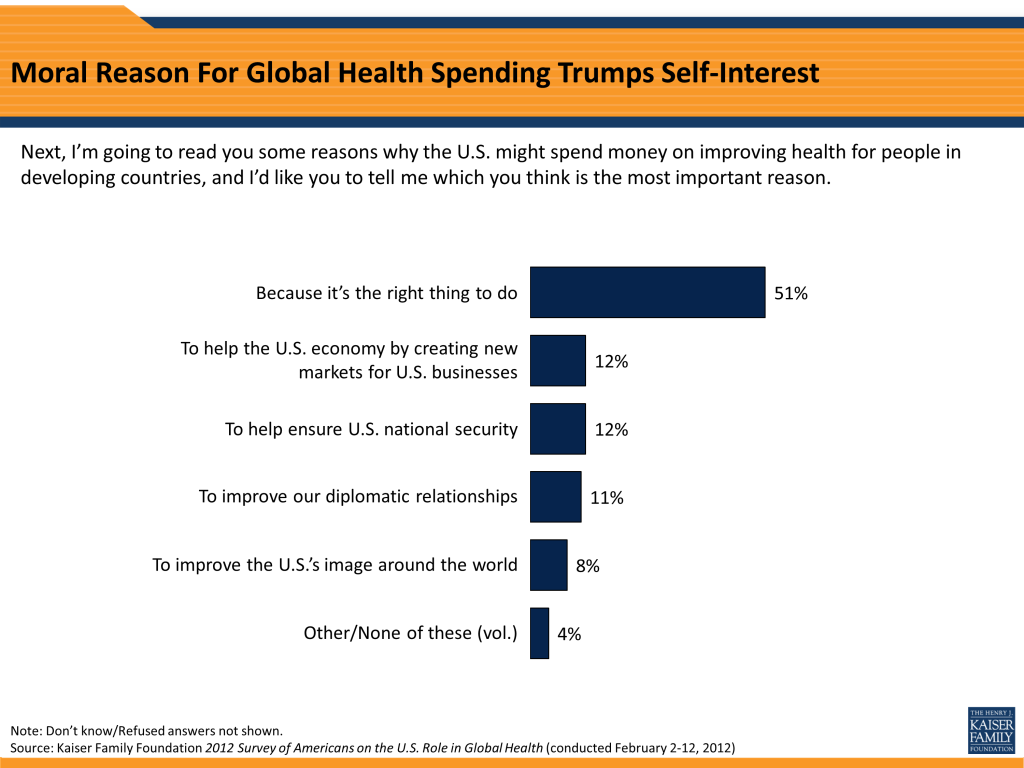
Despite recognizing some potential benefits to the U.S., the moral argument continues to trump such “self-interest” arguments when it comes to reasons for the U.S. to give. Half (51 percent) say the most important reason for the U.S. to spend money on health in developing countries is “because it’s the right thing to do,” while much smaller shares see the top reason as helping the U.S. economy (12 percent), ensuring U.S. national security (12 percent), improving diplomatic relationships (11 percent) or improving the U.S. image in the world (8 percent).
One challenge for those looking to increase the public’s level of support for U.S. spending on global health is that there are some indications that visibility of the issue may have declined somewhat since the summer of 2010. This decline may not be surprising given that 2012 is an election year, and one in which the news has continued to be dominated by the economic problems facing the country. While a majority of the public reports paying at least “some” attention to issues related to health in developing countries, fewer than one in five (18 percent) say they pay “a lot” of attention to these issues. The share saying they pay at least “some” attention is down somewhat, from 75 percent in August 2010 to 68 percent in 2012.
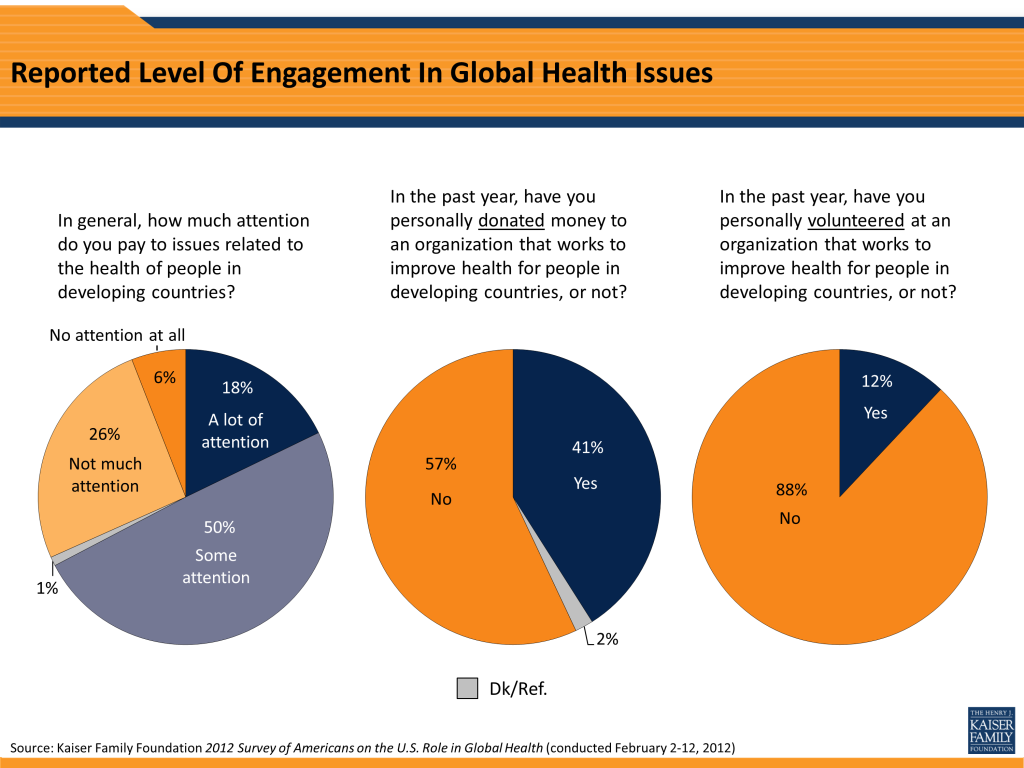
Similarly, there’s been a decline in the share saying they’ve heard more than a little in the past year about U.S. government efforts to improve health for people in developing countries. Currently, 45 percent say they’ve heard “a lot” (14 percent) or “some” (31 percent), down from a total of 57 percent who reported hearing “a lot” (21 percent) or “some” (36 percent) in 2010.
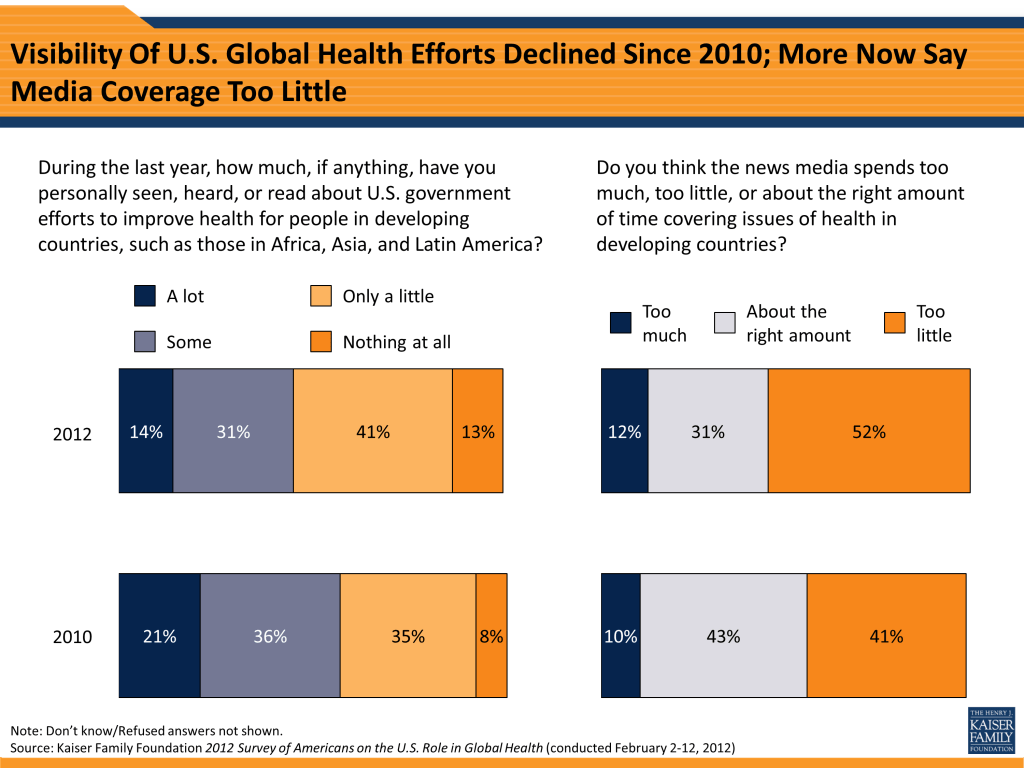
In light of this decline in visibility, the public has become somewhat more likely to say the news media is not devoting enough time to covering issues of health in developing countries. Currently, roughly half (52 percent) say the news media spends too little time on the topic, up from 41 percent in 2010. At the same time, the share who say the media spends about the right amount of time on the issue declined from 43 percent to 31 percent, while about one in ten continue to believe the media devotes too much time to the issue.
While there is a lot of agreement across various demographic groups on questions of U.S. global health policy, some distinct age trends emerge in this survey. Compared with their older counterparts, younger adults are more likely to support increasing U.S. spending on health in developing countries, more optimistic that spending will lead to progress and will bring various benefits to the U.S., and less skeptical about the amount of U.S. global health spending lost through corruption.
For example, more than half of adults under age 30 (53 percent) think the U.S. currently spends too little on health in developing countries, compared with just 18 percent of those ages 65 and older. And while a majority of those ages 50 and older feel that the U.S. contributes more than its fair share compared to other donor nations, just about a quarter of 18-29 year-olds feel the same way. Perhaps reflecting the optimism of youth, a clear majority (62 percent) of adults under 30 believe that more spending from the U.S. and others will lead to meaningful progress in improving health in developing countries, while a similar majority of seniors (57 percent) think more spending won’t make much difference (those between the ages of 30-64 are more split). Younger Americans are also more likely than older ones to believe that spending to improve health in developing countries helps improve the U.S. image in the world, protects the health of Americans at home, and is helpful for the U.S. economy and national security. And seniors are more than twice as likely as those under 30 to believe that at least 75 cents of each U.S. dollar spent on health in developing countries is lost through corruption (34 percent vs. 15 percent).
At the same time, younger adults are less likely than older Americans to report paying close attention to the issue of health in developing countries, and less likely to report hearing news about U.S. global health efforts in the past year. Just a third (33 percent) of those ages 18-29 say they’ve heard “a lot” or “some” in the past year about U.S. government efforts to improve health in developing countries, compared with six in ten of those ages 65 and older.
| Figure 28: Views on U.S. Global Health Spending by Age | ||||
| 18-29 | 30-49 | 50-64 | 65+ | |
| U.S. spending to improve health in developing countries is… | ||||
| …too much | 12% | 22% | 23% | 29% |
| …about right | 27 | 35 | 38 | 36 |
| …too little | 53 | 30 | 29 | 18 |
| Compared to other wealthier countries, the U.S. contributes… | ||||
| …more than its fair share | 26 | 43 | 55 | 52 |
| …about its fair share | 42 | 37 | 31 | 32 |
| …less than its fair share | 23 | 14 | 10 | 9 |
| More spending from the U.S. and other countries… | ||||
| …will lead to meaningful progress in improving health | 62 | 51 | 46 | 34 |
| …won’t make much difference | 37 | 44 | 51 | 57 |
| Percent who say spending money on health in developing countries… | ||||
| Helps improve the U.S. image in the world | 72 | 64 | 52 | 44 |
| Helps protect the health of Americans | 73 | 81 | 72 | 65 |
| Helps the U.S. economy | 51 | 46 | 39 | 32 |
| Helps U.S. national security | 56 | 46 | 41 | 34 |
| Percent who say cents of U.S. tax dollars spent on health in developing countries that are lost through corruption is… | ||||
| …less than 25 cents | 33 | 28 | 10 | 13 |
| …25-74 cents | 41 | 43 | 55 | 40 |
| …75 cents or more | 15 | 19 | 29 | 34 |
| During the last year, how much seen, heard, or read about U.S. government efforts to improve health in developing countries… | ||||
| …a lot/some | 33 | 41 | 49 | 60 |
| …only a little/none | 66 | 58 | 50 | 39 |
| How much attention you usually pay to health in developing countries… | ||||
| …a lot/some | 61 | 65 | 70 | 77 |
| …not much/none | 39 | 35 | 30 | 21 |
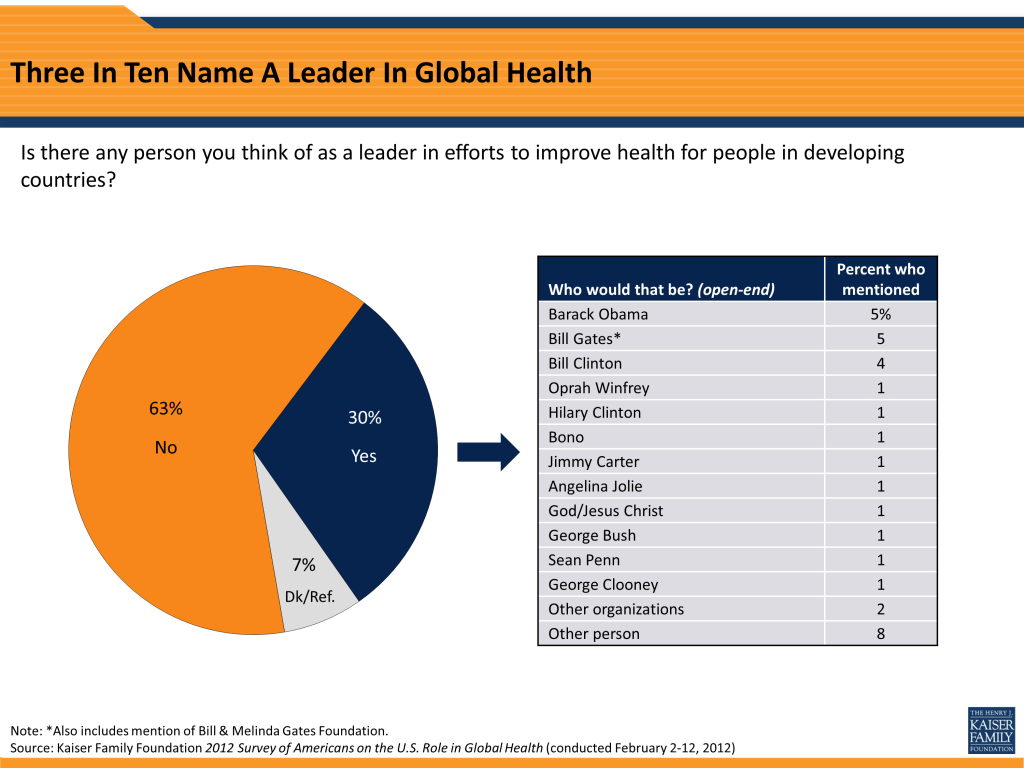
Perhaps surprisingly given this low level of visibility, three in ten Americans are able to name a person they think of as a leader in efforts to improve health for people in developing countries. At the top of the list are President Barack Obama (named by 5 percent) and entrepreneur and philanthropist Bill Gates (named by 5 percent, which includes mentions of the Bill and Melinda Gates Foundation), followed by former President Bill Clinton (4 percent). Various other individuals were mentioned by about 1 percent of the public each, including former presidents Jimmy Carter and George Bush, Secretary of State Hillary Clinton, and celebrities such as Oprah Winfrey, Bono, Angelina Jolie, Sean Penn, and George Clooney.
Since the Kaiser Family Foundation began tracking public opinion on the U.S. role in global health in 2009, we have consistently found solid levels of support among the public for current levels of U.S. global health spending, along with the caveat that the current economic situation makes most Americans wary of increasing such spending. This survey illuminates several opportunities and challenges for those looking to increase the public’s level of support for U.S. global health efforts. While misperceptions about the size of U.S. foreign aid continue to be a challenge, an opportunity can be found in the fact that accurate information has the potential to “move the needle” in this area. By simply telling people that foreign aid makes up only one percent of the budget, opinion shifts from a majority saying the U.S. currently spends too much on foreign aid to two-thirds saying we spend either too little or about the right amount.
Another opportunity lies in the degree to which there is bipartisan agreement among the public about current levels of U.S. spending on health in developing countries. In contrast to many domestic policy issues which tend to be more divisive, those looking to rally support for U.S. global health efforts may find potential supporters among Democrats, Republicans, and independents alike. And those looking toward the future may be encouraged by the fact that young adults are among those most likely to support increased U.S. involvement. Our analysis also finds that those who pay a lot of attention to global health issues and those who believe more spending will lead to meaningful progress are more likely to support an increase in U.S. funding for global health, suggesting that increasing the visibility of these issues and convincing people of the effectiveness of spending could be potentially successful strategies in gaining broader public support.
On the challenge side, perhaps the biggest challenge lies in the public’s skepticism about the amount of U.S. money that actually reaches people on the ground in developing countries versus being lost through corruption. It may be hard to convince the public to support an increase U.S. funding for global health as long as they continue to perceive that less than a quarter of every U.S. tax dollar spent on health in developing countries actually reaches those in need. And finally, declining attention to and visibility of global health issues presents an ongoing challenge for those looking to raise awareness of these issues, and one that is likely to continue throughout 2012 as the media focuses on the state of the U.S. economy and, increasingly, on the presidential election campaign.
The Kaiser Family Foundation 2012 Survey of Americans on the U.S. Role in Global Health was designed and analyzed by public opinion researchers at the Kaiser Family Foundation led by Mollyann Brodie, Ph.D., including Liz Hamel, Bianca DiJulio, Sarah Cho, and Theresa Boston, with input and guidance from Jennifer Kates, Ph.D., and Alicia Carbaugh. The survey was conducted February 2-12, 2012, among a nationally representative random digit dial telephone sample of 1,205 adults ages 18 and older, living in the United States, including Alaska and Hawaii (note: persons without a telephone could not be included in the random selection process). Computer-assisted telephone interviews conducted by landline (700) and cell phone (505, including 239 who had no landline telephone) were carried out in English and Spanish by Braun Research, Inc. under the direction of Princeton Survey Research Associates International (PSRAI). Both the landline and cell phone samples were provided by Survey Sampling International, LLC. For the landline sample, respondents were selected by asking for the youngest adult male or female currently at home based on a random rotation. If no one of that gender was available, interviewers asked to speak with the youngest adult of the opposite gender. For the cell phone sample, interviews were conducted with the person who answered the phone.
The combined landline and cell phone sample was weighted to balance the sample demographics to match estimates for the national population data from the Census Bureau’s 2011 Annual Social and Economic Supplement (ASEC) on sex, age, education, race, Hispanic origin, and region along with data from the 2000 Census on population density. The sample was also weighted to match current patterns of telephone use using data from the January-June 2011 National Health Interview Survey. The weight takes into account the fact that respondents with both a landline and cell phone have a higher probability of selection in the combined sample and also adjusts for the household size for the landline sample. All statistical tests of significance account for the effect of weighting. Weighted and unweighted values for key demographic variables are shown in the table below.
| SAMPLE DEMOGRAPHICS | ||
| Unweighted | Weighted | |
| GENDER | ||
| Male | 53.1% | 49.3% |
| Female | 46.9% | 50.7% |
| AGE | ||
| 18-24 | 8.1% | 12.6% |
| 25-34 | 12.9% | 16.1% |
| 35-44 | 13.4% | 17.8% |
| 45-54 | 17.8% | 17.9% |
| 55-64 | 21.6% | 16.2% |
| 65+ | 23.5% | 16.7% |
| EDUCATION | ||
| Less than HS Grad. | 7.3% | 12.3% |
| HS Grad. | 28.6% | 33.7% |
| Some College | 24.8% | 24.4% |
| College Grad. | 38.1% | 28.5% |
| RACE/ETHNICITY | ||
| White/not Hispanic | 72.3% | 67.0% |
| Black/not Hispanic | 9.4% | 11.0% |
| Hispanic | 12.0% | 13.7% |
| Other/not Hispanic | 3.8% | 5.9% |
| PARTY IDENTIFICATION | ||
| Democrat | 31.5% | 32.0% |
| Independent | 34.9% | 35.3% |
| Republican | 23.6% | 22.1% |
| Other | 6.1% | 5.9% |
The margin of sampling error including the design effect for the full sample is plus or minus 3 percentage points. For results based on subgroups, the margin of sampling error may be higher. Sample sizes and margin of sampling errors for other subgroups are available by request. Note that sampling error is only one of many potential sources of error in this or any other public opinion poll.
The response rate calculated based on the American Association for Public Opinion Research Response Rate 3 formula (AAPOR RR3) was 24 percent for the landline sample and 21 percent for the cell phone sample.
Health care accounts for a remarkably large slice of the U.S. economic pie. Each year health-related spending grows, virtually always outpacing spending on other goods and services, meaning that the size of that slice increases. These cost increases have a significant effect on households, businesses, and federal, state, and local governments. Among other things, rising health care costs make health insurance less affordable for individuals, families, and businesses; put pressure on businesses that offer insurance coverage to their employees; can be a major financial burden to families, even those that have insurance; and can result in individuals not receiving the health care services they need. For taxpayers, government programs such as Medicare and Medicaid are major parts of federal and state budgets and increasing costs require either additional revenue or reductions in benefits, eligibility, or payment rates.
Concerns about rising health care costs and affordability of health care for families persist despite the enactment of comprehensive health reform legislation in March 2010 (the Affordable Care Act, or ACA).1 The ACA changed the health care landscape considerably by providing significant financial assistance to help people with low and moderate incomes afford coverage and associated cost sharing. The law provides new standards for private health insurance, including identifying minimum benefits for health insurance, placing limits on cost sharing for covered benefits, and establishing new rules for private health insurance that assure access to coverage for people with health problems and limit premium and contribution differences based on health-related factors. Together these provisions will dramatically reduce financial burdens for many people with lower income or significant health care needs.
The ACA also has a number of provisions that address the costs and efficiency of the health care system, including provisions to demonstrate and implement new payment systems for Medicare (e.g., accountable care organizations, or ACOs), provisions to better coordinate care for people dually eligible for Medicare and Medicaid, reductions in Medicare payments, and new rules (e.g., disclosure and transparency) and new institutions (i.e., exchanges) to improve the efficiency of private health insurance.
Despite the many cost-reducing provisions in the ACA, system-wide health care costs are still projected to rise faster than national income for the foreseeable future, and this cost growth has important implications for government and family budgets. Reducing future federal budget deficits is a major focus in national policy debate, and spending on federal health programs is a primary target. Federal health spending is projected to grow from 5.6% of Gross Domestic Product (GDP) in 2011 to about 9.4% of GDP by 2035.2 Proposals to reduce federal health spending range from modest reforms, such as modifying payment systems to better reward efficiency and effectiveness, to fundamental changes, such as transforming Medicaid into a block grant with capped federal spending and replacing the current Medicare entitlement with a defined set of services to a defined contribution toward purchase of a private or public health plan Recent proposals to reduce future budget deficits include various policies to slow federal health spending, including taking steps to constrain overall federal spending to a proscribed rate of growth, such as one percentage point above GDP or GDP per capita.3 The more far-reaching reforms would limit federal costs and potentially expose program beneficiaries to higher out-of-pocket costs and benefit reductions. Many states have experienced severe budget problems during the recent recession, leading them to reduce state spending on Medicaid, which is one of the largest components of state budgets.
The federal budget debate in large part revolves around the overall size of the budget and the mix of program cuts and new revenues necessary to bring federal spending into better balance. Proposals to reduce federal health spending are based on the premise that health programs are growing to unaffordable levels and must be curtailed. Little of the debate, however, considers the amount of health that is currently provided by these programs and how much health the nation wants to support though federal spending in the future. Health spending grows faster than national income in part because the health care system continues to innovate and provide new treatment options to people with serious acute and chronic illnesses. A system that each year can do more of something that people find very valuable – address their health care needs – inevitably will attract a greater share of overall national spending. This does not mean that all current health care spending is necessary or that there are not considerable opportunities to improve the efficiency and quality of care, but even from more efficient levels continuing innovation will push costs higher as the arsenal of health care interventions continues to grow. The key challenge for policymakers will be finding the best mix of policies so that government, corporate, and private health spending is as efficient as possible and best meets the health care needs and desires of the nation.
The challenge is made more difficult by the highly decentralized nature of health care decision-making in the United States. Health care investment and spending are influenced by federal and state programs, with differing payment systems, incentives, and reimbursement levels, by numerous private health insurers, each with their own payment policies and practices, and by direct family payments for services that are covered or not covered by public or private insurance. Decisions by one program may shift costs or affect payment decisions by other payers, usually in an uncoordinated fashion. Provisions in the ACA provide for some additional coordination across programs, such as coordination of care for those dually eligible for Medicare and Medicaid. Private payers also may be able to take advantage of Medicare investments in ACOs and medical homes. Still, the lack of coordination across public and private spending programs makes coordinating efforts to reduce costs and increase efficiency system-wide a challenging proposition.
This primer gives a brief glimpse of available data on health care costs, and summarizes the impact of spending growth on various parts of society. The National Health Expenditure Accounts (NHEA), the source for several of the analyses shown, present the costs of care by type of health service or product (such as hospital care, physician services, or prescription drugs), sources of funds (such as private insurance, Medicare, Medicaid, or out-of-pocket by the individual patient), and types of sponsors (private business, households, and government). Results from both the Kaiser Family Foundation/Health Research and Educational Trust Employer Health Benefits Survey and the Medical Expenditures Panel Survey are also shown to help explain how health costs are distributed among families. Finally, we conclude by discussing some commonly-held explanations for why health care costs grew over time, how they might be addressed, and the effect of the ACA.
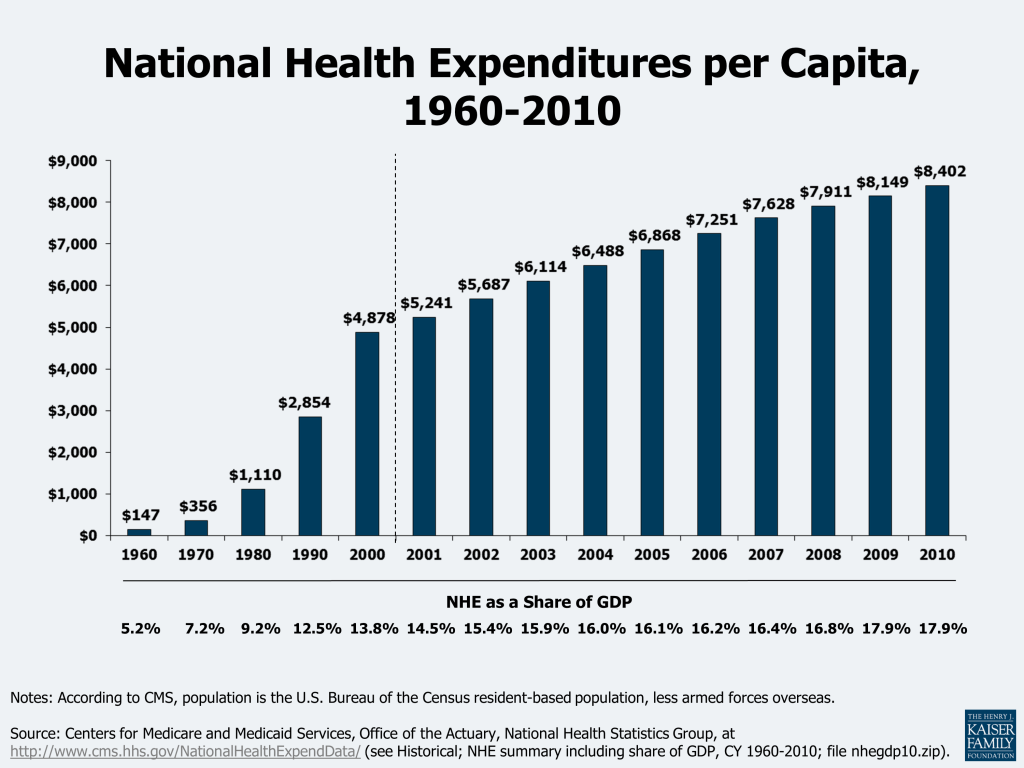
The U.S. spent $8,402 per person on health care in 2010. Health care spending has consumed an increasing share of economic activity over time. The United States spent $2.6 trillion on health care in 2010. Spread over the population, this amounts to $8,402 per person (Figure 1). This $2.6 trillion represents 17.9% of the nation’s total economic activity, referred to as the gross domestic product, or GDP. While health care expenditures have grown rapidly over time, increases have moderated in recent years.
Health care grows faster than many other sectors of the economy and thus its share of economic activity has increased over time. For example, whereas the education, transportation, and agriculture industries may, on average and over time, grow at rates close to the economy as a whole, health care does not. In 1970, total health care spending was about $75 billion, or only $356 per person (Figure 1). In less than 40 years these costs have grown to $2.6 trillion, or $8,402 per person. As a result, the share of economic activity devoted to health care grew from 7.2% in 1970 to 17.9% in 2010, though this level was unchanged from 2009. By the year 2020, the Centers for Medicare and Medicaid Services (CMS) projects that health spending will be nearly one-fifth of GDP (19.8).4
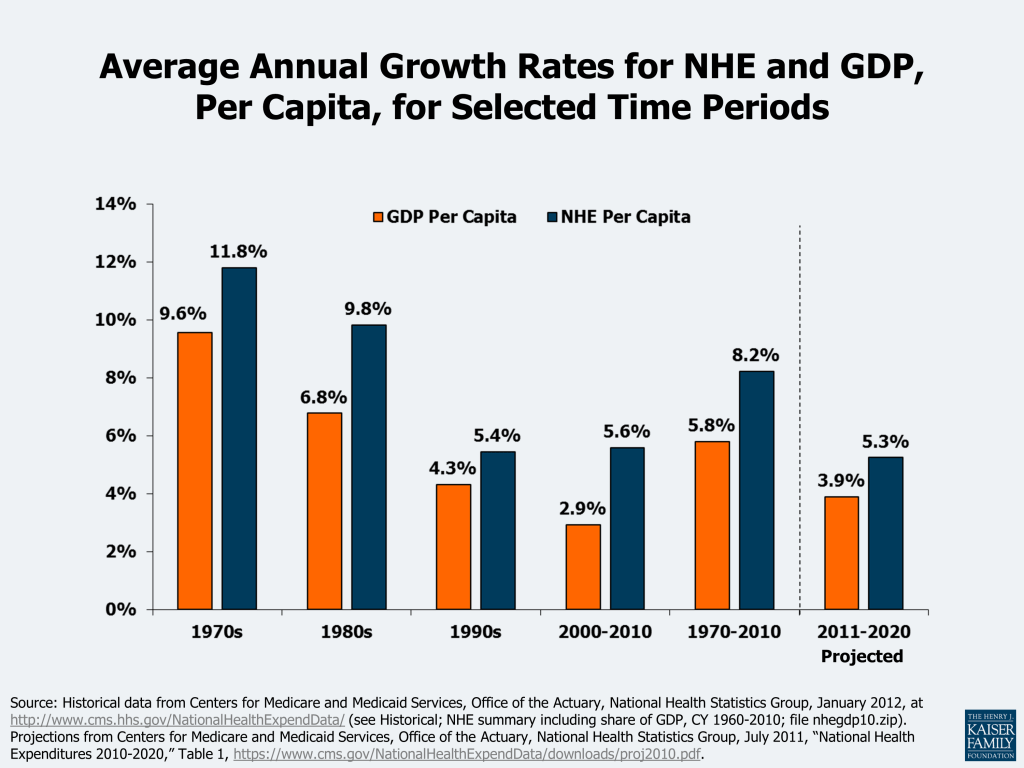
Health care spending has exceeded economic growth in every recent decade. Over the last four decades, the average growth in health spending has exceeded the growth of the economy as a whole by between 1.1 and 3.0 percentage points (Figure 2). Since 1970, health care spending per capita has grown at an average annual rate of 8.2% or 2.4 percentage points faster than nominal GDP. The persistence of this trend suggests systematic differences between health care and other economic sectors where growth rates are typically more in line with the overall economy. A smaller difference is projected over the 2011 to 2020 period, where the average annual growth in per capita health spending (5.3%) is projected to be about 1.2 percentage points higher than the growth in GDP (3.9%).5 The average annual growth rates in per capita national health spending have declined over the decades, from 11.8% in the 1970s to 5.6% in the 2000 to 2010 period.
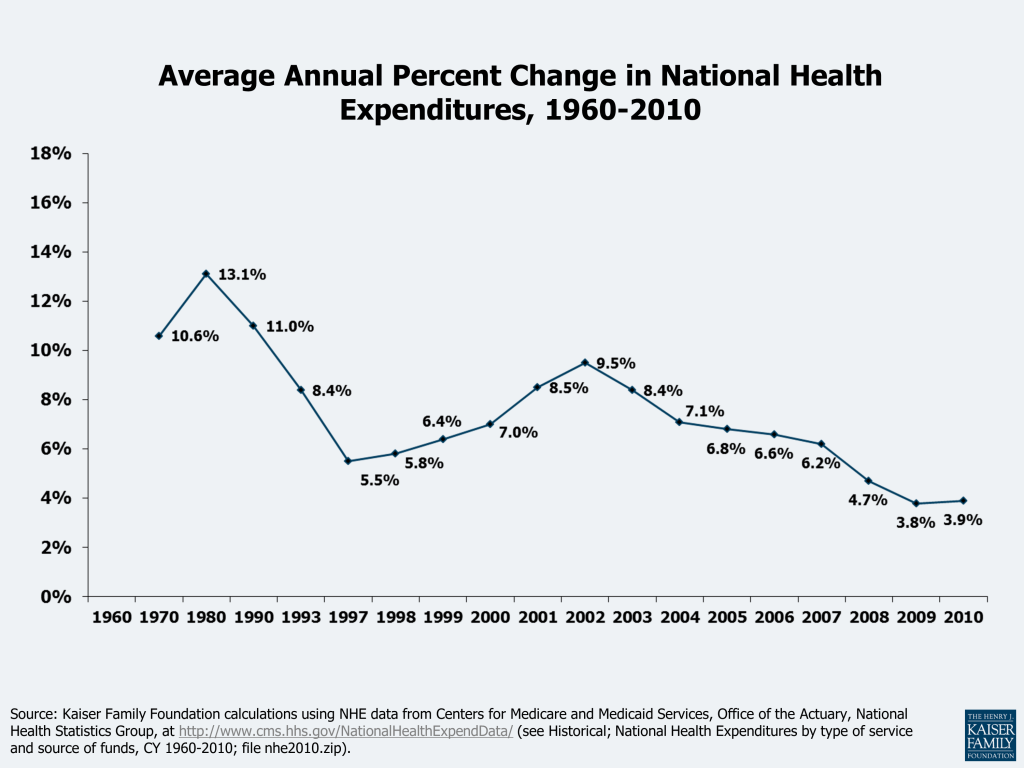
After years of increases, the rate of increase in national health spending has been declining since 2002. Since 2002, when the rate of increase in national spending was 9.5% over the prior year, the annual spending increases have declined to less than half that amount — 3.9% in 2010 — an amount similar to the 3.8% in 2009 (Figure 3). CMS indicates that these recent rates are lower than in any other years during the 51-year history of the National Health Expenditure Accounts record-keeping.6 CMS attributes the moderation to an “extraordinarily slow growth in the use and intensity of services.” The recession in the US economy, which officially lasted from December 2007 through June 2009, had an impact on utilization of services as people were reluctant to spend money on medical care, including those who lost their jobs and thus their insurance and those who were cautious about, or could not afford, their insurance’s cost sharing. According to CMS, the slowdown in health spending from this recession occurred more quickly than in earlier recessions where the effects were typically lagged, with the largest declines in annual % increases apparent in 2008 (+4.7%), 2009 (+3.8%), and 2010 (+3.9%). An example of the effect of the economy on medical service utilization — physician office visits by privately insured patients — can be seen at http://healthreform.kff.org/notes-on-health-insurance-and-reform/2011/november/the-economy-and-medical-care.aspx.7
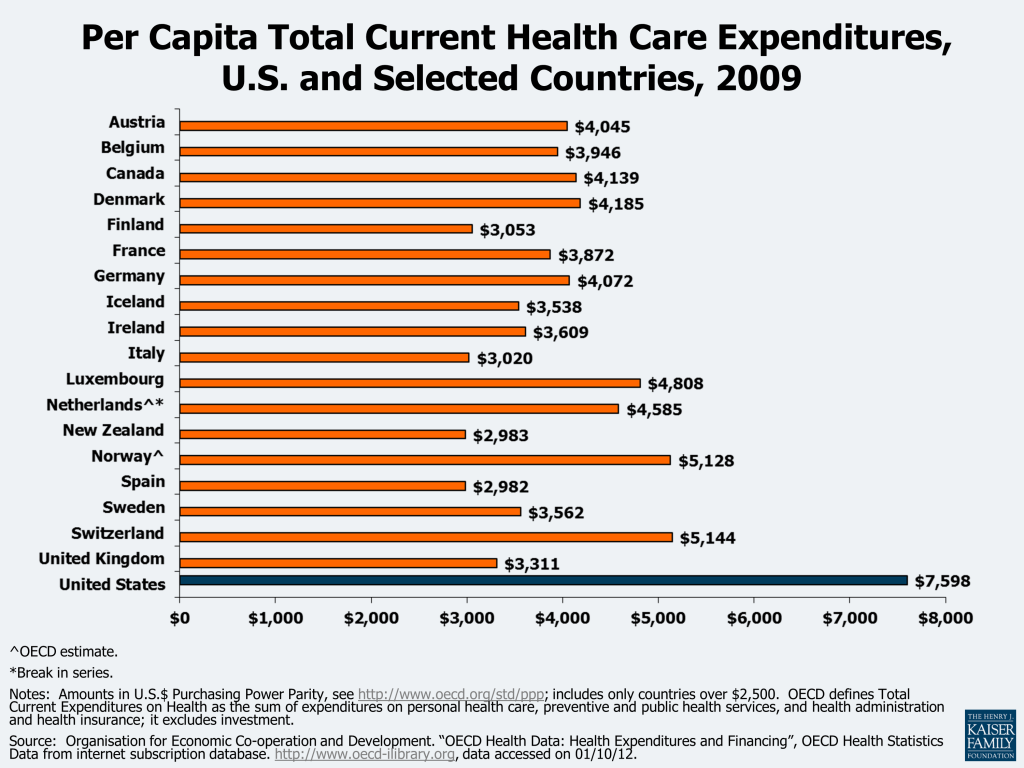
The U.S. spends substantially more on health care than other developed countries. Figure 4 shows per capita health expenditures in 2009 U.S. dollars for the Organisation for Economic Co-operation and Development (OECD) countries with above-average per capita national income. According to OECD data, health spending per capita in the United States was $7,598 in 2009.8 This amount was 48% higher than in the next highest spending country (Switzerland), and about 90% higher than in many other countries that we would consider global competitors. As a share of GDP, health care spending in the US also exceeds spending by other industrialized nations by at least 5 percentage points (not shown).9 Despite this relatively high level of spending, the United States does not appear to achieve substantially better health benchmarks compared to other developed countries.10 A recent study found that U.S. health care spending is higher than that of other countries most likely because of higher prices and perhaps more readily accessible technology and greater obesity, rather than higher income, an older population, or a greater supply or utilization of hospitals and doctors.11
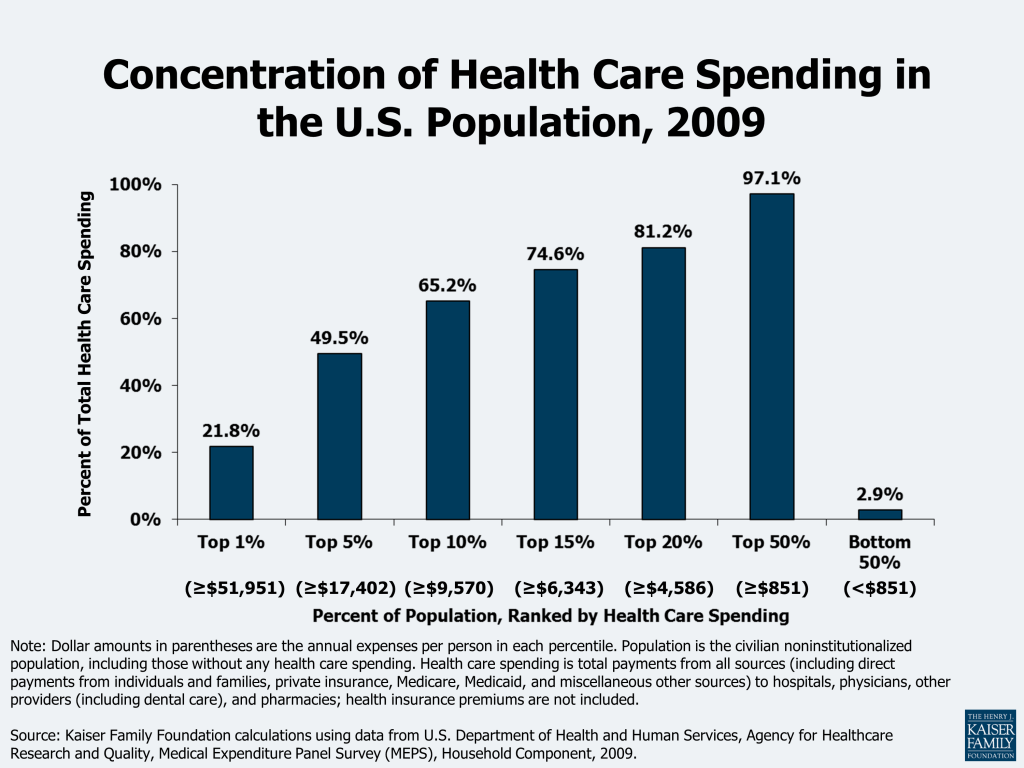
A small share of people accounts for a significant share of expenses in any year. In 2009, almost half of all health care spending was used to treat just 5% of the population, which included individuals with health expenses at or above $17,402 (Figure 5).12 Under a quarter of health spending (21.8%) went towards the treatment of the 1% of the population who had total health expenses above $51,951 in 2009. Because the onset of disease is unpredictable and can require intensive technology and time to treat, the distribution of health spending is highly concentrated.
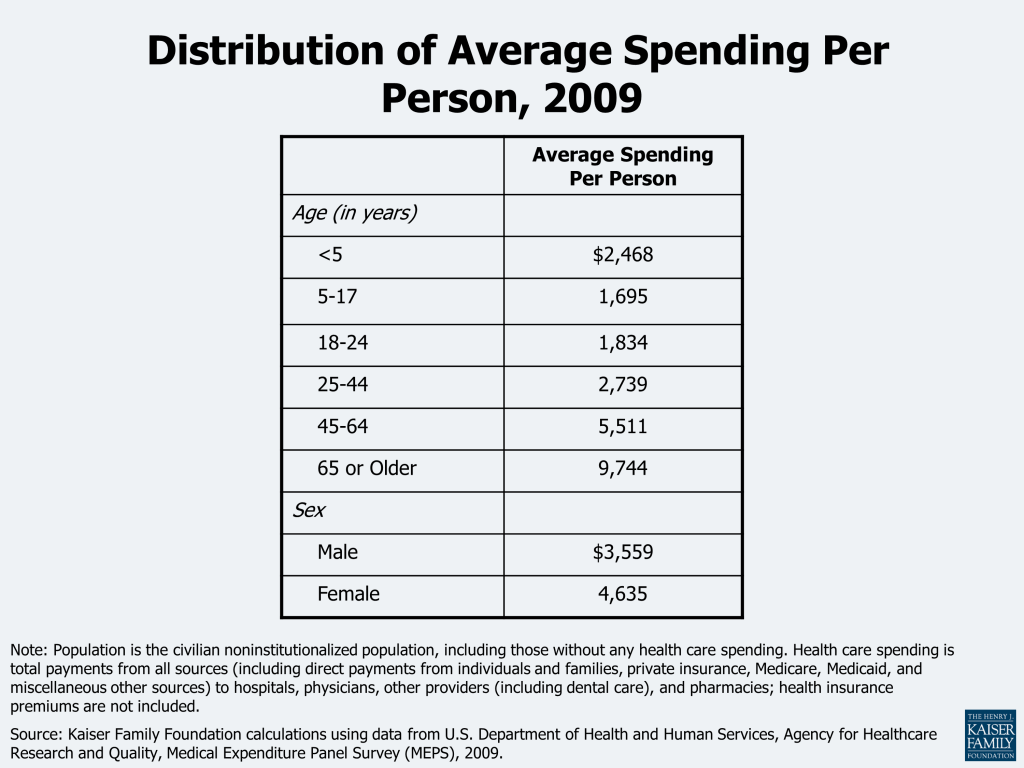
Health care spending also varies by factors such as age and sex. Average health care spending per person increased with age, although spending for children and for young adults (those aged 24 and younger) was roughly the same per person in 2009 (Figure 6). Adults aged 65 and older have the highest health care spending, averaging $9,744 per person in 2009. Women are reported to have higher average spending than men ($4,635 vs. $3,559 respectively).
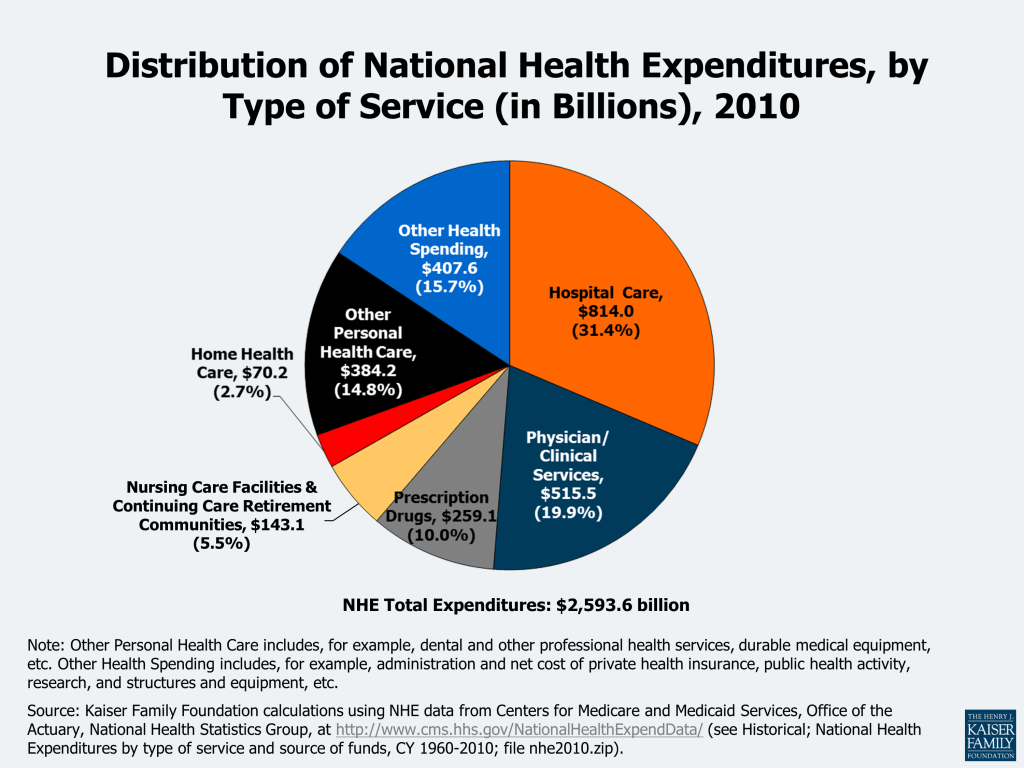
Most health care spending is for care provided by hospitals and physicians. Health care spending encompasses a wide variety of health-related goods and services, from hospital care and prescription drugs to dental services and medical equipment purchases. Figure 7 illustrates spending on health by type of expense in 2010. Spending on hospital care and physician services ($1,329.5 billion combined) makes up just over one-half of health care expenditures (51%). While spending on prescription drugs ($259.1 billion) accounts for only 10% of total health expenditures, its rapid growth has received considerable attention (a 114% increase since 2000, compared to 88% for both hospitals and physician/clinical services combined. However, the 2010 average annual spending growth from 2009 was lower for prescription drugs (1.2%) than for hospitals (4.9%) or physicians/clinical services (2.5%).
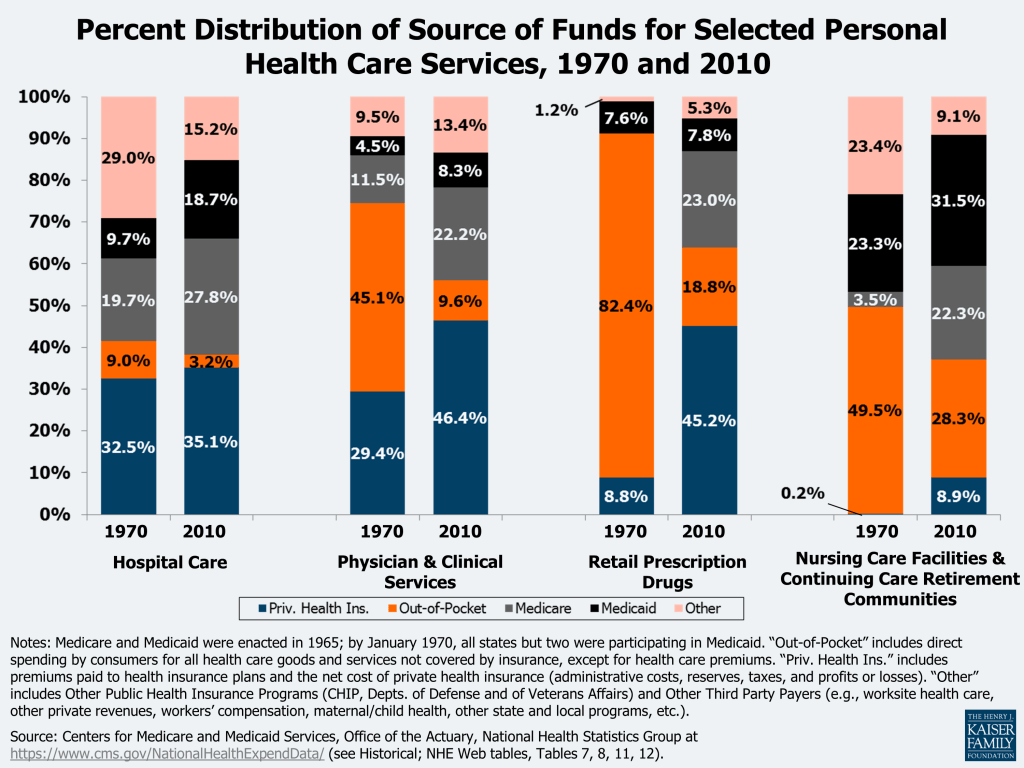
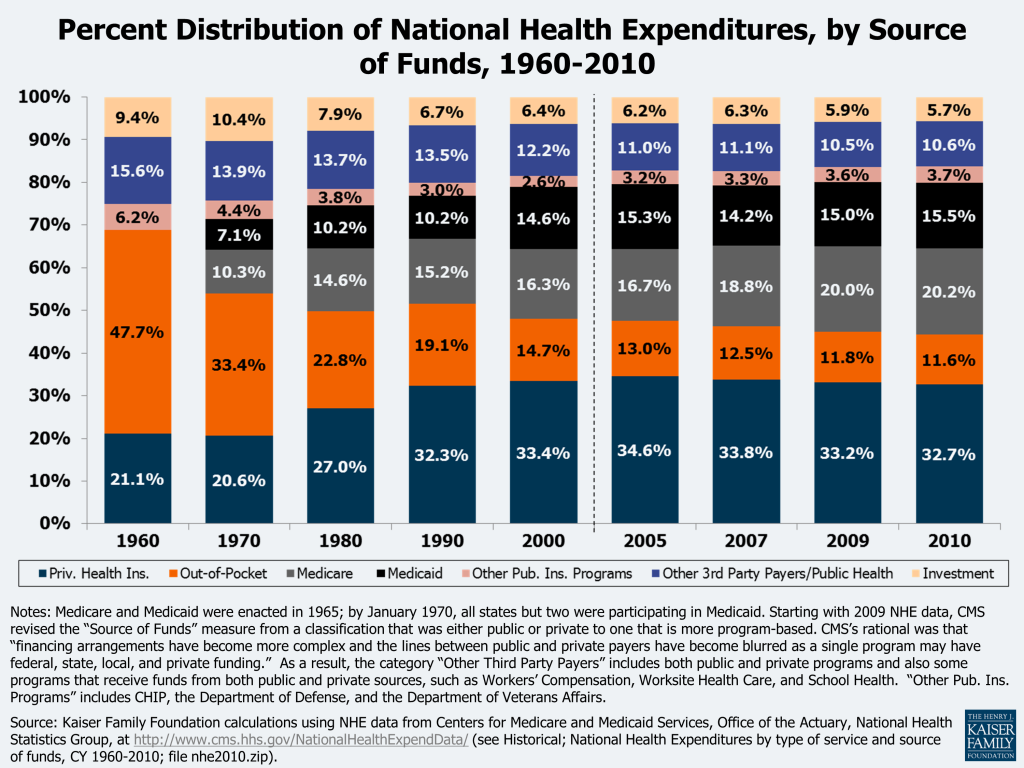
The relative contributions from the different sources of funding for personal health care services and for total national spending have changed considerably over the past decades. Figure 8 shows that, for most services, Medicare and Medicaid’s share of costs has risen (note that these programs were not enacted until 1965; by January 1970, all states but 2 were participating in Medicaid), while the shares from patient out-of-pocket costs have declined. Private health insurance’s portions have increased for physician and clinical services and retail prescription drugs, but decreased for nursing care. The shares of out-of-pocket costs for physician services and retail prescription drugs have declined. Figure 9 shows how the distribution of sources of funding for total national health expenditures has changed over time, with shares of private health insurance, Medicare, and Medicaid increasing, and a decrease in out-of-pocket shares. The shares of most sources have held relatively steady in recent years.
The annual percent increase for all sources of funding except out-of-pocket declined in 2010, although the cumulative increase since 2000 was less for out-of-pocket than for Medicare, Medicaid, and private health insurance. Of the major sources of national health spending, only out-of-pocket spending (which includes direct spending by consumers for all health care goods and services except private health insurance premiums) increased more in 2010 than in 2009 (1.8% vs. 0.2%) (Figure 10). CMS attributes this higher cost-sharing growth in 2010 to higher cost-sharing requirements for some employer plans, consumers’ switching to plans with lower premiums but higher deductibles and/or copayments, and the loss of health insurance coverage.13 However, the cumulative increase in out-of-pocket spending since 2000 is less than for other sources of funding (Figure 11).
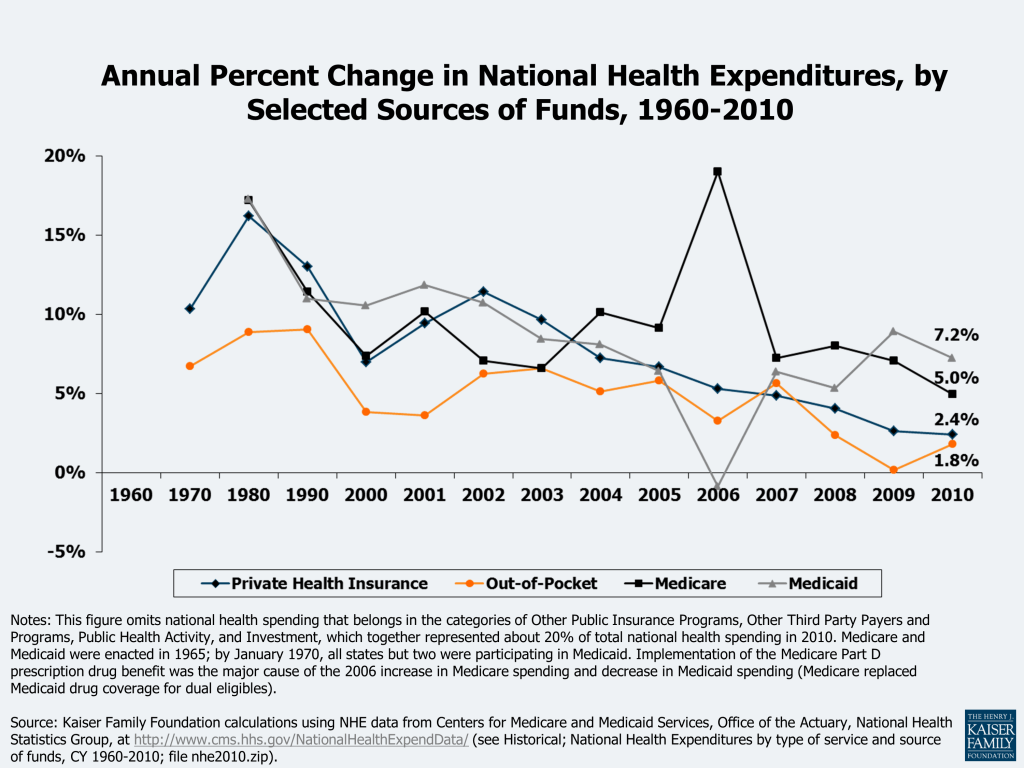
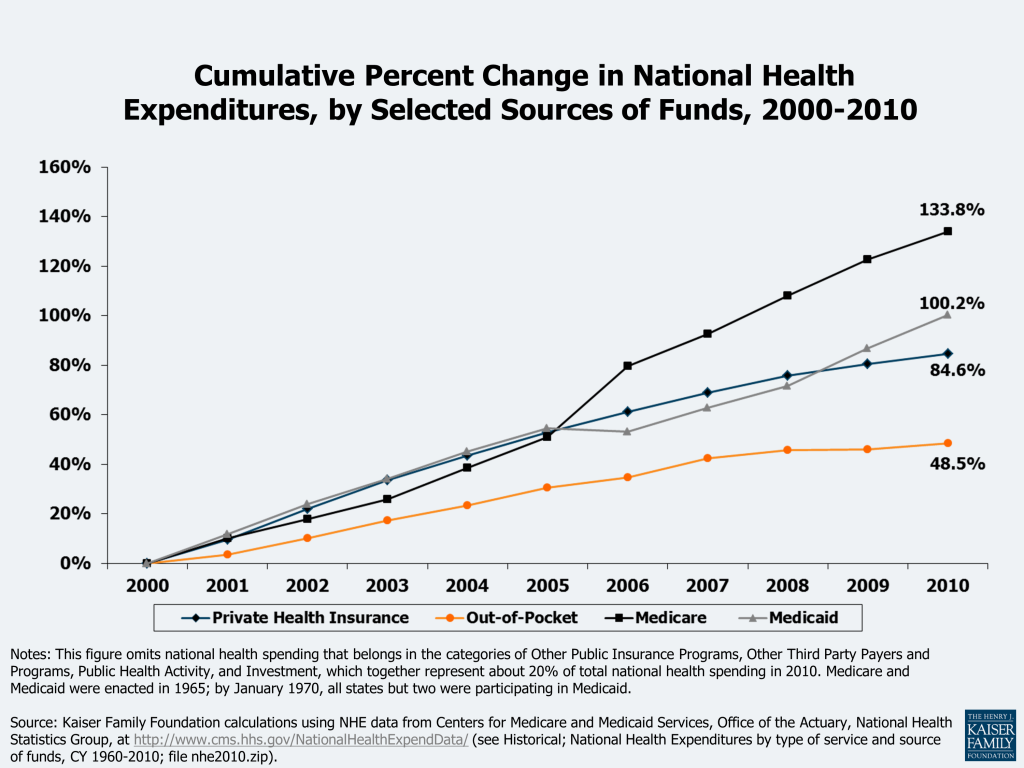
Several figures in this primer show the cumulative percent change in private health insurance or health insurance premiums (Figures 11, 15, and 20). These cumulative increases may vary from figure to figure because different years are used, the data sources differ, and what is being measured varies. Figure 11 uses the private health insurance category of the HHS national health expenditure data, which includes both private employer and individual health insurance premiums drawn from a number of sources, the medical portion of accident insurance, and the net cost of private insurance (including administrations costs, additions to reserves, rate credits and dividends, premium taxes, and profits or losses). Figure 15 uses family of four premium data from an annual employer survey of private and public employers conducted by the Kaiser Family Foundation and the Health Research & Educational Trust. Figure 20 uses family of four private sector premium data from the Medical Expenditure Panel Survey conducted by the Agency for Healthcare Research and Quality.
Private funds are the largest sponsor of health care payments (55% in 2010, compared to 45% from government funds), although over time their share has declined. Starting with the 2009 NHE data, CMS expanded their focus on spending by Type of Sponsor, which provides estimates of the individual, business, or tax source that is behind each Source of Funds category – i.e., the entity that is ultimately responsible for financing the health care bill. For example, private health insurance is considered a private source of funding but in the sponsor analysis, it is divided into business, household, and government sponsor categories based on who bears the underlying financial responsibility for the health insurance premiums.
Figure 12 illustrates the distribution of national health expenditures by type of sponsor. The federal government financed the largest share (29% in 2010), an increase from 19% in 2000; households financed a similar share (28%), a decline from 32% in 2000. The share of the total health care bill financed by state and local governments, and private businesses also declined over the same period.
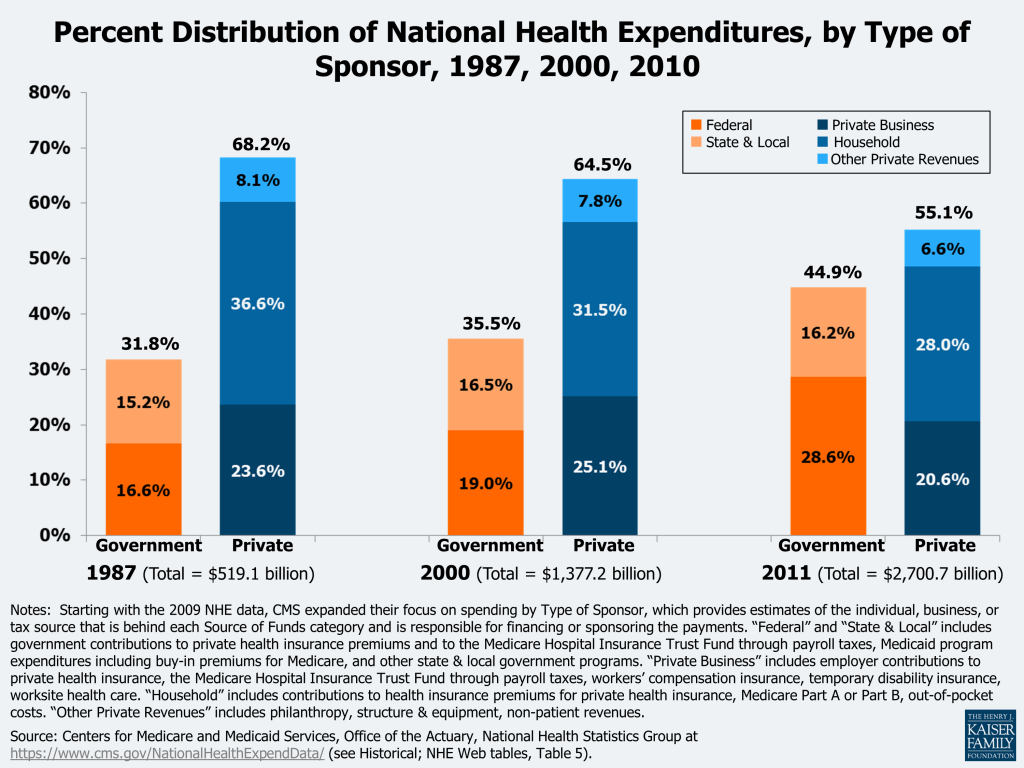
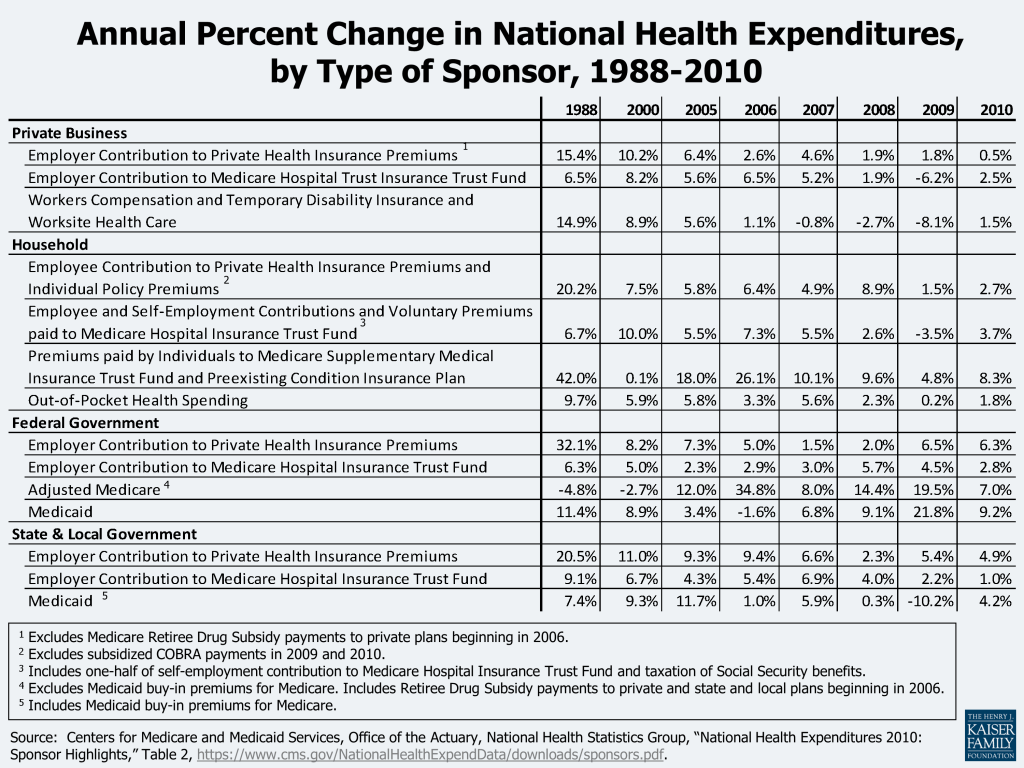
Figure 13 provides detail about the annual percent changes in components of the Type of Sponsors categories. Employer contributions to private health insurance premiums have declined since 1988, increasing only 0.5% in 2010 compared to a 2.7% increase in employee contributions to private and individual health insurance premiums. CMS reports that low growth in private business’ health spending resulted from recession-related job losses together with declines in private health insurance enrollment.14 The household share of spending has declined since 1988, partially explained by the decline in the growth of out-of-pocket costs paid directly by consumers. However, all categories of household spending increased in 2010 at levels greater than in 2009. Federal government health care spending growth declined in 2010 as a result of slowdowns in the rates of growth in Medicare and Medicaid spending, according to CMS, primarily due to a steep deceleration in Medicare Advantage spending and a slower growth in Medicaid enrollment). State and local government spending increased primarily because of Medicaid, which represented 32% of state and local government health spending in 2010.
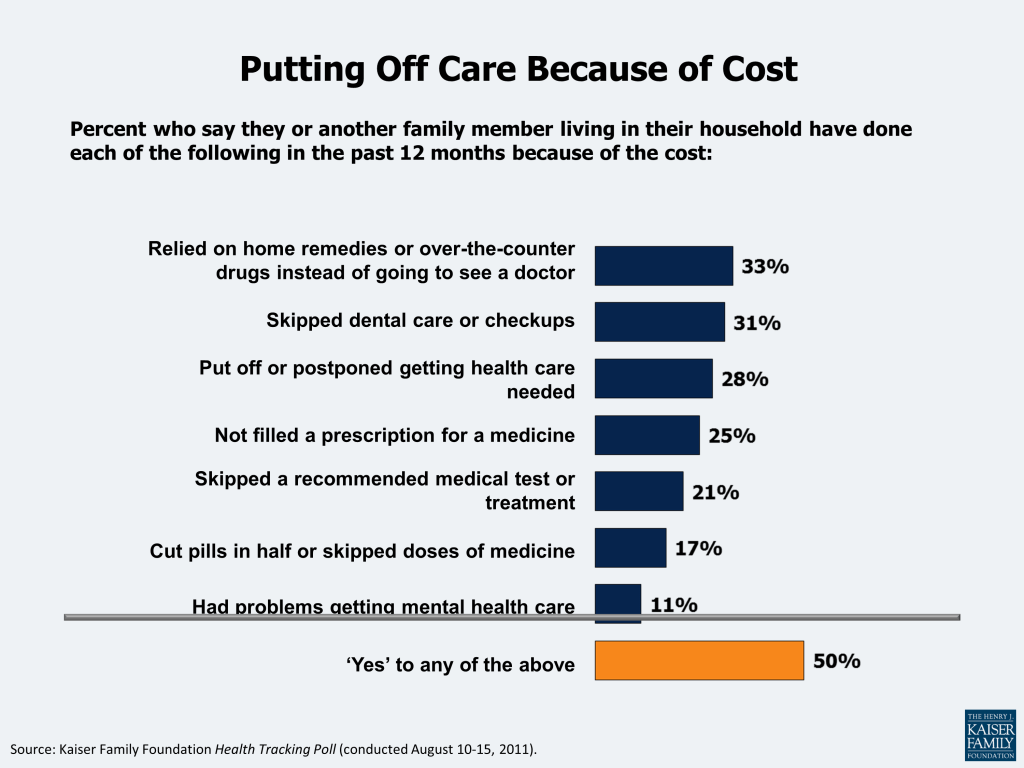
Rising health care costs result in families cutting back on care and facing serious financial problems. A Kaiser Health Tracking Poll found that half (50%) of Americans say their family cut back on medical care in the past 12 months because of cost concerns by, for example, relying on home remedies and over-the-counter drugs rather than visiting a doctor (33%), skipping dental care (31 %), and postponing getting health care they needed (28%)15 (Figure 8). Seventeen percent said they experienced serious financial problems due to family medical bills, with 11% using up all or most of their savings, 11% saying they have been contacted by a collection agency, and 7% reporting being unable to pay for basic necessities like food, heat, or housing.16 Beyond actual financial hardship due to medical care, 4 in 10 Americans (40%) report that they are “very worried” about having to pay more for their health care or health insurance.17
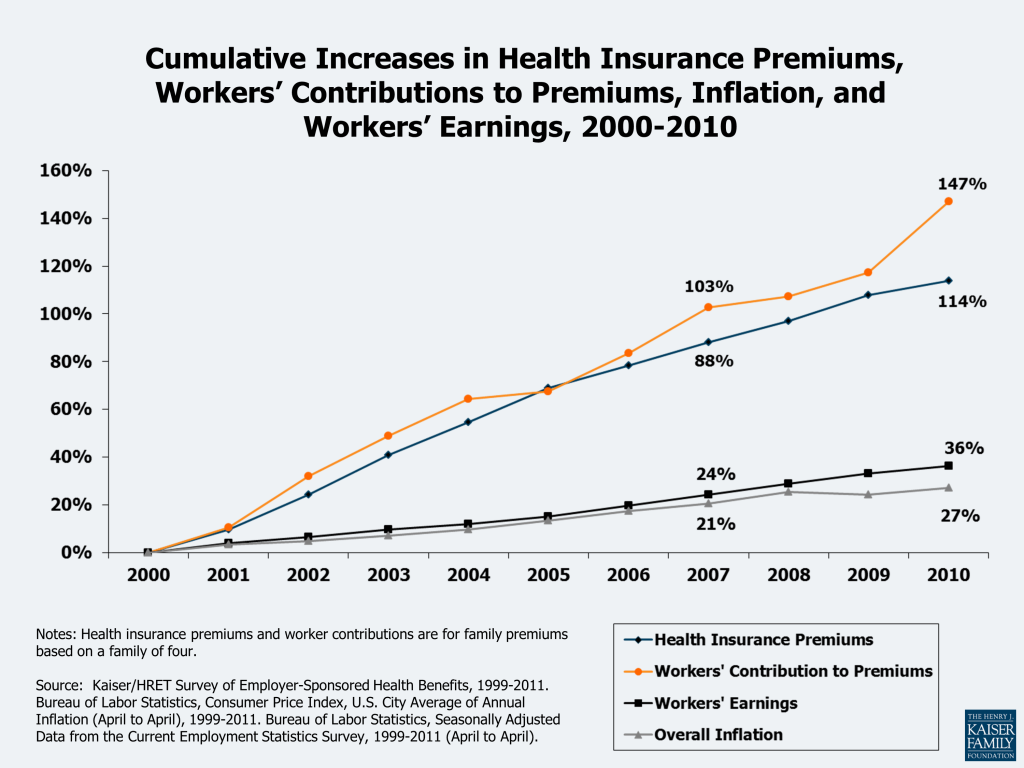
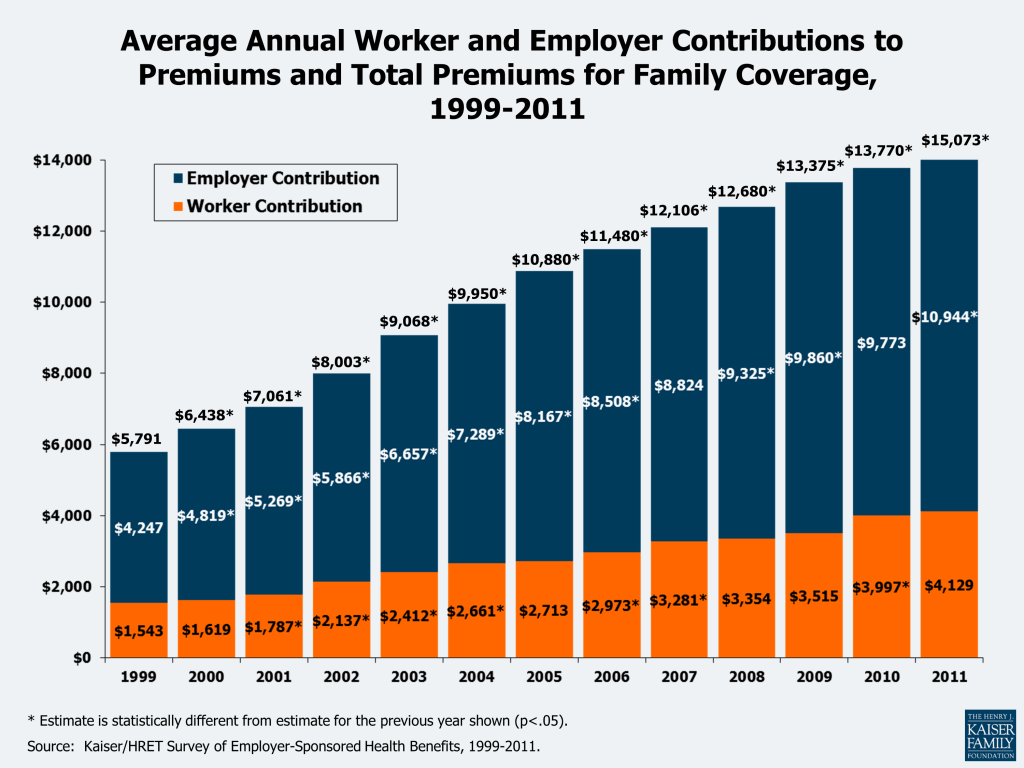
Health insurance premium increases consistently outpace inflation and the growth in workers’ earnings. The growth in health insurance premiums is a straightforward way to measure changes in the cost of private health insurance. As health care costs increase, it becomes increasingly difficult for families and businesses to purchase coverage because the price of coverage (the premium) typically increases. Employers, as purchasers of insurance, may also decide to increase the amount covered workers must pay to visit the doctor or go to the hospital (the cost sharing), which can put pressure on family budgets when family members become ill. Figure 15 compares the annual increase in employer premiums to both worker earnings growth and overall inflation. Premium growth has outpaced the growth in workers’ earnings almost every year. Whereas premium increases have been between 3 and 13% per year since 2000, inflation and changes in workers’ earnings are typically in the 2 to 4% range. This usually means that workers have to spend more of their income each year on health care to maintain coverage. Again, these effects may either be direct – through increased worker contributions for premiums or reduced health benefits – or indirect – such as when employers reduce wages or limit wage increases to offset increases in premiums. Average annual worker and employer contributions to total premiums have increased since 1999, with the worker contribution for family coverage increasing from $1,543 in 1999 to $4,129 in 2011 (Figure 16).
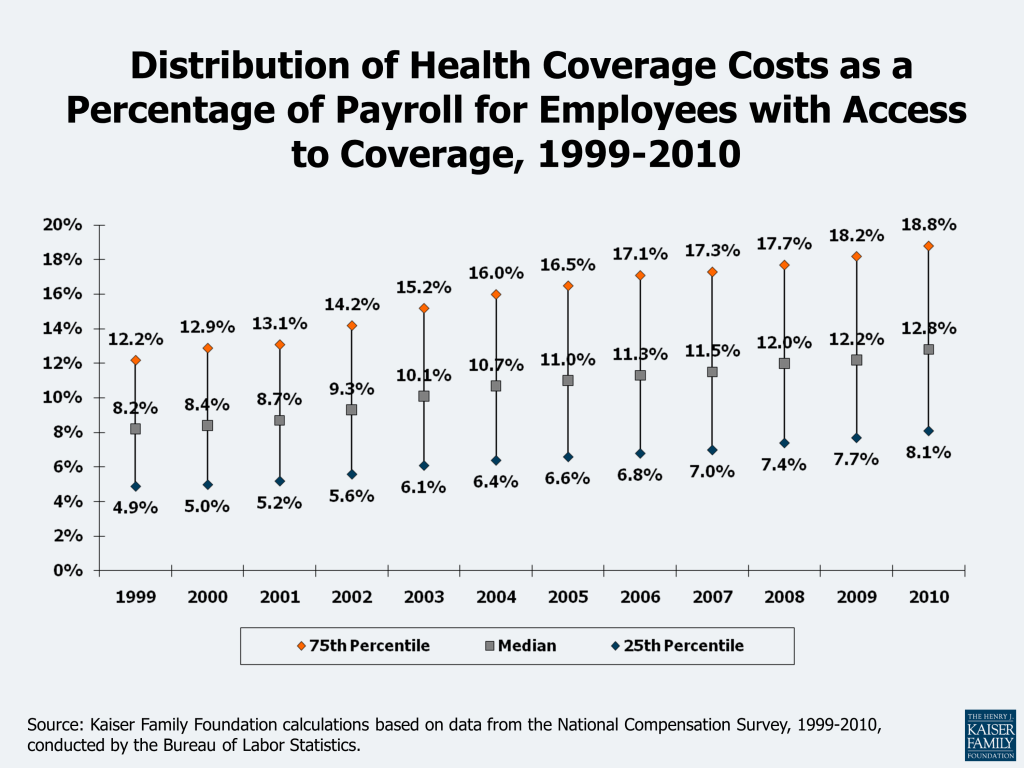
Employer shares of payroll going toward health insurance costs continue to rise. Among workers with access to health insurance at their job, the percentage of payroll paid by employers for health insurance has risen steadily in recent years. The median employer contribution (i.e., it was higher for one-half of workers and lower for the other half of workers) was 12.8% of payroll in 2010, up from 8.2% in 1999 (Figure 11). These percentages reflect contributions by employers for the cost of health insurance and do not include amounts that employees are required to contribute for their share of the premiums. There is significant variation across the workforce in the share of compensation going toward health insurance: 25% of workers with access to health insurance at work had employer costs for health insurance that were equal or less than 8.1% of payroll in 2010, while another 25% had employer costs for health insurance that were equal to or exceeded 18.8% of payroll. Employers contributed higher amounts, measured in cents per hour, for workers in higher-wage occupations than workers in lower-wage occupations. Viewed as a percentage of payroll, however, employer costs for health insurance represent a greater share of compensation for workers in lower-wage occupations than for workers in higher-wage occupations (see http://www.kff.org/insurance/snapshot/Employer-Health-Insurance-Costs-and-Worker-Compensation.cfm).
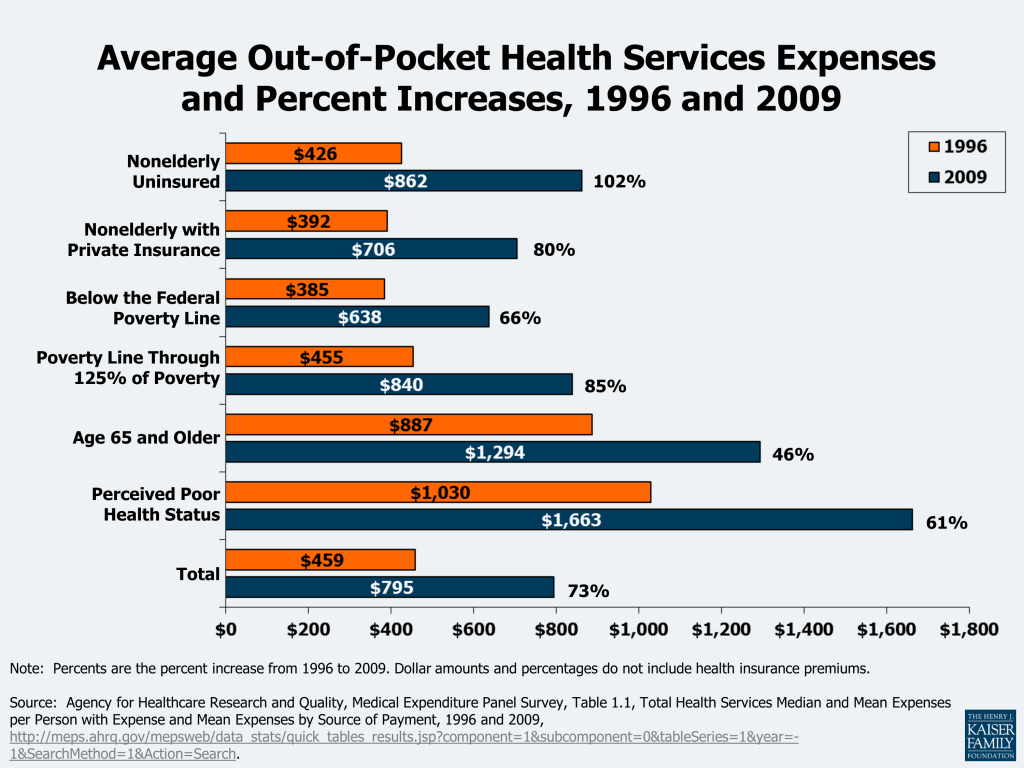
Families also are paying more out-of-pocket for health care. Another way of gauging the burden of rising health costs on households is to look at family medical out-of-pocket payments. These payments include the medical expenses of the uninsured and, for the insured, cost sharing (deductibles, coinsurance, and copayments) for covered services and amounts not paid for by insurance, such as out-of-network balance billing expenses and payments for non-covered services. While out-of-pocket spending as a share of total national health spending has declined (Figure 9) over time, the actual dollar amounts that families spend for medical services continue to rise (the reason that the out-of-pocket share of total spending continues to fall is that the amounts paid by private insurance and government programs have risen faster than the amounts paid out-of-pocket by families). In 2009, the average expenses paid out-of-pocket for medical services were $795, an increase of 73% over the $459 spent in 1996 (Figure 18). Average out-of-pocket expenses were higher for the elderly ($1,294 in 2009) and those who reported being in poor health ($1,663 in 2009). The nonelderly uninsured paid, on average, $862 out-of-pocket in 2009, compared to $706 for those with private insurance. Those whose poverty status was negative or poor (below the Federal poverty line, which was $22,050 in 2009 for a family of 4) paid $638 of their medical expenses out-of-pocket in 2009; for the near poor (over the poverty line through 125% of the poverty line), it was $840.
A recent survey found that more than one in five Americans (21%) were in families reporting problems paying medical bills in 2010, an increase over the 15% in 2003.18 The 2010 proportion (21%) was similar to the 19% in 2007, which the authors indicate may be attributable to a decreased use of medical care by people who lost jobs and health insurance during the 2007-2009 recession and those who reduced their medical care because of uncertain economic conditions. The uninsured were more likely than the insured (32% vs. 20%) and the low income were more likely than those with higher income (29% vs. 9%) to be in families with medical bill problems. Survey respondents reported that some of the financial consequences of their medical bill problems included problems paying for other necessities (66%), contacted by a collection agency (65%), and took money out of savings (65%). One in four (25%) thought about filing for bankruptcy and, of those, 20% did so (i.e., about 5% of all people in families with medical bill problems filed). For those with problems paying medical bills, the average family medical debt was $6,500 in 2010; 33% owed $5,000 or more. More than half (55%) had paid off none or just a little of the debt.
Examining the financial burden of out-of-pocket spending among the nonelderly finds that those with chronic medical conditions experience higher costs relative to their income. In 2008, 27% of those with 3 or more chronic conditions had out-of-pocket medical costs (including family contributions for health insurance premiums) that exceeded 10% of their income, compared to 16% with 1 chronic condition, 14% with acute medical conditions, and 11% with no medical conditions (Figure 19).
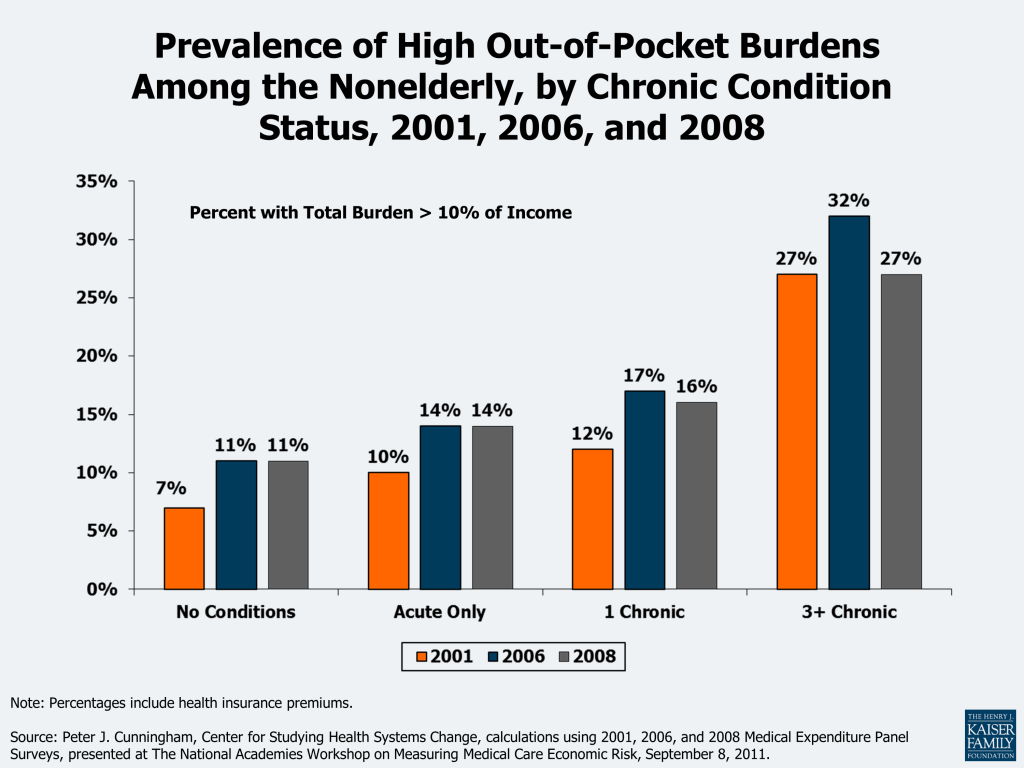
Health care costs have a significant impact on people’s income. A recent study found that although a median-income family of four’s monthly income increased by $1,910 from 1999 to 2009, this gain was offset to a great extent by increased spending on health care ($820, or 43% of the income growth), including health insurance premiums, out-of-pocket health spending, and taxes devoted to health care (not adjusted for inflation).19 Ongoing research into measures of poverty has found that health care costs are a significant expenditure for families and individuals. Recent analysis by the Census Bureau found that of the various types of expenses that could be used in the development of a new supplemental measure of poverty, out-of-pocket medical costs has the largest effect, potentially increasing the rate of those in poverty from 12.7% to 16.0% in 2010, a difference of about 10 million people, with the greatest impact for those age 65 and older.20 Research continues on the supplemental poverty measure, including an adjustment for the medical expenses of the uninsured.
Eligibility standards for public programs such as Medicaid and CHIP do not keep pace with rapid increases in the cost of health coverage. Public programs provide health insurance coverage to people who are considered too poor to afford the full cost of coverage on their own. Medicaid also covers many children and individuals with disabilities who may not be able to afford or find private coverage to meet their needs. Eligibility for these programs is generally restricted to people in families with incomes at or below specific poverty levels (although it varied by state, as of January 2012 the median eligibility threshold at which children qualified for Medicaid or CHIP was 250% of poverty; Medicaid coverage for parents was much lower than for children, with the median eligibility threshold for working parents at 63% of poverty and for jobless parents at 37% of poverty).21 The cost of health insurance, however, has risen substantially faster than the increase in FPL over time (Figure 20). For people whose income just exceeds the eligibility standards for public coverage, the share of family income required to pay for private health insurance increases substantially (see example at http://www.kff.org/insurance/snapshot/chcm021507oth.cfm). Lower and moderate income families will receive assistance in 2014 under the ACA with the implementation of new tax credits that will be available to help them pay for private health insurance.
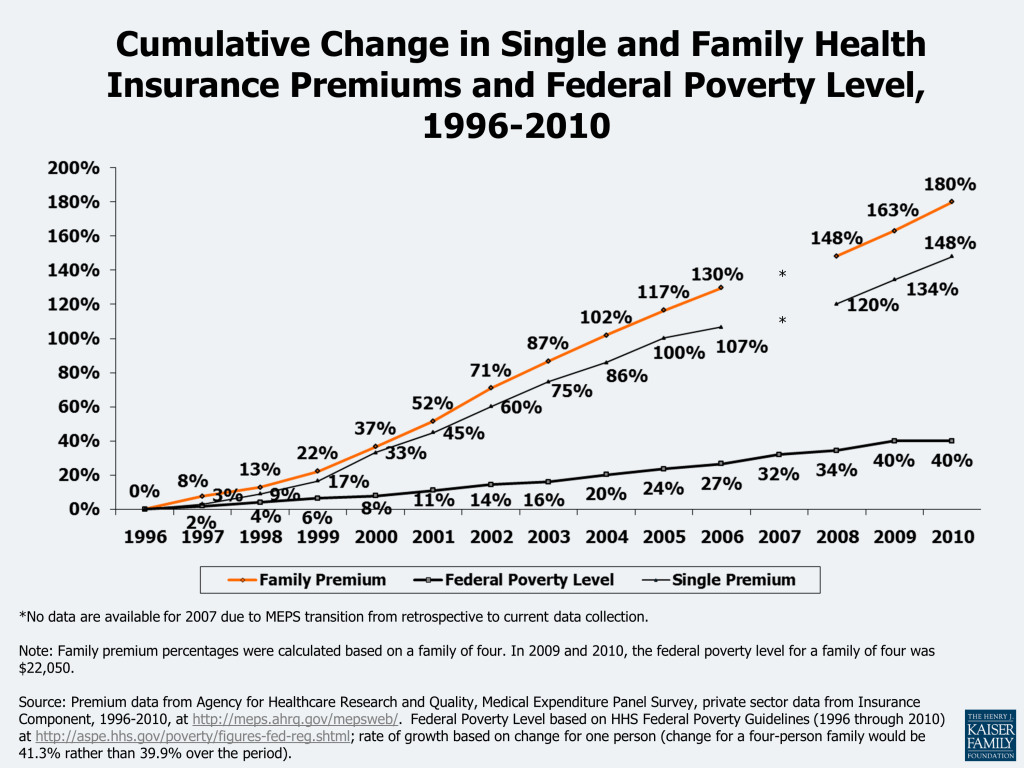
As shown in Figure 1, the portion of the economy devoted to health care has risen steadily for at least 50 years, rising from 5.2% of GDP in 1960 to 17.9% of GDP in 2010. CMS estimates that nearly one-fifth (19.8%) of GDP will be devoted to health care by the year 2020.22 Although recent increases in health care spending have declined relative to increases in the GDP, the questions still remains — why does spending on health care grow faster than overall economic growth?23
Wealthier countries can afford to spend more on health care technologies. Studies looking at the United States and other economies have found a strong correlation between wealth and health care spending – as nations become wealthier, they chose to spend more of their wealth on health care.24 Nations can spend more because the health care community continues to learn more every day about human health and health care conditions and, with that knowledge, is constantly expanding the inventory of health care products, techniques, and services that are available to address those conditions. Health care experts point to the development and diffusion of medical technology as primary factors in explaining the persistent difference between health spending and overall economic growth, with some arguing that new medical technology may account for about one-half or more of real long-term spending growth.25
The U.S. population is getting older and disease prevalence has changed. Other factors also influence spending growth. The U.S. population is aging (CBO estimates that the number of people age 65 or older will increase by about one-third between 2012 and 2022), and because older people have more health problems and use more health care than younger people, population aging will have a small but persistent impact on cost growth in the years to come.26 Increases in disease prevalence, particularly chronic diseases such as diabetes, asthma, and heart disease, coupled with the growing ability of the health system to treat the chronically ill, contribute to the high and growing levels of health spending. Rising obesity levels are another factor which may be influencing cost growth, but other trends, such as lower levels of smoking and alcohol consumption, may have a moderating effect.27 A small share of the population accounts for a high proportion of costs (see Figure 5). Developments in medicine and medical technology enable people who otherwise might have died to live longer, though perhaps with chronic conditions such as cancer or HIV/AIDS which require ongoing medical care.
Insurance coverage has increased. Government subsidies for health coverage also affect cost levels and potentially cost growth. Tax subsidies for health insurance and public coverage for certain groups (poor, disabled, and elderly) reduce the cost of health care to individuals, encouraging them to use more of it. Some argue that the high prevalence of health insurance encourages health technology development because those developing new technologies know that insurance will bear a substantial share of any new costs.28
Americans pay a lower share of health expenses than they used to. Another factor that may help explain rising health spending is the falling share of health care expenditures that Americans pay out-of-pocket.29 Between 1970 and 2010, the share of personal health expenditures paid directly out-of-pocket by consumers fell from 40% to 14%. Although consumers faced rising health insurance premiums over the period which affected their budgets, lower cost sharing at the point of service likely enabled consumers to use more health care, leading to expenditure growth.
Unnecessary spending in the US health care system. Some have estimated that 20% or more of total health care expenditures is due to various forms of waste, including overtreatment, failures of care coordination, failures of care delivery, administrative complexity, pricing failures and fraud and abuse.30 Other studies found that from $600 billion to $850 billion in waste could be cut annually from the U.S. health care system, and if waste reduction could be applied over the next 10 years, $3.6 trillion in wasteful spending could be saved, which is 10% of projected health care expenditures over the time period.31 Unnecessary or inappropriate treatments and tests are believed to contribute to the high level of health care costs, most recently addressed by the recent Choosing Wisely campaign, where nine physician groups (more in the future) have identified commonly used tests or procedures they say are often not necessary.32 Inefficiencies in medical care delivery and financing also contribute to health care costs. Wide variation in the use and cost of services across providers and in different geographic areas has called into question the appropriateness and value of the care received. The role of provider payment has also been cited as contributing to increased costs by, for example, encouraging the use of specialists or profitable equipment. The lack of integrated, efficient systems to electronically store and transmit health data is said to contribute to higher costs and limit the data available to study treatment effectiveness.33
Recent slow-down in health spending. The slower growth in health care spending in recent years is attributed to the downturn in the US economy in 2008 and 2009. As unemployment rose during the recession that lasted from December 2007 through June 2009, people lost their jobs and often their health insurance as a result. Even those with insurance used fewer health care goods and services given financial uncertainties. Economic recessions have historically had a lagged impact on health care spending because insurance contracts typically lock-in premiums and benefits for a year, and when consumers lose their jobs, they may maintain their coverage through COBRA, a spouse’s policy, or a public program. But the slowdown in health spending from the most recent recession occurred sooner than in previous recessions because of, according to CMS, “the highest unemployment rate in 27 years, a substantial loss of private health insurance coverage, employers’ increased caution about hiring and investing during the recovery, and the lowest median inflation-adjusted household income since 1996.”34 Others attribute a longer-term slowdown to the moderation of rapid growth following the backlash against managed care in the late 1990s and changes in benefit design to higher enrollee cost sharing.35 As the economy improves, increases in health care spending may return to higher levels.
Finding a way to address high costs and cost growth without unreasonably reducing access to new and needed services is a significant challenge.36 The information presented above shows that the United States faces two issues with health care costs: (1) the amount that is spent in the U.S. per person for health care is high, particularly when compared with the amounts peer nations pay for care (with almost half of U.S. health care spending used to treat just 5% of the population in 2009); and (2) health care expenditures grow rapidly relative to the economy overall, and have consistently done so for decades. Policymakers considering policy interventions related to costs need to distinguish between factors that affect how much health care costs at a point in time and factors that affect long-term cost growth.
Some approaches for dealing with health care costs can make spending more effficient, but will not address some of the key underlying pressures fueling long-term cost growth. Many of the policies under discussion in health policy circles to address costs – such as increasing the use of electronic medical records and other information technology, promoting evidence-based medicine, reducing unnecessary service use, a provider payment reform such as medical homes and accountable care organizations, changing the tax treatment of health benefits, consumer-directed health care, disease prevention and chronic disease management, or eliminating fraud and waste – are all largely aimed at improving the efficiency with which care is delivered. Successfully implementing any of these policies, and none of them are easy, would reduce the amount that we pay on average for care right now, but they are not likely to bring health care spending growth to down to the level of GDP growth.
For example, evidence suggests that medical errors and other quality lapses very likely increase the amount that we pay for health care, but to influence long-term cost growth, the prevalence or severity of errors and poor quality would need to be an increasing share of expenditures each year, which is probably not likely. Policies that reduce medical errors may well reduce the amount that we pay for care (and are important even if they do not). But assuming that errors can be reduced to more optimal levels, costs would likely continue to grow, albeit from a lower level, at rates that exceed economic growth in general. Other interventions intended to make the health system more efficient, such as reducing the use of unnecessary tests or disparities in health care practices across regions and providers, would likely have similar effects. Successful implementation of these initiatives such as these appear to be slowing growth because the level of costs is being rebased, but when more optimal levels are achieved, the growing demand for services (as people get wealthier) and the availability of new or better treatments and services may well push the growth rate for health care costs back up to higher levels.
The amount of unnecessary, inappropriate or wasteful care delivered in the United States is estimated to be quite high, so there is potential for substantial savings if care patterns could be improved. Recent investments in health information technology (e.g., electronic medical records, regional health information organizations) and care integration (e.g., medical homes, accountable care organizations) are among the latest efforts to attempt to address these long-standing problems and have potential to move care delivery toward a more consistent and evidence-based model. The challenge is to make health care decisions more informed and collaborative within a delivery system that is often highly disaggregated and dependent on a multiple public and private payers with varying priorities and payment approaches. A partial answer to this challenge may come from some of the new payment approaches being implemented or demonstrated by Medicare under new authority contained in the ACA (see below). In the past, successful payment strategies adopted by Medicare (such as DRGs for hospital payments and the RBRVS for paying physicians) have been widely adopted by private payers and have become industry standards. Medicare is a substantial payer and is able to exert a significant influence on the delivery system. New attention in Medicare to more integrated and accountable approaches to delivery and payment may establish organizations and systems that can be more widely adopted and reinforced by other public and private payers.
Over the longer run, the ability of the health care system to treat more conditions and deliver more care means that health care costs will grow faster than the economy as a whole. As incomes rise, societies generally spend more of their wealth on health care. Health care is a vital good and through research and innovation the health care system is able to provide new and better services and address previously untreatable conditions. Over the longer run, this continuing innovation increases health, but challenges societies to find ways to pay for the increasing costs. Bringing health spending growth closer to the rate of overall economic growth would likely require finding ways to slow the development, diffusion, and use of new health care technologies and practices. Doing so necessarily restrains spending that may improve health, so policy makers need to be mindful of the difficult tradeoffs involved in such decisions.
One approach that is widely used in other countries and is beginning to be implemented in the United States is developing approaches to explicitly assess and weigh the benefits and costs of new technologies, although such evaluations present serious challenges.37 The sheer volume and pace of medical advances would make it difficult to assess important changes before they are incorporated into medical practice; focusing on the most expensive new treatment options might be more practical and could have a meaningful impact on cost growth.38 Legislation in 2009 and 2010 has provided federal funding for the development and dissemination of comparative effectiveness research. Health technology assessment may also involve difficult decisions about whether a medical benefit is worth the cost and whether it should be covered by a public or private insurance program. For example, the National Institute for Health and Clinical Excellence (NICE), the U.K. authority charged with approving medical treatments, received widespread criticism when it excluded beta interferon to treat multiple sclerosis from the list of publicly-covered treatments.39
Another way to slow technology and innovation growth is increasing patient cost sharing. Higher cost sharing reduces demand (and for people with few resources, may essentially prevent access to some services), which over the longer run will dampen incentives for research and investment. This approach is controversial for many reasons, in large part because it can raise cost barriers to even necessary and appropriate care. There also may be limits to how high cost sharing can go before it is considered too punitive to be acceptable to employers and families purchasing coverage.
Payment and delivery system reforms also could have a moderating effect on the diffusion and use of new technologies in some cases. Payment approaches that bundle payments or otherwise shift risk to groups of providers for the cost or use of services may discourage them from investing in or using new services or technologies where value is not clear or appreciably better than current treatments. Providers that share a fixed or contingent payment for a bundle of services are likely to be critical of investments that incur new costs without corresponding benefits. As of now, very little of overall health spending is made through bundled or at risk payments, so this influence is likely to be small unless new payment approaches become more common and more coordinated delivery arrangements evolve.
Provisions in the health reform law (ACA) that affect health care costs. The ACA makes many changes to the way health coverage and health care will be provided and paid for in the future, both in public and in private settings. The law includes a requirement, with some exceptions, that people obtain health insurance, creates new sources of coverage through health insurance exchanges, provides for premium and cost-sharing subsidies for those with low incomes, significantly expands Medicaid eligibility, makes benefit changes and other changes designed to slow the growth of Medicare spending, restructures the private health insurance market, and includes numerous other health-related provisions. While the expansion of insurance coverage under the ACA will increase the level of health care spending in the short term, the Congressional Budget Office has estimated that after an initial increase, many of the law’s provisions will lower the rate of growth of health care spending over time. (FN) Many of the law’s provisions won’t be implemented until 2014.
The health care cost containment provisions in the ACA include those designed to control costs in both the short-term and long-term.40 Some of the short-term approaches, which aim to reduce the level of health care costs rather than their growth rate, include: reducing payments to providers (e.g., reducing payments to Medicare Advantage plans, reducing the update factor for Medicare hospital payments, increasing the rebates that pharmaceutical companies pay to Medicaid plans); eliminating unnecessary costs such as fraud and abuse in Medicare and Medicaid; simplifying health insurance administration by creating uniform electronic standards and operating rules for all private insurers, Medicare, and Medicaid; implementing hospital value-based purchasing programs; and establishing an approval process for generic biologic agents.
Other ACA provisions are designed to make health system changes that would address rising costs over the long term, primarily by making the delivery of medical services more efficient and less costly. A new Center for Medicare and Medicaid Innovation will create and evaluate experimental models in health care delivery, care coordination, and payment including: the Medicare Shared Savings Program where groups of health care providers known as accountable care organizations will coordinate their services to patients and will be allowed to share in any cost savings; programs to test methods to “bundle” services from different providers so that Medicare and Medicaid beneficiaries receive more coordinated and more efficient care; patient-centered medical homes for patients with chronic illness; contracts to states to develop models to improve the quality and coordination of care for patients eligible for both Medicare and Medicaid (“dual eligibles”). It is hoped that these Medicare and Medicaid models, if successful, could be applied to the total population. Other long-term approaches in the ACA include a new Independent Payment Advisory Board which, in addition to its Medicare responsibilities, is required to develop recommendations to slow the growth in private national health expenditures while preserving or enhancing quality of care. The ACA creates a private Patient-Centered Outcomes Research Institute to identify research priorities and conduct and disseminate research on the comparative effectiveness, risks, and benefits of different treatments and services so that those providing little or no value can be determined. The excise tax on high-cost employer-sponsored health plans is designed to encourage employers to make their plans more efficient and to encourage workers to use fewer services.
CMS estimates that health-spending growth due to the ACA for 2010 (the most recent data available) is estimated to be 0.2 percentage points, largely due to the provisions that affected Medicare spending.41 While estimators have done their best to predict how the ACA would affect future health spending, both federal and in total, there is admittedly significant uncertainty around the estimated costs and impact of the new law.42 The pervasive changes in financing and delivery are unprecedented, and many of the institutions and reforms have not been proven on a large scale or in diverse settings. There are questions about the potential effectiveness of the requirement to purchase coverage, the sufficiency of the premium tax credits and cost-sharing subsidies, the ability of states to implement the changes effectively, the long-term impact of the reductions in Medicare payments on hospitals and other providers, as well as about the potential effectiveness of the delivery system reforms that will take shape and be implemented over the next several years. In particular, there is hope, but as of yet only spotty evidence, that changes in health information capabilities and implementation of new payment approaches that use that information to better align reimbursement with the achievement of better health can change the trajectory of future growth in public and private health programs.
Changing the role of government in health care decisions and payments. The U.S. health care system is a mix of public and private payment and delivery arrangements. Compared to many developed countries, public health insurance plays a relatively small role in covering the population. While the vast majority of the elderly and many of the poor in the United States are covered through public health insurance programs, most of the population is covered by private health insurance, albeit with significant tax financing to help supplement premiums paid by families and their employers. Private health insurers largely mediate the price and use of services for people covered by private health insurance.
To more directly control cost growth, the United States could adopt more direct interventions that are used in some other countries. For example, the government (federal or at the state level) could set targets or caps for spending on health care services; targets could be set legislatively or the government could facilitate negotiations between provider organizations and payers. The government also could establish prices for services or even payment approaches that public and private payers would use. This approach would equalize prices across payers and focus competition on health management and customer service. On the insurance side, the government could constrain premium growth, forcing insurers to negotiate more favorable contracts with their participating providers.
At the other end of the spectrum, the United States could lower health care spending by reducing the role of government in the health care system. Critics of government involvement argue that reducing the government role would result in a leaner, more efficient system that spends less. For example, reducing or eliminating the tax preference for employer-provided insurance would reduce its value to employees (relative to more wages) and would likely result in employers offering less generous coverage which would likely reduce the amount of health care on average that enrollees consume.43 Reducing federal and state regulation of health plans and health benefits would reduce administrative costs and permit insurers to offer leaner benefit packages at lower premiums. Spending for public health programs could also be lowered by paring benefits or requiring larger beneficiary cost sharing, each of which would reduce the amount of care sought by beneficiaries.
Large changes that either expand or reduce the current roles that governments play in the health care system are likely to be very controversial and difficult to accomplish in the current political climate, where there is a deep partisan division over the role of government generally and in health care specifically. Direct government intervention in pricing is uncommon in the United States, and the vigorous opposition to even a public health insurance option in the recently enacted ACA suggests that a broader role for government is unlikely in the foreseeable future. Dramatic deregulation or significant reductions in federal support for health care would also be difficult to sustain politically because they would be viewed as a take away by large numbers of people who would be directly affected. Incremental changes, such as those in the ACA, are more acceptable politically (although the ACA was passed overwhelming on partisan lines), but are unlikely to produce more than modest changes to the cost of health care in the United States.
Improving population health. Studies have shown that a disproportionate share of health spending is used to treat chronic and often preventable diseases such as diabetes, obesity,44 and heart disease.45 Efforts to improve population health could have a long-term effect on disease prevalence and help reduce health care spending. Efforts could include increased spending on public health activities including community efforts, providing insurance and workplace health promotion and disease prevention programs, encouraging adherence to medical guidelines for prescription drugs, and educating patients about the benefits of a healthy life-style and treatment options.
Policymakers face significant challenges, short and longer term, as they think about how the nation will pay for the growing cost of health care. The health reform legislation enacted in 2010 (the ACA) contains provisions designed to achieve health care cost containment. But there are so many facets to health care reform — expanding coverage for the uninsured, reducing health care costs for individuals and employers, controlling entitlement spending for government programs such as Medicare and Medicaid, and reforming the health care delivery system, to name a few — that it is unclear how cost containment provisions will prosper in the dramatically changing health care environment. Successfully improving the efficiency and quality with which care is delivered is an enormous challenge, one that will require substantial investment in research, new information systems, performance incentives, and education, with the hope of transforming how health care is delivered by thousands and thousands of providers dispersed across our largely disaggregated health care system. Coming to terms with the potential of medical technology and its long-run influence on costs is a different type of challenge, but one that is also important. The advances in health care that have occurred over the past half-century have increased how long we live and have reduced the burden of disease for countless people. Developing the philosophical, ethical, and political framework necessary to balance the benefits of future advances with our ability to pay for them is one of the next great challenges for health policy.
This issue brief provides a summary of the major policies and statutory requirements governing U.S. participation in international family planning and reproductive health efforts. These laws and policies collectively direct how funds are spent, which organizations receive funds and generally shape U.S. family planning and reproductive health activities around the world. This issue brief is complemented by the Kaiser Family Foundation fact sheet The U.S. Government and International Family Planning & Reproductive Health: Statutory Requirements and Policies, which provides an update on the current status of these policies and requirements. Issue Brief (.pdf)
The increased public attention to the Affordable Care Act (ACA) generated by the Supreme Court’s consideration of the law did not meaningfully change the public’s opinion of the law overall or of the specific provision at the heart of the legal case against it, the individual mandate. Forty-two percent say they have a favorable opinion of the law this month and 43 percent have an unfavorable one, a division virtually unchanged from March. Similarly, the mandate is as unpopular as it was in last month, but not more so. But, the Supreme Court challenge did appear to have an impact on Americans’ sense of familiarity with the ACA. In April three in four Americans are aware that the individual mandate is part of the health care law, up from 64 percent before the Court heard oral arguments last month. And the proportion who feel they understand how the law will impact them jumped up 12 percentage points to 51 percent.
Although most Americans (63 percent) don’t expect to have to change anything about their health coverage when the mandate takes effect in 2014, nearly three in ten do believe they will have to make some change to their current insurance arrangements. For more on the survey, including updated numbers on public confidence in the Supreme Court, check out the topline, charts, and summary document of the poll findings.
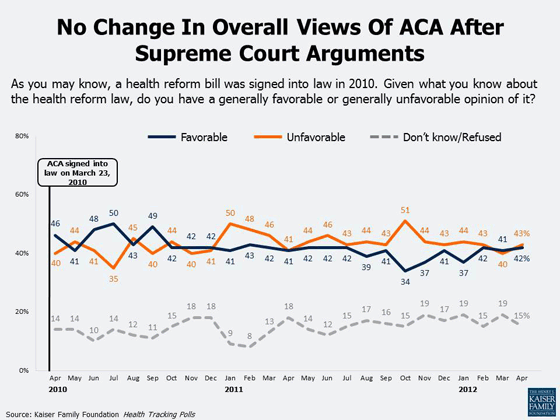
One mechanism for ensuring that health insurance provides value to consumers for the premiums that they pay, or that others pay on their behalf, is to require insurers to meet a minimum “medical loss ratio” or MLR standard. The MLR is the share of premium revenues that an insurer or health plan spends on patient care and quality improvement activities, as opposed to administration and profits. In a recent 50-state survey on Medicaid managed care, conducted by the Kaiser Family Foundation’s Commission on Medicaid and the Uninsured with Health Management Associates, 11 states – Arizona, the District of Columbia, Hawaii, Illinois, Indiana, Maryland, New Jersey, New Mexico, Ohio, Virginia, and Washington – reported that they have minimum MLR requirements for their Medicaid MCOs.
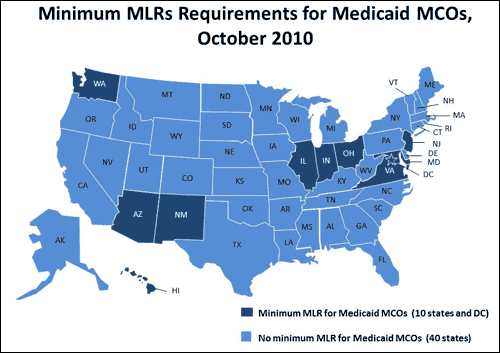
SOURCE: A Profile of Medicaid Managed Care Programs in 2010: Findings from a 50-State Survey
As explained in a related fact sheet, the Affordable Care Act (ACA) requires that, beginning in 2011, insurers in the large group market meet an MLR standard of 85% annually, and insurers in the small group and individual markets meet an MLR standard of 80%. Insurers that fail to meet these thresholds must pay rebates to their enrollees. The law permits the HHS Secretary to adjust the MLR requirement for individual coverage in a state if applying the 80% standard would destabilize the state’s individual insurance market. Seventeen states requested such MLR waivers, and the Secretary approved them for seven states (GA, IA, KY, ME, NV, NH, and NC) and rejected them for ten (DE, FL, IN, KS, LA, MI, ND, OK, TX, and WI). The ACA also requires a minimum MLR of 85% for Medicare Advantage Plans, beginning in 2014. Plans that do not meet the standard must make refunds to the HHS Secretary, and increasingly strict penalties apply for plans that fail the MLR standard more than two years in a row.
The ACA’s MLR requirements do not apply in Medicaid. This is of interest because about half of all Medicaid beneficiaries, around 27 million people, are enrolled in comprehensive, capitated managed care organizations (MCOs), and over half of these Medicaid beneficiaries are in for-profit plans. Increasingly, many states are expanding Medicaid managed care to include individuals with more complex and costly health care needs, including persons with disabilities, and “dual eligibles,” who qualify for both Medicare and Medicaid. Further, states are expected to rely heavily on MCOs to serve the 16 million additional Americans projected to gain Medicaid coverage by 2019 under the ACA.
A recent action by CMS suggests that an MLR standard in Medicaid could emerge as a federal requirement as states seek to move more and more Medicaid beneficiaries into managed care on a mandatory basis. On December 15, 2011, when CMS granted Florida an extension of its 1115 demonstration waiver, which mandates managed care for most Medicaid beneficiaries in five counties, the agency required, as one condition of the waiver extension, that MCOs in the demonstration counties meet an 85% MLR threshold beginning July 1, 2012, and provide documentation to the state and CMS to show ongoing compliance. This marks the first time CMS has ever made its approval of a state’s waiver request contingent on a minimum MLR requirement for health plans contracting with Medicaid.
The 11 states that applied MLR requirements to their Medicaid MCOs as of October 2010 reported minimum MLR thresholds ranging from 80% to 93%; most states consider direct care management a medical cost rather than an administrative one. Three states – California, Michigan, and Minnesota – indicated plans to establish an MLR requirement in Medicaid in the future. In a more recent development, Louisiana required a minimum MLR of 85% in its contracts with MCOs as the state implemented the first phase of its shift to capitated managed care in Medicaid.
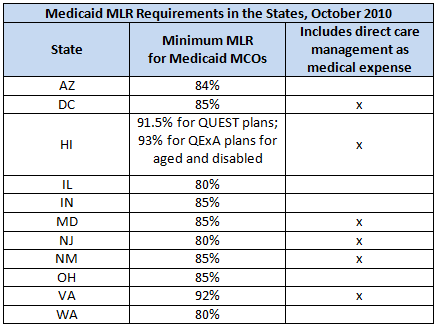
SOURCE: A Profile of Medicaid Managed Care Programs in 2010: Findings from a 50-State Survey