| Patient Protection and Affordable Care Act (P.L. 111-148) |
| Overall approach to expanding access to coverage | - Require most U.S. citizens and legal residents to have health insurance. Create state-based American Health Benefit Exchanges through which individuals can purchase coverage, with premium and cost-sharing credits available to individuals/families with income between 133-400% of the federal poverty level (the poverty level is $19,530 for a family of three in 2013) and create separate Exchanges through which small businesses can purchase coverage. Require employers to pay penalties for employees who receive tax credits for health insurance through an Exchange, with exceptions for small employers. Impose new regulations on health plans in the Exchanges and in the individual and small group markets. Expand Medicaid to 133% of the federal poverty level.
|
| INDIVIDUAL MANDATE |
| Requirement to have coverage | - Require U.S. citizens and legal residents to have qualifying health coverage. Those without coverage pay a tax penalty of the greater of $695 per year up to a maximum of three times that amount ($2,085) per family or 2.5% of household income. The penalty will be phased-in according to the following schedule: $95 in 2014, $325 in 2015, and $695 in 2016 for the flat fee or 1.0% of taxable income in 2014, 2.0% of taxable income in 2015, and 2.5% of taxable income in 2016. Beginning after 2016, the penalty will be increased annually by the cost-of-living adjustment. Exemptions will be granted for financial hardship, religious objections, American Indians, those without coverage for less than three months, undocumented immigrants, incarcerated individuals, those for whom the lowest cost plan option exceeds 8% of an individual’s income, and those with incomes below the tax filing threshold (in 2009 the threshold for taxpayers under age 65 was $9,350 for singles and $18,700 for couples).
|
| EMPLOYER REQUIREMENTS |
| Requirement to offer coverage | - Assess employers with 50 or more full-time employees that do not offer coverage and have at least one full-time employee who receives a premium tax credit a fee of $2,000 per full-time employee, excluding the first 30 employees from the assessment. Employers with 50 or more full-time employees that offer coverage but have at least one full-time employee receiving a premium tax credit, will pay the lesser of $3,000 for each employee receiving a premium credit or $2,000 for each full-time employee, excluding the first 30 employees from the assessment. (Effective January 1, 2014) • Exempt employers with up to 50 full-time employees from any of the above penalties.
|
| Other requirements | - Require employers with more than 200 employees to automatically enroll employees into health insurance plans offered by the employer. Employees may opt out of coverage.
|
| EXPANSION OF PUBLIC PROGRAMS |
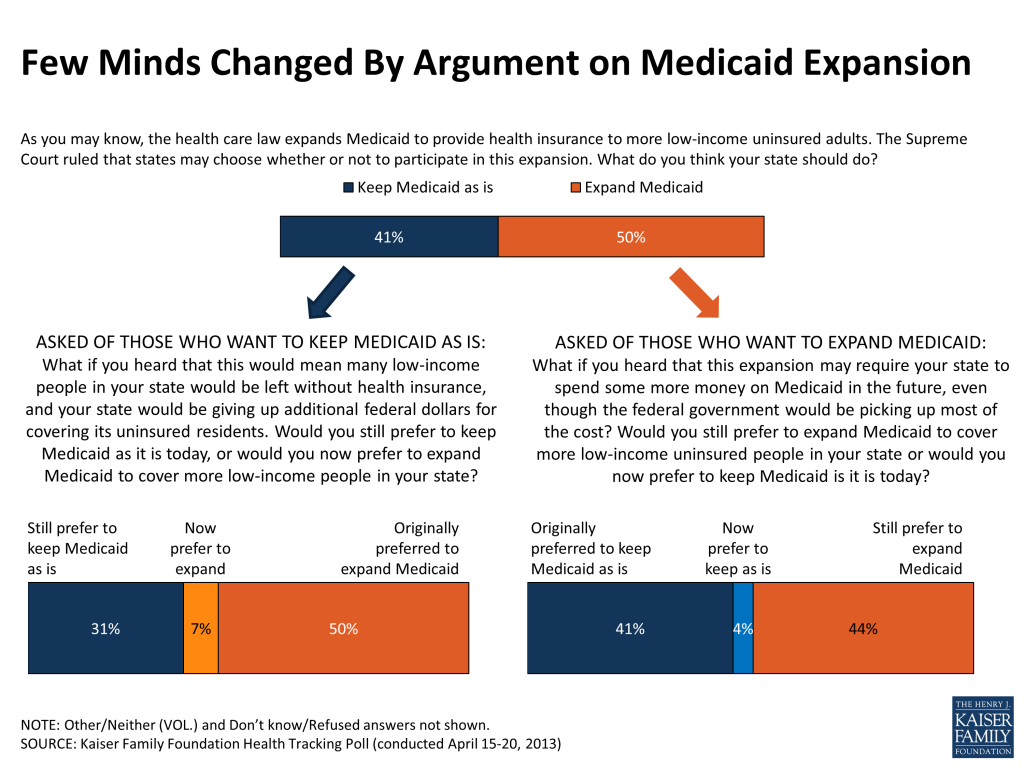
| Treatment of Medicaid | - Expand Medicaid to all non-Medicare eligible individuals under age 65 (children, pregnant women, parents, and adults without dependent children) with incomes up to 133% FPL based on modified adjusted gross income (as under current law undocumented immigrants are not eligible for Medicaid). All newly eligible adults will be guaranteed a benchmark benefit package that meets the essential health benefits available through the Exchanges. The Supreme Court ruling on the constitutionality of the ACA upheld the Medicaid expansion, but limited the ability of HHS to enforce it, thereby making the decision to expand Medicaid optional for states. To finance the coverage for the newly eligible (those who were not previously eligible for at least benchmark equivalent coverage, those who were eligible for a capped program but were not enrolled, or those who were enrolled in state-funded programs), states will receive 100% federal funding for 2014 through 2016, 95% federal financing in 2017, 94% federal financing in 2018, 93% federal financing in 2019, and 90% federal financing for 2020 and subsequent years. States that have already expanded eligibility to adults with incomes up to 100% FPL will receive a phased-in increase in the federal medical assistance percentage (FMAP) for non-pregnant childless adults so that by 2019 they receive the same federal financing as other states (93% in 2019 and 90% in 2020 and later). States have the option to expand Medicaid eligibility to childless adults beginning on April 1, 2010, but will receive their regular FMAP until 2014. In addition, increase Medicaid payments in fee-for-service and managed care for primary care services provided by primary care doctors (family medicine, general internal medicine or pediatric medicine) to 100% of the Medicare payment rates for 2013 and 2014. States will receive 100% federal financing for the increased payment rates. (Effective January 1, 2014)
|
| Treatment of CHIP | - Require states to maintain current income eligibility levels for children in Medicaid and the Children’s Health Insurance Program (CHIP) until 2019 and extend funding for CHIP through 2015. CHIP benefit package and cost-sharing rules will continue as under current law. Provide states with the option to provide CHIP coverage to children of state employees who are eligible for health benefits if certain conditions are met. Beginning in 2015, states will receive a 23 percentage point increase in the CHIP match rate up to a cap of 100%. CHIP-eligible children who are unable to enroll in the program due to enrollment caps will be eligible for tax credits in the state Exchanges.
|
| PREMIUM AND COST-SHARING SUBSIDIES TO INDIVIDUALS |
| Eligibility | - Limit availability of premium credits and cost-sharing subsidies through the Exchanges to U.S. citizens and legal immigrants who meet income limits. Employees who are offered coverage by an employer are not eligible for premium credits unless the employer plan does not have an actuarial value of at least 60% or if the employee share of the premium exceeds 9.5% of income. Legal immigrants who are barred from enrolling in Medicaid during their first five years in the U.S. will be eligible for premium credits.
|
| Premium credits | - Provide refundable and advanceable premium credits to eligible individuals and families with incomes between 100-400% FPL to purchase insurance through the Exchanges. The premium credits will be tied to the second lowest cost silver plan in the area and will be set on a sliding scale such that the premium contributions are limited to the following percentages of income for specified income levels:
Up to 133% FPL: 2% of income133-150% FPL: 3 – 4% of income150-200% FPL: 4 – 6.3% of income200-250% FPL: 6.3 – 8.05% of income250-300% FPL: 8.05 – 9.5% of income300-400% FPL: 9.5% of income- Increase the premium contributions for those receiving subsidies annually to reflect the excess of the premium growth over the rate of income growth for 2014-2018. Beginning in 2019, further adjust the premium contributions to reflect the excess of premium growth over CPI if aggregate premiums and cost sharing subsidies exceed .504% of GDP.
- Provisions related to the premium and cost-sharing subsidies are effective January 1, 2014.
|
| Cost-sharing subsidies | - Provide cost-sharing subsidies to eligible individuals and families. The cost-sharing credits reduce the cost-sharing amounts and annual cost-sharing limits and have the effect of increasing the actuarial value of the basic benefit plan to the following percentages of the full value of the plan for the specified income level:100-150% FPL: 94%150-200% FPL: 87%200-250% FPL: 73%250-400% FPL: 70%
|
| Verification | - Require verification of both income and citizenship status in determining eligibility for the federal premium credits.
|
| Subsidies and abortion coverage | - Ensure that federal premium or cost-sharing subsidies are not used to purchase coverage for abortion if coverage extends beyond saving the life of the woman or cases of rape or incest (Hyde amendment). If an individual who receives federal assistance purchases coverage in a plan that chooses to cover abortion services beyond those for which federal funds are permitted, those federal subsidy funds (for premiums or cost-sharing) must not be used for the purchase of the abortion coverage and must be segregated from private premium payments or state funds.
|
| PREMIUM SUBSIDIES TO EMPLOYERS |
| Small business tax credits | - Provide small employers with no more than 25 employees and average annual wages of less than $50,000 that purchase health insurance for employees with a tax credit.
- Phase I: For tax years 2010 through 2013, provide a tax credit of up to 35% of the employer’s contribution toward the employee’s health insurance premium if the employer contributes at least 50% of the total premium cost or 50% of a benchmark premium. The full credit will be available to employers with 10 or fewer employees and average annual wages of less than $25,000. The credit phases-out as firm size and average wage increases. Tax-exempt small businesses meeting these requirements are eligible for tax credits of up to 25% of the employer’s contribution toward the employee’s health insurance premium.
- Phase II: For tax years 2014 and later, for eligible small businesses that purchase coverage through the state Exchange, provide a tax credit of up to 50% of the employer’s contribution toward the employee’s health insurance premium if the employer contributes at least 50% of the total premium cost. The credit will be available for two years. The full credit will be available to employers with 10 or fewer employees and average annual wages of less than $25,000. The credit phases-out as firm size and average wage increases. Tax-exempt small businesses meeting these requirements are eligible for tax credits of up to 35% of the employer’s contribution toward the employee’s health insurance premium.
|
| Reinsurance program | - Create a temporary reinsurance program for employers providing health insurance coverage to retirees over age 55 who are not eligible for Medicare. Program will reimburse employers or insurers for 80% of retiree claims between $15,000 and $90,000. Payments from the reinsurance program will be used to lower the costs for enrollees in the employer plan. Appropriate $5 billion to finance the program. (Effective 90 days following enactment through January 1, 2014)
|
| TAX CHANGES RELATED TO HEALTH INSURANCE OR FINANCING HEALTH REFORM |
| Tax changes related to health insurance | - Impose a tax on individuals without qualifying coverage of the greater of $695 per year up to a maximum of three times that amount or 2.5% of household income to be phased-in beginning in 2014.
- Exclude the costs for over-the-counter drugs not prescribed by a doctor from being reimbursed through an HRA or health FSA and from being reimbursed on a tax-free basis through an HSA or Archer Medical Savings Account. (Effective January 1, 2011)
- Increase the tax on distributions from a health savings account or an Archer MSA that are not used for qualified medical expenses to 20% (from 10% for HSAs and from 15% for Archer MSAs) of the disbursed amount. (Effective January 1, 2011)
- Limit the amount of contributions to a flexible spending account for medical expenses to $2,500 per year increased annually by the cost of living adjustment. (Effective January 1, 2013)
- Increase the threshold for the itemized deduction for unreimbursed medical expenses from 7.5% of adjusted gross income to 10% of adjusted gross income for regular tax purposes; waive the increase for individuals age 65 and older for tax years 2013 through 2016. (Effective January 1, 2013)
- Increase the Medicare Part A (hospital insurance) tax rate on wages by 0.9% (from 1.45% to 2.35%) on earnings over $200,000 for individual taxpayers and $250,000 for married couples filing jointly and impose a 3.8% tax on unearned income for higher-income taxpayers (thresholds are not indexed). (Effective January 1, 2013)
- Impose an excise tax on insurers of employer-sponsored health plans with aggregate values that exceed $10,200 for individual coverage and $27,500 for family coverage (these threshold values will be indexed to the consumer price index for urban consumers (CPI-U) for years beginning in 2020). The threshold amounts will be increased for retired individuals age 55 and older who are not eligible for Medicare and for employees engaged in high-risk professions by $1,650 for individual coverage and $3,450 for family coverage. The threshold amounts may be adjusted upwards if health care costs rise more than expected prior to implementation of the tax in 2018. The threshold amounts will be increased for firms that may have higher health care costs because of the age or gender of their workers. The tax is equal to 40% of the value of the plan that exceeds the threshold amounts and is imposed on the issuer of the health insurance policy, which in the case of a self-insured plan is the plan administrator or, in some cases, the employer. The aggregate value of the health insurance plan includes reimbursements under a flexible spending account for medical expenses (health FSA) or health reimbursement arrangement (HRA), employer contributions to a health savings account (HSA), and coverage for supplementary health insurance coverage, excluding dental and vision coverage. (Effective January 1, 2018)
- Eliminate the tax deduction for employers who receive Medicare Part D retiree drug subsidy payments. (Effective January 1, 2013)
|
| Tax changes related to financing health reform | - Impose new annual fees on the pharmaceutical manufacturing sector, according to the following schedule:
- $2.8 billion in 2012-2013;$3.0 billion in 2014-2016;
- $4.0 billion in 2017;
- $4.1 billion in 2018; and
- 2.8 billion in 2019 and later.
- Impose an annual fee on the health insurance sector, according to the following schedule:
- $8 billion in 2014;
- $11.3 billion in 2015-2016;
- $13.9 billion in 2017;
- $14.3 billion in 2018
- For subsequent years, the fee shall be the amount from the previous year increased by the rate of premium growth.
For non-profit insurers, only 50% of net premiums are taken into account in calculating the fee. Exemptions granted for non-profit plans that receive more than 80% of their income from government programs targeting low-income or elderly populations, or people with disabilities, and voluntary employees’ beneficiary associations (VEBAs) not established by an employer. (Effective January 1, 2014) - Impose an excise tax of 2.3% on the sale of any taxable medical device. (Effective for sales after December 31, 2012)
- Limit the deductibility of executive and employee compensation to $500,000 per applicable individual for health insurance providers. (Effective January 1, 2009)
- Impose a tax of 10% on the amount paid for indoor tanning services. (Effective July 1, 2010)
- Exclude unprocessed fuels from the definition of cellulosic biofuel for purposes of applying the cellulosic biofuel producer credit. (Effective January 1, 2010)
- Clarify application of the economic substance doctrine and increase penalties for underpayments attributable to a transaction lacking economic substance. (Effective upon enactment)
|
| HEALTH INSURANCE EXCHANGES |
| Creation and structure of health insurance exchanges | - Create state-based American Health Benefit Exchanges and Small Business Health Options Program (SHOP) Exchanges, administered by a governmental agency or non-profit organization, through which individuals and small businesses with up to 100 employees can purchase qualified coverage. Permit states to allow businesses with more than 100 employees to purchase coverage in the SHOP Exchange beginning in 2017. States may form regional Exchanges or allow more than one Exchange to operate in a state as long as each Exchange serves a distinct geographic area. (Funding available to states to establish Exchanges within one year of enactment and until January 1, 2015)
|
| Eligibility to purchase in the exchanges | - Restrict access to coverage through the Exchanges to U.S. citizens and legal immigrants who are not incarcerated.
|
| Multi-state plans | - Require the Office of Personnel Management to contract with insurers to offer at least two multi-state plans in each Exchange. At least one plan must be offered by a non-profit entity and at least one plan must not provide coverage for abortions beyond those permitted by federal law. Each multi-state plan must be licensed in each state and must meet the qualifications of a qualified health plan. If a state has lower age rating requirements than 3:1, the state may require multi-state plans to meet the more protective age rating rules. These multi-state plans will be offered separately from the Federal Employees Health Benefit Program and will have a separate risk pool.
|
| Consumer Operated and Oriented Plan (CO-OP) | - Create the Consumer Operated and Oriented Plan (CO-OP) program to foster the creation of non-profit, member-run health insurance companies in all 50 states and District of Columbia to offer qualified health plans. To be eligible to receive funds, an organization must not be an existing health insurer or sponsored by a state or local government, substantially all of its activities must consist of the issuance of qualified health benefit plans in each state in which it is licensed, governance of the organization must be subject to a majority vote of its members, must operate with a strong consumer focus, and any profits must be used to lower premiums, improve benefits, or improve the quality of health care delivered to its members. (Appropriate $4.8 billion to finance the program and award loans and grants to establish CO-OPs by July 1, 2013)
|
| Benefit tiers | - Create four benefit categories of plans plus a separate catastrophic plan to be offered through the Exchange, and in the individual and small group markets:
- Bronze plan represents minimum creditable coverage and provides the essential health benefits, cover 60% of the benefit costs of the plan, with an out-of-pocket limit equal to the Health Savings Account (HSA) current law limit ($5,950 for individuals and $11,900 for families in 2010);
- Silver plan provides the essential health benefits, covers 70% of the benefit costs of the plan, with the HSA out-of-pocket limits;
- Gold plan provides the essential health benefits, covers 80% of the benefit costs of the plan, with the HSA out-of-pocket limits;
- Platinum plan provides the essential health benefits, covers 90% of the benefit costs of the plan, with the HSA out-of-pocket limits;
- Catastrophic plan available to those up to age 30 or to those who are exempt from the mandate to purchase coverage and provides catastrophic coverage only with the coverage level set at the HSA current law levels except that prevention benefits and coverage for three primary care visits would be exempt from the deductible. This plan is only available in the individual market.
- Reduce the out-of-pocket limits for those with incomes up to 400% FPL to the following levels:
- 100-200% FPL: one-third of the HSA limits ($1,983/individual and $3,967/family);
- 200-300% FPL: one-half of the HSA limits ($2,975/individual and $5,950/family);
- 300-400% FPL: two-thirds of the HSA limits ($3,987/individual and $7,973/family).
These out-of-pocket reductions are applied within the actuarial limits of the plan and will not increase the actuarial value of the plan. |
| Insurance market and rating rules | - Require guarantee issue and renewability and allow rating variation based only on age (limited to 3 to 1 ratio), premium rating area, family composition, and tobacco use (limited to 1.5. to 1 ratio) in the individual and the small group market and the Exchange.
- Require risk adjustment in the individual and small group markets and in the Exchange. (Effective January 1, 2014)
|
| Qualifications of participating health plans | - Require qualified health plans participating in the Exchange to meet marketing requirements, have adequate provider networks, contract with essential community providers, contract with navigators to conduct outreach and enrollment assistance, be accredited with respect to performance on quality measures, use a uniform enrollment form and standard format to present plan information.
- Require qualified health plans to report information on claims payment policies, enrollment, disenrollment, number of claims denied, cost-sharing requirements, out-of-network policies, and enrollee rights in plain language.
|
| Requirements of the exchanges | - Require the Exchanges to maintain a call center for customer service, and establish procedures for enrolling individuals and businesses and for determining eligibility for tax credits. Require states to develop a single form for applying for state health subsidy programs that can be filed online, in person, by mail or by phone. Permit Exchanges to contract with state Medicaid agencies to determine eligibility for tax credits in the Exchanges.
- Require Exchanges to submit financial reports to the Secretary and comply with oversight investigations including a GAO study on the operation and administration of Exchanges.
|
| Basic health plan | - Permit states the option to create a Basic Health Plan for uninsured individuals with incomes between 133-200% FPL who would otherwise be eligible to receive premium subsidies in the Exchange. States opting to provide this coverage will contract with one or more standard plans to provide at least the essential health benefits and must ensure that eligible individuals do not pay more in premiums than they would have paid in the Exchange and that the cost-sharing requirements do not exceed those of the platinum plan for enrollees with income less than 150% FPL or the gold plan for all other enrollees. States will receive 95% of the funds that would have been paid as federal premium and cost-sharing subsidies for eligible individuals to establish the Basic Health Plan. Individuals with incomes between 133-200% FPL in states creating Basic Health Plans will not be eligible for subsidies in the Exchanges.
|
| Abortion coverage | - Permit states to prohibit plans participating in the Exchange from providing coverage for abortions.
- Require plans that choose to offer coverage for abortions beyond those for which federal funds are permitted (to save the life of the woman and in cases of rape or incest) in states that allow such coverage to create allocation accounts for segregating premium payments for coverage of abortion services from premium payments for coverage for all other services to ensure that no federal premium or cost-sharing subsidies are used to pay for the abortion coverage. Plans must also estimate the actuarial value of covering abortions by taking into account the cost of the abortion benefit (valued at no less than $1 per enrollee per month) and cannot take into account any savings that might be reaped as a result of the abortions. Prohibit plans participating in the Exchanges from discriminating against any provider because of an unwillingness to provide, pay for, provide coverage of, or refer for abortions.
|
| Effective dates | - Unless otherwise noted, provisions relating to the American Health Benefit Exchanges are effective January 1, 2014.
|
| BENEFIT DESIGN |
| Essential benefits package | - Create an essential health benefits package that provides a comprehensive set of services, covers at least 60% of the actuarial value of the covered benefits, limits annual cost-sharing to the current law HSA limits ($5,950/individual and $11,900/family in 2010), and is not more extensive than the typical employer plan. Require the Secretary to define and annually update the benefit package through a transparent and public process. (Effective January 1, 2014)
- Require all qualified health benefits plans, including those offered through the Exchanges and those offered in the individual and small group markets outside the Exchanges, except grandfathered individual and employer-sponsored plans, to offer at least the essential health benefits package. (Effective January 1, 2014)
|
| Abortion coverage | - Prohibit abortion coverage from being required as part of the essential health benefits package. (Effective January 1, 2014)
|
| CHANGES TO PRIVATE INSURANCE |
| Temporary high-risk pool | - Establish a temporary national high-risk pool to provide health coverage to individuals with pre-existing medical conditions. U.S. citizens and legal immigrants who have a pre-existing medical condition and who have been uninsured for at least six months will be eligible to enroll in the high-risk pool and receive subsidized premiums. Premiums for the pool will be established for a standard population and may vary by no more than 4 to 1 due to age; maximum cost-sharing will be limited to the current law HSA limit ($5,950/individual and $11,900/family in 2010). Appropriate $5 billion to finance the program. (Effective within 90 days of enactment until January 1, 2014)
|
| Medical loss ratio and premium rate reviews | - Require health plans to report the proportion of premium dollars spent on clinical services, quality, and other costs and provide rebates to consumers for the amount of the premium spent on clinical services and quality that is less than 85% for plans in the large group market and 80% for plans in the individual and small group markets. (Requirement to report medical loss ratio effective plan year 2010; requirement to provide rebates effective January 1, 2011)
- Establish a process for reviewing increases in health plan premiums and require plans to justify increases. Require states to report on trends in premium increases and recommend whether certain plan should be excluded from the Exchange based on unjustified premium increases. Provide grants to states to support efforts to review and approve premium increases. (Effective beginning plan year 2010)
|
| Administrative simplification | - Adopt standards for financial and administrative transactions to promote administrative simplification. (Effective dates vary)
|
| Dependent coverage | - Provide dependent coverage for children up to age 26 for all individual and group policies. (Effective six months following enactment)
|
| Insurance market rules | - Prohibit individual and group health plans from placing lifetime limits on the dollar value of coverage and prohibit insurers from rescinding coverage except in cases of fraud. Prohibit pre-existing condition exclusions for children. (Effective six months following enactment) Beginning in January 2014, prohibit individual and group health plans from placing annual limits on the dollar value of coverage. Prior to January 2014, plans may only impose annual limits on coverage as determined by the Secretary.
- Grandfather existing individual and group plans with respect to new benefit standards, but require these grandfathered plans to extend dependent coverage to adult children up to age 26 and prohibit rescissions of coverage. Require grandfathered group plans to eliminate lifetime limits on coverage and beginning in 2014, eliminate annual limits on coverage. Prior to 2014, grandfathered group plans may only impose annual limits as determined by the Secretary. Require grandfathered group plans to eliminate pre-existing condition exclusions for children within six months of enactment and by 2014 for adults, and eliminate waiting periods for coverage of greater than 90 days by 2014. (Effective six months following enactment, except where otherwise specified)
- Impose the same insurance market regulations relating to guarantee issue, premium rating, and prohibitions on pre-existing condition exclusions in the individual market, in the Exchange, and in the small group market. (See new rating and market rules in Creation of insurance pooling mechanism.) (Effective January 1, 2014)
- Require all new policies (except stand-alone dental, vision, and long-term care insurance plans), including those offered through the Exchanges and those offered outside of the Exchanges, to comply with one of the four benefit categories. Existing individual and employer-sponsored plans do not have to meet the new benefit standards. (See description of benefit categories in Creation of insurance pooling mechanism.) (Effective January 1, 2014)
- Limit deductibles for health plans in the small group market to $2,000 for individuals and $4,000 for families unless contributions are offered that offset deductible amounts above these limits. This deductible limit will not affect the actuarial value of any plans. (Effective January 1, 2014)
- Limit any waiting periods for coverage to 90 days. (Effective January 1, 2014)
- Create a temporary reinsurance program to collect payments from health insurers in the individual and group markets to provide payments to plans in the individual market that cover high-risk individuals. Finance the reinsurance program through mandatory contributions by health insurers totaling $25 billion over three years. (Effective January 1, 2014 through December 2016)
- Allow states the option of merging the individual and small group markets. (Effective January 1, 2014)
|
| Consumer protections | - Establish an internet website to help residents identify health coverage options (effective July 1, 2010) and develop a standard format for presenting information on coverage options (effective 60 days following enactment).
- Develop standards for insurers to use in providing information on benefits and coverage. (Standards developed within 12 months following enactment; insurer must comply with standards within 24 months following enactment)
|
| Health care choice compacts and national plans | - Permit states to form health care choice compacts and allow insurers to sell policies in any state participating in the compact. Insurers selling policies through a compact would only be subject to the laws and regulations of the state where the policy is written or issued, except for rules pertaining to market conduct, unfair trade practices, network adequacy, and consumer protections. Compacts may only be approved if it is determined that the compact will provide coverage that is at least as comprehensive and affordable as coverage provided through the state Exchanges. (Regulations issued by July 1, 2013, compacts may not take effect before January 1, 2016)
|
| Health insurance administration | - Establish the Health Insurance Reform Implementation Fund within the Department of Health and Human Services and allocate $1 billion to implement health reform policies.
|
| STATE ROLE |
| State role | - Create an American Health Benefit Exchange and a Small Business Health Options Program (SHOP) Exchange for individuals and small businesses and provide oversight of health plans with regard to the new insurance market regulations, consumer protections, rate reviews, solvency, reserve fund requirements, premium taxes, and to define rating areas.
- Enroll newly eligible Medicaid beneficiaries into the Medicaid program no later than January 2014 (states have the option to expand enrollment beginning in 2011), coordinate enrollment with the new Exchanges, and implement other specified changes to the Medicaid program. Maintain current Medicaid and CHIP eligibility levels for children until 2019 and maintain current Medicaid eligibility levels for adults until the Exchange is fully operational. A state will be exempt from the maintenance of effort requirement for non-disabled adults with incomes above 133% FPL for any year from January 2011 through December 31, 2013 if the state certifies that it is experiencing a budget deficit or will experience a deficit in the following year.
- Establish an office of health insurance consumer assistance or an ombudsman program to serve as an advocate for people with private coverage in the individual and small group markets. (Federal grants available beginning fiscal year 2010)
- Permit states to create a Basic Health Plan for uninsured individuals with incomes between 133% and 200% FPL in lieu of these individuals receiving premium subsidies to purchase coverage in the Exchanges. (Effective January 1, 2014) Permit states to obtain a five-year waiver of certain new health insurance requirements if the state can demonstrate that it provides health coverage to all residents that is at least as comprehensive as the coverage required under an Exchange plan and that the state plan does not increase the federal budget deficit. (Effective January 1, 2017)
|
| COST CONTAINMENT | |
| Administrative simplification | - Simplify health insurance administration by adopting a single set of operating rules for eligibility verification and claims status (rules adopted July 1, 2011; effective January 1, 2013), electronic funds transfers and health care payment and remittance (rules adopted July 1, 2012; effective January 1, 2014), and health claims or equivalent encounter information, enrollment and disenrollment in a health plan, health plan premium payments, and referral certification and authorization (rules adopted July 1, 2014; effective January 1, 2016). Health plans must document compliance with these standards or face a penalty of no more than $1 per covered life. (Effective April 1, 2014)
|
| Medicare | - Restructure payments to Medicare Advantage (MA) plans by setting payments to different percentages of Medicare fee-for-service (FFS) rates, with higher payments for areas with low FFS rates and lower payments (95% of FFS) for areas with high FFS rates. Phase-in revised payments over 3 years beginning in 2011, for plans in most areas, with payments phased-in over longer periods (4 years and 6 years) for plans in other areas. Provide bonuses to plans receiving 4 or more stars, based on the current 5-star quality rating system for Medicare Advantage plans, beginning in 2012; qualifying plans in qualifying areas receive double bonuses. Modify rebate system with rebates allocated based on a plan’s quality rating. Phase-in adjustments to plan payments for coding practices related to the health status of enrollees, with adjustments equaling 5.7% by 2019. Cap total payments, including bonuses, at current payment levels. Require Medicare Advantage plans to remit partial payments to the Secretary if the plan has a medical loss ratio of less than 85%, beginning 2014. Require the Secretary to suspend plan enrollment for 3 years if the medical loss ratio is less than 85% for 2 consecutive years and to terminate the plan contract if the medical loss ratio is less than 85% for 5 consecutive years.
- Reduce annual market basket updates for inpatient hospital, home health, skilled nursing facility, hospice and other Medicare providers, and adjust for productivity. (Effective dates vary)
- Freeze the threshold for income-related Medicare Part B premiums for 2011 through 2019, and reduce the Medicare Part D premium subsidy for those with incomes above $85,000/individual and $170,000/ couple. (Effective January 1, 2011)
- Establish an Independent Payment Advisory Board comprised of 15 members to submit legislative proposals containing recommendations to reduce the per capita rate of growth in Medicare spending if spending exceeds a target growth rate. Beginning April 2013, require the Chief Actuary of CMS to project whether Medicare per capita spending exceeds the average of CPI-U and CPI-M, based on a five year period ending that year. If so, beginning January 15, 2014, the Board will submit recommendations to achieve reductions in Medicare spending. Beginning January 2018, the target is modified such that the board submits recommendations if Medicare per capita spending exceeds GDP per capita plus one percent. The Board will submit proposals to the President and Congress for immediate consideration. The Board is prohibited from submitting proposals that would ration care, increase revenues or change benefits, eligibility or Medicare beneficiary cost sharing (including Parts A and B premiums), or would result in a change in the beneficiary premium percentage or low-income subsidies under Part D. Hospitals and hospices (through 2019) and clinical labs (for one year) will not be subject to cost reductions proposed by the Board. The Board must also submit recommendations every other year to slow the growth in national health expenditures while preserving quality of care by January 1, 2015.
- Reduce Medicare Disproportionate Share Hospital (DSH) payments initially by 75% and subsequently increase payments based on the percent of the population uninsured and the amount of uncompensated care provided (Effective fiscal year 2014)
- Eliminate the Medicare Improvement Fund. (Effective upon enactment)
- Allow providers organized as accountable care organizations (ACOs) that voluntarily meet quality thresholds to share in the cost savings they achieve for the Medicare program. To qualify as an ACO, organizations must agree to be accountable for the overall care of their Medicare beneficiaries, have adequate participation of primary care physicians, define processes to promote evidence-based medicine, report on quality and costs, and coordinate care. (Shared savings program established January 1, 2012)
- Create an Innovation Center within the Centers for Medicare and Medicaid Services to test, evaluate, and expand in Medicare, Medicaid, and CHIP different payment structures and methodologies to reduce program expenditures while maintaining or improving quality of care. Payment reform models that improve quality and reduce the rate of cost growth could be expanded throughout the Medicare, Medicaid, and CHIP programs. (Effective January 1, 2011)
- Reduce Medicare payments that would otherwise be made to hospitals by specified percentages to account for excess (preventable) hospital readmissions. (Effective October 1, 2012)
- Reduce Medicare payments to certain hospitals for hospital-acquired conditions by 1%. (Effective fiscal year 2015)
|
| Medicaid | - Increase the Medicaid drug rebate percentage for brand name drugs to 23.1 (except the rebate for clotting factors and drugs approved exclusively for pediatric use increases to 17.1%); increase the Medicaid rebate for non-innovator, multiple source drugs to 13% of average manufacturer price. (Effective January 1, 2010) Extend the drug rebate to Medicaid managed care plans. (Effective upon enactment)
- Reduce aggregate Medicaid DSH allotments by $.5 billion in 2014, $.6 billion in 2015, $.6 billion in 2016, $1.8 billion in 2017, $5 billion in 2018, $5.6 billion in 2019, and $4 billion in 2020. Require the Secretary to develop a methodology to distribute the DSH reductions in a manner that imposes the largest reduction in DSH allotments for states with the lowest percentage of uninsured or those that do not target DSH payments, imposes smaller reductions for low-DSH states, and accounts for DSH allotments used for 1115 waivers. (Effective October 1, 2011)
- Prohibit federal payments to states for Medicaid services related to health care acquired conditions. (Effective July 1, 2011)
|
| Prescription drugs | - Authorize the Food and Drug Administration to approve generic versions of biologic drugs and grant biologics manufacturers 12 years of exclusive use before generics can be developed. (Effective upon enactment)
|
| Waste, fraud, and abuse | - Reduce waste, fraud, and abuse in public programs by allowing provider screening, enhanced oversight periods for new providers and suppliers, including a 90-day period of enhanced oversight for initial claims of DME suppliers, and enrollment moratoria in areas identified as being at elevated risk of fraud in all public programs, and by requiring Medicare and Medicaid program providers and suppliers to establish compliance programs. Develop a database to capture and share data across federal and state programs, increase penalties for submitting false claims, strengthen standards for community mental health centers and increase funding for anti-fraud activities. (Effective dates vary)
|
| IMPROVING QUALITY/HEALTH SYSTEM PERFORMANCE |
| Comparative effectiveness research | - Support comparative effectiveness research by establishing a non-profit Patient-Centered Outcomes Research Institute to identify research priorities and conduct research that compares the clinical effectiveness of medical treatments. The Institute will be overseen by an appointed multi-stakeholder Board of Governors and will be assisted by expert advisory panels. Findings from comparative effectiveness research may not be construed as mandates, guidelines, or recommendations for payment, coverage, or treatment or used to deny coverage. (Funding available beginning fiscal year 2010) Terminate the Federal Coordinating Council for Comparative Effectiveness Research that was founded under the American Recovery and Reinvestment Act. (Effective upon enactment)
|
| Medical malpractice | - Award five-year demonstration grants to states to develop, implement, and evaluate alternatives to current tort litigations. Preference will be given to states that have developed alternatives in consultation with relevant stakeholders and that have proposals that are likely to enhance patient safety by reducing medical errors and adverse events and are likely to improve access to liability insurance. (Funding appropriated for five years beginning in fiscal year 2011)
|
| Medicare | - Establish a national Medicare pilot program to develop and evaluate paying a bundled payment for acute, inpatient hospital services, physician services, outpatient hospital services, and post-acute care services for an episode of care that begins three days prior to a hospitalization and spans 30 days following discharge. If the pilot program achieves stated goals of improving or not reducing quality and reducing spending, develop a plan for expanding the pilot program. (Establish pilot program by January 1, 2013; expand program, if appropriate, by January 1, 2016)
- Create the Independence at Home demonstration program to provide high-need Medicare beneficiaries with primary care services in their home and allow participating teams of health professionals to share in any savings if they reduce preventable hospitalizations, prevent hospital readmissions, improve health outcomes, improve the efficiency of care, reduce the cost of health care services, and achieve patient satisfaction. (Effective January 1, 2012)
- Establish a hospital value-based purchasing program in Medicare to pay hospitals based on performance on quality measures and extend the Medicare physician quality reporting initiative beyond 2010. (Effective October 1, 2012) Develop plans to implement value-based purchasing programs for skilled nursing facilities, home health agencies, and ambulatory surgical centers. (Reports to Congress due January 1, 2011)
|
| Dual eligibles | - Improve care coordination for dual eligibles by creating a new office within the Centers for Medicare and Medicaid services, the Federal Coordinated Health Care Office, to more effectively integrate Medicare and Medicaid benefits and improve coordination between the federal government and states in order to improve access to and quality of care and services for dual eligibles. (Effective March 1, 2010)
|
| Medicaid | - Create a new Medicaid state plan option to permit Medicaid enrollees with at least two chronic conditions, one condition and risk of developing another, or at least one serious and persistent mental health condition to designate a provider as a health home. Provide states taking up the option with 90% FMAP for two years for home health-related services, including care management, care coordination, and health promotion. (Effective January 1, 2011)
- Create new demonstration projects in Medicaid to pay bundled payments for episodes of care that include hospitalizations (effective January 1, 2012 through December 31, 2016); to make global capitated payments to safety net hospital systems (effective fiscal years 2010 through 2012); to allow pediatric medical providers organized as accountable care organizations to share in cost-savings (effective January 1, 2012 through December 31, 2016); and to provide Medicaid payments to institutions of mental disease for adult enrollees who require stabilization of an emergency condition (effective October 1, 2011 through December 31, 2015).
- Expand the role of the Medicaid and CHIP Payment and Access Commission to include assessments of adult services (including those dually eligible for Medicare and Medicaid). ($11 million in additional funds appropriated for fiscal year 2010)
|
| Primary care | - Increase Medicaid payments in fee-for-service and managed care for primary care services provided by primary care doctors (family medicine, general internal medicine or pediatric medicine) to 100% of the Medicare payment rates for 2013 and 2014. States will receive 100% federal financing for the increased payment rates. (Effective January 1, 2013)
- Provide a 10% bonus payment to primary care physicians in Medicare from 2011 through 2015. (Effective for five years beginning January 1, 2011)
|
| National quality strategy | - Develop a national quality improvement strategy that includes priorities to improve the delivery of health care services, patient health outcomes, and population health. Create processes for the development of quality measures involving input from multiple stakeholders and for selecting quality measures to be used in reporting to and payment under federal health programs. (National strategy due to Congress by January 1, 2011)
- Establish the Community-based Collaborative Care Network Program to support consortiums of health care providers to coordinate and integrate health care services, for low-income uninsured and underinsured populations. (Funds appropriated for five years beginning in FY 2011)
|
| Financial disclosure | - Require disclosure of financial relationships between health entities, including physicians, hospitals, pharmacists, other providers, and manufacturers and distributors of covered drugs, devices, biologicals, and medical supplies. (Report due to Congress April 1, 2013)
|
| Disparities | - Require enhanced collection and reporting of data on race, ethnicity, sex, primary language, disability status, and for underserved rural and frontier populations. Also require collection of access and treatment data for people with disabilities. Require the Secretary to analyze the data to monitor trends in disparities. (Effective two years following enactment)
|
| PREVENTION/WELLNESS |
| National strategy | - Establish the National Prevention, Health Promotion and Public Health Council to coordinate federal prevention, wellness, and public health activities. Develop a national strategy to improve the nation’s health. (Strategy due one year following enactment) Create a Prevention and Public Health Fund to expand and sustain funding for prevention and public health programs. (Initial appropriation in fiscal year 2010) Create task forces on Preventive Services and Community Preventive Services to develop, update, and disseminate evidenced-based recommendations on the use of clinical and community prevention services. (Effective upon enactment)
- Establish a Prevention and Public Health Fund for prevention, wellness, and public health activities including prevention research and health screenings, the Education and Outreach Campaign for preventive benefits, and immunization programs. Appropriate $7 billion in funding for fiscal years 2010 through 2015 and $2 billion for each fiscal year after 2015. (Effective fiscal year 2010)
- Establish a grant program to support the delivery of evidence-based and community-based prevention and wellness services aimed at strengthening prevention activities, reducing chronic disease rates and addressing health disparities, especially in rural and frontier areas. (Funds appropriated for five years beginning in FY 2010)
|
| Coverage of preventive services | - Eliminate cost-sharing for Medicare covered preventive services that are recommended (rated A or B) by the U.S. Preventive Services Task Force and waive the Medicare deductible for colorectal cancer screening tests. Authorize the Secretary to modify or eliminate Medicare coverage of preventive services, based on recommendations of the U.S. Preventive Services Task Force. (Effective January 1, 2011)
- Provide states that offer Medicaid coverage of and remove cost-sharing for preventive services recommended (rated A or B) by the U.S. Preventive Services Task Force and recommended immunizations with a one percentage point increase in the federal medical assistance percentage (FMAP) for these services. (Effective January 1, 2013)
- Authorize Medicare coverage of personalized prevention plan services, including a comprehensive health risk assessment, annually. Require the Secretary to publish guidelines for the health risk assessment no later than March 23, 2011, and a health risk assessment model by no later than September 29, 2011. Reimburse providers 100% of the physician fee schedule amount with no adjustment for deductible or coinsurance for personalized prevention plan services when these services are provided in an outpatient setting. (Effective January 1, 2011)
- Provide incentives to Medicare and Medicaid beneficiaries to complete behavior modification programs. (Effective January 1, 2011 or when program criteria is developed, whichever is first) Require Medicaid coverage for tobacco cessation services for pregnant women. (Effective October 1, 2010)
- Require qualified health plans to provide at a minimum coverage without cost-sharing for preventive services rated A or B by the U.S. Preventive Services Task Force, recommended immunizations, preventive care for infants, children, and adolescents, and additional preventive care and screenings for women. (Effective six months following enactment)
|
| Wellness programs | - Provide grants for up to five years to small employers that establish wellness programs. (Funds appropriated for five years beginning in fiscal year 2011)
- Provide technical assistance and other resources to evaluate employer-based wellness programs. Conduct a national worksite health policies and programs survey to assess employer-based health policies and programs. (Conduct study within two years following enactment)
- Permit employers to offer employees rewards—in the form of premium discounts, waivers of cost-sharing requirements, or benefits that would otherwise not be provided—of up to 30% of the cost of coverage for participating in a wellness program and meeting certain health-related standards. Employers must offer an alternative standard for individuals for whom it is unreasonably difficult or inadvisable to meet the standard. The reward limit may be increased to 50% of the cost of coverage if deemed appropriate. (Effective January 1, 2014) Establish 10-state pilot programs by July 2014 to permit participating states to apply similar rewards for participating in wellness programs in the individual market and expand demonstrations in 2017 if effective. Require a report on the effectiveness and impact of wellness programs. (Report due three years following enactment)
|
| Nutritional information | - Require chain restaurants and food sold from vending machines to disclose the nutritional content of each item. (Proposed regulations issued within one year of enactment)
|
| LONG-TERM CARE |
| CLASS act | - Establish a national, voluntary insurance program for purchasing community living assistance services and supports (CLASS program). Following a five-year vesting period, the program will provide individuals with functional limitations a cash benefit of not less than an average of $50 per day to purchase nonmedical services and supports necessary to maintain community residence. The program is financed through voluntary payroll deductions: all working adults will be automatically enrolled in the program, unless they choose to opt-out. NOTE: This provision was repealed by the American Taxpayer Relief Act of 2012.
|
| Medicaid | - Extend the Medicaid Money Follows the Person Rebalancing Demonstration program through September 2016 (effective 30 days following enactment) and allocate $10 million per year for five years to continue the Aging and Disability Resource Center initiatives (funds appropriated for fiscal years 2010 through 2014).
- Provide states with new options for offering home and community-based services through a Medicaid state plan rather than through a waiver for individuals with incomes up to 300% of the maximum SSI payment and who have a higher level of need and permit states to extend full Medicaid benefits to individual receiving home and community-based services under a state plan. (Effective October 1, 2010)
- Establish the Community First Choice Option in Medicaid to provide community-based attendant supports and services to individuals with disabilities who require an institutional level of care. Provide states with an enhanced federal matching rate of an additional six percentage points for reimbursable expenses in the program. (Effective October 1, 2011)
- Create the State Balancing Incentive Program to provide enhanced federal matching payments to eligible states to increase the proportion of non-institutionally-based long-term care services. Selected states will be eligible for FMAP increases for medical assistance expenditures for non-institutionallybased long-term services and supports. (Effective October 1, 2011 through September 30, 2015)
|
| Skilled nursing facility requirements | - Require skilled nursing facilities under Medicare and nursing facilities under Medicaid to disclose information regarding ownership, accountability requirements, and expenditures. Publish standardized information on nursing facilities to a website so Medicare enrollees can compare the facilities. (Effective dates vary)
|
| OTHER INVESTMENTS |
| Medicare | - Make improvements to the Medicare program:
|
| Workforce | - Improve workforce training and development:
- Establish a multi-stakeholder Workforce Advisory Committee to develop a national workforce strategy. (Appointments made by September 30, 2010)
- Increase the number of Graduate Medical Education (GME) training positions by redistributing currently unused slots, with priorities given to primary care and general surgery and to states with the lowest resident physician-to-population ratios (effective July 1, 2011); increase flexibility in laws and regulations that govern GME funding to promote training in outpatient settings (effective July 1, 2010); and ensure the availability of residency programs in rural and underserved areas. Establish Teaching Health Centers, defined as community-based, ambulatory patient care centers, including federally qualified health centers and other federally-funded health centers that are eligible for payments for the expenses associated with operating primary care residency programs. (Funds appropriated for five years beginning fiscal year 2011)
- Increase workforce supply and support training of health professionals through scholarships and loans; support primary care training and capacity building; provide state grants to providers in medically underserved areas; train and recruit providers to serve in rural areas; establish a public health workforce loan repayment program; provide medical residents with training in preventive medicine and public health; promote training of a diverse workforce; and promote cultural competence training of health care professionals. (Effective dates vary) Support the development of interdisciplinary mental and behavioral health training programs (effective fiscal year 2010) and establish a training program for oral health professionals. (Funds appropriated for six years beginning in fiscal year 2010)
- Address the projected shortage of nurses and retention of nurses by increasing the capacity for education, supporting training programs, providing loan repayment and retention grants, and creating a career ladder to nursing. (Initial appropriation in fiscal year 2010) Provide grants for up to three years to employ and provide training to family nurse practitioners who provide primary care in federally qualified health centers and nurse-managed health clinics. (Funds appropriated for five years beginning in fiscal year 2011)
- Support the development of training programs that focus on primary care models such as medical homes, team management of chronic disease, and those that integrate physical and mental health services. (Funds appropriated for five years beginning in fiscal year 2010)
|
| Community health centers and school-based health centers | - Improve access to care by increasing funding by $11 billion for community health centers and by $1.5 billion for National Health Service Corps over five years (effective fiscal year 2011); establishing new programs to support school-based health centers (effective fiscal year 2010) and nurse-managed health clinics (effective fiscal year 2010).
|
| Trauma care | - Establish a new trauma center program to strengthen emergency department and trauma center capacity. Fund research on emergency medicine, including pediatric emergency medical research, and develop demonstration programs to design, implement, and evaluate innovative models for emergency care systems. (Funds appropriated beginning in fiscal year 2011)
|
| Public health and disaster preparedness | - Establish a commissioned Regular Corps and a Ready Reserve Corps for service in time of a national emergency. (Funds appropriated for five years beginning in fiscal year 2010)
|
| Requirements for non-profit hospitals | - Impose additional requirements on non-profit hospitals to conduct a community needs assessment every three years and adopt an implementation strategy to meet the identified needs, adopt and widely publicize a financial assistance policy that indicates whether free or discounted care is available and how to apply for the assistance, limit charges to patients who qualify for financial assistance to the amount generally billed to insured patients, and make reasonable attempts to determine eligibility for financial assistance before undertaking extraordinary collection actions. Impose a tax of $50,000 per year for failure to meet these requirements. (Effective for taxable years following enactment)
|
| American Indians | - Reauthorize and amend the Indian Health Care Improvement Act. (Effective upon enactment)
|