Poll Finding

2013 Survey of Americans on the U.S. Role in Global Health

Published: Nov 7, 2013

The Kaiser Family Foundation 2013 Survey of Americans on the U.S. Role in Global Health is the fifth in a series of surveys designed, conducted, and analyzed by the Kaiser Family Foundation in order to shed light on the American public’s perceptions, knowledge, and attitudes about the role of the United States in efforts to improve health for people in developing countries. This latest survey updates trends from Kaiser’s previous surveys dating back to 2009, and explores new questions including the public’s perception of the “bang for the buck” of U.S. aid and its ability to promote self-sufficiency in developing countries, views of spending reductions in the context of the federal budget deficit, and more detail on people’s sources of information, including how much news they report hearing about specific global health issues. For the first time, the survey also includes some more detailed questions on perceptions and awareness of polio.

A few key highlights from the survey are described here, and a more detailed set of findings and charts can be found below.

Summary Of Key Findings

As the country continues to climb out of economic recession and policymakers battle over the federal budget and national debt, Americans’ basic level of support for current levels of U.S. spending on efforts to improve health for people in developing countries has held relatively steady in recent years. Six in ten say the country spends either too little or about the right amount on such efforts, while three in ten say we spend too much. While there are some partisan differences in attitudes towards U.S. global health spending, these differences are much smaller than other surveys have found on questions of domestic health care policy.

Improving health in developing countries is one of many priorities the public sees as important for the President and Congress to address in world affairs, but not the top one. Fighting terrorism tops the list of priorities, followed by protecting human rights and helping out in areas affected by natural disasters.

As previous Kaiser surveys have found, misperceptions persist about the size of U.S. foreign aid and how aid is directed. On average, Americans think 28 percent of the federal budget is spent on foreign aid, when it is about 1 percent. Further, four in ten think a major part of U.S. foreign aid is given directly to developing countries to use as they see fit, when in reality most U.S. aid is directed to specific program areas. As we’ve seen in the past, people are more supportive of foreign aid spending when a specific purpose is mentioned – in this case, improving the health of people in developing countries – than they are of the idea of foreign aid in general.

There are several important caveats to Americans’ support for U.S. global health spending. Current economic conditions make people wary of increasing spending abroad, and when it comes to contributing to deficit reduction, larger shares of the public support cuts in overseas aid compared with domestic programs like Medicare, Medicaid, public education, and Social Security. Further, most Americans do not think U.S. aid aimed at improving health delivers a good “bang for the buck,” and only about a third think it increases self-sufficiency in developing countries.

An ongoing challenge for those looking to increase the public’s level of interest in and support of global health is grabbing their attention, and there are some signs that the visibility of global health issues has declined in recent years. News media continues to be the public’s top source of information on global health, and there is great variation in how much people report hearing in the news about specific health issues in developing countries, with hunger and malnutrition at the top of the list. Few say they’ve heard much about tuberculosis or polio from the news media. Still, public awareness of the global challenge of polio is high; three-quarters are aware that the disease has not been eradicated worldwide.

Priorities For U.S. In World Affairs, Priorities Within Global Health

Terrorism, Human Rights Top Public’s Priorities For U.S. In World Affairs

Improving health in developing countries is one of many priorities the public sees as important for the president and Congress to address in world affairs. At the top of the public’s list, more than half see fighting global terrorism and protecting human rights as a top priority, followed by disaster relief. Following these are a cluster of issues seen as top priorities by more than a third of the public, including promoting opportunities for women and girls, protecting the environment and fighting climate change, improving education, improving health, and reducing poverty in developing countries. After two wars, these priorities rank higher for the public than promoting democracy and providing military assistance to developing countries.
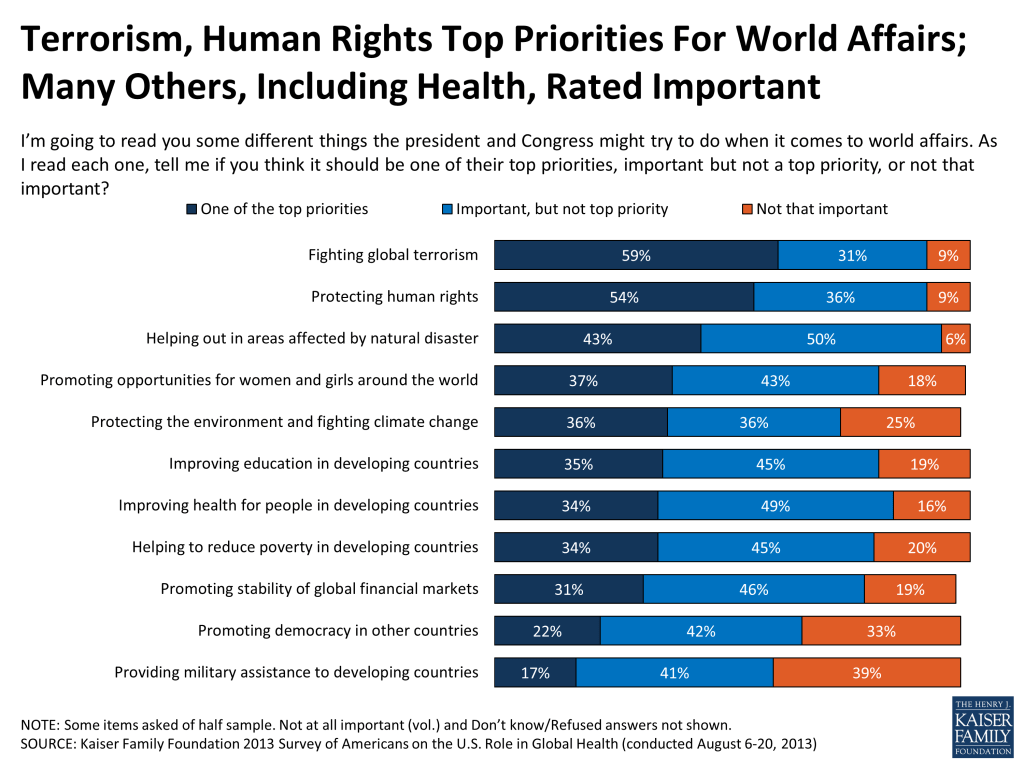
Figure 1

Within Health, All Priorities Seen As Important; Clean Water, Children’s Health, Hunger Rise To Top

When asked about a variety of different priorities for U.S. efforts to improve health in developing countries, large majorities believe each area is important, and between three and six in ten say each should be “one of the top” priorities. Highest on the list of those considered top priorities are basic needs such as improving access to clean water and reducing hunger, along with children’s health and vaccinations.
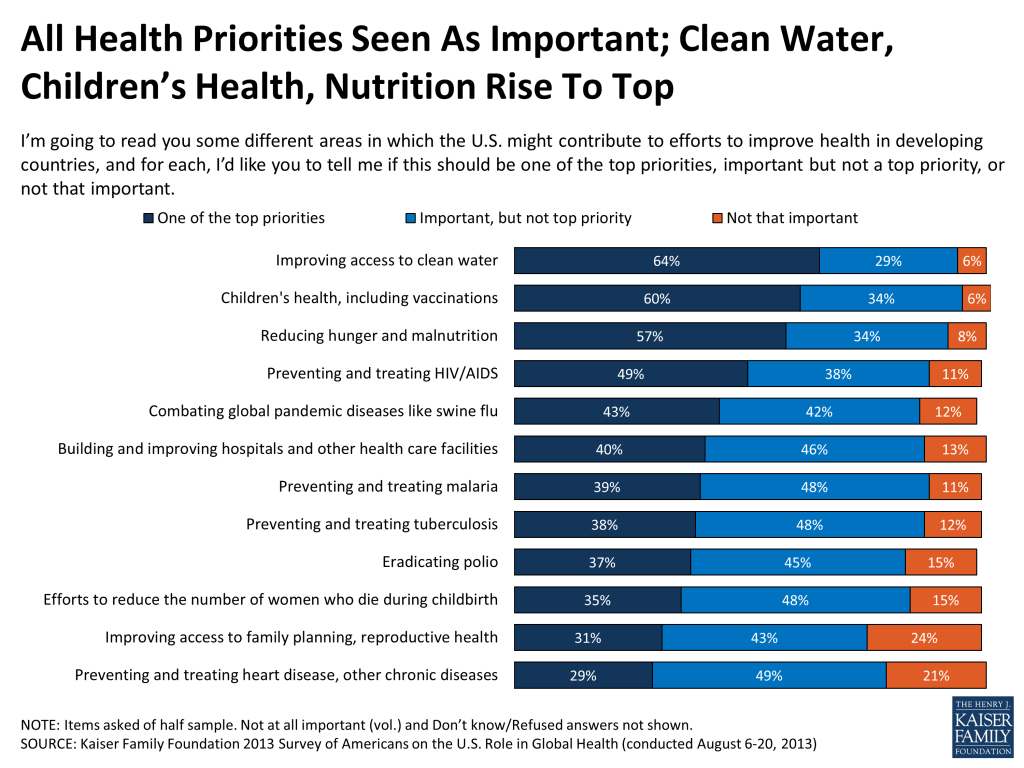
Figure 2

Given growing attention to polio eradication worldwide, this year’s survey included some more detailed questions about the disease. While eradicating polio does not rank high on the public’s list of priorities for U.S. involvement in improving health in developing countries, awareness of the global challenge of polio is relatively high. Nearly three-quarters (74 percent) of the public are aware that polio has not been eradicated around the world. Public awareness is somewhat less accurate when it comes to the status of the polio epidemic at home. About half (52 percent) are aware that the disease has been eliminated in the U.S., but nearly four in ten (37 percent) mistakenly believe it has not been eliminated in the U.S., and another one in ten (11 percent) are unsure.
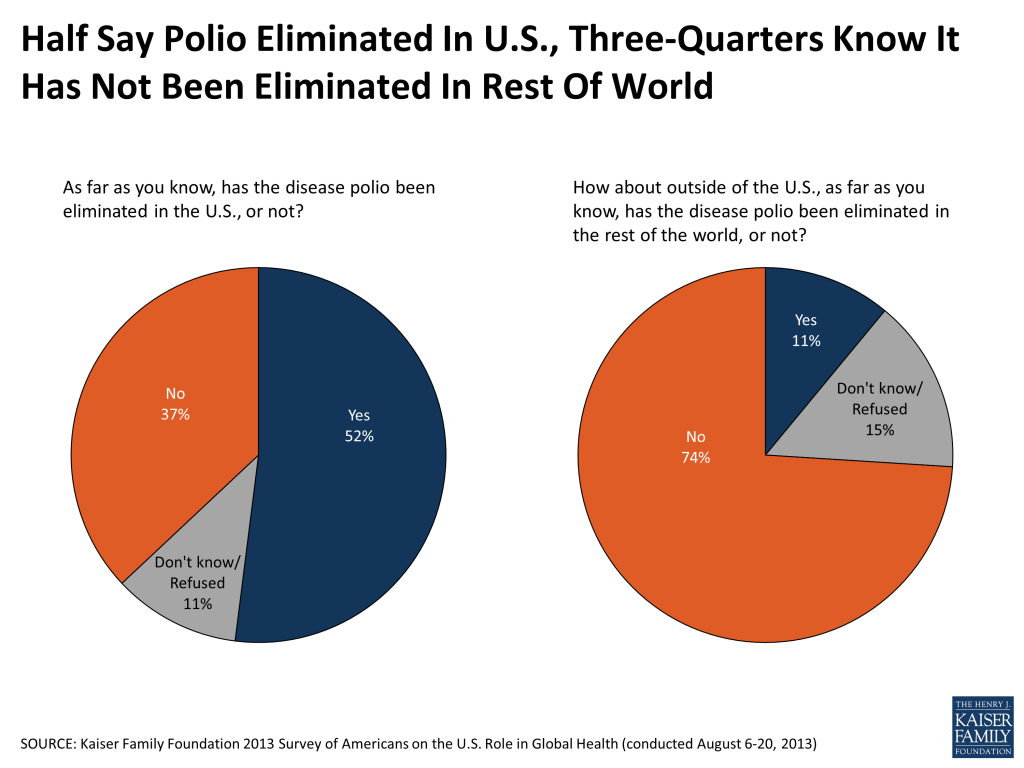
Figure 3

Views Of U.S. Spending On Foreign Aid And Efforts To Improve Health In Developing Countries

Confusion About Foreign Aid Spending Persists; Providing Accurate Information Has The Potential To Change Views

Consistent with previous Kaiser polls, the 2013 survey finds that the vast majority of the public overestimates the size of the federal budget that is spent on foreign aid, with just four percent correctly saying that foreign aid makes up one percent or less of the federal budget. A majority give answers above 10 percent, and on average, Americans answer that 28 percent of the budget is spent on foreign aid.
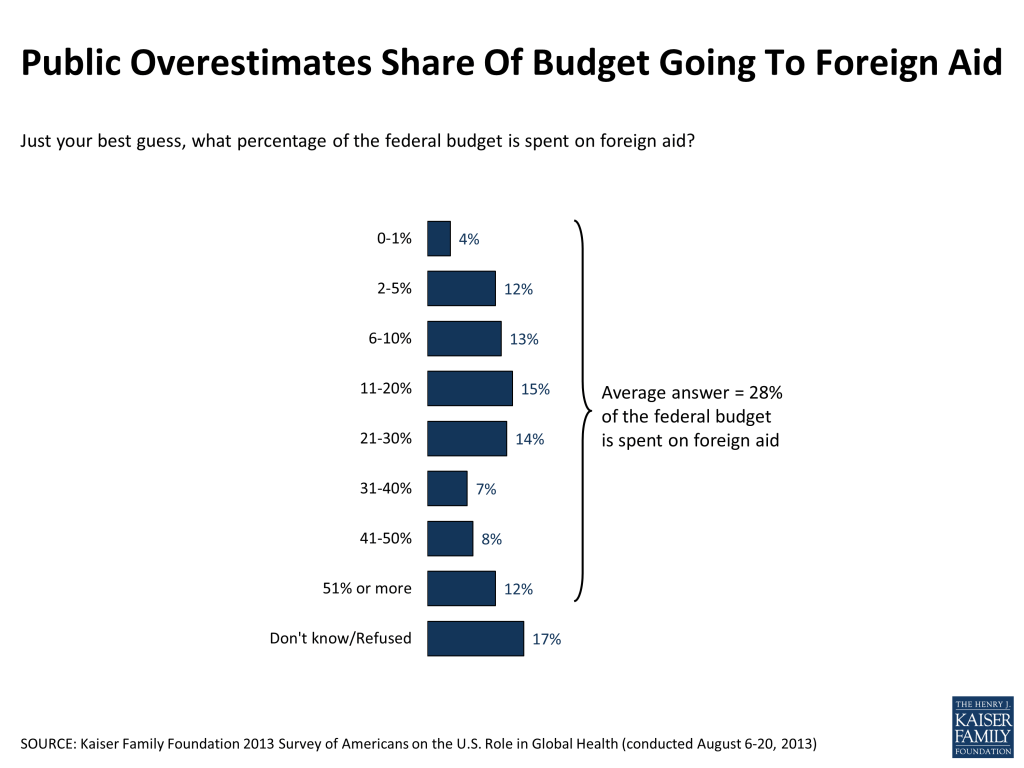
Figure 4

As previous Kaiser surveys have shown, spending on “foreign aid” continues to be unpopular, and in this survey, six in ten think the U.S. is now spending too much on foreign aid, and just 13 percent say the country is spending too little. However, we also find that providing people with accurate information has the potential to move opinion significantly. When survey respondents are told that only about one percent of the federal budget is spent on foreign aid, the share saying the U.S. spends too little more than doubles (from 13 percent to 28 percent), while the share saying we spend too much drops in half (from 61 percent to 30 percent).
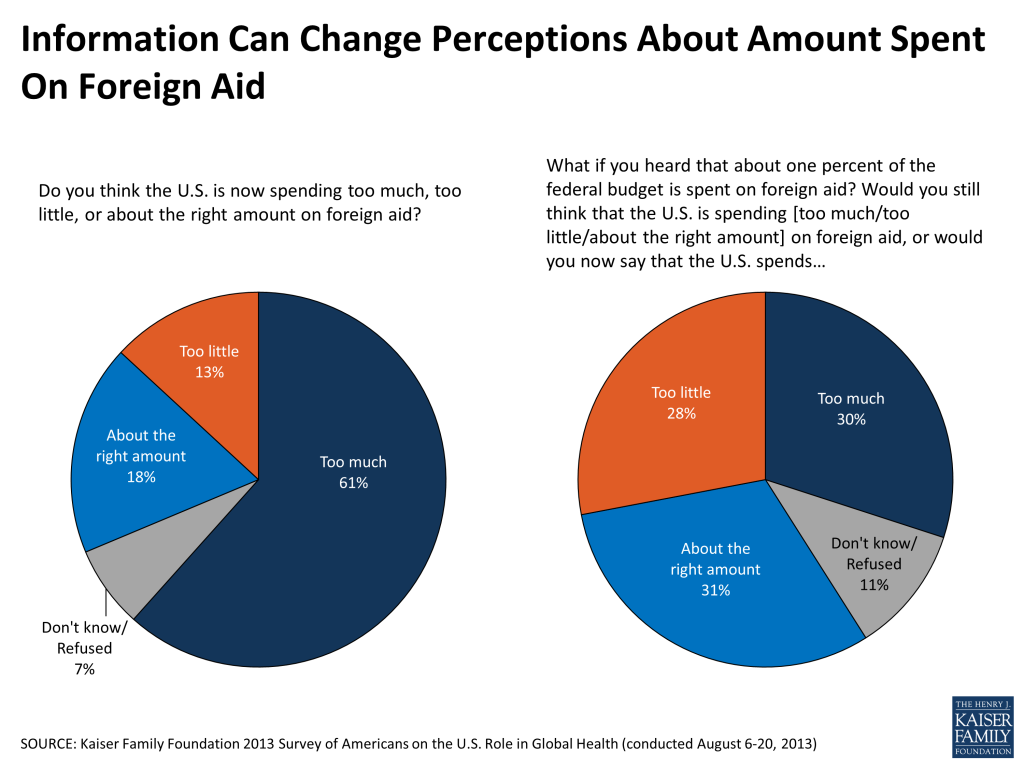
Figure 5

When it comes to the types of things U.S. foreign aid money is actually spent on, the public perceives a variety of components as making up this spending. At the top of the list, 65 percent think military assistance is a “major part” of U.S. foreign aid spending, and nearly half (47 percent) say the same about addressing health issues in developing countries. Around four in ten (39 percent) see improving education and building and strengthening infrastructure as major parts of U.S. foreign aid spending. In addition to these specific areas, 40 percent believe a major part of foreign aid is given to developing countries to use as they see fit. In fact, most U.S. foreign aid spending goes to specific program areas (such as agriculture, disease prevention, and maternal health, among others), and most aid does not go directly to governments, but rather to local or international non-governmental organizations, including to U.S.-run programs, in developing countries.1 
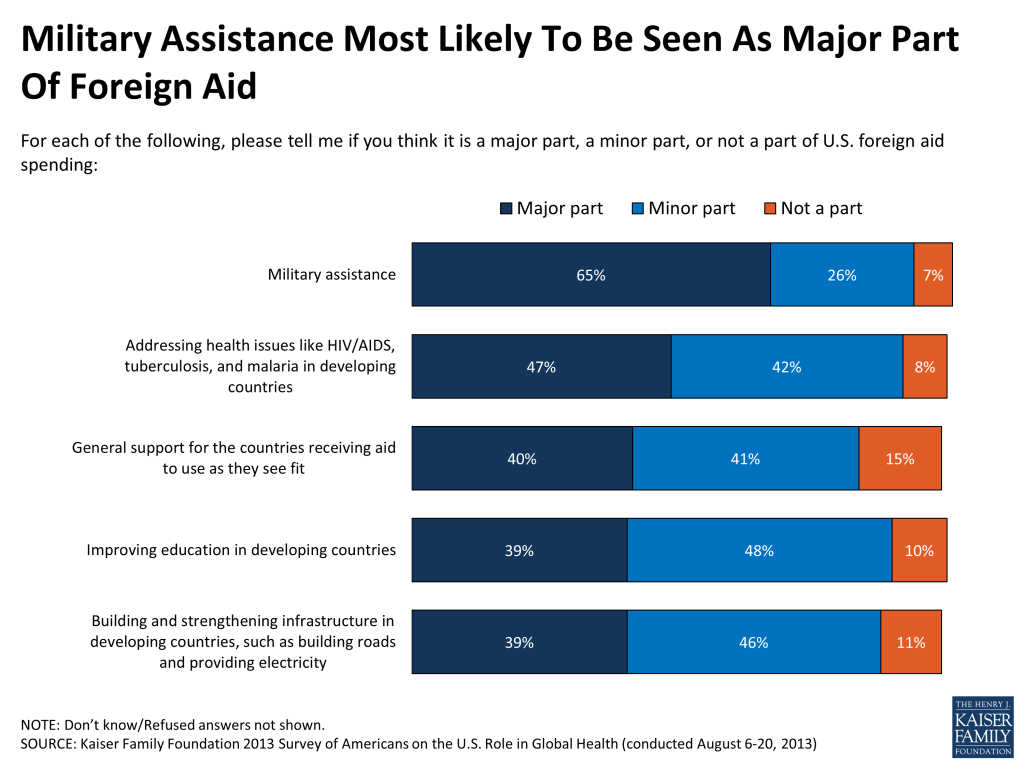
Figure 6

Specificity Matters: More Support For Spending On “Improving Health” Versus “Foreign Aid”

Kaiser surveys have consistently found that Americans are more likely to support U.S. spending for global health specifically than they are when asked about foreign aid more generally. In the current survey, about six in ten say the U.S. is now spending too little (31 percent) or about the right amount (30 percent) on efforts to improve health for people in developing countries, while three in ten say the country is spending too much.
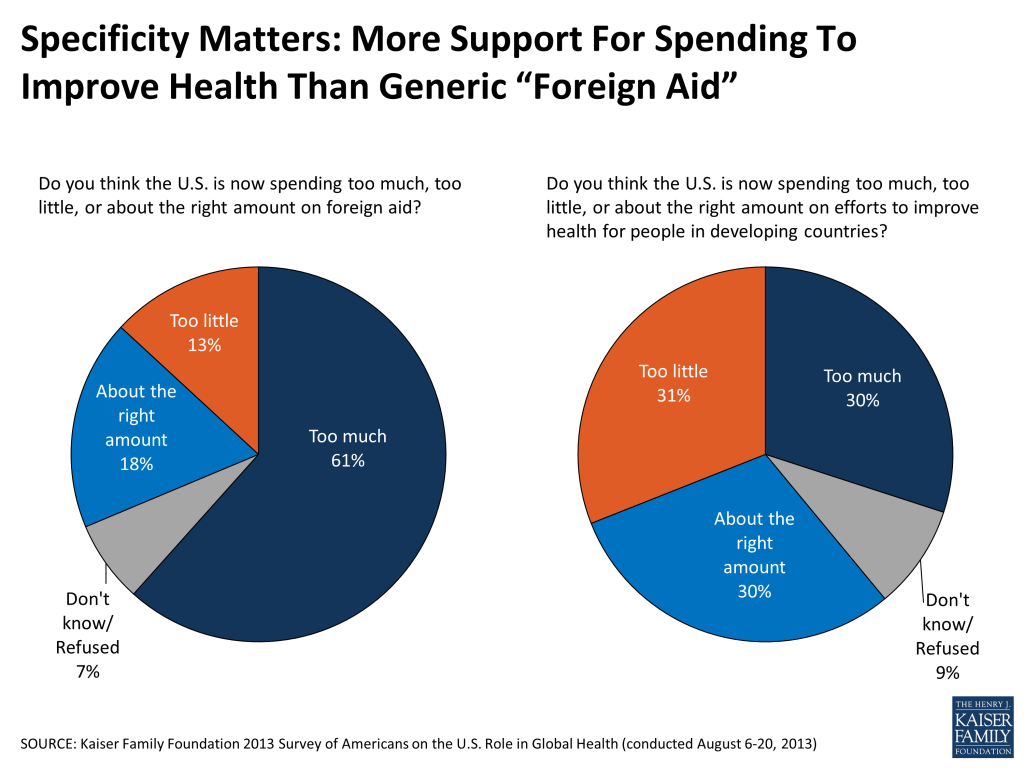
Figure 7

Attitudes towards the amount of U.S. spending on health in developing countries have held relatively steady in recent years over the course of the country’s economic recovery and battles over the federal budget and deficit. The share who say the U.S. is spending “too much” on these efforts is somewhat higher in 2013 than it was in 2012, but is close to the level measured in 2010.
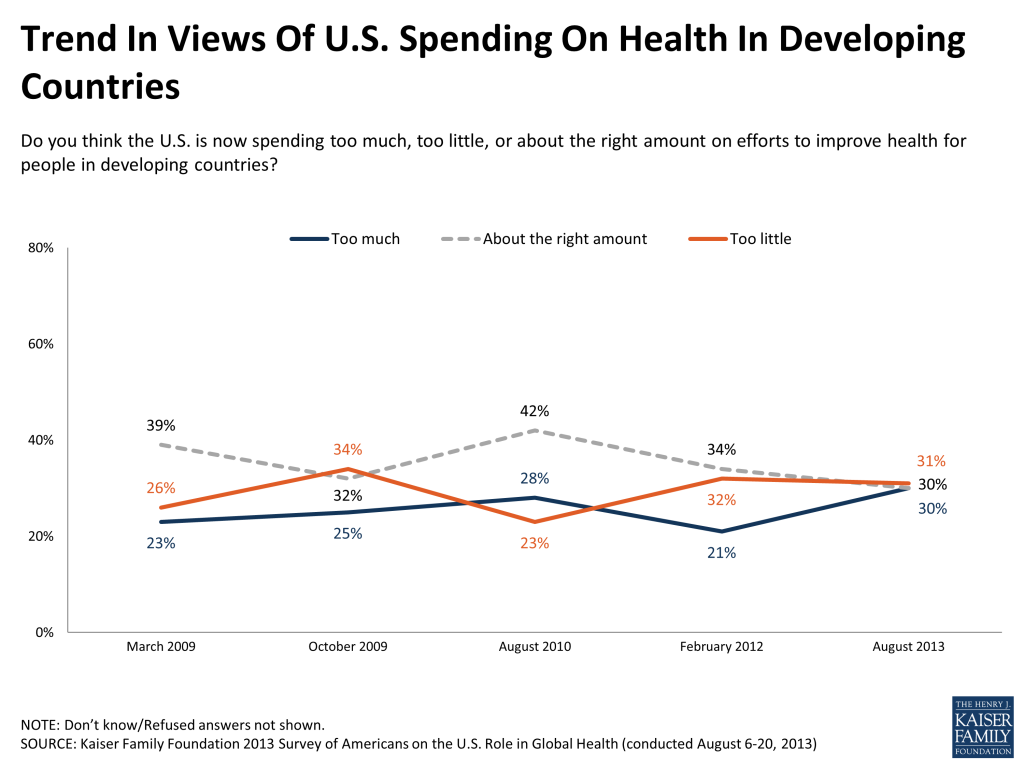
Figure 8

Public Believes U.S. Global Health Spending Protects Health At Home And Improves U.S. Image, But Moral Reason For Giving Trumps Self-Interest

Nearly seven in ten believe that U.S. spending on health in developing countries helps protect the health of Americans by preventing the spread of diseases, and over half believe such spending is helpful for improving the U.S. image around the world. The public is somewhat less convinced that U.S. global health spending helps U.S. national security or the U.S. economy, with close to four in ten saying it is helpful in these areas and about six in ten saying it doesn’t have much impact.
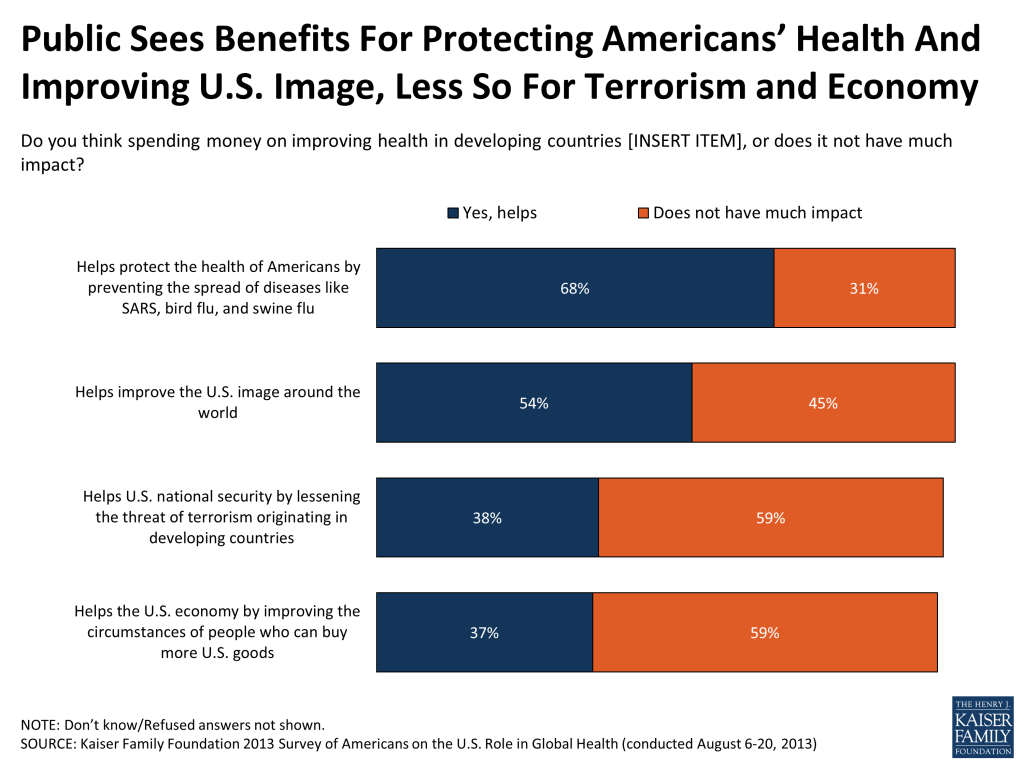
Figure 9

While many recognize these potential benefits at home, the moral argument ranks higher than self-interest arguments among the public in terms of reasons for giving aid. Nearly half say the most important reason for the U.S. to spend money on improving health in developing countries is “because it’s the right thing to do,” while far fewer choose reasons related to U.S. diplomacy, economy, or security.
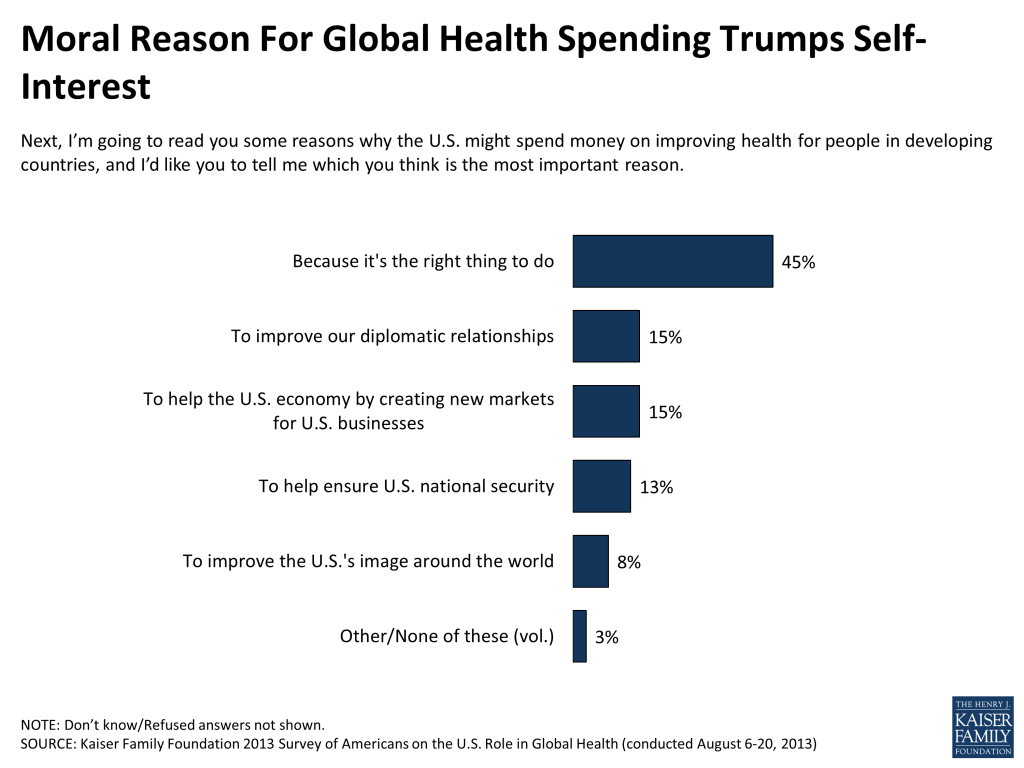
Figure 10

Most Support Participation In International Efforts

When it comes to how the U.S. should go about providing aid to improve health in developing countries, over six in ten say the country should participate in international efforts, so other countries will do their fair share and efforts will be better coordinated. About half as many (31 percent) feel that it’s better for the U.S. to operate on its own, so we have more control over how money is spent and get more credit and influence in the countries receiving aid. This desire to participate in international efforts may be related to the fact that half of Americans believe the U.S. is already contributing more than its fair share to global health efforts compared to other wealthier countries, while just 13 percent think the U.S. is doing less than its fair share and three in ten say the U.S. share is about right.
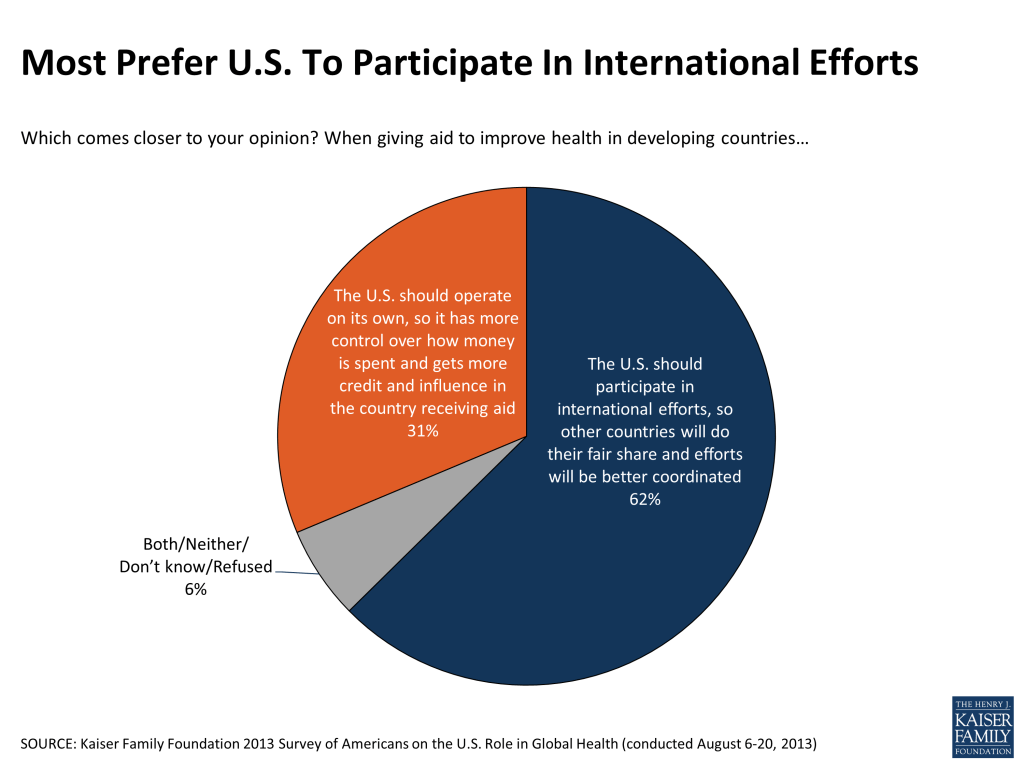
Figure 11

Caveats To Support For Spending; Perceived Barriers

Caveats To Support For Current Level Of U.S. Spending On Global Health: Concerns About Economy, Desire To Protect Domestic Programs, Skepticism About Whether Spending Will Lead To Progress

While six in ten Americans say that the current level of U.S. spending to improve health in developing countries is either too low or about right, economic concerns continue to make the public wary of the idea of increasing spending abroad. Since 2009, a solid majority of the public has said that given the serious economic problems facing the country and the world, the U.S. can’t afford to spend more money on health in developing countries, while a much smaller share have said the current economic conditions make it more important than ever for the U.S. to increase such spending.
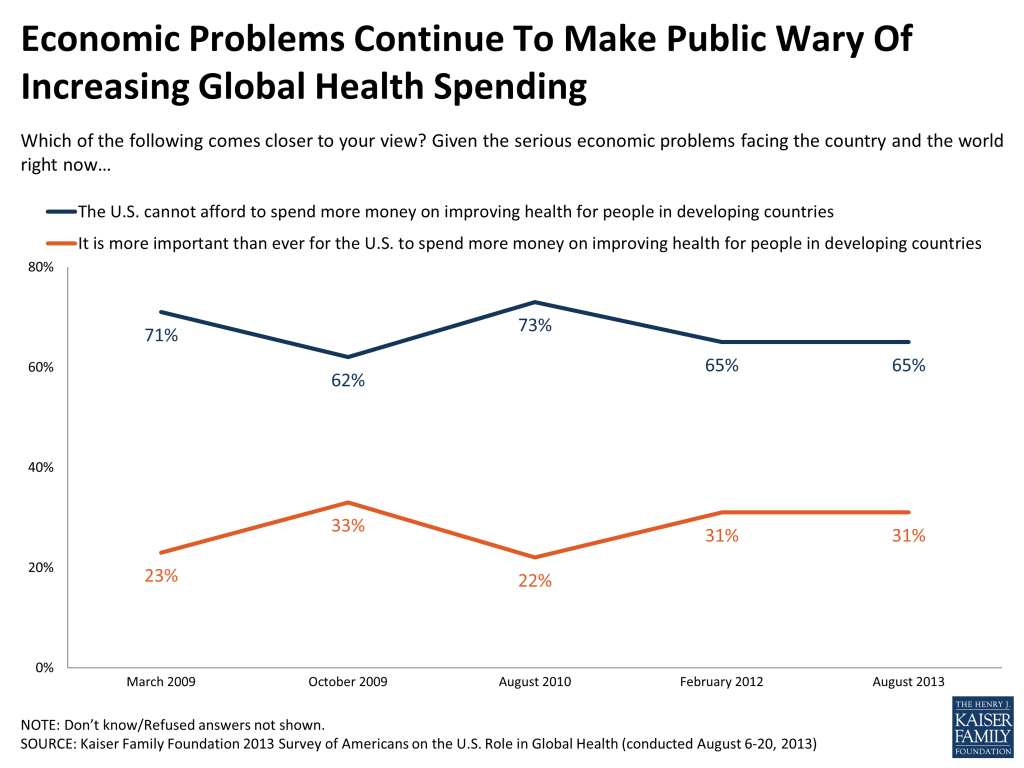
Figure 12

Another important caveat to support for current levels of spending is that the public is much more likely to back reductions in spending on overseas aid in order to reduce the deficit than they are to support cuts in domestic programs like Medicare, Social Security, and public education. Nearly half say they would support major reductions to spending on foreign aid as a way to reduce the federal budget deficit, and another third would support minor reductions. While fewer say they would support major reductions in “spending to address health issues like HIV/AIDS, tuberculosis and malaria in developing countries” versus the generic “foreign aid,” still over six in ten support major or minor reductions. By contrast, more than half say they would support no reductions to spending on public education, Social Security, Medicare, or Medicaid in order to reduce the deficit.
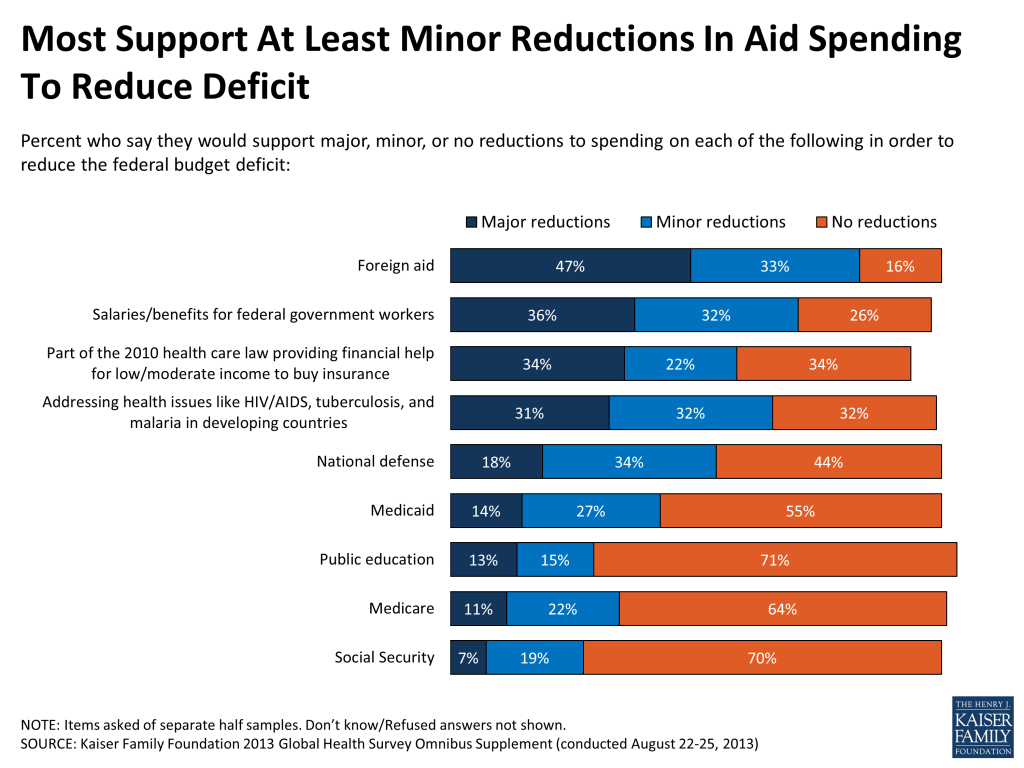
Figure 13

Since 2009, the public has also been divided as to whether more spending from the U.S. and other wealthier countries will lead to meaningful progress in improving health in developing countries or won’t make much difference. In 2013, 44 percent believe spending will lead to progress, while just over half say it won’t make much difference.
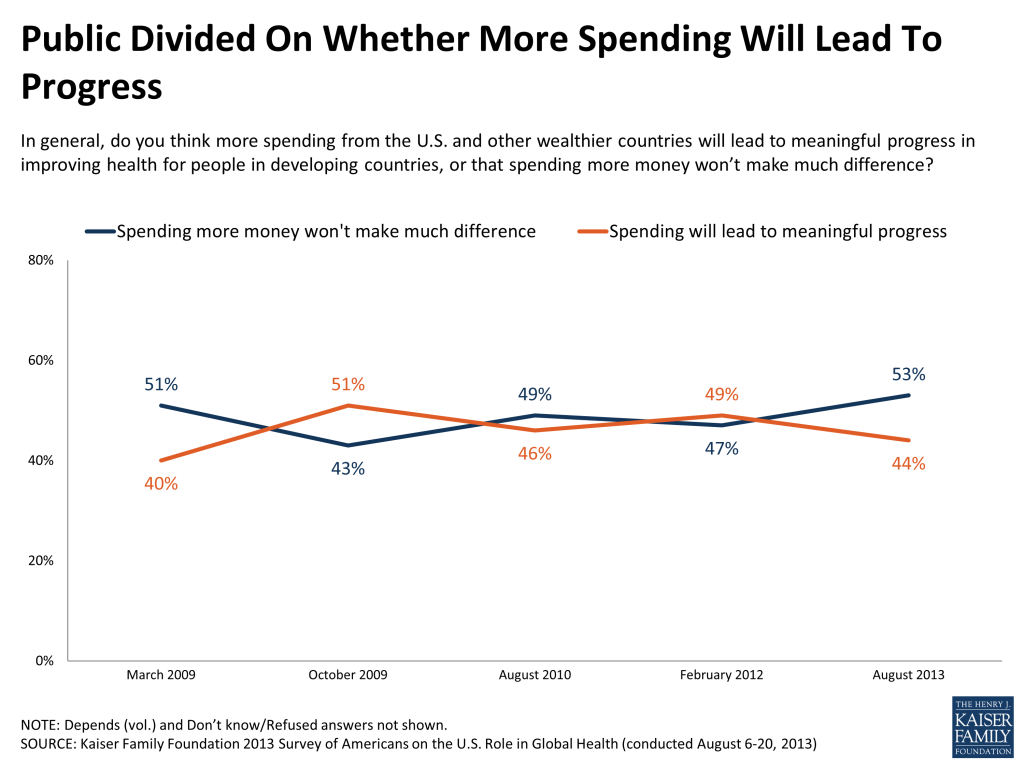
Figure 14

Skepticism about whether spending will lead to progress may be related to the fact that most Americans don’t believe U.S. spending on health in developing countries delivers a good return on investment, and only about a third think it improves self-sufficiency.

Two-thirds of the public rates the “bang for the buck” of U.S. spending on health in developing countries as “only fair” or “poor,”, while just a quarter say it is “good” or “excellent.” And while just over a third of the public believes such spending helps make people and communities more self-sufficient, an equal share believes this type of aid doesn’t have much impact on self-sufficiency, and roughly a quarter say it decreases self-sufficiency.
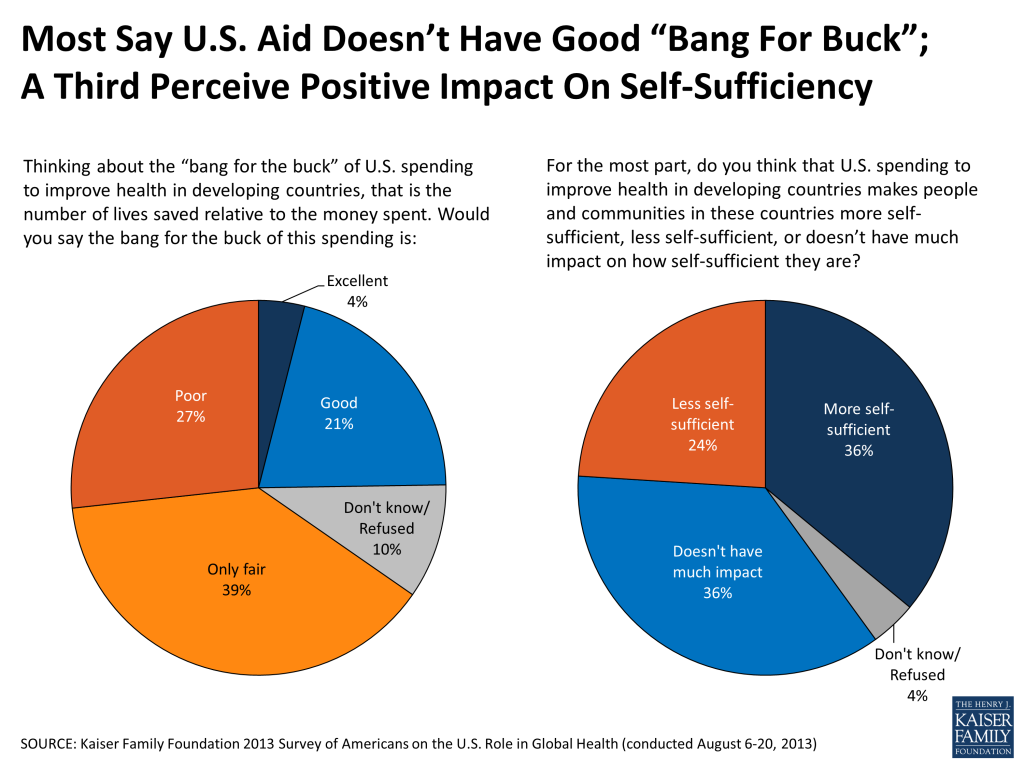
Figure 15

Corruption Perceived As Biggest Barrier To Progress

Another finding that has been consistent in Kaiser surveys: The public sees corruption as the biggest barrier to progress on global health. In the latest survey, 83 percent say corruption and misuse of funds is a “major reason” why it has been difficult to improve health for people in developing countries, and nearly half say it is the most important reason. Perhaps because of this concern about corruption, two-thirds of the public (66 percent) think the U.S. should have the primary role in determining how U.S. aid is spent in developing countries to ensure tax dollars are well spent, while just about a quarter (27 percent) say it’s better for the developing country governments to make decisions about how aid is spent since they know their country’s problems best.
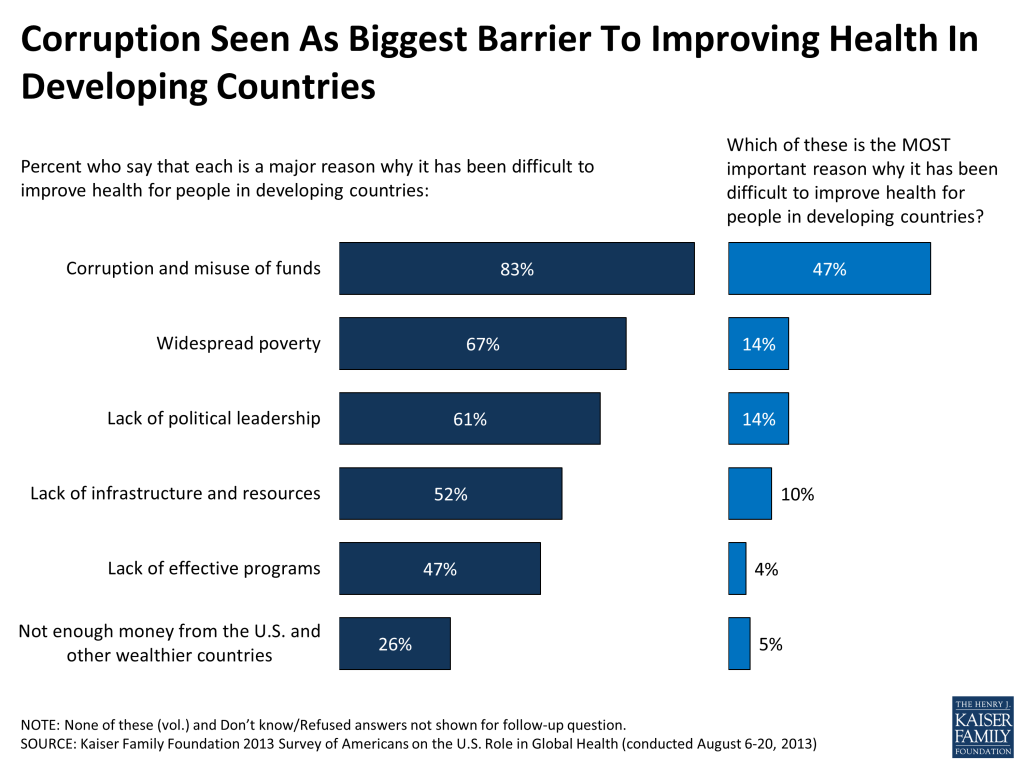
Figure 16

Section 4: Attitudes Towards U.S. Global Health Spending By Party Identification

As is the case when it comes to most questions involving federal spending, attitudes towards U.S. spending on efforts to improve health in developing countries differ somewhat by individual political party identification. However, these partisan differences are much smaller than we find on questions of domestic health care policy and spending. For example, Republicans are 15 percentage points more likely than Democrats to say the U.S. currently spends too much on health in developing countries, but still over half of Democrats, Republicans, and independents say such spending is either too little or about right.

FIGURE 17: VIEWS OF CURRENT LEVELS OF U.S. GLOBAL HEALTH SPENDING BY PARTY ID
TotalDemocratsIndependentsRepublicans
Do you think the U.S. is now spending too much, too little, or about the right amount on efforts to improve health for people in developing countries?
Too much30%24%30%39%
About right30293132
Too little31403020
TOTAL TOO LITTLE OR ABOUT RIGHT61696152

Some underlying partisan differences in perceptions of the impact of U.S. spending on health in developing countries may help explain the small but measurable differences in support for spending. For example, while a majority of Democrats believe that more spending from the U.S. and other wealthier countries will lead to meaningful progress in improving health, two-thirds of Republicans feel that more spending won’t make much difference. Democrats are also more likely than Republicans to believe that U.S. aid helps people and communities in developing countries to become more self-sufficient, while Republicans are more likely to perceive a negative impact on self-sufficiency. Republicans and independents are more likely to believe U.S. spending on health in developing countries delivers a “poor” bang for the buck, though even among Democrats, relatively few see such spending as offering a good return on investment.

FIGURE 18: VIEWS OF IMPACTS OF U.S. GLOBAL HEALTH SPENDING BY PARTY ID
TotalDemocratsIndependentsRepublicans
In general, do you think more spending from the U.S. and other wealthier countries will lead to meaningful progress in improving health for people in developing countries, or that spending more money won’t make much difference?
Will lead to meaningful progress44%55%45%31%
Won’t make much difference53425367
For the most part, do you think that U.S. spending to improve health in developing countries makes people and communities in these countries more self-sufficient, makes them less self-sufficient, or doesn’t have much impact on how self-sufficient they are?
More self-sufficient36443630
Less self-sufficient24202529
Doesn’t have much impact on self-sufficiency36333639
Next, thinking about the “bang for the buck” of U.S. spending to improve health in developing countries, that is the number of lives saved relative to the money spent. Would you say the bang for the buck of this spending is…?
Excellent4632
Good21232416
Only fair39423741
Poor27202833

Visibility Of Global Health Issues And Sources Of Information

Declining Attention And Visibility Of Global Health Issues

The public reports engaging in global health issues on various levels, but there is some indication that the level of visibility and attention has declined somewhat in recent years. In 2013, close to two-thirds of the public say they pay at least “some” attention to issues of health in developing countries, but just 12 percent say they pay “a lot” of attention. Each of these shares is down 10 percentage points from March 2009. About a third of the public reports having donated to an organization working on global health issues in the past year, down from a high of 49 percent in August 2010 (the year of the Haiti earthquake), and similar to the level measured in 2009. Eleven percent say they have volunteered for an organization working on health in developing countries in the past year, a share that has held steady since 2009.
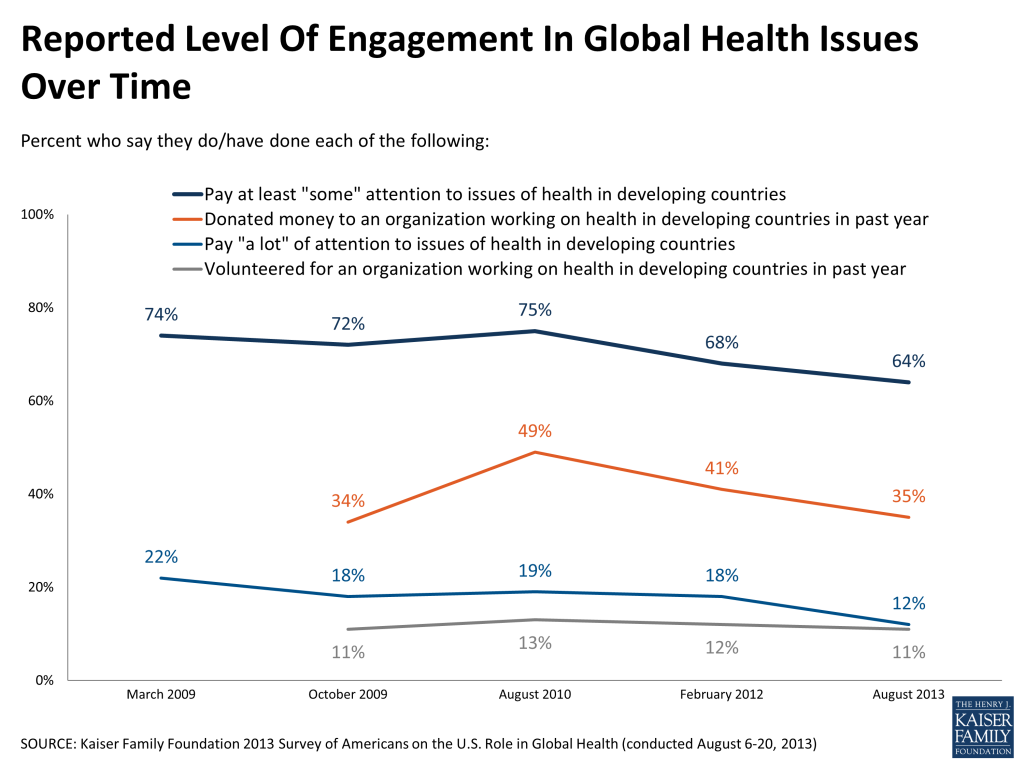
Figure 19

Over half of the public reports hearing “only a little” or “nothing at all” about U.S. government efforts to improve health in developing countries over the past year, while a third say they’ve heard “some” and just 15 percent say they’ve heard “a lot.” Visibility of U.S. government efforts in this area are similar to 2012, but still somewhat lower than 2010, when more than half said they had heard “a lot” or “some” about these efforts.
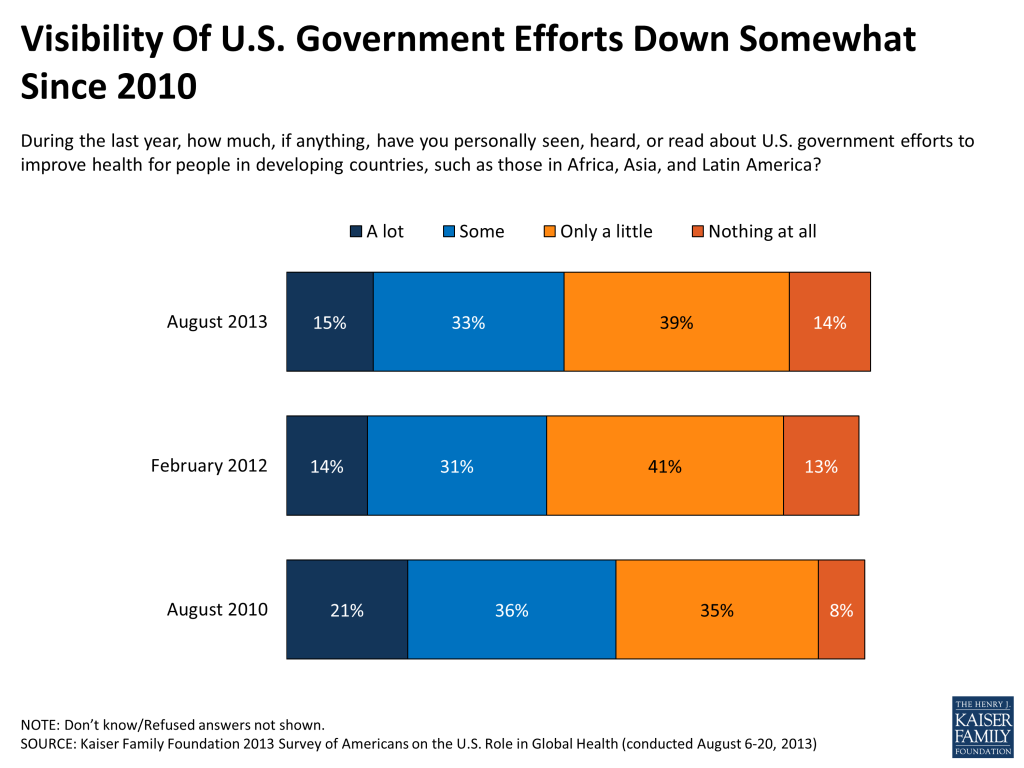
Figure 20

U.S. government efforts, there is variation in how much the public reports hearing in the news about specific global health issues and problems. Most prominently, nearly two-thirds say they have heard “a lot” or “some” in the past year about hunger and malnutrition in developing countries. Just over half report hearing news about HIV/AIDS, children’s health, and global pandemics like the flu, while somewhat fewer report hearing something about maternal health. Less visible issues include family planning, tuberculosis, and polio.
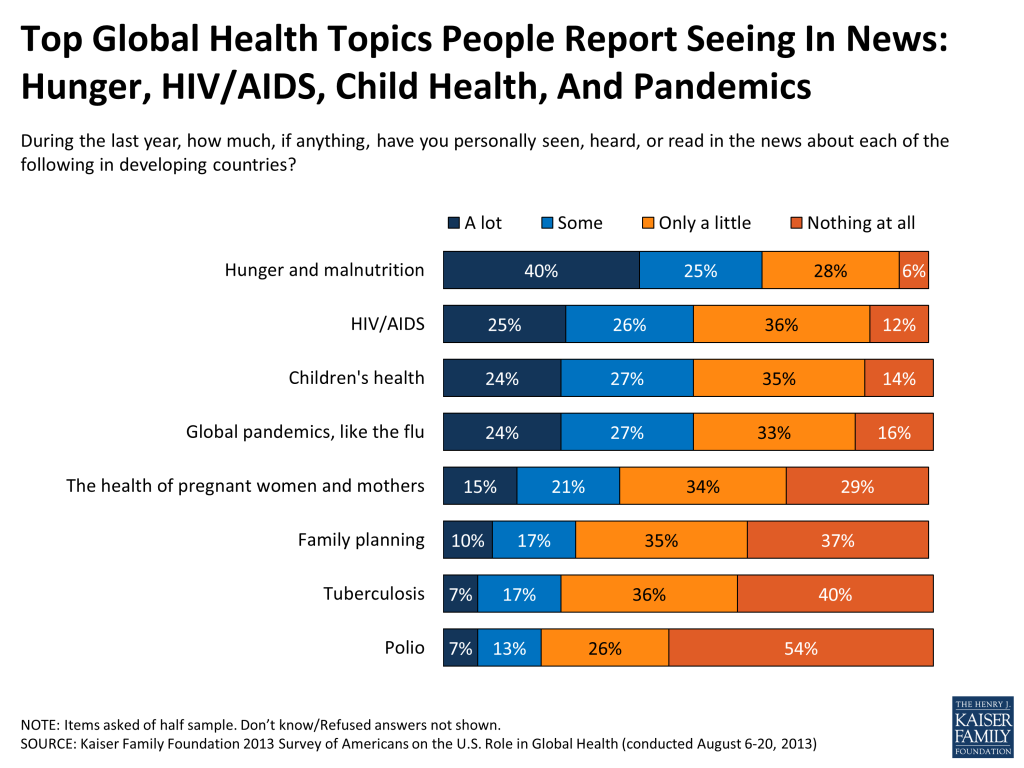
Figure 21

News Media Top Source Of Information

As it is on many topics, the news media remains the public’s top source of information on global health, with seven in ten saying they have gotten “a lot” or “some” information about the health of people in developing countries from news media sources in the past year. Behind the media as sources of information are non-profit organizations, churches and other religious institutions, and conversations with friends and family. Social media ranks at the bottom of the list as a source of information, with just 28 percent saying they’ve gotten “a lot” or “some” information about health in developing countries from sites like Facebook or Twitter in the past year. Young adults are somewhat more likely than others to report getting information about global health from social media (47 percent of those ages 18-29 say they’ve gotten at least “some” in the past year), but news media is still the top source, far outranking social media for Americans of all ages.
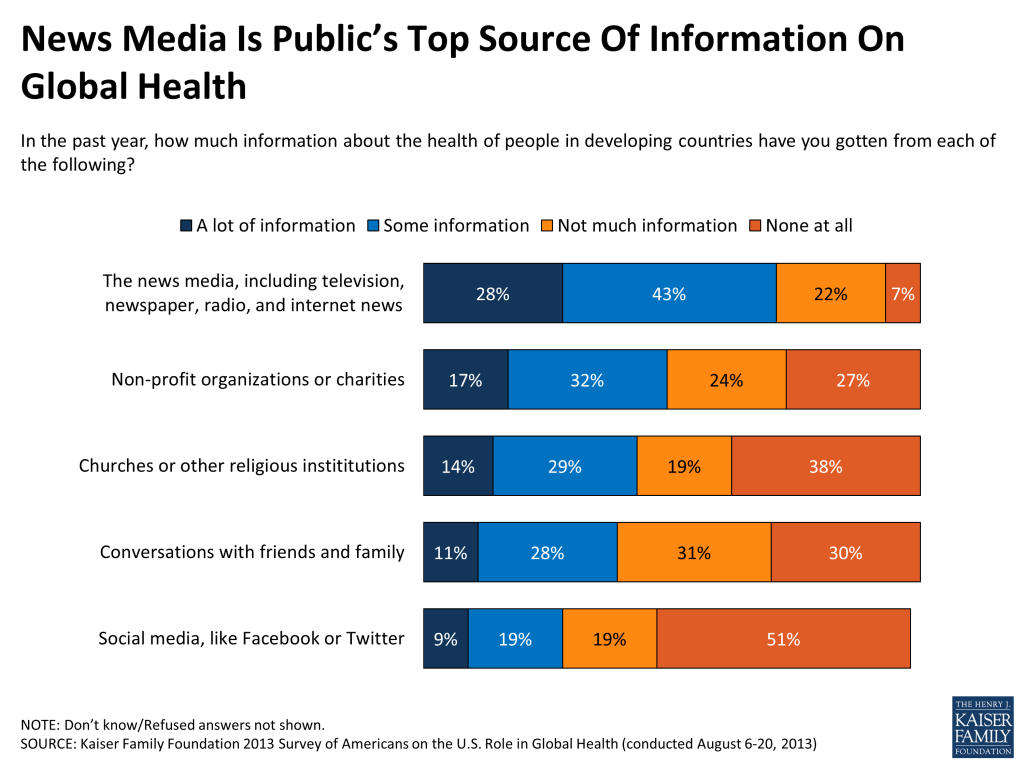
Figure 22

With the news media as their top source of information on issues of health in developing countries, many Americans say they would like to hear more from this source. Fully half say the news media spends too little time covering global health issues, while just 12 percent say the news media spends too much time on the topic and a third say the amount of coverage is about right. When it comes to the content of that coverage, Americans report hearing a fairly even mix of positive and negative stories. Overall, 28 percent say they’ve heard only or mostly positive news stories about global health in the past year (such as stories about successful programs), and a similar share – 26 percent – say they’ve heard only or mostly negative stories (such as those about corruption).
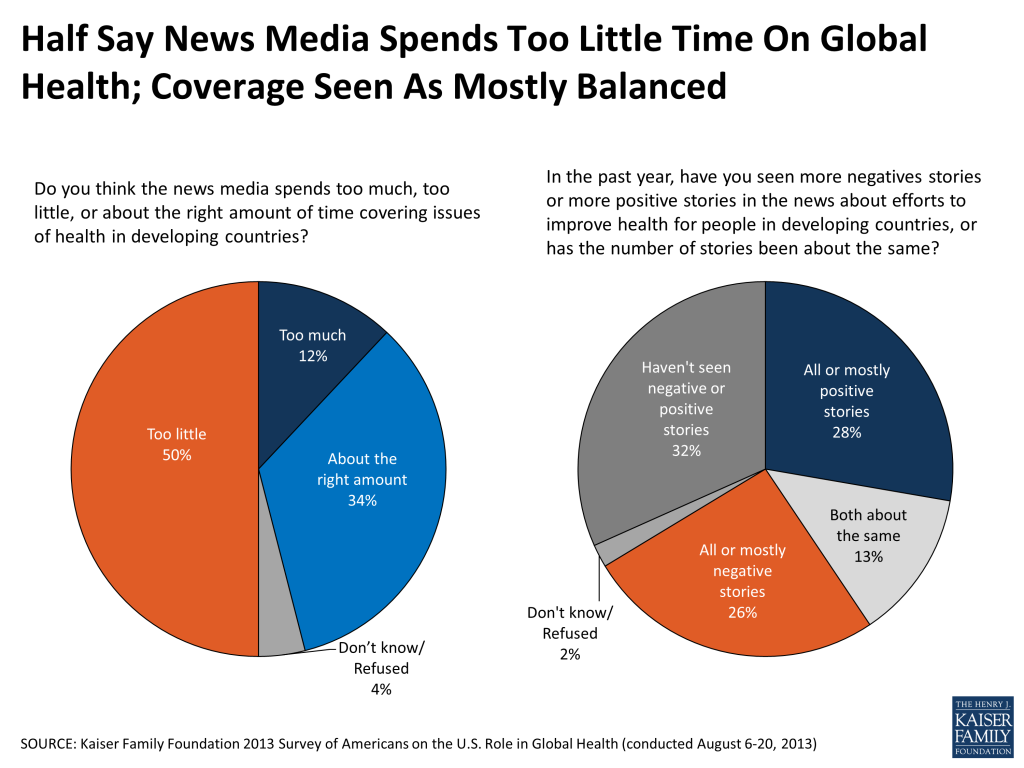
Figure 23

Bill And Hillary Clinton, Bill Gates, And Barack Obama Stand Out As Leaders In Global Health

When asked about various people who might be perceived as leaders in efforts to improve health for people in developing countries, Bill Clinton tops the list, with 70 percent saying the former president stands out as a leader in this area. He is followed closely by philanthropist and former Microsoft CEO Bill Gates, former Secretary of State Hillary Clinton, and President Barack Obama. Fewer see former president George W. Bush or current Secretary of State John Kerry as leaders in global health.
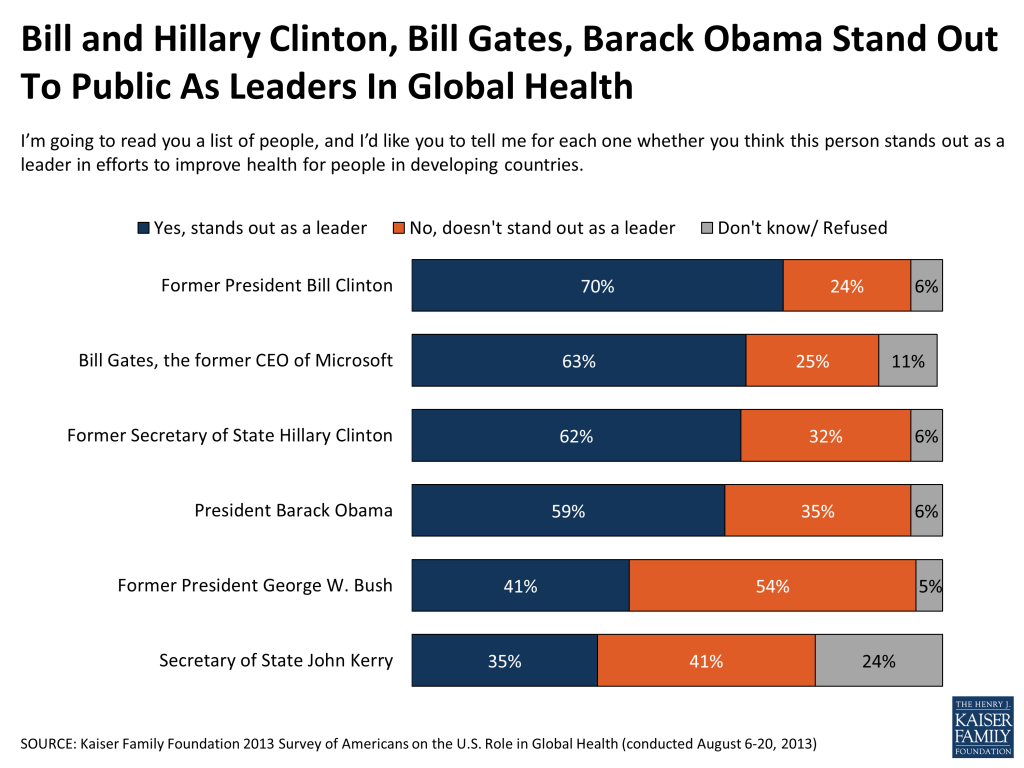
Figure 24

The Kaiser Family Foundation 2013 Survey of Americans on the U.S. Role in Global Health was designed and analyzed by public opinion researchers at the Foundation led by Mollyann Brodie, Ph.D., including Liz Hamel and Becky Hanna. The survey was conducted August 6-20, 2013, among a nationally representative random digit dial telephone sample of 1,507 adults ages 18 and older, living in the United States, including Alaska and Hawaii (note: persons without a telephone could not be included in the random selection process). Computer-assisted telephone interviews conducted by landline (752) and cell phone (755, including 427 who had no landline telephone) were carried out in English and Spanish by Braun Research under the direction of Princeton Survey Research Associates International (PSRAI). Both the random digit dial landline and cell phone samples were provided by Survey Sampling International, LLC. For the landline sample, respondents were selected by asking for the youngest adult male or female currently at home based on a random rotation. If no one of that gender was available, interviewers asked to speak with the youngest adult of the opposite gender. For the cell phone sample, interviews were conducted with the person who answered the phone. The survey fieldwork was funded through a grant from the Bill & Melinda Gates Foundation.

The combined landline and cell phone sample was weighted to balance the sample demographics to match estimates for the national population using data from the Census Bureau’s 2011 American Community Survey (ACS) on sex, age, education, race, Hispanic origin, nativity (for Hispanics only), and region along with data from the 2010 Census on population density. The sample was also weighted to match current patterns of telephone use using data from the July-December 2012 National Health Interview Survey. The weight takes into account the fact that respondents with both a landline and cell phone have a higher probability of selection in the combined sample and also adjusts for the household size for the landline sample. All statistical tests of significance account for the effect of weighting.

The margin of sampling error including the design effect for the full sample is plus or minus 3 percentage points. For results based on subgroups, the margin of sampling error may be higher. Sample sizes and margin of sampling errors for other subgroups are available by request. Note that sampling error is only one of many potential sources of error in this or any other public opinion poll.

Methodology for Omnibus Supplement

One additional question (the deficit question labeled O1 and listed on page 18 of the survey topline) was asked on the PSRAI omnibus survey. Different research clients purchase space on the omnibus survey and therefore additional questions covering a wide variety of topics may have preceded or followed this question. The Kaiser Global Health Omnibus Supplement was conducted August 22-25, 2013, among a nationally representative random digit dial telephone sample of 1,001 adults ages 18 and older, living in the continental United States (note: persons without a telephone could not be included in the random selection process). Computer-assisted telephone interviews conducted by landline (501) and cell phone (500, including 253 who had no landline telephone) were carried out in English by MKTG under the direction of PSRAI.

The combined landline and cell phone sample was weighted to balance the sample demographics to match estimates for the national population using data from the Census Bureau’s 2011 American Community Survey (ACS) on sex, age, education, race, Hispanic origin, and region along with data from the 2010 Census on population density. The sample was also weighted to match current patterns of telephone use using data from the July-December 2012 National Health Interview Survey.

The margin of sampling error including the design effect for the full sample on the omnibus supplement is plus or minus 4 percentage points. Full methodological details, including weighted and unweighted values for key demographic variables and response rates are available upon request.

Endnotes

  1. See, for example, USAID Forward Progress Report 2013 (http://www.usaid.gov/sites/default/files/documents/1868/2013-usaid-forward-report.pdf) and Institute of Medicine Evaluation of PEPFAR (http://www.iom.edu/Reports/2013/Evaluation-of-PEPFAR.aspx) ↩︎

Health Insurance Coverage of Women, State Estimates

Published: Nov 6, 2013

This fact sheet provides state-by-state data on the uninsured rate, as well as rates of private insurance coverage and Medicaid coverage, among women nationally, in the 50 states and the District of Columbia.

      Health Insurance Coverage of  Women Ages 18 to 64, by State, 2011-2012
Estimated Number of Women (Thousands)ESI/Other Public*IndividualMedicaidUninsured
Percent Distribution
United States98,28361%7%12%19%
Alabama1,53465%11%18%
Alaska22164%5%10%22%
Arizona2,01058%5%16%21%
Arkansas89756%7%11%26%
California12,05855%8%15%23%
Colorado1,60762%10%10%18%
Connecticut1,14370%7%13%10%
Delaware28966%5%17%12%
District of Columbia22959%9%23%9%
Florida5,98758%7%9%27%
Georgia3,18660%6%8%26%
Hawaii41571%5%14%10%
Idaho46161%8%8%23%
Illinois4,01264%7%13%17%
Indiana2,01265%4%14%18%
Iowa94465%10%13%12%
Kansas85267%8%9%16%
Kentucky1,38563%6%12%20%
Louisiana1,41756%5%12%27%
Maine43462%6%20%12%
Maryland1,92869%6%9%16%
Massachusetts2,14268%6%22%4%
Michigan3,07364%7%15%15%
Minnesota1,65370%7%13%10%
Mississippi90459%5%15%20%
Missouri1,84964%8%11%17%
Montana29957%10%8%25%
Nebraska56266%11%8%15%
Nevada84659%6%7%28%
New Hampshire42574%6%5%14%
New Jersey2,77366%5%10%18%
New Mexico63353%5%14%27%
New York6,29460%6%20%14%
North Carolina3,02361%6%11%22%
North Dakota21670%12%7%11%
Ohio3,54064%7%13%16%
Oklahoma1,14762%6%10%22%
Oregon1,24059%10%12%19%
Pennsylvania4,07866%8%13%13%
Rhode Island33762%7%16%15%
South Carolina1,51362%5%12%20%
South Dakota24663%12%9%17%
Tennessee2,02961%7%15%17%
Texas8,09557%5%8%30%
Utah82666%8%7%18%
Vermont20161%7%23%9%
Virginia2,58770%7%7%17%
Washington2,18965%6%11%18%
West Virginia59462%3%20%
Wisconsin1,77464%9%16%11%
Wyoming17662%8%9%21%
* ESI/Other Public category includes: employer-based coverage and other public insurance, such as Medicare and military-related coverage. – Sample size too small.SOURCE: State-level figures based on Urban Institute and Kaiser Family Foundation estimates of pooled 2012 and 2013 Current Population Surveys.  U.S. Total figures based on 2013 Survey.
Health Insurance Coverage of Low-income Women Ages 18 to 64, by State, 2011-2012
Estimated Number of Women (Thousands)% of Women Who are Low-IncomeESI/Other Public*IndividualMedicaidUninsured

Percent Distribution

United States 36,74037%29%8%27%36%
Alabama 63641%36%23%33%
Alaska 8538%37%22%35%
Arizona 81140%26%32%37%
Arkansas 41246%29%21%43%
California 5,01342%24%8%29%38%
Colorado 49631%27%14%24%35%
Connecticut 32729%35%9%34%22%
Delaware 10637%35%38%23%
District of Columbia 7935%19%12%54%15%
Florida 2,29538%29%7%18%46%
Georgia 1,30641%32%8%16%45%
Hawaii 18144%49%6%28%17%
Idaho 18841%31%18%42%
Illinois 1,42135%31%8%29%32%
Indiana 79840%32%31%31%
Iowa 29631%29%12%32%26%
Kansas 28133%33%10%22%35%
Kentucky 57141%31%24%37%
Louisiana 64145%28%23%44%
Maine 14333%25%7%46%22%
Maryland 52827%33%8%25%35%
Massachusetts 67532%34%51%7%
Michigan 1,10436%31%10%32%27%
Minnesota 43526%26%12%38%24%
Mississippi 41546%31%29%34%
Missouri 66736%31%26%35%
Montana 11739%29%11%17%43%
Nebraska 16930%36%12%19%32%
Nevada 35342%33%14%47%
New Hampshire 9923%39%17%34%
New Jersey 87331%29%25%38%
New Mexico 28345%25%25%45%
New York 2,43939%29%8%40%24%
North Carolina 1,16138%30%24%38%
North Dakota 5827%31%19%23%27%
Ohio 1,33938%31%10%29%30%
Oklahoma 43938%33%22%39%
Oregon 44736%24%25%37%
Pennsylvania 1,39434%30%12%33%25%
Rhode Island 12136%26%35%30%
South Carolina 61040%34%25%35%
South Dakota 8334%31%13%21%34%
Tennessee 82140%30%31%30%
Texas 3,36142%27%5%17%52%
Utah 28735%39%17%32%
Vermont 5929%24%49%17%
Virginia 77730%35%11%17%36%
Washington 73133%30%7%25%37%
West Virginia 22738%30%31%35%
Wisconsin 52830%26%41%23%
Wyoming 5833%28%12%23%37%
* ESI/Other Public category includes: employer-based coverage and other public insurance, such as Medicare and military-related coverage. – Sample size too small.Note: Low income is defined as incomes less than 200% of the poverty threshold, which equaled $38,180 for a family of three in 2012.SOURCE: State-level figures based on Urban Institute and Kaiser Family Foundation estimates of pooled 2012 and 2013 Current Population Surveys. U.S. Total figures based on 2013 Survey.


State-by-State Estimates of the Number of People Eligible for Premium Tax Credits Under the Affordable Care Act

Published: Nov 5, 2013

Issue Brief

Key provisions of the 2010 Affordable Care Act (ACA) create new Marketplaces for people who purchase insurance directly and provide new premium tax credits to help people with low or moderate incomes afford that coverage.  We estimate that about 17 million people who are now uninsured or who buy insurance on their own (“nongroup purchasers”) will be eligible for premium tax credits in 2014.  This issue brief provides national and state estimates for tax credit eligibility for people in these groups.  We also estimate that about 29 million people nationally could look to new Marketplaces as a place to purchase coverage.

Eligibility for Premium Tax Credits

A key focus of the ACA is to reduce the number of uninsured by expanding the number of people who buy nongroup coverage.  It does this by removing existing barriers that keep people with health problems from obtaining coverage, and by providing financial assistance through premium tax credits for low and moderate income people who purchase coverage through new state Marketplaces operated by states or the federal government.  The Congressional Budget Office estimates that by 2018 around 20 million people covered in marketplaces will receive premium tax credits to assist them with their premium costs.1 

Under the law, people with incomes between 100 percent and 400 percent of the federal poverty level may be eligible for premium tax credits when they purchase coverage in a Marketplace.  People who are eligible for other types of public or private coverage, for example Medicaid or coverage through an employer-provided plan, generally cannot claim a premium tax credit.  These tax credits also are not available to people who are not lawfully present in the country or who are incarcerated.  Legally residing immigrants who recently arrived in the country are eligible for premium tax credits despite being ineligible for Medicaid; they may qualify if their income does not exceed 400 percent of the federal poverty level.2 

The amount of tax credit that a person receives depends on their family income and the cost of health insurance where they live.  The law establishes a maximum percentage of income that people within the 100 to 400 percent of poverty income range must pay for a benchmark plan where they live.  The percentages range from 2% of income for people with income at the federal poverty line to 9.5% of income for people with incomes at four times federal poverty.  If the premium that a person or family faces for the benchmark plan in their area is higher than the maximum percent of income defined in the law for their income, they are eligible for a tax credit and the tax credit is equal to the difference between the premium for the benchmark plan and the defined percent of their income.  The benchmark plan is the second-lowest-cost plan in the silver cost-sharing tier offered through the marketplace for the area where they live.3   Additional explanations and examples are available by using the Kaiser Premium Subsidy Calculator.

People who are eligible for a premium tax credit can apply it to reduce the premium for any plan (other than catastrophic plans) offered in the marketplace.  Their cost will be the actual premium for the plan that they enroll in minus the value of the premium tax credit they receive.  One thing to note is that because marketplace premiums vary by age in most states, people with the same income but different ages will qualify for different premium tax credit amounts.  In some cases, the premium for a benchmark plan for people at younger ages will be less than the defined percentage of income specified in the law; in this case the person would not receive a premium tax credit and would have to pay the full premium for any plan that they choose.  However, they would still be able to purchase coverage, and their cost as a share of income will match the cost for others with comparable incomes.  Premiums also vary by geographic area, which means that premium tax credits may differ for otherwise similar people if they live in different places.

How Many People are Eligible for Premium Tax Credits

We used data from the 2012 and 2013 Current Population Survey (CPS) Annual Social and Economic Supplement (ASEC) to estimate the number of people eligible for premium tax credits for marketplace coverage.  The ASEC provides detailed information on family composition, income and insurance status for national and state samples of residents.  We use that information to determine whether each individual would be eligible to purchase coverage through a marketplace and whether they would be eligible to receive a premium tax credit.

The analysis starts with a pool of people who have no insurance or who purchase nongroup insurance.  People who are covered by a public program or by employer-based coverage are assumed to retain that coverage and would not be eligible for premium tax credits.  Two other groups of people were then removed from this potential pool of tax-credit eligible individuals: uninsured adults and children whose incomes would make them eligible for Medicaid or CHIP and people who are not legally residing in the United States.  Neither group is eligible for premium tax credits under the ACA.  For those remaining in the pool, we looked at their family incomes under ACA rules and the premiums that they would face for benchmark coverage to determine whether they would qualify for a premium tax credit. The vast majority of potential eligibles with incomes between 100 percent and 400 percent of poverty would qualify for a tax credits; those who do not qualify in this income range are younger people who face a premium that is lower than the defined percent of income under the law.  As a final step, we removed approximately 16 percent of potential eligibles because research shows that some people who are uninsured or have nongroup coverage have access to employer-based coverage, either through an offer from their own employer or through an offer through a spouse or parent.  Those that remain in the potential pool constitute our estimate of tax-credit eligible individuals.  A more complete description of this data and our methods is provided in the methods section below.

We estimate that over 17 million people nationally will be eligible for tax credits in 2014.  The national and state totals are shown in Table 1.  Three states (Texas, California, and Florida) each have more than 1 million tax-credit-eligible residents, and another seven states have more than 500,000 tax-credit-eligible residents.  At the lower end, seven states have fewer than 50,000 tax-credit-eligible residents, with the District of Columbia (9,500) and Vermont (27,000) having the fewest.  The five states with the most tax-credit-eligible individuals account for about 40 percent of all such individuals nationally.

How Many People Might Look to State Marketplaces for Coverage?

People eligible for premium tax credits are likely to look to new marketplaces when they want coverage because tax credits are only available to marketplace enrollees.  Others looking to purchase coverage on their own also might want to purchase in new marketplaces, although nongroup policies will be available outside of marketplaces as well.  Generally, nongroup policies written inside and outside of marketplaces will provide the same benefits, have the same cost-sharing tiers, and be subject to the same market rules.

We estimate the potential market for coverage in marketplaces by starting with current nongroup purchasers and uninsured people who are legally residing in the United States and who are not eligible for Medicaid or CHIP.  We then excluded two groups from among the current uninsured.  The first group is people with incomes above Medicaid eligibility levels but below poverty, referred to as the gap group. Because they are not eligible for financial assistance, few will have the means to afford nongroup coverage.  We also excluded current uninsured people who are in a household of a full-time worker who either has or is offered employer-based insurance.  As noted above, these people would be ineligible for premium tax credits, so we assume that they would choose employer-based coverage rather than nongroup coverage if they choose to become insured.4 

This calculation leaves about 29 million people nationally who might look to the new marketplaces.  The largest potential markets are in the states with the largest tax-credit eligible population: California, Texas, and Florida.  Six states have a potential market of more than 1 million people, and another 12 have a potential market of more than 500,000 people.

Discussion

The Congressional Budget Office (CBO) projects that 7 million people will enroll in health insurance exchanges in 2014, including 6 million who will be receiving tax credits to subsidize their premiums. Based on our analysis above, these enrollment levels would mean that 25% of potential exchange enrollees would choose to participate in year one of the ACA, with a slightly higher proportion of people eligible for tax credits (35%) buying coverage in an exchange.

From the perspective of delivering assistance to people eligible for it, enrollment in exchanges is a key measure, since tax credits are only available to those who buy coverage on their own in an exchange. It often takes time for enrollment in a new program to ramp up, and consistent with this view, CBO projects the number of people receiving tax credits in exchanges to triple by 2016.

The take-up of tax credits may vary significantly across states, for a variety of reasons. In the early stages of open enrollment, it’s clear that the enrollment process is working more smoothly in some state-based exchanges than in others, and the difficulties with the federal marketplace have been widely reported. In addition, significantly greater outreach and consumer assistance resources are available in state-based exchanges due to the availability of federal grants under the ACA and limited budget for implementation of the federal marketplace. Our estimates of the number of people eligible for tax credits by state can serve as a barometer for tracking the success of enrollment efforts.

The overall enrollment in Marketplace coverage is likely to be a metric that is watched closely. While it is not, in fact, the most relevant measure for assessing the stability of the individual insurance market, it may provide some signals as to the health of the market and where premiums may be heading in 2015.

More important than how many enroll is who enrolls – Are they disproportionately younger and healthier or older and sicker? And, it is the composition of the entire individual market that is important, not just who enrolls in exchanges. That is because insurers are required to set premiums for individual insurance market coverage across all plans they offer, inside and outside of exchanges. Also, the risk adjustment system – which will redistribute money from plans that serve disproportionately healthy enrollees to those that enroll a disproportionately sick population – applies to plans inside and outside exchanges as well.

However, the likelihood of getting a balanced mix of enrollees in the individual market is related to the total number of new signups. It is expected that people who have a pre-existing condition and have been excluded from the individual insurance market previously will likely be among the early entrants. In addition, many people in state-based high risk pools will likely switch over to the individual market as well. Therefore, low enrollment levels may indicate a disproportionately sick risk pool, while higher enrollment levels may suggest a more balanced pool. And, it is likely that many new entrants to the individual market will enter through Marketplaces, so the number and composition of Marketplace enrollment may be suggestive of how the market is doing overall. Because insurance pools operate at the state level, the composition of enrollment state-by-state will be what drives the stability of insurance markets. Enrolling a large number of young and healthy people in California, for example, would not offset low take-up in Texas.

Methods

The analysis uses pooled data from the 2012 and 2013 Current Population Survey (CPS) Annual Social and Economic Supplement (ASEC). The CPS ASEC provides socioeconomic and demographic information that can be used for national and state estimates.

Estimating eligibility for Medicaid, CHIP and premium tax credits for marketplace coverage requires grouping individuals together in different ways to determine their income under the different program rules. Our approach is described here.  We analyzed people without coverage or with nongroup coverage to determine their potential eligibility for premium-tax-credits and as potential marketplace participants. The first step was to remove adults and children with incomes below Medicaid and CHIP eligibility levels in their state.5  We also removed people who are not legal residents from the pool of potential eligibles. The ASEC does not ask about legal status of non-citizens, so we imputed documentation status as described here. Programming code to create the households and to perform the immigration status imputation is available upon request.

Premium tax credits. We analyzed the sample of remaining uninsured and nongroup people to determine eligibility for premium tax credits based on the income for their tax household and the premiums in the state where they lived. More than 40 percent of the unweighted records in the 2012-2013 CPS have a county identified — so a second lowest silver plan premium for that county was directly merged on to these records.  Other records were assigned a premium based on the within-state average premium for all undisclosed counties, weighted by the Census Bureau’s 2010 Small Area Health Insurance Estimates (SAHIE) of the uninsured population of those counties.  Premiums were adjusted for age based on the age-rating curve in each state.  We assumed that all eligible members of a tax household would enroll in nongroup coverage and calculated their premium as a percent of household income.  This premium percentage was compared to the maximum percentages in the ACA that families in the tax credit range (100 to 400 percent of poverty) must pay toward the cost of the second-lowest cost silver plan where they live. People in families with incomes between 100 and 400 percent of poverty and whose household premium exceeded the maximum ACA percentage were identified as potentially tax credit eligible, subject to one additional adjustment described below.

As a final step, we reduced the number of people eligible for premium tax credits to reflect offers of employer-sponsored coverage.  Under the law, people offered employer-sponsored coverage that meets minimum standards are not eligible to receive premium tax credits, even if they purchase nongroup coverage in a marketplace. The ASEC does not ask whether respondents were offered coverage at work, so we derived offer rates using data from Wave 6 of the 2008 Survey of Income and Program Participation (SIPP).  Wave 6 asks respondents if they were offered health insurance at their main job. We assume that people who live with a spouse or parent that has coverage or an offer of coverage through a job also was offered coverage.  We calculated offer rates for people without insurance and with nongroup insurance, stratified by age and income.  We applied these percentages to the ASEC sample to reduce each state’s count of uninsured and current nongroup individuals potentially eligible for premium tax credits.

Potential Market. As with our estimates for tax-credit eligibles, the estimate for the number of people who might look for coverage in Marketplaces starts with people legally residing in the United States who are uninsured or have nongroup coverage and have incomes above Medicaid and CHIP eligibility levels. We retain all remaining nongroup purchasers, even those with low incomes, as potential Marketplace purchasers because they are purchasing nongroup coverage now. Among the current uninsured, we excluded two groups from potential purchasers. The first group is people with access to employer-based coverage.  As discussed above, we assume that these people would choose coverage through a job rather than nongroup coverage if they want to get insurance. We used information from Wave 6 in SIPP, as described above, to remove them from the number of potential marketplace purchasers. Excluding currently uninsured people with access to employer-sponsored insurance reduces the number of potential purchasers by a little over five million people. The second group we excluded was uninsured people with incomes below poverty, referred to as the gap group. These uninsured adults live in states that elected not to adopt the ACA Medicaid expansion, and are not eligible for financial assistance to help them get coverage in exchanges. We assume that few would have sufficient resources to purchase nongroup coverage. Excluding this gap group reduces the number of potential purchasers by about 4.8 million people.

The issue brief was prepared by Gary Claxton, Larry Levitt, Anthony Damico, Rachel Garfield, Nirmita Panchal, Cynthia Cox and Matthew Rae.

Tables

TABLE 1
Estimated Number of Tax-Credit-Eligible Individuals and Potential Market for Marketplace Coverage, By State
Number of Tax Credit Eligible ResidentsPotential Market Size
National17,187,00028,605,000
Alabama270,000464,000
Alaska55,00078,000
Arizona313,000551,000
Arkansas150,000227,000
California1,903,0003,291,000
Colorado254,000501,000
Connecticut109,000216,000
Delaware29,00048,000
District of Columbia9,00036,000
Florida1,587,0002,545,000
Georgia654,0001,063,000
Hawaii29,00058,000
Idaho130,000202,000
Illinois501,000937,000
Indiana354,000525,000
Iowa127,000262,000
Kansas161,000298,000
Kentucky192,000302,000
Louisiana344,000489,000
Maine77,000122,000
Maryland201,000419,000
Massachusetts118,000259,000
Michigan436,000725,000
Minnesota90,000298,000
Mississippi204,000298,000
Missouri386,000657,000
Montana97,000152,000
Nebraska122,000239,000
Nevada155,000249,000
New Hampshire81,000137,000
New Jersey400,000628,000
New Mexico118,000193,000
New York779,0001,264,000
North Carolina684,0001,073,000
North Dakota43,00077,000
Ohio544,000812,000
Oklahoma256,000446,000
Oregon187,000337,000
Pennsylvania715,0001,276,000
Rhode Island40,00070,000
South Carolina336,000491,000
South Dakota70,000118,000
Tennessee387,000645,000
Texas2,049,0003,143,000
Utah206,000331,000
Vermont27,00045,000
Virginia518,000823,000
Washington272,000507,000
West Virginia71,000117,000
Wisconsin301,000482,000
Wyoming47,00080,000

Source: KFF analysis of March 2012 and 2013 CPS. See Methods for more details.

Endnotes

  1. http://cbo.gov/sites/default/files/cbofiles/attachments/44190_EffectsAffordableCareActHealthInsuranceCoverage_2.pdf ↩︎
  2. Recent legally residing immigrants with incomes below the poverty line are treated as if their income were at the poverty line, making them eligible for premium tax credits. ↩︎
  3. Health plans sold in the individual market in a state all have essentially the same benefits.  Plans are organized into five tiers based on the amount of cost sharing (e.g., deductibles, copayments, coinsurance) they have.  The five tiers are catastrophic, bronze, silver, gold and platinum. For more information, see https://modern.kff.org/wp-content/uploads/2013/01/8303.pdf. ↩︎
  4. We did not remove current nongroup purchasers with an offer of employer-based coverage from the potential market total.  These people have already made the decision not to take employer-provided coverage and to purchase nongroup coverage. ↩︎
  5. Because some states have chosen to take the optional Medicaid expansion under the ACA and others have not, people with incomes from 100 to 138 percent of poverty will have different forms of financial assistance dependent on the stateu2019s decision. These people will be eligible for Medicaid in states taking the expansion but will potentially eligible for premium tax credits in states not expanding Medicaid. ↩︎
News Release

New Web Portal Explains The Affordable Care Act – “Obamacare”- For People With HIV

Published: Nov 4, 2013

MENLO PARK, Calif., Nov. 4, 2013—The Kaiser Family Foundation has produced a new consumer web portal to help people living with HIV navigate the Affordable Care Act (ACA). Specifically designed to address the needs of people with HIV, the Obamacare & You portal, funded by Gilead Sciences, Inc., is presented as part of Greater Than AIDS, a leading national public information initiative developed by the Kaiser Family Foundation together with the Black AIDS Institute.

It is estimated that about one in four people with HIV in care in the U.S. are currently uninsured and many more are underinsured. People with HIV could be among those who make the greatest gains in coverage from the ACA, and the portal was developed to help navigate the new healthcare environment.

Features of the Greater Than AIDS Obamacare and You portal include:

  • A “Find Your Story” feature that explains how someone with HIV may be affected by the ACA based on their current insurance situation;
  • A Frequently Asked Questions (FAQs) section that provides answers to more than fifty questions about the ACA as it affects people living with HIV, such as “Can I be denied health insurance because I have HIV?” and “If I receive services from the Ryan White HIV/AIDS Program or AIDS Drug Assistance Program (ADAP), do I still need insurance?”;
  • State-specific information for all 50 states and the District of Columbia on health insurance marketplaces (including a list of available plans and information about financial assistance), Medicaid coverage options, Ryan White HIV/AIDS and AIDS Drug Assistance Programs, and other relevant HIV resources;
  • A guide to the essential health benefits provided under the ACA with detail about relevance to people with HIV;
  • A downloadable worksheet to help people applying for coverage gather relevant information necessary to enroll and make plan choices that best suit their HIV care needs;
  • Other tools, including links to the Foundation’s animated video explaining how to get ready for Obamacare and its health reform subsidy calculator.

“Our new Obamacare & You web portal for people with HIV is part of a growing body of resources the Foundation is developing to help Americans understand the ACA and their choices under the law,” said Kaiser Family Foundation President & CEO Drew Altman. “It is especially important that people with HIV understand how potential changes in health insurance will affect their coverage status and access to care and medications that are vitally important to their health and continuing prevention efforts.”

Among the aspects of the ACA that have particular relevance for people with HIV seeking coverage in the private insurance market are reforms that preclude insurance companies from using pre-existing conditions as a cause for denying coverage. The removal of spending limits—both annual and lifetime—also have bearing given the high cost of ongoing HIV care. In addition, since HIV rates are disproportionately higher among those with lower incomes, it is also expected that many people living with HIV will seek coverage in expanded Medicaid programs in those states that opt to do so.

The Obamacare & You consumer web portal is part of the Foundation’s ongoing effort to help consumers understand the ACA and their choices under the law. The content is the sole product and responsibility of the Kaiser Family Foundation. Gilead Sciences, Inc. provided funding for its development. More of the Foundation’s consumer resources on the ACA can be found on www.kff.org/aca-consumer-resources/.

The Foundation also produces fact sheets and analyses on the topic of HIV/AIDS, including materials on how the ACA affects people living with HIV. This information is available at www.kff.org/hivaids/.

More information on Greater Than AIDS is available at www.greaterthan.org.

About the Kaiser Family Foundation

The Kaiser Family Foundation, a leader in health policy analysis, health journalism and communication, is dedicated to filling the need for trusted, independent information on the major health issues facing our nation and its people. The Foundation is a non-profit private operating foundation, based in Menlo Park, California.

About Greater Than AIDS

Greater Than AIDS is a leading national public information response focused on the U.S. domestic epidemic. Launched in 2009, it is supported by a broad coalition of public and private sector partners, including: major media and other business leaders; Federal, state and local health agencies and departments; national leadership groups; AIDS service and other community organizations; and foundations, among others.

Through targeted media messages and community outreach, Greater Than AIDS works to increase knowledge, reduce stigma and promote actions to stem the spread of the disease. While national in scope, Greater Than AIDS focuses on communities most affected.

The Kaiser Family Foundation (provides strategic direction and day-to-day management, as well as oversees the production of the campaigns. The Black AIDS Institute – a think tank exclusively focused on AIDS in Black America – provides leadership and expert guidance and supports community engagement. Additional financial and substantive support is provided by the Elton John AIDS Foundation, Ford Foundation and MAC AIDS, among others.

About Gilead Sciences, Inc.

Gilead Sciences, Inc. is a biopharmaceutical company that discovers, develops and commercializes innovative therapeutics in areas of unmet medical need. The company’s mission is to advance the care of patients suffering from life-threatening diseases worldwide. Headquartered in Foster City, California, Gilead has operations in North and South America, Europe and Asia Pacific.

Implications of the Affordable Care Act for People With HIV Infection and the Ryan White HIV/AIDS Program: What Does the Future Hold?

Author: Jennifer Kates
Published: Nov 1, 2013

There are numerous aspects of the Affordable Care Act that will be important for people with HIV in the U.S., including consumer protections and private insurance reforms, establishment of health care marketplaces in every state, new benefit standards, Medicare fixes, prevention enhancements, expansion of Medicaid, and health system improvements. However, it is unlikely that these changes will address all the needs of people with HIV. The Ryan White HIV/AIDS Program will thus remain crucial for the provision of adequate health care to HIV-infected individuals, but it will need to change. Changes in the Ryan White Program’s role will depend largely on state decisions on Medicaid expansion and health care marketplaces. This article, published in the September/October issue of Topics in Antiviral Medicine, summarizes a presentation by Jennifer Kates of the Kaiser Family Foundation at the IAS–USA continuing education program held in New York, New York, in April 2013.

Article

Poll Finding

Kaiser Health Tracking Poll: October 2013

Published: Nov 1, 2013

The latest Kaiser Health Tracking Poll, conducted October 17-23,  finds that the public reported paying more attention this month to the political fights over the government shutdown and raising the debt ceiling than technical problems with the opening of the online federal health insurance exchange created by the Affordable Care Act (ACA). As the rollout of the law and website problems made headlines, most Americans give the federal government fair or poor ratings when it comes to implementing the law, while ratings of their own state governments are only slightly better. Despite all this, public opinion on the law holds steady in this month’s tracking poll (44 percent unfavorable versus 38 percent favorable). A majority continues to oppose defunding the ACA, and more want Congress to expand it or keep the law as is rather than repeal it. As enrollment outreach efforts continue to ramp up, visibility of ACA-related advertising increased this month, particularly for ads providing information about how to get coverage under the law, and for the first time in Kaiser tracking the share saying they saw ads providing information about coverage is nearly equal to the share saying they saw ads for and against the law. This month, the share of the public who feel they have enough information about the law to understand how it will impact their family edged up by 8 percentage points to 55 percent, though over half of the uninsured continue to say they don’t have enough information.

More Attention to Government Shutdown and Debt Ceiling Fight Than ACA Website Glitches

The ACA has made its share of headlines in October, both for its role as a political football in the budget debate in Washington and for technical problems with the opening of the online health insurance marketplaces. The latest Kaiser Health Tracking Poll (which was in the field immediately after the end of the partial government shutdown) finds that the public reports paying more attention to the former rather than the latter. More than four in ten (44 percent) say they have followed the fight over the federal government shutdown and raising the debt ceiling “very closely,” while half that many (22 percent) say they’ve paid close attention to news about the website problems with the insurance exchanges.

Figure 1

Public Gives Federal Government Poor Ratings for ACA Implementation

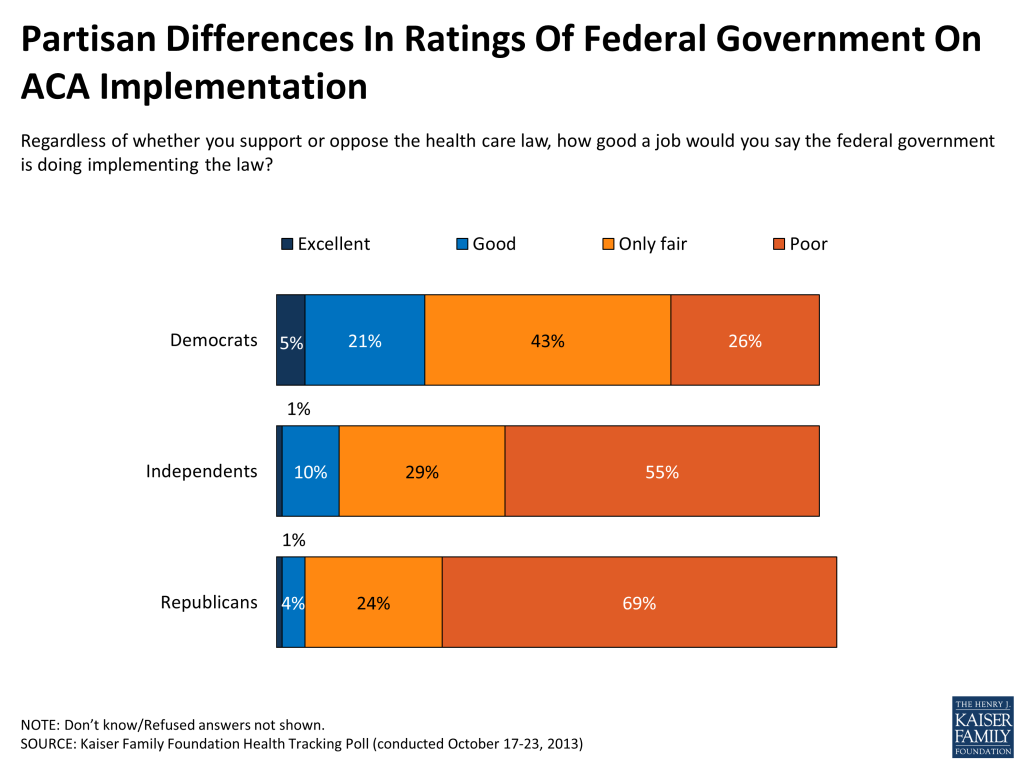
This relatively lower level of attention to the website “glitches” doesn’t mean the public hasn’t picked up on the fact that the ACA has had a rocky roll-out so far. Nearly half (48 percent) say the federal government is doing a “poor” job implementing the law, a share that rises to six in ten among those who followed news of the website problems very closely. State governments receive slightly higher ratings from the public, but still the majority rate their state’s handling of implementation as fair (34 percent) or poor (29 percent).

Figure 2

The law continues to be viewed through a partisan lens, and Republicans give even lower ratings to the federal government when it comes to implementing the law. Still, even among Democrats, majorities feel the federal government is doing “only fair” or “poor” when it comes to implementation. Ratings of state governments in this area are similar across parties.

Figure 3

Despite This, Overall Public Opinion Holds Steady

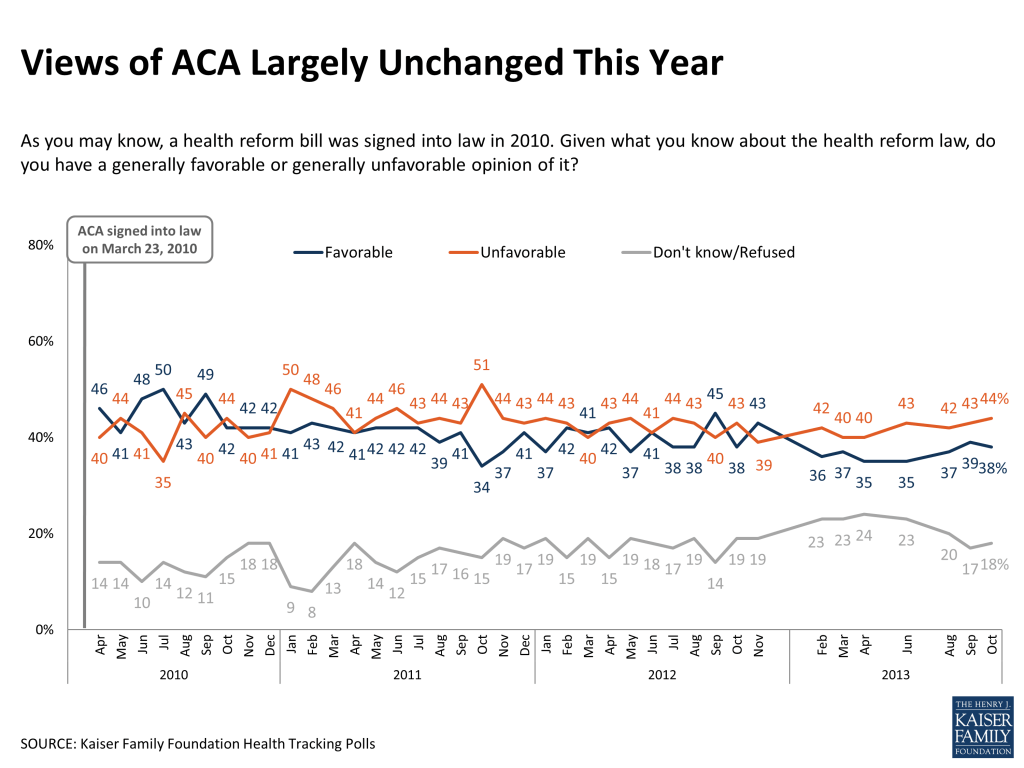
Despite the heavy news coverage and poor ratings for government implementation of the law, the October poll finds that the public’s overall views of the ACA have held relatively steady since last month, with 44 percent saying they have an unfavorable view of the law, 38 percent  a favorable view, and 18 percent saying they don’t know enough to say. Similar to last month, 8 percent of the public say they have an unfavorable view of the law, but they think it’s time for opponents to accept that it’s the law of the land and move on to other things. Partisan differences are as deep as ever, with seven in ten Democrats having a favorable view of the law and nearly eight in ten Republicans expressing the opposite view.

Figure 4

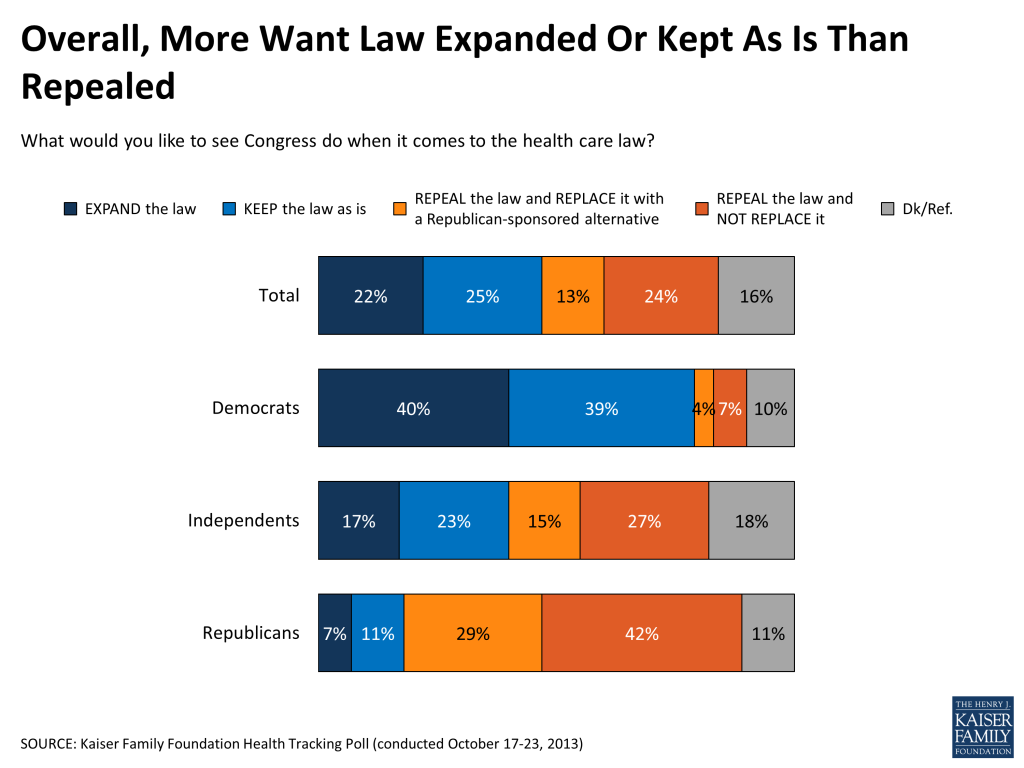
A solid majority of the public (60 percent) say they oppose the idea of cutting off funding as a way to stop the law from being implemented, and a higher share would like to see Congress expand the law or keep it as is (47 percent) rather than repeal it (37 percent). Partisan divisions are as deep as ever, with four in ten Democrats saying the want Congress to expand the law, and a similar share of Republicans (42 percent) wanting to see the law repealed and not replaced.

Figure 5

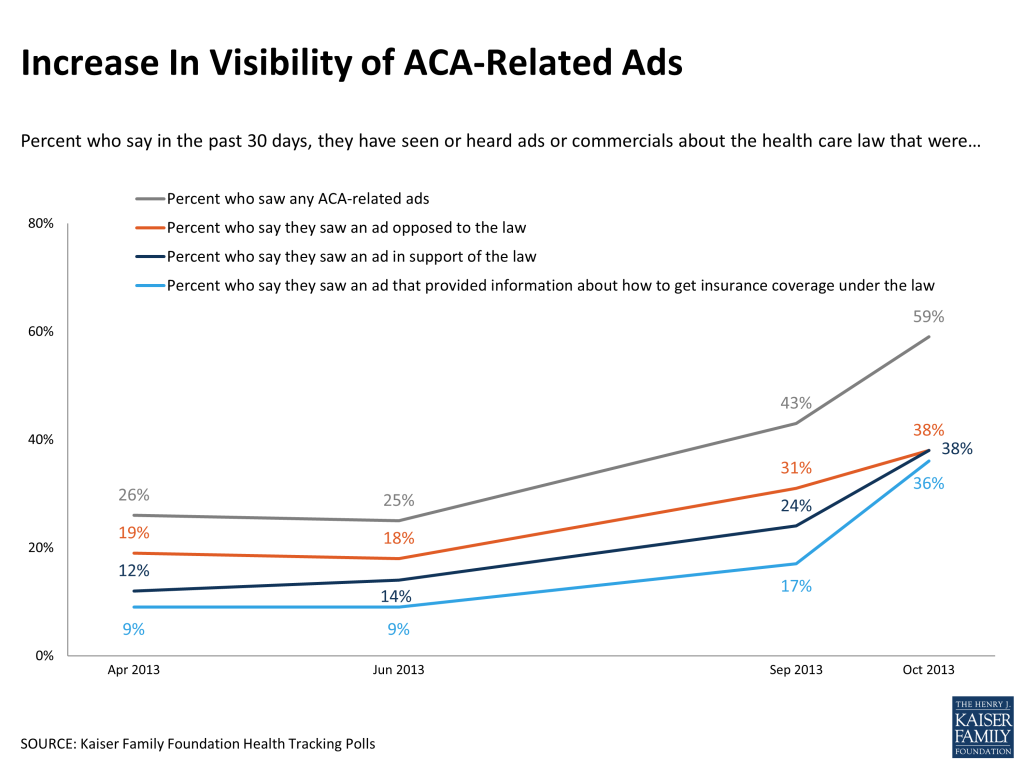
As enrollment outreach efforts continue to ramp up across the country, there was a large increase over the last month in the share of the public that report seeing ACA-related advertisements, particularly those that provide information about how to get insurance coverage. In October, 59 percent say they saw some type of ad or commercial about the health care law in the past 30 days, up from 43 percent in September. This includes 36 percent who say they saw ads that provided information about how to get coverage, more than double the share who said so last month (17 percent). For the first time in Kaiser tracking, the share saying they saw ads providing information about coverage is nearly equal to the share saying they saw ads for and against the law (38 percent each).

Figure 6

Among the uninsured, a key target group for enrollment outreach, the share saying they saw ads that provided information about how to get coverage under the law also increased, from 18 percent in September to 31 percent in October. Still, the survey shows that targeted outreach efforts to the uninsured are just beginning. This month, 2 percent of the uninsured say they have personally been contacted by anyone about the health care law through a phone call, email, text message, or door-to-door visit.

Share Who Feel They Have Enough Information Ticks Up This Month

Perhaps related to the increase in visibility of advertising, the share of the public that feels they have enough information about the law to understand how it will impact their own family edged up this month to 55 percent (up 8 percentage points since last month). Still, this leaves a large share – 44 percent – saying they don’t have enough information to understand the law’s impact. Among the uninsured, lack of information is even higher, with 55 percent saying they don’t have enough information and 42 percent feeling they do. This group also reports feeling somewhat more informed than last month, when two-thirds of the uninsured (67 percent) felt they lacked adequate information.

But Most Continue to Say They’ve Felt No Personal Impact So Far

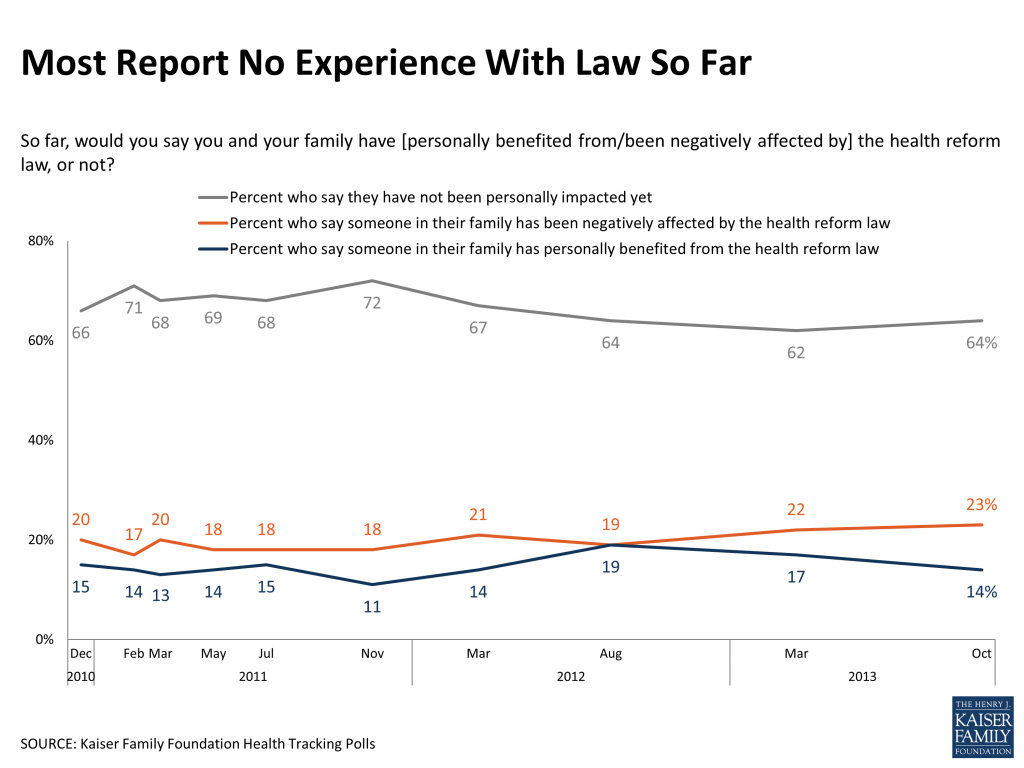
Most of the public (64 percent) continues to say that they haven’t been personally impacted by the health care law so far, though the share saying they’ve been negatively impacted is somewhat higher than the share who feel they’ve personally benefited (23 percent versus 14 percent). The most commonly reported positive impacts are expanded access to insurance, extension of dependent coverage, and lower costs, while the most commonly reported negative impact is increased costs, followed far behind by impacts on one’s job or business and changes to insurance benefits.

Figure 7

This Kaiser Health Tracking Poll was designed and analyzed by public opinion researchers at the Kaiser Family Foundation (KFF) led by Mollyann Brodie, Ph.D., including Liz Hamel, Claudia Deane, and Sarah Cho. The survey was conducted October 17-23, 2013, among a nationally representative random digit dial telephone sample of 1,513 adults ages 18 and older, living in the United States, including Alaska and Hawaii (note: persons without a telephone could not be included in the random selection process). Computer-assisted telephone interviews conducted by landline (755) and cell phone (758, including 430 who had no landline telephone) were carried out in English and Spanish by Princeton Data Source under the direction of Princeton Survey Research Associates International (PSRAI). Both the random digit dial landline and cell phone samples were provided by Survey Sampling International, LLC. For the landline sample, respondents were selected by asking for the youngest adult male or female currently at home based on a random rotation. If no one of that gender was available, interviewers asked to speak with the youngest adult of the opposite gender. For the cell phone sample, interviews were conducted with the person who answered the phone. KFF paid for all costs associated with the survey.

The combined landline and cell phone sample was weighted to balance the sample demographics to match estimates for the national population using data from the Census Bureau’s 2011 American Community Survey (ACS) on sex, age, education, race, Hispanic origin, nativity (for Hispanics only), and region along with data from the 2010 Census on population density. The sample was also weighted to match current patterns of telephone use using data from the July-December 2012 National Health Interview Survey. The weight takes into account the fact that respondents with both a landline and cell phone have a higher probability of selection in the combined sample and also adjusts for the household size for the landline sample. All statistical tests of significance account for the effect of weighting.

The margin of sampling error including the design effect for the full sample is plus or minus 3 percentage points. Numbers of respondents and margin of sampling error for key subgroups are shown in the table below. For results based on other subgroups, the margin of sampling error may be higher. Sample sizes and margin of sampling errors for other subgroups are available by request. Note that sampling error is only one of many potential sources of error in this or any other public opinion poll.

GroupN (unweighted)M.O.S.E.
Total1,513+/-3 percentage points
Uninsured, under age 65185+/-8 percentage points
Democrats437+/-5 percentage points
Republicans330+/-6 percentage points
Independents548+/-5 percentage points

State Marketplace Profiles: New Mexico

Published: Oct 30, 2013
New Mexico

Final update made on October 25, 2013 (no further updates will be made)

Establishing the Marketplace

On March 28, 2013, Governor Susana Martinez (R) signed legislation creating the New Mexico Health Insurance Exchange (NMHIX). Governor Martinez had vetoed previous legislation that would have established a Marketplacein 2011; however, the state had moved forward with a plan to create the New Mexico Health Insurance Exchange within the New Mexico Health Insurance Alliance.1  The Alliance was created in 1994 to provide small employer groups and qualifying individuals with access to health insurance.2  The new legislation creates a Board of Directors for the Marketplace,  requires the establishment of strong conflict of interest policies, and allows the creation of a Native American Service Center to help with outreach to Native American populations.3 ,4  The Board of Directors of the Marketplace will also oversee the Alliance until all the individuals and employers currently receiving coverage through the Alliance, along with enrollees in the New Mexico medical insurance pool, the state’s high risk pool, are transitioned into the Marketplace. On October 1, 2013, NMHIX launched its consumer-facing web portal, “Be Well New Mexico.” The website is available in English and Spanish. New Mexico is running its Small Business Health Options Program (SHOP) Marketplace, but will work with the federal government to run the individual Marketplace until October 2014. Under this arrangement, the state will maintain plan management and consumer assistance functions, while the federal government will operate the IT system.

Prior to enactment of Marketplace authorizing legislation, a 15-member Health Insurance Exchange Advisory Task Force was created by the Human Services Department to advise the state regarding development of a Marketplace. The Task Force consisted of eight workgroups focused on specific topics: Essential Health Benefits; outreach, education, adoption, and enrollment; legislation; market regulation; Native Americans; program integration; financial sustainability; and employer participation.5  Based in part on the insight collected by these workgroups, the Task Force released final recommendations on April 9, 2013.6 

Structure: ExchangeBe Well New Mexico is a quasi-governmental organization, specifically a non-profit public corporation.

Governance: ExchangeBe Well New Mexico is governed by a Board of Directors consisting of thirteen voting members. These members include: the state Superintendent of Insurance; six members appointed by the Governor, including the Secretary of Human Services, a health insurance issuer, and a consumer advocate; and six members appointed by the state Legislature, including one health care provider and one health insurance issuer.7 

In April 2013 the board members were selected and include:8 

  • Dr. James R. Damron (Chair), University of New Mexico School of Medicine
  • Jason Sandel (Vice Chair), New Mexico Medical Insurance Pool
  • Terriane Everhart, Property Consultants
  • John Franchini, New Mexico Superintendent of Insurance
  • Teresa Gomez, Futures for Children
  • Dr. Martin Hickey, New Mexico Health Connections
  • Dr. Larry Leaming, Roosevelt General Hospital
  • Gabriel Parra, Presbyterian Healthcare Services
  • Patsy Romero, Easter Seals El Mirador
  • David Shaw, Nor-Lea General Hospital
  • Ben Slocum, Lovelace Health Plan
  • Sidonie Squier, Secretary, New Mexico Human Services Department
  • Dr. J. Deane Waldman, University of New Mexico Health Sciences Center

The board named Mike Nunez, Executive Director of the New Mexico Health Insurance Alliance, to be the interim CEO of Be Well New Mexico at least through the first quarter of 2014, when the board hopes to hire a long-term CEO.

Contracting with Plans: The New Mexico Division of Insurance (DOI) has the regulatory responsibility for licensing Qualified Health Plan (QHP) issuers and reviewing and approving QHP policies. On April 15, 2013, DOI released its submission guidelines for qualified health plans (QHPs).9   Carriers are required to offer Silver and Gold levels of coverage, and must offer at least one statewide plan at each metal level for which the carrier submits a plan. (For example, if Carrier A has submitted a plan available at all the metal levels, then it needs to provide at least one statewide plan at all the metal levels. If Carrier A has only submitted plans at the Silver and Gold levels, then it only needs to provide statewide plans at the Silver and Gold Levels.) A carrier must offer three silver plan variations for each silver QHP to reflect the cost-sharing subsidies, and one zero cost sharing plan variation and one limited cost sharing plan variation for each metal level QHP. Benefits, networks, non-essential health benefits (EHB) cost sharing, and premiums must be the same across the silver plan variations. Carriers can offer plans in either the individual Marketplace or SHOP, and will not be required to offer the same plan in both Marketplaces. Plans that do not participate in the Marketplace initially will not be able to participate until the 2016 plan year.10 

Be Well New Mexico will use geographic and tobacco rating. It is defining the number of geographic rating areas in New Mexico as four Metropolitan Service Areas (MSAs) plus one. The cap on a maximum differential between the highest and lowest rated area is 40%. The maximum ratio for tobacco rating will be 1:1.5.

Health insurance rates for individuals have now been approved and plan summaries and premiums can be viewed online.11  Five insurers are participating in the Marketplace statewide.

In addition to ACA requirements, carriers offering QHPs will be required to report New Mexico-specific quality information to Be Well New Mexico and DOI. Quality reporting will not be required for dental carriers; however dental-specific quality measures may be created by DOI for future plan years.12 

Dental and Vision Benefits: DOI will allow either embedded pediatric dental benefits at a minimum actuarial value level of 70% or the health plan can opt out of embedding.  DOI has adopted the reasonable limit of annual cost sharing for stand-alone pediatric dental plans to be at or below $700 for a single child enrollee plan, and $1400 for two or more children enrolled in a plan. Plans sold through the SHOP Marketplace are not required to embed pediatric dental benefits, but stand-alone pediatric policies will be available on the SHOP Marketplace.13 

Risk adjustment, Reinsurance, and Risk corridors: Governor Martinez stated in her letter to Secretary Sebelius that New Mexico intends to administer a risk adjustment and reinsurance program during the first year of the Marketplace, but noted that the State would not be able to come to a final determination until it has an opportunity to examine the federal risk adjustment methodology.  Governor Martinez also noted New Mexico’s intention to use the federal service for Advance Premium Tax Credit/Cost-Sharing Reduction eligibility determinations.14 

Consumer Assistance and Outreach: On July 9, 2013 the New Mexico Human Services Department received a Level One Establishment grant of $18.6 million. This award will be used to support comprehensive outreach, education, and marketing activities, as well as the state’s “Healthcare Guide” program (Navigators and In-person Assisters). The state will partner with nonprofit organizations, counties, schools and universities, faith communities, providers, and business organizations to provide extensive outreach at local events.  The State will also provide targeted outreach and education to tribal sovereign Nations at health fairs and events, and create an educational website and hotlinks for Native Americans.15 

On June 18, 2013, Be Well New Mexico issued an RFP for advertising and marketing assistance, educational content, and public relations services, to be funded by the state’s Level One grant award. In August, the Marketplace awarded a $6-$7 million contract,16  and on September 17th launched its “Be Well New Mexico” marketing and outreach campaign. The campaign features radio, print and TV ads, billboards, a website and social media. It also features an original “Be Well New Mexico” song, performed by six Albuquerque-area musicians. However, due to issues that individuals have faced with using healthcare.gov, Be Well New Mexico decided to postpone its advertising campaign, including television commercials and other paid advertising, until the federal website is working better and it is easier for individuals to enroll.17 

On June 28, 2013 Be Well New Mexico released a Request for Information (RFI) for “Healthcare Guides,” which is how the Marketplace will refer to Navigators and Assisters.18  The Marketplace is contracting with two umbrella entities to develop Navigator/Assister programs and implement comprehensive outreach, education, and enrollment strategies. In August, the Marketplace selected these two umbrella entities: New Mexico Primary Care Association and Native American Professional Parenting Resources. These umbrella entities have subcontracted with community organizations throughout the state to provide Healthcare Guide services. Individual Healthcare Guides must complete a training and certification program, as well as a criminal background check. Healthcare Guides will deliver education, outreach, and in-person assistance to result in enrollment in the Marketplace, and connect customers to the Customer Service Center, Be Well New Mexico website, or certified and licensed brokers if additional support is needed. Targeted Native American assistance programs will also be developed to serve New Mexico’s Native American population.19 

Be Well New Mexico is using the federal call center for its individual Marketplace and creating its own call center for the SHOP Marketplace. There is one phone number that all customers can call to receive assistance (1-855-99-NMHIX). That call center will connect customers to either: 1) the state Medicaid program’s call center for Medicaid-related calls; 2) contracted Healthcare Guide entities and/or certified Healthcare Guides; 3) the federal call center for customers seeking health insurance on the individual market; 4) New Mexico’s SHOP Marketplace; or 5) referrals to agents and brokers as requested.

Agents and brokers who wish to sell Marketplace products will be required to meet licensing requirements and take additional training on Be Well New Mexico protocols. They will be required to register with the Marketplace, receive training on QHP options and other publicly subsidized insurance programs and comply with Marketplace privacy and security standards. Web brokers will be delayed until the 2015 operational year.20 

Small Business Health Options Program (SHOP) Marketplace: In New Mexico’s SHOP Marketplace, employers must cover a minimum of 50% of their employees’ health care costs. If a business has less than 25 full-time employees, offers coverage to all full-time employees, has an average annual salary for all employees of less than $50,000, and contributes at least 50% of premium costs for employee plans, the business may be eligible to receive a tax credit. Employers select a health plan metal level (bronze, silver, gold, or platinum) to offer employees, and select a reference plan on which to base their contribution for each employee. Employees can select any plan within the metal level offered by their employer, although they may have to pay more or less, based on the plan they choose compared to the reference plan.21 

Financing: The Exchange Advisory Task Force made several recommendations related to the financing of the Marketplace.  It recommended that an assessment be placed on insurers both inside and outside of the Marketplace to remove the potential disincentive for Marketplace participation, and that an assessment be placed on self-insured plans to contribute to financing the Marketplace’s administrative costs. In addition, the Task Force recommended that if/when the High Risk Pool and the Health Insurance Alliance are absorbed into the Marketplace, the assessments currently placed on plans for their administrative support be transferred to support the Marketplace.22 

Basic Health Program (BHP): New Mexico has explored establishing an optional coverage program available through the Affordable Care Act (ACA) which allows states to use federal funding to offer subsidized health insurance to adults with incomes between 139 and 200% of the federal poverty level (FPL) who would otherwise be eligible to purchase subsidized coverage through a Marketplace. The state selected a subcontractor to create a health care reform fiscal model, which includes the estimated impact of a BHP.23  In its final recommendations, the Advisory Task Force recommended that the BHP continue to be studied as the Marketplace moves forward. Workgroup members believe the BHP is necessary to mitigate the effects of churn and avoid possible loss of coverage.24 

Essential Health Benefits (EHB): The ACA requires that all non-grandfathered individual and small-group plans sold in a state, including those offered through the Marketplace, cover certain defined health benefits.  On October 17, 2012, the Public Regulation Commission’s Insurance Division recommended that New Mexico’s EHB benchmark be the Lovelace Classic Preferred Provider Organization, a small group plan.25 

Marketplace Funding

The New Mexico Department of Human Services received a federal Exchange Planning grant of $1 million in 2010.  The Office of Health Care Reform requested and was granted a 12-month budget extension on the Planning grant funds for a new project end date of September 29, 2012.26  On November 29, 2011, the New Mexico Human Services Department received a federal Level One Establishment grant of almost $35 million.27  The grant funding will be used to refine the vision and objectives of the Marketplace, continue stakeholder engagement, develop a multi-year business and operational plan, and examine the information technology infrastructure and functionality necessary to operate the Marketplace by 2014. In October 2012, New Mexico requested an extension of the Level One grant. On July 9, 2013 the New Mexico Human Services Department received an additional Level One Establishment grant of $18.6 million. This award will be used to support comprehensive outreach, education, and marketing activities, establishing the state’s Navigator program, and supporting the state’s in-person assistance personnel.28 

In addition, New Mexico, along with nine other states, is receiving technical assistance from the Robert Wood Johnson Foundation through the State Health Reform Assistance Network; this assistance includes help with setting up health insurance Marketplaces, expanding Medicaid to newly eligible populations, streamlining eligibility and enrollment systems, instituting insurance market reforms and using data to drive decisions.29 

Next Steps

On January 3, 2013, New Mexico received conditional approval from the U.S. Department of Health and Human Services (HHS) to establish a state-based Marketplace.30  However, due to time constraints in implementing an IT system, on May 17, the Board of Directors voted to work with the federal government to run the individual Marketplace until October 2014. Under this arrangement, the state will maintain plan management and consumer assistance functions, while the federal government will operate the IT system. The state will also run the SHOP Marketplace.31  32  The Be Well New Mexico Marketplace portal opened on October 1, 2013. The state’s SHOP Marketplace has begun to sign up small businesses to buy coverage and help them select plans for their businesses. Employees will be able to sign up for plans starting November 1. Be Well New Mexico directs individuals to HealthCare.gov, the federal health insurance Marketplace portal to apply for and enroll in coverage.

Additional information about Be Well New Mexico can be found at the state’s back office Marketplace website (NMHIX) and its customer portal (Be Well New Mexico). You can also obtain information from Be Well New Mexico’s Facebook page, Twitter feed, and You Tube site.

  1. New Mexico Level I Health Insurance Exchange Establishment Grant. September 2011.  ↩︎
  2. Title 13, Chapter 10, Part 11. Health Insurance Alliance Plan of Operation and Eligibility.  ↩︎
  3. SB 221. New Mexico Health Insurance Exchange Act.  ↩︎
  4. Governor Susana Martinez Signs Bipartisan Legislation to Establish State-Based Health Insurance Exchange By New Mexicans, For New Mexicans.” State of New Mexico, Office of the Governor. March 28, 2013.  ↩︎
  5. Presentation to the New Mexico Insurance Exchange Advisory Task Force. August 22, 2012.  ↩︎
  6. New Mexico Health Insurance Exchange Advisory Task Force Recommendations. New Mexico Human Services Department. April 9, 2013.  ↩︎
  7. SB 221. New Mexico Health Insurance Exchange Act.  ↩︎
  8. First Board Members Named for New Mexico Health Insurance Exchange. Albuquerque Business First, and Governor Susana Martinez Announces Appointments to the New Mexico Health Insurance Exchange Board. State of New Mexico Office of the Governor. ↩︎
  9. New Mexico Qualified Health Plan Submission Guidelines. 4/15/13.  ↩︎
  10. New Mexico Public Regulation Commission. FAQ about QHP submissions in New Mexico.  ↩︎
  11. New Mexico Health Insurance Rate Review. Individual Exchange Rates↩︎
  12. New Mexico Qualified Health Plan Submission Guidelines. 4/15/13.  ↩︎
  13. New Mexico Public Regulation Commission. FAQ s for Qualified Dental Plan Submission↩︎
  14. Letter from Governor Martinez to Secretary Sebelius. December 13, 2012.  ↩︎
  15. Center for Consumer Information and Insurance Oversight. New Mexico Health Insurance Marketplace Grants Awards List↩︎
  16. NMHIX Board Meeting Minutes, August 7, 2013.  Albuquerque Business First. “Health Insurance Exchange Board Awards PR Contract.”  ↩︎
  17. Albuquerque Journal. NM Health Exchange Advertising is on Hold. Oct. 17, 2013.  ↩︎
  18. New Mexico Health Insurance Exchange. Assister/Navigator (“Healthcare Guides”) Request for Information. June 28, 3013.  ↩︎
  19. New Mexico Health Insurance Exchange. RFI: Assister/Navigator↩︎
  20. New Mexico Health Insurance Exchange. Board Meeting Agenda: June 7, 2013.  ↩︎
  21. New Mexico Health Insurance Exchange: SHOP Employer Management↩︎
  22. New Mexico Health Insurance Exchange Advisory Task Force Recommendations. New Mexico Human Services Department. April 9, 2013.  ↩︎
  23. The Hilltop Institute. “New Mexico Health Care Reform Fiscal Model: Detailed Analysis and Methodology.” March 2012.  ↩︎
  24. New Mexico Health Insurance Exchange Advisory Task Force Recommendations. New Mexico Human Services Department. April 9, 2013.  ↩︎
  25. Press Release by the New Mexico Public Regulation Commission. October 17, 2012.  ↩︎
  26. New Mexico Office of Health Care Reform. 4th Quarterly Report Project Summary for CCIIO. ↩︎
  27. New Mexico Level I Health Insurance Exchange Establishment Grant. September 2011.  ↩︎
  28. Center for Consumer Informaiton and Insurance Oversight. New Mexico Health Insurance Marketplace Grants Awards List↩︎
  29. Robert Wood Johnson Foundation. “RWJF Seeks Coverage of 95 Percent of All Americans by 2020.” May 6, 2011.   ↩︎
  30. Letter from Secretary Sebelius to Governor Martinez. January 3, 2013.  ↩︎
  31. NM Changing its Plans for Health Exchange.” Associated Press.  ↩︎
  32. New Mexico Health Insurance Exchange Board Meeting Minutes. May 17, 2013.  ↩︎

State Marketplace Profiles: West Virginia

Published: Oct 24, 2013
West Virginia

Final update made on October 24, 2013 (no further updates will be made)

Establishing the Marketplace

On February 15, 2013, Governor Earl Ray Tomblin (D) submitted a blueprint to Secretary Sebelius for West Virginia to establish a Partnership Marketplace with plan management responsibilities.1  In the previous year, Governor Tomblin had signed SB 408 into law to establish the West Virginia Health Benefits Exchange and the state had begun exploring implementation options for a state-based marketplace. 2  However, concerns over the sustainability of a state-run marketplace led the Governor to pursue a Partnership Marketplace instead.

Prior to the decision to pursue a Partnership Marketplace, the Health Policy Division within the Office of the Insurance Commissioner (OIC) led the marketplace planning initiative. In January 2012, the OIC released a business plan which documented an approach to implementing the Marketplace.3  In addition, the OIC held a series of public engagement meetings throughout the state and met regularly with stakeholder groups to focus on marketplace implementation issues related to carriers, consumers, producers, and providers.

Contracting with Plans: In April 2013, the West Virginia Offices of the Insurance Commissioner (OIC) released a Qualified Health Plan Submission Guide to provide guidance to health insurance issuers regarding the certification standards for individual and SHOP Qualified Health Plans (QHPs) offered through the Marketplace. Two plans applied and were chosen as QHPs in West Virginia: Highmark Blue Cross Blue Shield and Carelink/Coventry Health Care.4  However, Carelink/Coventry Health Care withdrew from the Marketplace in September 2013, leaving Highmark Blue Cross Blue Shield as the only insurer. Highmark offers eleven plans in the individual Marketplace and four plans in the SHOP. Rates were released through Healthcare.gov.5 

Rates vary based on tobacco use, family composition, age, and geography. West Virginia has established eleven geographic rating areas. Issuers must submit rate information to the Marketplace on an annual basis, and the OIC will review rates for compliance with rating standards.6  Acting as a clearinghouse, OIC will accept plans that meet federal and state certification criteria. The State has partnered with the West Virginia School of Osteopathic Medicine to develop a strategy to maximize and report on provider quality in the Marketplace, such as through measurement and reporting, purchasing, and engaging consumers through better information.

Risk Adjustment, Reinsurance, and Risk Corridors: In 2011, the West Virginia legislature passed HB 2745 to develop an all-payer claims database and the state expects to begin collecting data in 2013.7  This database will provide the baseline information to create a risk adjustment program, as well as to provide outcome quality data and enable analyses of Marketplace policy initiatives. Governor Tomblin noted in his letter of intent to establish a Partnership Marketplace that West Virginia does not intend to operate a reinsurance program in 2014.8 

Consumer Assistance and Outreach:  The federal government will administer the state’s Navigator program, while the West Virginia OIC will oversee an In-Person-Assister (IPA) program.9  Navigator entity applications were due on June 7, 2013 and grantees were notified by the federal government on August 15.10  CMS awarded two organizations approximately $600,000 for the Navigator program in West Virginia.11  However, in September 2013, one of the organizations, West Virginia Parent Training and Information Inc., declined the $365,000 federal grant to be a navigator organization after receiving an inquiry from the State Attorney General.12  WVPTI did not explicitly cite the inquiry, which directed the nonprofit to answer 26 questions about their personnel and hiring practices, as the reason the group declined the grant.

The state selected an In-Person Technical Assistance contractor in July 2013 to help select IPA entities that will operate around the state. 13  IPAs will focus on assisting vulnerable and underserved populations in the individual private and public markets. The state requires that IPAs meet the same training, privacy and security, and conflict of interest standards as outlined in federal guidance on Navigators. The state estimated a need of 270 IPAs during open enrollment, and approximately 30 IPAs during non-peak periods. IPAs are available in 46 of 55 counties and an available list of IPAs in West Virginia is available through the state’s health insurance Marketplace website.14  West Virginia will rely on the federal government for mass marketing and branding of the Marketplace. The IPA vendor may perform some marketing at the local level.15 

Organizations can apply to be Certified Application Counselors through CMS and assist consumers in the application and enrollment process. Additionally, 27 Health Centers have been awarded outreach and enrollment assistance grants from HRSA to assist eligible consumers to enroll in coverage.16  More than 800 local assisters have been trained as of September 30, 2013.17 

Coordination with Medicaid: West Virginia is expanding its Medicaid program to individuals with incomes below 138% of the federal poverty level. Eligibility will be determined through the federal healthcare.gov and those who qualify for Medicaid will be directed to the state Medicaid website.18  West Virginia has sent letters to more than 170,000 people who were signed up for the Supplemental Nutrition Assistance Program (SNAP) and qualified for Medicaid.19  For those who respond to these letters, they will be automatically enrolled in Medicaid in November.

Essential Health Benefits: The ACA requires that all non-grandfathered individual and small-group plans sold in a state, including those offered through the Marketplace, cover certain defined health benefits. Since West Virginia did not put forward a recommendation, the state’s benchmark EHB plan will default to the largest small-group plan in the state, Highmark (Blue Cross Blue Shield of West Virginia) – Super Blue Plus 2000 PPO.

Marketplace Funding

The West Virginia Office of the Insurance Commissioner received a federal Exchange Planning grant of $1 million in September 2010 and a federal Level One Establishment grant of $9.7 million in August 2011. The Establishment grant will be used to study consumer quality and effectiveness, complete economic modeling, and investigate risk adjustment strategies and policy integration with state agencies. In July 2013, West Virginia received a second Level One Establishment grant for $10.2 million to support the IPA program and plan management activities. 20  The state requested and received a No Cost Extension for the Establishment grant, in part due to the delay of the release of an RFP for an actuarial assessment and economic model of the Marketplace.21 

Next Steps

On March 5, 2013, West Virginia received conditional approval from the U.S. Department of Health and Human Services (HHS) to establish a Partnership Marketplace.22  On October 1, West Virginia launched a consumer website that provides information on Navigators and In-person Assisters by county and links to healthcare.gov where consumers can apply for and enroll in coverage.

Additional information about the West Virginia Marketplace can be found at: http://bewv.wvinsurance.gov/ and www.healthcare.gov

  1. State of West Virginia, Offices of the Insurance Commissioner, Health Policy Division. “Blueprint Section 4: Plan Management.”  ↩︎
  2. SB 408/HB 3018 (Chapter 100). West Virginia Health Benefit Exchange Act↩︎
  3. West Virginia, Offices of the Insurance Commissioner, Health Benefits Exchange. “Business Plan, Version 1.2.” January 19, 2012.  ↩︎
  4. Nelson, C. September 11, 2013. “Highmark Now State’s Only Marketplace Option.” Charleston Daily Mail.  ↩︎
  5. Healthcare.gov. Health Plan Information for Individuals and Families↩︎
  6. West Virginia Offices of the Insurance Commissioner. Qualified Health Plan Submission Guide. Aparil 2013.  ↩︎
  7. HB 2745. West Virginia 2011 Legislation.  ↩︎
  8. Letter from Governor Tomblin to Secretary Sebelius, February 15, 2013.  ↩︎
  9. State of West Virginia, Offices of the Insurance Commissioner, Health Policy Division. “Blueprint Section 4: Plan Management.” ↩︎
  10. WV Health Benefit Exchange. Stakeholder Meeting Summary. May 28, 2013.  ↩︎
  11. WV Health Benefit Exchange. Stakeholder Meeting Summary. May 16, 2013.  ↩︎
  12. Eyre, E. “Rockefeller: Morrisey Intimidated Health Group Over ACA.” WV Gazette. September 7, 2013.  ↩︎
  13. WV Health Benefit Exchange. Stakeholder Meeting Summary. July 9, 2013.  ↩︎
  14. West Virginia Health Insurance Marketplace↩︎
  15. WV Health Benefit Exchange. Stakeholder Meeting Summary. May 16, 2013.  ↩︎
  16. HRSA. West Virginia: Health Center Outreach & Enrollment Assistance↩︎
  17. Johnson, S. September 30, 2013. “Health Insurance Marketplace Opens Tuesday.” Metro News.  ↩︎
  18. Medicaid.gov. West Virginia Moving Forward in 2014↩︎
  19. Terrarosa, T. October 17, 2013. “Health Insurance Marketplace Faces Difficulties.” The Dominion Post.  ↩︎
  20.  West Virginia Health Insurance Marketplace Grants Awards List↩︎
  21. West Virginia Establishment Grant Quarterly Report, 4/1/12-6/30/2012. ↩︎
  22. Letter from Secretary Sebelius to Governor Tomblin. March 5, 2013.  ↩︎

The U.S. Department of Defense and Global Health: Infectious Disease Efforts

Authors: Kellie Moss and Josh Michaud
Published: Oct 22, 2013

The Department of Defense (DoD) puts significant resources into understanding, preventing, and treating infectious diseases related to global health. Its efforts help to protect the health and well-being of U.S. military personnel, but also contribute to the health of civilians at home and abroad. DoD’s infectious disease efforts range from advancing medical research pertaining to infectious diseases; to innovating new tools and strategies for their control and prevention; to tracking, preparing for, and responding to outbreaks around the world. DoD’s work also helps strengthen other countries’ efforts to address these diseases.

This report provides an overview of DoD’s work pertaining to infectious diseases, looking at how activities are organized internally and ways they are coordinated with other U.S. government (USG) agencies and external partners. It focuses on the force health protection areas of medical research and development, health surveillance, and personnel education and training programs in infectious diseases, as well as to support the growing area of partnership engagement activities with partner countries. It identifies the various DoD funding streams for infectious disease efforts and spotlights DoD’s work to address two of global health’s key infectious disease challenges, HIV/AIDS and malaria, and DoD and USG funding supporting these efforts.

This report builds on The U.S. Department of Defense and Global Health, a Kaiser Family Foundation report released last fall that provided the first comprehensive look at the department’s role in global health.

The 65 and Over Population Will More Than Double and the 85 and Over Population Will More Than Triple by 2050

Published: Oct 17, 2013

Source

A. Houser, W. Fox-Grage, and K. Ujvari. Across the States 2013: Profiles of Long-Term Services and Supports, AARP Public Policy Institute, September 2012, available at: http://www.aarp.org/content/dam/aarp/research/public_policy_institute/ltc/2012/across-the-states-2012-full-report-AARP-ppi-ltc.pdf