An Overview of Delivery System Reform Incentive Payment (DSRIP) Waivers

Authors: Alexandra Gates, Robin Rudowitz, and Jocelyn Guyer
Published: Sep 29, 2014

Executive Summary

Prompted by an interest in improving the health of the population, enhancing the experience and outcome of the patient, and reducing the per capita cost of care, states are implementing innovative programs reforming how care is delivered and paid for.  Some delivery system initiatives have been long-standing, such as efforts to expand and improve quality and value in managed care contracts.  Others initiatives such as health homes for individuals with chronic conditions and new programs to test delivery and payment models to better serve individuals dually eligible for Medicaid and Medicare were new options included in the Affordable Care Act (ACA).  In addition, half of the states are involved in the State Innovation Models initiative (SIM) working with the CMS Innovation Center.  Finally, CMS together with the National Governor’s Association (NGA) recently announced a new initiative called the Medicaid Innovation Accelerator Program that will invest over $100 million over five years to help states accelerate the development and testing of new state-led payment and service delivery innovations.

“Delivery System Reform Incentive Payment” or DSRIP programs are another piece of the dynamic and evolving Medicaid delivery system reform landscape.  DSRIP initiatives are part of broader Section 1115 Waiver programs and provide states with significant funding that can be used to support hospitals and other providers in changing how they provide care to Medicaid beneficiaries.  Originally, DSRIP initiatives were more narrowly focused on funding for safety net hospitals and often grew out of negotiations between states and HHS over the appropriate way to finance hospital care.  Now, however, they increasingly are being used to promote a far more sweeping set of payment and delivery system reforms.  The first DSRIP initiatives were approved and implemented in California, Texas, and Massachusetts in 2010 and 2011, followed by New Jersey, Kansas and Massachusetts in 2012, and most recently New York which was approved in 2014 and will be implemented in 2015.  Key components of DSRIP waivers include the following:

Under DSRIP initiatives, funds to providers are tied to meeting performance metrics.  To obtain DSRIP funds, eligible entities (hospitals, and other providers, including provider coalitions) must meet certain milestones or metrics.  While the exact structure and requirements of each DSRIP initiative differ, there is a focus on meeting process type metrics in the early years of the waiver, such as system redesign or infrastructure development, and then meeting more outcome based metrics in later years, such as clinical health or population based improvements.  In support of these milestones and metrics, the DSRIP waivers impose robust data collection and reporting requirements on providers. Most recently, in the approval of the New York DSRIP plan, state DSRIP funds are also tied to meeting performance metrics beginning in year 3 of the waiver.
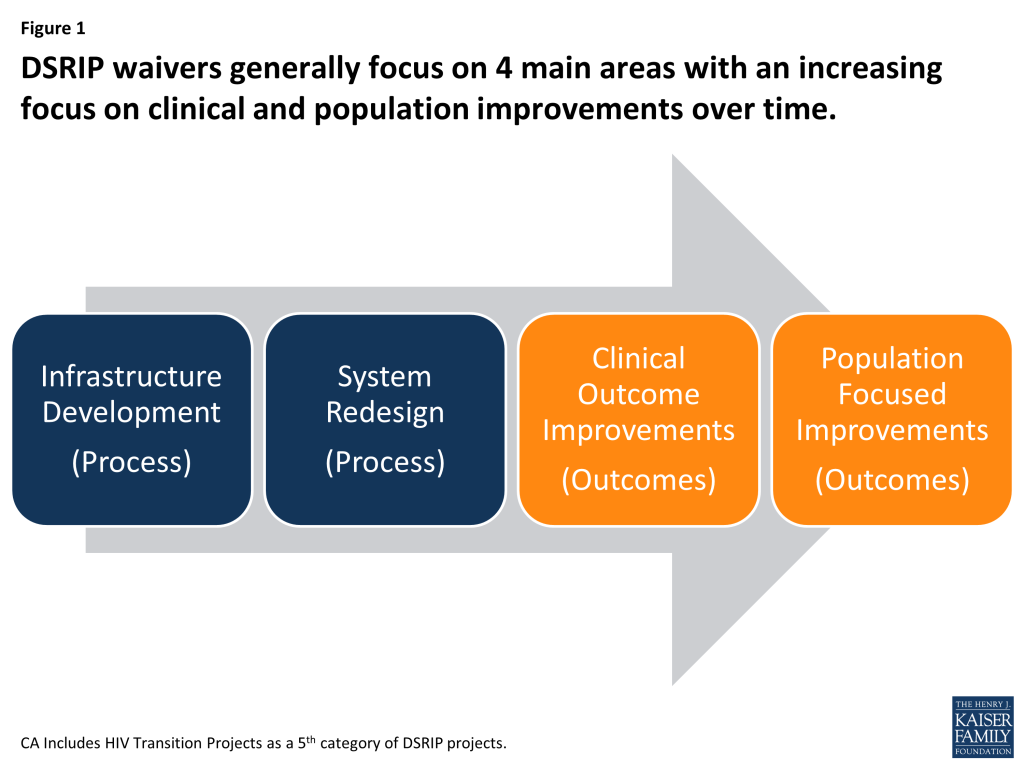
Figure 1: DSRIP waivers generally focus on 4 main areas with an increasing focus on clinical and population improvements over time

Funding for DSRIP initiatives varies across states, but can be significant.  However, DSRIP funding is part of broader Section 1115 waiver programs that are required to be budget neutral for federal spending.  California, New York, and Texas each expect to have several billion dollars for their DSRIP initiatives over a five-year period while Kansas, Massachusetts and New Jersey have smaller programs and will spend substantially less.  The DSRIP pool is a component of larger Medicaid 1115 waivers, which must be “budget neutral” to the federal government, meaning the federal government cannot spend more under the waiver than estimated spending without the waiver.  Generally, there is a lot of negotiation between states and the federal government over policy and budget neutrality for Section 1115 waivers.  In concept, states will undertake initiatives expected to save Medicaid funds and then use expected savings for new investments in delivery system reform.  States have also used DSRIP waivers as a means to continue receiving Medicaid funds for supplemental payments to hospitals as they expand their use of managed care.

The role of DSRIP waivers in delivery system reform is evolving. Recent DSRIP approvals highlight the evolution of DSRIP waivers, which increasingly include more accountability and involve a broader set of providers.  For example, the New York DSRIP waiver approved at the end of 2013 includes funding for a broad set of providers, a more specific set of metrics and projects, and new requirements for the state to meet statewide goals as a condition of continuing to receive DSRIP funding (in addition to requirements for providers to meet specific metrics to access funding).  Looking ahead, it will be important to evaluate the longer term outcomes of these initiatives and the extent to which they are making changes in care delivery, clinical outcomes, and population health.  If they are successful, policymakers may want to see how these programs can be scaled and replicated across a larger number of states.

Issue Brief

Introduction

States are engaged in an array of delivery system reform efforts from managed care to new options in the ACA such as demonstrations for those dually eligible for Medicare and Medicaid as well as health homes.  Multi-payer initiatives are funded through the State Innovation Models initiative (SIM), and CMS, together with the National Governor’s Association (NGA), recently announced a new initiative called the Medicaid Innovation Accelerator Program that will invest over $100 million over five years to help states accelerate the development and testing of new state-led payment and service delivery innovations.

“Delivery System Reform Incentive Payment” or DSRIP programs are another piece of the dynamic and evolving Medicaid delivery system reform landscape.  DSRIP initiatives are part of broader Section 1115 Waiver programs and provide states with significant funding that can be used to support hospitals and other providers in changing how they provide care to Medicaid beneficiaries.  Originally, DSRIP initiatives were more narrowly focused on funding for safety net hospitals and often grew out of negotiations between states and HHS over the appropriate way to finance hospital care.  Now, however, they increasingly are being used to promote a far more sweeping set of payment and delivery system reforms.  The first DSRIP initiatives were approved and implemented in California and Texas in 2010 and 2011, followed by New Jersey, Kansas and Massachusetts in 2012 and 2013 and most recently New York which was approved in 2014 and will be implemented in 2015.  At the highest level, DSRIP waivers are designed to advance the “Triple Aim” of improving the health of the population, enhancing the experience and outcomes of the patient and reducing the per capita cost of care (Figure 2).
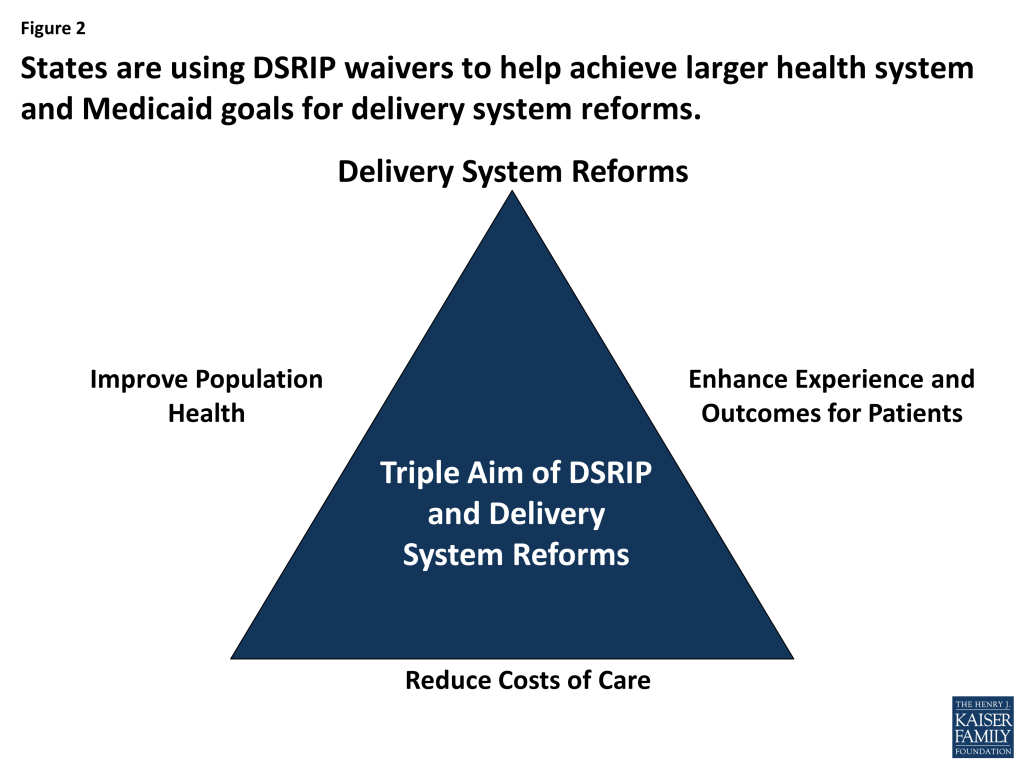
Figure 2: States are using DSRIP waivers to help achieve larger health system and Medicaid goals for delivery system reforms

Section 1115 Medicaid waivers provide states with an avenue to test new approaches in Medicaid that differ from federal program rules. These waivers are intended to allow for “experimental, pilot, or demonstration projects” that, in the view of the HHS Secretary, “promote the objectives” of the Medicaid program.  Section 1115 waivers have historically been used for a variety of purposes, including expanding coverage to populations who were not otherwise eligible, changing benefits packages, and instituting delivery system reforms.  There is long-standing policy that requires 1115 Waivers to be budget neutral for federal spending meaning the federal government will not spend more with the waiver than if the waiver were not in place.  Setting waiver policies and budget neutrality involve a lot of negotiations with states and the federal government.

There is no official federal guidance about what qualifies as a DSRIP program.  Beyond the six mentioned above, a number of other states, including Florida, New Mexico, and Oregon, operate initiatives that share key elements of DSRIP waivers, but are not included as DSRIP waivers for purposes of this paper.  With the prospect of hundreds of millions of dollars in federal Medicaid funding and the opportunity to promote a delivery system reform agenda, more states now are stepping forward to pursue DSRIP waivers. For example, Alabama, Illinois, and New Hampshire all are in various stages of developing DSRIP waivers.

Key Elements of DSRIP Waivers

This brief will examine similarities and differences across key elements of DSRIP waivers.  The states included in this analysis are:  California, Texas, Kansas, New Jersey, Massachusetts, and New York.  As noted above, each of the DSRIP waivers were part of broader state reform waivers.  For each of these states, Table 1 identifies the larger 1115 waiver into which the DSRIP initiative is folded, as well as the duration of the DSRIP component.

Table 1:  Timing and Authority for DSRIP Initiatives
StateTime FrameBroader Waiver Authority
California2010-2015Bridge to Reform Waiver
Texas2012-2016Transformation and Quality Improvement Waiver
Massachusetts2011-2014MassHealth
New Jersey2014-2017Comprehensive Medicaid Waiver
Kansas2014-2017KanCare Waiver
New York2014-2019Medicaid Reform Transformation Waiver

The key elements of DSRIP initiatives that will be explored in this analysis include:  the goals and objectives of DSRIP initiatives; eligible providers; projects and organization; allocation of funds; data collection and evaluation/reporting; and financing of DSRIP waivers.  As a group, the waivers share some common elements, but there also are differences across states due to state-specific circumstances as well as the evolution of these waivers over time.

Goals and Objectives

The overarching goal of all of the state DSRIP initiatives is transformation of the Medicaid payment and delivery system in an effort to achieve measureable improvements in quality of care and overall population health.  The initiatives link funding for eligible providers to their progress toward meeting specific milestones.  Individual states may have a range of reasons for pursuing DSRIP waivers that include delivery system reforms but may also include interest in maintaining or directing funds to hospitals or other providers.

Eligible Providers

Originally, DSRIP initiatives were narrowly focused on providing funds to safety net hospitals for delivery system reform.  Over time, these waivers are increasingly being used to support a broader array of providers (hospital and non-hospital) in pursuing delivery system reforms.  As such, a key choice for states is to decide which provider is eligible for DSRIP funds and, in particular, the role of non-hospital providers in DSRIP-funded initiatives.  (Table 2)

Table 2:  Eligible Providers
StatePublic HospitalsPrivate HospitalsNon-Hospital Providers
California x
Texas x x x
Massachusetts x x
New Jersey x x
Kansas x x
New York x x x

As shown in Table 2, all states use their DSRIP waivers to fund public hospitals for delivery system reform, but a significant number also allow private hospitals to receive funding.  To be eligible for funding, hospitals generally must meet standards for serving a certain proportion of Medicaid and uninsured populations. In many states, hospitals with larger Medicaid/uninsured populations are eligible to receive higher funding allocations.  In addition, a state may require a hospital to make intergovernmental transfers as a condition of receiving DSRIP funds.  The number of hospitals receiving DSRIP funding also varies across states.  In Kansas, only two hospitals (The University of Kansas Hospital and Children’s Mercy Hospital) are eligible to participate in DSRIP, compared to 7 hospitals in Massachusetts, 21 hospital systems in California and 63 hospitals in New Jersey.

DSRIP waivers in Texas and New York require that funds be used for a broader set of providers, and these states are using their DSRIP waivers to promote collaborative provider networks that consist of an anchor hospital, associated clinics, and other providers or entities.  In Texas, the state is broken up into 20 Regional Healthcare Partnerships (RHP). Each RHP is led by a public hospital or local governmental entity — such as a county or district hospital — that is responsible for funding the state match in partnership with regional health care providers.  The larger provider network, however, can include community health centers, county health departments, and other non-hospital providers.  Similar to Texas, New York is using its DSRIP waiver to promote coordinated networks of care organized around a lead hospital provider and component providers.

Projects and Organization

DSRIP allows Medicaid funding to be used to create incentives for providers to pursue key elements of delivery system reform.  The details of what these key elements look like vary across states and waivers, but, generally include projects focused on the following four areas (although the terminology differs across states):  infrastructure development, system redesign, clinical outcome improvements, and population focused improvements.  In general, DSRIP waivers are set up to focus on achieving metrics and milestones in infrastructure and system redesign (more process oriented changes) in the earlier years of the waiver and then focus shifts toward reaching clinical and population focused metrics and milestones (more outcome based measures) in the later years of the waiver (Figure 3). States typically require eligible entities to submit a plan for approval that outlines the specific projects and metrics they intend to implement.
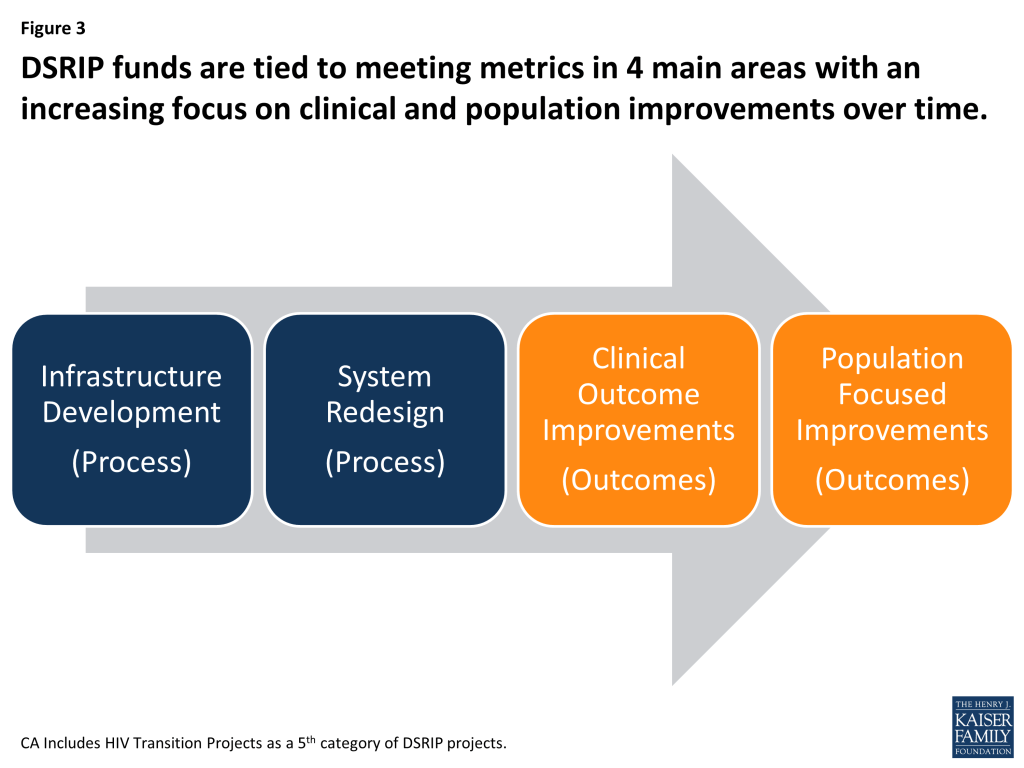
Figure 3: DSRIP funds are tied to meeting metrics in 4 main areas with an increasing focus on clinical and population improvements over time

DSRIP waivers vary in the rules and procedures governing the kinds of projects that can be undertaken for each of the major stages of delivery system reform.  For example, eligible providers in California, Massachusetts and Texas generally had flexibility to choose specific projects and select the metrics for delivery system reform; while in New Jersey, Kansas, and New York, the state is more prescriptive about the specific projects and metrics from which eligible providers may choose.  In Texas, eligible entities choose projects within 4 main focus areas laid out in broad parameters set by the state.

Process Metrics:  Infrastructure Development and System Redesign Efforts

Infrastructure development projects are generally focused on investments in technology, tools and human resources that are needed to allow a hospital or network of providers to move forward with delivery system reform.  System redesign projects focus on fostering new and innovative models of care delivery that expand access and improve quality.

For example, infrastructure projects could focus on developing training for the primary care workforce, or introducing telemedicine; implementing disease management or chronic care management registries/systems; and enhancing interpretation services and culturally competent care (including the collection of accurate Race, Ethnicity and Language (REAL) data).

System redesign projects may include the following:  redesigning primary care models and expanding medical homes; establishing patient navigation programs; expanding chronic care management models and medication management programs; integrating physical and behavioral health care; and creating integrated delivery systems.

In New Jersey and Kansas, each project has an element of infrastructure development metrics and investments tied to it, such as staff training or the development of educational models.  In New York, there is a set of core metrics related to operations or process measures that focus on approval of the DSRIP Plan, workforce milestones related to net change in providers, and system integration milestones.  Eligible providers also must choose 2 system transformation projects.

Outcome Measures:  Clinical Care and Population Health Improvements

Clinical care improvements and population focused improvements are tied to measurable outcomes and metrics to address patient care and safety, and improvements in overall health.  Some states specify areas for clinical and population health improvement metrics, while others allow providers flexibility to determine the key areas for improvement as well as the metrics.  There is significant overlap across states between these priority areas.

In California all DSRIP hospitals must make improvements on some key clinical outcomes, such as the rate of sepsis detection, the effectiveness of stroke management techniques, and the prevention of Central Line-Associated Bloodstream Infection (CLABSI).  Along with these standardized requirements, each DSRIP hospital must also select and report on their progress in improving outcomes for high burden conditions such as HIV/AIDS and asthma.  In effect, the state is requiring hospitals to make improvements on a number of defined clinical outcomes, but also giving them some flexibility to identify other clinical areas where improvements are needed.

In New Jersey each project has defined outcome measures that are similar across projects, such as reduced admissions, reduced emergency department visits, improvements in care processes, and increases in patient satisfaction.  However, each project may also have specific metrics which are primarily measured by NCQA, AMA Primary Care Incentive Program (PCIP), the Joint Commission, AHRQ, CMS or HRSA. For example, specific metrics for the project to improve cardiac care by reducing 30-day readmissions requires reporting and progress on several NCQA measures, such as controlling high blood pressure and compliance with post-discharge appointments.

In New York, each major network of providers (referred to as “Performing Provider Systems” or “PPSs”) must establish at least two priorities for clinical improvement.  The state has set some parameters around what the PPSs can focus on by requiring that their goals achieve at least one of two things: tackle behavioral health issues and address HIV/AIDS, cardiovascular health, perinatal health, diabetes care, palliative care, asthma or renal care.  In addition, each PPS must select one population-wide project that promotes mental health and prevents substance abuse; prevents chronic diseases; prevents HIV and STDs; or promotes healthy women, infants and children.

Statewide DSRIP Progress Measures

HHS efforts are underway to ensure that DSRIP waivers are translating into improvements in care across a state as a whole.  To that end, the latest waiver approval for New York makes DSRIP funding to the state (not just funding to eligible providers) contingent upon the state meeting statewide metrics tied to the overall goal of reducing avoidable hospitalizations.  Specifically, the state must meet statewide delivery system reform metrics, the majority of all specified individual project metrics must be met, growth in total Medicaid spending and spending on inpatient and ER services must fall at or below target trend rates, and the state must show demonstrated progress toward ensuring 90 percent of managed care payments are value-based by the end of the five year demonstration period.  If any of these four milestones above are not met, then DSRIP payments to providers will be reduced proportionately across all DSRIP Performing Provider Systems based on the valuation of their DSRIP project plans.

Allocation of Funds

DSRIPs are not grant programs – they are performance-based incentive programs.  In all states, providers must meet certain process or outcome measures to qualify for DSRIP funding; however, states vary in terms of the methodology for allocating the DSRIP funding across providers, demonstration years, and projects. Past DSRIP waivers have prioritized certain types of projects (e.g., integrated healthcare delivery, expanded primary care capacity, and/or population-focused improvements), as well as certain provider types (e.g., those with the largest percentages of Medicaid and uninsured patients).  Generally, over the course of a state’s DSRIP initiative, funding allocations for meeting milestones related to clinical care and population health receive higher levels of funding.

In California, for example, the allocation of funds was based on specific provider plan submissions for infrastructure and system redesign, a formula for allocating payments for clinical care, and population improvements, which are required to comprise 20-30 percent of funding for demonstration year 5.  Each intervention’s incentive payment amount will be determined using a formula where a base amount is multiplied by factors to determine the total dollars for that intervention.  The amount of the incentive funding paid to a provider is based on the amount of progress made meeting milestones.

New Jersey bases fund allocation on achievement values (AVs) for early state metrics and performance and outcomes in later years.  In New Jersey, amounts of the DSRIP pools will be set aside and directed to a Universal Performance Pool (UPP), which shall be available to hospitals that successfully maintain or improve a subset of DSRIP Performance Indicators.

In New York, DSRIP dollars will be allocated across two pools—one for public hospital-led PPS projects and one for all other hospital-led PPS projects. The maximum amount of funds for each PPS is based on set values for the projects chosen, the number of Medicaid enrollees attributed to the PPS, and the application scores each PPS receives on their State-submitted program plans.  Within the DSRIP funding pool of $6.42 billion, New York has reserved $20 million1  for planning grants and $300 million for state administration as part of the DSRIP funding.  New York will also allocate some DSRIP funds to create a performance pool available to providers that exceed the stated quality improvement goals.  As mentioned earlier, in addition to the metrics and milestones applicable to each PPS project, New York must meet statewide performance goals to obtain full DSRIP funding. Beginning in year three of the demonstration, failure to achieve these goals can result in the state losing some of its DSRIP funding. 2 

Data Collection and Evaluation / Reporting and Assessment

One of the primary features of DSRIP waivers is that funding is tied to meeting specific milestones.  As a result, states must establish data collection and reporting requirements that adequately measure provider performance.  Most DSRIP waivers are focused on process measures in the early years and then require more outcomes measures further into the demonstration.  A number of states also include a mid-demonstration assessment that allows the state adjust its metrics and measures for the latter part of the demonstration.

Generally, across states, the hospitals or providers are required to submit semi-annual reports to the state detailing progress in meeting specified metrics or milestones.  In addition, providers may also need to submit annual reports that also, for example, include narrative descriptions of progress made, lessons learned, and challenges faced.  Moreover, states must provide extensive data to the federal government regularly to demonstrate that they are complying with the terms and conditions of their waivers, as well as meeting “budget neutrality” requirements (discussed below).

For example, New York specifies 6 types of reports and ongoing formal monitoring (beyond standard CMS 1115 oversight):

  • Semi-annual reporting on project achievement (although some metrics are reported annually);
  • Quarterly state monitoring reports on PPS progress and challenges;
  •  An operational report to track DSRIP performance, a consumer level report to report high-level geographic and project-specific data elements to understand which providers are driving improvement quality;
  •  Learning collaboratives to promote and support continuous learning and sharing environments based on data transparency within the NY healthcare industry;
  •  Program evaluation conducted by an independent evaluator to provide an interim and summative evaluation; and
  •  Overall data standards will be collected as often as is practical in order to ensure that project impact is being viewed in “real time.”

Financing of DSRIP

The financing of DSRIP initiatives approved to date is complex, largely because the cost of delivery system reform initiative payments must be folded into an 1115 waiver.  As a result, the financing of DSRIP initiatives is tied to the financing of 1115 waivers, which often are being used by a state to accomplish multiple objectives at once. While these waivers specify an amount of federal funds available for DSRIP initiatives, the broader 1115 waiver must be budget neutral for federal spending, meaning spending under the waiver will not exceed predicted spending without the waiver.  Some of the DSRIP initiatives originally were designed to help states retain federal Medicaid matching funds associated with supplemental payments to hospitals.

Federal Financing

The amount of Medicaid funding available to support DSRIP initiatives varies considerably across states, but can be substantial.  For example, California, New York and Texas each expect to have several billion dollars (over $6 billion in California and New York and more than $11 billion in Texas) for their DSRIP initiatives over a five-year period (though the time period varies across states).  Kansas, Massachusetts and New Jersey have smaller DSRIP initiatives with less spending.  While the waivers include an amount of federal funding set aside for DSRIP initiatives, the entire waiver (including DSRIP) must meet budget neutrality requirements.

In the context of DSRIP waivers, it can be challenging to demonstrate budget neutrality.  The cost of making payments to hospitals and other providers for broad-based delivery system reform is not an expense that the federal government would match in the absence of a Medicaid 1115 waiver.  As a result, states must demonstrate that their 1115 waiver will generate “savings” (i.e., reduce the federal cost of operating Medicaid relative to the “without waiver” cost).  They can then “tap” the expected savings and repurpose them for new investments in delivery system reform.  To satisfy budget neutrality requirements, some states are redirecting federal Medicaid funds that they would have spent on supplemental payments to hospitals toward new delivery system reform payments.  (These supplemental payments can include disproportionate share hospital (DSH) payments or Upper Payment Limit (UPL) payments.)

In effect, states redirecting supplemental payments3  are repurposing these hospital-based payments and using them to finance delivery system reform incentives linked to performance measures.  In Texas, the DSRIP initiative helped retain the ability to make significant supplemental payments to hospitals as it moved more aggressively toward the use of Medicaid managed care since federal regulations prohibit states from making certain supplemental payments to hospitals on behalf of Medicaid managed care beneficiaries. Texas was able to integrate these supplemental payments into the budget neutrality calculations underlying its Medicaid 1115 waiver, and, in effect, repurpose a significant share of them for delivery system reform.

State Financing

States remain obligated to pay for their share of the cost of DSRIP initiatives under Medicaid financing requirements.  As such, they must identify a source of state dollars that can be used to “match” federal funding. States sometimes also use their spending on “Designated State Health Programs” or “DSHPs” as a source of state matching funds.  DSHPs are health programs funded entirely by the state, many of which provide safety-net health care services for low-income or uninsured individuals such as adult day care, outpatient substance abuse treatment or care for the mentally ill who are not eligible for Medicaid.  In the context of a larger 1115 waiver, states can sometimes secure federal Medicaid matching funds for the cost of such programs subject to approval from the federal government.  States have then used the money that the state saves to finance the state share of DSRIP initiatives (or other 1115 waiver activities).  In general, the federal government imposes strict limits on the extent to which it will provide federal Medicaid matching funds for DSHPs, making it an uncertain source of financing for future DSRIP waivers.  States can also rely on a number of other financing options, including general revenue dollars or intergovernmental transfers (IGTs) from public hospitals and their sponsoring government entities to fund their DSRIP programs.  Using the IGT approach, the public hospitals transfer local dollars to the state. The state then draws down federal funds to disburse to providers through the DSRIP program projects.

The dollar amounts involved with DSRIP waivers are substantial, but, by repurposing existing savings from 1115 demonstrations or Medicaid payments to hospitals, the waivers are estimated to be budget neutral for federal spending and give states and the federal government the tools for ensuring these funds are invested in delivery system reform.

Looking Ahead

DSRIP is one important element in the landscape of delivery system reform efforts that states are pursuing.  CMS has not released specific guidance for states about requirements for DSRIP programs.  However, more recent waiver approvals point to certain trends such as more accountability and the involvement of a broader set of providers.  Additional states including Alabama, New Hampshire and Illinois are in various stages of developing DSRIP initiatives.  Watching how states structure their programs in terms of eligible providers, projects and metrics as well as how they are financed and account for budget neutrality will provide additional guideposts for other states considering these programs.  Other questions will be whether states can renew DSRIP waivers and how DSRIP programs might differ across states implementing the Medicaid expansion and those not implementing the expansion.  Ultimately, it will be important to monitor these initiatives to measure success in meeting the goals of delivery system reform as well as achieving clinical and population health improvements.  If these initiatives are successful, it will be important to see how these programs can be scaled and replicated across a larger number of states.

This brief was prepared by Alexandra Gates and Robin Rudowitz from the Kaiser Family Foundation and Jocelyn Guyer from Manatt Health.  The authors would also like to thank Dori Glanz and Deborah Bachrach from Manatt Health for their help and review in preparing this brief.


Endnotes

  1. The original waiver included $70 million for planning grants. However, only $20 million of that was used and it is unsure how the remaining $50 million will be used. ↩︎
  2. In addition to the DSRIP funds, New York created a new pool ($500 million) to support safety-net providers that serve significant numbers of Medicaid beneficiaries and demonstrate financial hardship through losses or low margins. The Interim Access Assurance Fund (IAAF) is intended to ensure that Medicaid beneficiaries have adequate access to care in these affected facilities until December 31, 2014, when DSRIP projects are expected to launch. ↩︎
  3. New York is not redirecting supplemental payments. ↩︎
News Release

Measuring the Impact of Ebola: Will it Reach 1.4 Million?

Published: Sep 29, 2014

In the latest post in the Policy Insights series, Jen Kates and Josh Michaud take a look at several key measures of the Ebola epidemic’s impact and assess future projections of Ebola’s burden in the months to come.

Previous columns in the Policy Insights series are also available kff.org.

Measuring the Impact of Ebola: Will it Reach 1.4 Million?

Published: Sep 29, 2014

More than six months have passed since Ebola was first identified in West Africa, and the scale of the crisis continues to grow. Over the last few weeks cases and deaths have increased significantly in the two most affected countries – Liberia and Sierra Leone – setting the stage for even more explosive growth in the weeks and months to come if further action is not taken immediately. The sense of urgency in the face of an outbreak that has grown “out of control” has been palpable among public health leaders and politicians alike, including at the United Nations last week.  Some of this urgency has been driven by stark new data and modeling projections just released by the WHO and the U.S. Centers for Disease Control and Prevention (CDC).  To help shed light on these new data, we take a deeper look at several key measures of the epidemic’s impact including estimates of current cases, prevalence and death rates from Ebola, as well as a consideration of the future projections of Ebola’s burden in the months to come.

How Many Cases?

The global health community relies on the World Health Organization (WHO) as the authoritative source on current Ebola case numbers.  WHO has published updates and situation reports about the West African Ebola epidemic, collected from the country governments, agencies, and organizations working on the ground, approximately every week since August. Even though they represent the “gold standard” of the moment, the WHO numbers cannot be taken at face value.  As WHO itself has stated, its numbers are “vast underestimates,” and the organization believes the true number of cases is two to four times greater than the official reported numbers because many cases go undetected or uncounted for a variety of reasons. 

What Share of the Population Has Already Been Affected?

Recognizing these limitations, we used these data to calculate the cumulative prevalence of Ebola (the percent of the population that has been infected to date) in Liberia and Sierra Leone as of September 22 (see Table).  Based on officially reported numbers from WHO, cumulative prevalence across both countries stands at 0.049%.  Liberia has been hardest hit with an estimated cumulative prevalence of 0.07%, more than twice the rate for Sierra Leone.  For illustrative purposes, if we take into account the underreporting factor as estimated by WHO by tripling the officially reported case numbers, the cumulative prevalence across both countries would be 0.147%; in Liberia alone, the adjusted prevalence would be 0.22%, or approximately one in every 500 people having become infected already (see Table).  Moreover, the estimated number of new cases is rising exponentially.

Why Are Cases Growing Exponentially?

These constantly upward revisions are driven by a cruel epidemiologic statistic – the reproductive rate of disease, or average number of new infections each case creates. WHO’s most recent estimates of this number are 1.51 in Liberia and 1.38 in Sierra Leone.  As long as the reproductive rate remains above 1, the epidemic will continue to expand exponentially, unless something alters its trajectory.  At the current reproductive rates, case numbers are doubling approximately every 24 days in Liberia and every 30 days in Sierra Leone according to the WHO.

Table 1. Current Case and Cumulative Prevalence Estimates fro Ebola in Liberia and Sierra Leone, including Illustrative Prevalence Rates Adjusted for Under-reporting
 CountryPopulationCurrent Cumulative Reported Ebola Cases (as of Sept 22)Cumulative Reported Prevalence (%, as of Sept 22)Current Cumulative Cases if Adjusted for Under-reporting(3x reported cases)Current Cumulative Prevalence, based on Adjusted Case Counts (%)
Liberia 4,092,31030220.07490660.222
Sierra Leone 5,743,72518130.03254390.095
TOTAL 9,836,03548350.04914,5050.147
Sources: CIA World Factbook July 2014 Population Estimates; World Health Organization Ebola Situation Report (22 September).

What Does the Future Hold?

CDC’s new Ebola model estimates the potential future impact of the epidemic.  According to the model’s worst case scenario, which assumes no change in the trajectory of the epidemic and also corrects for underreporting, the number of Ebola cases in Liberia and Sierra Leone together could reach 1.4 million by the end of January 2015. This translates into a whopping 14% cumulative prevalence rate. To put this in perspective, an equivalent rate in the U.S. population would be almost 45 million people nationally, and more than 90,000 in Washington, DC alone.

What’s the Relative Impact Compared to Other Diseases?

The available numbers also indicate that Ebola had, as of mid-September, already become the leading cause of death in Liberia. The WHO has estimated a case fatality rate of 70% for the West Africa Ebola outbreak; applying this rate to the officially reported cases from Liberia for the last 7 weeks, we find Ebola caused, on average, 263 deaths per week in the country.  By comparison, the top three leading causes of deaths in the country – malaria, lower respiratory infections, and diarrheal diseases (using data from the global burden of disease study for 2010) – caused an estimated 140, 89, and 88 deaths per week, respectively.  This means at its current rate, Ebola is killing people in Liberia at approximately twice the rate of the country’s previously biggest cause of death and, ominously, this rate is likely to increase for the foreseeable future as the epidemic continues to expand.

Policymaking in a Fog

One of the many challenging dimensions of the current Ebola outbreak in West Africa, and one that it shares with just about every other global health issue, has been the lack of timely and robust data.  Policymakers trying to deliver personnel, supplies, and services where they are most needed have their task made that much more difficult because we have only vague and time-delayed estimates for some of the core epidemiological aspects of the current outbreak, from exactly how many people are infected, geographic locations where transmission may rising or falling, the rate of growth or decline in cases, and how many people remain at risk of becoming infected.  These weaknesses are partly a reflection of the lack of vital statistics and general surveillance capacity in the affected countries, from before the current outbreak even began, and partly due to the rapidly changing, sometimes chaotic situation on the ground.  Arriving at such estimates typically requires coordination between governmental Ministries of Health, non-governmental organizations, multilateral institutions, and aid agencies in rural and urban areas that are spread out across multiple countries.  A difficult task under any circumstances, it has been made even more challenging in the current crisis situation.

With timely, reliable information so limited, crude estimates and projections are what the global health community has to work with at this point. Unfortunately, the story these estimates and projections tell is an exceedingly grim one, and should create an even greater incentive for the world as a whole to respond to this still-growing crisis. The numbers are stark enough, but they only hint at the full weight of the massive and growing toll that Ebola has inflicted on the people in affected countries and communities.

The Mystery of the Missing $1,200 Per Person: Can Medicare’s Spending Slowdown Continue?

Published: Sep 29, 2014

This insight updates the original July 2014 version to reflect new budget projections released by the Congressional Budget Office.

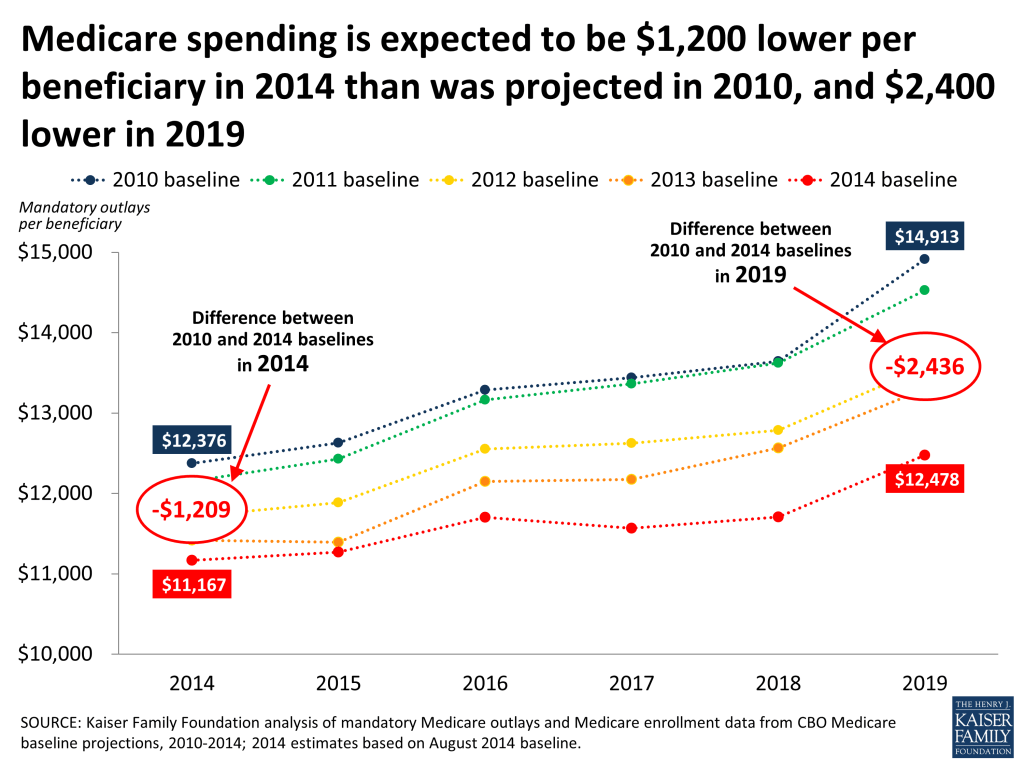
The big story in the Medicare world these days is the slowdown in program spending.  Based on our comparison of CBO’s August 2010 and August 2014 baselines, Medicare spending this year will be about $1,200 lower1  per person than was expected in 2010, soon after passage of the Affordable Care Act (ACA), which included reductions in Medicare payments to plans and providers and introduced delivery system reforms that aimed to improve efficiency and reduce costs.  By 2019, Medicare spending per person is projected to be more than $2,400 lower per person than was expected following passage of the ACA.  Medicare spending projections in CBO’s August 2010 and subsequent baselines take into account the anticipated effects of the ACA, along with other factors that are expected to affect future Medicare spending.  So it seems that the ACA may be having a bigger than expected effect, but something else may be going on here too.

Medicare spending is expected to be $1,200 lower per beneficiary in 2014 than was projected in 2010, and $2,400 lower in 2019

The numbers are impressive, and the consecutive year-to-year reductions in projected Medicare spending are unprecedented.  Looking back, total and per person Medicare spending have grown more slowly each year since 2010 than was expected based on CBO projections, and on a per person basis, Medicare spending actually declined between 2013 and 2014, according to our analysis of data from CBO.

Health care observers are still scratching their heads trying to explain why Medicare spending is growing so slowly.  A CBO analysis shows the Great Recession did not have the same effect on Medicare that it had on the slowdown in health care spending generally, which has been documented by our Kaiser colleagues. It is clear that the Medicare savings provisions in the ACA, such as reductions in provider payment updates and Medicare Advantage payments, have played a major role, and the changes included in the law may be having a bigger effect than was expected soon after the law passed.  In addition, the Budget Control Act of 2011 also exerted downward pressure on Medicare spending through sequestration that reduced payments to providers and plans by 2 percent beginning in 2013.  And yet even after incorporating these scheduled payment reductions in the baseline, CBO has continued to lower its projections of Medicare spending.

So what else might be going on here?  In addition to scheduled reductions in Medicare’s more formulaic payment rates, providers may be tightening their belts and looking to deliver care more efficiently in response to financial incentives included in the ACA, and it is possible that these changes are having a bigger effect than expected.  For example, CMS recently reported that hospital readmission rates dropped by 130,000 between January 2012 and August 2013.  It is also possible that hospitals and other providers are using data and other analytic tools more successfully to track utilization and spending and to reduce excess costs.  Another more straightforward factor is that several expensive and popular brand-name drugs have gone off patent in recent years, which has helped to keep Medicare drug spending in check.

Whatever the causes may be, the slowdown in spending is good news for Medicare, the federal budget and for beneficiaries—at least for now, and as long as it does not adversely affect access to or quality of care.  Lower costs lead directly to lower Medicare premiums and cost sharing.  Lower costs also help to improve the balance sheet for the Part A Trust Fund.

Even with this good news, it is unclear how long slow growth rates can be sustained.  The Medicare actuaries expect Medicare spending to begin to rise more rapidly in the coming years due to a number of factors, including faster enrollment growth, an increase in service use, and faster growth in payment rates due to higher prices brought about by a healthier economy, which will not be fully offset by payment reductions included in the ACA.  And Medicare continues to face long-term financing challenges brought about in part by an aging baby boom population.  These challenges will, no doubt, continue to be the subject of policymakers’ attention.

But for now, the slowdown in Medicare expenditures, as illustrated in the unexpected $1,200 per beneficiary reduction in spending this year, may ease short-term budgetary pressures on Medicare and could provide an opportunity for thoughtful consideration of ways to bolster the program for an aging population.

  1. The previous version of this insight reported that Medicare spending in 2014 will be about $1,000 lower per person than was expected in 2010, based on data from CBO’s April 2014 baseline of mandatory outlays estimated at $612 billion.  This revision reflects CBO’s August baseline of $603 billion ($9 billion less), producing a lower estimate of per capita spending. ↩︎
News Release

Behind the Increase in HIV Infections Among Gay and Bisexual Men

Published: Sep 25, 2014

In his latest column for The Wall Street Journal’s Think Tank, Drew Altman explores why the problem of HIV among gay and bisexual men is urgent–and under the radar.

All previous columns by Drew Altman are available online.

HIV/AIDS In The Lives Of Gay And Bisexual Men In The United States

Authors: Liz Hamel, Jamie Firth, Tina Hoff, Jennifer Kates, Sarah Levine, and Lindsey Dawson
Published: Sep 25, 2014

Executive Summary

From the earliest days of the HIV epidemic, gay and bisexual men have been among the hardest-hit groups in the United States. While gay men make up just 2 percent of the U.S. population, they account for two thirds (66 percent) of new HIV infections, a majority (56 percent) of people living with HIV, and more than half (55 percent) of all AIDS deaths since the epidemic’s beginning.1  It is estimated that 12-13 percent of gay and bisexual men in the U.S. are HIV-positive2 , including one in five in many major U.S. cities3 . Gay men are the only group in the country among whom new infections are on the rise; between 2008-2010, new infections rose 12 percent overall among gay men, and 22 percent among younger gay men ages 13-24.4  Recent research shows that antiretroviral therapy, which already has helped to dramatically increase the quality and length of life for people with HIV, has the potential to play a powerful role in the prevention of HIV. People living with HIV can reduce the risk of transmitting the infection to others by up to 96 percent if they are taking consistent ARV treatment5 , and for those who are HIV negative, new pre-exposure prophylaxis (PrEP) offers a daily pill that can help them to stay negative.6 

What do gay and bisexual men know and think about HIV, and about these new treatments? What are the obstacles to this population taking greater advantage of them? To help answer these questions, the Kaiser Family Foundation conducted a survey of gay and bisexual men in the U.S. focusing on attitudes, knowledge, and experiences with HIV/AIDS and new HIV therapies. The survey was conducted July 17-August 3, 2014 with a sample of 431 men who self-identified as either gay or bisexual using a nationally representative, probability-based Internet panel (more details available in the Survey Methodology section of this report). Some highlights of the survey are presented here, and a more comprehensive examination of the survey findings follows.

Highlights Of Survey Findings

  • The survey allows us to provide some basic demographic information about gay and bisexual men, and finds that just over half (53 percent) report being in a committed relationship, including one in five (20 percent) who say they are married. Twelve percent live in a household with at least one child under the age of 18.
  • About half of gay and bisexual men say HIV/AIDS is a “very” or “somewhat” significant issue for them personally (49 percent), while the other half say it is “not too significant” or “not a significant issue” in their lives (51 percent). However, just about a third (35 percent) say they are personally concerned about becoming infected, while more than half (56 percent) say they are not personally concerned.
  • Just a third of gay and bisexual men realize that new infections are on the rise among gay men. About one in five (22 percent) think rates are decreasing and the rest either think the situation is staying the same or acknowledge that they don’t know.
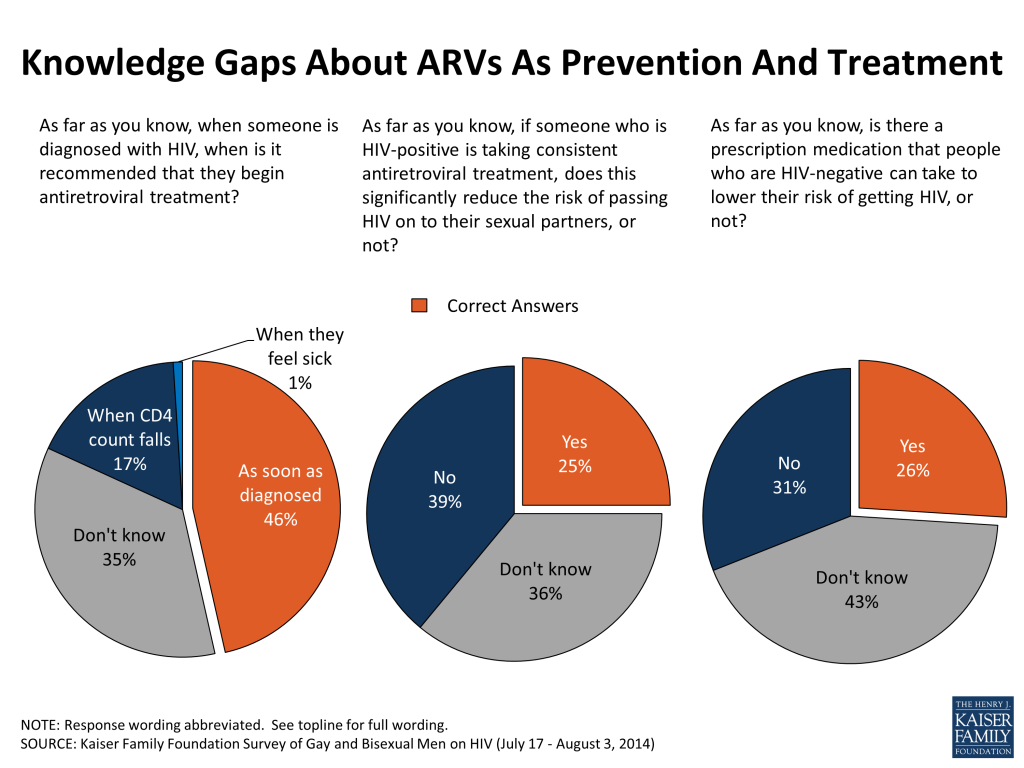
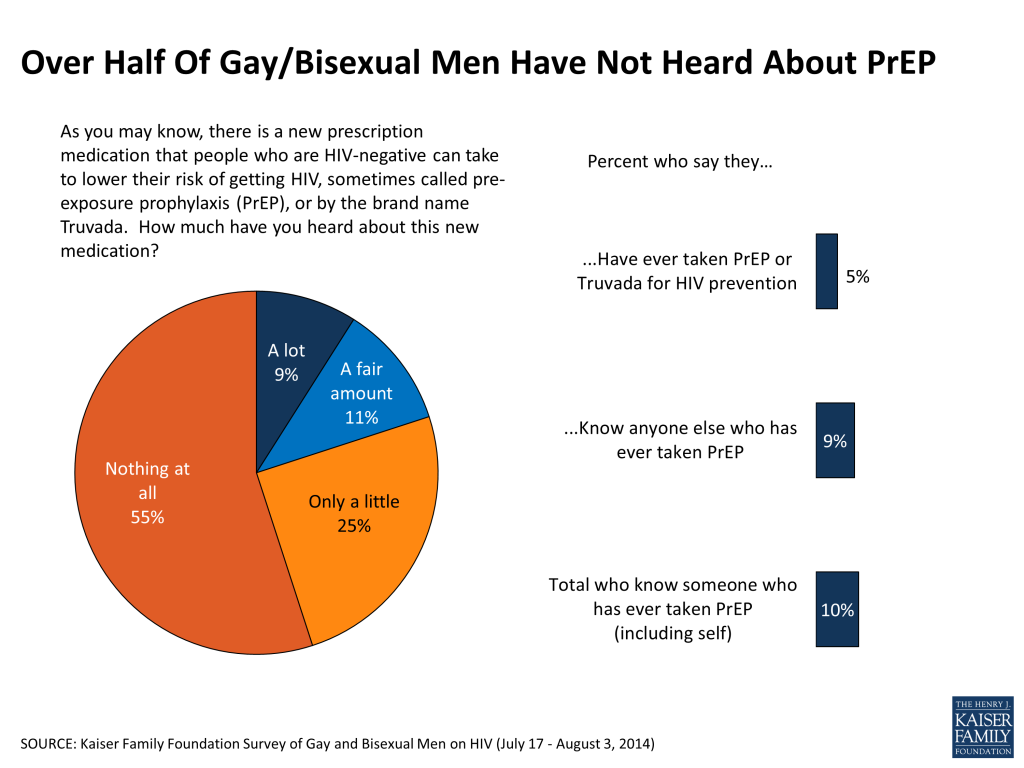
  • Most gay and bisexual men are not aware of current treatment recommendations for those who are HIV-positive, or of the latest developments in reducing new infections. Only about a quarter (26 percent) know about PrEP, a recently approved medication that people who are HIV-negative can take to lower their risk of becoming infected. Just one in ten know someone, including themselves, who has taken PrEP, and eight in ten say they have heard only a little or nothing at all about the new medication.
  • Fewer than half (46 percent) of gay and bisexual men are aware that people with HIV should start antiretroviral (ARV) treatment as soon as they are diagnosed, and only a quarter (25 percent) know about treatment as prevention, or TasP; that is, that taking consistent ARV treatment significantly reduces the risk of passing HIV on to one’s sexual partners.
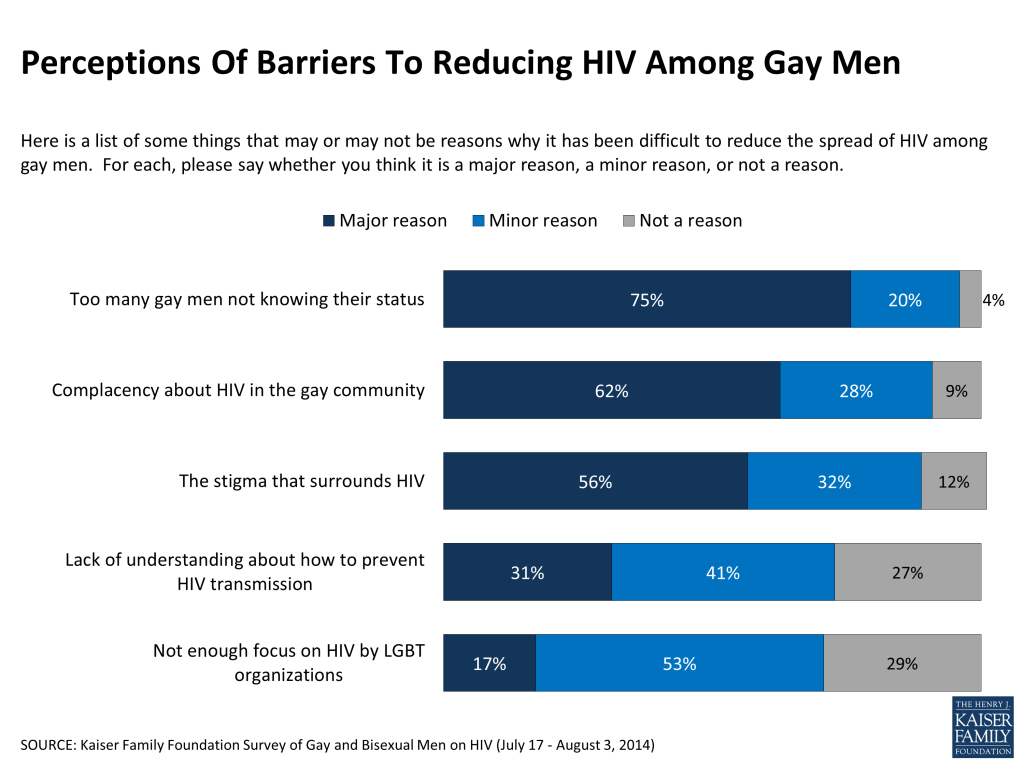
  • Majorities say that too many gay men not knowing their status (75 percent), complacency about HIV in the gay community (62 percent), and HIV-related stigma (56 percent) are major reasons it’s been hard to control the spread of HIV among gay men.
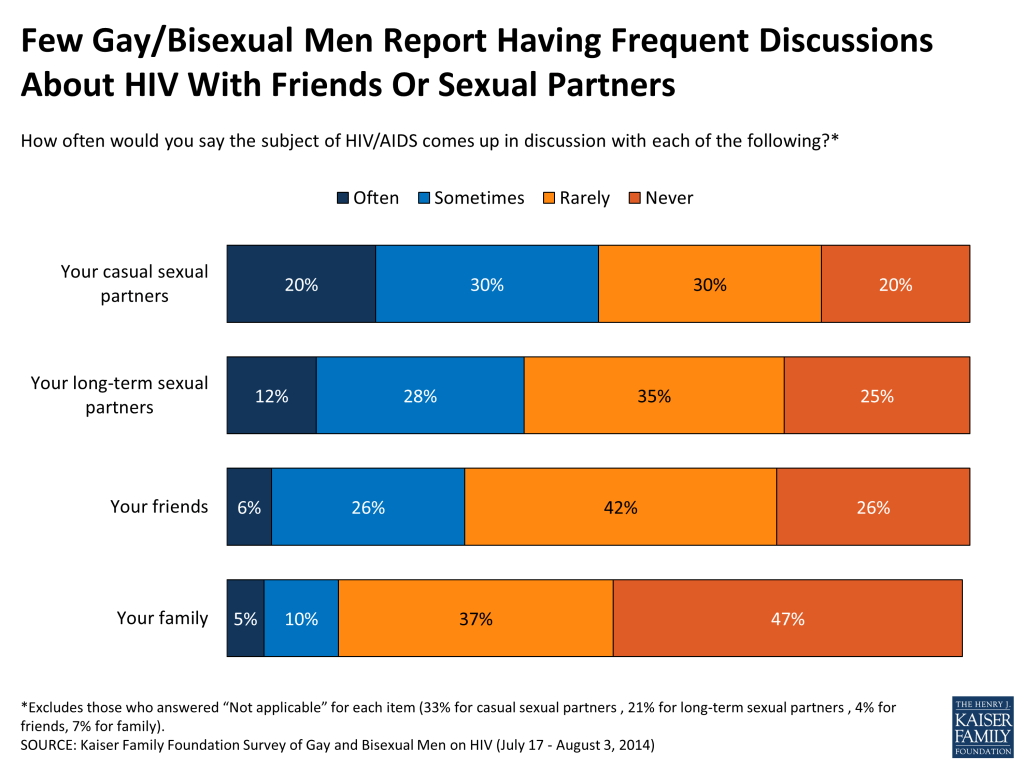
  • Few gay and bisexual men report talking much at all about HIV with friends or even with sexual partners. Three-quarters (68 percent) say they “rarely” or “never” discuss HIV with their friends, and large shares report not talking much about it with casual sexual partners (50 percent) or with long-term partners (60 percent).7 
  • Relatively few gay and bisexual men report getting tested for HIV as regularly as is often advised. While seven in ten say they have been tested at some point in their lives, just three in ten (30 percent) say they were tested in the last year, including 19 percent who say their most recent test was within the past 6 months. Fully three in ten (30 percent) say they have never been tested for HIV.8 
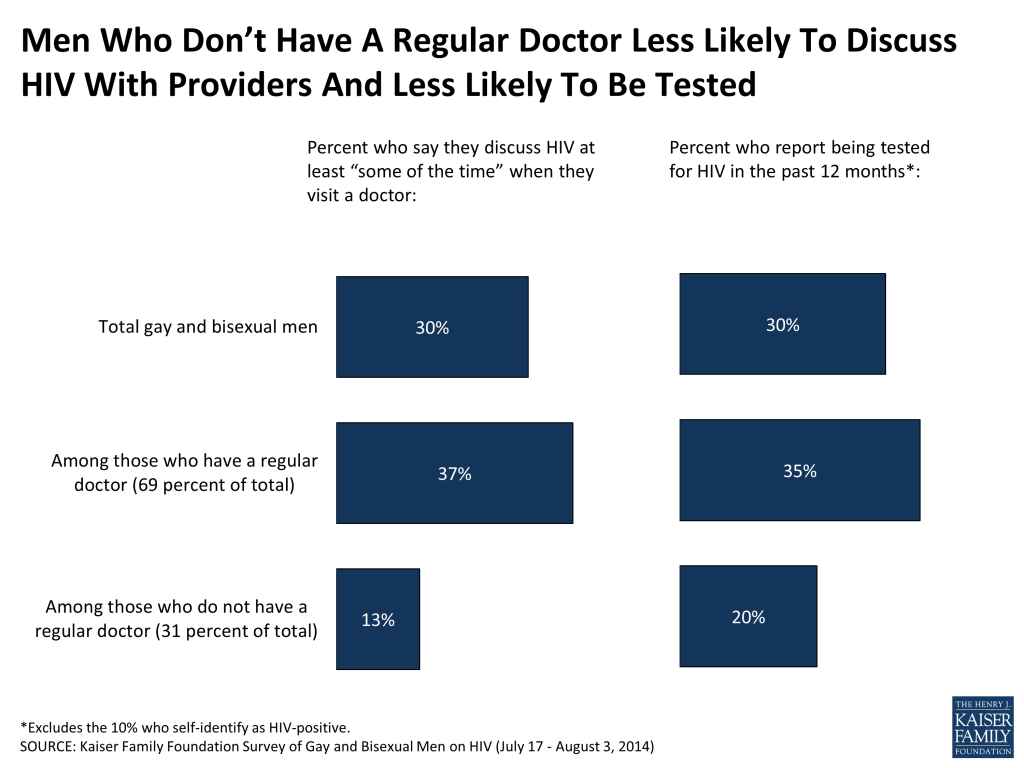
  • More than half (56 percent) of gay and bisexual men say that a doctor has never recommended they get tested for HIV, and six in ten (61 percent) say they rarely or never discuss HIV when they visit their doctor. Lack of communication with doctors may be a barrier to more men getting tested: almost half say they’ve never discussed their sexual orientation with a doctor, and three in ten say they don’t feel comfortable discussing sexual behaviors with health professionals. Three in ten gay and bisexual men report that they don’t have a regular physician, and these men (who tend to be younger, lower-income, and more racially diverse) are even less likely to report discussing HIV with doctors and to say they have been tested for HIV.

Highlights Of Differences Between Groups

The relatively modest sample size of the survey (431 men total) limits our ability to provide results among all subgroups of interest within the overall population of gay and bisexual men. However, we note some areas where responses differ significantly for some broad categories, including white men compared to members of racial and ethnic minority groups, and younger men (ages 18-34) compared with those ages 35 and older.

Differences by race/ethnicity

  • Gay and bisexual men of color are more likely than those who identify as white to say HIV/AIDS is a significant issue for them personally (64 percent versus 42 percent) and that they are personally concerned about becoming infected (53 percent versus 28 percent).
  • Nearly half (46 percent) of gay and bisexual men overall say they use condoms all or most of the time, although about a quarter (24 percent) say they never use condoms. Men of color are more likely than white men to report consistent condom use (61 percent versus 39 percent).9 
  • While most gay and bisexual men believe they have all the information they need about an array of issues related to the transmission and prevention of HIV, men of color are more likely than white men to say they want more information on most topics.

Differences by age

  • There is a large generational divide in the share saying someone close to them has died from HIV/AIDS. Nearly half (47 percent) of gay and bisexual men ages 35 and older say they have lost someone close to them to the disease, while just 8 percent of those ages 18-34 say the same. Older men are also somewhat more likely than younger men to say they know someone currently living with HIV (54 percent versus 39 percent).
  • Younger gay and bisexual men are twice as likely as older men to say they have never been tested for HIV (44 percent of those under age 35 versus 21 percent of those ages 35 and over). 10 
  • Men under the age of 35 are more likely than those ages 35 and older to say they would be uncomfortable having both sexual and non-sexual relationships with someone who is HIV-positive.
  • Men ages 35 and older are more likely to support widespread use of PrEP (64 percent say it should be used widely and 35 percent think it should be used on a more limited basis), while those under age 35 lean in the other direction (56 percent say it should be used on a more limited basis and 43 percent think it should be used as widely as possible).

Key Findings: Section 1: Importance Of Hiv/aids As An Issue, Personal Concern, And Personal Connections

HIV/AIDS As An Issue Facing Gay And Bisexual Men

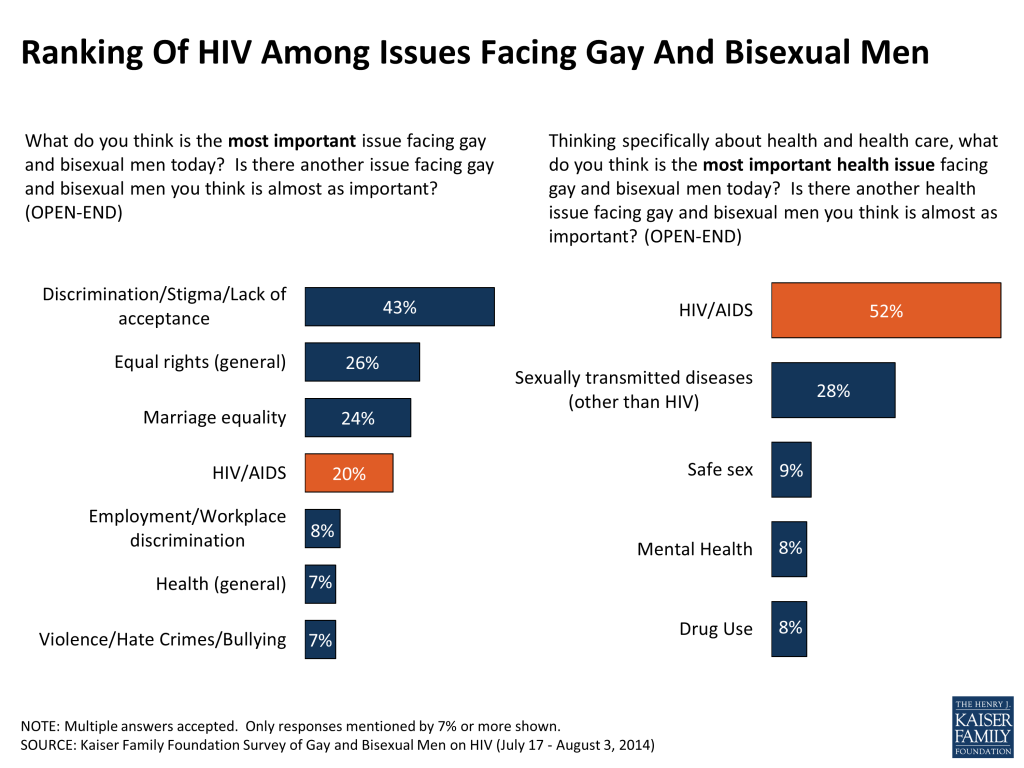
Men in the United States who identify as gay or bisexual see HIV/AIDS as the number one health issue, and as a top priority among overall issues facing their community today. When asked in their own words to name the most important issue facing gay and bisexual men today, 20 percent name HIV/AIDS, ranking behind discrimination/lack of acceptance (43 percent) and roughly equal to two other issues: equal rights (26 percent) and marriage equality (24 percent). Asked specifically about health issues affecting gay and bisexual men, HIV is by far the number one issue at 52 percent, followed by other sexually transmitted diseases (28 percent). Smaller shares name safe sex in general (9 percent), mental health (8 percent), and drug use (8 percent).

While HIV is named as the top health care issue among all subgroups of gay and bisexual men, the share naming HIV is somewhat larger among those who identify as gay versus those who consider themselves bisexual (59 percent versus 35 percent), and among those who know someone who is currently living with HIV versus those who don’t (60 percent versus 41 percent).

Figure 1

Asked about a variety of policy issues affecting gay and bisexual men, just over half (54 percent) say efforts aimed at prevention and treatment of HIV should be a top priority, while nearly as many say the same thing about efforts to combat bullying and violence directed at LGBT youth (51 percent) and equal employment rights for LGBT people (47 percent). Slightly fewer see legal gay marriage (40 percent) and adoption rights for same-sex couples (29 percent) as top priorities, though it should be noted that large majorities see all of these priorities as at least “very important.”

Figure 2

In addition to seeing HIV as a priority for their community, about half of gay and bisexual men (49 percent) say HIV/AIDS is a “very” or “somewhat” significant issue for them personally, while the other half (51 percent) say it is “not too significant” or “not a significant issue” in their lives. Men who are members of racial and ethnic minority groups, as well as those who say they know someone living with HIV, are more likely than whites and those who don’t know someone living with the disease to say that HIV/AIDS is a significant personal issue.

Figure 3

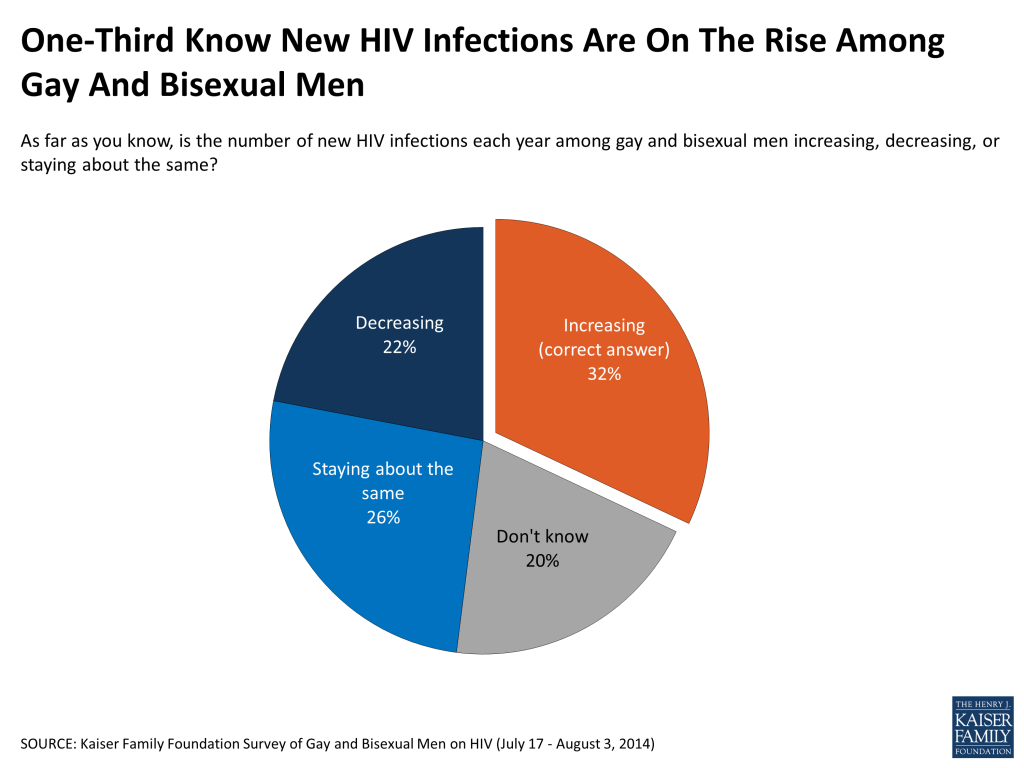
Many are unaware that HIV infections are increasing among gay and bisexual men, the only risk group for which this is true in the United States.11  Just about a third (32 percent) know that the number of new infections each year among gay and bisexual men is increasing, while 22 percent think the number is decreasing, 26 percent say it’s staying about the same, and one in five say they don’t know. Men who identify as gay are somewhat more likely to know that new HIV infections are increasing compared with those who identify as bisexual (36 percent versus 22 percent).

Figure 4

Personal Concern about Risk

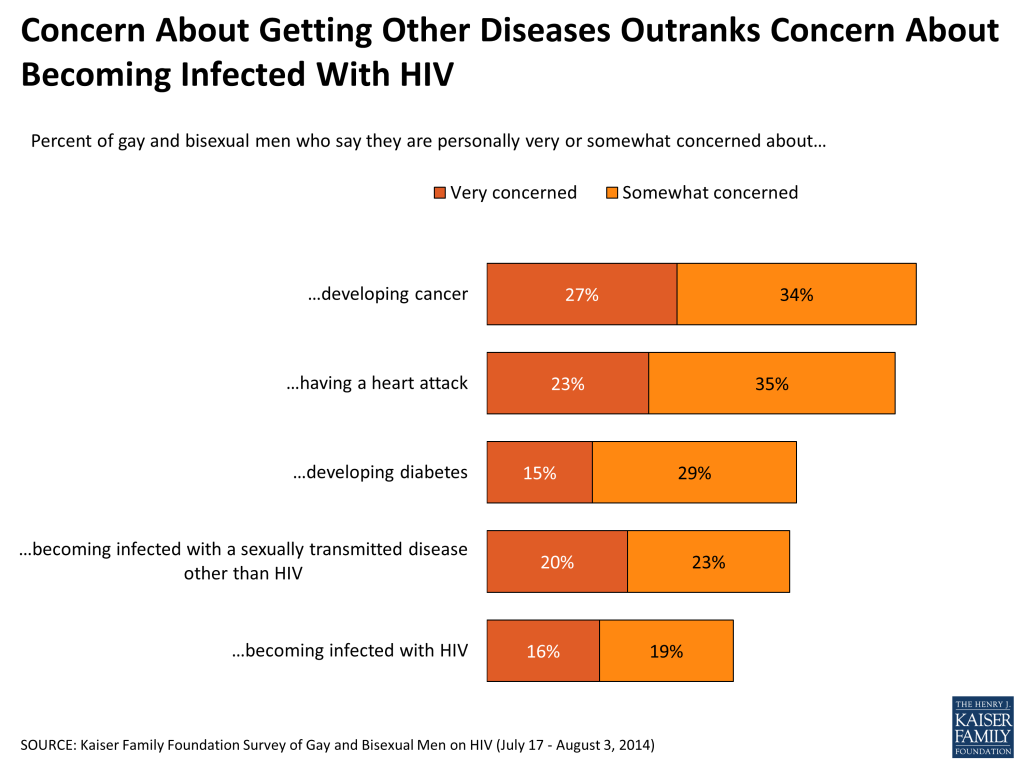
Only about a third (35 percent) of gay and bisexual men say they are at least somewhat concerned about becoming infected with HIV. Just over four in ten (43 percent) say they are concerned about contracting other STDs, while even more report being concerned about developing cancer (61 percent), having a heart attack (58 percent), and developing diabetes (44 percent).

Figure 5

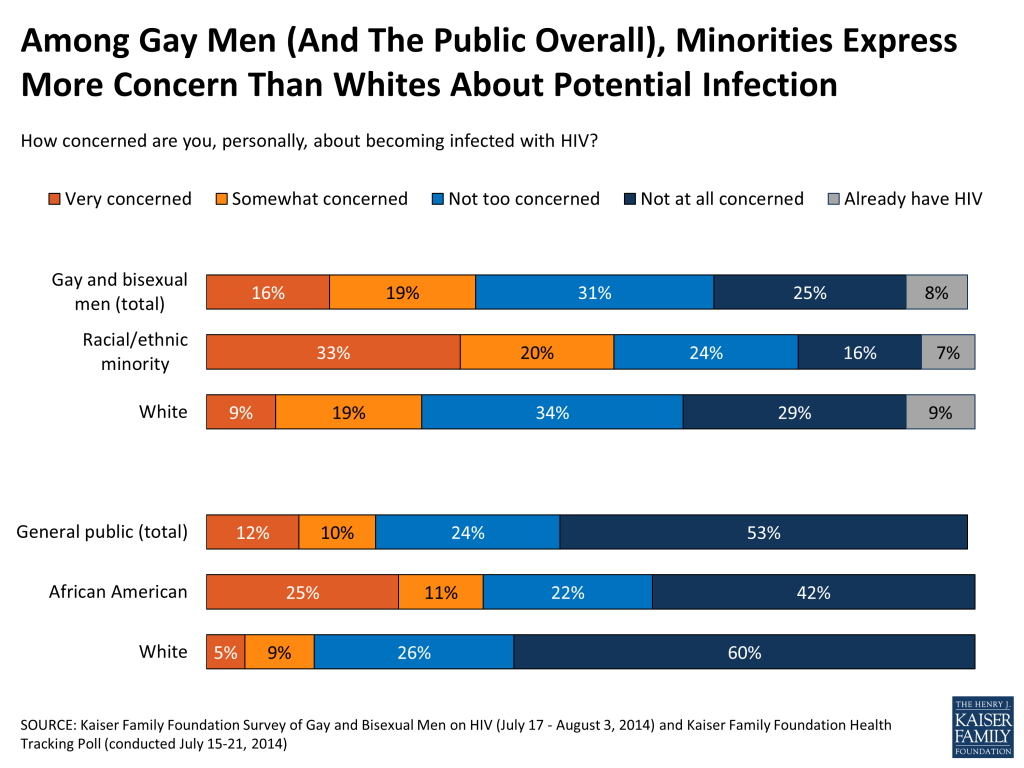
Gay men of color are almost twice as likely their white counterparts to say they are at least somewhat concerned about becoming infected with HIV (53 percent versus 28 percent).12  Similarly among the general population, Black Americans are more likely than whites to say they’re personally concerned about becoming infected (36 percent versus 14 percent).13 

Figure 6

Personal Connections

About half (49 percent) of gay and bisexual men overall say they know someone who is currently living with HIV, and 32 percent say someone close to them has died from HIV/AIDS. Among the general public, these shares are much smaller – just one in five (19 percent) say they know someone living with HIV and 15 percent have lost someone close to them to the disease. Among African Americans nationally – another group besides gay and bisexual men that is disproportionately affected by HIV – just over a quarter (27 percent) say they know someone living with the disease, and a similar share (28 percent, almost equal to the rate among gay men) say someone close to them has died from it.

Figure 7

Among gay and bisexual men, there is a large generational divide in the share saying someone close to them has died from HIV/AIDS. Nearly half (47 percent) of those ages 35 and older say they have lost someone close to them to the disease, while just 8 percent of those ages 18-34 say the same. Older men are also somewhat more likely than younger men to say they know someone currently living with HIV (54 percent versus 39 percent).

Figure 8

Ten percent of gay and bisexual men indicated that they themselves are HIV-positive. However, this is likely to be an underestimate of the true rate in the population, since some men may have chosen not to disclose their own status in the survey, and others are likely to be unaware they are HIV-positive. It is estimated that approximately 12 to 13 percent of all gay and bisexual men in the United States are HIV-positive14 , including one in five in many major U.S. cities15 . The U.S. Centers for Disease Control and Prevention (CDC) also estimates that 18 percent of gay and bisexual men with HIV do not know their status.16 

Key Findings: Section 2: Awareness And Opinions About Hiv Prevention And Treatment

Gaps In Awareness About HIV Prevention And Treatment: PrEP, TasP, and When to Start

Most gay and bisexual men are not aware of current treatment recommendations for those who are HIV-positive, or of the latest developments in reducing new infections. Only about a quarter (26 percent) know about PrEP (pre-exposure prophylaxis), a recently approved prescription medication that people who are HIV-negative can take to lower their risk of becoming infected (this is somewhat higher than the general public, 14 percent). Three in ten (31 percent) believe no such medication exists, and over four in ten (43 percent) say they don’t know.

Gaps in awareness also exist when it comes to antiretroviral (ARV) treatment recommendations for those who are HIV-positive. Fewer than half (46 percent) of gay and bisexual men know that someone living with HIV should begin ARV treatment as soon as they are diagnosed, while 17 percent believe they should wait until their CD4 count falls below a certain level, and over a third (35 percent) say they don’t know the recommendation.17 

Figure 9

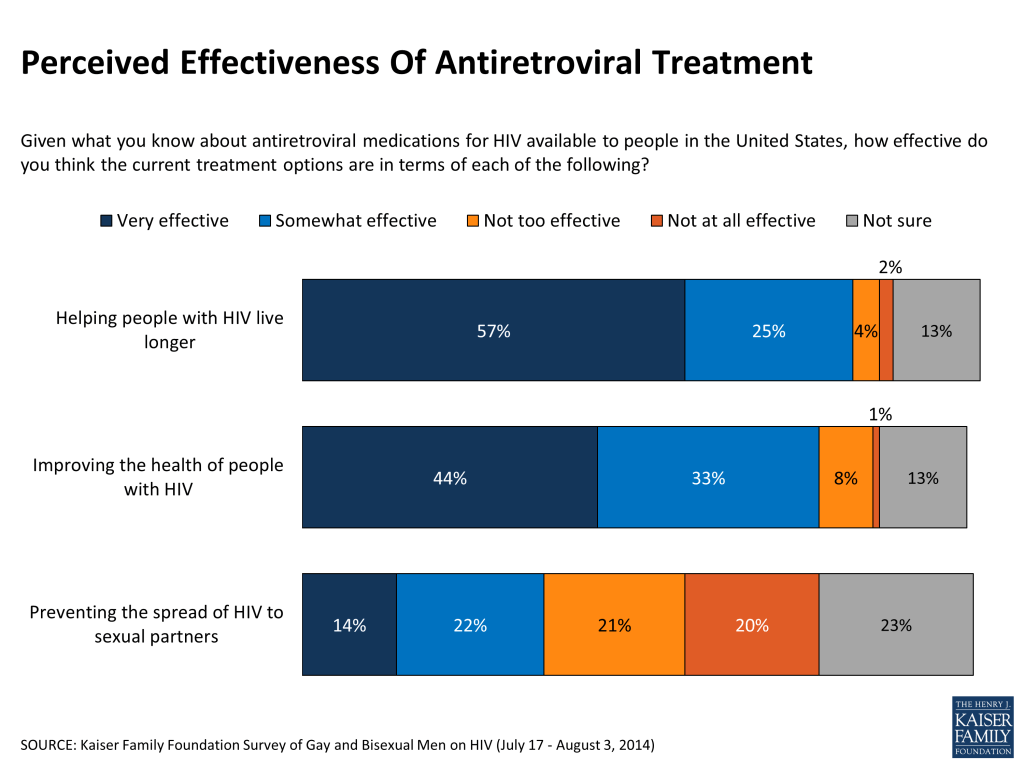
While most gay and bisexual men know that antiretroviral medications (ARVs) are effective at helping people with HIV live longer (82 percent) and improving the health of people with HIV (77 percent), far fewer realize that they’re also effective in preventing the spread of HIV to sexual partners (36 percent) (otherwise known as “treatment as prevention” or TasP).18 

Further, only a quarter (25 percent) of gay and bisexual men know that if someone with HIV is taking consistent ARV treatment, it significantly reduces the risk of passing on HIV to their sexual partners (about the same as the general public, 21 percent). A plurality (39 percent) believe that consistent ARV treatment does not reduce the risk of transmission, and over a third (36 percent) say they don’t know enough to answer.

Men who identify as gay are more likely than those who consider themselves bisexual to be aware that taking consistent ARV reduces the risk of transmission (29 percent versus 15 percent), and that there is a prescription medicine HIV-negative people can take to lower their risk (32 percent versus 15 percent).

Figure 10

More About Pre-Exposure Prophylaxis (PrEP)

As noted above, just a quarter of gay and bisexual men know that a medication exists to reduce a person’s risk of contracting HIV. In a more specific question that mentions both the term pre-exposure prophylaxis (PrEP) and the brand name Truvada, just one in five say they have heard “a lot” (9 percent) or “a fair amount” (11 percent) about this new medication. One-quarter say they have heard “only a little” about PrEP, while over half (55 percent) say they’ve heard “nothing at all.” Just one in ten say they personally know someone who has taken PrEP for HIV prevention, including 5 percent who say they have taken the medication themselves.

Figure 11

When told of the existence of PrEP, just over half (56 percent) of gay and bisexual men say they agree with the view that the new medication “should be used as widely as possible among gay men because every available prevention tool should be used to limit the spread of HIV in communities at risk,” while about four in ten (43 percent) think it “should be used on a more limited basis among gay men because people using it may be less likely to use condoms consistently, putting them at risk for other sexually transmitted diseases.”

Figure 12

Gay and bisexual men ages 35 and older are more likely to support widespread use of PrEP (64 percent say it should be used widely and 35 percent think it should be used on a more limited basis), while those under age 35 lean in the other direction (56 percent say it should be used on a more limited basis and 43 percent think it should be used as widely as possible).

Key Findings: Section 3: Perceived Barriers, Stigma, And Talking About Hiv

Perceived Barriers To Reducing HIV

When asked about reasons why it has been difficult to reduce the spread of HIV in the gay community, gay and bisexual men see a number of factors as “major” reasons, including too many gay men not knowing their HIV status (75 percent), complacency about HIV in the gay community (62 percent), and HIV-related stigma (56 percent). Just three in ten (31 percent) see lack of understanding about how to prevent transmission as a major barrier to curbing the spread of the disease, although the survey results indicate there are significant knowledge gaps about newer prevention options available to reduce the risk of contracting HIV, namely PrEP and treatment as prevention. Few (17 percent) say that lack of focus on HIV by LGBT organizations is a major reason why it has been difficult to slow the spread of HIV among gay men.

Men of color are more likely than those who identify as white to say lack of understanding about HIV prevention is a major reason (48 versus 23 percent).

Figure 13

Stigma, Violence, And Discrimination

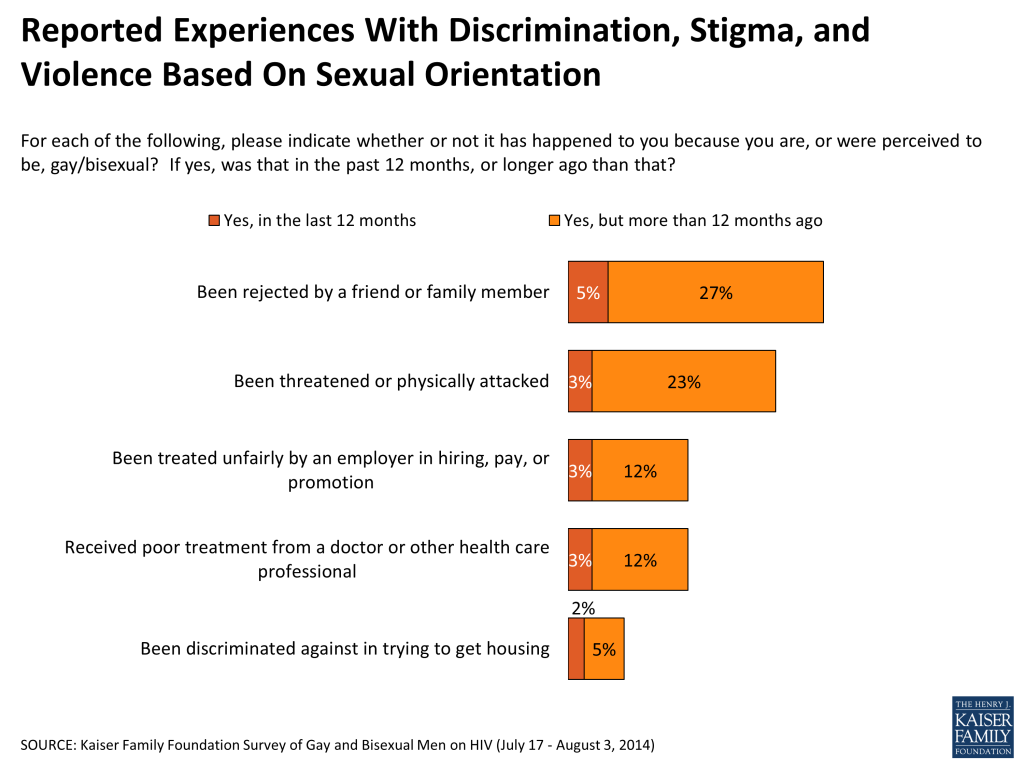
Discrimination and stigma (whether HIV-related or not) is the most frequently-named issue when asked about the most important issues facing gay and bisexual men today. When it comes to their own experiences, many report having faced various forms of stigma and discrimination as a result of their sexual orientation, including being rejected by a friend or family member (32 percent), being threatened or physically attacked (26 percent), experiencing unfair treatment from an employer (15 percent), poor treatment from a medical professional (15 percent), and discrimination in trying to find housing (7 percent).

Figure 14

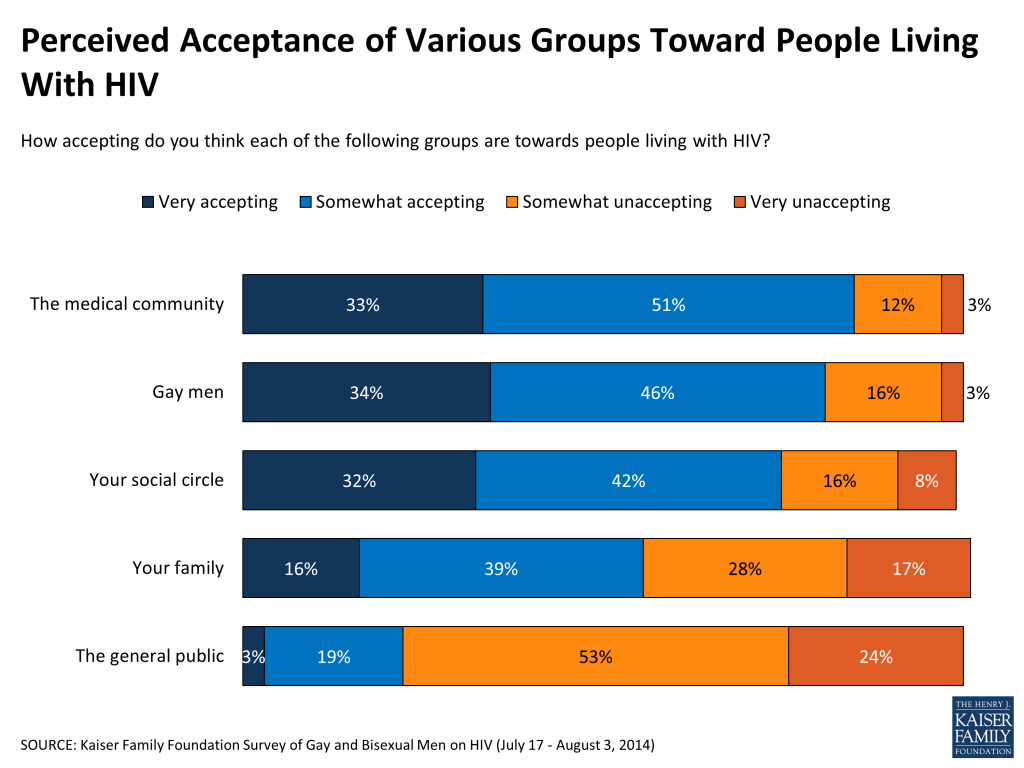
On the topic of HIV-related stigma, about a third of gay and bisexual men say that gay men as a group and their own social circles are “very” accepting towards people with HIV, and an additional four in ten say each of these groups is “somewhat” accepting. The medical community ranks similarly high in perceived acceptance (33 percent say they are “very” accepting and 51 percent say they are “somewhat” accepting). Their own families are perceived as somewhat less accepting of HIV-positive persons (16 percent “very” and 39 percent “somewhat”). However, the large majority (77 percent) of gay and bisexual men believe the general public is unaccepting of people living with HIV.

Figure 15

When asked why they think some people with HIV might be reluctant to tell others about their status, gay and bisexual men see a variety of factors as major reasons, including fear of rejection by family and friends (79 percent), fear of rejection by intimate partners (76 percent), fear of discrimination in housing, jobs, or other situations (76 percent), and a general desire for privacy (62 percent).

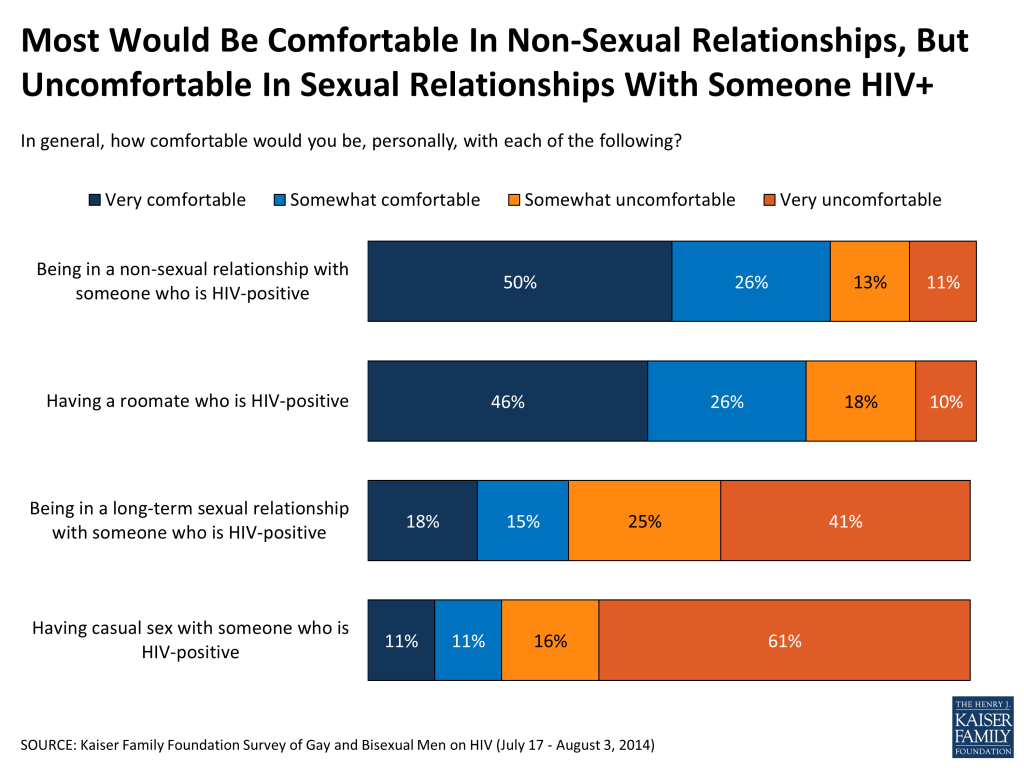
Large majorities of gay and bisexual men say they would be uncomfortable having a sexual relationship with a person who is HIV-positive, including being in a long-term sexual relationship (66 percent) and having casual sex (77 percent). By comparison, three-quarters say they would be “very” or “somewhat” comfortable being in a non-sexual relationship with someone who is HIV-positive (76 percent) and a similar share say the same about having an HIV-positive roommate (72 percent, a rate that is much higher than the general public at 46 percent).

Figure 16

Gay and bisexual men under the age of 35 are more likely than those ages 35 and older to say they would be uncomfortable having both sexual and non-sexual relationships with someone who is HIV-positive, as are those who identify as bisexual compared with those who identify as gay.

REPORTED COMFORT IN SEXUAL AND NON-SEXUAL RELATIONSHIPS WITH SOMEONE WITH HIV
Ages 18-34Ages 35+BisexualGay
In general, how comfortable would you be…
being in a non-sexual relationship with someone who is HIV-positive
Very or somewhat comfortable60%84%60%82%
Very or somewhat uncomfortable40154017
being in a long-term sexual relationship with someone who is HIV-positive
Very or somewhat comfortable22411441
Very or somewhat uncomfortable79608658
having casual sex with someone who is HIV-positive
Very or somewhat comfortable11281226
Very or somewhat uncomfortable89718874

Some men do report having been in “serodiscordant” relationships – that is, where their partner’s HIV status is different from theirs. One in five (19 percent) of those who didn’t identify themselves as HIV-positive say they’ve been in a sexual relationship at some point with someone who has HIV, and another 13 percent say they’re “not sure” if they’ve ever been in such a relationship. Still, an even larger share of this group (37 percent) say that at some point they have decided not to pursue a sexual relationship with someone specifically because they were HIV-positive.

Figure 17

Another issue of importance is that of sexual violence, including intimate partner violence. Eighteen percent of gay and bisexual men say that at some time in their life, a person has attempted to force them to have sex or engage in a sex act against their will, including 4 percent who say this happened in the past year.

Conversations About HIV

Few gay and bisexual men report talking much at all about HIV with friends or even with sexual partners. Large majorities say the topic of HIV comes up “rarely” or “never” in conversations with their friends (68 percent) or family members (84 percent). Compared with the general public, gay and bisexual men are somewhat more likely to say they discuss HIV with their friends at least “sometimes” (32 percent versus 22 percent), though they are no more likely than the general public to report discussing it with family members (15 percent versus 19 percent).

While gay and bisexual men are more likely to report discussing HIV with their sexual partners than with family and friends, still a majority (60 percent) say they “rarely” or “never” discuss the topic with their long-term partners, and half (50 percent) say the same about their casual partners. While these conversations may not be occurring with frequency, gay and bisexual men are more likely than the general public to report talking with sexual partners about HIV. Among adults in general, more than eight in ten (82 percent), say the subject of HIV/AIDS “rarely” or “never” comes up in discussions with their spouse or other intimate partners. 19 

When it comes to conversations about HIV with long-term sexual partners, gay and bisexual men of color are more likely than whites to say they discuss the topic at least “sometimes” (52 percent versus 34 percent), and those who identify as gay are more likely to report these conversations than those who consider themselves bisexual (47 percent versus 27 percent).

Figure 18

Asked more specifically about discussions at the beginning of new relationships, most gay and bisexual men (61 percent) say they ask a person’s HIV status before beginning a sexual relationship “always” or “most of the time,” although nearly four in ten say they don’t routinely ask, including 22 percent who say they “never” do so.20 

Figure 19

Key Findings: Section 4: Condom Use And Hiv Testing

Attitudes And Reported Behaviors About Condoms

According to the CDC, when used consistently and correctly, condoms are highly effective at preventing the spread of HIV and many other sexually transmitted diseases.21  Six in ten gay and bisexual men (60 percent) consider condoms to be “very” effective at preventing HIV transmission between gay men, and most of the remainder (36 percent) say they are “somewhat” effective. Still, fewer than half (46 percent) say they use condoms “all of the time” or “most of the time” when having sex, and nearly a quarter (24 percent) say they never use condoms.22 

Notably, gay and bisexual men who are members of racial and ethnic minority groups are more likely than their white counterparts to say they use condoms all or most of the time (61 percent versus 39 percent).

Figure 20

Attitudes And Reported Behaviors About HIV Testing

The CDC recommends that gay and bisexual men be tested for HIV at least annually and that those who are sexually active may benefit from more frequent testing (every 3 to 6 months)23 , a recommendation already made by many health departments, particularly in areas where gay and bisexual men have been hard hit by HIV. Nearly two-thirds of gay and bisexual men say that testing is recommended more than once annually, including 55 percent who say it should be every 3-6 months and 8 percent who say it should be every month. Men who identify as gay are more likely than those who identify as bisexual to think testing should be at least every 3-6 months (70 percent versus 50 percent).

Relatively few gay and bisexual men report getting tested as regularly as is often advised. While seven in ten say they have gotten an HIV test at some point in their lives, just one in five (19 percent) say they were tested within the past 6 months. Another one in nine (11 percent) report having been tested between 6 and 12 months ago, while 36 percent say their last test was over a year ago and 3 percent can’t remember when they were last tested. Fully three in ten (30 percent) say they have never been tested for HIV, a share that rises to 44 percent among those under age 35.24 

Gay and bisexual men who identify as white are more likely than men of color to say they have ever been tested for HIV (74 percent versus 59 percent), though the share that reports being tested within the past 6 months is similar for both groups (18 percent among white men, 23 percent among men of color).

Figure 21

Among those who have never been tested or who have let more than a year elapse since their last test, by far the most common reason is not feeling at risk (60 percent say this is a major reason). Fewer say they just haven’t gotten around to it (20 percent), they were afraid to find out the results (16 percent), they didn’t know where to go to get tested (13 percent), their doctor never brought it up (11 percent), or they were worried about the cost (10 percent).

Figure 22

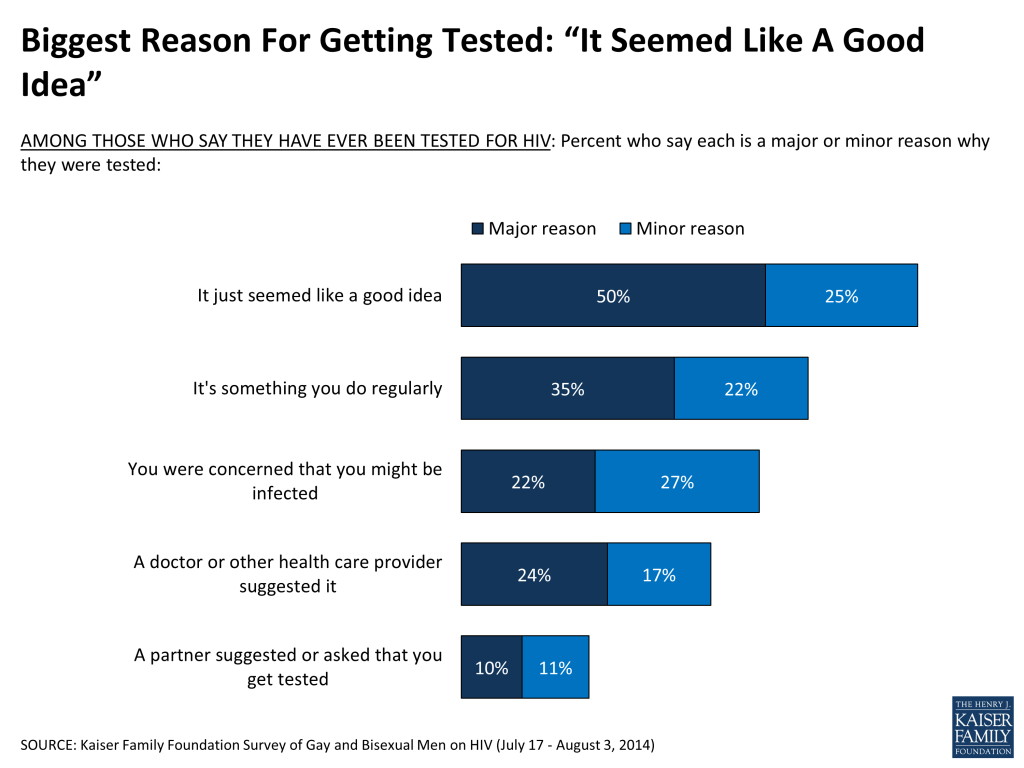
Among gay and bisexual men who have been tested for HIV, the most common reason they say they decided to do so was “it just seemed like a good idea” (50 percent say this is a major reason), followed by “it’s something you do regularly” (35 percent), having a test suggested by a doctor (24 percent), being concerned about being infected (22 percent), and a suggestion or request from partner that they get tested (10 percent).

Among those who have been tested, six in ten (60 percent) say their most recent test was conducted as part of another health visit such as a regular check-up, while a third (33 percent) say they went to a doctor or clinic specifically to get an HIV test.

Figure 23

Lack Of Communication With Doctors As A Barrier To Testing And Care

Doctors play an important role in getting people tested for HIV and getting them into treatment, yet more than half of gay and bisexual men (56 percent) say that no doctor or health care provider has ever suggested they get tested. While three in ten (30 percent) say they discuss the topic of HIV at least “some of the time” when they visit a doctor, six in ten (61 percent) say they “rarely” or “never” discuss the topic with any health care provider.

Figure 24

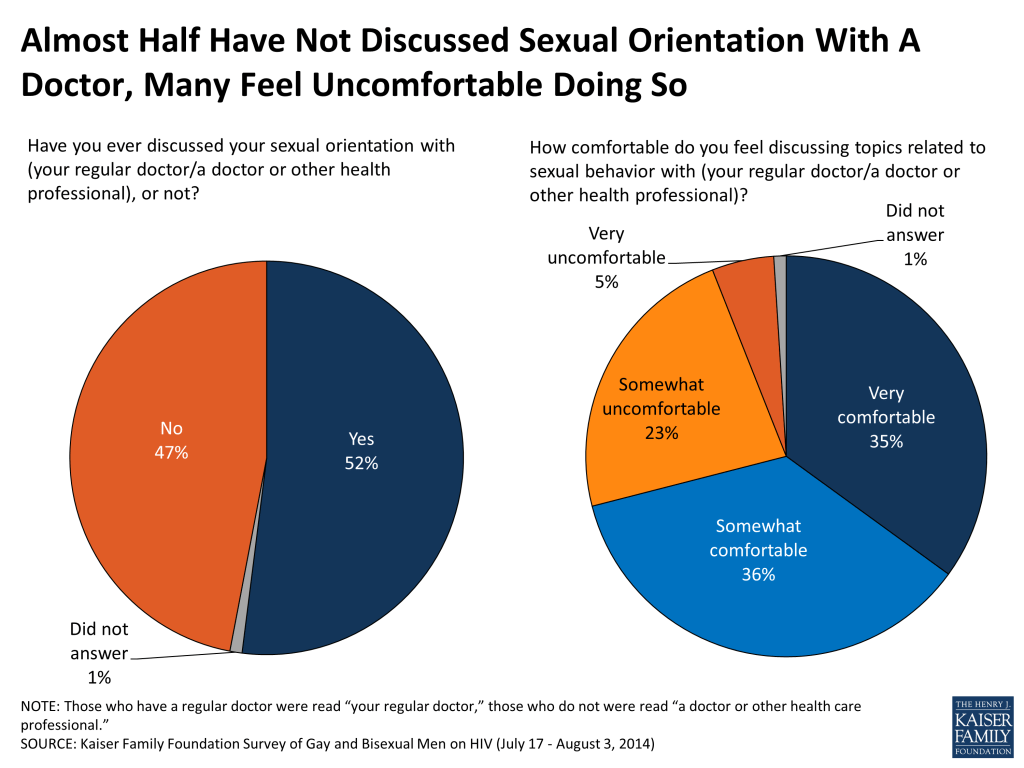
Lack of open communication with doctors may be a barrier to more gay and bisexual men getting the health care they need, including HIV testing. Almost half (47 percent) say they’ve never discussed their sexual orientation with a doctor or other health care professional. While most (71 percent) say they feel “very” or “somewhat” comfortable discussing topics related to sexual behavior with their doctor, almost three in ten (28 percent) say they feel uncomfortable doing so. As noted above, 15 percent say that they’ve received poor treatment from a health care professional at some point because of their sexual orientation.

Bisexual men are even less likely to report openly communicating with their doctors about HIV and sexual behavior: 67 percent say they’ve never discussed their sexual orientation with a health professional, 45 percent say they feel uncomfortable discussing sexual behavior with their doctor, 77 percent say they rarely or never talk about HIV with doctors, and 72 percent say no health care provider has ever suggested they be tested for HIV.

Figure 25

Lack of access to health care providers may also be a barrier to more frequent HIV testing and health care for some gay and bisexual men. Three in ten (31 percent) either say they don’t have a regular place to go for medical care or that they don’t have a regular physician, and these men (who tend to be younger, lower-income, and more racially diverse) are less likely to report discussing HIV with doctors, and less likely to report getting tested.

Figure 26

Key Findings: Section 5: Information And The Role Of Different Groups

Interest In Getting More Information About HIV

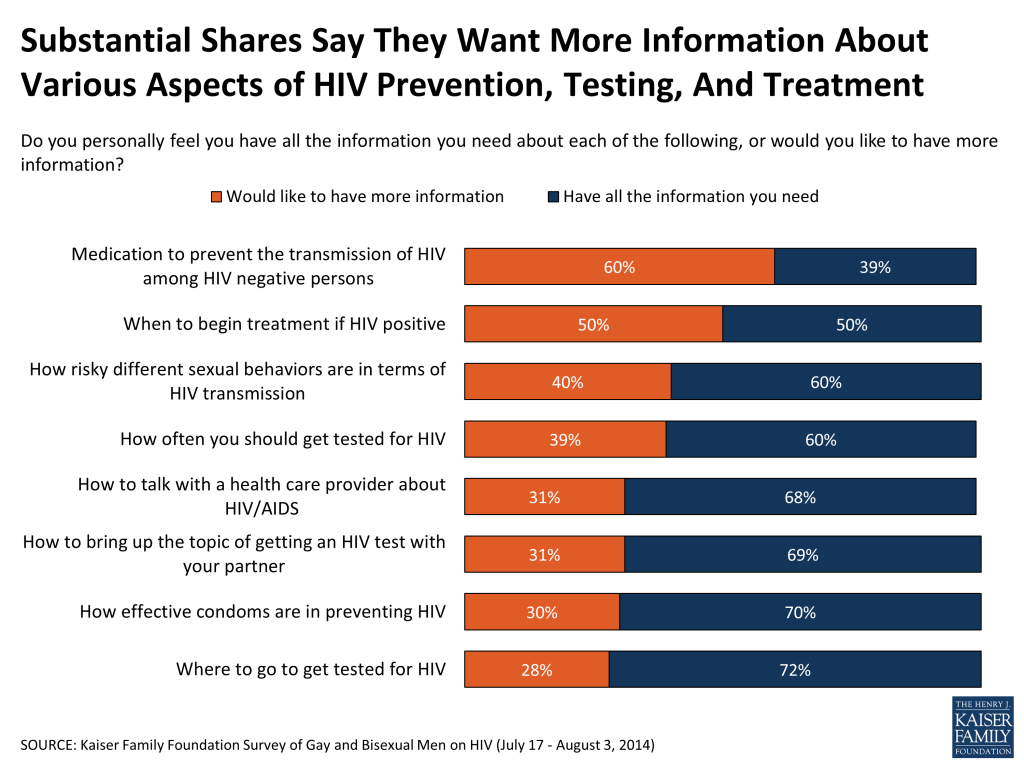
While many gay and bisexual men say they “have all the information they need” about various aspects of HIV prevention, testing, and treatment, substantial shares say they would like to know more. At the top of the list, six in ten (60 percent) would like to have more information about medication to prevent the transmission of HIV among HIV-negative persons, and half (50 percent) say they’d like to know more about how soon to begin treatment after testing positive. About four in ten say they’d like more information about the relative risk of different sexual behaviors (40 percent) and how often to get tested (39 percent), while about three in ten want to know more about how to bring up the topic of testing with a partner (31 percent), how to talk with health care providers about HIV (31 percent), the effectiveness of condoms (30 percent), and where to go to get tested (28 percent).

Figure 27

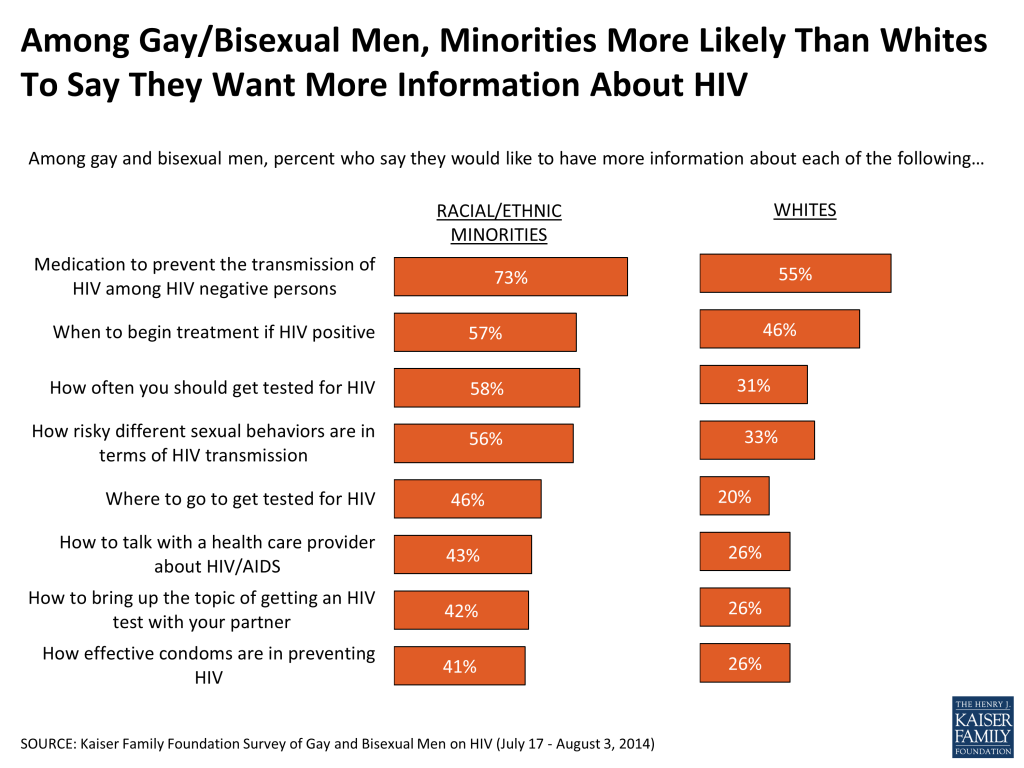
Gay and bisexual men who are members of racial and ethnic minority groups are more likely than their white counterparts to say they’d like to have more information in most of these areas. For example, 58 percent of minorities versus 31 percent of whites say they want more information about how often to get tested, and 46 percent of minorities versus 20 percent of whites want to know more about where to go to get an HIV test. These results are consistent with earlier Kaiser Family Foundation surveys of the general public, which found that African Americans and Hispanics were more likely than whites to report a desire for more HIV-related information.25 

Figure 28

Perceptions Of Progress And Who Is Doing Enough To Combat HIV

Nearly two-thirds (64 percent) of gay and bisexual men say the U.S. is making progress when it comes to the impact of HIV in the country today, higher than the share of the general public who say the same (40 percent). A majority (58 percent) of gay and bisexual men also believe the U.S. is making progress in regards to the impact of HIV on gay and bisexual men specifically, while 28 percent feel the problem is about the same as it has been and 13 percent say the U.S. is losing ground.

Figure 29

There is a general consensus among gay and bisexual men that various groups are not doing enough to address the problem of HIV in the U.S., including Congress (74 percent say they’re not doing enough), public schools (68 percent), pharmaceutical companies (62 percent), the media (59 percent), President Obama and his administration (55 percent), religious leaders and institutions (52 percent) and businesses that target gay consumers (51 percent).

In contrast to these other institutions, 71 percent of gay and bisexual men feel that LGBT organizations are doing enough to address the problem of HIV. And as noted above, relatively few (17 percent) say lack of focus on HIV by LGBT organizations is a major reason why it has been difficult to slow the spread of HIV among gay men. Still, some would like to see more focus on HIV by gay community leaders. While a majority (56 percent) of gay and bisexual men say gay leaders are paying the right amount of attention to the issue of HIV relative to other issues, about a third (34 percent) say they’re paying too little attention.

Figure 30

Despite a general sense that LGBT organizations are doing enough to address the problem of HIV/AIDS in the U.S., few gay and bisexual men say that they’ve personally gotten a lot of information about the disease from these organizations – or from any other source – in the past year.

The most commonly reported source of information on HIV/AIDS is the Internet (45 percent say they have gotten at least “some” information from this source in the past year), followed by LGBT media (35 percent), HIV/AIDS organizations (33 percent), LGBT community organizations (30 percent), doctors and other health professionals (29 percent), mainstream media (22 percent), and friends and family (13 percent).

Figure 31

Key Findings: Section 6: Some Key Characteristics Of Gay And Bisexual Men

In addition to their opinions and experiences related to HIV/AIDS, this survey allows us to provide some basic demographic information about gay and bisexual men. Overall, seven in ten (70 percent) call themselves gay and three in ten (30 percent) think of themselves as bisexual. One in five (20 percent) say they are married, including a much higher percentage of bisexual men (42 percent) compared with gay men (10 percent). Including those who are married, in a civil union, or living with a partner, about half (53 percent) say they are in a committed relationship (including similar shares of those who identify as gay and those who identify as bisexual). Twelve percent live in a household with at least one child under the age of 18. Just 13 percent say they live in an area known for being an LGBT neighborhood, while the vast majority (86 percent) say they do not.

When it comes to health care, the large majority (82 percent) say they are covered by some form of health insurance, most commonly from an employer or labor union (52 percent), followed by Medicare (16 percent), Medicaid (11 percent), plans purchased on their own outside the new health insurance marketplace (6 percent), and plans purchased from the new marketplace (4 percent). Thirteen percent say they do not have any form of health insurance.

Nearly eight in ten (78 percent) say they have a regular place to go for health care, most commonly a doctor’s office or HMO (54 percent) or a general clinic or health center (14 percent). However, as noted above, three in ten either have no usual source of care (22 percent) or do not have a regular personal doctor at the place they usually seek care (9 percent).

When it comes to politics, over three-quarters (77 percent) of gay and bisexual men say they are registered to vote at their present address, and the vast majority identify as a Democrat (56 percent) or a Democratic-leaning independent (23 percent). Just 9 percent call themselves Republicans and 8 percent are independents who lean toward the Republican Party. Ideologically, two-thirds (67 percent) call themselves liberal, while 20 percent say they are moderate and 12 percent say they are conservative. Over four in ten (42 percent) report no religious affiliation. The most commonly reported religious affiliations are Catholic (17 percent), Protestant – including Methodist, Lutheran, Presbyterian and Episcopal (15 percent), Baptist (8 percent), and other Christian denominations (7 percent).

Survey Methodology

The Kaiser Family Foundation Survey of Gay and Bisexual Men on HIV was designed and analyzed by researchers at the Kaiser Family Foundation (KFF), and was conducted July 17-August 3, 2014, among a nationally representative sample of 431 men ages 18 and older who self-identified as gay or bisexual. The survey was funded by M·A·C AIDS Fund. Interviews were conducted in English and Spanish using GfK’s KnowledgePanel, an online research panel. KnowledgePanel members are recruited through probability sampling methods and include both those with internet access and those without (KnowledgePanel provides internet access for those who do not have it and, if needed, a device to access the internet when they join the panel). A combination of random digit dialing (RDD) and address-based sampling (ABS) methodologies have been used to recruit panel members (in 2009 KnowledgePanel switched its sampling methodology for recruiting panel members from RDD to ABS). The panel comprises households with landlines and cellular phones, including those with only cell phones, and those without a phone. Both the RDD and ABS samples were provided by Marketing Systems Group (MSG). KnowledgePanel continually recruits new panel members throughout the year to offset panel attrition as people leave the panel.

Panel members complete an annual profile survey that includes a range of demographic, attitudinal and behavioral questions, including questions about sexual orientation. Men who identified as gay or bisexual on the profile survey were eligible for the KFF survey sample and were sent an invitation to complete the survey. Respondents were asked to reconfirm their sexual orientation using the following question: Do you consider yourself to be 1) Heterosexual or straight, 2) Gay, 3) Bisexual, 4) Other? Men who had previously identified as gay or bisexual but selected something other than one of these options in the screening interview were asked: In an earlier survey, you identified as gay/bisexual. Do you still consider yourself to be gay/bisexual, or not? The vast majority of respondents in the final sample (97 percent) re-confirmed their identity as gay or bisexual on the first question, and 3 percent reconfirmed on the second question. Respondents who did not reconfirm as gay or bisexual on either question were thanked for their time and told that the interview was over.

The survey data were weighted to be representative of gay and bisexual men nationwide. Weighting took place in several stages. First, all members of the panel carry a weight designed to produce a nationally representative sample of the U.S. adult population. This weight matches gender, age, race/ethnicity, education, region, household income, homeownership status, metropolitan area, and Internet access to parameters from the March 2013 Supplement of the Census Bureau’s Current Population Survey (CPS).26 

In the second stage, the sample of gay and bisexual men was weighted to match known national parameters where available, and to match the full sample of panel members who identify as gay and bisexual men on characteristics for which no national parameters are available. The sample was weighted using an iterative technique to match age, race/ethnicity, region, and education to parameters for gay and bisexual men from the 2013 National Health Interview Survey (NHIS), and to match primary language, Internet access, metropolitan area, and household income to targets derived from the weighted sample of all gay and bisexual men in the panel.

Margins of sampling error and tests of statistical significance take into account the effect of weighting at each of these stages. The margin of sampling error including the design effect for the full sample of 431 gay and bisexual men is plus or minus 7 percentage points. Numbers of respondents and margin of sampling error for key subgroups are shown in the table below. For results based on other subgroups, the margin of sampling error may be higher. Sample sizes and margin of sampling errors for other subgroups are available by request. Note that sampling error is only one of many potential sources of error in this or any other public opinion poll.

GroupN (unweighted)M.O.S.E.
Total gay and bisexual men431±7 percentage points
Gay299±8 percentage points
Bisexual132±12 percentage points
Racial/ethnic minorities142±12 percentage points
Whites289±8 percentage points
Ages 18-34101±12 percentage points
Ages 35 and over330±8 percentage points

Some of the same questions that were asked on the Survey of Gay and Bisexual Men on HIV were also asked of the general public as part of the July 2014 Kaiser Health Tracking Poll, a nationally representative telephone survey. More detail on that survey’s methodology, along with the full question wording and results, are available at https://www.kff.org/wp-content/uploads/2014/08/8618-t.pdf.


Endnotes

  1. KFF analysis of CDC data. ↩︎
  2. KFF analysis of CDC data. ↩︎
  3. CDC, HIV Testing Among Men Who Have Sex with Men — 21 Cities, United States, 2008, MMWR, Volume 60(21), June 2011. ↩︎
  4. CDC, Estimated HIV Incidence in the United States, 2007-2010. http://www.cdc.gov/hiv/pdf/statistics_hssr_vol_17_no_4.pdf ↩︎
  5. National Institutes of Health, Treating HIV-infected People with Antiretrovirals Protects Partners from Infection, May 12, 2011. http://www.niaid.nih.gov/news/newsreleases/2011/pages/hptn052.aspx ↩︎
  6. U.S. Food and Drug Administration news release, July 16, 2012. http://www.fda.gov/newsevents/newsroom/pressannouncements/ucm312210.htm ↩︎
  7. This analysis excludes those who selected “not applicable” for each item (4 percent for friends, 33 percent for casual sexual partners, 21 percent for long-term sexual partners). ↩︎
  8. This analysis excludes the 10 percent who self-identify as HIV-positive. ↩︎
  9. This analysis excludes the 16 percent who selected “not applicable” for the question about condom use. ↩︎
  10. This analysis excludes the 10 percent who self-identify as HIV-positive. ↩︎
  11. CDC, Estimated HIV Incidence in the United States, 2007-2010. http://www.cdc.gov/hiv/pdf/statistics_hssr_vol_17_no_4.pdf ↩︎
  12. Note that the sample size of the survey of gay and bisexual men does not allow us to break out the responses for African Americans specifically. ↩︎
  13. Throughout this report, comparison data for the general public and Black Americans (another group at high risk for HIV infection) come from KFF’s July Health Tracking Poll, a monthly nationally-representative telephone survey. Full results of that survey are available at https://modern.kff.org/wp-content/uploads/2014/08/8618-t.pdf ↩︎
  14. KFF analysis of CDC data. ↩︎
  15. CDC, HIV Testing Among Men Who Have Sex with Men — 21 Cities, United States, 2008, MMWR, Volume 60(21), June 2011. ↩︎
  16. CDC, Monitoring Selected National HIV Prevention and Care Objectives by Using HIV Surveillance Data—United States and 6 Dependent Areas—2011, HIV Surveillance Supplemental Report, Volume 18(5), October 2013. http://www.cdc.gov/hiv/pdf/2011_Monitoring_HIV_Indicators_HSSR_FINAL.pdf ↩︎
  17. Department of Health and Human Services, Guidelines for the Use of Antiretroviral Agents in HIV-1-Infected Adults and Adolescents/Initiating Antiretroviral Therapy in Treatment-Naive Patients, May 1, 2014. http://aidsinfo.nih.gov/guidelines/html/1/adult-and-adolescent-arv-guidelines/10/initiating-art-in-treatment-na%C3%AFve-patients ↩︎
  18. National Institutes of Health, Treating HIV-infected People with Antiretrovirals Protects Partners from Infection, May 12, 2011 http://www.niaid.nih.gov/news/newsreleases/2011/pages/hptn052.aspx ↩︎
  19. This analysis excludes those who selected “not applicable” for each item (4 percent for friends, 7 percent for family, 21 percent for long-term sexual partners, 33 percent for casual sexual partners). ↩︎
  20. This analysis excludes the 26 percent who selected “not applicable” for this question. ↩︎
  21. CDC, Condoms and STDs: Fact Sheet for Public Health Personnel. http://www.cdc.gov/condomeffectiveness/latex.htm ↩︎
  22. This analysis excludes the 16 percent who selected “Not applicable” for this question. ↩︎
  23. CDC, HIV Among Gay and Bisexual Men. http://www.cdc.gov/hiv/risk/gender/msm/facts/index.html ↩︎
  24. This analysis excludes the 10 percent who self-identify as HIV-positive. ↩︎
  25. Kaiser Family Foundation, HIV/AIDS at 30: A Public Opinion Perspective, June 1, 2011.  https://modern.kff.org/hivaids/report/hivaids-at-30-a-public-opinion-perspective/ ↩︎
  26. Details about KnowledgePanel sampling, recruitment, and weighting methodology, including details about how design weights are calculated, is available at http://www.knowledgenetworks.com/knpanel/docs/knowledgepanel(R)-design-summary-description.pdf ↩︎
News Release

Gay and Bisexual Men See HIV as the Top Health Issue Facing Their Community, But Majorities Are Not Personally Worried About Getting Infected & Not Getting Tested Regularly  

Published: Sep 25, 2014

Most Are Unaware of New Prevention Options, Such as PrEP, or Current Treatment Recommendations

MENLO PARK, CA – More than thirty years into the HIV/AIDS epidemic, and at a time when infections among gay and bisexual men are on the rise in the U.S., a new national survey of gay and bisexual men by the Kaiser Family Foundation (KFF) finds that though HIV/AIDS is named as the number one health issue facing their population, a majority (56%) are not personally concerned about becoming infected, and relatively few report having been tested recently.

Only three in 10 (30%) gay and bisexual men say they were tested for HIV within the last year, including 19 percent who report being tested within the last six months (these figures exclude the 10% who self-identify as HIV-positive). Gay and bisexual men under the age of 35 are twice as likely as those who are older to report never having been tested for HIV (44% vs. 21%). The CDC recommends at least annual HIV testing for this population with more frequent testing advised by many health departments.

Only about a quarter (26%) know about PrEP (pre-exposure prophylaxis), a daily pill that people who are HIV-negative can take to lower their risk of becoming infected. Eight in 10 (80%) say they have heard “only a little” or “nothing at all” about the new prevention option.

Fewer than half (46%) of gay and bisexual men are aware that the current guidelines for people with HIV are to start antiretroviral (ARV) treatment as soon as they are diagnosed, and only a quarter (25%) know about treatment as prevention. (Research shows that taking consistent ARV treatment can reduce the risk of passing HIV on to others by as much as 96 percent.)

More than half (56%) say that a doctor has never recommended they get tested for HIV, and six in 10 (61%) say they rarely or never discuss HIV when they visit their doctor.

“These survey results underscore the importance of getting the word out among gay and bisexual men about risk and new treatment and prevention options,” said Kaiser Family Foundation President and CEO Drew Altman, Ph.D.

Just a third (32%) realize that new infections are on the rise among gay and bisexual men. One in four (22%) think the number is decreasing and the rest either think the situation is staying the same or acknowledge that they don’t know.

Reflecting the disproportionate impact of HIV in communities of color, gay and bisexual men who are members of racial and ethnic minority groups are more likely to say that HIV/AIDS is a significant issue for them personally than white gay men (64% versus 42%) and to say that they are personally concerned about becoming infected (53% versus 28%).

Overall, three quarters (75%) say that gay and bisexual men not knowing their HIV status is a major reason it has been hard to control the spread of HIV among this group. Complacency about HIV in the gay community (62%) and HIV-related stigma (56 percent) are also named by majorities as major factors.

Many say HIV is not a topic that comes up often, if all, even with those closest to them. Three quarters (68%) say they “rarely” or “never” discuss HIV with friends, and large shares report not talking much about the disease with casual sexual partners (50%) or with long-term partners (60%).

While most gay and bisexual men (76%) say they are comfortable having non-sexual relationships with HIV-positive persons, large majorities say they would be uncomfortable with more intimate relationships, including being in a long-term sexual relationship (66%) and having casual sex (77%) with someone who is HIV-positive.  Gay and bisexual men under the age of 35 are more likely to say they would be uncomfortable having relationships, sexual or otherwise, with someone who is HIV-positive. Nearly two in five (37%) gay and bisexual men who did not identify as HIV-positive themselves say they have decided not to pursue a sexual relationship specifically because the person was HIV-positive.

Just over half (53%) report being in a committed relationship, including one in five (20%) who say they are married. Twelve percent live in a household with at least one child under the age of 18.

Gay and bisexual men under the age of 35 are less likely to report personal connections to HIV than those who are older.  Nearly half (47%) of gay and bisexual men 35 and older say they have lost someone close to them to the disease, compared to only 8 percent of those who are younger. Overall, half (49%) of gay and bisexual men say they personally know someone living with HIV and one in three (32 percent) have had someone close to them who has died.

THE CURRENT STATE OF THE EPIDEMIC AMONG GAY MEN IN THE U.S.  According to U.S. Centers for Disease Control and Prevention (CDC),  one in five gay men in 20 major cities is estimated to be HIV positive with about one third not knowing they are positive. KFF estimates, based on CDC data, are that 12-13 percent of gay men are HIV positive. There is evidence that the situation is worsening. Between 2008-2010, CDC reports new infections rose 12 percent overall among gay men, and 22 percent among younger gay men, driven by increases among men of color.

Methodology

The survey was designed and analyzed by researchers at the Kaiser Family Foundation and funded by  M·A·C AIDS Fund.  It was conducted from July 17-August 3 among a sample of 431 men ages 18 and older who self-identified as gay or bisexual. Interviews were conducted in English and Spanish using GfK’s KnowledgePanel, a nationally representative, probability-based online research panel. The margin of sampling error is plus or minus 7 percentage points for the full sample. For results based on subgroups, the margin of sampling error is higher.

Behind the Increase in HIV Infections Among Gay and Bisexual Men

Published: Sep 25, 2014

This was published as a Wall Street Journal Think Tank column on September 25, 2014.

Gay and bisexual men represent an estimated 2% of the U.S. population but more than half of all people living with HIV and 66% of new HIV infections. They are the only population group in the United States for which HIV infections are rising. Projections have shown that if current trends continue, half of all gay and bisexual men will be HIV-positive by age 50.

So it’s a major concern that, according to a Kaiser Family Foundation survey published Thursday, only a third of gay and bisexual men know that infections are increasing among this group. Only a quarter know that if someone who is HIV-positive is taking HIV antiretroviral treatment, his risk of passing on the virus is significantly reduced. The Centers for Disease Control and Prevention recommends testing every three to six months for sexually active gay and bisexual men; many state health departments do as well. But almost a third of gay and bisexual men have never been tested for HIV, and another third were tested more than a year ago. More than half don’t know about pre-exposure prophylaxis (PrEP)–a pill that HIV-negative men can take to prevent infection that is about 90% effective when taken every day.

Discrimination and stigma are still barriers to spreading the word about testing and new treatments among gay and bisexual men, and there is no one-size-fits-all approach for such a broad, diverse community that encompasses 40-year-old white men in San Francisco and teenage African American high-school students just coming out in, say, Texas. There has also been discussion about how widely PrEP should be used by HIV-negative gay and bisexual men.

The message about PrEP is almost certainly best spread in the context of a comprehensive approach to prevention and treatment. One attempt to do this right is Speak Out, part of the national Greater Than AIDS campaign–that the Kaiser Family Foundation has helped to lead–that focuses on groups at greatest risk of HIV infection. Whatever the approach, there is no question that the problem of HIV among gay and bisexual men remains urgent–and under the radar.

News Release

How Workers and Employers Diverge on Wellness Programs 

Published: Sep 24, 2014

In his latest column for The Wall Street Journal’s Think Tank, Drew Altman examines employer attitudes and the evidence on wellness programs, and what the prospects for wellness programs are long term.

All previous columns by Drew Altman are available online.

News Release

Sept. 30 Web Briefing for Media: The Response to the Ebola Outbreak in West Africa

Published: Sep 23, 2014

President Obama recently announced an increased effort by the United States to respond to the spread of Ebola in West Africa as the scale of the outbreak continues to grow. What has the global response been so far? How has the United States contributed? What will the response be going forward in the coming weeks and months? What key lessons can be learned from this outbreak, and what can be learned by comparing the outbreak to other large-scale disasters?

On Sept. 30 at 3 p.m. ET, the Kaiser Family Foundation will hold an interactive web briefing exclusively for journalists to examine these questions.

Steve Monroe, deputy director of the National Center for Emerging and Zoonotic Infectious Diseases at the U.S. Centers for Disease Controls and Prevention; Sophie Delaunay, executive director of Doctors Without Borders/Médecins Sans Frontières; Jen Kates, Kaiser Family Foundation vice president and director of global health and HIV policy; and Josh Michaud, Foundation associate director of global health policy will provide insights and answer questions. Penny Duckham, executive director of the Foundation’s Media Fellowships Program, will moderate, and the majority of the web briefing will be devoted to a question-and-answer session with journalists.