KFF designs, conducts and analyzes original public opinion and survey research on Americans’ attitudes, knowledge, and experiences with the health care system to help amplify the public’s voice in major national debates.
In his latest column for The Wall Street Journal‘s Think Tank, Drew Altman explores how price is the major factor that distinguishes the cost of our health care system from those in other developed nations, yet most efforts in the U.S. to address health-care costs don’t focus on price much at all.
All previous columns by Drew Altman are available online.
In this new policy insight, Kaiser Family Foundation Senior Fellow Karen Pollitz explores how high cost sharing in health insurance plans can contribute to an individual’s medical debt, and explains how greater transparency in plan details could help consumers avoid some financial pitfalls. Medical Debt Among Insured Consumers: The Role of Cost Sharing, Transparency, and Consumer Assistance also provides an update on provisions of the Affordable Care Act meant to increase health plan transparency and bolster consumer assistance.
A recent report issued by the Consumer Financial Protection Bureau (CFPB) finds that medical debts account for a majority (52%) of debt collections actions that appear on consumer credit reports. This report offers yet another reminder that a broader view of health insurance – not just at how many have coverage, but also the effectiveness of coverage – is warranted. An earlier Kaiser Family Foundation report found that 1 in 3 Americans struggle to pay medical bills, and that 70% who do so are insured.
The CFPB report confirms that medical debt frequently occurs among people with no other history of credit problems. When it does, it can have serious and long range financial consequences. Referral of medical debts to collections damages a person’s credit rating significantly and for many years, limiting access to mortgages, car loans, and other consumer credit. Health consequences are also possible; as the Kaiser report observed, once in debt, people may delay or forego other needed care to avoid incurring further unaffordable medical bills.
Medical debt and high cost sharing
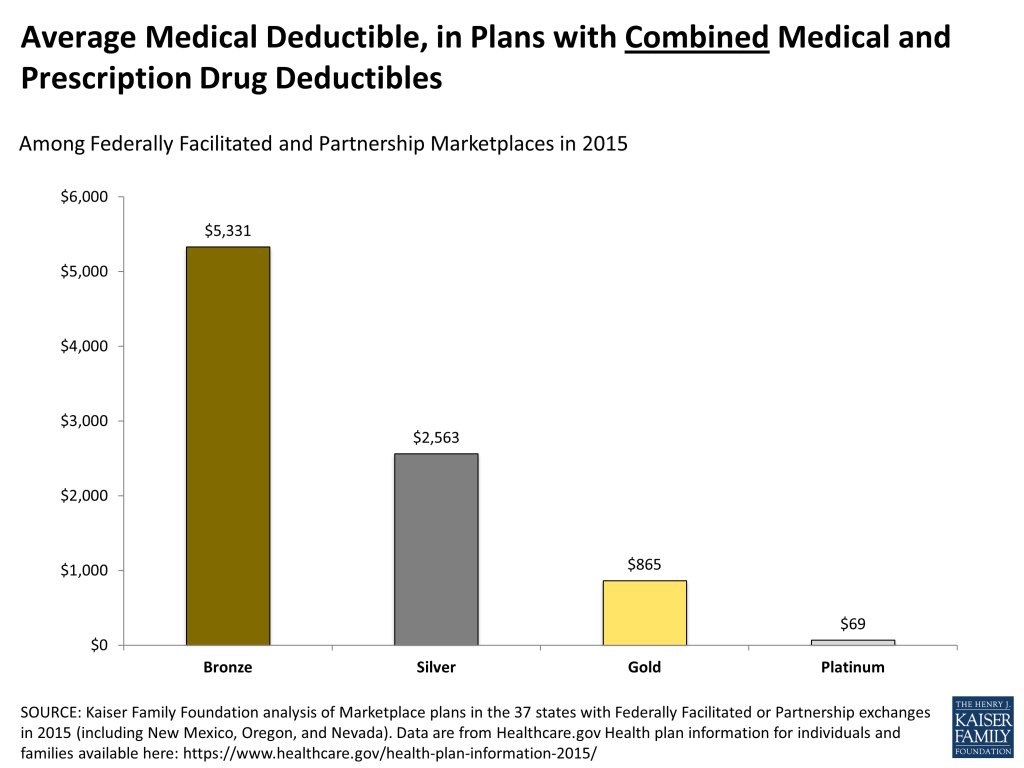
How is it that medical debt can be so prevalent among the insured? The Kaiser report observed that cost sharing is one primary contributor. Cost sharing levels under many health plans now exceed the resources that most families have on hand. In its most recent report on the economic well-being of US households, the Federal Reserve found that only 48 percent of Americans would be able to completely cover a hypothetical emergency expense costing $400 without selling something or borrowing money. Unforeseen medical expenses could trigger such an emergency – though under most health plans today, consumer’s cost liability could be much greater than $400. The average annual deductible – the amount a patient must pay out of pocket before health insurance reimbursement begins – under job-based health plans exceeded $1,200 for an individual in 2014. For non-group health plans sold on new health insurance marketplaces, deductibles are even higher. For silver plans (the most popular plan type in 2014) offered in federally administered marketplaces, the average annual medical deductible in 2015 is $2,563 for plans with a combined medical/prescription drug deductible; in silver plans with separate medical and drug deductibles, the average annual medical deductible is $3,456. (In the 37 federally facilitated and partnership marketplaces in 2015, 55% of silver plans feature a combined annual deductible while 45% of silver plans apply separate annual deductibles for medical and prescription drug expenses.) For less expensive bronze plans, the average annual deductible exceeds $5,300 in 2015. Some policymakers have discussed the option of making available so-called copper plans, which would have even higher cost sharing. Under the ACA, cost sharing subsidies are available to low income consumers up to 250% of the federal poverty level.
Average Medical Deductible, in Plans with Combined Medical and Prescription Drug DeductiblesAverage Medical Deductible, in Plans with Separate Medical and Prescription Drug Deductibles
Out of pocket medical spending can exceed the amount of the deductible in a year for insured consumers who have a major health event, such as surgery. Additional copays and coinsurance can apply after the deductible, up to an annual out-of-pocket limit. That limit was $6,350 ($12,700 for family coverage) in 2014, increased to $6,600/$13,200 in 2015 and proposed to increase to $6,850/$13,700 in 2016. This limit applies to all non-grandfathered health plans, including those offered by employers. However, guidance issued earlier this year by the U.S. Department of Labor suggested that employers may have flexibility to define which covered benefits are subject to the out of pocket limit, leaving consumer cost sharing for other covered, in-network benefits to apply without limit.
The Kaiser report noted other reasons why insured consumers accrue medical debt, including receipt of care from providers outside the health plan network. The ACA sets network adequacy requirements for Marketplace plans.
Medical debt and complexity/lack of transparency
The CFPB report also noted that the problem of medical debt and collections may be exacerbated by complexity and lack of transparency:
“In particular, the complexity of medical billing and the third-party reimbursement processes faced by most patients and their families is a potential source of confusion or misunderstanding between patient, medical provider, and insurer. That complexity could lead some consumers to be unaware of when, to whom, or for what amount they owe a medical bill or even whether payment was the responsibility of the consumer rather than an insurance company.”
A recurring theme observed in the Kaiser report was that consumers were often surprised to learn how much they owed for care they thought would be covered by insurance.
The ACA provides for development of new tools to make health insurance coverage more understandable and transparent for consumers. One such tool is the summary of benefits and coverage (SBC) – a short, standardized summary of what a health plan covers and how cost sharing applies to each major benefit. All non-grandfathered health plans are required to provide an SBC to all enrollees and make it available to prospective enrollees. The SBC is to be written in plain language with no fine print. It must also include standardized scenarios to illustrate how the plan would cover common medical events and what out of pocket expenses might be left for consumers. By comparing these “coverage illustrations,” consumers can discern differences in the relative comprehensiveness of coverage under plan choices. A 2011 Kaiser survey found the SBC to be the single most popular provision under the ACA. To date, however, implementation of this requirement has been incomplete. Insurers are currently required to provide only two of the six coverage illustrations provided for under the implementing regulation; a recent proposed amendment to the regulation would add a third illustration. In addition, to generate SBC coverage illustrations, insurers and health plans have been permitted to use a short cut calculator that doesn’t take into account potentially important plan features (such as brand vs. generic cost sharing differences) that could impact a patient’s relative cost sharing responsibility under different plans. An analysis of the calculator’s results observed that over-simplifying the process can mask important plan differences for consumers and cloud transparency. Initially insurers were allowed to use the short cut for one year, but that flexibility has since been extended indefinitely.
Initial regulations to implement new appeal rights under the ACA also established new standards for the explanation of benefits (EOB) statement that summarizes what claims have been paid or denied. The initial regulation required that specific information about each claim, including billing codes, should be included to help consumers identify the service in question. An amendment to the appeals regulation subsequently removed this requirement in favor of a more general claims description.
The ACA also requires other transparency reporting by all non-grandfathered health plans, including those sponsored by employers. Plans are to periodically report data on enrollment, disenrollment, claims payment practices, claims denials, out of network claims and associated consumer expenses, and any other information deemed appropriate by the Secretary. Data are to be used to facilitate oversight and enforcement and to develop plan rating tools to inform consumers. This broad data reporting authority could also be used to make billing and payment practices more transparent. To date, implementation of this ACA transparency provision has not been initiated.
Medical Debt and Consumer Assistance
Finally, the Kaiser report observed how consumers can be confused and overwhelmed by jargon and the sheer volume of medical bills and insurance statements, particularly when they are sick. The ACA authorizes funding for ombudsman or consumer assistance programs (CAPs) to be established in each state. CAPs are required to serve all state residents – those in group health plans, non-group plans, and the uninsured. CAPs are to help consumers answer questions about their coverage, resolve disputes, and file appeals. CAPs also are to help consumers explore coverage options for which they are eligible and apply for subsidies. And, CAPs are to collect data on consumer experiences with health plans and report it to the Secretary who, in turn, is to use CAP data to inform oversight and strengthen enforcement. During the first year of implementation (2010-2011), 38 state CAPs provided assistance to more than 200,000 individuals and helped them recover more than $18 million in benefit payment. Since then, no new CAP appropriations have been legislated and the number of active programs has declined. Insurers and group health plans are required by the ACA to include notice about CAP assistance on all denial letters. Group plans must provide such notice to participants living in states listed on a DOL web site.
Conclusion
Increasing deductibles and other cost sharing have helped to make insurance premiums more affordable, but the flip side has been to expose even people with insurance to risk of medical debt. When cost-sharing under health insurance exceeds the ability of consumers to pay their medical bills, cases of health-related bankruptcy and credit problems are inevitable. Greater transparency in the details of health insurance plans cannot eliminate medical debt, but they can help consumers distinguish plan differences to make more informed choices and to plan ahead financially. Greater transparency, as well as consumer assistance, can also help consumers use their coverage more effectively and resolve billing questions and disputes when they arise.
In December 2014, Utah released more details for a proposal for a Section 1115 demonstration, Healthy Utah, to implement the Affordable Care Act’s (ACA) Medicaid expansion. To be implemented, this proposal would need to be officially submitted to CMS (and subject to state and federal comment periods). The proposal would also require approval by the Utah state legislature; however, in mid-December the Legislature’s Health Reform Task Force chose not to recommend the Governor’s plan to the full Legislature. Instead, the Task Force proposed more limited coverage alternatives, but these proposals do not preclude the Governor’s plan from being approved by the legislature.1
The demonstration would cover childless adults with incomes from 0-138% of the federal poverty level (FPL, up to $16,105 per year for an individual in 2014) and parents with incomes from 50-138% FPL ages 19 to 64 in Utah – an estimated 95,000 beneficiaries in FY 2016 and up to 140,000 in FY 2019.2 If implemented on January 1, 2016, the waiver would:
Expand Medicaid coverage to newly eligible adults primarily by using Medicaid funds as premium assistance for Marketplace Qualified Health Plan (QHP) coverage.3 Newly eligible adults with access to employer-sponsored insurance (ESI) would receive premium assistance for ESI.
Provide wrap-around coverage for Medicaid benefits not offered through QHPs, except Utah seeks a waiver of the federal requirement to provide non-emergency medical transportation in demonstration year one.
Require monthly premiums up to 2% of income for newly eligible adults from 100-138% FPL. These beneficiaries could opt to participate in a pilot program that offers lower monthly premiums and a $50 copayment for non-emergent use of the emergency department (ED), which exceeds the $8 maximum copay allowable under federal law. Utah would seek § 1916(f) waiver authority for this copay pilot program.
Require co-payments according to state plan amounts and consistent with federal law for all newly eligible beneficiaries. Maximum cost-sharing, including premiums and copays, would remain capped at 5% of income.
Create a healthy behavior incentive program that would offer referrals for smoking cessation services in demonstration year one. In year 2, the program would mirror the program already established for Utah state employees and offer unspecified incentives to beneficiaries who complete an annual health screening and whose screening indicates they are healthy or who improve in an area of concern.
Allow parents covered through a Marketplace QHP or ESI to elect to have their Medicaid or CHIP eligible children covered in their same plan with the state providing cost-sharing, premium, and benefits wrap-around coverage through Medicaid/CHIP.
While the proposal notes that two-thirds of adults in the expansion group are employed and many of the remaining one-third are medically frail and not able to work, the proposal includes a provision to automatically enroll able-bodied adults in a concurrent work program when newly eligible beneficiaries apply for Medicaid. The work program would include an online assessment and access to training opportunities and job postings. Utah is exploring possible sanctions related to benefits available under other state programs for non-compliance with the work program but is not proposing that work program participation be a condition of Medicaid eligibility and is not seeking federal waiver authority for the work program.
Utah also proposes covering newly eligible beneficiaries from July through December 2015, through its existing Medicaid program. Beneficiaries would then transition to waiver coverage as of January 2016.
CMS has approved Medicaid expansion waivers in four other states (Arkansas, Iowa, Michigan and Pennsylvania).4 Some provisions in these other waivers are similar to several of Utah’s proposals. Specifically, CMS has approved:
using Medicaid as premium assistance and requiring newly eligible beneficiaries to enroll Marketplace QHPs in Arkansas and Iowa;
requiring premiums equal to 2% of income in Michigan and Pennsylvania and $10 per month in Iowa for beneficiaries above 100 to 138% FPL, similar to what those beneficiaries would pay for Marketplace coverage;
offering healthy behavior incentive programs (with protocols subject to CMS approval) in Iowa, Michigan, and Pennsylvania, that enable beneficiaries to reduce premiums or copays by completing specified activities;
waiving, on a limited basis, the requirement to provide non-emergency medical transportation (NEMT). Iowa’s NEMT waiver is limited to year one, after which CMS is to evaluate the impact on beneficiary access to care. Pennsylvania’s NEMT waiver is limited to year one, after which the state must begin providing this service to newly eligible adults.
CMS did not approve waiver authority relating to the work program proposed by Pennsylvania. Indiana and New Hampshire have waiver applications pending with CMS. Arkansas, Iowa and Arizona (states that are currently implementing waiver programs) have waiver amendments pending. Table 1 describes the major elements of Utah’s proposed Section 1115 demonstration.
Would cover approximately 95,000 in FY 2016 and up to 140,000 in FY 2019 newly eligible adults primarily through premium assistance for Marketplace QHPs. Would require premiums for beneficiaries from 100-138% FPL and offer healthy behavior incentives. Seeks approval for one year waiver of non-emergency medical transportation and a pilot program that would offer lower premiums but a higher copay for non-emergency use of the emergency room. Would also allow Medicaid children to join parents on private plans.
Duration:
1/1/16 to 12/31/18–
From July to December 2015, the state would implement a bridge program in which newly eligible adults will be enrolled in modified versions of traditional Medicaid ACOs or other provider arrangements currently in place in Utah. These adults would then transition to Marketplace or ESI premium assistance beginning January 1, 2016.
Coverage Groups:
Covers newly eligible adults ages 19-64: parents from 50-138% FPL and childless adults from 0-138% FPL.–Parents covered through a Marketplace QHP or ESI may elect to have their Medicaid or CHIP eligible children covered in their same plan with the state providing cost-sharing, premium, and benefits wrap-around coverage through Medicaid/CHIP.
Exempt Groups:
Excludes beneficiaries who are already covered under the current Medicaid program, those who are medically frail, refugees, and American Indians/Alaskan Natives. All exempt groups will have the option to enroll in traditional Medicaid or premium assistance under the demonstration. Medically frail beneficiaries will be identified through application questions, a referral form completed by a provider, and claims review.
Premiums:
Individuals from 100-138% FPL will pay approximately 2% of their income towards premiums. Premiums would be $15/month for a single adult and an additional $10/month for each additional family member.–Alternatively, individuals from 100-138% FPL could opt to participate in a pilot program that would offer premiums of $10/month for a single adult, and an additional $5/month for each additional family member but would also include a $50 copay for non-emergent use of the emergency department (ED).
Co-Payments:
All individuals 0-138% FPL will be subject to cost-sharing consistent with state plan amounts and federal law:–Individuals between 0 and 40% FPL would only have co-payments of $8 for non-preferred drugs and non-emergent use of the emergency department.–Individuals between 41 and 100% FPL would have co-payments for most services at nominal or maximum allowable levels under current federal law ($4 for most outpatient services and prescription drugs, $8 for non-preferred drugs and non-emergent use of the ED, and $50 for inpatient hospitalization and behavioral health inpatient admissions).–Individuals from 100-138% FPL would have cost-sharing for most services at amounts allowable under current federal law (generally up to 10% of the agency’s cost of the service). Beneficiaries in this group can choose to participate in a pilot program that offers lower monthly premiums but a $50 copayment for non-emergent use of the emergency department (described above). Individuals that do not choose to participate in the pilot program would have higher monthly premiums and an $8 copay for non-emergency use of the ED, consistent with current federal law.–All cost-sharing (including premiums and co-payments) is limited to 5% of household income.–No copays for preventive services.
Healthy Behavior Incentives and Work Referral:
Beginning in demonstration year 1, smokers will be referred tobacco cessation programs.–Beginning in demonstration year 2, the state is considering offering unspecified incentives to beneficiaries similar to those that are currently offered to Utah state employees: an incentive may be awarded if the beneficiary has an annual screening checking weight, cholesterol, blood pressure, etc. In addition, a second incentive may be offered if the check shows the beneficiary is healthy. Beneficiaries that are not healthy in one area will still be able to earn the second incentive by improving an element of health concern.–Includes a provision to automatically enroll able-bodied adults in a concurrent work program when newly eligible beneficiaries apply for Medicaid (that includes an online assessment and access to training opportunities and job postings). Utah is exploring possible sanctions related to benefits available under other state programs for non-compliance with the work program but is not proposing that work program participation be a condition of Medicaid eligibility and is not seeking federal waiver authority for the work program.
Delivery Systems and Benefits:
Would require enrollment in silver-level Marketplace QHPs or ESI with premium assistance.–State will provide wrap-around coverage for benefits not covered by QHPs or ESI, including EPSDT for 19 and 20 year olds, out-of-network family planning services, and community health center services.–Seeks waiver of non-emergency medical transportation in year 1 for all newly eligible adults.
Financing:
Utah will use savings generated from a previous § 1115 waiver to finance the Healthy Utah waiver as well as some quality improvement efforts. In addition, the state will use savings from state-funded behavioral health and inpatient services for inmates to finance any state costs for the program. The state has also indicated that if costs are higher than the savings achieved under Healthy Utah waiver, it has the option to increase provider assessments.
Next Steps:
State must get state legislative approval, submit proposal for two 30 day public comment periods (state and federal), and federal approval of the waiver.
Newly-eligible adults deemed medically frail will have the option to enroll in the state’s traditional Medicaid program, which provides coverage through Accountable Care Organizations or other provider arrangements. ↩︎
Pennsylvania’s new governor, Tom Wolf, has indicated that he is planning to expand the state’s existing Medicaid program through a State Plan Amendment rather than use the§ 1115 waiver approved in August 2014. ↩︎
In general, people in the United States use the health system less than people in comparable countries, and services in the U.S. are consistently more expensive than in countries of similar size and wealth. This slideshow examines price and utilization of several healthcare services, including magnetic resonance imaging (MRI), caesarian sections, angioplasty surgery and coronary bypass surgery, through data from the International Federation of Health Plans and the Organisation for Economic Co-operation and Development.
The slideshow is part of the Peterson-Kaiser Health System Tracker, an online information hub dedicated to monitoring and assessing the performance of the U.S. health system. More information about the analysis leading to the slideshow is available through the tracker.
Updated Jan. 2015 – Map and tables reflect most recent premium data available.
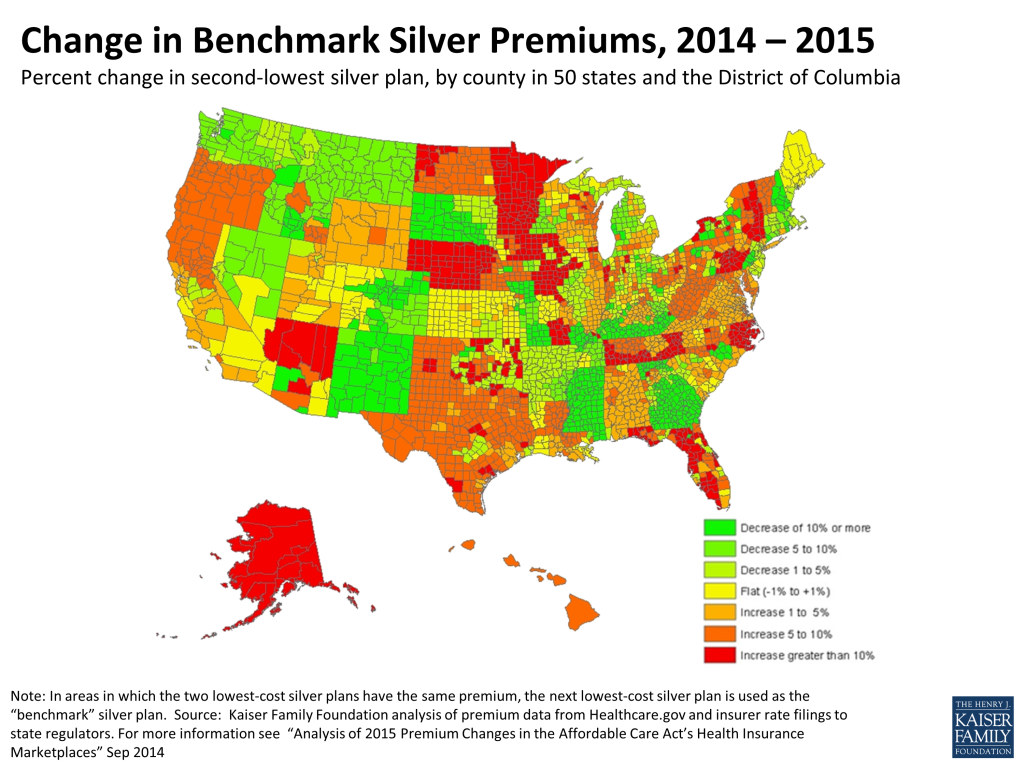
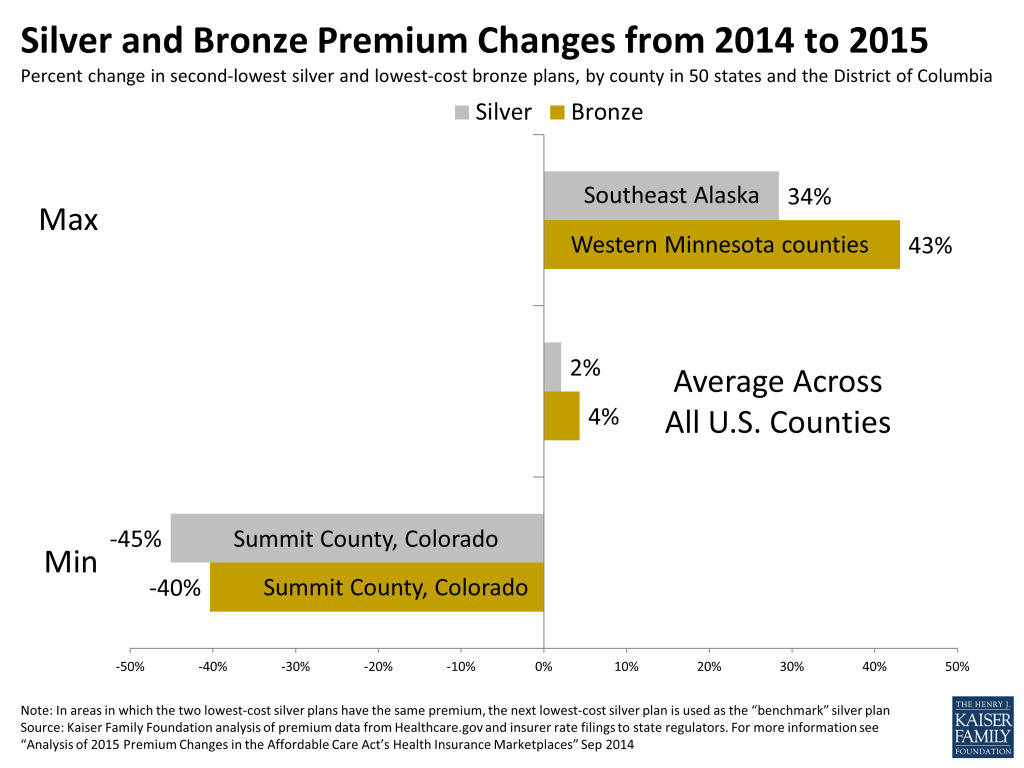
The map and 50-state table are updates to our September analysis, which examined premium changes for the lowest-cost bronze plan and the two lowest-cost silver plans in 16 major cities. The second-lowest cost silver plan in each state is of particular interest as it acts as a benchmark that helps determine how much assistance eligible individuals can receive in the form of federal tax credits. Although premium changes vary substantially across and within states, premium changes for 2015 in general are modest when looking at the low-cost insurers in the marketplaces, where enrollment is concentrated.
Change in Benchmark Silver Premiums, 2014 – 2015Silver and Bronze Premium Changes from 2014 to 2015
The tables below were first published in the Kaiser Family Foundation analysis of 2015 premium changes in September, 2014. They were updated in January, 2015 with the most recent premium data available.
Benchmark Silver Plans
This table presents the premiums and percent change in benchmark silver plans in a major city in each state. In addition to an enrollee’s income and family size, their second-lowest priced silver plan is used as the benchmark to determine the amount of financial assistance he or she can receive through the Marketplace.
Table 1: Monthly Silver Premiumsfor a 40 Year Old Non-Smoker Making $30,000 / Year
State
Major City
2nd Lowest Cost Silver Before Tax Credit
2nd Lowest Cost Silver After Tax Credit
2014
2015
% Changefrom 2014
2014
2015
% Changefrom 2014
Alabama
Birmingham
$258
$264
2.5%
$209
$208
-0.8%
Alaska
Anchorage
$433
$547
26.3%
$165
$164
-0.8%
Arizona
Phoenix
$197
$177
-10.0%
$197
$177
-10.0%
Arkansas
Little Rock
$306
$299
-2.3%
$209
$208
-0.8%
California
Los Angeles
$255
$257
0.8%
$209
$208
-0.8%
Colorado
Denver
$250
$211
-15.6%
$209
$208
-0.8%
Connecticut
Hartford
$328
$312
-5.0%
$209
$208
-0.8%
Delaware
Wilmington
$289
$301
4.1%
$209
$208
-0.8%
DC
Washington
$242
$242
-0.2%
$209
$208
-0.8%
Florida
Miami
$269
$274
1.8%
$209
$208
-0.8%
Georgia
Atlanta
$251
$255
1.8%
$209
$208
-0.8%
Hawaii
Honolulu
$183
$200
9.3%
$181
$179
-0.8%
Idaho
Boise
$231
$210
-9.3%
$209
$208
-0.8%
Illinois
Chicago
$212
$215
1.6%
$209
$208
-0.8%
Indiana
Indianapolis
$354
$329
-7.0%
$209
$208
-0.8%
Iowa
Cedar Rapids
$255
$246
-3.5%
$209
$208
-0.8%
Kansas
Wichita
$224
$218
-2.7%
$209
$208
-0.8%
Kentucky
Louisville
$205
$212
3.2%
$205
$208
1.1%
Louisiana
New Orleans
$311
$296
-4.8%
$209
$208
-0.8%
Maine
Portland
$295
$282
-4.4%
$209
$208
-0.8%
Maryland
Baltimore
$229
$235
2.6%
$209
$208
-0.8%
Massachusetts
Boston
$278
$257
-7.5%
$209
$208
-0.8%
Michigan
Detroit
$224
$230
2.6%
$209
$208
-0.8%
Minnesota
Minneapolis
$154
$183
18.5%
$154
$183
18.5%
Mississippi
Jackson
$410
$305
-25.5%
$209
$208
-0.8%
Missouri
St Louis
$263
$276
4.8%
$209
$208
-0.8%
Montana
Billings
$258
$241
-6.6%
$209
$208
-0.8%
Nebraska
Omaha
$271
$264
-2.6%
$209
$208
-0.8%
Nevada
Las Vegas
$238
$237
-0.6%
$209
$208
-0.8%
New Hampshire
Manchester
$289
$247
-14.6%
$209
$208
-0.8%
New Jersey
Newark
$322
$316
-1.9%
$209
$208
-0.8%
New Mexico
Albuquerque
$194
$171
-11.8%
$194
$171
-11.8%
New York
New York City
$365
$372
1.8%
$209
$208
-0.8%
North Carolina
Charlotte
$307
$326
6.4%
$209
$208
-0.8%
North Dakota
Fargo
$271
$272
0.3%
$209
$208
-0.8%
Ohio
Cleveland
$249
$247
-0.6%
$209
$208
-0.8%
Oklahoma
Oklah. City
$201
$219
8.8%
$201
$208
3.2%
Oregon
Portland
$201
$213
6.1%
$201
$208
3.4%
Pennsylvania
Philadelphia
$300
$268
-10.7%
$209
$208
-0.8%
Rhode Island
Providence
$293
$260
-11.2%
$209
$208
-0.8%
South Carolina
Columbia
$269
$276
2.7%
$209
$208
-0.8%
South Dakota
Sioux Falls
$264
$257
-2.8%
$209
$208
-0.8%
Tennessee
Nashville
$188
$203
7.8%
$188
$203
7.8%
Texas
Houston
$245
$250
2.0%
$209
$208
-0.8%
Utah
Salt Lake City
$209
$215
2.7%
$209
$208
-0.8%
Vermont
Burlington
$413
$436
5.6%
$209
$208
-0.8%
Virginia
Richmond
$253
$260
2.7%
$209
$208
-0.8%
Washington
Seattle
$281
$254
-9.8%
$209
$208
-0.8%
West Virginia
Huntington
$268
$289
7.8%
$209
$208
-0.8%
Wisconsin
Milwaukee
$315
$333
5.7%
$209
$208
-0.8%
Wyoming
Cheyenne
$395
$407
3.1%
$209
$208
-0.8%
Note: In areas in which the two lowest-cost silver plans have the same premium, the next lowest-cost silver plan is used as the “benchmark” silver plan.Source: Kaiser Family Foundation analysis of premium data from Healthcare.gov and insurer rate filings to state regulators. For more information see “Analysis of 2015 Premium Changes in the Affordable Care Act’s Health Insurance Marketplaces” Sep 2014
Lowest Bronze Plans
The table below presents the premium and percent change for the lowest-cost bronze plan in a major city in each state. These plans represent the lowest-cost option available to most shoppers on the Marketplaces.
Table 2: Monthly Bronze Premiums for a 40 Year Old Non-Smoker Making $30,000 / Year
State
Rating Area(Major City)
Lowest Cost Bronze Before Tax Credit
Lowest Cost Bronze After Tax Credit
2014
2015
% Change from 2014
2014
2015
% Change from 2014
Alabama
Birmingham
$208
$218
4.9%
$160
$162
1.3%
Alaska
Anchorage
$310
$396
27.7%
$42
$13
-69.0%
Arizona
Phoenix
$170
$153
-9.8%
$170
$153
-9.8%
Arkansas
Little Rock
$231
$240
3.7%
$135
$149
10.5%
California
Los Angeles
$188
$210
11.7%
$142
$161
12.9%
Colorado
Denver
$186
$167
-10.0%
$145
$164
13.0%
Connecticut
Hartford
$232
$196
-15.5%
$113
$92
-19.0%
Delaware
Wilmington
$247
$239
-3.4%
$167
$146
-13.0%
DC
Washington
$166
$181
8.8%
$134
$147
10.1%
Florida
Miami
$198
$224
12.9%
$138
$158
13.8%
Georgia
Atlanta
$202
$205
1.5%
$161
$158
-1.9%
Hawaii
Honolulu
$145
$166
14.5%
$143
$145
1.4%
Idaho
Boise
$192
$184
-3.9%
$169
$182
7.3%
Illinois
Chicago
$152
$170
11.7%
$150
$163
8.5%
Indiana
Indianapolis
$271
$251
-7.5%
$127
$130
2.0%
Iowa
Cedar Rapids
$161
$182
12.9%
$116
$144
24.1%
Kansas
Wichita
$148
$173
17.0%
$133
$163
22.2%
Kentucky
Louisville
$162
$135
-16.8%
$162
$131
-19.4%
Louisiana
New Orleans
$208
$202
-2.7%
$106
$114
7.1%
Maine
Portland
$235
$218
-7.1%
$149
$144
-3.6%
Maryland
Baltimore
$146
$165
12.8%
$127
$138
8.7%
Massachusetts
Boston
$242
$210
-13.1%
$173
$161
-7.3%
Michigan
Detroit
$168
$181
7.8%
$153
$159
3.6%
Minnesota
Minneapolis
$115
$140
21.4%
$115
$140
21.4%
Mississippi
Jackson
$242
$226
-6.6%
$42
$129
208.4%
Missouri
St Louis
$179
$198
10.6%
$125
$130
3.7%
Montana
Billings
$206
$211
2.6%
$157
$178
13.2%
Nebraska
Omaha
$197
$203
3.0%
$135
$147
8.4%
Nevada
Las Vegas
$183
$201
10.1%
$154
$172
11.8%
New Hampshire
Manchester
$227
$188
-17.1%
$147
$149
1.3%
New Jersey
Newark
$280
$279
-0.3%
$167
$171
2.1%
New Mexico
Albuquerque
$154
$131
-15.2%
$154
$131
-15.2%
New York
New York City
$307
$308
0.3%
$151
$144
-4.7%
North Carolina
Charlotte
$224
$244
9.1%
$126
$126
-0.7%
North Dakota
Fargo
$213
$223
4.5%
$151
$159
4.7%
Ohio
Cleveland
$185
$196
5.8%
$146
$157
7.2%
Oklahoma
Oklah. City
$129
$148
15.0%
$129
$137
6.2%
Oregon
Portland
$165
$175
5.8%
$165
$170
2.6%
Pennsylvania
Philadelphia
$238
$219
-7.9%
$147
$159
8.1%
Rhode Island
Providence
$210
$201
-4.3%
$127
$149
17.5%
South Carolina
Columbia
$202
$201
-0.4%
$142
$133
-6.9%
South Dakota
Sioux Falls
$239
$217
-9.3%
$184
$168
-9.0%
Tennessee
Nashville
$139
$153
10.3%
$139
$153
10.3%
Texas
Houston
$168
$188
11.9%
$132
$146
10.1%
Utah
Salt Lake City
$152
$168
10.3%
$152
$161
5.5%
Vermont
Burlington
$336
$360
7.1%
$132
$131
-0.7%
Virginia
Richmond
$170
$173
1.8%
$126
$121
-4.5%
Washington
Seattle
$186
$194
4.3%
$114
$148
29.5%
West Virginia
Huntington
$215
$234
8.9%
$156
$153
-2.3%
Wisconsin
Milwaukee
$244
$261
7.1%
$138
$136
-1.7%
Wyoming
Cheyenne
$331
$346
4.7%
$145
$147
1.0%
Note: In areas in which the two lowest-cost silver plans have the same premium, the next lowest-cost silver plan is used as the “benchmark” silver plan.Source: Kaiser Family Foundation analysis of premium data from Healthcare.gov and insurer rate filings to state regulators. For more information see “Analysis of 2015 Premium Changes in the Affordable Care Act’s Health Insurance Marketplaces” Sep 2014
On Tuesday, January 13, the Kaiser Family Foundation and the Center for Strategic and International Studies (CSIS) held a conversation with Tom Frieden, M.D., M.P.H., director of the Centers for Disease Control and Prevention (CDC), to discuss his recent trip to assess the Ebola outbreak in Sierra Leone, Liberia and Guinea. The discussion focused on efforts to contain the Ebola outbreak in West Africa and the ongoing response by the U.S. government.
Josh Michaud, associate director of global health policy at the Kaiser Family Foundation, made opening remarks, and Stephen Morrison, senior vice president and director, global health policy center at CSIS, moderated the conversation.
WHEN:
Tuesday, January 13, 2:00 p.m.
WHERE:
Barbara Jordan Conference CenterKaiser Family Foundation Offices1330 G Street, NWWashington, D.C.(one block west of Metro Center)
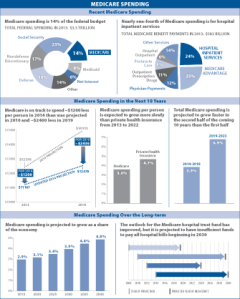
This Visualizing Health Policy infographic provides an overview of Medicare spending, including information on current federal spending relative to other government programs (e.g., Social Security) and percent-share of spending across Medicare services, as well as projected Medicare spending over the next decade and beyond. Recent federal spending on Medicare is about a third of Defense and Social Security spending combined. In the short term, Medicare spending per person is expected to be lower relative to previous projections and to grow more slowly than private health insurance. In the long term, Medicare spending as a share of the economy is projected to grow, and Medicare is projected to lack sufficient funds to pay all hospital bills beginning in 2030.
Visualizing Health Policy is a monthly infographic series produced in partnership with the Journal of the American Medical Association (JAMA). The full-size infographic is freely available on JAMA’s website and is published in the print edition of the journal.
This Visualizing Health Policy infographic provides an overview of Medicare spending, including information on current federal spending relative to other government programs (e.g., Social Security) and percent-share of spending across Medicare services, as well as projected Medicare spending over the next decade and beyond. Recent federal spending on Medicare is about a third of Defense and Social Security spending combined. In the short term, Medicare spending per person is expected to be lower relative to previous projections and to grow more slowly than private health insurance. In the long term, Medicare spending as a share of the economy is projected to grow, and Medicare is projected to lack sufficient funds to pay all hospital bills beginning in 2030.
Visualizing Health Policy is a monthly infographic series produced in partnership with the Journal of the American Medical Association (JAMA). The full-size infographic is freely available on JAMA’s website and is published in the print edition of the journal.