Safety-Net Emergency Departments: A Look at Current Experiences and Challenges

Authors: Guenevere Burke and Julia Paradise
Published: Feb 10, 2015

Executive Summary

Safety-net hospital emergency departments (EDs) are an important part of our health care system, especially, but not only, for the uninsured and others with low income. With multiple major changes unfolding in our system today, including the development of new health care delivery models, payment reforms, health insurance expansion, and increasing demand for primary care, safety-net EDs are a sort of crucible in which these shifts and transitions can be seen playing out. To understand more about safety-net EDs’ current experiences and challenges as the Affordable Care Act (ACA) begins to take hold, we conducted interviews in June and July 2014 with ED directors in a convenience sample of 15 of the 750 safety-net hospitals around the country, and asked them about selected aspects of their ED’s experience in January-June 2014 compared to the same period of 2013.

The hospitals in our sample come from all four Census regions and a mix of Medicaid expansion and non-expansion states. Our sample includes primarily large, urban teaching centers with an average of close to 100,000 ED visits per year. Ten of the 15 hospitals are public (non-federal) and five are private non-profits. All are trauma centers, including 11 Level 1 Regional Resource Trauma Centers, three Level 2 Community Trauma Centers, and one Level 3 Rural Trauma Hospital.

Several key themes emerged from our interviews:

  • The ED directors we spoke with in hospitals in Medicaid expansion states reported reductions in the share of ED patients without insurance and corresponding increases in the share with Medicaid. However, uninsured rates remained high in all the safety-net EDs.
  • The ED directors’ expectations regarding trends in ED visit volume over the next few years varied. Some anticipated increased visits, citing pressures on primary care access, remaining large uninsured populations, or expanded ED capacity. Others anticipated flat or declining ED visits due to expanded coverage and access and the impact of new models of health care delivery and payment.
  • The ED directors we interviewed were not certain what the net impact of expanded coverage, large remaining uninsured populations, DSH cuts, delivery system reforms, and other ongoing changes will be on ED finances.
  • The interviews underscored that EDs play multiple roles in our health care system, not only providing emergency care, but also acting as a primary and specialty care safety-net, a diagnostic and referral center, and a psychiatric treatment site.
  • The interviews also spotlighted how EDs have become a critical site of psychiatric treatment due to major strains on access to inpatient psychiatric treatment. The ED directors reported that adult patients needing inpatient psychiatric treatment often have to wait in the ED for 10 hours or more for an inpatient bed, and waits for children are as long as 24 to 48 hours.
  • We heard that broader changes in the health care system, such as the emergence of stand-alone EDs, the growing prevalence of high-deductible plans, and delivery system transformation, present safety-net EDs with new challenges and opportunities.

Issue Brief

Introduction

Safety-net hospitals, including their emergency departments (EDs), are an essential part of our health care system and a major source of care for millions of Americans, especially (but not only) the uninsured and others with low income. With significant changes affecting nearly every aspect of our health system today, including health care delivery, payment systems, insurance coverage and markets, and capacity to meet rising demand for access, safety-net EDs are a sort of crucible in which these shifts and transitions can be seen playing out. To understand more about safety-net EDs’ current experiences and challenges as the Affordable Care Act (ACA) takes hold, we conducted interviews in June and July 2014 with ED directors in a convenience sample of 15 of the 750 safety-net hospitals around the country. We asked the safety-net ED directors about selected aspects of their ED’s experience in January-June 2014 and how they compare to their experiences during same period of 2013.

We defined safety-net hospitals as those reporting in the American Hospital Association (AHA) Annual Survey Database that over 25% of their FY 2012 inpatient discharges were Medicaid patients. The 15 hospitals in our sample are located in all four Census regions and in a mix of Medicaid expansion and non-expansion states. Our sample includes primarily large, urban academic centers with an average of close to 100,000 ED visits per year. Ten of the 15 hospitals are public (non-federal) and five are private non-profits. All are trauma centers, including 11 Level 1 Regional Resource Trauma Centers, three Level 2 Community Trauma Centers, and one Level 3 Rural Trauma Hospital.

This issue brief draws out key themes that emerged from our interviews and highlights variation in the experience reported by ED directors in different hospitals and environments. The observations and perspectives of these safety-net ED directors, while not representative in a statistical sense, illuminate important issues and can help to inform assessments of both the opportunities and remaining difficult challenges for safety-net EDs as change accelerates under the ACA.

Key Findings

Who is Coming through the ED Door

“…I think education, both for physicians and for mostly the patient population, to understand the value of seeing a primary care doctor, how to utilize health care resources appropriately, what the appropriate use of a sub-specialist and an emergency department are – I think, hopefully, those things will occur. As people understand how to do those things …our system becomes more efficient, more resource saving.” 

The ED directors’ assessments of recent changes in visit volume were mixed. Visit volume in some EDs was flat in the first six months of 2014 relative to 2013. One director explained that no increase in visits was possible because the ED was already at its saturation point. Directors who said ED visit volume was higher in 2014 than 2013 posited a variety of explanations, including continuation of recent upward trends in ED visits, higher patient through-put due to improved ED operations, new utilization due to expanded coverage, and strained access to outpatient primary care. ED directors who reported declines in visits also offered differing explanations. For example, one suggested that his county hospital, which is known for seeing indigent patients, might not be the first choice for patients who have a choice, including those who gained coverage in 2014. Another mused that high-deductible plans might have contributed to reduced ED visits because they impose high financial barriers to expensive care.

“As the ACA matures and patients without primary care physicians hopefully have developed relationships, the number of visits at ERs is going to plateau…I hope and then I trust there will be certain dividends to maturity of the ACA.”

The ED directors’ expectations regarding ED visit volume in the next few years varied, too. Many of the directors we interviewed anticipated higher visit volume in the next three to five years. The reason they cited most often was their expectation of rising strains on outpatient primary care capacity as coverage expands. Also, the ED directors widely emphasized that it will take time for many newly insured patients to learn how to use their coverage, establish relationships with primary care providers, and seek care appropriately. Several interviewees indicated that capacity and use of their EDs is increasing due to new ED programs, new construction, and efficiency improvements.

The directors who expected visit volume to remain stable or decline were more optimistic that newly covered patients will be able to establish relationships with primary care physicians. One pointed to the fact that more patients now have a choice about where they seek emergency care. Another observed that because his hospital was operating on a global budget for all its patients, there was increased emphasis on outpatient management of conditions that previously triggered admissions to the hospital.

The ED directors in Medicaid expansion states reported lower uninsured rates among ED patients in the first six months of 2014. With one exception, all the ED directors in Medicaid expansion states reported that the uninsured rate among their patients had fallen in the first six months of 2014 compared to the first six months of 2013 or a somewhat longer look-back period. They attributed the reductions in uninsurance almost entirely to the Medicaid expansion, pointing to closely corresponding increases in the share of their ED patients with Medicaid coverage. In some cases, they reported that private coverage had increased, too. One of the five ED directors in Medicaid non-expansion states also reported a drop in the uninsured rate among ED patients, citing increases in Medicare, Medicaid, and private coverage.

Notably, uninsured rates remain high across the board. Notwithstanding higher rates of insurance coverage in some EDs, uninsured rates in safety-net EDs remain high in both Medicaid expansion and non-expansion states, ranging from 20% to 25% at the low end (except for one outlier, reporting about 8%), to 70% or more at the high end. The ED directors said that, regardless of coverage expansion, they will continue to see a large population that remains uninsured.

Safety-Net ED Finances

“The concern would be that the few patients who do get insurance,… if they choose to go someplace else, if they choose to go down the block to the urgent care center, then we’re going to have a greater percentage of non-paying patients, which is going to strap the hospital even further.”

ED directors are not certain how all the changes that are occurring – including but not limited to ACA-related reforms – will affect their EDs’ bottom lines. In the immediate post-ACA implementation period we asked about, it was not yet clear to the ED directors what impact the law would have on their institutions’ finances. Those in Medicaid expansion states generally saw measurable reductions in the uninsured rate among their patients and increases in Medicaid coverage and patient revenues. At the same time, along with the other directors, they pointed to an array of other factors also in play – anticipated reductions in Medicaid DSH payments; low Medicaid reimbursement rates; large populations who remain uninsured, including undocumented immigrants and low-income adults in non-expansion states; increased patient choice among the newly insured; and payment reforms underway in some states and hospitals. In EDs Have Multiple Roles Beyond Emergency Careaddition, a number of ED directors mentioned that neighboring hospitals and urgent care clinics had well-established methods to attract and retain insured patients while routing uninsured patients to safety-net hospitals. The directors said they were uncertain about what the net effect of all these changes on their bottom lines will be.

EDs Have Multiple Roles Beyond Emergency Care

In addition to providing traditional emergency services, safety-net EDs play numerous other roles in their communities. They are rapid diagnostic and treatment centers for overwhelmed primary care clinics. They are a source of access to specialty care and act as referral centers for patients with limited outpatient treatment options. And they are a key source of information and assistance for people new to health insurance and the health care system who are trying to navigate this unfamiliar and complex terrain. These additional roles have become integral to the operations as well as the community expectations of safety-net EDs across the country. Some of these activities are described in greater detail below.

Emergency Care

“If you have chest pain, should you go to your primary care doctor? Should you go to the ER? …It’s sort of a blurred line… If the patient’s having chest pain and they’re 50 years old, can they wait two weeks? Actually, a lot of people probably could wait two weeks, but a few can’t. They don’t know until they get their EKGs and their heart checked out. It’s hard to tell sometimes.

Most of our heart attacks walk in the door. They’re not brought in by ambulance, so it’s hard sometimes to tell what can wait or what can’t wait.”

The defining purpose of EDs is to provide emergency care, frequently including life-saving treatment. Often, it is clear that an individual who presents to the ED is having a medical emergency. But the ED directors stated that it is also often unclear to individuals who seek attention in EDs whether their conditions or symptoms, which may be painful or frightening, indeed require emergency attention. They go to the ED because they need a health professional to make this clinical assessment, and the ED directors saw making these assessments as part and parcel of the job of EDs. They underscored that a visit to the ED to seek care for a perceived emergency, even if it turns out not to be an emergency, should not be considered inappropriate or unnecessary ED use, or confused with avoidable ED visits for primary care. They said that when patients fear that they are experiencing a life-threatening health event, the decision to go the ED is rational, particularly if they are likely to encounter delays in care or inadequate diagnostic testing and treatment if they seek medical attention in other settings.

Primary Care

“Having a primary care physician and having access to them are two different things… Somebody they can identify and say ‘this is my primary care doctor’ – that’s gone up pretty dramatically, but then you say, well, when was the last time you saw that person or can we get follow-up for that person, and the answers can vary but its commonly ‘well, they can’t get us in for six months.’”

Interviewees characterized safety-net EDs as a primary care backstop in our system. Use of the ED as a primary care safety-net emerged as a major theme in our interviews. When we asked the 15 ED directors how frequently they see patients who visit the ED because they lack access to timely primary care, responses like “extremely often” and “every single minute of every hour of every single day” were typical, although a small number described robust primary care networks in their communities. Nearly all the directors estimated that fewer than half of their patients had a primary care doctor or clinic.

The ED directors suggested that many factors lead people to seek primary care in EDs, including limited outpatient primary care capacity in the community; increased pressure on primary care physicians (PCPs) to see more patients per day, which strains their capacity to accept patients with involved needs; limited PCP participation in both public and private insurance; and lack of after-hours access and long waits for appointments with office-based PCPs. The directors said that, in addition to keeping health care costs lower, increased access to outpatient primary care would help reduce crowding and long wait-times for care in EDs.

“[T]hey don’t have access. Either they’re not familiar with their plan, or they didn’t know they had a primary care doctor…”

Weak patient connections to PCPs were also cited. Another issue that some directors raised is that insured ED patients who, according to administrative records, have an assigned PCP often appear not to know it, indicating a need for increased patient outreach and engagement, particularly for newly insured populations who may have limited health insurance literacy and experience with the health system. It was suggested that other safety-net patients have a weak connection to primary care because they make infrequent primary care visits due to travel distances, low income, and other barriers to access. These gaps undermine patients’ ability to experience the value of continuity of care, which helps to reinforce patient-PCP relationship.

“The challenge of the change is really to connect people to this grand goal of primary care and you have to start somewhere. They started with getting people coverage, but there’s a lot more pieces that have to fall into place to make it work, but you’ve got to start with one piece, right?”

Many ED directors took the view that improved access to primary care under the ACA will take time to materialize. The ED directors in our sample generally reported that the supply of primary care in their communities remained relatively unchanged in the early period following the ACA coverage expansions. However, many said they expected progress under health reform to take place in a step-wise fashion, beginning with expanded coverage and, over time, leading to improved access to care.

Diagnostic and Referral Center

“…in many instances – and this happens in our own clinic – they’re being sent over by their primary care doctor for something that they felt they couldn’t handle in the clinic…”

Patients are often referred to the ED from a primary care provider’s office. The ED directors said that PCPs or other clinicians may make the referrals if they lack resources they believe might be required for patients, or for other reasons. They also pointed out that referrals are often initiated by non-clinical staff because the office has limited same- or next-day appointments available. This dynamic has itself influenced both provider and patient behavior to some extent. Some safety-net hospitals have increased the accessibility of their primary care clinics by adding same-day and after-hours appointments, but have subsequently found that many patients once turned away from an office-based PCP and referred to the ED will continue to seek care in the ED because of that initial experience.Diagnostic and Referral Center

Referrals to the ED also occur because of limited access to timely specialty care. Numerous ED directors noted that it can be more challenging to obtain appointments for some specialties than for primary care. Shortages of some specialists, low participation in Medicaid by certain types of specialists, including orthopedists, limited managed care provider networks, and lack of coverage for and access to oral health care were all cited. One interviewee mentioned that some patients who receive specialist care in the ED will first seek follow-up care with the specialist on call in the ED because geographic and financial barriers make it extremely difficult for them to access office-based specialists, or because they face months-long waits to see an oncologist, for example. One ED director stated that the specialist groups on contract to his ED specialty care clinics are considered to be the best in the field and attract patients from considerable distances. The directors reported difficulty arranging follow-up for patients suffering from advanced cancer and neurosurgical diagnoses, while noting that some of these problems were more memorable than common.

Psychiatric Treatment

Safety-net EDs are increasingly an important source of psychiatric care. Several ED directors spoke about the role their EDs are playing as a safety-net for psychiatric treatment, citing severe gaps in access to both outpatient and inpatient psychiatric care. One director highlighted a sharp increase in psychiatric visits in the first six months of 2014, including many patients with both medical and psychiatric problems. He noted that his psychiatric emergency center is the only one in his large city due to several closures of psychiatric facilities and general hospitals with psychiatric facilities, and also that funding for psychiatric resources had been declining slowly but steadily over the last two years.

Virtually all EDs reported significant difficulty obtaining inpatient treatment for patients suffering from psychiatric illness. Federal law (“EMTALA”) requires emergency providers and capable hospitals to provide stabilizing treatment for patients in need of emergency care, regardless of their insurance status. However, the ED directors we interviewed reported that, once they have stabilized psychiatric ED patients, they have difficulty securing inpatient psychiatric treatment for them. Their safety-net hospitals have limited capacity for inpatient psychiatric care and must often transfer psychiatric patients to another hospital. The EMTALA prohibition against considering patients’ insurance status does not apply in the case of stable patients, and many ED directors we spoke with reported that their ability to obtain inpatient care for psychiatric patients varied dramatically based on the patient’s insurance status, with Medicaid and uninsured patients facing much longer waits for inpatient treatment. The directors noted that access to inpatient treatment was even more limited for patients with co-morbid illnesses, such as substance abuse and its related medical problems. Psychiatric patients often remain in the ED for prolonged periods, awaiting admission to the hospital’s inpatient psychiatric unit or transfer to another inpatient facility – a phenomenon known as “boarding.” Prolonged periods of patient boarding have been linked with worse health outcomes.

Four of 10 ED directors reported typical boarding time of at least 10 hours for adult psychiatric patients. Ten ED directors provided estimates of typical boarding time for adult psychiatric patients seen in the ED. Of the 10, nine gave estimates of six hours or more, including four who said the typical wait was at least 10 hours. It is noteworthy that three of the hospitals have separate psychiatric EDs or treatment areas, which should reduce boarding times. Several ED directors pointed out that “typical” boarding time concealed important disparities and variation in psychiatric patient experiences. For example, one director reported that boarding time averaged 18 hours for Medicaid patients, but three days for the uninsured. Another said that, while typical boarding time for psychiatric patients in his ED is 8 to 10 hours, some patients have waited 36 to 40 hours to be admitted for inpatient psychiatric treatment. Some ED directors spoke of especially long wait times for children with psychiatric emergencies – 24 to 48 hours, or even longer – due to the sharp lack of adolescent psychiatric care and pediatric psychiatric beds, made worse in some areas by hospital closures.

Some ED directors cited positive changes in access to inpatient and outpatient psychiatric care. One director mentioned that, because more patients now have insurance, the ED is now able to transfer psychiatric patients to additional inpatient facilities besides the state psychiatric hospital, easing boarding times. Others mentioned ongoing efforts to mitigate gaps in access to emergency psychiatric care, including expansions of outpatient psychiatric care in their hospitals.

Broader Health System Developments

In addition to the central themes and issues that emerged from our interviews, a number of other topics raised by individual ED directors also warrant discussion because they shed light on dynamics in the health care market and our health care system at large.

  • Stand-alone EDs. Emerging first in Texas several years ago, stand-alone EDs currently exist in nearly all states. They may be indistinguishable from traditional EDs from the patient perspective, but their capabilities and licensing requirements appear to vary considerably. Interviewees noted that stand-alone EDs, which are generally located in areas with high rates of private health insurance coverage, may have contractual agreements with nearby hospitals under which the hospitals give priority for inpatient admission to the stand-alone ED’s patients – who are more likely to be insured – over its own Medicaid and uninsured ED patients who are waiting for an inpatient bed. While these arrangements may improve the payer mix of the hospitals involved, uninsured or “underinsured” patients in these hospitals’ EDs may face delays for inpatient care based on their ability to pay. In addition, stand-alone EDs compete with safety-net EDs for emergency physician staff.
  • New models of care. A number of the ED directors we interviewed said that their institutions were experimenting with new care models aimed either at increasing ED capacity through efficiency measures or at decreasing ED visits. Some had implemented new care processes to reduce ED wait times, improve patient throughput, and provide a “value experience” for patients, in order to attract and retain newly insured patients in particular. Others were participating in accountable care organizations (ACOs) or other population health management programs with global payments, or were operating under a global budget that introduced new pressures and incentives to reduce ED visits.
  • High-deductible plans. Several of the 15 ED directors we interviewed observed the increasing prevalence of high-deductible health plans. One ED director we spoke to believes that high-deductible plans – which are designed to encourage more prudent consumer use of health care, including ED services – empower consumers because individuals paying out of pocket for expensive medical care are more likely to demand high quality and providers will therefore invest more effort in providing high-value care. Mostly, though, ED directors expressed concern that high-deductible plans effectively render insured individuals uninsured, reproducing the same financial barriers to care that expanded coverage was intended to lower. By the same token, they said, high deductibles diminish the increase in patient revenues that safety-net providers expected from expanded coverage, as many in the low-income population they serve may be unable to pay these deductibles.

Conclusion

Safety-net EDs play multiple vital roles in our health care system, evolving continually to fill emerging or widening gaps in access to services. In addition to providing emergency care needed by Americans from all walks of life, they also provide a safety-net of primary care and specialty care, serve as diagnostic and referral centers, and, increasingly, act as psychiatric treatment facilities, particularly for the uninsured and others with low income. Even as health insurance coverage expands widely under the ACA, the uninsured rate among safety-net ED patients is likely to remain high and safety-net EDs will continue to be a linchpin of access to care that is not otherwise available to many in our system.

Widespread and far-reaching initiatives to transform health care delivery and payment, along with expanded coverage, expected changes in payment to safety-net hospitals, and other reforms accelerated or set in motion by the ACA, mean that safety-net EDs are operating in a changing environment that presents both new opportunities and new challenges. It will be important to understand how safety-net EDs in this transitional setting participate in and respond to the changes, how they are affected, and what the implications are for access to care in communities across the nation.     

Appendix

Methods

We conducted semi-structured interviews with ED directors in a convenience sample of 15 safety-net hospitals around the country, to learn how selected aspects of their ED’s experience in the six months immediately following full implementation of the ACA (January-June 2014) compared with their experience in the same six-month period in the year before ACA implementation (January-June 2013). Among those we interviewed were ED medical directors, chairpersons, and chief medical officers. The hospitals included in our sample are located in a mix of Medicaid expansion and non-expansion states and are drawn from all four Census regions. Although we sought to recruit diverse hospitals with respect to urban/suburban/rural location, ownership, and other factors, our sample includes primarily large, urban academic centers with an average of close to 100,000 ED visits per year. On average, the Medicaid share of total inpatient discharges was 42% in the sample hospitals.

Interview Questionnaire

  1. Thinking about the period since January 1, 2014, when the ACA-related coverage expansions took effect, has the visit volume in your emergency department changed compared to the first six months of 2013? What do you think is the primary reason for the observed change? What do you anticipate will happen to your visit volume over the next 3-5 years?
  2. What is the current insurance (or payor) mix of your ED patients? In other words, roughly what share of patient visits (not revenue or charges) are attributable to Medicaid, Medicare, privately insured, and self-pay/uninsured patients, respectively? Has this insurance mix changed compared to the first six months of 2013? If so, how?
  3. Compared to the first six months of 2013, has patient acuity in your emergency department changed since January 1, 2014? If yes, please elaborate – for example, have you seen a change in fast-track volume, admission rates, or triage acuity categories?
  4. Approximately what share of your emergency department patients would you say currently have a primary care doctor or a clinic they usually go to? Is this share about the same as it was in the first six months of 2013, or is it different?
  5. How often does your emergency department see patients who are visiting the emergency department because they do not have other access to timely primary care? Specialty care?
  6. What is the typical “boarding time” for an admitted psychiatric patient in your emergency department (i.e., disposition decision to emergency department departure)? Is this about the same compared to the first six months of 2013 or is it different?
  7. How, if at all, have the changes in the ACA affected your ED’s finances?
  8. What do you see as the chief opportunities and challenges presented by the ACA?
  9. Is there anything we haven’t covered that you’d like to observe or share?
 

News Release

Visualizing Health Policy: Premium Changes in the Affordable Care Act’s Insurance Marketplaces 2014-2015

Published: Feb 10, 2015

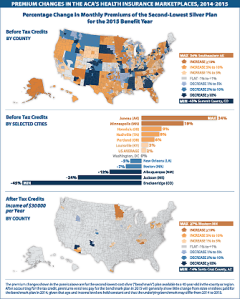
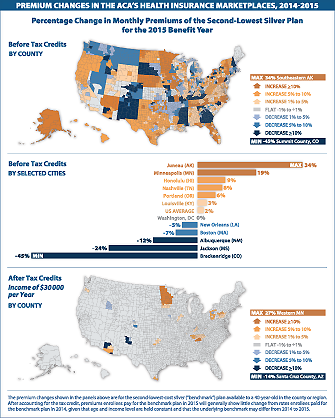
This Visualizing Health Policy infographic illustrates the change in monthly premiums by county, and select cities, from 2014 to 2015 for a 40-year-old person covered by the second-lowest-cost silver “benchmark” plan in the Affordable Care Act’s insurance marketplaces. Premium changes were greatest in Summit County, Colo. (45% decrease) and southeastern Alaska (34% increase), before tax credits. After accounting for tax credits, premiums for a 40-year-old person with an annual income of $30,000 would remain flat in most of the country, as long as the enrollee changed from the 2014 benchmark plan to the plan designated as the benchmark for 2015.


jama_2015jan_ACApremiums

Visualizing Health Policy is a monthly infographic series produced in partnership with the Journal of the American Medical Association (JAMA). The full-size infographic is freely available on JAMA’s website and is published in the print edition of the journal.

Visualizing Health Policy: Premium Changes in the Affordable Care Act’s Insurance Marketplaces 2014-2015

Published: Feb 10, 2015

This Visualizing Health Policy infographic illustrates the change in monthly premiums by county, and select cities, from 2014 to 2015 for a 40-year-old person covered by the second-lowest-cost silver “benchmark” plan in the Affordable Care Act’s insurance marketplaces. Premium changes were greatest in Summit County, Colo. (45% decrease) and southeastern Alaska (34% increase), before tax credits. After accounting for tax credits, premiums for a 40-year-old person with an annual income of $30,000 would remain flat in most of the country, as long as the enrollee changed from the 2014 benchmark plan to the plan designated as the benchmark for 2015.

jama_2015jan_ACApremiums

Visualizing Health Policy is a monthly infographic series produced in partnership with the Journal of the American Medical Association (JAMA). The full-size infographic is freely-available on JAMA’s website and is published in the print edition of the journal.

View Slide Sources

How much does the U.S. spend to treat different diseases?

Published: Feb 4, 2015

This slideshow looks at how much the United States spends to treat specific diseases and tracks spending growth over time, using data from the Bureau of Economic Analysis Health Care Satellite Account. The analysis shows that five disease categories — ill-defined, circulatory, musculoskeletal, respiratory, endocrine and nervous system conditions — account for roughly half of medical services spending in 2012. Among the highest-cost conditions, spending on ill-defined conditions — including check-ups, preventive care and treatment of colds and other minor conditions — grew the fastest between 2000 and 2012. The cost per case grew fastest for infectious diseases.

The slideshow is part of the Peterson-Kaiser Health System Tracker, an online information hub dedicated to monitoring and assessing the performance of the U.S. health system. More information about the analysis leading to the slideshow is available through the tracker.


Medicaid Expansion in Indiana

Published: Feb 3, 2015

In January 2015, the Centers for Medicare and Medicaid Services (CMS) approved Indiana’s amendment of its § 1115 demonstration, the Healthy Indiana Plan (HIP).1   The amended waiver implements the Affordable Care Act’s (ACA) Medicaid expansion by building on the prior HIP demonstration.2   Beginning February 1, 2015, the new demonstration will cover nearly all adults ages 19-64 with income from 0-138% of the federal poverty level (FPL, about $16,242 per year for an individual in 2015) – an estimated 350,000 beneficiaries.

Indiana describes its demonstration as a “consumer-driven health plan,”3  which seeks to  “[r]educe the number of uninsured, low income Hoosiers and increase access to healthcare services; [p]romote value-based decision-making and personal health responsibility; [p]romote disease-prevention and health promotion to achieve better health outcomes; [p]romote private market coverage. . . ; and [a]ssure State fiscal responsibility and efficient management of the program.”4 

While all waivers involve some amount of administrative complexity, Indiana’s demonstration is more complex than others approved to date.  The program has multiple parts, including four different Medicaid benefit packages for the populations covered by the waiver (aside from premium assistance for employer-sponsored insurance).  It also requires administering and tracking a number of elements, such as premium payments or co-payments, compliance with healthy behaviors, health savings account balances and rollover funds, presumptive eligibility determinations, and services that would have been covered retroactively for certain groups.  Beneficiaries are treated differently based on their coverage group, and beneficiaries within the same coverage group are treated differently depending upon their income level, medical frailty status, and whether they have paid premiums.

Indiana’s waiver is different than other Medicaid expansion waivers approved to date in that it allows the state to prevent certain newly eligible beneficiaries (non-medically frail adults above the federal poverty level) from re-enrolling in coverage for six months after they are disenrolled for non-payment of premiums.  The waiver provides a less generous benefit package to newly eligible beneficiaries at or below the federal poverty level who do not pay premiums.  To receive the more generous benefit package, even beneficiaries with very little or no income (0-5% FPL, up to $589 per year for an individual in 2015) must pay premiums of $1.00 per month.  Medically frail beneficiaries have access to the state plan benefit package, in accordance with federal law, but those above the federal poverty level who do not pay premiums continue to be billed and must pay state plan co-payments; the waiver does not describe how medically frail beneficiaries will be identified.

Indiana’s waiver also differs from others approved to date in that it makes coverage effective on the date of the first premium payment (or at the expiration of a 60 day payment period for those at or below the federal poverty level), rather than on the date of application.  The waiver also includes § 1916(f) authority to test graduated co-payments for non-emergency use of the emergency room (ER) up to $25, which is over three times the amount in federal law.

Key elements of Indiana’s waiver include:

  • Establishing premiums through monthly contributions to a Personal Wellness and Responsibility (POWER) health savings account for most newly eligible adults with income from 0-138% FPL, with services delivered through capitated managed care organizations (MCOs). Premiums are a condition of eligibility for non-medically frail beneficiaries from 101-138% FPL and are limited to 2% of income ($27/month for those at 138% FPL); premiums for those with income below 5% FPL ($49 or less per month for an individual in 2015) are $1.00 per month;
    • Beneficiaries who pay premiums will be eligible for HIP Plus, which includes expanded benefits and co-payments only for non-emergency use of the ER. Coverage in HIP Plus begins the first day of the month in which a beneficiary pays a premium, instead of the date of Medicaid application;
    • Most beneficiaries with income from 101-138% FPL who fail to pay premiums within a 60 day grace period will be disenrolled from coverage and barred from re-enrolling for 6 months;
    • Beneficiaries with income at or below 100% FPL who fail to pay premiums will receive HIP Basic, with fewer benefits (such as no coverage for adult dental and vision) and required co-payments in state plan amounts;
    • Non-expansion parent/caretaker relatives and those receiving Transitional Medical Assistance have the option of paying premiums in lieu of co-payments for services. These beneficiaries receive the Medicaid state plan benefit package;
  • Waiving non-emergency medical transportation (NEMT) for most newly eligible adults for one year, to be extended based on the results of an evaluation assessing the impact on access to care;
  • Establishing a two year demonstration under §1916(f) with a control group to evaluate whether graduated co-payments (first instance $8, subsequent $25) discourage non-emergency use of the ER by non-expansion parent/caretakers and newly eligible adults; and
  • Offering optional Medicaid premium assistance for newly eligible adults with employer-sponsored insurance.

While not implemented through waiver authority, Indiana plans to increase Medicaid provider reimbursement rates to 75% of Medicare rates for physician and physician extender services.

Indiana sought waiver authority to require a work referral as a condition of eligibility, which was not approved by CMS.  Instead, Indiana may administer a voluntary state-run work search and job training program, which is separate from the Medicaid expansion demonstration.5   Indiana’s requested waiver of Early Periodic Screening Diagnostic and Treatment (EPSDT) benefits (specifically, vision and dental) for 19 and 20 year olds in the HIP Basic plan also was denied by CMS.

To date, CMS has approved waivers in Arkansas, Iowa, Michigan, and Pennsylvania to implement the ACA’s Medicaid expansion.  New Hampshire has a waiver application pending with CMS, and Tennessee and Utah have proposals pending at the state level.

Some features of Indiana’s demonstration are similar to those approved to date in other states.  For example, Iowa and Pennsylvania’s demonstrations include non-emergency medical transportation waivers for the first demonstration year and monthly premiums as a condition of eligibility for those above 100% FPL.6   Iowa, Michigan, and Pennsylvania also allow beneficiaries to reduce premiums and/or co-payments by completing specified healthy behavior activities.

Indiana’s demonstration is distinct from other states in its use of health savings accounts to fund covered services, its waivers of reasonable promptness and retroactive coverage making coverage effective on the date of initial premium payment, the six month lock-out for non-payment of premiums for beneficiaries above 100% FPL, and its testing of graduated co-payments (in amounts that exceed federal law) for non-emergency use of the emergency room.

In addition to changing how coverage works for beneficiaries who were covered under Indiana’s prior demonstration, implementation of the new demonstration also will require people between 100-138% currently enrolled in Marketplace coverage to transition to Medicaid, which will require terminating their Marketplace coverage and reconciling any premium tax credits that they may have received.  More details about Indiana’s demonstration are provided in Table 1.

Table 1:  Indiana’s Section 1115 Medicaid Expansion Demonstration Waiver Provisions
ElementIndiana Waiver Provision
Overview:Implements the ACA’s Medicaid expansion by requiring most newly eligible adults with incomes from 0-138% FPL to pay monthly premiums by contributing to a Personal Wellness and Responsibility (POWER) health savings account.  Newly eligible adults who pay premiums will be eligible for HIP Plus, an expanded benefit package with co-payments only for non-emergency use of the ER.  Those with incomes from 101-138% FPL who fail to pay premiums after a 60 day grace period will be disenrolled from coverage and barred from re-enrolling for 6 months. Beneficiaries with incomes at or below 100% FPL who fail to pay premiums will receive HIP Basic, a more limited benefit package with state plan level co-payments.  Also allows non-expansion parent/caretakers to pay premiums in lieu of cost-sharing for state plan services and offers optional Medicaid premium assistance for employer-sponsored insurance (ESI) for newly eligible adults over age 21.
Duration:2/1/15 to 1/31/18
Coverage Groups:Covers adults ages 19-64 with incomes from 0-138% FPL, including non-expansion (§ 1931) parent/caretakers, those eligible for Transitional Medical Assistance (formerly eligible as § 1931parent/caretakers), and adults newly eligible through the ACA’s Medicaid expansion (approximately 350,000 beneficiaries statewide)..Excludes children, seniors, and dual eligible beneficiaries. American Indian/Alaska Natives may opt out of the demonstration 30 days after enrollment.  Newly eligible AI/ANs who remain in the demonstration will have the more generous (HIP Plus) benefit package, with coverage effective on the date of application, and no premiums or co-payments.
Coverage Effective Date:   Waives reasonable promptness so that HIP Plus coverage begins on the first day of the month in which a beneficiary makes an initial premium payment instead of the date on which beneficiary is determined eligible for Medicaid (retroactive to the application date). Beneficiaries have 60 days from the date of their eligibility determination to make this payment.  However, individuals determined presumptively eligible (described below) will maintain presumptive Medicaid coverage for at least 60 days, and those found presumptively eligible who are subsequently determined fully eligible will have no gap in coverage..For those at or below 100% FPL, HIP Basic coverage begins on the first day of the month in which the 60 day premium payment period expires.  Once in HIP Basic, beneficiary cannot move to HIP Plus until eligibility renewal, receipt of rollover funds (described below) or at other times designated by the state.
Fast Track Payments:Effective April 1, 2015, state shall allow for an optional $10.00 fast track initial POWER account pre-payment that makes enrollment effective the first day of the month in which payment is received, once a beneficiary is determined eligible.  However, the beneficiary cannot change MCOs for a year after making a fast track payment.  The fast track payment is refundable if the applicant is determined ineligible.  If the beneficiary’s regular monthly premium is less than $10.00, the MCO shall credit the remaining portion of the fast track payment to subsequent premium payments.  If the beneficiary’s regular monthly premium is more than $10.00, the beneficiary will be billed the difference on the next POWER account invoice.
Presumptive Eligibility:State shall include FQHCs, RHCs, CMHCs, and health department sites in an expanded presumptive eligibility program.  Presumptive eligibility enables applicants to receive Medicaid-covered services as of the date  that a qualified provider entity preliminarily determines that the applicant is financially and categorically eligible for Medicaid, while the final eligibility determination is pending with the state Medicaid agency..To maintain the reasonable promptness waiver, the state must make final eligibility determinations for a certain percentage of presumptively eligible applicants (out of eligibility determinations made on all types of applications), beginning January 2016.  If the state fails to meet this standard, the reasonable promptness waiver will be suspended for the next 6 months.  The state shall propose the standard based on the first 9 months of the demonstration.
Retroactive Coverage Transition Program:Waives retroactive coverage of services incurred during the 90 days prior to Medicaid eligibility.  However, for one year, the state will reimburse providers for services received up to 90 days prior to the effective Medicaid coverage date for non-expansion parent/caretaker relatives who were not determined presumptively eligible. If CMS determines that these beneficiaries are incurring costs that would have been reimbursed by Medicaid without the retroactive eligibility waiver (based on data provided by the state by Nov. 1, 2015), this transition program shall continue for the remainder of the demonstration.
Delivery System and Health Savings Accounts:  Services provided by MCOs.  MCOs also must bill and collect premiums from beneficiaries.POWER accounts are jointly funded by beneficiary premiums and the state.  POWER account funds are used to fund the first $2,500 of covered claims, except for preventive services required by 42 USC § 300gg-13,7  the cost of which are not charged against POWER account funds.  Other preventive services are covered, subject to a $500 annual cap, and are charged against POWER account funds.State pays capitated rate to MCOs for services after the $2,500 POWER account funds are exhausted.Within 30 days after demonstration approval, the state must submit an operational protocol to describe the process for collecting POWER account contributions.
Beneficiary Premiums:  Monthly premiums apply to all beneficiaries from 0-138% FPL and are the greater of 2% of income (up to $27 per month for an individual at 138% FPL) or $1.00.  Premiums for those at or below 5% FPL ($49 per month for an individual in 2015) will be $1.00/month.   Premiums are a condition of eligibility only for non-medically frail beneficiaries from 101-138% FPL..Cost-sharing (both premiums and co-payments) limited to 5% of quarterly household income.  POWER account contributions cannot exceed 2% of household income (although each beneficiary will have their own POWER account)..Beneficiary premium amounts are adjusted at annual renewal and anytime the state is made aware of an income change during the current coverage period.Beneficiary premiums shall be reduced by any POWER account contributions made by third parties, such as employers or non-profit organizations.
State Contributions:The state funds the difference between the beneficiary’s monthly premiums and the full $2,500 POWER account value. The state will make an initial $1,300 account contribution upon the beneficiary’s MCO enrollment, and any additional amount owed by the state to the MCO for services provided to the beneficiary shall be reconciled after 12 months.
Consequences of Premium Non-Payment:Newly eligible adults from 101-138% FPL who do not make a premium payment within a 60 day grace period will be disenrolled from coverage and locked out for six months.  Prior to disenrollment, the state shall review all other bases of Medicaid eligibility and notify the beneficiary about the option to request a medical frailty determination, and the MCO must provide 2 written notices about the delinquent payment.  Beneficiaries who are disenrolled for non-payment of premiums are not subject to the lock-out if they re-apply with verification of non-payment due to a “qualifying event,” such as moving to another state and then returning, experiencing domestic violence, or medical frailty.8   Individuals who never make their initial premium payment are not subject to the 6 month lock-out..Newly eligible adults from 101-138% FPL who are medically frail who do not pay premiums will not be terminated from coverage.  Instead, these beneficiaries must continue to have access to the state plan benefit package,9  are subject to state plan co-payments for services, and continue to be billed for premiums..Newly eligible adults at or below 100% FPL who do not make an initial premium payment within 60 days of their eligibility determination or who do not make a subsequent premium payment within the 60 day grace period will be automatically enrolled in the HIP Basic plan.  These beneficiaries will be subject to state plan co-payments for services, which may exceed the cost of monthly premiums applicable under HIP Plus.10 .Non-expansion parent/caretakers and newly eligible adults at or below 100% FPL who are medically frail who do not pay premiums retain their existing benefit package (described below) and are subject to state plan co-payments.
Debts/Refunds Upon Disenrollment:Payment of unpaid premiums is not a condition of Medicaid re-enrollment but may be owed as a debt.11   MCOs may attempt to collect unpaid premiums from beneficiaries but may not report debt to collection agencies, place a lien on beneficiary’s home, refer cases to debt collectors, file a lawsuit, seek a court order to garnish wages, or sell the debt to a third party for collection.If beneficiaries have paid excess premiums,12  they are owed a refund, subject to a 25% penalty if the beneficiary is terminated for non-payment of premiums.
Healthy Behavior Incentives:HIP Plus beneficiaries who make timely premium payments will be eligible to rollover their share of the unused POWER account balance at the end of 12 months. If the beneficiary completes unspecified age and gender appropriate preventive services, the rollover balance for HIP Plus beneficiaries will be doubled by the state, not to exceed the beneficiary’s total premium payments for the year..HIP Basic beneficiaries can rollover unused POWER account funds, up to 50% of the amount of premiums required for HIP Plus, if they obtained unspecified age and gender appropriate preventive services..Rollover funds can be used to reduce the required beneficiary premiums in the subsequent year.  Debts may be collected from rollover account balances.
Co-Payments for Non-Emergency Use of the ER:All demonstration beneficiaries must pay a co-payment for non-emergency use of the ER, which is waived if the beneficiary calls the MCO’s 24 hour nurse hotline prior to using the ER. These co-payments must be refunded if the beneficiary has an emergency condition or is admitted to the hospital on the same day..Grants § 1916(f) waiver authority for two year demonstration (until Jan. 31, 2017) to test whether graduated co-payments ($8 for first visit and $25 for subsequent visits in the same year) discourage non-emergency use of the ER.  ($25 exceeds the $8 maximum amount authorized by federal law.)  This authority applies to all demonstration populations (newly eligible adults and non-expansion parent/caretakers).  By May 1, 2015, state must establish a control group with a minimum of 5,000 beneficiaries who will not be subject to the increased co-payments; selection of the control group will be detailed in the state’s protocol submitted to CMS.
Benefit Packages:Newly eligible adults 0-138% FPL who pay premiums receive HIP Plus, an ABP that includes the ACA’s essential health benefits and covers more services than HIP Basic..Newly eligible adults at or below 100% FPL who do not pay premiums receive HIP Basic, an ABP that includes the ACA’s essential health benefits but with fewer covered services (no vision or dental coverage) compared to HIP Plus. HIP Basic includes all EPSDT services for 19 and 20 year olds, consistent with federal law..Newly eligible adults who are medically frail must have access to the state plan benefit package.13 .Non-expansion parent/caretaker relatives and those receiving Transitional Medical Assistance receive the Medicaid state plan benefit package..(Benefit package contents are specified in state plan amendments, not the waiver terms and conditions.)
Non-Emergency Medical Transportation:Waives non-emergency medical transportation (NEMT) for newly eligible adults, except pregnant women and those who are medically frail, for demonstration year 1.  CMS will consider an extension of the NEMT waiver based on an evaluation of its impact on access to care.
Optional Premium Assistance for ESI:Newly eligible adults age 21 or older with access to ESI may choose to receive premium assistance and assistance with cost-sharing through a POWER account.  The state will fund the POWER account with $4,000 per year for an individual or $8,000 per year for 2 adults in the same household covered by ESI.  POWER account funds will be used to pay the state’s portion of the ESI premium and contribute to the employee’s ESI cost-sharing (deductibles, co-payments, co-insurance). Beneficiaries must contribute to their ESI premium by a payroll deduction of at least $1.00 but not less than 2% of their monthly income. The employer must contribute at least half of the employee’s premium, and the ESI benefit package must comply with the requirements for an approved Medicaid ABP.
Financing:State shall finalize budget neutrality agreement with CMS by Feb. 1, 2015.The state plans to fund the state share of Medicaid expansion costs (beginning in 2017) with existing cigarette tax revenues and funds from an existing hospital assessment fee (which may be adjusted as needed.)  These funding sources will pay for the state’s costs of expanding HIP 2.0, the state share of payments to fund an increase to 75% of Medicare reimbursement rates for physician and physician extender services provided under current Medicaid programs including Hoosier Healthwise, programs for beneficiaries who are aged, blind or disabled, and other non-HIP programs, and annual funding of $50M staring in 2017 to fund the Medicaid program and contributions to the HIP trust fund to assure appropriate reserves and funding for 1 year of HIP operational costs.
Evaluation and Reporting:Requires state to submit data after one year to evaluate whether there are gaps in coverage that would be remedied by retroactive coverage..Requires monthly and annual reporting on presumptive eligibility..Requires independent entity to annually survey statistically significant groups of those enrolled in demonstration, those eligible but not enrolled, and those disenrolled for non-payment of premiums..Requires independent evaluation of NEMT waiver by Nov. 1, 2015; also requires independent evaluations of the graduated non-emergency use of ER co-payments and the retroactive coverage waiver and transition uncompensated care program.
Public Input:The state shall hold a forum for public comment within 6 months of demonstration implementation and annually thereafter.


  1. CMS Healthy Indiana Plan Special Terms and Conditions (Feb. 1, 2015 – Jan. 31, 2018), available at http://www.in.gov/fssa/hip/files/IN_HIP_2.0_CMS_Approved_STCs_1_27_15.pdf. ↩︎
  2. Prior to the enactment of the ACA, states could only cover non-disabled childless adults through a waiver. Indiana’s HIP demonstration waiver expanded coverage to parents and childless adults below 100% FPL. Enrollment for parents was not capped; however, enrollment for childless adults was capped at 36,500 and limited to open enrollment periods. ↩︎
  3. Press release:  Indiana Wins Approval of Plan to Cover 350,000 Uninsured (Jan. 27, 2015), available at http://www.in.gov/fssa/hip/2418.htm. ↩︎
  4. Ind. Fam. & Soc. Servs. Admin., HIP 2.0 1115 Waiver Application at  (July 2, 2014), available at 14 http://www.medicaid.gov/Medicaid-CHIP-Program-Information/By-Topics/Waivers/1115/downloads/in/Healthy-Indiana-Plan-2/in-healthy-indiana-plan-support-20-Waiver-Application-07022014.pdf.  Indiana’s waiver application also included the goals of “promot[ing]. . . family coverage options to reduce network and provider fragmentation within families” and “facilitate[ing] HIP member access to job training and stable employment to reduce dependence on public assistance” but those features were not included in the approved waiver authorities. ↩︎
  5. Press release:  CMS and Indiana Agree on Medicaid Expansion (Jan. 27, 2015), available at http://www.cms.gov/Newsroom/MediaReleaseDatabase/Press-releases/2015-Press-releases-items/2015-01-27.html; see also Letter from CMS Administrator Marilyn Tavenner to Medicaid Director Joseph Moser (Jan. 27, 2015), available at http://www.in.gov/fssa/hip/files/IN_HIP_2.0_CMS_Approval_Ltr_1_27_15.pdf. ↩︎
  6. Pennsylvania’s NMET waiver requires that the state provide NEMT beginning in year 2.  Iowa and Pennsylvania waive premiums in the first year of their demonstrations.  Iowa provides a 90 day grace period, and the state must waive premiums for beneficiaries who self-attest to financial hardship.  Pennsylvania provides a 90 day grace period, and beneficiaries may re-enroll in coverage without a lock-out period after termination for non-payment.  Michigan’s demonstration also includes premiums up to 2% of income for beneficiaries above 100% FPL, but premiums are not a condition of eligibility and are waived for at least the first  six months of the demonstration. ↩︎
  7. These include all services rated “A” or “B” by the U.S. Preventive Services Task Force, immunizations recommended by the CDC Advisory Committee on Immunization Practices, and services for infants, children, adolescents, and women supported by HRSA guidelines. ↩︎
  8. Other qualifying events include obtaining and subsequently losing private coverage, losing income after being disqualified for increased income, residing in a county subject to a disaster declaration within 60 days prior to termination for non-payment, and other circumstances specified by the state. ↩︎
  9. Technically, these beneficiaries receive an ABP that is equivalent to the state plan benefit package. ↩︎
  10. Copayments under HIP Basic: Service HIP Basic Plan Co-Payments Preventive services* $0 Outpatient services $4 Inpatient services $75 Preferred drugs $4 Non-preferred drugs $8 Non-emergency ER visit $8 for first visit, $25 for subsequent visits** *Including family planning services ** $8 for all visits for control group ↩︎
  11. The debt is limited to the amount of the beneficiary’s pro rata share of claims paid during the coverage period or amounts permissible under Medicaid cost-sharing rules for deductibles, whichever is less. ↩︎
  12. Refunds are based on premium payments in excess of the beneficiary’s pro rata share of claims at disenrollment. ↩︎
  13. Technically, these beneficiaries receive an ABP that is equivalent to the state plan benefit package. ↩︎

Summary of Medicare Provisions in the President’s Budget for Fiscal Year 2016

Authors: Gretchen Jacobson, Cristina Boccuti, Juliette Cubanski, Christina Swoope, and Tricia Neuman
Published: Feb 3, 2015

On February 2, 2015, the Office of Management and Budget released President Obama’s budget for fiscal year (FY) 2016, which includes provisions related to Medicare. The President’s budget proposal would use federal savings and revenues to reduce the deficit, replace sequestration of Medicare and other federal programs for 2016 through 2025, and pay for new spending priorities.

The President’s FY2016 budget proposal would reduce net Medicare spending by $423 billion between 2016 and 2025, and is estimated to extend the solvency of the Medicare Hospital Insurance Trust Fund by approximately five years. This brief summarizes the Medicare provisions included in the President’s FY2016 Budget, with highlights noted below:

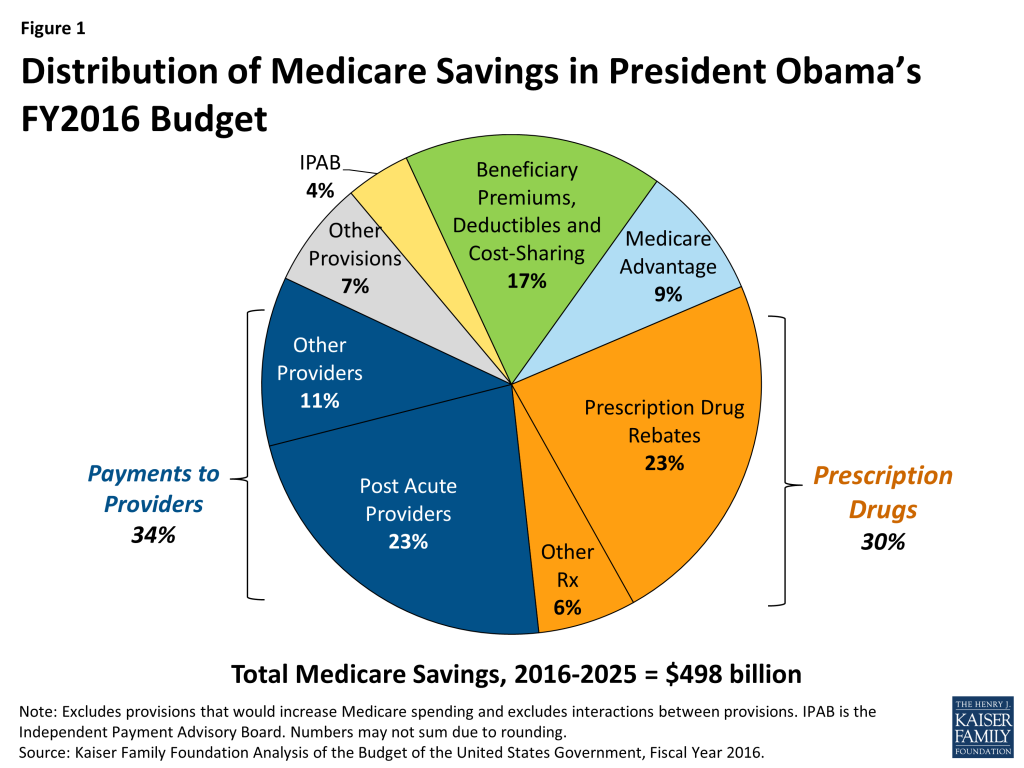
  • More than one-third (34%) of the proposed Medicare savings are due to reductions in Medicare payments to providers, most of which affect providers of post-acute care (Figure 1).
  • Nearly one-third (30%) of the proposed savings are related to Medicare prescription drug spending. The largest single-source of Medicare savings (23% of Medicare savings) is a provision that would require drug manufacturers to provide Medicaid rebates on prescriptions for Part D Low Income Subsidy enrollees, a proposal which was also included in the President’s FY2014 and FY2015 proposed budgets.
  • About one-sixth (17%) of the proposed Medicare savings is due to increases in income-related premiums, increases in prescription drug copayments for low-income enrollees to encourage the use of generic drugs, an increase in the Part B deductible for new enrollees, and a new home health copayment for new enrollees.
  • The President’s FY2016 budget would also repeal the Sustainable Growth Rate (SGR) formula and proposes about $54 billion in new Medicare spending, including, for example, provisions to reform physician payments and eliminate the 190-day lifetime limit on inpatient psychiatric care.
Figure 1: Distribution of Medicare Savings in President Obama’sFY2016 Budget

Many of the proposals in the President’s FY2016 budget were included in the FY2015 budget; new provisions are denoted with asterisks. Total budget estimates reflect the net 10-year budget effects of these proposals, FY2016-2025; for proposals implemented after 2016, the effects are for fewer than 10 years.

Summary of Medicare Provisions in the President’s Budget

General Provisions Pertaining to Medicare Expenditures

  • The Independent Payment Advisory Board (IPAB): Would lower the IPAB target growth rate for Medicare spending from GDP+1 percent to GDP+0.5 percent for 2018 and future years. The FY2015 budget included a similar provision, although the budgetary impact was smaller because it included one less year of Medicare spending, which is projected to grow at a faster rate in future years. Estimated budget impact, FY2021-2025: -$20.88 billion
  • Sequestration of Medicare Spending: Would replace sequestration with other savings and revenue provisions.

Physician Payments and the Sustainable Growth Rate (SGR) Formula

  • Physician Payment Reform:  Would repeal the Medicare Sustainable Growth Rate (SGR) formula; the Administration’s adjusted baseline assumes the cost associated with preventing a reduction in Medicare physician payments, FY2016-2025: +$108 billion.  The FY2016 budget also proposes to reform Medicare physician payments in line with provisions included in H.R. 4015 and S. 2000 developed in the 113th Congress. In these bills, physicians are given the choice to receive performance-based payments from Medicare or receive added payments if they participate in delivery models that account for both spending and quality.  Estimated budget impact (details of proposed reforms unspecified), FY2016-2025: +$43.99 billion
  • Primary Care Incentive Payments*: Would convert the current, temporary 10-percent Medicare primary care bonus payment program (set to expire at the end of 2015) into a permanent program that is budget neutral within the Medicare physician fee schedule. Estimated budget impact, FY2016-2025: no budget impact1 

Medicare Payments to Other Providers

Total Budget Impact: -$167.84 billion

  • Post-Acute Care Providers: Would restructure payments for post-acute care services using a bundled payment approach, beginning in 2020. Would reduce payment updates for certain post-acute care providers, equalize payments for certain conditions commonly treated in inpatient rehabilitation facilities (IRFs) and skilled nursing facilities (SNFs), and require that 75 percent of IRF patients require intensive rehabilitative services, beginning in 2016. Estimated budget impact, FY2020-2025: -$113.56 billion
  • Hospital Outpatient Payments*: Would lower payments to services provided in off-campus hospital outpatient departments to either the applicable physician fee schedule rate or the ambulatory surgical center (ASC) rate. Changes would be phased in beginning in 2017. Estimated budget impact, FY2017-2025: -$29.5 billion
  • Indirect Medical Education (IME): Would reduce provider payments for IME to align with patient care costs, beginning in 2016. Estimated budget impact, FY2016-2025: -$16.26 billion
  • Critical Access Hospitals: Would reduce critical access hospital payments to 100 percent of reasonable costs, and eliminate the designation for those critical access hospitals within 10 miles of the nearest hospital, beginning in 2016. Estimated budget impact, FY2016-2025: -$2.50 billion
  • Hospital Readmissions and Hospital-Acquired Conditions*: Would establish a comprehensive hospital-wide readmissions measure and change the documentation requirements for the hospital-acquired conditions program. Estimated budget impact, FY2016-2025: no budget impact
  • Additional Providers: Would exclude certain services from the in-office ancillary services exception; modify the documentation requirements for face-to-face encounters for durable medical equipment, prosthetics, orthotics and supplies claims; clarify the Medicare Fraction in the Medicare DSH statute; implement value-based purchasing for SNFs, home health agencies (HHAs), ambulatory surgical centers (ASCs), hospital outpatient departments (HOPDs), and community mental health centers; and expand the availability of Medicare data released to qualified entities. Estimated budget impact, FY2017-2025: -$6.02 billion

Prescription Drugs

Total Budget Impact: -$147.88 billion
  • Part D Prescription Drug Rebate: Would require drug manufacturers to provide rebates on behalf of Part D low-income subsidy (LIS) enrollees that are no less than Medicaid rebate levels, and to provide an additional rebate for brand-name and generic drugs whose prices grow faster than inflation, beginning in 2017. Estimated budget impact, FY2017-2025: -$116.13 billion
  • Pay for Delay: Would prohibit “pay for delay” arrangements between brand and generic drug manufacturers. Estimated budget impact for Medicare, FY2016-2025: -$10.06 billion; for Medicare and other federal health care programs combined, FY2016-2025: -$11.51 billion
  • Part D Prescription Drug Discounts: Would increase the manufacturer discounts for brand-name drugs in the Part D coverage gap from 50 percent to 75 percent, closing the gap for brand-name drugs by 2017, three years earlier than under current law. Estimated budget impact, FY2017-2025: -$9.43 billion
  • Part B Drugs: Would modify the reimbursement of Part B drugs by reducing payments from 106 percent to 103 percent of the average sales price. Estimated budget impact, FY2016-2025: -$7.38 billion
  • Biologics: Would shorten the length of exclusivity for biologics from 12 years to 7 years, and prohibit additional periods of exclusivity for brand-name biologics due to minor changes in product formulations. Estimated budget impact for Medicare, FY2016-2025: -$4.40 billion; for Medicare and other federal health care programs combined, FY2016-2025: -$4.53 billion
  • Mandatory Reporting of Drug Coverage*: Would require group health plans that offer a prescription drug benefit to report their plan enrollees with drug coverage to HHS or Part D plan sponsors.   Estimated budget impact, FY2016-2025: -$0.48 billion
  • Drug Price Negotiation*: Would allow the Secretary of HHS to negotiate prices for biologics and high-cost prescription drugs eligible for placement on the Part D specialty tier. Manufacturers would be required to supply HHS with all data and information necessary to come to an agreement on price. The final price would be indexed to the Consumer Price Index and plan sponsors would be permitted to negotiate additional discounts off this price. Estimated budget impact, FY2016-2025: no budget impact
  • Part D Bonus Payments: Would provide new bonus payments to Part D plans with high quality star ratings (4 stars or more). Plans with high ratings would have a larger portion of their bid subsidized by Medicare, while plans with lower ratings would receive a smaller subsidy. Would be implemented in a budget neutral manner. Estimated budget impact, FY2016-2025: no budget impact
  • Preventing Prescription Drug Abuse in Part D*:  Would give the Secretary of HHS the authority to establish a program requiring certain Medicare beneficiaries to utilize only certain prescribers/pharmacies to obtain prescriptions for controlled substances.  Estimated budget impact, FY2016-2025: no budget impact
  • Retroactive Part D Coverage for LIS Beneficiaries: Would permanently authorize a demonstration (the LI NET program) allowing CMS to contract with a single plan to provide retroactive drug coverage for Part D LIS beneficiaries while their eligibility is being processed. Estimated budget impact, FY2016-2025: no budget impact
  • Suspend Coverage and Payment for Some Part D Drugs: Would provide the Secretary of HHS with the authority to suspend coverage and payment for questionable Part D prescriptions and incomplete clinical information. Estimated budget impact, FY2016-2025: no budget impact

Beneficiary Premiums, Deductibles And Cost-Sharing

Total Budget Impact: -$83.81 billion
  • Income-Related Part B and Part D Premiums: Would increase the current law income-related premiums paid under Medicare Parts A and B, and expand the share of beneficiaries who would be subject to income-related premiums. Under current law, premiums for most people on Medicare equal 25 percent of projected average per capita Part B expenditures and 25.5 percent of average per capita Part D expenditures. Beneficiaries with higher incomes (more than $85,000 for individuals and $170,000 for married couples), including 5 percent of beneficiaries in 2014, are required to pay higher premiums, ranging from 35 percent to 80 percent of per capita costs (up to $336 per month for the Part B premium), depending on their income; these thresholds are fixed though 2019, and will be indexed to rise with inflation beginning in 2020.The proposal would increase the payment for the lowest income-related premium tier from 35 percent to 40 percent of projected per capita expenditures, and create new tiers of income-related premium payments every 12.5 percentage points, with a cap at 90 percent of projected per capita expenditures. It also would maintain a freeze on current-law income-related thresholds until 25 percent of Medicare beneficiaries pay income-related premiums. Estimated budget impact, FY2019-2025: -$66.41 billion
  • Part D Copayments for Low-Income Subsidy (LIS) Beneficiaries: Would increase copayments to twice the level required under current law for specified brand-name drugs with appropriate generic substitutes for Part D LIS beneficiaries to encourage greater use of generic drugs; beneficiaries could receive drugs at current copayment levels with successful appeal of a coverage determination, and low-income beneficiaries qualifying for institutional care would be excluded from the policy. Estimated budget impact, FY2017-2025: -$8.86 billion
  • Part B Premium Surcharge on “Near First-Dollar” Medigap Coverage: Would introduce a surcharge on Part B premiums that would be equivalent to about 15 percent of the average Medigap premium for new beneficiaries that purchase Medigap policies with “particularly low cost-sharing requirements,” starting in 2019. Estimated budget impact, FY2019-2025: -$3.97 billion
  • Part B Deductible: Would increase the Part B deductible for new beneficiaries by $25 in 2019, 2021, and 2023. Current beneficiaries or those nearing Medicare eligibility would not be subject to the higher deductible. Under current law, the Part B deductible is uniform across all beneficiaries ($147 in 2015) and is indexed to rise in accordance with changes in Medicare Part B per capita spending. Estimated budget impact, FY2019-2025: -$3.74 billion
  • Home Health Copayment: Would introduce a new copayment of $100 per home health episode, for episodes with five or more visits not preceded by a hospital or post-acute care stay, applicable only to new beneficiaries starting in 2019. Under current law, Medicare does not impose a copayment on home health services. Estimated budget impact, FY2019-2025: -$0.83 billion
  • Medicare Part B Late Enrollment Penalty*:  Would clarify that the Part B premium “hold-harmless” provision does not apply to the calculation of the Part B late enrollment penalty, but only to the annual increase to the basic Part B premium, consistent with current CMS practice.  Current law prohibits an increase in the Part B premium that would otherwise result in a reduction in an individual’s monthly Social Security payments in a year where the Social Security cost-of-living adjustment (COLA) is insufficient to cover the amount of the Part B premium increase for an individual.  Estimated budget impact, FY2016-2025: no budget impact

Medicare Advantage

Total Budget Impact: -$43.40 billion
  • Coding Intensity Adjustment: Would increase the minimum coding intensity adjustment for payments to Medicare Advantage plans. Estimated budget impact, FY2017-2025: -$36.24 billion
  • Employer-Group Plans: Would align payments for Medicare Advantage employer group waiver plans with the average individual Medicare Advantage bid in each Medicare Advantage payment area. Estimated budget impact, FY2017-2025: -$7.16 billion

Accountable Care Organizations (ACOs)

Total Budget Impact: -$0.14 billion
  • Providers Eligible to be Assigned Beneficiaries in Shared Savings ACOs*: Would allow CMS to assign beneficiaries to Federally Qualified Health Centers and Rural Health Clinics participating in the Medicare Shared Savings ACO Program. Estimated budget impact, FY2019-2025: -$0.08 billion
  • Beneficiary Assignment to ACOs*: Would expand the basis for beneficiary assignment to ACOs to include beneficiary use of nurse practitioners, physician assistants, and clinical nurse specialists. Estimated budget impact, FY2020-2026: -$0.06 billion
  • Cost Sharing for Primary Care*: Would allow ACOs to pay beneficiaries for primary care visits up to the applicable Medicare cost-sharing amount. Participation would be voluntary and no additional payments would be made to ACOs to cover the costs of this proposal. Estimated budget impact, FY2016-2025: no budget impact

Medicare Coverage

Total Net Budget Impact: +$4.80 billion
  • Psychiatric Care*: Would eliminate the 190-day lifetime limit on inpatient psychiatric facility services. Estimated budget impact, FY2016-2025: +$5.0 billion
  • Dialysis Services*: Would expand Medicare coverage of short-term scheduled dialysis services for beneficiaries with acute kidney injury. Estimated budget impact, FY2016-2025: -$0.2 billion.

Dual-Eligible Beneficiaries

Total Net Budget Impact: +$0.975 billion
  • Qualified Individuals: Would extend the program to pay Part B premiums for qualified individuals (QIs) through 2017. The QI program provides premium assistance to low income beneficiaries through a block grant which is currently authorized through March 31, 2015. Estimated budget impact, FY2015-2017: +$0.975 billion
  • Program for All-Inclusive Care for the Elderly (PACE) Program: Would initiate a budget-neutral pilot in a limited number of states to expand eligibility requirements for the PACE program to include beneficiaries dually eligible for Medicare and Medicaid who are between the ages of 21 and 55 to test whether PACE programs can effectively serve a younger population without increasing costs. Current law limits the PACE program to dually eligible beneficiaries ages 55 and older. Estimated budget impact, FY2016-2025: no budget impact
  • Appeals Process for Dual-Eligible Beneficiaries: Would implement a single beneficiary appeals process for managed care plans that integrate Medicare and Medicaid payment and services and serve dual-eligible beneficiaries. Estimated budget impact, FY2016-2025:no budget impact
  • Special Needs Plans for Dual-Eligible Beneficiaries (D-SNPs)*: Would allow for joint Federal-State coordinated review of marketing materials for Medicare Advantage D-SNPs, which are managed care plans that integrate Medicare and Medicaid payment and services and serve Medicare-Medicaid enrollees. Estimated budget impact, FY2016-2025: no budget impact

Other Medicare Provisions

Total Net Budget Impact: -$32.145 billion
  • Bad Debt: Would reduce bad debt payments from 65 percent to 25 percent over three years to more closely match private sector standards; details not specified. Estimated budget impact, FY2016-2025: -$31.08 billion
  • Fraud, Waste, and Abuse: Would aim to reduce fraud, waste, and abuse in Medicare through several measures, including creating new initiatives to reduce improper payments in Medicare and requiring prior authorization for power mobility devices and advanced imaging, as well as other items and services at high risk of fraud and abuse. Estimated budget impact, FY2016-2025: -$1.821 billion
  • Appeals*: Would provide the Office of Medicare Hearings and Appeals and Departmental Appeals Board authority to use Recovery Audit Contractor (RAC) collections; establish Medicare appeals refundable filing fee; remand appeals to the redetermination level with the introduction of new evidence; increase minimum amount in controversy for administrative law judge (ALJ) adjudication of claims to equal amount required for judicial review; establish magistrate adjudication for claims with amount in controversy below new ALJ amount in controversy threshold; and expedite procedures for claims with no material fact in dispute. Estimated budget impact, FY2016-2025: +$1.27 billion
  • Delinquent Tax Debts: Would levy up to 100 percent of payments to Medicare providers with delinquent tax debts, beginning in 2015. Estimated budget impact, FY2016-2025: – $0.514 billion


  1. Note that the U.S. Department of Health and Human Services Budget in Brief for Fiscal Year 2016 refers to provisions that the Office of Management and Budget determines will have a budget impact of “$500 million or less” as provisions with “no budget impact”. ↩︎

An Overview of New CMS Data on the Number of Adults Enrolled in the ACA Medicaid Expansion

Authors: Laura Snyder, Samantha Artiga, Robin Rudowitz, and Jessica Stephens
Published: Feb 2, 2015

Issue Brief

New preliminary data from the Medicaid Budget and Expenditure System (MBES) released by the Centers for Medicare and Medicaid Services (CMS) details for the first time the number of adults enrolled in Medicaid under the new Affordable Care Act (ACA) Medicaid expansion category. The data show that as of March 2014, among 48 states reporting data, 4.8 million adults out of the total 54.1 million individuals enrolled in Medicaid were in the ACA Medicaid expansion category (referred to as the VIII Group based on the section of legislation that added the expansion eligibility category). Missing from this preliminary data report are DC, North Dakota and California, which due to its size accounts for a large share of Medicaid enrollees. The 4.8 million expansion adults includes 3.2 million adults that qualify for 100% federal match funding as individuals made newly eligible under the ACA and 1.5 million adults who fall into the adult expansion category but do not qualify for the full 100% federal match funding, but qualify for other enhanced match rates made available under the law.

These data were released as part of state quarterly expenditure reports that are submitted to CMS through the MBES to claim federal matching funds, which began including enrollment data starting with the January through March 2014 quarter. These data provide another element of Medicaid enrollment that differs from other enrollment data released from CMS as part of its Medicaid and CHIP Performance Indicator Project, which provide point-in-time Medicaid and CHIP enrollment data to support program management and oversight. These two data sets are not comparable; they have different purposes and include different populations. This issue brief provides an overview of the new data as well as how it differs from the Performance Indicator data. Appendix Table 1 provides state by state enrollment data for March 2014.

Where Do these Data Come From?

States submit quarterly expenditure reports to CMS through the MBES to claim federal Medicaid reimbursement for covered services provided to Medicaid enrollees. States submit these reports to CMS using a CMS-64 form following the end of each quarter (usually within 30 days of the close of the quarter). When states submit the expenditure reports, they certify the data are accurate and CMS conducts a limited review to assess whether the data are reasonable. Historically, these expenditure data have not included any information on enrollment or spending by eligibility group. However, to enable states to claim the enhanced funding available for adults made newly eligible by the ACA, CMS revised the CMS-64 form to require states to report claims separately by eligibility group, including separate reporting of claims for newly eligible adults. In addition, for the first time, the CMS-64 form includes enrollment data by eligibility group. Since this data claiming and reporting process is new, ensuring that the data are comparable and accurate across states may take time.1  To date CMS has only released enrollment data and not spending data from the MBES.

What does the MBES enrollment data show?

The preliminary MBES enrollment data released to date provide total Medicaid enrollment and enrollment in the ACA Medicaid expansion category for January through March 2014 for 48 states. The enrollment counts include the number of individuals enrolled at any time during the reporting month. Analysis of the March 2014 preliminary enrollment data shows the following:

During March 2014, nearly 4.8 million adults were covered through the ACA Medicaid expansion category, which includes non-disabled, non-elderly adults with incomes up to 138% FPL ($16,105 for an individual in 2014). This total includes data for 22 of the 25 states that had adopted the Medicaid expansion at that time; data were not available for California, the District of Columbia, and North Dakota. (Since March 2014, four additional states—MI, NH, PA, and IN—have adopted the Medicaid expansion.2 ) The 4.8 million expansion adult enrollees accounted for 9% of the total 54.1 million individuals enrolled in Medicaid during March 2014 among the 48 reporting states (Figure 1), and 18% of the 26.7 million total Medicaid enrollees in the 22 states that had adopted the expansion and reported data. However, expansion adults as a share of total Medicaid enrollment varied significantly across states from 5% in Ohio to 50% in Oregon.

Figure 1: Medicaid Enrollment by ACA Expansion Group Status, March 2014

The 4.8 million expansion adults within the 22 reporting states that had adopted the expansion included 3.2 million newly eligible adults (68%) who qualify for 100% federal match funds and 1.5 million adults (32%) who are enrolled in the expansion category but do not qualify for the 100% federal match. (Figure 1) There are several reasons why states have adults enrolled in the expansion category who do not qualify for the newly eligible 100% federal match. First, for states that had already expanded coverage to parents and other adults statewide up to at least 100% FPL as of March 23, 2010 when the ACA was enacted, the ACA includes a special “expansion” or “transition” matching rate in recognition that they already provided higher levels of Medicaid coverage ahead of the ACA; it provides a phased-in increase in the federal matching rate for these adults. Second, states may have some adults enrolled in the expansion group who do not qualify for the 100% federal match based on a number of technical adjustments associated with transitioning a state’s pre-ACA eligibility limits to new MAGI-based limits under the ACA (See Text Box 1).

Text Box 1: Understanding Different Matching Rates Under the ACA Expansion Group

Newly-Eligible Matching Rate. The ACA provides 100% federal financing for those made newly eligible for Medicaid under the law. The federal match rate falls to 95% in 2017, 94% in 2018, 93% in 2019, and then 90% in 2020 and beyond. Beginning in 2014, it is available for non-elderly, non-disabled adults with incomes up to 138% FPL who would not be eligible for Medicaid under the rules that a state had in place on December 1, 2009.

“Expansion” States Matching Rate. The “expansion” or “transition” matching rate is designed to provide some additional federal funding to “expansion” states that had already expanded coverage to parents and childless adults up to at least 100% FPL statewide as of March 23, 2010, when the ACA was enacted. In recognition of these states already provided coverage at these higher Medicaid eligibility levels, these states can receive a phased-in increase in their federal matching rate for adults without dependent children under age 65 beginning on January 1, 2014 so that by 2019 it will equal the enhanced matching rate available for newly-eligible adults. In addition, expansion states that do not have any newly-eligible Medicaid beneficiaries because they already covered people up to 138% FPL or higher (e.g. Massachusetts) also receive a temporary (January 1, 2014 through December 31, 2015) 2.2 percentage point increase in their federal matching rate for all populations.

Technical Adjustments Related to Who Qualifies for 100% Federal Funding for Newly Eligible Adults. Whether an individual qualifies for the 100% newly eligible federal match rate is based on a comparison of the individual’s income to the income standard in effect in the state on December 1, 2009, converted to an equivalent MAGI-based income standard. Individuals with incomes at or below the converted MAGI-based income standard will not be considered newly eligible and individuals with incomes above the converted standard are newly eligible and eligible for the enhanced match rate. As part of the conversion to MAGI, states may make adjustments to account for individuals who would not have been eligible because of asset test requirements in place on December 1, 2009, enrollment caps that may have been in effect for waiver populations receiving full benefits as of December 1, 2009, and other special circumstances. These adjustments may result in some adults being enrolled in the expansion category who do not qualify for the 100% federal match for newly eligible adults.

See Understanding How States Access the ACA Enhanced Medicaid Match Rates for more details.

Reflecting variation in eligibility levels prior to the ACA, the share of expansion adults that qualified for the 100% federal match for newly eligible adults differs across states. For example, states like New York, Massachusetts, Delaware, and Vermont, which had previously provided full Medicaid coverage to parents and other adults up to at least 100% FPL, have higher shares of expansion adults who do not qualify for the 100% federal match for newly eligible adults. Instead, these adults qualify for the “expansion” or “transition” rates, given to states in recognition of their earlier expansions to adults at higher income levels, which will phase-in increases so that by 2019 it will equal the enhanced matching rate available for newly-eligible adults. In contrast, in states like Kentucky or Nevada, which had not previously covered childless adults and had low eligibility limits for parents, all adults in the expansion category qualify for the 100% federal match for newly eligible adults (Figure 2).

Figure 2: ACA Expansion Adults (Group VIII Enrollees), by Newly Eligible Status, Preliminary Data for March 2014

Enrollment of adults in the expansion group is concentrated in a small number of states. Half of the total 4.8 million adults enrolled in the expansion group during March 2014 resided in five states (New York, Oregon, New Jersey, Illinois and Washington State.) (Figure 3) However this distribution varied for the 3.2 million expansion adults who qualify for the 100% federal match for newly eligible adults. Over half resided in New Jersey, Illinois, Washington State, Oregon and Kentucky (Figure 3). If data from California were available, these shares would likely change.

Figure 3: Enrollment Among Expansion Adults and Newly Eligible Expansion Adults by State, March 2014

What Are the Limitations of these Data?

While these data provide new information that shed light on the number of adults covered through the ACA Medicaid expansion, there are some key limitations to recognize:

  • The enrollment data reported are being collected for the first time on new revised CMS-64 forms. The CMS-64 form is a statement of expenditures for which states are entitled to federal Medicaid reimbursement. These data historically have not included information about enrollment or spending by eligibility group. To account for the newly eligible federal match rate, CMS has revised the CMS-64 form to require states to report claims separately by eligibility group, including separate reporting for newly eligible adults, as well as to report enrollment by eligibility group. Since this data reporting process is new, ensuring that the data are comparable and accurate across states may take time. Moreover, because these initial data are preliminary, states may continue to provide updates to the enrollment data over time, so the numbers will change.
  • Some data from states that have adopted the expansion are not available. The data include enrollment counts for 22 of the 25 states that had adopted the Medicaid expansion as of March 2014. Data for California, the District of Columbia, and North Dakota are not available. The lack of data from California significantly affects the total numbers due to the large population size of the state. In addition, since March 2014, four additional states (Indiana, Michigan, New Hampshire and Pennsylvania) have adopted the expansion, which will increase the number of adults enrolled under the Medicaid expansion group in future quarters.
  • The purpose of the enrollment data collected through this reporting is to determine appropriate matching rates for the new ACA expansion adults; it is not intended to be the primary source of Medicaid enrollment data. Data collection through the forthcoming Transformed Medicaid Statistical Information System (T-MSIS) will contain enhanced information about key eligibility, enrollment, utilization and expenditure data and statistics for Medicaid and CHIP and will serve as the primary data source on Medicaid enrollment from CMS. This data is for financial purposes; states may continue to make adjustments over time as part of the normal claims process.

How does this compare to other data sources?

Since December 2013, CMS has been providing another source of monthly enrollment data for Medicaid and CHIP as part of its Medicaid and CHIP Performance Indicator Project. There are important differences between the Performance Indicator and MBES enrollment data that limit the ability to make comparisons between the two datasets, as discussed below and highlighted in Table 1:

  • The data vary in their intended purpose. The MBES enrollment data are collected as part of the claiming process for federal Medicaid matching funds only, not CHIP. The Performance Indicator data are intended to provide timely insight into Medicaid and CHIP eligibility and enrollment trends to support program management and oversight.
  • There are key differences in who is included in the enrollment data. The MBES enrollment data include all enrollees whose spending is eligible for Medicaid matching funds (including limited benefit waiver enrollees and Medicare enrollees that receive cost-sharing and premium assistance from Medicaid). In contrast, the Performance Indicator enrollment data only include enrollees that receive full benefit coverage. Moreover, the MBES enrollment data only include enrollment in Medicaid and not CHIP; the claiming process for CHIP, which has different matching rates, is done separately. The Performance Indicator data include enrollment for both Medicaid and CHIP.
  • There are differences in the timing of the data. The MBES data include individuals enrolled in the state’s Medicaid program at any time during the month of the reporting period. In contrast, the Performance Indicator data are a point-in-time count based on the number of individuals enrolled as of the last day of the month. The MBES enrollment data cover the period between January and March 2014, while the most recent monthly Performance Indicator report included data through November 2014.
Table 1: Differences Between CMS MBES and Performance Indicator Enrollment Data
MBES DataPerformance Indicator Data
Eligibility Groups includedAll Medicaid enrollees, including those receiving limited benefits (e.g., limited benefit waiver enrollees and Medicare enrollees receiving cost-sharing and premium assistance from Medicaid). Does not include CHIP enrollees.Includes enrollees in Medicaid and CHIP enrollment. Does not include enrollees receiving limited benefits.
Enrollment data periodTotal number of enrollees ever enrolled during the month. (Data are reported on a quarterly basis.)Total number of enrollees as of the last day of the month.
Frequency of reportingQuarterlyMonthly
Most recent data available as of February 2015March 2014November 2014
Data purposeCollected as part of the claiming process for federal Medicaid matching funds.Collected as part of new Medicaid and CHIP Performance Indicator Project to inform program management and oversight.

Looking Ahead

This new MBES enrollment data provide further insight into the early effects of the Medicaid expansion on Medicaid enrollment. However, the data are preliminary and this is the first time enrollment data have been collected as part of the claiming process. It differs from other enrollment data collected as part of the CMS Performance Indicator project in many ways, limiting the ability to make comparisons between the datasets. Data collection through the forthcoming T-MSIS system (which will use the same definition as the CMS-64 claims process) will undergo a more thorough quality review and is intended to serve as the authoritative source of Medicaid enrollment data moving forward. This brief will be updated as more data become available.

Appendix

Appendix Table 1: MBES Enrollment Data, March 2014

 StateTotal Medicaid EnrollmentMedicaid Expansion EnrollmentExpansion as a % of TotalNewly Eligible EnrollmentNewly Eligible as a % of Expansion
Alabama1,022,171N/AN/A
Alaska110,050N/AN/A
Arizona1,475,310214,52215%24,99612%
Arkansas865,866212,50225%187,83888%
CaliforniaNot Available (NA)NANANANA
Colorado976,972211,38922%210,01399%
Connecticut693,075127,67618%127,676100%
Delaware197,67953,06327%4,3568%
DCNot Available (NA)NANANANA
Florida3,828,560N/AN/A
Georgia1,670,971N/AN/A
Hawaii333,09072,91722%45,84663%
Idaho276,009N/AN/A
Illinois2,850,529384,91214%384,536100%
Indiana1,082,404N/AN/A
Iowa523,28183,88016%81,12197%
Kansas363,360N/AN/A
Kentucky1,060,566247,89923%247,899100%
Louisiana1,243,095N/AN/A
Maine298,463N/AN/A
Maryland1,091,423163,92715%163,927100%
Massachusetts1,740,078296,56517%00%
Michigan1,832,594N/AN/A
Minnesota986,434149,59615%148,77699%
Mississippi662,433N/AN/A
Missouri780,053N/AN/A
Montana149,587N/AN/A
Nebraska237,280N/AN/A
Nevada404,66263,69316%63,693100%
New Hampshire136,663N/AN/A
New Jersey1,464,215395,41527%395,415100%
New Mexico649,389115,23118%115,231100%
New York5,672,421876,01915%70,1418%
North Carolina1,833,362N/AN/A
North DakotaNot Available (NA)NANANANA
Ohio2,447,745120,8635%120,863100%
Oklahoma765,059N/AN/A
Oregon847,923424,68550%340,63980%
Pennsylvania2,094,487N/AN/A
Rhode Island250,29439,13116%39,131100%
South Carolina1,068,510N/AN/A
South Dakota107,575N/AN/A
Tennessee1,368,261N/AN/A
Texas3,965,101N/AN/A
Utah296,528N/AN/A
Vermont186,87543,67823%00%
Virginia887,379N/AN/A
Washington1,545,269371,39724%353,60095%
West Virginia471,285103,66222%103,662100%
Wisconsin1,172,629N/AN/A
Wyoming68,891N/AN/A
Total54,055,8564,772,6229%3,229,35968%
NOTE: Data are preliminary. Data are not available for California, Washington DC, or North Dakota.SOURCE: Medicaid Enrollment data collected from the Medicaid Budget and Expenditure System (MBES), Centers for Medicare and Medicaid Services. Accessed January 23, 2015. http://www.medicaid.gov/medicaid-chip-program-information/program-information/medicaid-and-chip-enrollment-data/medicaid-enrollment-data-collected-through-mbes.html.

Endnotes

  1. For more information on the Medicaid claims process and changes under the ACA, see the following brief: Robin Rudowitz, Understanding How States Access the ACA Enhanced Medicaid Match Rates. Kaiser Family Foundation, September 2014. https://modern.kff.org/medicaid/issue-brief/understanding-how-states-access-the-aca-enhanced-medicaid-match-rates/. ↩︎
  2. See Current Status of State Medicaid Decisions, as of January 27, 2015, available at: https://modern.kff.org/health-reform/slide/current-status-of-the-medicaid-expansion-decision/. ↩︎

White House Releases FY16 Budget Request

Published: Feb 2, 2015

The White House released the FY 2016 budget request on February 2, 2015, which includes funding for U.S. global health programs. A significant portion of U.S. funding for global health, including funding at the U.S. Agency for International Development (USAID) and the Department of State, is outlined in the State & Foreign Operations (SFOPs) Congressional Budget Justification (CBJ), however, total funding for global health is not currently available as some funding provided through USAID, Health and Human Services (HHS), and the Department of Defense (DoD) is not yet available. The table below compares the FY 2016 request to final FY 2015 enacted funding amounts as outlined in the “Consolidated and Further Appropriations Act, 2015” (H.R. 83).

In the FY 2016 budget request, funding for global health programs at USAID and the State Department (through the Global Health Programs account) would total $8,181 million, which is $273 million (3%) below the FY 2015 enacted level. Funding for tuberculosis, neglected tropical diseases (NTDs), global health security (formerly pandemic influenza and emerging threats), nutrition, and vulnerable children all declined compared to FY 2015, while malaria, maternal & child health (MCH), and family planning & reproductive health (FP/RH) funding increased. The U.S. contribution to Gavi, the Vaccine Alliance, which is included as part of MCH funding, also increased compared to the FY 2015 enacted level.

While funding for bilateral HIV programs at the State Department and USAID remained essentially flat, the base U.S. contribution to the Global Fund to Fight AIDS, Tuberculosis and Malaria (Global Fund) is $1,107 million or $243 million (18%) below the FY 2015 level. The SFOPs CBJ states that the $1,107 million would fulfill “President Obama’s pledge to provide $1 for every $2 pledged by other donors to the Global Fund and completing the U.S. commitment to the 2014-2016 replenishment.”

(Note: Additional global health funding amounts and analysis will be added as more information becomes available.)

FY16 Request - PT Entry - Table (2-2-15)v2