KFF designs, conducts and analyzes original public opinion and survey research on Americans’ attitudes, knowledge, and experiences with the health care system to help amplify the public’s voice in major national debates.
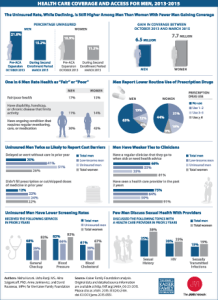
This Visualizing Health Policy infographic provides a snapshot of men’s health care and insurance coverage issues, including health status, access to care and use of services. It compares the uninsured rates of men and women, their cost barriers to care, their connection to clinicians, and their use of prescription drugs, screening, and counseling services. Fewer men than women gained coverage between October 2013 and March 2015, and the uninsured rate continues to be higher for men than women. Although men are less likely than women to experience cost barriers to care, uninsured men are twice as likely as all men to report cost barriers resulting in delayed care or reduced prescription medications. Men are also are less likely to have seen a health care provider in the past two years and seek screening services or discuss their sexual health with providers.
Visualizing Health Policy is a monthly infographic series produced in partnership with the Journal of the American Medical Association (JAMA). The full-size infographic is freely available on JAMA’s website and is published in the print edition of the journal.
This Visualizing Health Policy infographic provides a snapshot of men’s health care and insurance coverage issues, including health status, access to care and use of services. It compares the uninsured rates of men and women, their cost barriers to care, their connection to clinicians, and their use of prescription drugs, screening, and counseling services. Fewer men than women gained coverage between October 2013 and March 2015, and the uninsured rate continues to be higher for men than women. Although men are less likely than women to experience cost barriers to care, uninsured men are twice as likely as all men to report cost barriers resulting in delayed care or reduced prescription medications. Men are also are less likely to have seen a health care provider in the past two years and seek screening services or discuss their sexual health with providers.
Visualizing Health Policy is a monthly infographic series produced in partnership with the Journal of the American Medical Association (JAMA). The full-size infographic is freely available on JAMA’s website and is published in the print edition of the journal.
Following up on an earlier column for The Wall Street Journal’s Think Tank on seniors and poverty, Drew Altman looks at why older women will be more at risk of economic insecurity than men in the future.
All previous columns by Drew Altman are available.
As of Spring 2015, states had completed the second open enrollment period for the new Health Insurance Marketplaces established by the Affordable Care Act (ACA) and most of the 30 states that have adopted the Medicaid expansion to low-income adults were well into their second year of implementation. Two years into implementation, interest remains high in understanding enrollment under the coverage expansions and the extent to which enrollment problems that plagued the initial open enrollment period have been resolved. A range of other questions also have emerged, including how Marketplaces are evolving and impacting consumer choices, the extent to which State-based Marketplaces (SBMs) have achieved financial stability, whether newly insured individuals are accessing care, and what the costs of care have been for Medicaid expansion adults. This brief provides insight into these questions through an on-the-ground view of ACA implementation in five states that identifies areas of progress as well as issues to be addressed. It is based on 40 in-person interviews conducted with a range of stakeholders during April and May 2015 in three states (Colorado, Kentucky, and Washington) that have a SBM and adopted the Medicaid expansion and two states (Utah and Virginia) that rely on the Federally-facilitated Marketplace (FFM) for enrollment of individuals into qualified health plans (QHPs) and have not adopted the Medicaid expansion to date.
Key findings from stakeholders in the study states are highlighted on Table 1. In sum, they show that, as of the second year, most major enrollment systems issues had been resolved. The states that expanded Medicaid continued to experience enrollment growth, and Marketplace enrollment goals were met or surpassed in four of the five states, although affordability remains a key enrollment challenge. In all five states, broad efforts are underway to increase health insurance and health care literacy among newly insured individuals. Per enrollee costs of care for expansion enrollees have been lower than anticipated in the three states that expanded Medicaid. Expansion enrollees generally are able to access needed care, although there are access challenges for some services. Access to care for individuals enrolled in QHPs varies based on their choice of plan.
Looking ahead, the states are focused on a range of priorities, including continued improvements to enrollment systems and efforts to enhance access to care and care coordination. Moreover, in Colorado and Washington, there is significant pressure on the Marketplaces to achieve financial sustainability; in Utah and Virginia, debate around the Medicaid expansion and the outcome of the King v. Burwell Supreme Court case remain the most significant issues; and, in Kentucky, the upcoming gubernatorial election could have significant implications for implementation given the opposition to the ACA among potential candidates.
Table 1: Key Findings on the Second Year of ACA Implementation from Stakeholders in Five States:Colorado, Kentucky, Utah, Virginia, and Washington
Enrollment
In four of the states, most major enrollment system issues had been resolved (KY, UT, WA, and VA).
There was continued enrollment growth in the Medicaid expansion states (CO, KY, WA), with some slowing in the pace of growth (CO, KY) and some increases in children as a share of new enrollees (CO, WA).
Marketplace enrollment goals were met or surpassed in four of the five states (CO, KY, UT, and VA). In KY, the balance between new QHP and Medicaid enrollments was beginning to even out with an increase in the share of new enrollments among QHPs.
In all five states, many consumers successfully renewed QHP coverage, with about half of re-enrollees shopping for new plans. However, some renewal challenges remain, including the need for improved consumer outreach and education about renewal.
Marketplace Plans and Premiums
Three states saw new insurers enter the market (KY, VA, and WA), while two had high continuity among plan offerings (CO and UT).
Four states (CO, KY, UT, and VA) experienced changes in the second lowest cost silver, or benchmark plan, which affected the level of premium tax credits available for eligible consumers.
In two states (VA and KY), low-cost plans with a large market share adopted large premium increases, leaving consumers to renew their plan with a large increase or switch plans.
Despite attempts to educate consumers about total-out-pocket costs, many selected plans based on the lowest premium, leaving them with high deductibles and cost sharing. Some individuals who purchased bronze plans did not maintain their coverage due to high out-of-pocket costs.
Premiums remain unaffordable for some consumers even with subsidies.
Outreach
Messaging moved away from raising awareness to personal testimonials and emphasis on the importance and value of coverage.
Both mass marketing and local level outreach and enrollment assistance remained important, with some shifting away from mass marketing to community efforts.
As the group of uninsured individuals narrows, targeted strategies to reach specific groups have become increasingly important.
Access, Utilization, and Costs
Per enrollee costs of care for Medicaid expansion adults have been lower than anticipated in the three states that expanded Medicaid (CO, KY, and WA).
In the Medicaid expansion states, enrollees are generally able to access needed care, although there are access challenges for certain services and providers.
Access to care for individuals enrolled in QHPs varies based on their choice of plan. Some individuals who selected lower cost plans with limited networks experienced challenges accessing care, although some of these challenges have moderated over time.
In all five states, broad efforts are underway at multiple levels to increase health insurance and health care literacy among newly insured individuals.
In the Medicaid expansion states (CO, KY, and WA), clinics that historically served uninsured populations reported an increase in their share of patients with coverage, but a significant share of their patients still remains uninsured, leaving other funding streams important.
Clinics and hospitals in the non-expansion states (UT and VA) identified a range of financial challenges due to the coverage gap and reductions in funding.
Priorities Looking Ahead
All five states plan to continue to refine and enhance their enrollment systems.
Some stakeholders indicated that they anticipate more limited funding for marketing and outreach next year.
Stakeholders in all five states emphasized the need for continued work to increase individuals’ health insurance and health care literacy. All five states also are engaged in a range of delivery system reforms and care coordination initiatives.
In CO and WA, there is significant pressure on the Marketplaces to achieve financial sustainability.
In UT and VA, debate around adopting the Medicaid expansion remains the most significant issue as well as uncertainties related to the outcome of the King v. Burwell Supreme Court case.
In KY, stakeholders emphasized that the upcoming gubernatorial election could have significant implications, given opposition to the ACA among potential candidates.
Introduction
Introduction
As of Spring 2015, states had completed the second open enrollment period for the new Health Insurance Marketplaces established by the ACA and most of the 30 states that have adopted the Medicaid expansion to low-income adults were well into their second year of implementation, with a few implementing the expansion more recently. With the experience of two open enrollment periods under their belt, states can provide key lessons learned about outreach and enrollment experiences under the ACA. Moreover, with new coverage options now in place for over two years, state experiences can offer early insights into how health care access and utilization is changing as a growing number of people have gained coverage.
This brief provides an on-the-ground view of ACA implementation after completion of the second open enrollment period. It is based on 40 in-person interviews conducted in five states that have made different implementation choices, including three states (Colorado, Kentucky, and Washington) that have developed a SBM and adopted the Medicaid expansion and two states (Utah and Virginia) that rely on the FFM for enrollment of individuals into QHPs and that have not adopted the Medicaid expansion to date. The interviews were conducted by the Kaiser Family Foundation’s Commission on Medicaid and the Uninsured and Perry Undem Research/Communication with a range of stakeholders in each state, including Medicaid and Marketplace officials, consumer advocates, assisters, and hospital and community health center (CHC) representatives, during April and May 2015.
This work builds on previous analysis that examined states’ preparation for implementation prior to the beginning of the initial ACA open enrollment period in October 2013 and a subsequent report that identified key lessons learned from four states leading enrollment efforts at the completion of that first open enrollment period. Together, this body of work provides an in-depth, local level understanding of ACA implementation from multiple perspectives, tracking and documenting experiences and providing key lessons learned to help shape efforts moving forward.
The report presents key findings related to enrollment systems; enrollment and renewal; outreach, marketing, and enrollment assistance; and access to and utilization of care. It concludes with key priorities identified by stakeholders looking head.
Background
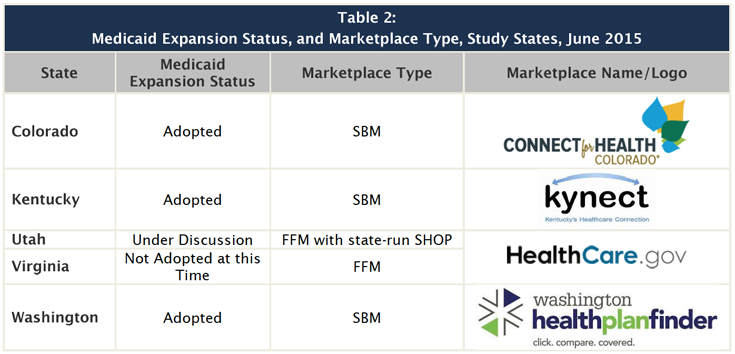
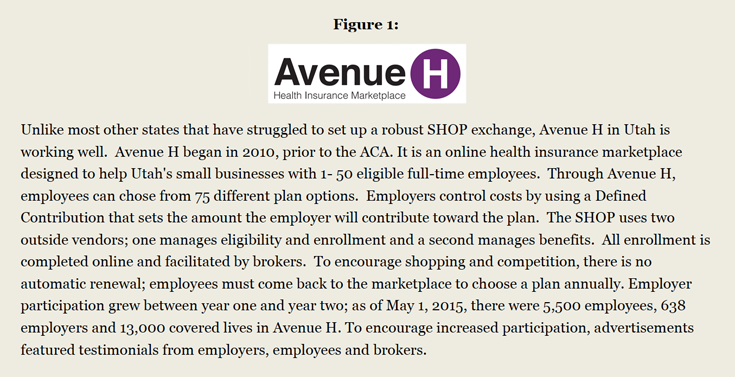
The study states included in this report represent a mix of implementation approaches (Table 2). The ACA expanded health coverage through two key vehicles, new Health Insurance Marketplaces offering QHPs, which provide premium tax credit subsidies to offset the cost of coverage for moderate income adults, and a Medicaid expansion to low-income adults with incomes up to 138% of the federal poverty level. However, the 2012 Supreme Court ruling on the constitutionality of the ACA effectively made the Medicaid expansion optional for states. States have implemented the ACA in varied ways, with some establishing SBMs and others relying on the FFM or a partnership model. For the second open enrollment period, 17 states including the District of Columbia operated a SBM, though three of these states (New Mexico, Nevada, and Oregon) used the federal healthcare.gov website for enrollment; 7 states operated a Partnership Marketplace; and 27 states relied on the FFM. As of June 2015, 30 states, including DC, have adopted the Medicaid expansion, while the remaining 21 states have not, although debate continues in several states. Among the study states, Colorado, Kentucky, and Washington each established their own SBMs and have adopted the Medicaid expansion. Utah and Virginia rely on the FFM, healthcare.gov, to enroll individuals into QHPs, although Utah has its own state-operated Small Business Health Options (SHOP) Marketplace, Avenue H (See Figure 1). Neither state has adopted the Medicaid expansion to date, although there has been ongoing debate about the expansion in both states. Governors in both states put forward proposals for expansion but faced legislative opposition. Virginia’s legislative session concluded without adoption of the expansion, although the Governor continues to support it; Utah’s session concluded with the creation of a committee to continue work this summer followed by a possible special session.
Issue Brief
Key Findings
Enrollment Systems
All three of the SBM study states had single integrated Medicaid/Marketplace enrollment systems during the second open enrollment period, while the two FFM states coordinate enrollment between healthcare.gov and their state Medicaid enrollment systems. The three SBM study states (Colorado, Kentucky, and Washington) each rely on their own state-based enrollment systems for enrollment into Marketplace QHPs and MAGI-based Medicaid. Kentucky and Washington each have had a fully integrated Marketplace and Medicaid system since the initial open enrollment period. Colorado moved from separate Marketplace and Medicaid systems to a single shared eligibility determination system just prior to the second open enrollment period to address challenges coordinating between two systems that it encountered during the first open enrollment period. Virginia and Utah both rely on the FFM to process enrollment in QHPs and maintain separate systems to process Medicaid eligibility determinations.
Many of the major enrollment system issues that affected the initial open enrollment period had been resolved by the beginning of the second open enrollment period. In Kentucky and Washington, stakeholders reported that the state-based enrollment systems functioned very smoothly during year two. Similarly, stakeholders in Virginia and Utah indicated that the FFM functioned significantly better during the second open enrollment period and that problems communicating between the FFM and state Medicaid systems that led to delays and backlogs of applications during the first open enrollment period were mitigated during the second year. However, stakeholders in Utah reported some remaining transfer issues during the early part of the second open enrollment period, and, in Virginia, there were reports of some remaining backlogs. Across these four states, stakeholders noted that more individuals were able to self-enroll because the systems were operating more smoothly, which freed up assistance resources to address more complex cases. In contrast to the other four study states, Colorado experienced system problems after transitioning to a new shared eligibility determination portal. Because building the shared portal took longer than anticipated, it was launched just prior to the second open enrollment period, limiting opportunities to test or train on it. Stakeholders commented that the system had a number of glitches, particularly related to calculating eligibility for advance premium tax credits.
The states continued to improve and refine their enrollment systems leading up to and throughout the second open enrollment period. In Kentucky, the state implemented several enhancements prior to the second open enrollment period. These enhancements included allowing consumers to see premium costs with the advance premium tax credits applied when shopping for plans. In addition, for people who qualify for cost-sharing reductions, the system now displays silver plans at the top of the plan list, given that these plans have the best value for these consumers by providing access to the cost-sharing reductions. In Washington, stakeholders noted continued improvements in real-time determinations for Medicaid, with many individuals now receiving a determination in as little as 15-20 minutes. Similarly, despite the system challenges in Colorado, stakeholders noted that there was a notable increase in the share of Medicaid applications that received real-time determinations, with nearly eight in ten now receiving a real-time decision. Virginia also made improvements to its Medicaid eligibility system to facilitate online enrollment by consumers and stakeholders indicated that there have been fewer delays in Medicaid enrollment during the second year.
Despite major improvements to systems, stakeholders identified a range of remaining issues to address as well as planned further enhancements for the future. For example, in Kentucky, stakeholders noted that there are some continued system problems affecting enrollment for immigrants and refugees and with consumers changing QHPs at renewal. State officials indicated data fixes are being completed in the short-term with a permanent solution to be implemented later this summer. Looking ahead, the state plans to further enhance the system by making improvements to SHOP and the enrollment dashboard available to insurance agents and kynector enrollment assisters. It also will launch a kynect tablet-based application for the individual (Medicaid and QHP) and small group markets. In Washington, while the system functioned smoothly in terms of determining eligibility for QHPs and tax credit subsidies, notable problems were encountered with processing premium payments for QHPs. Unlike most other states, the Washington Healthplanfinder collects premiums from consumers, called premium aggregation, rather than consumers paying their health plans directly. Given the challenges experienced with this process, the Healthplanfinder plans to move away from premium aggregation prior to the next open enrollment period. With regard to Medicaid, the state has enhanced the system by integrating selection of a Medicaid managed care plan into the enrollment process. In Colorado, the Connect for Health Colorado board has allocated funding to address system glitches and improve technology processes. Officials noted that they will prioritize fixes to facilitate a smoother enrollment experience by the next open enrollment period but that improvements will continue beyond that time period.
Enrollment and Renewal
Medicaid
Table 3 below presents Medicaid and CHIP enrollment data reported by the Centers for Medicare and Medicaid (CMS) as of March 2015. As seen in the data, the three study states that implemented the Medicaid expansion (Colorado, Kentucky, and Washington), experienced significantly greater enrollment growth relative to pre-ACA levels, compared to the two study states (Utah and Virginia) that did not expand. Moreover, reflecting that much of this growth was likely among newly eligible adults, children account for a smaller share of total enrollment in these expansion states. According to state-reported data from Kentucky, a total of 375,174 individuals enrolled in the Medicaid expansion by the end of 2014.1 Data from Washington show that 549,000 adults have enrolled in the Medicaid expansion as of May 2015.2
Stakeholders in the three study states that implemented the Medicaid expansion (Colorado, Kentucky, and Washington) noted continued growth in Medicaid enrollment during the second open enrollment period. Stakeholders in Kentucky and Colorado indicated that, although growth has continued, the pace has started to slow. It was noted that this likely is because they achieved such significant enrollment success during the first open enrollment period, leaving a smaller universe of eligible individuals to enroll. Stakeholders in Colorado further noted that Medicaid enrollment during the initial open enrollment period was concentrated among adults, but that, during the second year, they have seen an increase in the share of new enrollees who are children. In Kentucky, stakeholders indicated that they have seen some reductions in the number of people enrolling through disability-based and medically needy eligibility pathways, since individuals no longer have to be disabled or have medical expenses to qualify for coverage. In Washington, Medicaid enrollment continued at a fast pace, exceeding expectations. Stakeholders indicated that enrollment grew among both newly eligible adults and children, noting that the rate of growth in children’s enrollment was the highest it has been in the past five years.
Table 3: Medicaid/CHIP Enrollment
US
Colorado
Kentucky
Utah
Virginia
Washington
Total Enrollment
Pre-ACA Average Monthly Medicaid/CHIP Enrolment
57,794,096
783,420
606,805
294,029
935,434
1,117,576
Total Monthly Medicaid/CHIP enrollment as of March 2015
71,050,561
1,232,504
1,140,261
301,200
952,536
1,685,329
Percent Change in Enrollment
21%
57%
88%
2%
2%
51%
Child Enrollment
Medicaid/CHIP Child Enrollment as of March 2015
29,401,734
586,939
489,540
211,629
645,829
781,303
Child Enrollment as a % of Total Medicaid/CHIP Enrollment
Utah and Virginia have not adopted the Medicaid expansion and stakeholders in both states reported very little change in Medicaid enrollment. Stakeholders in Utah said there have been some modest increases in Medicaid enrollment beyond regular program growth, largely as a result of more children enrolling in Medicaid as families apply through the Marketplace. In Virginia, stakeholders felt there has been no real change in Medicaid enrollment, which they attributed to the significantly limited eligibility levels for adults in the absence of the expansion.
The study states are in varied stages of implementing new streamlined Medicaid renewal processes established by the ACA. Washington has fully implemented the new processes, under which the state conducts electronic data matches and automatically renews individuals who are found still eligible based on the data match. It also has completed moving all MAGI-eligible cases from its old eligibility system to its new system. State officials noted that the new processes are working well and that its rates of automated renewals have exceeded expectations. The remaining four states are still in the process of transitioning to these processes. Currently, enrollees in these states are sent a letter and/or pre-populated form and requested to report any changes. In Colorado and Utah, individuals are automatically renewed if nothing has changed. In Virginia and Kentucky, individuals need to sign and return the form to continue coverage. Kentucky plans to move to an automated renewal process in July. Stakeholders in these states did not identify any major problems with renewal, although officials in Virginia said they remain delayed in processing some renewals. In addition, assisters in several of the states noted that some consumers had questions about renewal or needed help providing requested information to the state.
Marketplaces
There was variation across the study states in the level of changes they experienced in plan participation and premium costs within their Marketplaces between year one and year two. Reflecting the still evolving nature of the Marketplaces, Kentucky, Virginia, and Washington saw new insurers enter the market, while Colorado and Utah had high continuity in plan offerings. In addition, Marketplaces in Colorado, Kentucky, Utah, and Virginia experienced changes in the second lowest cost silver, or benchmark, plan. The benchmark plan determines how much assistance eligible consumers can receive in the form of premium tax credits. In Colorado, the change in the benchmark plan led to a reduction in the level of tax credit subsidies, which stakeholders indicated was very confusing for consumers. They reported that it was difficult to explain to individuals why the subsidy amounts changed and why their premium share may have increased even though overall premium costs decreased. In Virginia and Kentucky, low cost plans with large market shares adopted large premium increases for 2015, leaving consumers to either renew their current plan with a large premium increase or switch to a lower cost plan. In Washington, there were some additions of new plans and carriers to the Marketplace. Stakeholders noted that, because of the large number of plan choices, it will be important to improve the shopping experience for individuals to enable them to sort and filter plans by different criteria. Overall, premium amounts held fairly steady in the state with a small average increase.
Marketplace enrollment goals were met or surpassed in four of the five study states (Colorado, Kentucky, Utah and Virginia). Table 4 below presents Marketplace enrollment data based on data reported by the Office of the Assistant Secretary for Planning on Evaluation (ASPE). Stakeholders in Kentucky reported that QHP enrollment continued at a strong pace and the balance between QHP enrollment and Medicaid enrollment was evening out. In the first year, less than 20% of new enrollees were eligible for QHPs compared to over 80% who enrolled in Medicaid. In the second open enrollment period, the share of QHP enrollment had increased to 35%. Despite its challenges with launching a new eligibility system, Colorado achieved its QHP enrollment goals. Virginia surpassed its QHP enrollment goals, which stakeholders attributed to heightened state leadership under the new Governor and new state funding to support both a state-based outreach campaign and additional outreach workers. Stakeholders in Utah also viewed the second open enrollment period as a success, with a number indicating that it exceeded expectations.
In contrast, stakeholders in Washington were disappointed with overall Marketplace enrollment numbers, which fell below enrollment goals. Stakeholders indicated that several factors may have contributed to lower enrollment levels. First, the system problems with premium payments diminished consumer confidence in the Marketplace, which may have suppressed enrollment. It was noted that it remains unclear how many individuals who could potentially be brought into the Marketplace are currently purchasing coverage outside of the Marketplace. Secondly, a number of individuals did not make their first premium payment at renewal, which contributed to higher than anticipated disenrollments. Lastly, some stakeholders suggested that enrollment goals may have been overstated due to assumptions used to develop the projections. For example, it was noted that the projections assumed a 100% renewal rate, which was not realistic. In addition, officials pointed out that, because the Marketplace collects premium payments directly, its enrollment data reflect effectuated enrollment numbers (i.e., the number that have made a premium payment), which are lower than enrollment counts in other states that are based on the number of individuals that have selected a plan.
Table 4: Marketplace Enrollment Data
Colorado
Kentucky
Utah
Virginia
Washington
Enrollment
Total Marketplace enrollment
122,976
92,372
128,220
335,033
159,124
Marketplace enrollment as share of potential population
22%
35%
34%
40%
32%
New vs. Re-enrolling Consumers
Percent new consumers
28%
26%
49%
54%
37%
Percent re-enrolled consumers
72%
73%
51%
46%
63%
% of re-enrollees actively renewing
47%
53%
47%
56%
Not reported
% of re-enrollees auto renewing
53%
48%
53%
44%
Not reported
Financial Assistance
Total Marketplace enrollees receiving financial assistance
68,027
63,975
86,330
285,938
124,505
Percent of individuals enrolled with financial assistance
55%
69%
67%
85%
78%
Marketplace enrollees receiving financial assistance as share of subsidy-eligible population
Many consumers successfully renewed their QHP coverage, with about half of re-enrollees shopping for new plans, but stakeholders also identified some challenges with renewal. While renewals generally went smoothly in Kentucky, stakeholders noted that some individuals had problems with the system freezing when they tried to select a new plan. As noted, Washington experienced significantly more disenrollments at renewal than anticipated. Stakeholders noted that, although many individuals were auto-renewed, a number did not pay their first premium and were disenrolled. Marketplace officials thought that this situation may have been exacerbated by their inability to continue premium auto-payments at renewal as well as potentially confusing notices from insurance carriers that told consumers they did not need to take any action. In Utah and Colorado, the drop in tax credit subsidy amounts as a result of the change in the benchmark plan created some confusion among individuals. In addition, some individuals in Utah shifted plans because the lowest cost plan has a very narrow provider network. Lastly, some stakeholders in Virginia noted that there were problems related to matching income to verify continued eligibility for some individuals. Across all five study states, stakeholders pointed to the need for improved consumer education and outreach about renewal, noting that individuals were confused about their need to renew and/or by notices they received from insurers or the Marketplace.
A number of stakeholders highlighted the importance of the tax-related Special Enrollment Period (SEP), particularly given the shorter enrollment period. The federal Marketplace and most SBMs provided a tax-related SEP to allow consumers who were subject to a penalty for not having insurance when they filed their 2014 taxes to enroll outside the normal open enrollment period. Stakeholders in Kentucky, Washington, and Utah noted that the tax penalties played a role in encouraging enrollment, indicating that a number of individuals enrolled during the SEP to avoid future penalties. However, Colorado did not provide a tax-related SEP, and several stakeholders indicated that some individuals were upset they could no longer enroll and that the state had not provided the SEP.
Coverage Transitions
Stakeholders did not identify significant issues related to coverage transitions between Medicaid and Marketplace coverage. In Colorado, although data were not available to measure coverage transitions, stakeholders reported that they had not encountered any major issues. They did indicate that more education is needed to encourage individuals to report life changes during the year and to inform individuals about the ability to enroll in Medicaid throughout the year. In Washington, state and Marketplace officials reported that movement between coverage types has been lower than anticipated, at less than 1% per month. Data show that more individuals move from QHPs to Medicaid than from Medicaid to QHPs. Stakeholders suggested this may be reflective of greater incentives for individuals to report decreases in income as well as the fact that individuals with income increases may gain employer-sponsored insurance rather than enrolling in a QHP. The data also show that there was a significant uptick in the number of coverage transitions during the open enrollment period when many individuals came up for renewal. Medicaid and Marketplace officials in Washington are planning to do a focused study of coverage transitions to better understand the changes. In Kentucky, officials reported that rates of churn in Medicaid (about 20,000-30,000 disenrolling per month) have not increased under the ACA; however, they plan further study of movement from Medicaid to Marketplace coverage. Kentucky sends quarterly reminders to encourage individuals to report changes in income and circumstances throughout the year. Stakeholders suggest that these reminders could lead to increased churn but also fewer issues with reconciliation. In Virginia and Utah, few individuals would likely transition between coverage types given the gap in coverage for adults without the Medicaid expansion.
Outreach, Marketing, and Enrollment Assistance
Consumer Awareness and Messaging
Stakeholders in all five study states indicated that there was greater awareness among consumers about the new ACA coverage options during the second open enrollment period. Some also noted there was greater awareness of the tax penalty for not having insurance. In addition, a number of stakeholders felt there was increased acceptance among some consumers that the new coverage options and requirements are going to remain in place, which contributed to a greater willingness to participate during year two among some individuals who may have been reluctant to enroll during the first year. Some stakeholders also felt that the coverage was less politicized because there was less media coverage. For example, in Utah, some stakeholders suggested that less national media attention allowed there to be some distance from negative feelings tied to “Obamacare,” which may have spurred enrollment. Stakeholders said that, because of the increased consumer awareness, they did not need to devote as much outreach and education to raising awareness and could instead focus on encouraging individuals to enroll and directing them to assistance resources. However, at the same time, stakeholders felt that the reduced media attention at the national, state, and local levels limited that avenue as an information source for individuals.
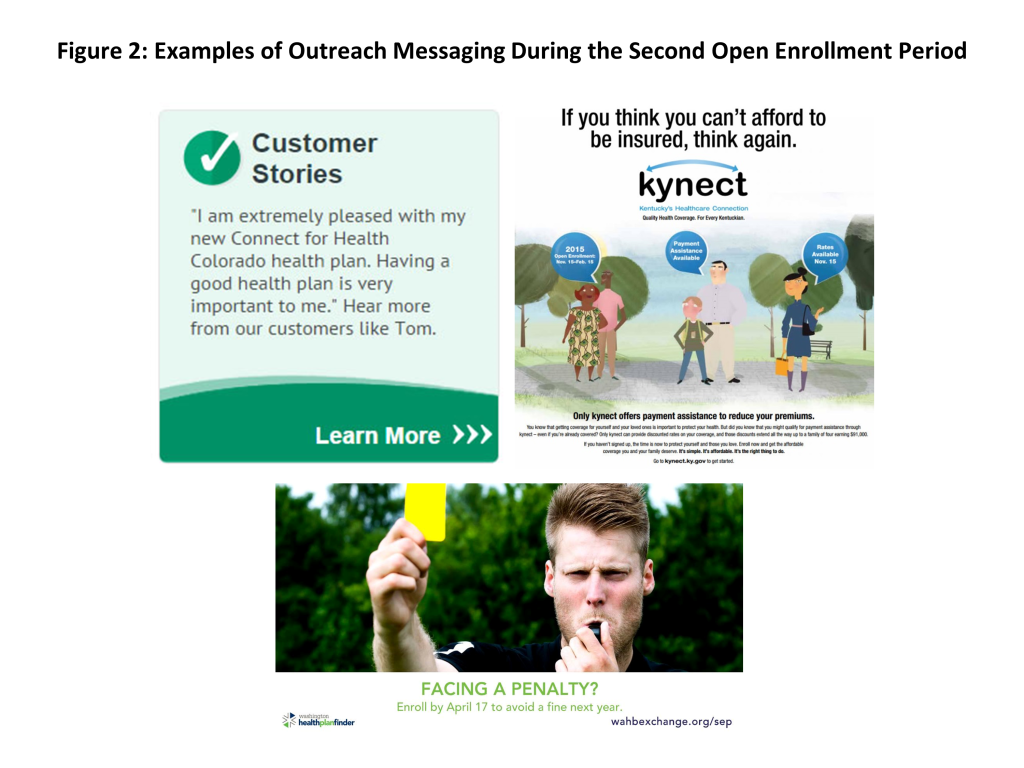
In year two, outreach messaging shifted away from raising awareness to personal testimonials and emphasis on the importance and value of coverage (Figure 2). For example, Connect for Health Colorado launched a, “We all need health insurance campaign,” in both English and Spanish and shared stories of consumers who have benefited from gaining coverage on their website and through social media. Stakeholders also indicated that messaging focused more on the availability of financial help and affordable coverage options during year two. For example, kynect’s advertising included the phrase, “If you think you can’t afford to be insured, think again.” Similarly, Virginia launched a state campaign that emphasized the availability of financial help to reduce health insurance costs. Some stakeholders also incorporated information on the tax penalty, the shorter enrollment period, the tax-related SEP, and renewals into their messaging efforts.
Figure 2: Examples of Outreach Messaging During the Second Open Enrollment Period
Outreach and Enrollment Efforts
Mass marketing campaigns remained important during the second open enrollment period, although the study states varied in the scope of their marketing and how it compared to year one. In the SBM states (Colorado, Kentucky, and Washington), stakeholders indicated that there was somewhat less marketing through mass media outlets during year two, in part, due to more limited marketing budgets. However, there still was a significant media presence through television, radio, and print advertisements. In Utah, which relies on the FFM, stakeholders noted that there were no state media efforts. The only advertising was via federal marketing, which a number of stakeholders indicated was challenging for outreach efforts. Health plans in Utah were able to do direct marketing to encourage enrollment in QHPs but not Medicaid. The major plans also are allowed to conduct community awareness events at health fairs and enrollment events which may increase their brand recognition if the state were to move forward with the Medicaid expansion. In Virginia, which is also an FFM state, federal funding was redirected and accessed under the new Governor to support a state media campaign, which a number of stakeholders felt facilitated outreach and enrollment efforts. However, some stakeholders indicated that this marketing did not reach certain areas of the state.
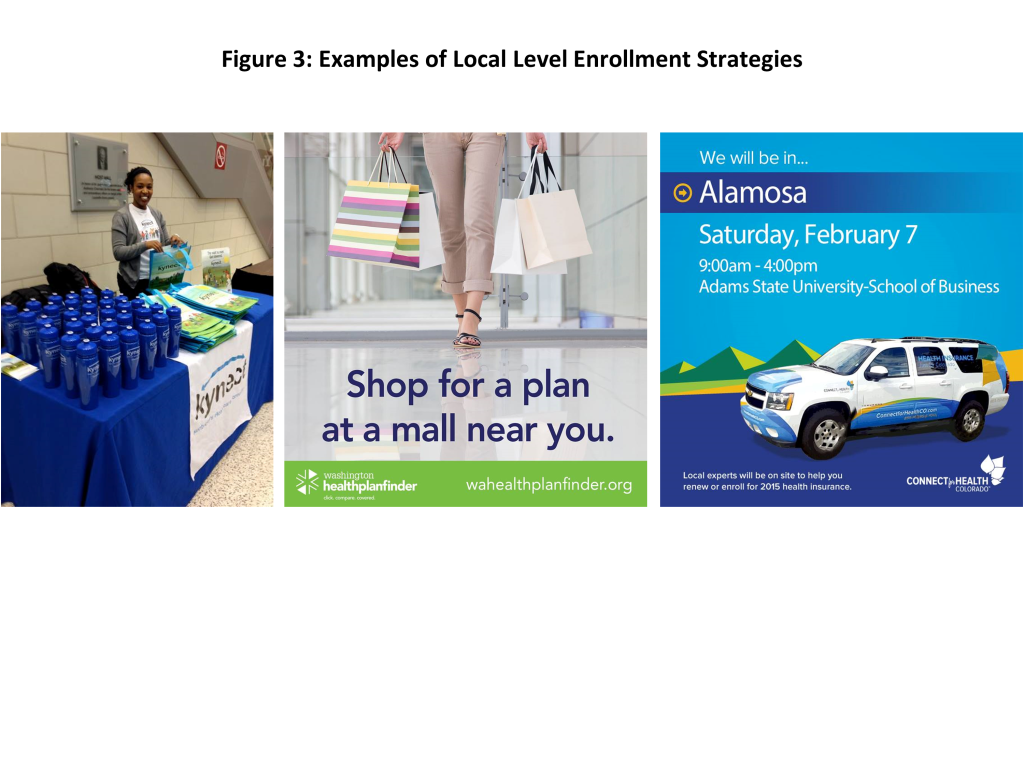
Local level outreach and enrollment assistance also remained vital during year two. Stakeholders across the five states described a range of activities to connect with individuals through community locations such as schools, libraries, and churches. In Kentucky, kynect repeated its most successful local level enrollment strategies from year one, which included providing kynect-branded giveaways to consumers and conducting outreach and providing enrollment assistance at state fairs and festivals (Figure 3). Kynect also established an enrollment storefront in the community that was staffed with assisters, brokers, and kynect and Medicaid staff. Stakeholders noted this storefront was enormously successful, serving over 7,500 clients during the open enrollment period, and that it was particularly helpful for handling complex cases because all the people with the needed expertise were in the same room. Connect for Health Colorado also built upon its previous success with temporary enrollment sites, establishing more sites during year two, including sites in rural areas. It also replicated its mobile enrollment tour, traveling around the state in Connect for Health Colorado vans. In addition, it repeated its direct outbound email campaign to individuals who initiated an account with Connect for Health Colorado but did not finish enrollment. Washington Healthplanfinder launched a mall enrollment tour, with enrollment events at several malls across the state during the beginning of the second open enrollment period. In Northern Virginia, assisters conducted “sign up Saturday” events and assisters throughout the state organized other enrollment events to reach individuals. In Utah, TakeCareUtah, a partnership between the Association for Utah Community Health, the Utah Health Policy Project, and the United Way, helped connect individuals with trained enrollment specialists in their communities and neighborhoods. Individuals can call the United Way 2-1-1 number to be directed to resources in their area.
Figure 3: Examples of Local Level Enrollment Strategies
Targeted enrollment efforts became increasingly important. In addition to broad outreach and enrollment events, stakeholders noted that, as the group of uninsured individuals they are trying to reach narrows, targeted strategies to reach specific groups increase in importance. As one assister in Kentucky commented, outreach tactics “changed from big net to spear fishing.” Across the study states, stakeholders described focused efforts to reach the Latino community, including utilizing more Spanish-speaking assisters and volunteers and marketing through Spanish media channels. Assisters also referenced targeted outreach to immigrant communities, African Americans, young adults, and veterans. In Colorado and Kentucky, stakeholders highlighted efforts to reach the LGBT community. For example, the Connect for Health Colorado Marketplace worked with the LGBT community to develop advertising that would resonate with individuals. In addition, a new initiative in Kentucky has been launched to enroll individuals in coverage as they re-enter the community upon release from prison or jail. In Utah, where the church plays a significant role in the lives of many residents, it was noted that, although the church has not been actively engaged in outreach and enrollment, information has been traveling by word of mouth as more members have gained coverage.
Enrollment Assistance
A mix of different types of individuals were involved in outreach and enrollment, including navigators, assisters, brokers, and CHC staff. Stakeholders noted that there was improved coordination across these groups during year two, which facilitated resource sharing, trouble shooting, and joint decision making. In particular, stakeholders in Colorado, Kentucky, and Washington highlighted increasingly strong relationships between assisters and brokers. There was somewhat less connection between brokers and assisters in Virginia and Utah due, in part, to federal regulations that limit referrals from assisters to brokers. However, stakeholders in Utah indicated that they are beginning to develop closer relationships. In all five states, assisters at CHCs played a key role in outreach and enrollment. In the states that expanded Medicaid, these assisters conducted both in-reach to their CHCH patients as well as outreach to the broader community and were able to enroll a significant share of their CHC patients into Medicaid coverage. However, in the non-expansion states, few CHC patients qualified for coverage since most fall into the coverage gap. As such, the CHC assisters in these states focused their enrollment efforts on the broader community outside of the CHCs.
Many of the individuals providing outreach and enrollment assistance during year two had also served this role during year one. As such, many were well-prepared and could utilize their experience and knowledge to “hit the ground running” with outreach and enrollment efforts. Largely stable funding for assisters across the study states also proved important to ensuring an adequate number of experienced assisters were available to help consumers. In Virginia, new funding to support outreach and education specialists and enrollment assisters at CHCs resulted in a significant uptick in the number of outreach and enrollment workers, which stakeholders indicated improved enrollment efforts.
Expanded capacity and fewer system problems improved the ability of call centers to serve individuals. Colorado, Kentucky, and Washington all expanded call center capacity during year two. This helped improve operations and reduce wait times and abandonment rates in Kentucky and Washington. In Colorado, there remained high demand for call center help as a result of its system problems and, as such, call center capacity remained strained. Stakeholders in Virginia and Utah indicated fewer issues with consumers accessing the healthcare.gov call center help during year two, reflecting a decrease in system problems that drove many calls during year one.
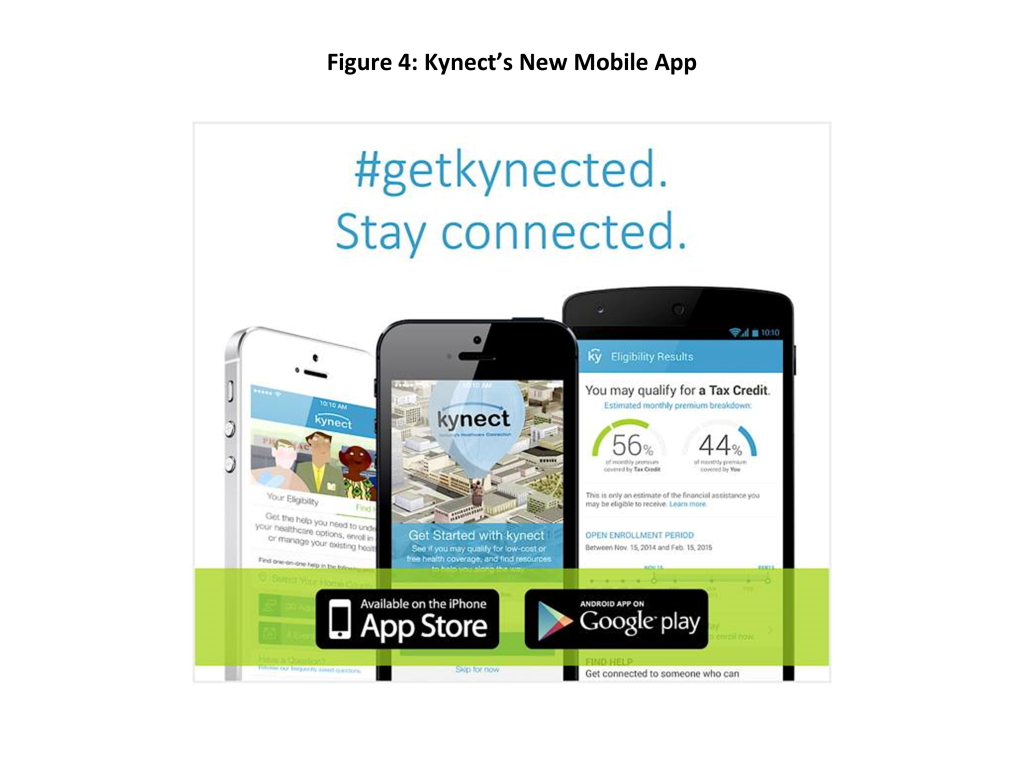
Online tools continue to be utilized and developed to support outreach and enrollment. Although Virginia relies on the FFM for QHP enrollment, it re-launched its state Cover Virginia website, which serves as a landing page for consumers to learn more about coverage options and help direct them to either apply through healthcare.gov or directly to Medicaid, depending on their circumstances. It includes an online screening tool, information about QHPs and Medicaid eligibility, and a tool to help connect individuals with local assistance resources. Kynect launched a new mobile app that allows individuals to identify enrollment events, find an agent or assister, complete a pre-screen for eligibility, and anonymously shop (Figure 4). It plans to enhance the app moving forward to allow individuals to create and access an account, take images of documentation and browse for plans, including Medicaid managed care plans.
Figure 4: Kynect’s New Mobile App
Greater education of tax preparers will be key for helping consumers moving forward. For the first time this year, consumers faced new health insurance reporting requirements on their taxes. All consumers were required to report their health insurance coverage status for the year, and those receiving premium tax credits had to complete forms to reconcile the advance tax credit payments they received last year with their annual income. Stakeholders noted that a number of individuals were confused about these tax questions and forms and that many tax preparers had limited understanding of these issues. In Kentucky, it was noted that some Medicaid enrollees were confused about whether they needed the health coverage-related tax forms to file their taxes, resulting in lots of questions for tax preparers and assisters. Efforts were made by stakeholders to educate tax preparers. For example, kynect sent information to tax preparers and included answers to tax questions on its website, and assisters in Virginia shared information with tax preparers. However, there still appeared to be confusion and knowledge gaps among preparers, particularly those working for smaller, independent firms. At the same time, navigators and assisters indicated that they were nervous and hesitant to provide individuals any information or help to consumers related to tax questions.
Enrollment Challenges
Stakeholders indicated that despite attempts to inform and educate consumers about total out-of-pocket costs, many selected plans based on the lowest premium, leaving them with high deductibles and other cost sharing requirements that are unaffordable for them. It was noted that some individuals who purchased bronze plans did not maintain their coverage because of the high out of pocket costs. In Kentucky, stakeholders described an increased effort to educate eligible consumers about the availability of cost-sharing reductions, which they felt contributed to more consumers choosing silver plans during year two. In Utah, one of the major insurance carriers said they provided a lot of front-end consumer assistance to help individuals pick a plan that was best for them in terms of affordability and benefits, which stakeholders felt may have resulted in fewer plan changes. It also was noted that purchasing coverage would actually increase out-of-pocket costs for some individuals who previously relied on CHCs that charge a sliding fee, since a plan’s cost sharing requirements would exceed the sliding fees. One clinic noted that, moving forward, they will focus on educating individuals that the clinic can continue to discount individuals’ out-of-pocket charges based on the sliding fee scale even if they have coverage.
Stakeholders also said that premiums remain unaffordable for some consumers even with the tax credit subsidies. Moreover, they pointed out that, although an individual may have resources to pay the first month’s premium, he or she may not be able to continue to pay them over time. Marketplace officials in Washington noted that many consumers do not understand that premium payments are prospective for the following month, leading many to fall behind on their payments.
Some stakeholders noted that the shorter enrollment period compressed enrollment efforts. In most of the study states, the impact of the shorter enrollment period was somewhat mitigated by the tax-related SEP. However, a number of stakeholders indicated that the shortened time period, which spanned the holiday season, limited opportunities to reach individuals.
As more people are enrolled in coverage, it is becoming increasingly challenging to find and enroll eligible individuals. Across the study states, stakeholders felt that the remaining uninsured include a mix of the Hispanic community, immigrants, individuals living in rural areas, and harder-to-find or transient populations that are not well connected to resources. It was noted that low enrollment levels among Hispanics may be reflective of multiple factors, including access to translated materials, lack of trust, and cultural barriers. Looking ahead, they noted that targeted efforts will be required to reach the remaining uninsured and that some will not be possible to reach or will not be interested or willing to enroll in coverage.
In Virginia and Utah, which did not expand Medicaid, many individuals who tried to enroll in coverage fell into the coverage gap. Stakeholders in both states noted that the coverage gap created challenges to conducting broad outreach and messaging and led to significant confusion among people seeking health insurance. Stakeholders in Virginia noted that the gap was particularly confusing for individuals living in border areas next to states that did expand, like Kentucky, since they would hear messages encouraging them to apply and that everyone is eligible but then find out that they did not qualify for assistance. In Utah, stakeholders noted that the coverage gap makes it difficult to reach the remaining uninsured individuals who are eligible for coverage because it limits the ability to conduct broad-based marketing efforts. Assisters noted that when they identified people who fell into the coverage gap, they would connect with available resources for care for the uninsured. However, they said that it was often very difficult to deal with this situation and that some individuals would be very upset and distraught after learning they did not qualify for coverage.
Access to and Utilization of Care
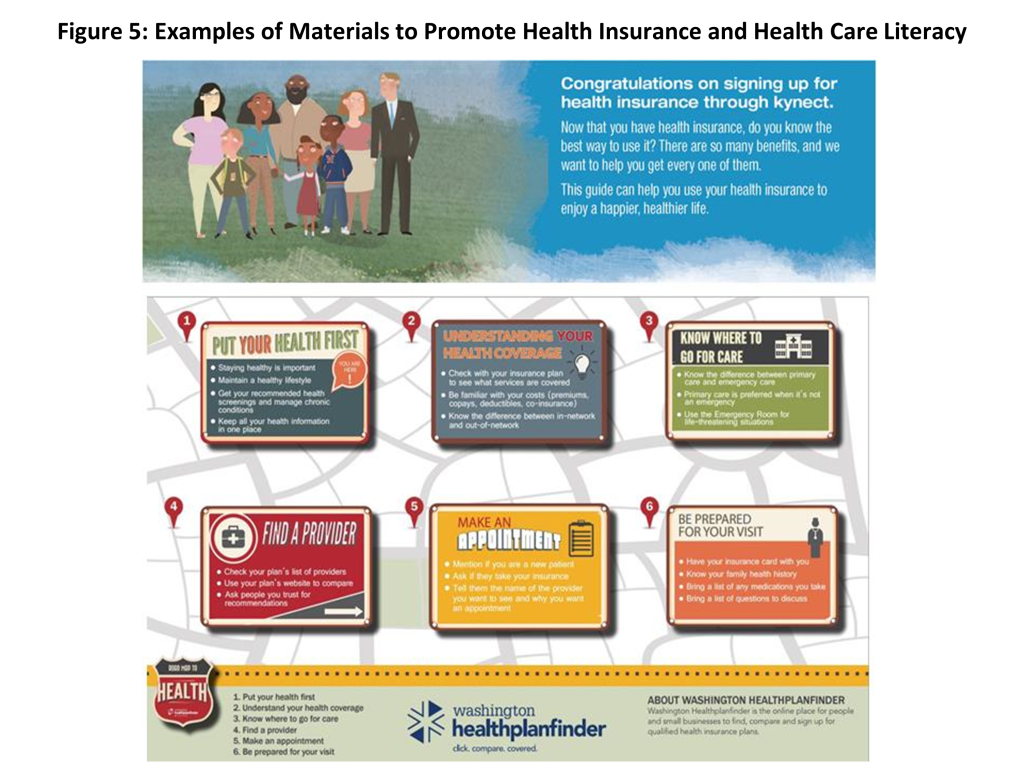
Stakeholders in all five states referenced efforts underway at multiple levels to help increase health insurance and health care literacy among individuals. For example, a number of the Marketplaces have produced printed materials and videos designed to explain basic insurance concepts like deductible and copayment and provide information on how to access care and choose a provider. For example, the “how to kynect” brochure in Kentucky provides a glossary, information on how to find a primary care provider and how to use care, as well as healthy living tips (Figure 5). Similarly, Washington Healthplanfinder, has created a Roadmap to Health brochure. A number of stakeholders also noted that the “From Coverage to Care” materials developed by the Centers for Medicare and Medicaid Services have been helpful in supporting these efforts. State Medicaid agencies also are engaging in education. For example, the Washington state Medicaid agency created a first-time user guide which is mailed to the home with the enrollment packet and includes basic information on what is covered, how to arrange a doctor’s visit, and who to call for assistance with different issues. Assisters also developed materials to explain key health insurance concepts and noted that this education is most effective when provided on a one-on-one basis with the individual. The Marketplace insurance carriers and Medicaid managed care plans are also working directly with their members on education and providing information to support enrollment assisters. However, overall, most stakeholders noted that efforts to increase literacy are still in the early stages and more work is needed in this area.
Figure 5: Examples of Materials to Promote Health Insurance and Health Care Literacy
Among the three study states that implemented the Medicaid expansion (Colorado, Kentucky, and Washington), per enrollee costs of care for expansion adults have been lower than anticipated. In Colorado, most expansion adults are enrolled in a coordinated care initiative. The state observed higher emergency room use among expansion enrollees during the first six months of enrollment, but this use fell off over the subsequent six months to levels below that of individuals enrolled in fee-for-service Medicaid, and the costs of care for expansion adults has been lower than anticipated. The state is conducting analysis to gain a better understanding of why costs are lower than expected and whether they might be related to the connection to a medical home and greater understanding of how to use insurance. In Kentucky, there has not been as large a spike in emergency room use due to pent-up demand as was anticipated; however, the expansion population is accessing more care particularly for diabetes, heart disease, and other chronic conditions. An independent analysis of the first year of the expansion in Kentucky found that, compared to individuals previously enrolled in Medicaid, those in the Medicaid expansion group accessed providers at a higher rate and had increased utilization of preventive services.3 Part of this might be due to the previous lack of health insurance leading to first-time screenings and appointments. In Washington, Medicaid officials reported that, because of the large enrollment within the state, the overall health of the population is better than anticipated, leading to lower per capita costs.
Stakeholders in the three Medicaid expansion states (Colorado, Kentucky, and Washington) felt that enrollees are generally able to access needed care, although they pointed to access challenges for certain types of services and providers. In Colorado, stakeholders commented that the increased demand for care has led to longer wait times in some cases, particularly for specialty services. Similarly, stakeholders in Washington and Kentucky noted difficulty finding providers for certain specialties and behavioral health services. In each of these states, stakeholders also noted access challenges in rural areas, but pointed out that these challenges are reflective of overall provider shortages and not specific to Medicaid. Kentucky has been engaged in efforts to expand access to behavioral health providers by allowing Medicaid to contract with additional provider types (such as licensed drug alcohol counselors) and adding new services to Medicaid (such as substance abuse). Both Colorado and Washington added adult dental benefits to Medicaid in the past year, but stakeholders noted that there is a limited supply of dentists to provide these services, particularly given the high demand for them. Stakeholders in Kentucky also pointed to challenges recruiting dental providers, although they noted that access varied across the state, with greater provider availability in Louisville where there is a dental school. In Colorado, the Medicaid agency added a unit focused exclusively on provider recruitment and is examining potential rate changes to support improved access. To facilitate access to dental care, the state made targeted rate increases for dental benefits this year. The state is also using state-only funds to extend the increase in rates for primary care that was originally funded under the ACA. In contrast, Washington did not extend the primary care rate increase; stakeholders noted that there is some lag time before providers will feel the impact, and they are waiting to see if that will result in any changes in access.
In the three Medicaid expansion states (Colorado, Kentucky, and Washington), stakeholders highlighted cost savings or improved value resulting from the expansion. Stakeholders in Kentucky and Washington highlighted analyses that have documented substantial state savings that have accrued from the Medicaid expansion. In Kentucky, a recent analysis estimated a net positive fiscal impact from the Medicaid expansion of $919.1 million from SFY 2014 through SFY 2021 compared to what the state would have spent had it not expanded resulting from increased employment, increased revenues to providers and decreased uncompensated care.4 Similarly, officials in Washington noted that the state has saved about $350 million from the expansion in its first 18 months. In Colorado, officials noted that as individuals gain coverage they are costing less, for example due to lower re-admission rates.
Access to care for individuals enrolled in QHPs varies based on their choice of plan. For example, a number of stakeholders noted that some individuals who selected lower cost plans with limited networks experienced challenges getting appointments and finding providers. They suggested that some of these challenges have moderated over time as individuals have adjusted their expectations and some plans have made adjustments to better accommodate member needs. In response to narrow networks among some plans in 2014, the Department of Insurance in Washington established new requirements on network adequacy for 2015 and is drafting additional regulations to provide tools to ensure plans comply with the requirements. In Virginia, it was noted that there are some access issues in border areas where individuals are seeking to visit doctors across state lines, but unable to do so because the providers are not in-network. Stakeholders also said there were some problems with the websites not being up to date with provider networks and prescription formularies. In Utah, stakeholders indicated that those newly insured through QHPs have been high utilizers of care, and several of the plans have initiated efforts to help individuals understand how to use their insurance and manage their care, directing them away from use of the emergency room and encouraging use of primary and preventive care.
A number of care coordination and integration initiatives are underway in the study states. As noted, in Colorado, expansion enrollees are enrolled in a new coordinated care program that is designed to provide individuals a medical home and manage their care. Looking ahead, this initiative will collaborate with social services to address social determinants of health. In Washington, the state has received a State Innovation Model grant, under which the state will be integrating physical and behavioral services at both a financing and service delivery level in Medicaid. By 2020, Washington will have fully integrated managed care contracts in place across the state. The state is also aligning Medicaid quality and performance measures across plans and implementing these measures through their managed care contracts; the first shared measures will be in place in 2016. In addition, the initiative will establish linkages between clinical care and community services to address social determinants of health through Accountable Communities of Health. Kentucky is focusing on Medicaid enrollees who are super-utilizers of emergency department care through increased case management. In addition, Kentucky added behavioral health services to the Medicaid managed care contract in 2014 and holds regular meetings with the plans and educational forums with behavioral health providers to support integration of these services.
In the study states that expanded Medicaid, clinics that historically served uninsured populations reported a significant increase in their share of patients with coverage, particularly Medicaid coverage, which has led to increases in third-party reimbursements. However, they noted that a share of patients still remains uninsured, including undocumented immigrants, individuals who still cannot afford coverage and transitory individuals who are difficult to enroll in coverage. As such, other funding streams remain important. To accommodate the shift in coverage patterns, clinics have added clinical and administrative staff to meet increased demand for services as well as increased administrative demands associated with billing. Some are also increasing infrastructure to expand their capacity. One clinic reported that the coverage increases have led to a rise in provider satisfaction because coverage has facilitated their ability to refer patients out for the services they need.
In contrast, clinics in Virginia and Utah reported very little to no change in the share of patients they serve with coverage, because most fell into the coverage gap. One clinic reported an increase in their share of uninsured patients since their outreach and enrollment workers were identifying uninsured people through their ACA outreach efforts and then referring them to the clinic for services. This increase in demand has led to strained capacity at the clinic and longer waits for appointments. Some clinics also noted that they have lost some patients that enrolled in a QHP. Because clinics in these states have not seen any gains in coverage among their patients, they have not realized any increases in reimbursement. However, the clinics have benefited from enhanced funding in the ACA for operations and stressed the importance of maintaining this funding in the future. Similarly, hospitals in these states reported that they are continuing to see uncompensated care costs rise while facing cutbacks in Medicare payments and the planned reductions in Medicaid Disproportionate Share Hospital Funding, and, as such, are significantly concerned about their financial stability moving forward in the absence of the Medicaid expansion.
Looking Ahead
Looking ahead, stakeholders identified several key priority areas of focus, including the following:
Improvements in enrollment systems. As noted, stakeholders in the study states indicated continued enrollment system work in the future to both address remaining problems and continue to enhance functions and capabilities to improve the enrollment experience.
Reductions in marketing and outreach resources. A number of stakeholders indicated that they anticipated more limited funding to support marketing and outreach in the following year. They noted that as resources are reduced, it will be important to target them effectively and efficiently. Some stakeholders suggested that a greater share of resources should be directed to local level enrollment assistance activities versus broader media campaigns.
Increasing health insurance and health care literacy. Across all five study states, stakeholders emphasized the need for continued work to increase individuals’ understanding of health insurance and how to appropriately utilize care. This understanding will be key for ensuring individuals enroll in the best health plan to meet their needs, holding down health care costs, and eventually improving health outcomes over the longer-term. It was recognized that care management and care coordination initiatives will play an important role in these efforts.
Delivery system reform. The study states are each engaged in a range of different types of delivery system reforms through a variety of vehicles, including Medicaid options and waivers and the State Innovation Model grants. Increased integration of physical and behavioral care, improved care management and care coordination, and addressing social determinants of health will all be key priorities moving forward.
Financial sustainability of the SBMs. Stakeholders in Colorado and Washington noted that there is significant pressure on their Marketplaces to achieve financial sustainability. Options are being explored to increase revenues and decrease operation budgets to achieve greater financial stability. In contrast, kynect’s financial outlook is stable, as funding through a broad-based assessment on plans both inside and outside the Marketplace covers its budget.
Medicaid expansion debate. In Utah and Virginia, debate around adopting the Medicaid expansion remains the most significant issue moving forward. Stakeholders indicated that they cannot achieve greater progress on reducing the uninsured without the expansion. Most remained optimistic that the expansion would occur. In Virginia, a number of stakeholders noted that they thought the likelihood of expansion may increase after the next round of state legislative elections or after the next Presidential election. It was noted that as debate continues, stakeholders must make future plans considering both expansion and non-expansion scenarios, which can complicate planning efforts.
King v. Burwell. Stakeholders in Utah and Virginia also cited the uncertainties surrounding the outcome of the King v. Burwell Supreme Court case as a key issue. It was noted that, without subsidies, many individuals would no longer be able to afford coverage. In Virginia, stakeholders are exploring potential contingency plans if the ruling determines that subsidies can no longer be provided through the FFM. In Utah, there is a lot of concern about the case, and state officials and plans are working on contingency plans. However, stakeholders noted that it is very hard to predict how to respond.
Elections. In Kentucky, stakeholders emphasized that the upcoming gubernatorial election could have significant implications for the ACA. They noted that much of the success of ACA implementation in the state has been due to the Governor’s leadership and strong collaboration across state agencies, advocates, navigators and providers. However, there remain pockets of strong opposition to the ACA in the state and a number of candidates are running on platforms to repeal kynect and the Medicaid expansion, which stakeholders are concerned could threaten the accomplishments realized to date.
Conclusion
In sum, these findings show that, as of the second year of ACA implementation, most major enrollment system issues had been resolved. The states that expanded Medicaid continued to experience enrollment growth, and Marketplace enrollment goals were met or surpassed in four of the five states, although affordability remains a key enrollment challenge. In all five states, broad efforts are underway to increase health insurance and health care literacy among newly insured individuals. Overall, costs of care for Medicaid expansion enrollees have been lower than anticipated in the three states that expanded Medicaid. Expansion enrollees generally are able to access needed care, although there are access challenges for some services. Access to care for individuals enrolled in QHPs varies based on their choice of plan.
Looking ahead, the states are focused on a range of priorities, including continued improvements to enrollment systems and efforts to enhance access to care and increase care coordination. Moreover, in Colorado and Washington, there is significant pressure on the Marketplaces to achieve financial sustainability; in Utah and Virginia, debate around the Medicaid expansion and the outcome of the King v. Burwell Supreme Court case remain the most significant issues; and, in Kentucky, the upcoming gubernatorial election could have significant implications for implementation given the opposition to the ACA among potential candidates.
The authors gratefully acknowledge Michael Perry, Sean Dryden, and Naomi Mulligan Kolb with Perry Undem Research/Communication for their work managing the fieldwork logistics, conducting the interviews, and assisting in identifying key themes for this project. They also extend their deep appreciation to all the participants for sharing their time and perspectives to inform this project.
Historically, most state Medicaid programs delivered and paid for services for Medicaid beneficiaries on a fee-for-service (FFS) basis, directly paying participating physicians, clinics, hospitals, and other providers a fee for each service they furnish. The FFS payment model, by definition, rewards volume, irrespective of patient health outcomes or quality of care. Also, care provided in a FFS system can often be fragmented because there is no coordinating entity, and both redundancies and gaps in patient care can result. In addition, beneficiaries are on their own in FFS systems to identify providers who participate in Medicaid and are taking new patients.
Increasingly, state Medicaid programs have been expanding their use of managed care as well as other service delivery and payment systems, as an alternative to traditional FFS. States may have different purposes in doing so, including to improve beneficiary access to care, improve the quality of care, increase Medicaid budget predictability, and reduce Medicaid spending. On May 26, 2015, the Centers for Medicare and Medicaid Services (CMS) released a proposed rule that seeks to modernize Medicaid managed care regulations. State innovation in Medicaid service delivery and payment systems has been further catalyzed by new demonstration and pilot programs and state plan authorities provided by the ACA. Underpinning many of these new opportunities for innovation are important principles, including patient-centered care, cost and quality accountability, and population health management.
There is wide state variation in Medicaid health care delivery and payment systems, as states design and combine service delivery models and payment approaches in a multitude of ways (see Mapping Medicaid Delivery System and Payment Reform to learn more about activity across states). To help those interested in understanding the diversity of Medicaid reform initiatives underway or in development in states across the country, this guide defines key terms organized under two major headings: Delivery System Models and Payment Models. Under these headings, established/long-standing terms are defined first followed by newer, more emerging terms and concepts.
Delivery System Models
Medicaid Managed Care
Primary Care Case Management (PCCM)
Risk-Based Managed Care/Managed Care Organization (RBMC/MCO)
Prepaid Health Plan (PHP)
Managed Long-Term Services and Supports (MLTSS)
Other Delivery System Models
Patient-Centered Medical Home (PCMH)
Health Home (HH)
Accountable Care Organization (ACO)
Payment Models
Fee-for-Service (FFS)
Capitation
Care Management Fee
Pay-for-Performance (P4P)
Shared Savings Arrangements (Gain-Sharing)
Shared Risk Arrangements (Risk-Sharing)
Episode of Care (EOC) Payment
Global Bundling
Delivery System Reform Incentive Payment (DSRIP)
Delivery System
MEDICAID MANAGED CARE
Primary Care Case Management (PCCM): PCCM is a model of Medicaid managed care that is outlined in the Medicaid statute. In PCCM programs, state Medicaid agencies contract with primary care providers to provide, locate, coordinate, and monitor primary care services for Medicaid beneficiaries who select them or are assigned to them by the state.12 In effect, the primary care provider – usually a physician or a physician practice, but sometimes a nurse practitioner, physician assistant, or other provider – serves as a beneficiary’s “medical home” for primary and preventive care. Under their contracts with primary care providers, states pay them a small monthly case management fee in addition to regular FFS payments; unlike in risk-based managed care (see definition below), providers do not assume any financial risk under this model. States set requirements for the participating primary care providers, such as minimum hours of operation at each location, specific credentials or training, and responsibility for referrals to specialists. State staff carry out, or contract out, administrative functions related to PCCM (e.g., network development and credentialing). “Enhanced” PCCM refers to PCCM programs that include additional services and responsibilities to strengthen care coordination.
Risk-Based Managed Care/Managed Care Organization (RBMC/MCO): MCOs are health plans that contract with states to provide comprehensive Medicaid benefits to enrolled Medicaid beneficiaries for a pre-set per-member-per-month (PMPM) premium, or capitation payment.3 This arrangement is known as risk-based managed care because MCOs are at financial risk for the Medicaid services specified in their contracts. States develop and oversee their own Medicaid managed care programs, subject to federal requirements. MCOs must meet federal and state-specific requirements that address matters such as: protocols for enrollment, disenrollment, and member support; ensuring an adequate provider network and access to care; grievances and appeals, and collection and reporting of data. Although MCOs are at financial risk for comprehensive Medicaid benefits, many states “carve out” certain services from their MCO contracts, such as prescription drugs or behavioral health services. These carved-out benefits may be provided and financed under a separate contract with a prepaid health plan (see definition below) or on a FFS basis. Alternatively, some MCOs may subcontract with prepaid health plans to provide such benefits.
Prepaid Health Plan (PHP): As distinct from an MCO, a PHP is a non-comprehensive health plan that provides only certain services, such as dental services or non-emergency medical transportation.4 Most PHPs are paid on a risk, or capitated, basis. There are several types of PHPs:
Prepaid Ambulatory Health Plan (PAHP): A PAHP is a non-comprehensive prepaid health plan that provides only certain outpatient services, such as dental services or outpatient behavioral health care, and does not cover any inpatient services.5
Prepaid Inpatient Health Plan (PIHP): A PIHP is a non-comprehensive prepaid health plan that provides only inpatient hospital or institutional services, such as inpatient behavioral health care, and does not have a comprehensive risk contract.6
Managed Long-Term Services and Supports (MLTSS): MLTSS refers to risk-based arrangements for the delivery of Medicaid long-term services and supports, which often include institutional and home and community-based services (e.g., adult day care), enabling Medicaid beneficiaries to live independently in their homes and communities rather than receive care in an institution.7 Some MLTSS programs provide only long-term services and supports (e.g., operate as PHPs), but, in other arrangements, MLTSS are provided through comprehensive MCOs.
OTHER DELIVERY SYSTEM MODELS
Patient-Centered Medical Home (PCMH): In 2007, the American Academy of Family Physicians, the American Academy of Pediatrics, the American College of Physicians, and the American Osteopathic Association released key principles that define a PCMH: (1) the personal physician leads a team that is collectively responsible for the patient’s ongoing care; (2) the physician is responsible for the whole person in all stages of life; (3) care is coordinated and/or integrated; (4) quality and safety are hallmarks of a medical home; (5) enhanced access to care is available through all systems; and (6) payment appropriately recognizes the added value to the patient.8 The National Committee for Quality Assurance (NCQA) is one of a small number of organizations that has issued specific standards that the PCMHs must meet to receive its accreditation.9 Providers or provider organizations that perform PCMH functions are often paid (by state Medicaid agencies directly or through MCO contracts) a PMPM fee in addition to regular FFS payments for their Medicaid patients. Providers or provider organizations seeking PCMH recognition may also be supported through upfront grants (to cover PCMH infrastructure costs) and/or through performance-based payments (i.e., P4P).10
Health Home (HH): Section 2703 of the Affordable Care Act (ACA) established the Medicaid health home (HH) program. The Medicaid HH model builds on the patient-centered medical home concept.11 Targeted to individuals with multiple chronic conditions, including serious mental illness, HHs are designed to be person-centered systems of care that facilitate access to and coordination of the full array of primary and acute physical health services, behavioral health care, long-term services and supports, and social service supports. HHs establish care plans for Medicaid beneficiaries, and coordinate and integrate clinical and non-clinical services.12 Medicaid HHs must provide the following services: comprehensive care management, care coordination and health promotion, transitional care, referrals to community and social services, patient and family support, and use of health information technology. States receive a 90%federal match rate for HH services (not to exceed eight quarters) and have considerable flexibility to design their own methods for paying HHs. HH providers are required to report quality measures established by CMS.13 States may implement multiple HH programs that target different populations.
Accountable Care Organization (ACO): There is currently no uniform federal definition of an ACO and the concept continues to evolve.14 Generally, an ACO is a group of health care providers or, in some cases, a regional entity that contracts with providers and/or health plans, that agrees to share responsibility for the health care delivery and outcomes for a defined population. The organizational structure of ACOs varies, but, in concept, ACOs generally include primary and specialty care providers and at least one hospital. Providers in an ACO are expected to coordinate care for their shared patients to enhance quality and efficiency, and the ACO as an entity is accountable for that care, specifically for the quality and total cost of care. An ACO that meets quality performance standards that have been set by the payer and achieves savings relative to a benchmark can share in the savings. Some states that are pursuing ACOs for Medicaid beneficiaries are building on existing care delivery programs (e.g., PCCM, medical homes, MCOs) that already involve some degree of coordination among providers and may have developed key infrastructure necessary to facilitate coordination among ACO providers (e.g., electronic medical records). States use different terminology in referring to their Medicaid ACO initiatives, such as Coordinated Care Organizations (CCOs) in Oregon and Regional Care Collaborative Organizations (RCCOs) in Colorado.
Payment Models
Fee-for-Service (FFS): In a FFS system, the state Medicaid agency establishes the fee levels for covered services and pays participating providers directly for each service they deliver to Medicaid beneficiaries. Providers do not bear any financial risk. Beneficiaries seeking care in the traditional FFS environment must identify providers who participate in Medicaid and accept new patients. Except in the context of PCCM programs, there is generally no organized provider network in the FFS environment.
Capitation: Capitation payment refers to the fixed per-member-per-month (PMPM) amount that a state Medicaid agency pays a managed care organization (MCO) to provide or arrange for covered Medicaid services delivered to enrolled beneficiaries. Capitation rates are pre-set, so MCOs are at financial risk for the services they actually provide. States adjust capitation rates for Medicaid enrollees based on their demographic characteristics, such as age and gender, and often based on other factors as well. Medicaid MCOs may pay the providers in their network on a capitation basis, a FFS basis, or on other terms.
Care Management Fee: FFS providers or provider organizations operating as patient-centered medical homes and/or health homes are often paid a supplemental per-member per-month care management fee for Medicaid patients assigned to them. These care management fees may be adjusted based on patient demographics and/or health status, or on characteristics of the provider entity, such as its score by an accrediting body.15
Pay-for-Performance (P4P): P4P is a health care payment model that rewards providers or managed care organizations (MCOs) financially for achieving or exceeding specified quality benchmarks or other goals.16 P4P payments may be made based on performance on structure, process, and/or outcome measures, with providers evaluated against benchmarks or by comparison with other providers. Some state Medicaid programs contracting with MCOs incorporate a P4P component into their payment methods. For example, they may withhold a portion of the capitation payment, which the MCO can earn back by demonstrating high performance, or make performance-based bonus payments in addition to the regular capitation payments.
Shared Savings Arrangements (Gain-Sharing): Under shared savings arrangements, sometimes referred to as gain-sharing, provider organizations or ACOs have an opportunity to share in any net savings that accrue to a payer for a defined panel of patients over a specified time period (usually 12 months). Actual costs for the patient panel are compared to a pre-established benchmark that is determined using historical utilization and/or cost data for the patient panel or a similar population. To be eligible for savings, provider organizations/ACOs must meet performance/quality requirements while also reducing costs.1718 In shared savings-only models, provider organizations/ACOs do not face downside risk. That is, they face no financial penalty if actual costs exceed the benchmark. Most typically, the shared savings model is used by ACOs and some PCMHs.
Shared Risk Arrangements (Risk-Sharing): Entities that enter into shared savings arrangements with payers may also agree to share in losses. Risk-sharing is often added to shared savings arrangements after some experience has been accumulated. Under a shared risk arrangement, if actual costs for the defined patient population exceed the benchmark, the provider group/entity is accountable for a portion of the excess costs and must return funds to the payer.
Episode of Care (EOC) Payment: Episode of care payments are single, pre-established amounts paid to providers for the set of services involved in treating a patient’s health event, such as a knee replacement, or a particular health condition, such as Attention Deficit Hyperactivity Disorder (ADHD), over a specified period of time. Episodes have a defined beginning and end and usually involve payment for multiple services and providers.1920 Payment amounts are set based on established clinical protocols and guidelines and are typically adjusted to account for the severity of the patient’s condition. Episode of care payments can be prospective or retrospective. Under the prospective model, a single payment is made for a defined “episode of care.” Under the retrospective model, providers and hospitals involved in the episode receive payment as they normally would according to the payer fee schedule, but actual expenditures are later reconciled against the pre-set price for the episode, which may trigger gain- or risk-sharing. As distinct from global bundling (see definition below), episode-based payment is a tool for managing costs incurred over a shorter time period, such as 30 or 90 days, usually beginning with initial treatment of the health event or condition. Other terms sometimes used to describe the concept of episode of care payments include bundled payment, episode-based payment, and episodic bundling.
Global Bundling: Global bundling involves a single, pre-set payment for a wide range of services delivered to an individual over a defined period of time, usually one year. Global payment amounts are risk-adjusted based on the patient’s health and other characteristics that may affect the services needed, such as age or gender. In addition, global payment models incorporate outcome or quality measures to safeguard against under-service and reward high performance.21 Other terms sometimes used to refer to the concept of global bundling include risk-adjusted global fees, comprehensive care payment, global payments, and global budgets.
Delivery System Reform Incentive Payment (DSRIP): DSRIP initiatives, which are part of broader Section 1115 demonstration waiver programs, provide states with significant funding to support hospitals and other providers in changing how they provide care to Medicaid beneficiaries. DSRIP waivers are not grant programs – they are performance-based incentive programs. The concept is that states undertake initiatives expected to save Medicaid funds and then use the available savings for new investments in delivery system reform. To obtain DSRIP funds, eligible entities, including hospitals and other providers and/or provider coalitions, must meet certain milestones or performance metrics. While the exact structure and requirements of DSRIP initiatives vary, there is often a focus on meeting process-oriented metrics in the early years of the waiver, such as metrics related to infrastructure development or system redesign, and a focus on more outcome-oriented metrics in later years.22 For example, infrastructure related metrics might pertain to implementation of chronic care management registries or enhanced interpretation services. System redesign metrics might relate to expansion of medical homes or physical and behavioral health care integration. Outcome measures might address clinical care improvements or population health.
Appendix
The table below provides links to relevant federal legislation, regulations, and other guidance where available for Medicaid delivery system and payment models. Some terms originate from authorizing legislation, regulations, or other CMS guidance while other terms, which may be used by other federal programs or in the private sector, may not be specifically defined by the Medicaid program.
Medicaid Delivery System and Payment Model Legislation, Regulations, and Other Guidance
Risk-Based Managed Care(RBMC)/Managed Care Organization (MCO)
State Option to Use Managed Care, Social Security Act, §1932..Medicaid Managed Care Organization, Social Security Act, §1903(m)..42 C.F.R. Part 438. CMS regulations on Medicaid managed care..42 CFR Parts 438, 440, 456, and 457. Notice of Proposed Rulemaking (NPRM). Mental Health Parity and Addiction Equity Act of 2008; the Application of Mental Health Parity Requirements to Coverage Offered by Medicaid Managed Care Organizations, the Children’s Health Insurance Program (CHIP), and Alternative Benefit Plans..42 CFR Parts 431, 433, 438, 440, 457 and 495. Notice of Proposed Rulemaking (NPRM). Medicaid and Children’s Health Insurance Program (CHIP) Programs; Medicaid Managed Care, CHIP Delivered in Managed Care, Medicaid and CHIP Comprehensive Quality Strategies, and Revisions Related to Third Party Liability.
Prepaid Health Plans (PHP)
42 C.F.R. Part 438. CMS regulations on Medicaid managed care..42 CFR Parts 431, 433, 438, 440, 457 and 495. Notice of Proposed Rulemaking (NPRM). Medicaid and Children’s Health Insurance Program (CHIP) Programs; Medicaid Managed Care, CHIP Delivered in Managed Care, Medicaid and CHIP Comprehensive Quality Strategies, and Revisions Related to Third Party Liability.
Prepaid Ambulatory Health Plan (PAHP)
42 C.F.R. § 438.2. CMS regulation regarding prepaid ambulatory health plans..42 CFR Parts 431, 433, 438, 440, 457 and 495. Notice of Proposed Rulemaking (NPRM). Medicaid and Children’s Health Insurance Program (CHIP) Programs; Medicaid Managed Care, CHIP Delivered in Managed Care, Medicaid and CHIP Comprehensive Quality Strategies, and Revisions Related to Third Party Liability.
Prepaid Inpatient Health Plan (PIHP)
42 C.F.R. § 438.2. CMS regulation regarding prepaid inpatient health plans..42 CFR Parts 431, 433, 438, 440, 457 and 495. Notice of Proposed Rulemaking (NPRM). Medicaid and Children’s Health Insurance Program (CHIP) Programs; Medicaid Managed Care, CHIP Delivered in Managed Care, Medicaid and CHIP Comprehensive Quality Strategies, and Revisions Related to Third Party Liability.
There is no uniform Medicaid definition of an ACO nor a uniform definition across payers. Medicare, as part of their Pioneer ACO program, defines and ACO as follows: “Under the program regulations, an ACO refers to a group of providers and suppliers of services (e.g., hospitals, physicians, and others involved in patient care) that will work together to coordinate care for the Medicare Fee-For-Service patients they serve. The goal of an ACO is to deliver seamless, high-quality care for Medicare beneficiaries, instead of the fragmented care that often results from a Fee-For-Service payment system in which different providers receive different, disconnected payments. The ACO will be a patient-centered organization where the patient and providers are true partners in care decisions. The Affordable Care Act specifies that an ACO may include the following types of groups of providers and suppliers of Medicare-covered services: ACO professionals (i.e., practitioners meeting the statutory definition) in group practice arrangements, networks of individual practices of ACO professionals, partnerships or joint ventures arrangements between hospitals and ACO professionals, hospitals employing ACO professionals, or other Medicare providers and suppliers as determined by the Secretary.” “An ACO professional is defined as a physician, as well as a physician assistant, nurse practitioner or clinical nurse specialist.”
See: http://www.cms.gov/Medicare/Medicare-Fee-for-Service-Payment/sharedsavingsprogram/Downloads/ACO_Providers_Factsheet_ICN907406.pdf. ↩︎
An analysis of a 2014 survey by the Kaiser Family Foundation finds that previously uninsured Americans who obtained health coverage that year experienced improved access to care and a decrease in financial insecurity, though they remained concerned about cost. The analysis of the 2014 Kaiser Survey of Low-Income Americans and the ACA finds that about 11 million previously uninsured nonelderly adults obtained health coverage during 2014, the year the ACA’s new coverage options were fully implemented. About half the newly insured adults were under 35, two-thirds were in households with at least one full or part-time worker and many were racial minorities. Contrary to assumptions that those with health problems would be more likely to sign up, newly insured adults had a similar health profile to people who already had coverage prior to 2014, and were more likely to report being in good or excellent health than their uninsured counterparts.
The newly insured variously obtained coverage through Medicaid (36%), the ACA marketplaces (22%), employer coverage (26%), or some other means (16%). The comprehensive survey of 10,502 adults was conducted between September 2, 2014 and December 15, 2014. Key findings include:
As expected, the newly insured were more likely than those who remained uninsured to have a usual source of care (63% vs. 46%), and more likely to have a regular doctor at a source of care (44% vs. 25%);
They were more likely than the remaining uninsured to have used medical services (64% vs 52%), or to have had a checkup or received preventive care (47% vs 27%). There were no significant differences across covered groups – including those who already had coverage – in the share reporting they had to wait longer than they thought reasonable for an appointment, with low rates reporting this as an issue;
Although cost was the biggest factor in their choice of health plan, 44 percent of the newly insured said they had trouble affording their monthly premium. Moreover, even though 85 percent of marketplace enrollees received premium subsidies, 41 percent of the newly insured with such coverage reported difficulty affording their premiums;
However, compared to the uninsured, the newly insured report lower rates of difficulty paying medical bills (36% vs. 17%), and were considerably less likely to report living with worry about their ability to afford medical care in the future.
With a Supreme Court decision on King v. Burwell looming, Drew Altman’s latest column for The Wall Street Journal’s Think Tank plays out the politics of a ruling for the two major parties.
All previous columns by Drew Altman are available.
In 2014, millions of people gained health insurance as the major coverage provisions of the Affordable Care Act (ACA) were implemented. While much attention has been paid to enrollment in new coverage options and changes in the number of uninsured over the past year, less is known about how this coverage has affected people’s lives. This report, based on the 2014 Kaiser Survey of Low-Income Americans and the ACA, aims to understand the impact that gaining coverage has had on the lives of the “newly insured” adult population. The survey of 10,502 non-elderly adults was fielded between September 2 and December 15, 2014, with the majority of interviews (70%) conducted prior to November 15, 2014 (the start of the second open enrollment period). Additional detail on the survey methods is available in the methods appendix available online.
Based on the survey findings, approximately 11 million nonelderly adults were newly insured in 2014, meaning they reported that they obtained health coverage in 2014 and were uninsured before that coverage started. While many of these people gained coverage in the first quarter of 2014—which coincided with the “open enrollment period” for Marketplace coverage—most gained it after March 2014. Medicaid enrollment is available throughout the year, and some people were eligible to enroll in Marketplace coverage outside of open enrollment. In addition, people can gain non-ACA coverage at any time.
The vast majority (95%) of adults who gained coverage in 2014 have family income below 400% of poverty, the income range for financial assistance under the ACA, with more than half (53%) in low-income families (at or below 138% of poverty) and more than one in four (42%) in middle-income families (139 to 400% of poverty). While this income profile is not significantly different than that for the remaining uninsured population, the newly insured population is significantly more likely than the previously insured to be low- or middle-income and significantly less likely to be higher income (greater than 400% of poverty). Because of these differences in income, we restrict the analysis in this brief to the population below 400% of poverty.
Who gained coverage in 2014?
Most newly insured adults are in working families, many with a part-time worker. Despite concerns about adverse selection into coverage, about half of newly insured adults are under age 35 (similar to those who remained uninsured), and newly insured adults are actually less likely to report fair or poor health than those who remained uninsured. Notably, newly insured adults were more likely to be female than their counterparts who remained without coverage, and they were also more likely to have insurance coverage for all their children (if they had any) than those who remained uninsured. In addition, half of newly insured adults are people of color, and more than half do not have dependent children—groups that have historically faced disparities in coverage rates or exclusions from coverage in the past.
How do newly insured adults access care?
A primary goal of expanding health insurance coverage is to help people access the medical services that they need. The survey findings reinforce other findings that insurance facilitates access to health care, indicating that adults who gained coverage in 2014 are more likely to be linked to regular care, less likely to postpone care when they need it, and more likely to use preventive services than those who remained uninsured. While some newly insured adults changed where they regularly go for care and most see private doctor’s offices for their regular care, many continue to seek services from community clinics and health centers, which have historically served under-served populations such as the uninsured and may be the most available source of care in their area. Still, survey findings show that newly insured adults face some access barriers compared to adults who were insured before 2014. This finding may indicate that newly insured adults are not as settled into regular care as their previously insured counterparts; it may also reflect difficulty finding a provider, problems navigating the health system and health insurance networks, misunderstanding about how to use coverage and when to seek care, or concerns about out-of-pocket costs.
How does coverage affect financial security?
Health care costs can be a major burden for low- and middle-income families. While many newly insured adults report difficulty affording their monthly premium, they also report lower rates of problems with medical bills and lower rates of worry about future medical bills than their uninsured counterparts. However, newly insured adults still face financial insecurity: they are more likely than those who had coverage before 2014 to worry about future medical bills, and they face general financial insecurity at rates similar to the uninsured. These patterns may indicate that while coverage can ameliorate some of the financial challenges that low- and moderate-income adults face, many will continue to face financial challenges in other areas of their lives.
How do the newly insured view their coverage?
People’s views of their plan may affect not only their use of their coverage but also the likelihood that they re-enroll in coverage or change plans. Survey results reveal that newly insured adults were very sensitive to cost in choosing their plan, placing a priority on cost over benefits and provider networks. A minority of both newly insured and previously insured adults reported problems in using their plan. However, newly insured adults were more likely than previously insured to say they do not understand the details of their plan and were more likely to give their plan a low rating. These findings indicate that additional education may be needed to help people understand their coverage.
Policy Implications
As more and more evidence mounts to document coverage gains during the first year of the ACA, there is interest in understanding how these gains in coverage have affected the lives of the newly insured. Findings from the 2014 Kaiser Survey of Low-Income Americans and the ACA show, not surprisingly, that adults who gained coverage had better access to health care and better financial security from medical costs than those who remained without coverage. In addition, survey findings reveal few differences in outcomes among the newly insured population by type of coverage, and the differences that do exist largely reflect Medicaid’s role in targeting the lowest income and most vulnerable.
Still, comparison between newly insured adults and those who have had coverage since before 2014 shows some areas for ongoing attention as policymakers strive to translate coverage to care. Ongoing monitoring of newly insured adults’ access and utilization is important to assess whether this population continues to face challenges or whether these differences subside over time.
Introduction
Lack of health insurance coverage for millions of people has been a long-standing policy challenge in the United States. Historically, most Americans received health coverage as an employer benefit through a job, but not all workers and their families were covered. Some people purchased coverage on their own, but this “non-group” coverage was costly and could be difficult to obtain. Public coverage provided assistance to many low- and middle-income people, but gaps in eligibility left many without an affordable coverage option. To increase the number of people with access to affordable coverage, the Affordable Care Act (ACA) included several provisions to address these challenges. The major coverage provisions, which went into effect in January 2014, include the expansion of Medicaid in many states and the availability of premium tax credits to purchase coverage through newly-established Health Insurance Marketplaces. These provisions have the potential to improve the availability and affordability of insurance coverage in the United States, with the ultimate goal of helping people access needed health services and reducing the financial burden of medical costs on low- and middle-income families.
While much attention has been paid to enrollment in new coverage options and changes in the number of uninsured since coverage provisions went into effect, less is known about how this coverage has affected people’s lives. To help understand the early impact of the ACA, the Kaiser Family Foundation is conducting a series of comprehensive surveys of the low- and moderate-income population. The 2013 Kaiser Survey of Low-Income Americans and the ACA, fielded prior to the start of open enrollment for 2014 ACA coverage, provided a baseline snapshot of health insurance coverage, health care use and barriers to care, and financial security among insured and uninsured adults at the starting line of ACA implementation.1 In Fall 2014, we conducted a second wave of the Kaiser Survey of Low-Income Americans and the ACA to understand how these factors have changed under the first year of the law’s main coverage provisions. The survey of 10,502 nonelderly adults was fielded between September 2 and December 15, 2014, with the majority of interviews (70%) conducted prior to November 15, 2014 (the start of open enrollment for 2015 Marketplace coverage; Medicaid enrollment is open throughout the year). Questions asked about coverage in 2014, costs and scope of coverage, access to health care services, and affordability and family budgets. Additional detail on the survey methods is available in the methods appendix available online.
Based on the survey findings, approximately 11 million nonelderly adults were newly insured in 2014, meaning they reported that they obtained health coverage in 2014 and were uninsured before that coverage started. While the ACA was leading to major changes in health insurance coverage in 2014, these changes were occurring against the backdrop of the normal cycles of health coverage that people experience as their employment and income circumstances change. Therefore, though most people who report gaining coverage in 2014 did so through one of the pathways in place under the ACA (Figure 1), some people gained other coverage such as employer coverage. In addition, some people who were insured before 2014 also enrolled in ACA coverage options. For example, some people who were purchasing coverage on their own instead purchased that coverage through the new Marketplaces, and some people who lost coverage and were low- and middle-income took up Medicaid.
Figure 1: Current Coverage Type Among Nonelderly Adults, by Newly Insured versus Previously Insured Status
Under the ACA, most people can only purchase Marketplace coverage during “open enrollment.” For coverage that started in 2014, open enrollment was between October 2013 and the end of March 2014; however, due to website glitches, people who started an application before March 31, 2014 were allowed to enroll through April 2014. In addition, “special enrollment periods” may be available for those undergoing certain life events (such as having a baby, getting married, or moving to a new state). Medicaid enrollment is open throughout the year, and enrollment in job-based coverage is generally timed to start of a job or fall open enrollment periods if the employer offers a choice of plans. While many (40%) newly insured adults gained their coverage in the first quarter of 2014, most gained it after March 2014. Not surprisingly, given enrollment periods, newly insured Marketplace enrollees were most likely to gain coverage in the first quarter, whereas newly-insured adults with Medicaid or employer coverage were more likely to gain coverage throughout the year (Figure 2).
Figure 2: Timing of Enrollment in Coverage Among Low- and Middle-Income Newly-Insured Adults, by Type of Coverage
The vast majority of adults who gained coverage in 2014 have family income below 400% of poverty, the income range for financial assistance under the ACA. More than half (53%) of adults who gained coverage in 2014 have family income at or below 138% of poverty, or about $27,300 for a family of three, and more than one in four (42%) has family incomes in the range for tax credits (139 to 400% of poverty). This income profile is not significantly different than that for the remaining uninsured population. However, the newly insured population is significantly more likely than the previously insured to be low- and middle-income and significantly less likely to be higher income (greater than 400% of poverty). This pattern reflects the longstanding association between being low income and lacking insurance coverage.
This report aims to understand the impact that gaining coverage has had on the lives of low- and middle-income “newly insured” adults. Based on the 2014 Kaiser Survey of Low-Income Americans and the ACA, it describes who was newly insured as of Fall 2014 and compares this population to their uninsured and previously insured counterparts (see text box below for definitions of these terms); provides information on how the newly insured view their coverage and any problems they have encountered, and examines how the newly insured fare with respect to access to medical care and financial burden. Because adults who were previously insured were more likely to be higher income, and because income is associated with many of the outcomes of interest, the analysis in this brief is restricted to only the population below 400% of poverty, who we call “low- and middle-income adults.” This approach enables us to compare the newly insured to the uninsured and previously insured with a similar income profile. Because timing of coverage may also affect some of the outcomes of interest, we also conducted sensitivity analysis to examine whether patterns among the newly insured differed by timing of coverage and, where relevant, report those as well.
–
Definitions of Key Terms Used in This Report
Throughout this report, we use the following terms to refer to people by whether they have insurance coverage and when they gained their coverage:
Uninsured: This group includes people who lacked insurance coverage at the time of the survey. While some of these people lost coverage during 2014, the vast majority (77%) lacked coverage since at least January 2014.
Newly Insured: This group includes people who were insured at the time of the survey, indicated that their coverage started on or after January 2014, and said that they lacked insurance coverage before their current coverage began.
Previously Insured: This group includes people who were insured at the time of the survey and had been insured since before January 2014. Some of these individuals may have changed the type of coverage they had in 2014, but they had no period of uninsurance before their current coverage began.
–In addition, to increase the comparability between coverage groups, we restrict this analysis to low- and middle-income nonelderly adults. Income groups are defined as:
Low-Income: People in families with incomes up to or including 138% of the poverty level. In 2014, 138% of poverty was $27,300 for a family of three.
Middle-Income: People in families with incomes between 139 and 400% of the poverty level. In 2014, 400% of poverty was $79,200 for a family of three.
Issue Brief
Who gained coverage in 2014?
In some ways, the low- and middle- income “newly insured” population (those who gained coverage in 2014 and were uninsured before gaining that coverage) and “uninsured” population (those who lacked coverage in fall 2014) resemble each other. For example, they are similar with respect to income, work status, age, and family type, and they differ from the low- and middle-income “previously insured” population (people who had coverage before 2014 and still had it in 2014) on these factors. However, the newly insured population differs from their counterparts who remained without coverage on some important factors, such as race/ethnicity, gender, and immigration status. These differences in part reflect ongoing barriers to coverage among some groups and in part reflect higher take-up among others.
Even within the low- and middle-income population, newly insured adults are more likely to be lower-income than previously insured adults. More than half (56%) of adults in the income range for ACA financial assistance are in families at or below 138% of poverty, a rate that is not statistically significantly different from the remaining uninsured. In contrast, previously insured adults in the low- and middle-income range are more likely to fall into the middle-income range, with 63% having family incomes between 139 and 400% of poverty (Figure 3). The fact that newly insured adults are more likely to be in the lowest income group may have implications for their financial stability and ability to navigate the health system, as lower-income individuals face more barriers to health care than higher-income people.
Figure 3: Income Distribution Among Low- and Middle-Income Nonelderly Adults, By Insurance Coverage in Fall 2014
Not surprisingly, adults who are newly insured through Medicaid are significantly more likely to be in the lowest income group than adults who gained Marketplace or other private coverage, who are more likely to be middle-income (data not shown). Medicaid eligibility is targeted to adults with the lowest incomes, with the ACA extending eligibility to most adults with incomes at or below 138% in states that expanded. Some adults, such as pregnant women or working adults with disabilities, may qualify for Medicaid at higher incomes through pathways in place before the ACA.
Newly insured adults are more likely to be in a family working part-time (versus full-time) than their previously insured counterparts. A majority of low- and middle-income adults who gained coverage in 2014 live in a family with a worker, meaning either they or their spouse works full time (45%) or part time (20%), and a third (33%) are in a family with no worker (Figure 4). This distribution is not significantly different from the uninsured. However, previously insured adults are more likely than newly insured adults to have a full-time worker in the family and less likely to have a part-time worker. This pattern reflects the historical ties between work and health insurance, since most people who had coverage before the ACA obtained that coverage through a job and people without full-time employment had limited access to affordable coverage. With new coverage provisions in place as of 2014, there were more options for health insurance outside employment, particularly for people in states that expanded Medicaid.
Figure 4: Family Work Status Among Low- and Middle-Income Nonelderly Adults, by Insurance Coverage in Fall 2014
Within the newly insured population, those newly insured through Medicaid were less likely than adults with other coverage (including Marketplace) to be in a full-time working family (data not shown). This finding is not surprising given that Medicaid eligibility targets those in the lowest income bracket, and people with lower incomes are less likely to work full-time. However, compared to adults who had Medicaid coverage before 2014, those who gained Medicaid coverage were more likely to be in a family with a worker. With the expansion of Medicaid in many states, eligibility levels were raised to levels where one could work part-time and still meet income limits.
Half of newly insured adults are under age 35. Despite concerns that many people who sign up for coverage would be older adults who were more at risk for health problems, half of newly insured adults were under age 35 (Appendix Table 1). Nearly a fifth (19%) were aged 19 to 25, the so-called “young invincible” group. The age distribution of the newly insured was similar to the remaining uninsured population but younger than the previously insured population. These differences likely reflect the fact that those who lacked coverage prior to 2014 were more likely to be young, since younger adults have looser ties to employment and lower incomes. Within the newly insured population, there were no significant differences in age distribution between Medicaid and Marketplace enrollees, though newly insured adults with employer coverage were less likely than those who gained ACA coverage to be age 45-64.
The newly insured population is more likely to be female than their counterparts who remained without coverage. Nearly six in ten (58%) of the newly insured population is female, a share significantly higher than that among the remaining uninsured (45%) but not significantly different from the previously insured (Appendix Table 1). Women have historically had a lower uninsured rate than men,2 and the gender patterns in who gained coverage may reflect women taking up coverage at a higher rate than men. There were no significant differences in gender by coverage type within the newly insured population.
More than half of newly insured adults are adults without dependent children, a group that has generally been excluded from publicly-financed health coverage in the past. About six in ten (61%) newly insured adults do not have dependent children, and 72% are not married (Figure 5). These shares are similar to those among the remaining uninsured population. In the past, non-elderly adults without dependent children could only qualify for Medicaid if they were disabled or pregnant, and private coverage as an adult dependent was generally restricted to spouses. With new coverage expansions, some people who faced limits to accessing coverage due to family structure were able to gain coverage. Previously insured adults were most likely to be married, perhaps reflecting the availability of family coverage in the private market. Within the newly insured population, there were no significant differences by coverage in the share of adults who were not married without dependent children.
Figure 5: Family Status of Low- and Middle-Income Nonelderly Adults, By Insurance Coverage in Fall 2014
Among parents, newly insured adults were less likely to have uninsured children than adults who remained without coverage. The vast majority of uninsured children are eligible for coverage under the ACA: Medicaid and the Children’s Health Insurance Program (CHIP) are available to most children in low-income families, and children may be covered along with their parents in Marketplace coverage. Research has found that parent coverage in public programs is associated with higher enrollment of eligible children.3 Coverage patterns in 2014 support this finding: newly insured parents were less likely than uninsured parents to have uninsured children, and nearly all newly insured and previously insured parents had all of their children insured (Figure 6).
Figure 6: Share of Low- and Middle-Income Parents Whose Children Are Insured, by Parent Insurance Coverage in Fall 2014
Over half of newly insured adults are people of color. Reflecting historical patterns of the uninsured being more likely to be people of color than the insured, the newly insured are less likely than the previously insured to be White, Non-Hispanic, though they are no more or less likely to be White, Non-Hispanic than adults who remained uninsured (Figure 7). Notably, the newly insured population is less likely to be Hispanic than the remaining uninsured. This pattern likely reflects a combination of factors, including language barriers, immigration policy, and work status, that led to the remaining uninsured being disproportionately Hispanic. There were no significant differences in race/ethnicity of the newly insured population by type of coverage gained.
Figure 7: Race/Ethnicity of Low- and Middle-Income Nonelderly Adults, By Insurance Coverage in Fall 2014
The vast majority of newly insured adults are U.S. citizens. Nearly nine in ten (87%) of newly insured adults are citizens, and 7% are legal immigrants (Appendix Table 1). The remainder is immigrants who are in the United States without a green card. While federal law bars undocumented immigrants from ACA coverage either through Medicaid or the Marketplace, as documented elsewhere, immigrants without green cards may acquire coverage through a job, directly from insurers outside the Marketplace, or through state-only programs.4,5,6 However, bans on coverage among undocumented immigrants are evident in the higher share (15%) of remaining uninsured who fall into this category. Among the previously insured, nearly all (97%) are U.S. citizens or legal immigrants. Within the newly insured population, there were no significant differences in the share of US citizens by type of coverage.
Newly insured adults do not differ significantly from the previously insured on most measures of health status, but they are less likely than their uninsured counterparts to report fair or poor health. Nearly three in ten (28%) newly insured adults rate their overall health as fair or poor, a share that is not significantly different from the previously insured but is lower than the remaining uninsured (Figure 8). Nearly a fifth (18%) reports their mental health is fair or poor and about four in ten (39%) report that they have an ongoing medical condition that requires regular care, rates about equal to adults in other coverage groups. These findings refute the idea that those who gained coverage are more likely than those who did not to be in poor health or feel they need medical services. However, newly insured adults are less likely than the previously insured and more likely than the uninsured to say they take a prescription on a regular basis.
Figure 8: Health Status Among Low- and Middle-Income Nonelderly Adults, by Insurance Coverage in Fall 2014
Within the newly insured group, adults with Medicaid are more likely say they receive care for an ongoing condition than those with Marketplace coverage (data not shown). Further, adults newly insured through Medicaid were more likely to report fair or poor overall or mental health, to have an ongoing condition, or to take a prescription drug than those newly insured through employer coverage. Several pre-ACA Medicaid eligibility pathways specifically target people with health problems, and some gaining coverage may have qualified through these routes. Many adults also enroll in Medicaid after coming in contact with the medical system, which may explain why these adults are more likely than other newly insured to have a chronic condition.
How do newly insured adults access care?
The ultimate goal of expanding health insurance coverage is to help people access the medical services that they need. A large body of literature has documented that people with insurance are more likely to be linked to regular care, are less likely to postpone care when they need it, and have an easier time accessing services. The survey findings reinforce those findings, indicating that adults who gained coverage in 2014 have better access to care than those who remained without coverage. In addition, the survey findings provide insight into patterns of care among the newly insured and remaining insured. While some newly insured adults report changing where they regularly go for care, many say they continue to seek services from community clinics and health centers, which have historically provided care to under-served populations such as the uninsured.
Adults who gained coverage are more likely to be linked to care than those who remained uninsured. Newly insured adults were more likely than those who remained uninsured in Fall 2014 to have a usual source of care, or a place to go when they are sick or need advice about their health (not counting the emergency room); they were also more likely to have a regular doctor at their usual source of care (Figure 9). Having a usual source of care or regular doctor is an indicator of being linked in to the health care system and having regular access to services. These patterns reinforce a large body of research that finds that gaining coverage is associated with improved access to care. However, results also indicate that the newly insured are less likely than the previously insured to have a usual source of care or regular doctor. This finding may indicate that newly insured adults are still navigating the health care system and are not as settled into regular care as their previously insured counterparts. There were no differences in the share with a usual source of care by type of coverage among the newly insured, but adults newly insured through Medicaid were more likely than those newly insured through Marketplace or employer coverage to say they have a regular doctor at their usual source of care.
Figure 9: Share of Low- and Middle-Income Insured Adults with a Usual Source of Care or Regular Provider, by Insurance Coverage
Newly insured adults were more likely to change where they usually go for care than their uninsured or previously insured counterparts. A fifth of newly insured adults who have a usual source of care reported that they changed the place they usually go for care since gaining their coverage (Figure 10). This rate is twice as high as the share of previously insured adults who changed their usual source of care in 2014 (it is also higher than the share of uninsured adults, but the difference is not statistically significant). About half of newly insured adults who changed their site of care reported that it was due to their insurance, a significantly higher rate than the other coverage groups.
Figure 10: Change in Usual Source of Care Among Low- and Middle-Income Nonelderly Adults, by Insurance Coverage in Fall 2014
While clinics remain an important source of care for the newly insured, most rely on private doctor’s offices for their regular care. Among newly insured adults who have a usual source of care, about half (51%) say it is a doctor’s office or HMO, and more than a third (34%) say it is a clinic or health center (Figure 11). In contrast, about half of uninsured adults with a usual source of care rely on a clinic or health center, and less than a third use a doctor’s office or HMO for their regular care. Previously insured adults were most likely to use a doctor’s office or HMO and least likely to use clinics as their usual source of care. Historically, clinics and health centers were crucial “safety net” providers for uninsured people. As newly insured gain coverage, many continue to rely on these providers, but they are also more likely to change to a doctor’s office for their care.
Figure 11: Type of Place Used for Usual Source of Care among Low- and Middle-Income Adults, by Insurance Coverage
Like their previously insured counterparts, most newly insured adults choose their site of care based on convenience or providers, rather than affordability or lack of options. In the past, many uninsured adults reported that they chose their usual source of care because it was affordable, a pattern that is also seen among adults who were uninsured in 2014. In contrast, adults who gained coverage in 2014 were more likely to say they chose their usual source of care because it was convenient (38%), and many chose it because the provider they prefer to see is there (30%) (Figure 12). They were also more likely than the uninsured to choose their site of care because it has a good reputation. Previously insured adults were more likely than newly insured to choose their usual source of care because their preferred provider is there. These differences may indicate that the previously insured adults have stronger ties to their providers, having been linked to care for a longer period of time.
Figure 12: Reason for Choosing Usual Source of Care among Low- and Middle-Income Adults, by Insurance Coverage
Mirroring patterns of being linked to care, newly insured adults are more likely than their uninsured counterparts to have used medical services or received preventive care. Overall, nearly two-thirds (64%) of adults who gained coverage in 2014 said they used at least one medical service since gaining their coverage, and nearly half (47%) had received a preventive visit or check-up (Figure 13). These rates were significantly higher than those for the uninsured in 2014 but were lower than the previously insured reported for 2014. These patterns are not unexpected given the large body of research showing that people with insurance coverage are more likely than those without to use care, including preventive care. The differences between the newly insured and previously insured partially reflect the shorter period of time that the newly insured had their coverage, since most people’s coverage started at least several months into 2014. Analysis of the type of care received (not shown) indicates that differences exist for outpatient services (well-care or sick care) and mental health services but not for hospital-based services, including emergency care, indicating that patterns differ for discretionary versus emergent or high-acuity services. Within the newly insured, adults with employer coverage were less likely than those with Medicaid to have used medical services since gaining coverage, and they were less likely than either Medicaid or Marketplace enrollees to have received a preventive visit since gaining coverage.
Figure 13: Use of Care Among Low- and Middle-Income Nonelderly Adults, by Insurance Coverage in Fall 2014
Newly insured adults were less likely than uninsured adults to never receive needed care or face serious consequences of postponing care. While there were no significant differences between coverage groups in the share who postponed care, newly insured adults were significantly less likely than uninsured adults to say they never got the care they needed (22% versus 32%) (Figure 14). They were also less likely to report that postponing care led to a condition worsening or serious stress (there was no significant difference in the share who said postponing care led to time away from work or school). Still, the newly insured were more likely than the previously insured to report problems postponing and never receiving needed care, reflecting some unmet need among those who gained coverage in 2014.
Figure 14: Unmet Need for Care Among Low- and Middle-Income Nonelderly Adults, by Insurance Coverage in Fall 2014
Unmet need could be related to several factors, including difficulty finding a provider, problems navigating the health system and health insurance networks, misunderstanding about how to use coverage and when to seek care, or concerns about out-of-pocket costs. When asked why they postponed care, newly insured adults were less likely than uninsured adults to say cost was a factor (21% versus 34%), but they were more likely than previously insured adults (15%) to say cost was a factor (Figure 15). While Medicaid enrollees pay no or nominal cost-sharing, adults with Marketplace coverage may face out-of-pocket costs, particularly if they do not choose a silver plan (cost sharing subsidies for people with incomes below 250% of poverty are only available if they choose a silver plan).7 In addition, as discussed earlier in this brief, newly insured adults have lower incomes than previously insured adults, which means cost-sharing may pose a bigger burden for them. When asked whether being able to get to the provider when it was open or difficulty traveling to the provider were factors, there were no significant differences in the shares of uninsured, newly insured, and previously uninsured adults who said these things caused them to postpone care.
Figure 15: Reasons for Postponing Care Among Low- and Middle-Income Nonelderly Adults, by Insurance Coverage in Fall 2014
Though most adults did not report problems getting medical appointments, newly insured adults were more likely than other adults to say a provider would not take them as a new patient. Compared to 7% of uninsured and 6% of previously insured adults, 15% of newly insured adults say that a provider told them he/she would not take them as a new patient (Figure 16). Most newly insured adults who reported this problem said it was because the provider did not take their coverage, a rate higher than that for the previously insured. The lower rates among the uninsured likely reflect this group’s lower propensity to seek care, as detailed elsewhere. The higher rates among the newly insured may reflect problems with network adequacy, outdated or inaccurate plan information, or disruptions in care patterns that led newly insured adults to be more likely to seek a new provider.
Figure 16: Problems Getting Medical Appointments Among Low- and Middle-Income Nonelderly Adults, by Insurance Coverage in Fall 2014
Among adults who received care, newly insured adults were more likely than uninsured to report effective communication with their providers about their care. Once people get into care, health literacy—or “patients’ ability to obtain, process, and understand the basic health information and services they need to make appropriate health decisions”8 —plays an important role in how that care affects health outcomes. Health literacy depends on a range of factors related to patients (e.g., engagement in care), providers (e.g., how the information is communicated), service setting (e.g., the length of time of the interaction), and the nature of the visit (e.g., the complexity of health information). In general, it appears that adults with coverage are more likely than those without coverage to report effective communication with their provider, a finding that may be linked to having a regular doctor. Adults who were newly insured were significantly more likely than their uninsured counterparts to report effective communication, including getting all the information they wanted from the provider; feeling encouraged to ask questions; understanding their test results; and understanding how to take their medication (Figure 17). Within the group of newly insured adults, there were no significant differences by coverage type. Further, the only outcome for which there was a significant difference between the newly and previously insured was understanding test results.
Figure 17: Views of Health Care Encounter Among Low- and Middle-Income Nonelderly Adults, by Insurance Coverage in Fall 2014
How does coverage affect financial security?
Health care costs can be a major burden for low-income families. While many newly insured adults report difficulty affording their monthly premium, they also report lower rates of problems with medical bills and lower rates of worry about future medical bills than their uninsured counterparts. However, newly insured adults still face financial insecurity: they are more likely than those who had coverage before 2014 to worry about future medical bills, and they face general financial insecurity at rates similar to the uninsured. These patterns may indicate that while coverage can ameliorate some of the financial challenges that low- and moderate- income adults face, many will continue to face financial challenges in other areas of their lives.
Many low- and middle-income insured adults report difficulty paying their monthly premium. Among adults who say that they pay a monthly premium for their health coverage, more than four in ten newly insured adults (44%) and over a third of previously insured adults (35%) say it is somewhat or very difficult to afford this cost (Figure 18). While rates of difficulty varied by type of coverage among the newly insured, these differences by type of coverage were not statistically significant. Notably, though a majority (85%) of Marketplace enrollees receive premium subsidies,9 many (41% of the newly insured and 49% of the previously insured) still report difficulty affording their premium cost.
Figure 18: Difficulty Affording Health Insurance Premiums among Low- and Middle-Income Insured Adults, by Insurance Coverage
However, coverage does provide financial protection from medical bills and eases concern over affording medical care. Compared to the uninsured, both newly insured and previously insured adults report lower rates of difficulty paying medical bills. Despite being less likely to use services, over a third (36%) of uninsured adults report a problem paying medical bills, a rate twice as high as either the newly insured or previously insured (Figure 19). Uninsured adults were also more likely to report serious consequences from medical bills, such as using up their savings, having difficulty paying for necessities, borrowing money, or being sent to collection. On all measures of problems from medical bills, there were no significant differences between the newly and previously insured.
Figure 19: Problems Paying Medical Bills Among Low- and Middle-Income Nonelderly Adults, by Insurance Coverage in Fall 2014
In addition to being less likely to report experiencing financial strain due to medical bills, insured adults are less likely than uninsured to report living with worry about their ability to afford medical care in the future. Newly insured adults were half as likely as uninsured to say they lack confidence in their ability to afford the cost of care for services they typically require (34% versus 68%), and they were also significantly less likely to say they lack confidence in their ability to afford the cost of a major illness (59% versus 82%) (Figure 20). In some cases, this concern has implications for people’s level of stress and affects their daily lives: newly insured adults were less likely than uninsured to say that worry over affording medical costs has affected their job performance, family relationships, or ability to sleep. However, in contrast to reported problems with medical bills, newly insured adults were more likely than previously insured adults to report financial insecurity over future medical bills. Among the newly insured, there were no significant differences in lack of confidence by coverage type. It is possible that newly insured adults have less confidence in the protection offered by their coverage, or it is possible that their recent experience without coverage led them to be more concerned about future coverage and costs.
Figure 20: Financial Insecurity Over Medical Costs Among Low- and Middle-Income Nonelderly Adults, by Insurance Coverage in Fall 2014
Many newly insured adults still face financial insecurity in areas outside of health care costs. While coverage provides some financial protection from medical bills, newly insured adults are not less likely than uninsured adults to report facing general financial challenges in other areas of their lives. For example, there are no significant differences in the share of uninsured and newly insured adults reporting general financial insecurity or in the share reporting difficulty paying for necessities, saving money, or paying off debt (Figure 21). However, previously insured adults were less likely than newly insured to report these financial challenges.
Figure 21: Financial Security Among Low- and Middle-Income Nonelderly Adults, by Insurance Coverage in Fall 2014
Within the group of newly insured adults, those with Medicaid were more likely than those with other types of coverage to report that they were financially insecure and more likely to say they have difficulty paying for necessities (data not shown). This finding is not surprising, given that Medicaid is targeted to adults with the lowest incomes.
How do the newly insured view their coverage?
People’s views of their plan may affect not only their use of their coverage but also the likelihood that they re-enroll in coverage or change plans. Survey results reveal that newly insured adults were very sensitive to cost in choosing their plan, placing a priority on cost over benefits and provider networks. A minority of all insured adults reported problems in using their plan. However, newly insured adults were more likely than previously to say they do not understand the details of their plan and were more likely to give their plan a low rating. These findings indicate that additional education may be needed to help people understand their coverage.
Newly insured adults were less likely to prioritize scope of coverage in choosing their plan than previously insured adults. Among adults who say they had a choice of plans and made the choice themselves, under a quarter (24%) of newly insured adults say they chose their plan because of the benefits covered, compared to 35% of previously insured adults (Figure 22). Newly insured adults were most likely to say they chose their plan because of low cost (35%); while this share was higher than the previously insured (28%), the difference was not statistically significant. Newly insured adults may have been less likely to choose based on benefits because new regulations set a minimum scope of coverage across new plans (so called “essential health benefits”), but “grandfathered” pre-existing plans are not held to the same requirement. Alternatively, newly insured adults may be more sensitive to price than their previously insured counterparts, even with the availability of financial assistance for coverage. Notably, more than half (56%) of newly insured Marketplace enrollees say they chose their plan primarily based on cost (data not shown).
Figure 22: Main Reason for Choosing Health Plan, Among Low- and Middle- Income Insured Adults Who Had a Choice
Newly insured adults were more likely to say they had difficulty comparing services and provider networks across plans than previously insured adults. In contrast to comparing costs, which similar shares of the newly insured (17%) and previously insured (15%) said was difficult, newly insured adults who chose a plan were significantly more likely than previously insured to say they found it difficult to compare services (32% versus 19%) or provider networks (34% versus 22%) (Figure 23). Comparing the newly insured and previously insured by coverage type, it appears that these differences may be linked to coverage type. For example, newly insured adults with Marketplace coverage were no more likely to report difficulty than the previously insured with Marketplace coverage (data not shown).
Figure 23: Views of Plan Selection Process Among Low- and Middle-Income Adults Who Chose a Health Plan
Most newly insured adults give their health plan high ratings, but some report not understanding the details of their plan. Nearly three quarters (74%) of all newly insured adults rate their coverage as “excellent” or “good” (versus “not so good” or “poor”), and this rate did not differ significantly by type of coverage that people gained (Figure 24). While these findings show high rates of satisfaction, adults who had coverage before 2014 were more likely to give their plan a high rating, with 83% saying their coverage was excellent or good.
Figure 24: Rating of Health Insurance Coverage among Low- and Middle-Income Insured Adults, by Insurance Coverage
Lower plan ratings among the newly insured could reflect problems with coverage, but, as discussed below, newly insured were no more likely to report problems with their plans than their previously insured counterparts. However, newly insured adults were less likely than previously insured adults to say that they understand their plan (Figure 25). Just two thirds (67%) said they understand the services their plan covers “very well” or “somewhat well” (versus 79% of previously insured adults), and three quarters understand how much they would have to pay when they visit a health care provider (versus 85% of previously insured). These shares were not significantly different across coverage type within the newly insured. It is possible that newly insured adults face challenges in understanding the complexity of insurance coverage, and lower plan ratings could reflect confusion or misunderstanding about coverage.
Figure 25: Understanding of Health Insurance Coverage among Low-and Middle-Income Insured Adults, by Insurance Coverage
Newly insured adults were no more likely than previously insured to report a specific problem with their health plan. When asked specifically if they encountered various problems with their coverage, such as coverage, costs, or customer service, newly insured adults reported similar or lower rates than previously insured. Specifically, there were no significant differences in shares reporting being denied coverage for a service they thought was covered or having difficulty getting a question answered (Figure 26). Newly insured adults were less likely than previously insured to say they faced higher than expected out-of-pocket costs or that they had not yet met their deductible. Again, within the newly insured group, there were no significant differences in rates of problems by type of coverage, with the one exception of newly insured adults with employer coverage being less likely to say their plan did not cover a service they thought was covered. In addition, there were no consistent patterns in the share of newly insured adults reporting problems by when their coverage started.
Figure 26: Problems with Current Coverage Among Low- and Middle-Income Insured Adults, by Insurance Coverage
Policy Implications
As more and more evidence mounts to document coverage gains during the first year of the ACA, there is interest in understanding how these gains in coverage have affected the lives of the newly insured. Findings from the 2014 Kaiser Survey of Low-Income Americans and the ACA show, not surprisingly, that adults who gained coverage had better access to health care and better financial security from medical costs than those who remained without coverage. Still, comparison to adults who have had coverage since before 2014 show some areas for ongoing attention as policymakers strive to translate coverage to care.
The ACA created new coverage options for people who were left out of coverage in the past. Many people who gained coverage in 2014 were from groups that have historically lagged in access to health insurance, including part-time workers, single adults, and people of color. These groups had high uninsured rates in the past for a variety of reasons, including limited access to coverage through a job, limits on publicly-financed coverage, and low incomes that made affording coverage difficult. With the ACA, some of these barriers to coverage were eased. However, socio-demographic differences between the newly insured and remaining uninsured do reveal some remaining barriers to coverage. For example, the newly insured population is more likely than the remaining uninsured to be female—perhaps indicating a need for more outreach to men—and is more likely to be US citizens or legal immigrants—indicating ongoing restrictions to coverage for some immigrants. Further, while many who gained coverage in 2014 were people of color, indicating advances in addressing longstanding racial and ethnic disparities in health coverage, most of the remaining uninsured are people of color, with more than a quarter identifying as Hispanic. Continued expansion of coverage may be key to further efforts to address ongoing disparities in coverage.
There is limited evidence of selection or a “surge” among newly insured adults. Newly insured adults were no more likely than those who remained without coverage to be older or in poor physical or mental health. In fact, the newly insured adult population reports better health on average than the remaining uninsured population. In addition, compared to those who had coverage since before 2014, there were no differences in self-reported health status, and newly insured adults were less likely to have used medical services. The differences in utilization patterns between the newly insured and previously insured partially reflect the shorter period of time that the newly insured had their coverage, since most people’s coverage started at least several months into 2014. Notably, newly insured adults were no more likely to use emergency care than those who had coverage since before 2014.
Newly insured adults have protection from medical costs but still face some financial difficulty. Compared to their counterparts who remained uninsured, adults who gained coverage in 2014 had better protection from medical bills and less worry about future medical costs. However, newly insured adults still face financial insecurity: they are more likely than those who had coverage before 2014 to worry about future medical bills, and they face general financial insecurity at rates similar to the uninsured. Notable shares of both newly insured and previously insured adults report problems paying their monthly premium, and newly insured adults were particularly cost-sensitive in choosing their health plan. These patterns may indicate that while coverage can ameliorate some of the financial challenges that low- and moderate-income adults face, many will continue to face financial challenges in other areas of their lives.
Coverage facilitates access to care, but some newly insured adults need additional support in navigating the health system and getting linked to care. Like outcomes related to medical costs, survey results show that newly insured adults fared better than uninsured adults in access to care, including having a regular provider, receiving preventive care, not postponing care, and have effective communication with their provider. However, on some measures, newly insured adults reported more problems than their counterparts who have had coverage since before 2014: for example, they were less likely to have a regular provider, more likely to not get needed care, and more likely to say a provider would not take them as a patient due to insurance. These differences likely reflect a range of factors, including limited networks, problems navigating the health system, misunderstanding about how to use coverage and when to seek care, or concerns about out-of-pocket costs. While coverage facilitates access to care, it may not automatically or immediately link newly insured adults into care in the same way that adults who have had insurance for quite some time are. Ongoing monitoring of newly insured adults’ access and utilization is important to assess whether this population continues to face challenges or whether these differences subside over time.
Among the newly insured population, there were few differences in outcomes by type of coverage. The ACA builds on the existing employer-based system to create coverage options for people across the income spectrum, including Medicaid (for people at the lowest incomes) and subsidies for Marketplace coverage (for people with middle-income). Medicaid is designed to serve a low-income population, with very limited cost sharing and broad benefits; Marketplace coverage is designed to serve those with middle incomes, with premium and cost-sharing support for people with income at the lower range of eligibility. Through some have expressed concern that some gaining coverage under the ACA are required to enroll in Medicaid versus Marketplace coverage, survey findings indicate very few differences in outcomes for these two groups. For example, there were no differences in plan ratings or problems with coverage, protection from medical bills, or access to care. The differences that were seen (for example, that newly insured adults with Medicaid are sicker, less likely to be in a working family, and are more generally financially insecure) largely reflect Medicaid’s role in targeting lowest income and most vulnerable. However, on measures of how coverage works for enrollees, Medicaid and Marketplace coverage fared about equally well and generally as well as employer-based coverage.
Appendix
Appendix Table 1: Newly Insured, Previously Insured, and Uninsured Adults with Incomes Below 400% FPL, Fall 2014
Uninsured
Newly Insured
Previously Insured
Income
< 138% FPL
59%
56%
37%*
139 – 400% FPL
41%
44%
63%*
Work Status
Full Time Working Family
47%
45%
61%*
Part Time Working Family
19%
20%
10%*
Unemployed Family
33%
33%
29%
Race/Ethnicity
Hispanic
31%*
23%
18%
White, Non-Hispanic
45%
49%
61%*
Black, Non-Hispanic
15%
19%
12%*
Other
8%
9%
9%
Gender
Female
45%*
58%
53%
Male
55%
42%
47%
Citizenship
Citizen
77%*
87%
94%*
Legal Immigrant
7%
7%
3%
Undocumented
15%*
5%
2%*
Age
19-25
24%
19%
18%
26-34
29%
31%
20%*
35-44
20%
19%
22%
45-64
26%
31%
40%*
Family Status
Married with dependent children
16%
16%
29%*
Married, no dependent children
10%
11%
18%*
Not married with dependent children
22%
22%
14%*
Not married, no dependent children
52%
50%
39%*
Insurance Status of Participant’s Children
Doesn’t have Children
62%
62%
57%
All Children are insured
25%*
35%
41%
Some or all children are uninsured
12%
—
2%
Health Status
Excellent/Good Health
62%*
71%
75%
Fair/Poor Health
37%*
28%
25%
Excellent/Good Mental Health
79%
80%
84%
Fair/Poor Mental Health
20%
18%
16%
Has Ongoing Condition
32%
39%
41%
Taking Rx
25%*
36%
49%*
Coverage Began In
Quarter 1
NA
40%
NA
Quarter 2
NA
20%
NA
Quarter 3
NA
22%
NA
Quarter 4
NA
9%
NA
DK/RF
NA
9%
NA
Prior Coverage
Coverage started prior to 2014
NA
NA
87%
Had same plan, but renewed in 2014
NA
NA
11%
Had other plan, same coverage type
NA
NA
—
Had other type of coverage
NA
NA
13%
NOTES: NA: Not applicable. “–“: Estimates with relative standard errors greater than 30% or with cell sizes less than 100 are not provided.* Estimate statistically significantly different from newly insured estimate at the 95% confidence level.SOURCE: 2014 Kaiser Survey of Low-Income Americans and the ACA.
Sommers BD. “Insuring children or insuring families: do parental and sibling coverage lead to improved retention of children in Medicaid and CHIP?” J Health Econ. 2006 Nov;25(6):1154-69. Epub 2006 Jun 5. ↩︎
Zuckerman, S., T.A. Waidmann, E, Lawton. “Undocumented Immigrants, Left Out Of Health Reform, Likely To Continue To Grow As Share Of The Uninsured.” Health Affairs. October 2011 30:1997-2004. ↩︎
Medicare plays an integral role in end-of-life care, an issue that is emotionally-charged and easily politicized. About three-quarters of the 2.5 million Americans who die each year are ages 65 and older, and covered by Medicare at the time of their death, yet policy issues related to Medicare and end-of-life care are often poorly understood.
As policymakers consider whether and how Medicare should pay physicians and other health care professionals for talking to Medicare beneficiaries and their families about their options and choices for end-of-life care, the Kaiser Family Foundation has released a new fact sheet that answers 10 frequently-asked questions (FAQs) about the program’s role in end-of-life care.
Questions covered include:
What is end-of-life care, and how does Medicare cover it?
What is “advance care planning,” does Medicare pay for it, and are policymakers considering changes in Medicare coverage for it?
Did the Affordable Care Act change how Medicare covers end-of-life care?
What are “advance directives,” and are health care facilities required to keep records of them?