KFF designs, conducts and analyzes original public opinion and survey research on Americans’ attitudes, knowledge, and experiences with the health care system to help amplify the public’s voice in major national debates.
In his column for The Wall Street Journal’s Think Tank, Kaiser’s President Drew Altman is joined by The Commonwealth Fund’s President David Blumenthal to discuss the impact of the Affordable Care Act’s coverage expansion on the primary care delivery system. Their analysis is based on the Kaiser-Commonwealth National Survey of Primary Care Providers.
All previous columns by Drew Altman are available online.
Seniors managing chronic health conditions or experiencing an age-related decline in physical or cognitive functioning may need long-term services and supports (LTSS) to complete daily self-care activities (such as eating, bathing or dressing) or household activities (such as preparing meals or doing laundry). LTSS include a range of services, including adult day health care programs, home health aide services, personal care services, and case management services, among others.1 LTSS needs may be met through both paid services and unpaid services provided by friends or family members. While some people who need LTSS choose or require care based in nursing facilities, most people with LTSS needs live in the community. (See related videos on seniors with LTSS needs in Virginia and Kansas.)
Medicare is the primary source of health insurance for nearly all seniors, but the program does not cover LTSS, and few Medicare beneficiaries have private insurance that covers these services. For some low-income Medicare beneficiaries (called “dual eligible beneficiaries”), Medicaid fills this gap by providing wraparound coverage for a range of services, including LTSS. Helping these individuals remain in the community rather than reside in a nursing facility is a goal of both beneficiaries and states, in part due to the Americans with Disabilities Act’s community integration mandate.2 Understanding the community-based LTSS population served by Medicaid is important for designing effective care delivery systems, particularly as states are increasingly developing new systems of integrated and managed care for this population, and because Medicaid is the nation’s primary payer for LTSS.3
In addition, other low-income seniors may have LTSS needs but may not meet Medicaid eligibility criteria or be enrolled in the program. Some Medicaid waiver programs that provide home and community-based LTSS have waiting lists for coverage.4 Since many of these people may become eligible for Medicaid should they ever need institutional-based LTSS, it is important to understand the needs and characteristics of this population as well as that already served by Medicaid.
To better understand the low-income population with LTSS needs, including those covered by Medicaid and those who are not, this issue brief examines the need for LTSS among seniors who live in the community5 and need LTSS. We use the 2011 National Health and Aging Trends Study (NHATS) to examine rates of need for LTSS and detail the characteristics of seniors who need these services. Throughout the brief, we compare dual eligible beneficiaries to low-income seniors without Medicaid. We also examine a third group, higher income seniors without Medicaid, to understand the role of income. Because LTSS needs increase with age, we also examine differences by age. A full description of the NHATS data and the analytical approach are included in the methods section at the end of this issue brief.
The need for LTSS among seniors living in the community
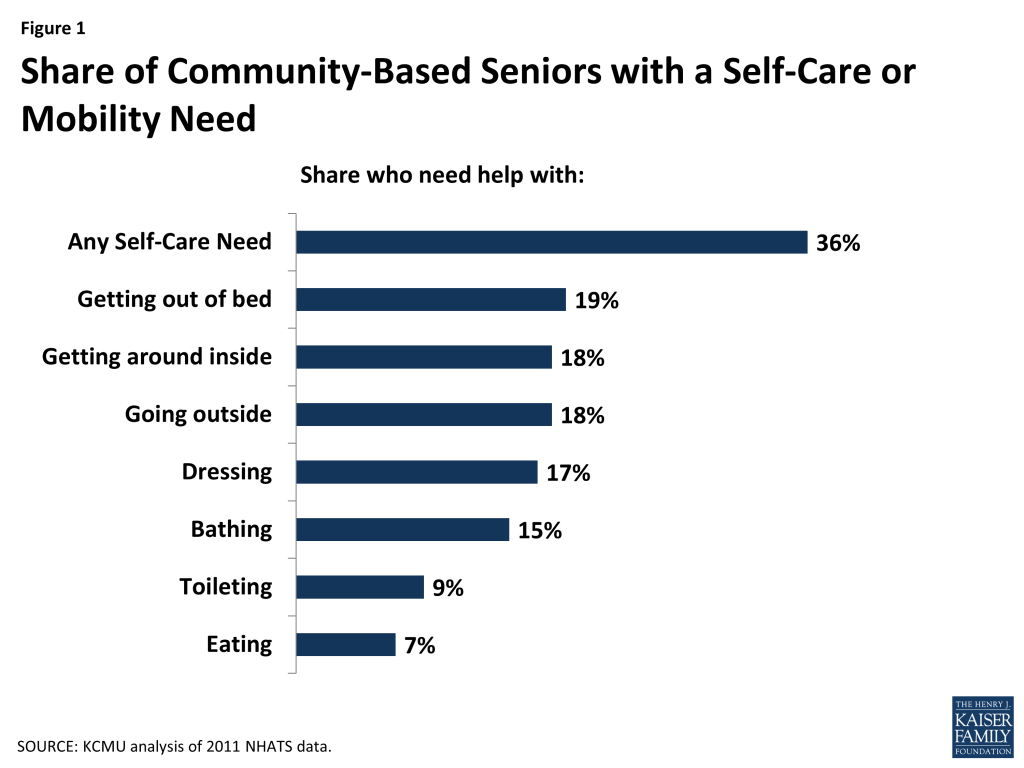
LTSS needs are relatively common among seniors living in the community. Overall, 46 percent of seniors in the community report having any type of LTSS need (data not shown). LTSS needs fall into two major categories: self-care needs and household activity needs.Sometimes called “activities of daily living,” self-care needs (e.g., bathing, dressing, or eating) are those considered essential to daily functioning. The number and extent of such needs are used as the basis to determine Medicaid eligibility for LTSS. More than a third (36%) of seniors in the community have a self-care or mobility need (Figure 1). With the exception of toileting and eating (which are less common), different types of self-care/mobility needs (bathing, dressing, going outside, getting around inside, and getting out of bed) are about equally prevalent. While Medicaid eligibility standards may require that an individual have several self-care needs, even having one self-care need could be incapacitating if that need is unmet.
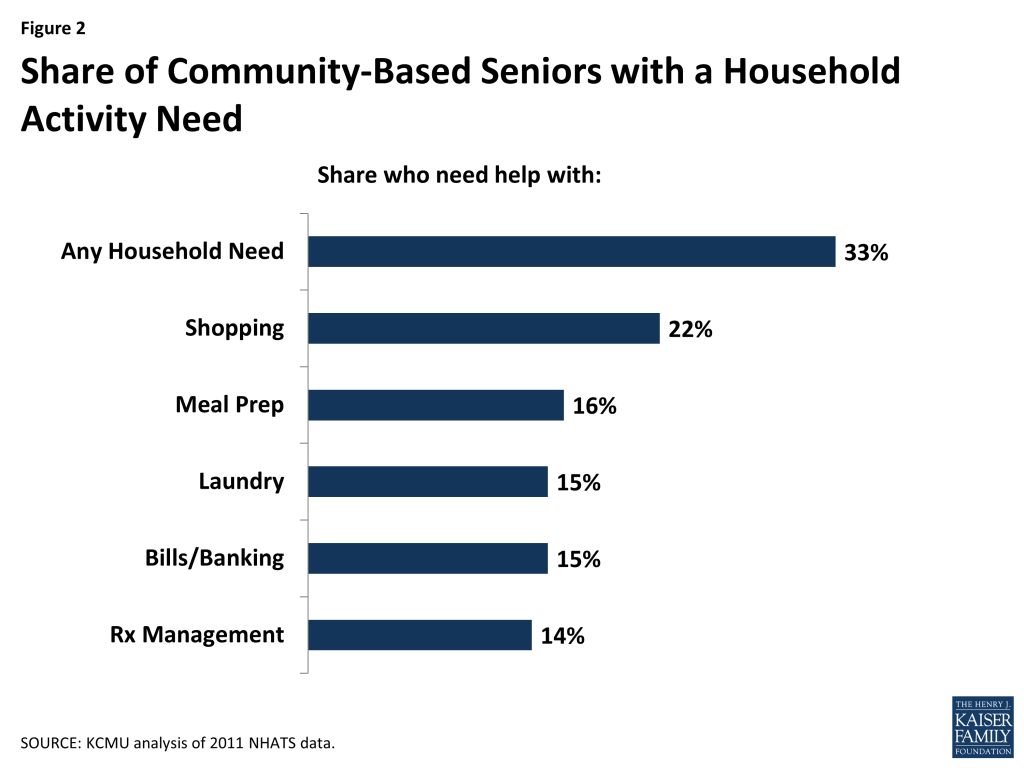
Figure 1: Share of Community-Based Seniors with a Self-Care or Mobility NeedFigure 2: Share of Community-Based Seniors with a Household Activity Need
Household activity needs (e.g., preparing meals or managing medication) are sometimes called “instrumental activities of daily living.” Household activity needs are also common, with a third (33%) of seniors in the community having such a need (Figure 2). Within household activity needs, different types of needs (help with meal preparation, laundry, paying bills, and medication management) were about equally prevalent, with the exception of shopping for groceries or personal items, which was more common. While not as essential to functioning as self-care needs, household activity needs are an important measure of a person’s ability to live independently in the community.
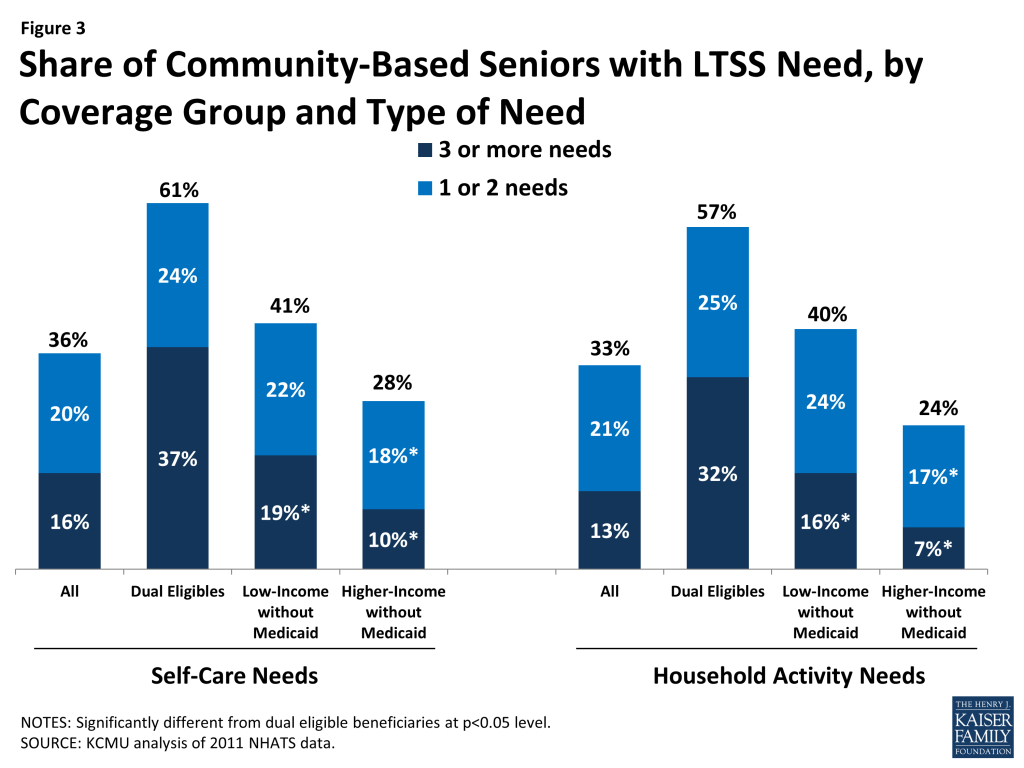
The need for LTSS is more common among some groups of seniors than others. Dual eligible seniors are more likely to have an LTSS need than low-income seniors who do not have Medicaid. Almost seven in ten dual eligible beneficiaries reported an LTSS need, a significantly higher rate than among low-income seniors without Medicaid (52%) or higher-income seniors without Medicaid (36%) (data not shown). This pattern holds across different types (household and self-care) of need (Figure 3). Dual eligible beneficiaries also are more likely than other seniors to report having three or more LTSS needs. This finding in part reflects Medicaid eligibility policy: seniors may become eligible for Medicaid LTSS coverage based on their low income and functional needs or by “spending down” their income and resources to cover medical and LTSS expenses. However, many low-income seniors who do not have Medicaid also need LTSS. Unless these individuals have private insurance coverage for LTSS, they must pay out-of-pocket for services, rely on family or friends, or go without needed services. For low-income seniors without Medicaid, accessing needed services may be particularly difficult, given limited resources.
Figure 3: Share of Community-Based Seniors with LTSS Need, by Coverage Group and Type of Need
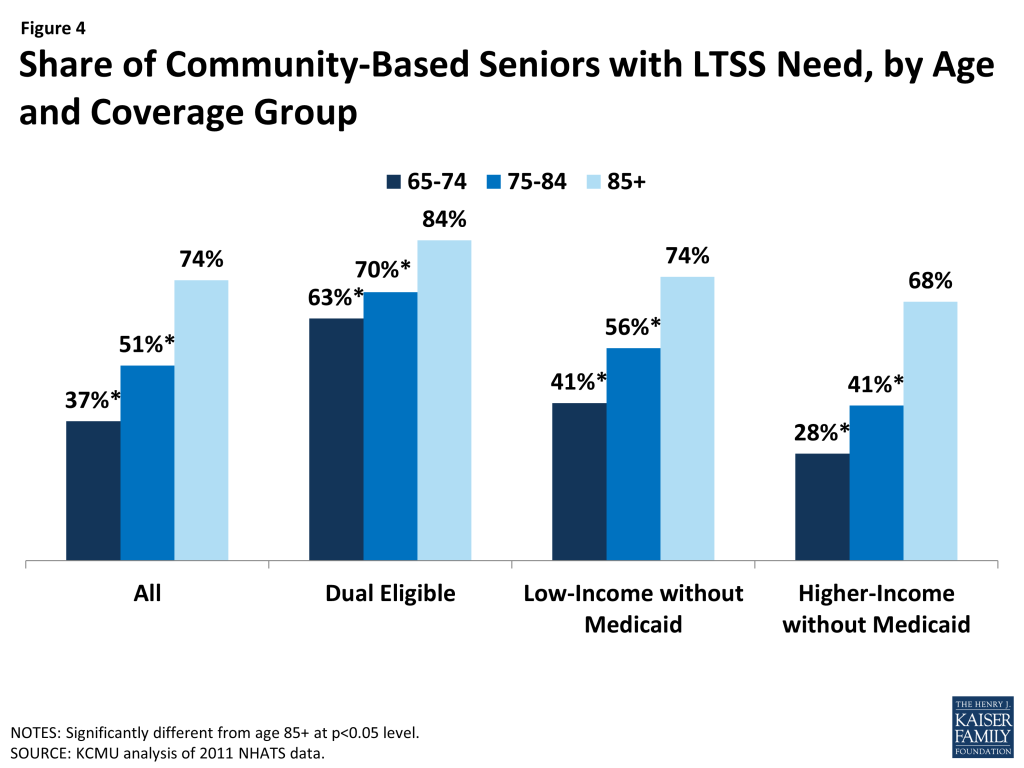
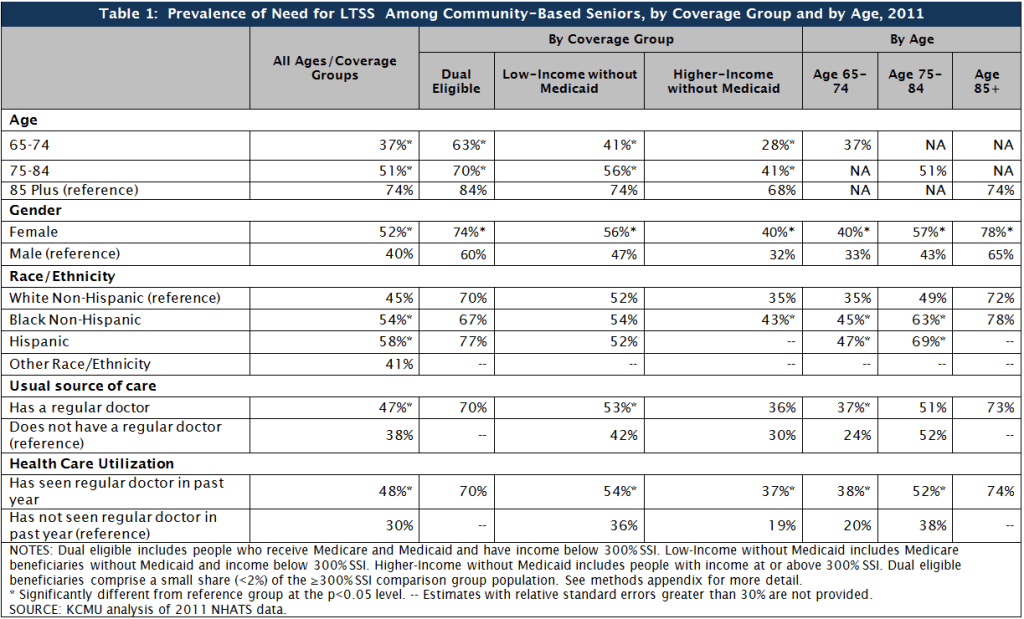
Not surprisingly, older seniors are most likely to need LTSS. Compared to 37% of seniors aged 65 to 74 and about half of those aged 75-84, nearly three quarters (74%) of those aged 85 and older have an LTSS need (Figure 4 and Table 1). This pattern is expected given that functioning declines with age, but it also demonstrates high levels of need among the “very old” (age 85+) who may face additional challenges in accessing needed services (such as transportation or mobility limitations). It also indicates that, as the population ages, overall rates of need for LTSS may increase. Differences in rates of need by age exist among both dual eligible beneficiaries and seniors without Medicaid, though dual eligible beneficiaries at all ages are more likely to need LTSS than both other low-income and higher-income seniors without Medicaid. Again, different rates of need by coverage group reflect Medicaid’s role in providing assistance to those with LTSS needs.
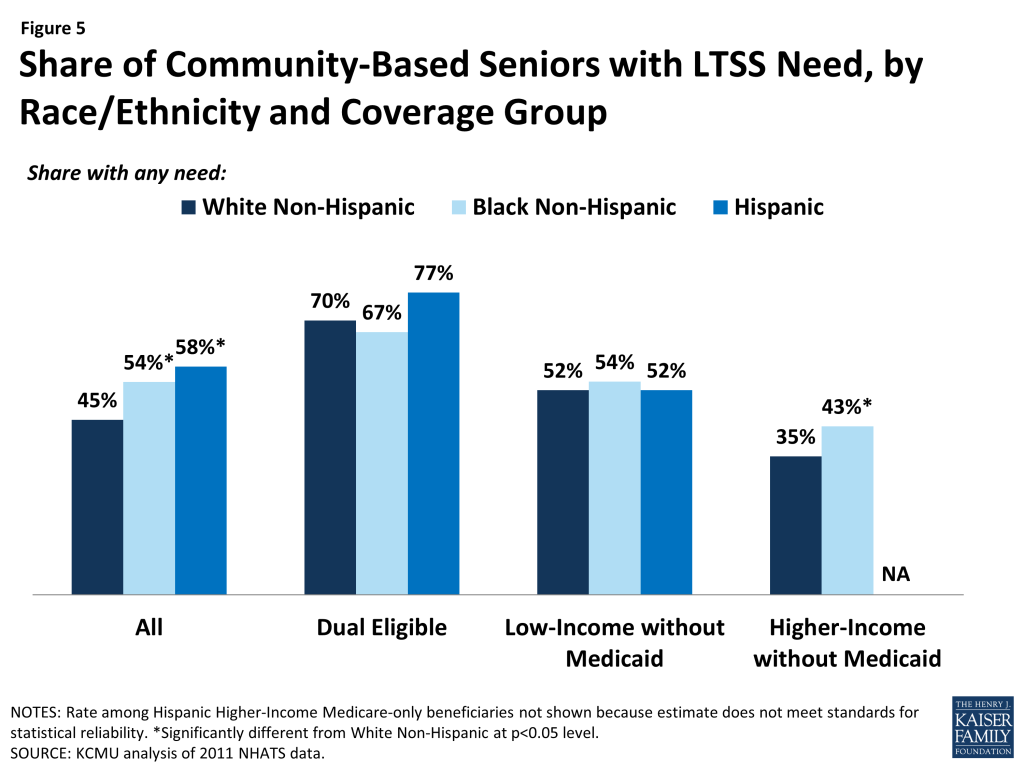
Figure 4: Share of Community-Based Seniors with LTSS Need, by Age and Coverage GroupFigure 5: Share of Community-Based Seniors with LTSS Need, by Race/Ethnicity and Coverage Group
Women also are more likely to need LTSS, with more than half of elderly women (52%) having an LTSS need compared to four in ten men. Even controlling for coverage group/income and age, women are more likely than men to need LTSS (see Table 1). In addition, people of color are more likely to have an LTSS need than White, Non-Hispanics. More than half of Black (54%) or Hispanic (58%) seniors have an LTSS need, compared to 45 percent of White Non-Hispanics. Some of the differences in rates of need by race/ethnicity likely reflect income; when examining rates of need within income/coverage group, there was no difference in rates of need by race/ethnicity among either dual eligible beneficiaries or low-income seniors without Medicaid (Figure 5 and Table 1).
Lastly, most seniors (about 90%, data not shown) are linked to a regular source of health care and the percentage with LTSS need is higher than among the small percentage of seniors who are not linked to care. However, nearly four in ten (38%) seniors who say they do not have a regular health care provider need LTSS, and three in ten who have not seen a regular provider in the past year need LTSS (Table 1). While these rates of need are lower than those among seniors who do have regular providers or did see their provider in the past year, they indicate relatively high levels of need among seniors who do not appear to be linked to a regular source of care. Health care providers may be an important resource for screening for LTSS needs and connecting low-income people to Medicaid coverage and services, and people who are not linked to care may be harder to reach. Identifying people with LTSS needs as early as possible and connecting them to services can be cost-effective over time by preventing or postponing the need for more intensive services or institutional care as functioning declines due to unmet needs.
Understanding the population of seniors with LTSS needs
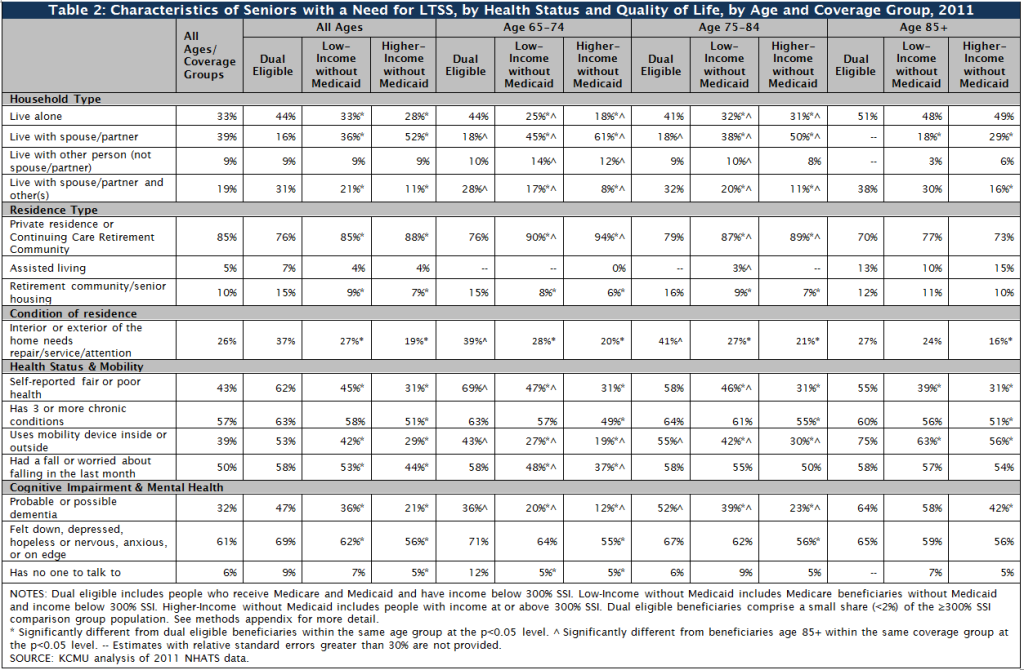
In recent years, many states have undertaken efforts to coordinate Medicaid LTSS with other services, including both those provided by Medicaid and by Medicare, or to actively manage LTSS through managed care programs. Understanding the health and social characteristics of seniors with LTSS needs can help policymakers design programs to address the needs of this population. Among both dual eligible beneficiaries and low-income seniors without Medicaid, most seniors with an LTSS need have physical or mental health problems and live in a private residence. However, there are notable differences between the LTSS population served by Medicaid and the LTSS population that does not have Medicaid: Medicaid beneficiaries are frailer in that they have poorer health, higher rates of mobility impairment, and higher rates of cognitive impairment or mental illness. They also are more likely to live alone or in poor housing conditions. Still, the population of low-income seniors without Medicaid who need LTSS also is vulnerable, with notable shares having significant physical or mental impairment and living in arrangements that may make it difficult to obtain needed assistance.
Health Status and Mobility Limitations
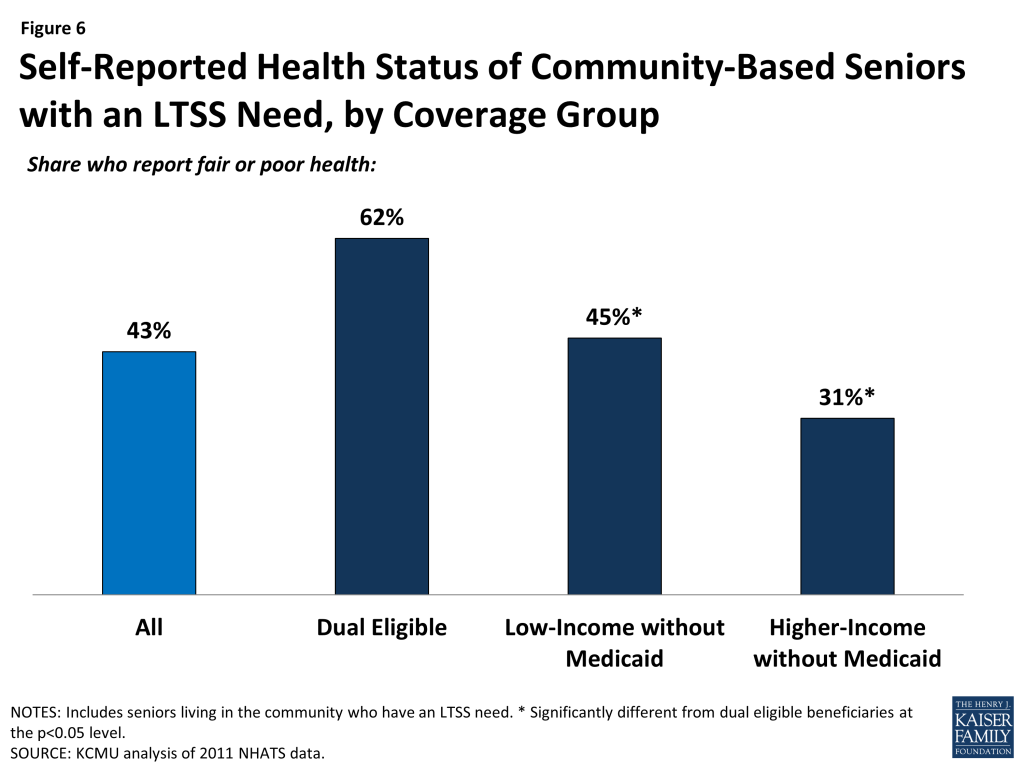
Poor health and the need for LTSS are closely related. Overall, over half (57%) of seniors with an LTSS need live with at least three chronic conditions (such as high blood pressure, arthritis, osteoporosis, diabetes, or heart disease6 ), and this rate is similarly high among dual eligible beneficiaries and low-income seniors without Medicaid with an LTSS need (Table 2). While not surprising, these patterns show a strong relationship between physical illness and LTSS needs. Similarly, many (43%) seniors with an LTSS need say their overall health is fair or poor, though dual eligible beneficiaries are more likely than low-income seniors without Medicaid to say that their overall health is fair or poor (Figure 6). This difference may reflect dual eligible beneficiaries having more complex health needs or comorbidities than seniors without Medicaid.
Figure 6: Self-Reported Health Status of Community-Based Seniors with an LTSS Need, by Coverage Group
Mobility problems are also common among seniors with LTSS needs. Overall, nearly four in ten (39%) seniors with an LTSS need use a mobility device (cane, wheelchair, walker or scooter) either inside or outside their home. Among dual eligible beneficiaries with an LTSS need, however, rates are higher, with more than half (53%) requiring a mobility device in or outside the home (Figure 7). Though older (age 85+) beneficiaries in all coverage/income groups are more likely to use a mobility device than younger seniors, the pattern of dual eligible beneficiaries being more likely to use mobility devices holds across age groups (Table 2). This finding may point to a need for special transportation programs for dual eligible beneficiaries, particularly if they require health or social services outside the home.
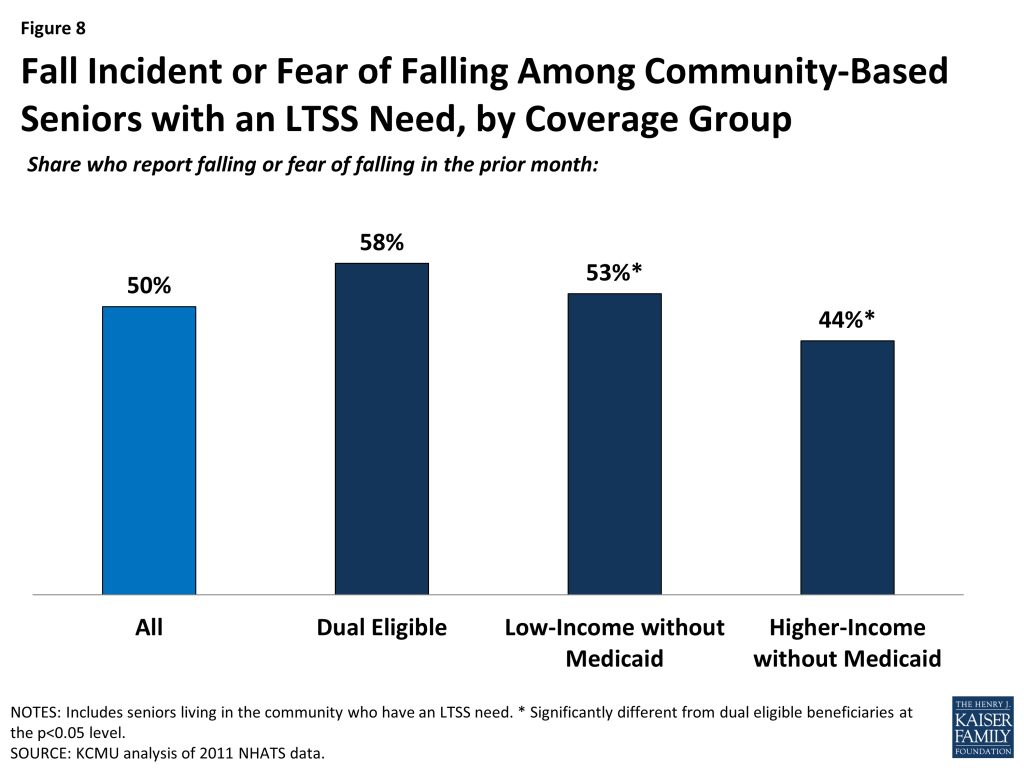
Figure 7: Mobility Impairment among Community-Based Seniors with an LTSS Need, by Coverage GroupFigure 8: Fall Incident or Fear of Falling Among Community-Based Seniors with an LTSS Need, by Coverage Group
Falls are a serious problem among older adults, occurring frequently and leading to serious injury or even death; fear of falls is also common and can lead to self-imposed restrictions on activity that in turn contribute to mobility impairment.7 Indeed, corresponding to mobility impairments, half of seniors with an LTSS need report that they have either had a fall or feared falling in the prior month, and dual eligible beneficiaries with an LTSS need are more likely than other seniors to report falling or having a fear of falling (Figure 8). However, because fall incidents or risk increase with age, among seniors with an LTSS need in the age groups 75-84 or 85+, there is no difference across coverage/income groups in the likelihood of falling or fear of falling (Table 2). Because falls lead to increased health care utilization and costs,8,9 high rates of falling and fall risk may be of concern for programs serving the community-based LTSS population.
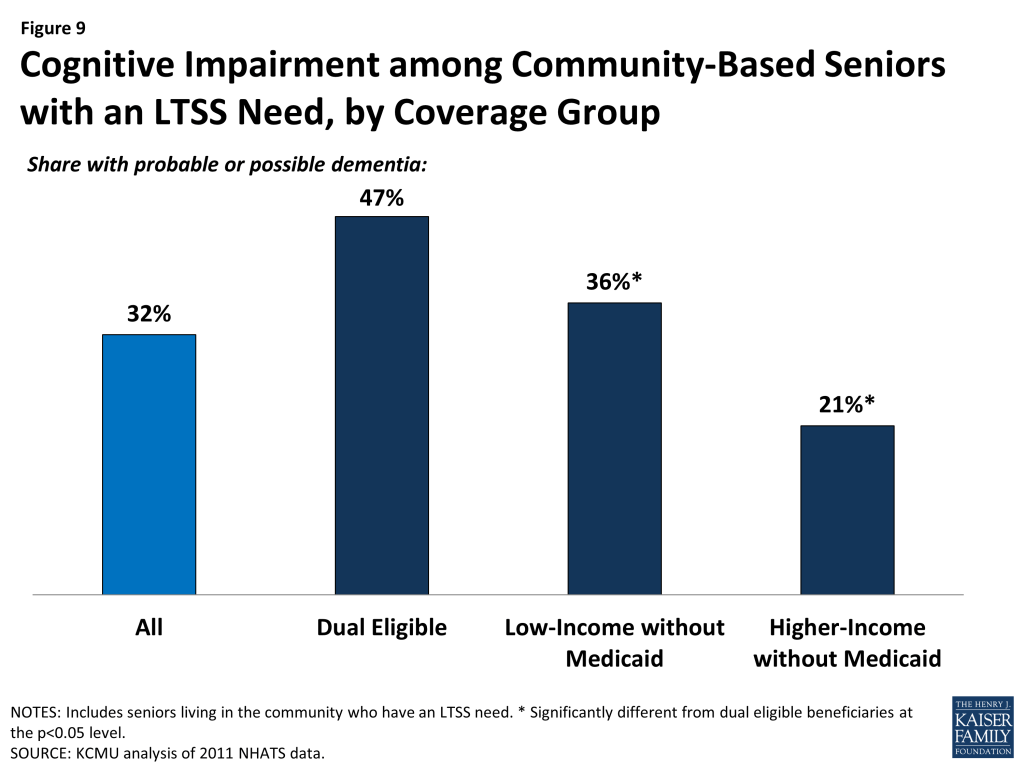
Similar to those with physical limitations, people with cognitive impairments may require extra assistance and substantial supervision in managing day-to-day self-care or household activities. They may also be particularly challenging to serve, as these impairments sometimes manifest in difficult behavior. Overall, nearly one in three (32%) seniors with an LTSS need has a cognitive impairment, defined here as possible or probable dementia.10 However, among dual eligible beneficiaries, the rate is 47 percent, significantly higher than among seniors without Medicaid (Figure 9). The likelihood of having a cognitive impairment increases with age, and by age 85, there are no statistical differences in the prevalence of cognitive impairment between dual eligible beneficiaries and low-income seniors without Medicaid (Table 2). Recently proposed federal regulations for staffing in nursing facilities call for additional training in caring for people with dementia,11 but no similar federal requirements exist for care delivered in the community.12 Thus, states and other programs serving the LTSS population in the community may need to develop their own guidelines to ensure best practices in caring for the seniors with dementia or other cognitive impairment.
Figure 9: Cognitive Impairment among Community-Based Seniors with an LTSS Need, by Coverage GroupFigure 10: Depression or Anxiety among Community-Based Seniors with an LTSS Need, by Coverage Group
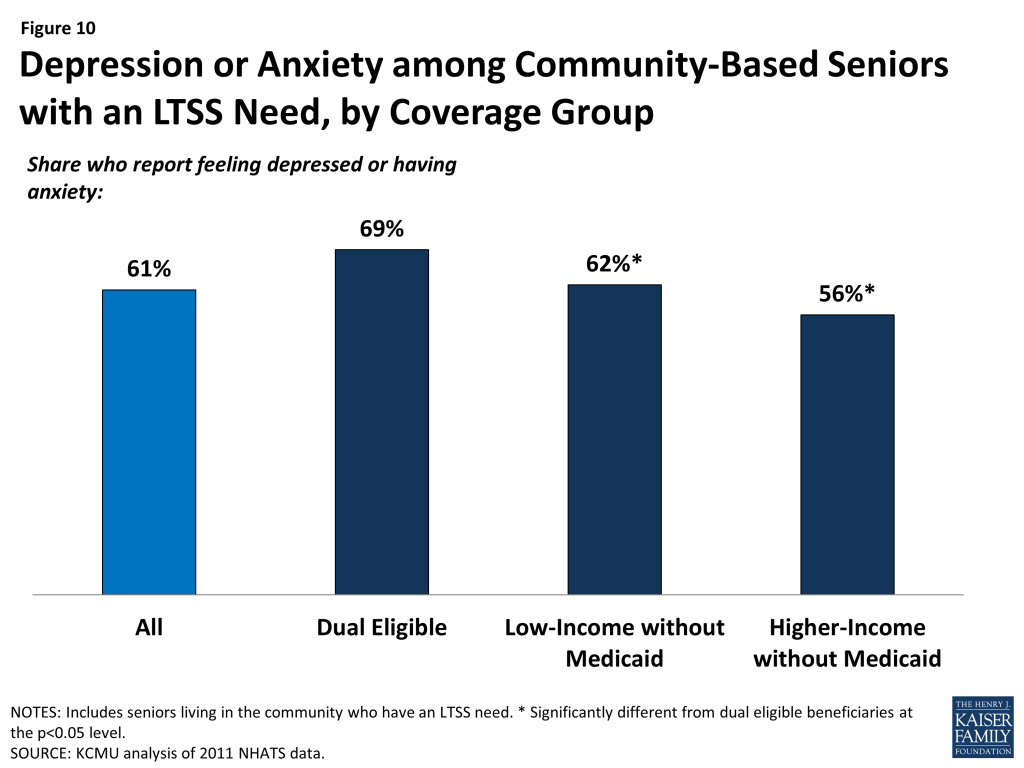
Integrated care that coordinates physical and behavioral health is a goal of many recent initiatives to serve the LTSS population in the community. More than six in ten (61%) seniors with an LTSS need report feeling depressed or having anxiety. Among seniors with an LTSS need, dual eligible beneficiaries are more likely than seniors without Medicaid to report symptoms of depression or anxiety (Figure 10). These patterns vary when looking at specific age groups, as rates of depression and anxiety generally even out between coverage/income groups at older ages (Table 2). As with the high prevalence of physical comorbidities or multiple chronic conditions, high rates of behavioral health need among people with LTSS needs may represent an opportunity for additional coordination of services.
In addition to maintaining self-sufficiency and promoting independence, delivering care in the least-restrictive setting, and lowering long-term care costs, a central goal of helping people with LTSS needs remain in the community is to preserve social networks and community integration. Notably, among seniors with an LTSS need, only 6 percent say they have no one to talk to about important things—a proxy for social isolation. These rates are low across all coverage/income groups. When looking at specific age groups, however, younger (age 65-74) dual eligible beneficiaries are particularly likely to report not having someone to talk to (12%, versus 5% for seniors without Medicaid in the same age range) (Table 2). The higher rate among this group may indicate barriers to being integrated into the community and a need for more social interaction for this population.
Housing Type and Condition
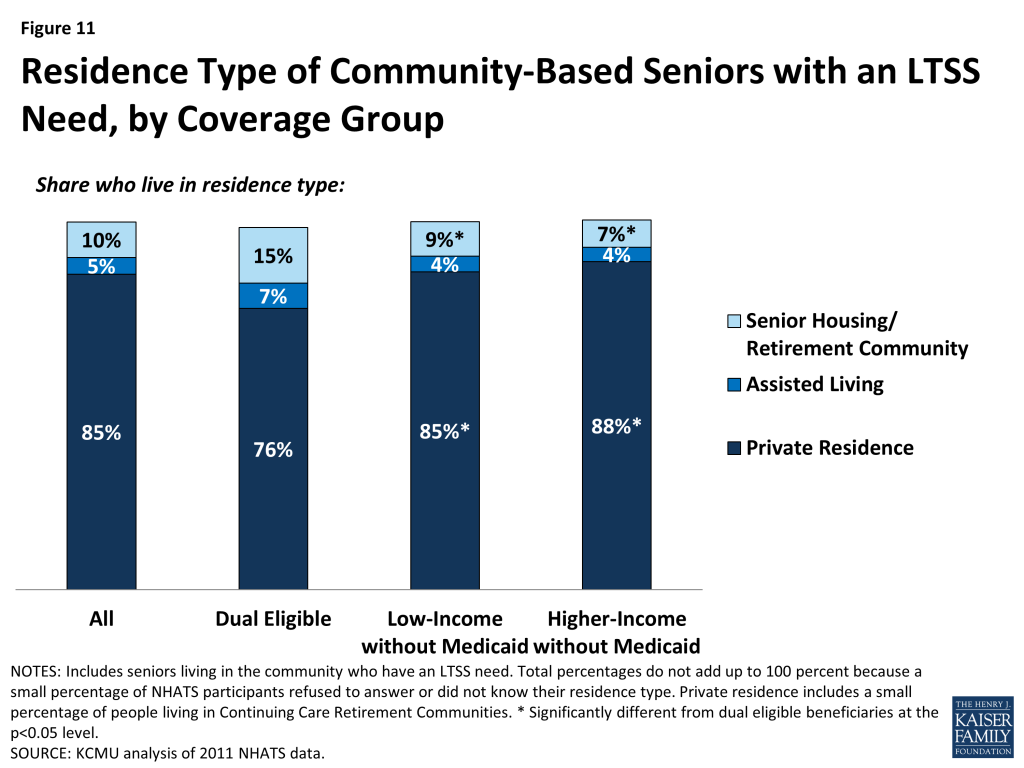
People who live in assisted living or senior housing/retirement communities may have access to more social or supportive services than those who do not live in such places. Overall, the majority (85%) of seniors with an LTSS need live in a private residence, versus an assisted living facility or senior housing/retirement community. However, dual eligible beneficiaries are less likely than seniors without Medicaid to live in a private residence and are more likely to live in senior housing or a retirement community (Figure 11), perhaps reflecting a greater level of need among dual eligible beneficiaries. These differences decrease at older ages (Table 2).
Figure 11: Residence Type of Community-Based Seniors with an LTSS Need, by Coverage GroupFigure 12: Living Situation of Community-Based Seniors with an LTSS Need, by Coverage Group
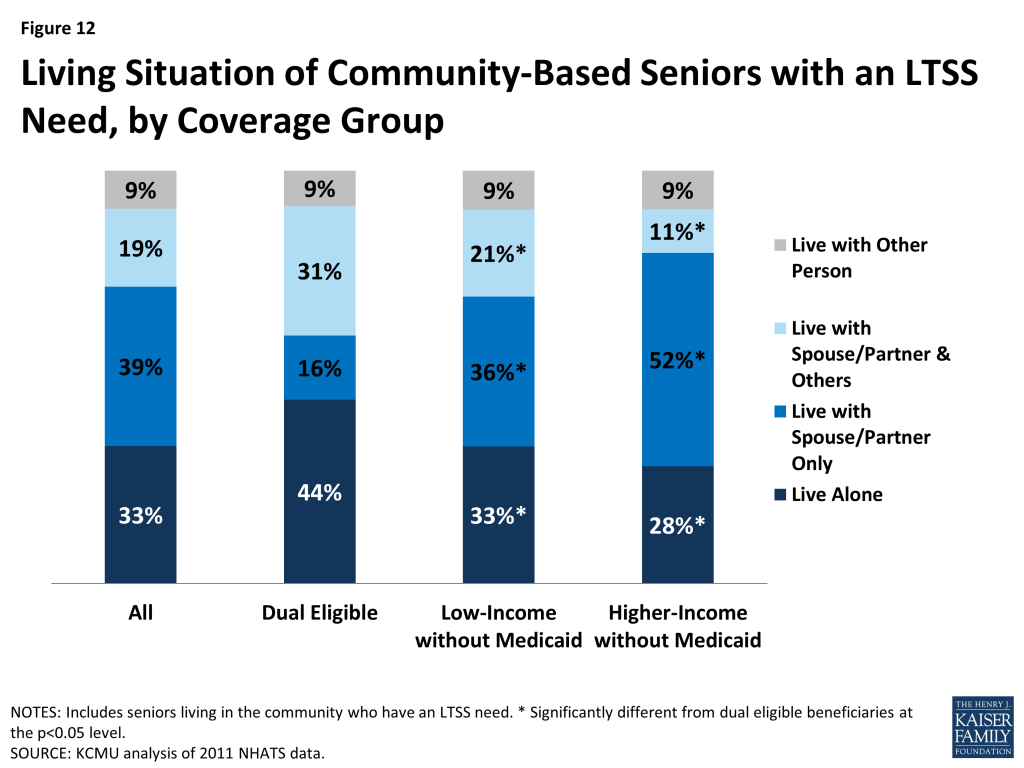
In addition, dual eligible beneficiaries with LTSS needs are more likely than seniors without Medicaid to live alone (Figure 12). This pattern holds for those ages 65 to 84, but differences decrease at older ages (Table 2). Notably, much of the low-income LTSS population without Medicaid lives alone. While people who live alone but have Medicaid coverage may receive personal care services to help them with day-to-day tasks, those who live alone, need LTSS, and do not have Medicaid must either pay for help out-of-pocket or rely on someone to come to their home daily to help them. Some people with LTSS needs live with someone else, in addition to a spouse or partner, perhaps because they select living arrangements that enable them to receive assistance from extended family or friends. Dual eligible beneficiaries are more likely than seniors without Medicaid to live with someone besides a spouse or partner, though many low-income seniors without Medicaid also have such living arrangements.
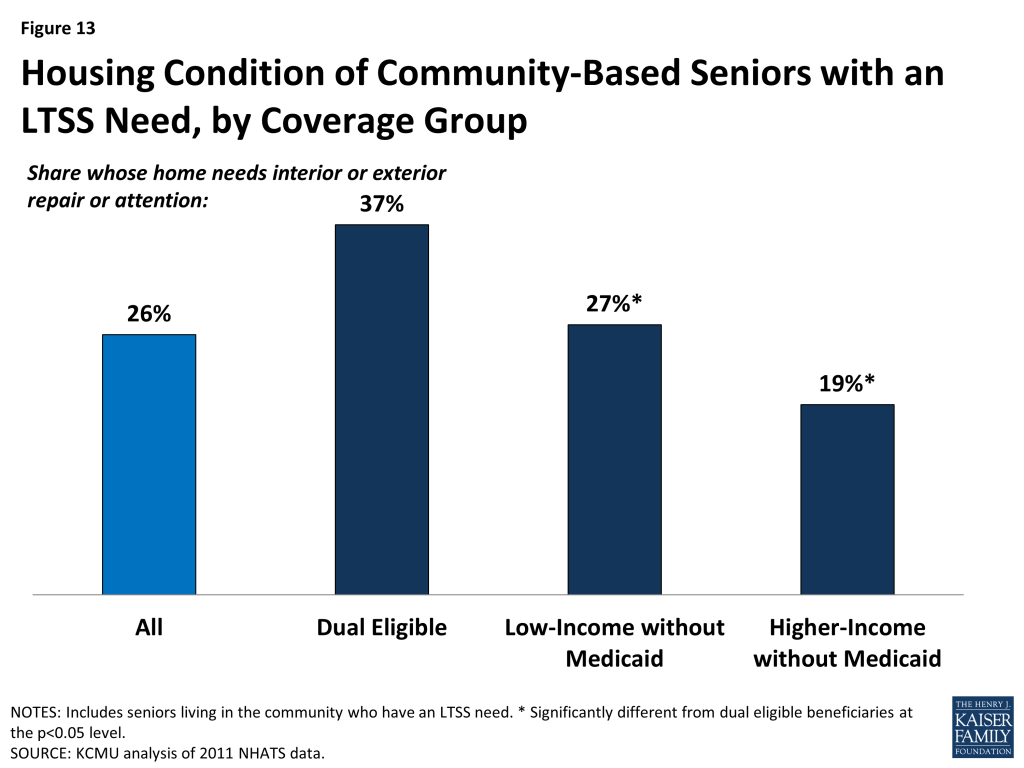
Further, among all seniors with an LTSS need, many live in a home that needs repair to the interior or exterior (26%). These repair needs may include minor conditions (e.g., flaking paint, a broken lamp) or more serious conditions (e.g., pests, tripping hazards) that pose a health hazard. Poor housing conditions may reflect the occupant’s limited income or ability to keep up on repairs, but a growing body of evidence indicates that these conditions can also have a deleterious effect on overall health and functioning.13 Thus, housing conditions may represent a challenge for programs and individuals trying to serve the population with LTSS needs, particularly since such repairs are not covered by Medicaid despite their impact on health. Dual eligible beneficiaries are more likely than seniors without Medicaid to live in a residence in need of interior or exterior repairs (Figure 13). Among older seniors (ages 85 and older), fewer differences in housing conditions are found across income groups, with low-income seniors without Medicaid as likely as dual eligible beneficiaries to live in a residence that needs repair (Table 2).
Figure 13: Housing Condition of Community-Based Seniors with an LTSS Need, by Coverage Group
Conclusion and Policy Implications
Understanding the community-based population of seniors with LTSS needs is particularly important for designing effective systems to serve their needs. This population is at high risk for needing institutional care, which can be costly and is not the preferred site of care for most people. In addition, people in the community who need LTSS may not be linked to services or programs to meet their needs, placing them at risk of developing more extensive, and costly, needs over time. These outcomes are particularly likely for low-income seniors who do not have Medicaid, as they likely lack other coverage for LTSS and have limited resources to purchase these services. Should the low-income population without Medicaid reach the point where they need institutional care, many would likely become eligible for Medicaid.
Medicaid currently plays an important role in helping people with LTSS needs maintain health and functioning in the community. Because many dual eligible beneficiaries qualify for Medicaid as a result of a disability, high medical expenses, or a need for LTSS, rates of LTSS need are particularly high among seniors with Medicaid. Further, Medicaid seniors with LTSS needs are in worse overall physical or mental health than other seniors, indicating that Medicaid is serving the LTSS needs of a population with particularly complex health, social, and environmental needs.
The high level of LTSS need among Medicaid beneficiaries has implications for how to best deliver services to these seniors. This analysis shows high rates of comorbid physical and mental health problems among dual eligible beneficiaries with LTSS needs; it also finds a need for social supports such as efforts to improve housing conditions, reduce fall risk, and, in some cases, address social isolation. Delivery system reform initiatives seeking to better coordinate care across the domains of medical and LTSS and to integrate physical and behavioral health services could allow these beneficiaries’ needs to be met in a more holistic manner while potentially improving health outcomes and lowering costs. As of October 2014, 19 states had waivers to operate capitated managed long-term services and supports programs, most of which require beneficiaries to enroll in a Medicaid managed care organization to receive services, and as of July 2015, 12 states were implementing demonstrations seeking to better integrate services and align financing for dual eligible beneficiaries. Many of these programs aim to increase access to community-based services, and most integrate LTSS with acute and primary care as well as behavioral health services.14 Work is ongoing to measure how well these programs are meeting their goals and the needs of beneficiaries.15
States can select from among a variety of optional services to meet Medicaid beneficiaries’ LTSS needs, many of which allow beneficiaries to self-direct their services by selecting their personal care provider and/or administering their services budget. In recent years, new and expanded options to provide Medicaid LTSS have become available, although some programs are time-limited and set to expire.16 For example, the Affordable Care Act provides new Medicaid state plan options, with enhanced federal funding, for states to cover attendant care services and supports through the Community First Choice program and health home services to improve care coordination for beneficiaries with chronic conditions.17 As of July, 2015, five states had adopted the Community First Choice option,18 and as of June, 2015, 19 states had adopted the Medicaid health homes option.19 States have the flexibility to choose among various optional Medicaid services to design programs that best meet the needs of beneficiaries, and a better understanding of the characteristics of this population can assist those efforts.
In addition, the complexity of needs among the Medicaid population may indicate a role for LTSS to prevent deterioration in health status that could result in more costly long-term institutional care. With dual eligible beneficiaries more likely to live alone, these seniors may have less access to natural supports (such as a family caregiver) that could delay the need for formal LTSS. At the same time, supports may be needed to address the social determinants of health. For example, many dual eligible beneficiaries with LTSS needs live in a home in need of repairs. Investments to remediate these conditions, such as pests or tripping hazards, while not medical in nature, might help to avoid future health care costs arising from injuries or medical exacerbations stemming from these conditions if they remain unaddressed. While Medicaid does not cover home repairs, states may encourage their Medicaid managed care organizations to offer medically appropriate alternative services as cost-effective substitutes in lieu of services covered under the Medicaid state plan.20
While Medicaid is serving many seniors with LTSS needs, many low-income seniors who do not have Medicaid also have LTSS needs. This population still has notable rates of physical and mental health comorbidity, and many live in housing situations that may make it difficult to meet their needs in addition to lacking financial resources to pay for care out-of-pocket. Providing LTSS to meet this population’s needs may be cost-effective over the long-term as unmet needs may worsen and require more costly services to address in the future. In the absence of other public or private sources of LTSS coverage, Medicaid remains the nation’s primary payer for these services. States have a number of options to expand Medicaid eligibility to offer services to those in need of LTSS where medically necessary. For example, the Affordable Care Act expanded the § 1915(i) state plan option to create a new Medicaid eligibility pathway, including access to home and community-based services.21 Through this option, states can choose to cover (1) people who are not otherwise eligible for Medicaid with income up to 150 percent of the federal poverty level and no resource limit and/or (2) people who would be eligible for Medicaid under an existing waiver with income below 300 percent of the SSI federal benefit rate. Importantly, the § 1915(i) option enables states to offer home and community-based LTSS to beneficiaries who meet state-established functional eligibility criteria that are less restrictive than the state’s institutional level of care criteria. This allows states to offer home and community-based services as a preventive measure, before a person’s needs deteriorate to the point where institutional care is required. As of July 2015, 17 states had adopted the § 1915(i) option.22
States also have flexibility to set financial and functional eligibility criteria for Medicaid home and community-based waiver programs. At state option, these criteria may be more restrictive than the criteria used to qualify for Medicaid-funded nursing facility services.23 Limiting access to community-based services in this way can create a bias toward institutional care and barriers to returning to the community once the more restrictive waiver eligibility criteria are met. Even though community-based care may be less expensive than comparable institutional care, people who move into nursing facilities are likely to lose their community-based housing and other resources and connections that can help support their functioning in the community.
In addition, not all people who qualify for Medicaid home and community-based waivers receive those services. Unlike nursing facility services, which must be provided to beneficiaries if eligible, states can limit waiver enrollment. Enrollment caps can result in waiting lists for Medicaid-funded community-based services. Waiting list length varies by state and within states by waiver population. In 2013, there were over 27,000 people waiting for Medicaid waiver services targeted to seniors, with an average wait time of 13 months, and over 127,000 people waiting for waiver services targeted to seniors and non-elderly people with physical disabilities, with an average wait time of 10 months.24 While many people waiting for Medicaid waiver services are presently living in the community, their unmet LTSS needs may put them at risk of institutionalization and/or requiring more costly services in the future.
Looking ahead, state and federal policymakers and other stakeholders will be challenged to meet the growing need for LTSS to support seniors living in the community in a way that accommodates diverse needs, ensures care quality, and manages costs. Insight into the socio-demographic and health status characteristics of these seniors, especially dual eligible beneficiaries who rely on Medicaid for their LTSS needs and how they may be similar to or different from other seniors with LTSS needs, can lead to increased understanding about how to optimize policies to support these populations.
Methods
Methods
This analysis uses data from the National Health and Aging Trends Study (NHATS), a longitudinal survey of Medicare beneficiaries ages 65 and older.† Participants are drawn from a nationally representative sample of Medicare beneficiaries and interviewed annually in-person. To keep the sample as large as possible, we used NHATS Round 1 data, reflecting the Medicare population in 2011. We subset the data to include only those who lived outside nursing facilities and completed the interview.
We stratified the analysis by age categories of 65-74, 75-84, and 85 and over. Within each age category, we further stratified the analysis into dual eligibility/income groups, which included (i) dual eligible beneficiaries with income below 300% of the 2011 Supplemental Security Income (SSI) federal benefit rate (FBR), (ii) non-dual eligible beneficiaries with incomes below 300% SSI, who we call “low-income without Medicaid” throughout the analysis, and (iii) beneficiaries with incomes at or above 300% SSI, who we call “higher-income without Medicaid” throughout the analysis. We chose to use the 300% SSI break for income to reflect policy rules about which individuals may be eligible for Medicaid long-term care assistance. Note that dual eligible beneficiaries account for a small share (<2%) of the higher income group, but we do not stratify the higher income group by dual eligibility status.
NHATS collects information about different sources of income as well as total income; for respondents who do not know or refuse to provide income information, the survey includes imputed income. If a person is single, does not live with a partner, or is separated, income includes only the respondent’s own income; if a person is married or living with a partner, income includes both the respondent’s income and their spouse’s/partner’s income. We randomly selected the variable ia1toincim5 from the 5 generated income variables and compared it to the 2011 monthly SSI FBR ($2,022 for an individual and $3,033 for a couple).
We excluded respondents who either refused or did not know if they were married because we were unable to ascertain which income threshold (single or married) to use in comparing their incomes to the 2011 SSI FBR. We also excluded participants who did not know or refused to answer their Medicaid enrollment status. The total number of respondents who could not be categorized into an income or coverage group due to missing data was 217, leading to a final sample size of 7,395.
First, we analyzed which participants have any LTSS need by looking at self-care/mobility and household activities. We identified participants as having an LTSS need if they reported having difficulty completing an activity or receiving help with an activity (for household activities help due to a health or functioning reason). Self-care/mobility activities include bathing, dressing, toileting, eating, getting out of bed, getting around inside, and getting outside. Household activities include laundry, shopping, meal preparation, banking, and medication management.
We then looked at socio-demographic characteristics and health status among those who had any LTSS need. All percentages in Tables 1 and 2 are from the non-nursing facility sample with any self-care or household activity need, except for “interior or exterior of the home needs repair/service/attention” and “has no one to talk to.” The former percentage is from the subset of non-nursing facility participants with an LTSS need whose home the interviewer observed. The latter is from the subset of non-nursing facility participants with an LTSS need who completed the survey themselves, rather than through a proxy.
† Jill Montaquila, Vicki A. Freedman, Brad Edwards and Judith D. Kasper. 2012. National Health and Aging Trends Study Round 1 Sample Design and Selection. NHATS Technical Paper #1. Baltimore: Johns Hopkins University School of Public Health, http://www.nhats.org/scripts/sampleDesign.htm.
Tables
Table 1: Prevalence of Need for LTSS Among Community-Based Seniors, by Coverage Group and by Age, 2011
Table 2: Characteristics of Seniors with a Need for LTSS, by Health Status and Quality of Life, by Age and Coverage Group, 2011
The analysis includes seniors living in a private residence, assisted living facility, or retirement community and excludes those in nursing facilities. For Medicaid funding purposes, states are currently in the process of determining whether specific settings qualify as “home and community-based” to come into compliance with recent federal regulations. 79 Fed. Reg. 2948-3039 (Jan. 16, 2014), available at http://www.gpo.gov/fdsys/pkg/FR-2014-01-16/pdf/2014-00487.pdf. ↩︎
Chronic illnesses included in this analysis are arthritis, cancer, diabetes, heart disease, high blood pressure, lung disease, osteoporosis, and stroke. ↩︎
Stevens JA, Corso PS, Finkelstein EA, Miller TR. The costs of fatal and non-fatal falls among older adults. Inj Prev. 2006 Oct;12(5):290-5. ↩︎
Shumway-Cook A, Ciol MA, Hoffman J, Dudgeon BJ, Yorkston K, Chan L. Falls in the Medicare population: incidence, associated factors, and impact on health care. Phys Ther. 2009 Apr;89(4):324-32. ↩︎
Kasper, JD, Freedman VA, Spillman BC. Classification of Persons by Dementia Status in the National Health and Aging Trends Study. Technical Paper #5. 2013, available at www.nhats.org. ↩︎
The Balancing Incentive Program, which provides enhanced federal funding to help states increase the proportion of LTSS dollars devoted to community-based services instead of institutional care, expires in September 2015, and the Money Follows the Person program, which provides enhanced federal funding to support institutional to community transitions, expires in September 2016. Molly O’Malley Watts et al. Medicaid Balancing Incentive Program: A Survey of Participating States (June 2015) Washington, DC: Kaiser Family Foundation, available at https://modern.kff.org/medicaid/report/medicaid-balancing-incentive-program-a-survey-of-participating-states/; Molly O’Malley Watts, et al. Money Follows the Person: A 2013 State Survey of Transitions, Services and Costs (April 2014), Washington, DC: Kaiser Family Foundation, available at https://modern.kff.org/medicaid/report/money-follows-the-person-a-2013-survey-of-transitions-services-and-costs/. ↩︎
CMS, Providing Long Term Services and Supports in a Managed Care Delivery System, Enrollment Authorities and Rate Setting Techniques: Strategies States May Employ to Offer Managed HCBS, CMS Review Processes and Quality Requirements (Dec. 2009), available at http://www.pasrrassist.org/sites/default/files/attachments/10-07-23/ManagedLTSS.pdf. ↩︎
Section 1915(i) allows states to offer the same categories of home and community-based services under their Medicaid state plans as are available under waivers. States may target services to specific populations. Section 1915(i) services must be provided statewide and waiting lists are not permitted, although states can further restrict functional eligibility criteria for future beneficiaries if the state exceeds its projected number of beneficiaries served under this option. Molly O’Malley Watts et al. How is the Affordable Care Act Leading to Changes in Medicaid Long-Term Services and Supports Today? State Adoption of Six LTSS Options (April 2013), Washington, DC: Kaiser Family Foundation, available at https://modern.kff.org/medicaid/issue-brief/how-is-the-affordable-care-act-leading-to-changes-in-medicaid-long-term-services-and-supports-ltss-today-state-adoption-of-six-ltss-options/. Kaiser Family Foundation State Health Facts, Health Home State Plan Option, available at https://modern.kff.org/medicaid/state-indicator/health-home-state-plan-option/. ↩︎
Medicaid provides health and long-term care coverage to nearly 70 million low-income Americans across the U.S. and is an integral part of the nation’s health care system. Since its enactment in 1965, Medicaid has evolved considerably at the national and state level as policymakers have turned to the program to respond to America’s diverse and changing societal needs. Today, the program provides access to affordable health insurance for low-income Americans, a healthy start for millions of children, access to essential services and supports for children with special needs and broader coverage to many individuals with severe physical and mental health conditions, facilitating independent living and community integration. Medicaid also supports poor Medicare beneficiaries and shoulders the high costs of long-term care for those who could not otherwise afford it.
The stories here reveal the range of experience and diverse roles that Medicaid plays in the lives of Americans across the U.S. These stories are not intended to be an evaluation of the program, but to get underneath Medicaid’s statistics and provide insight into individual experiences with the program. We have provided links to Foundation resources that complement these personal stories.
We gratefully acknowledge Mad Squid Media for their video production services and to the families who were kind enough to share their stories with us.
“Now I have an understanding of why these programs exist and how they can benefit people who are hard-working Americans who just aren’t at the place yet where they can afford private health insurance.”
Todd is a full-time student and works two part time jobs. His wife Erin stays at home with their 8 month old baby, Jane. Erin had Medicaid coverage during her pregnancy and the two months that followed but she and husband Todd are now uninsured. They earn too little to qualify for subsidies in the Marketplace but too much to qualify for Medicaid in Utah.
“[When I was uninsured] I would get a bill for $3,000, $1,500 dollars, it got astronomical…Medicaid has just been a big help to me…I don’t have to worry about that along with everything else.”
When Wendy lost her job in 2009, she lost her health insurance with it. While unemployed and uninsured, Wendy began noticing symptoms of what turned out to be pernicious anemia, a treatable but incurable condition affecting the body’s red blood cells. Hospital visits and treatment led to serious medical debt, which Wendy was unable to pay off. She now has a temporary job but no offer of employer health coverage. When Ohio expanded Medicaid under the Affordable Care Act in January 2014, Wendy became eligible. With this coverage, Wendy is able to receive treatment for her chronic condition.
“Our private insurance doesn’t cover all the specialists that he needs to see and Medicaid really helps supplement…it changes our life—for the better.”
Sam is six years old and has fragile X syndrome and mild autism, resulting in various developmental disabilities. He has private insurance but it doesn’t cover all the specialists, services and therapies that someone with his condition requires. Through a Medicaid option, Sam is able to receive Medicaid as supplemental insurance to “wrap around” the services that are not covered by his private insurance, including occupational therapy, physical therapy and speech therapy.
“[Through] a Medicaid waiver program, tailored for people with disabilities, Abdul got an internship and a job coach, who helps him to navigate his work environment and feel more confident…”
Abdul was born with several developmental disabilities which affect his ability to learn and communicate. Through a Medicaid waiver in his state, Abdul received an internship placement, as well as a job and transportation coach. He was eventually offered full-time employment at his internship site, which is where he works today. His job and transportation coach give him the skills he needs to navigate his environment, be effective at work and become more independent.
“Medicaid allowed me to have the same care as everybody else, in the same respiratory hospital and in this nursing home…there’s no discrimination.”
Penny is a senior with Guillain-Barré Syndrome and resides in a nursing home. As a result of her illness, she is unable to walk and needs 24-hour access to care. Although she is eligible for and enrolled in Medicare, Medicaid pays for her long-term care needs.
“My children currently have Medicaid…it’s a blessing. I myself do not…which frightens me because I am their caregiver.”
Maria is a registered nurse at a community health center in Texas. She doesn’t earn enough to purchase private health insurance for herself or her children and doesn’t have employer coverage. Because of her income, the children qualify for and are enrolled in Medicaid but as an adult, Maria remains ineligible and uninsured.
“I’d really like to be able to help somebody, the way they’ve helped me…To me, Medicaid means I’ve been given a second chance.”
Bill was 27 years old and working as a nurse when he had his first mental break. He was admitted to the hospital and diagnosed with bipolar disorder. Because of the severity of his condition, Bill had to stop working and spends 30 hours a week in a day program while taking medication to manage his condition, both of which are covered by Medicaid.
“Medicaid coverage in Arkansas was expanded [in 2014] and I was then covered…It was such a relief…Now, I’m just like anyone else who works and has insurance.”
Kim works as an assistant to a general contractor. Before gaining coverage through Arkansas’ Medicaid expansion, she was uninsured for a period of 12 years. During that time, she was unable to get preventive care and avoided seeking medical attention, due to cost, until she was extremely ill and required hospitalization. Her son Steven has had Medicaid since he was 3 years old, receiving preventive care, as well as treatment for his asthma and allergies.
“My mom had Medicare at the time of her stroke but it did not cover long-term care. To us, Medicaid means being able to live with dignity, in the community, with friends and family.”
After Mary Francis suffered a stroke in 1999, she relocated from Oklahoma City to Richmond, Virginia, to live with her daughter, Mary. Her stroke left her with no muscle control on the left side of her body, and she has since required the help of a caregiver for everyday activities, including walking and meal preparation. She sold her home and spent down all her assets in order to become eligible for Medicaid, and Medicaid now provides her access to an adult day center during the week, as well as self-directed home and community-based services (HCBS). She has chosen her daughter, Mary, as her full-time caregiver.
“Because she [Maxine] is able to stay in her own home, she feels a certain amount of independence.”
Maxine is a 90 year old woman who has diabetes, spinal stenosis, and short-term memory loss. These conditions require her to have a full-time caregiver to assist with cooking, cleaning and other daily activities. It was important to Maxine to remain in the home she has lived in for the last 65 years rather than moving to an assisted living facility. Through Medicaid, Maxine is able to receive home and community-based services (HCBS) and to self-direct her care. She has chosen her daughter, Susan, as her caregiver.
Expanded health insurance coverage through the Affordable Care Act (ACA) is having a major impact on hospital payer mix across the country. Similar to other reports recently released, new data examining hospital discharges in 16 states with data through the second quarter in 2014 show increases in Medicaid and declines in uninsured or self-pay discharges in states that implemented the Medicaid expansion. These trends hold true for all hospital discharges as well as for specific services such as mental health or asthma. This information adds to a growing body of evidence indicating that coverage expansions are affecting providers and may lead to decreases in uncompensated care for the uninsured. These 16 states include 6 states that have not implemented (Florida, Georgia, Indiana, Missouri, Virginia, and Wisconsin) and 10 states that had implemented the Medicaid expansion (Arizona, California, Colorado, Hawaii, Iowa, Kentucky, Michigan, Minnesota, New Jersey, New York) by the second quarter in 2014.
Key Findings
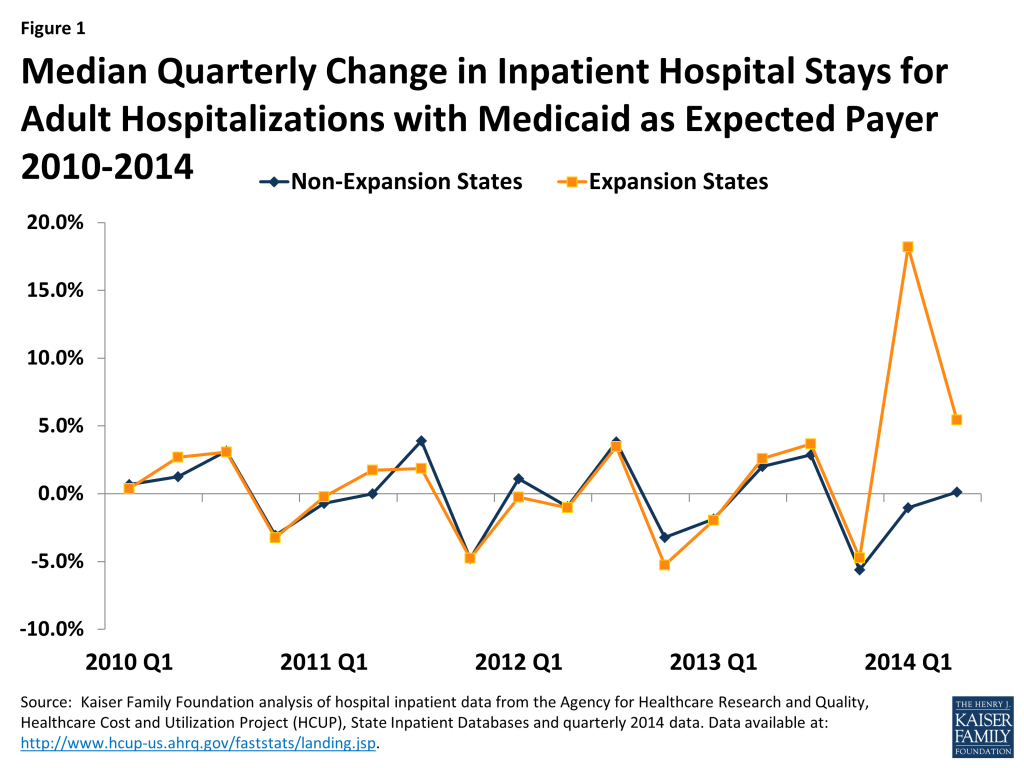
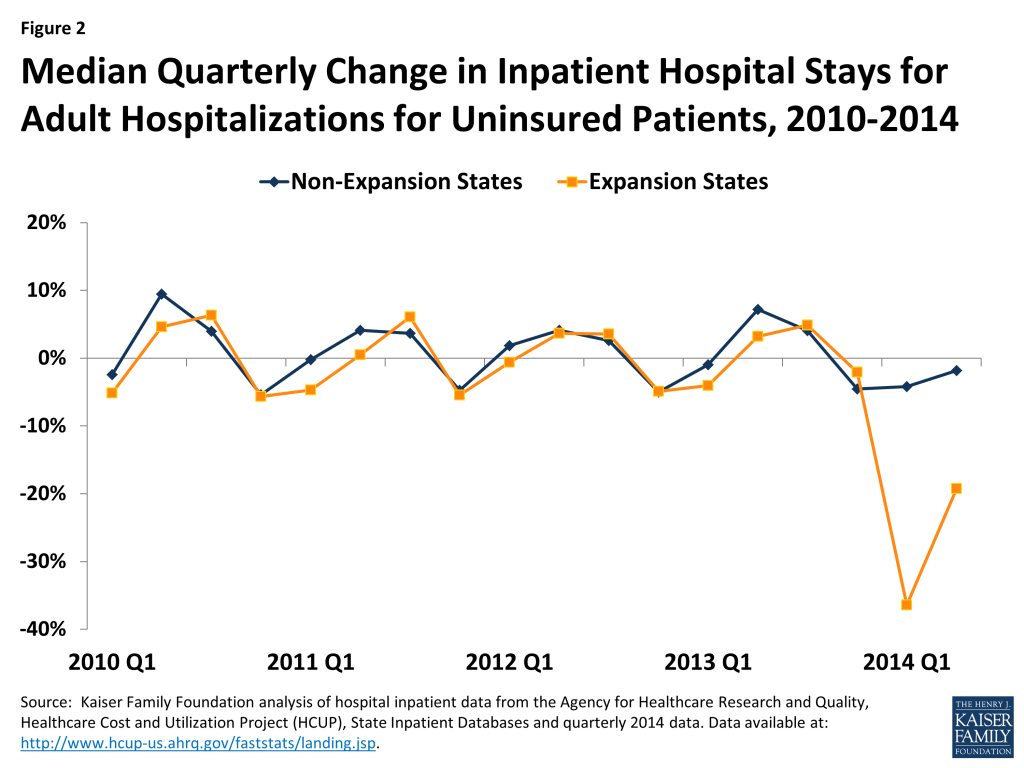
Prior to the ACA’s major coverage expansions, growth rates for inpatient stays in expansion and non-expansion states moved in tandem, but patterns diverged starting in 2014. From 2010 through 2013, the number of quarterly Medicaid and uninsured discharges in both expansion and non-expansion states changed cyclically in a similar pattern (Figures 1 and 2). Beginning in 2014, expansion states show sharp increases in inpatient stays for Medicaid and sharp declines for uninsured compared to non-expansion states (Figures 1 and 2).
Figure 1: Median Quarterly Change in Inpatient Hospital Stays for Adult Hospitalizations with Medicaid as Expected Payer 2010-2014Figure 2: Median Quarterly Change in Inpatient Hospital Stays for Adult Hospitalizations for Uninsured Patients, 2010-2014
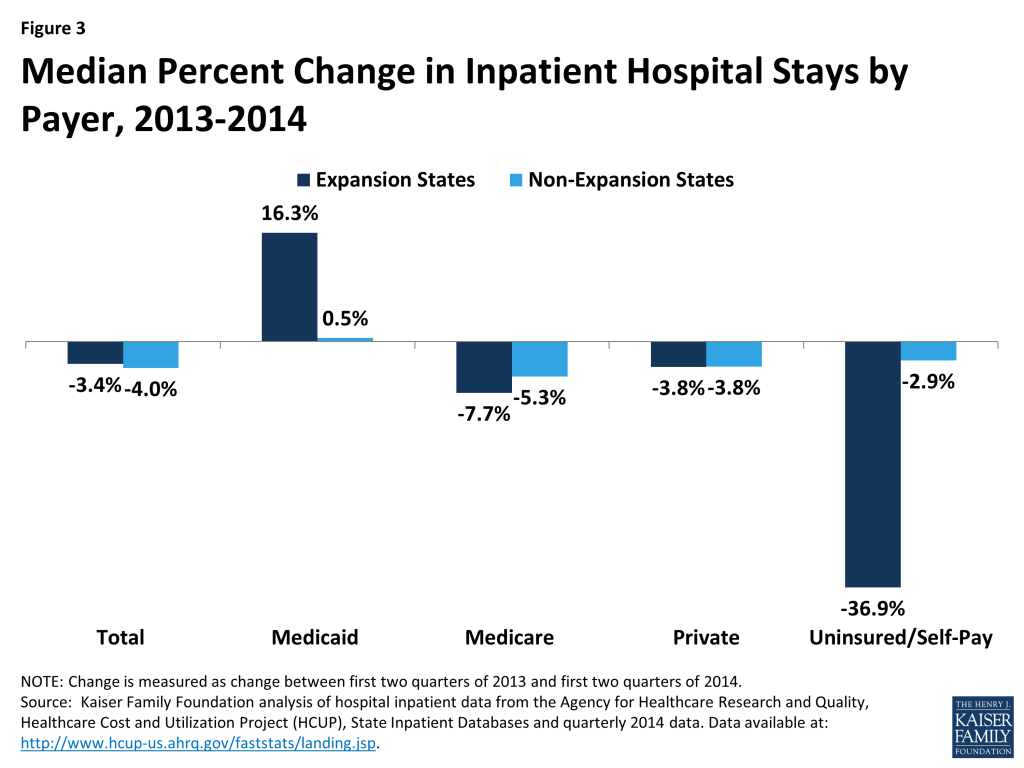
Comparing inpatient stays by payer for 2013 to 2014 shows sharp increases for Medicaid and sharp declines in uninsured for expansion states. Data show that while inpatient stays declined by 3.4% for a typical expansion state from 2013 to 2014, Medicaid inpatient stays increased by 16.3% and uninsured stays decreased by 36.9%. A typical non-expansion state experienced a decline in inpatient stays of 4.0% with small (0.5%) increases in Medicaid stays and slight declines in uninsured inpatient stays (2.9%) (Figure 3).
Figure 3: Median Percent Change in Inpatient Hospital Stays by Payer, 2013-2014
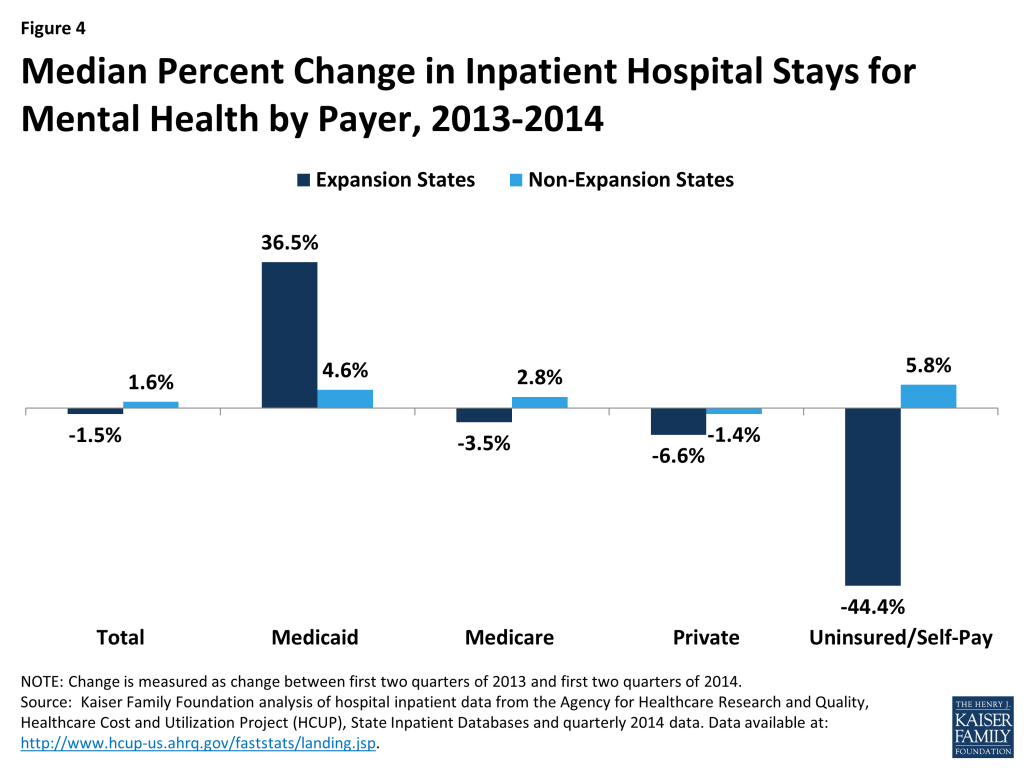
Increases in Medicaid discharges and declines in uninsured discharges for expansion states were especially pronounced for mental health. Among the states included in this analysis, adult mental health stays accounted for 5.8% of adult hospital stays in the 2nd quarter of 2014 (data not shown). A typical expansion state experienced a decrease of 1.5% in mental health inpatient stays but saw a 36.5% increase in Medicaid mental health inpatient stays and a 44.4% decline in uninsured stays for mental health. Non-expansion states saw overall mental health stays increase slightly (1.6% increase) with similar slight increases across payers except for private (Figure 4).
Figure 4: Median Percent Change in Inpatient Hospital Stays for Mental Health by Payer, 2013-2014
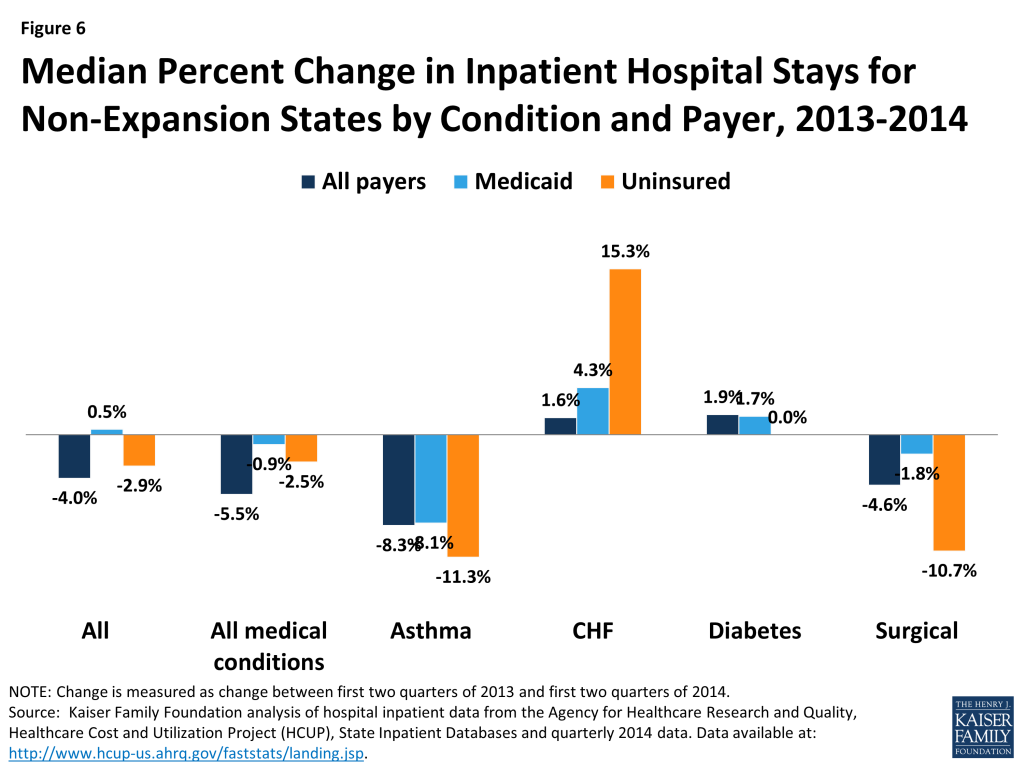
The 2013 to 2014 trends for expansion and non-expansion states are consistent across other types of inpatient stays. Among states in this analysis, medical conditions account for about half of all stays, surgical discharges account for about 23% of all stays, and other conditions account for much smaller shares (data not shown). These shares are similar for expansion and non-expansion states. Looking at changes in stays for other types of conditions including asthma, coronary heart failure (CHF), diabetes, and surgical care reveal similar patterns for expansion states as seen for total adult hospitalizations: while discharges declined overall, Medicaid discharges increased and uninsured discharges declined (Figure 5). For non-expansion states, stays for most conditions were flat or declined, both overall and for Medicaid and uninsured discharges. The exceptions to the pattern for non-expansion states were discharges for CHF, which rose 1.6% overall and 15.3% and 4.3% for uninsured and Medicaid, respectively, and diabetes, which rose slightly for all payers as well as Medicaid (Figure 6).
Figure 5: Median Percent Change in Inpatient Hospital Stays for Expansion States by Condition and Payer, 2013-2014Figure 6: Median Percent Change in Inpatient Hospital Stays for Non-Expansion States by Condition and Payer, 2013-2014
Looking ahead, changes may converge. Data for the later quarters in 2014 (not included in this analysis) show that the percent changes from quarter to quarter were not as disparate for expansion and non-expansion states as they were for the early months in 2014. This is likely because big level changes were occurring by payer when individuals changed coverage as a result of the Medicaid expansion in expansion states. Going forward, change between expansion and non-expansion states may follow similar trends as prior to the implementation of the ACA. In addition, it will be important to assess how these changes in discharges by payer are affecting hospitals’ financial position. While hospitals in expansion states saw large shifts in payer mix between Medicaid and uninsured, most hospital discharges are covered by other payers such as Medicare or private insurance. As states and hospitals continue to report data on changes in payer mix and financial performance, we will be able to gain a fuller picture of the full impact of the ACA on providers.
Methods
This data note uses data from the Healthcare Cost and Utilization Project (HCUP) to examine changes in discharges by payer for states that did and did not implement the ACA Medicaid expansion. HCUP consists of family of health care databases developed through a Federal-State-Industry partnership and sponsored by the Agency for Healthcare Research and Quality (AHRQ). Specifically, this analysis is based on data in the State Inpatient Databases (SID). The data is discharge-level data for all patients treated in community, non-rehabilitation hospitals in the state and is weighted to represent all discharges in the state. While 48 states participate in the SID, this analysis examines data from 16 states with data from 2010 through the second quarter of 2014. The 16 states include 6 states that had not implemented (Florida, Georgia, Indiana, Missouri, Virginia, and Wisconsin) and 10 states that had implemented the Medicaid expansion (Arizona, California, Colorado, Hawaii, Iowa, Kentucky, Michigan, Minnesota, New Jersey, New York) in this time period.
This data includes nearly 3 million hospital stays in the second quarter of 2014 (with 1.8 million (61%) from the expansion states and 1.2 million (39%) from the non-expansion states). Discharges in expansion and non-expansion states were concentrated in a small number of large states. For the group of expansion states, California and New York accounted for more than half of all discharges (54%), and for the non-expansion states, Florida and Georgia accounted for 56% of the discharges for the second quarter in 2014. (Table 1) Because these large states have a bigger impact on the overall experience of each group of states, we used the median for the group when examining outcomes of payer mix, percent change by quarter and when measuring change from 2013 to 2014.
The dominant payers for both expansion and non-expansion states were Medicare and private insurance. For all discharges in the second quarter of 2014, the typical expansion state had a higher percentage of Medicaid discharges compared to non-expansion states (22% versus 15%) and a lower percentage of uninsured discharges (3% versus 9%). (Table 1)
Table 1: Number and Distribution of Discharges by Payer for States Included in Analysis, 2014 Q2
State
Total
Medicaid Discharges
Uninsured Discharges
Medicare Discharges
Private Insurance Discharges
#
#
As a % ofTotal Discharges
#
As a % ofTotal Discharges
#
As a % ofTotal Discharges
#
As a % ofTotal Discharges
All Expansion States
Total
1,836,900
448,350
24%
62,450
3%
778,250
42%
547,850
30%
Median
108,950
24,250
22%
3,075
3%
47,675
43%
35,025
32%
Arizona
121,900
29,350
24%
6,500
5%
52,700
43%
33,350
27%
California
604,050
176,550
29%
20,500
3%
235,300
39%
171,700
28%
Colorado
75,950
18,100
24%
2,700
4%
28,800
38%
26,350
35%
Hawaii
18,800
5,100
27%
350
2%
6,600
35%
6,750
36%
Iowa
56,950
8,300
15%
1,100
2%
29,550
52%
18,000
32%
Kentucky
96,000
26,400
28%
2,300
2%
42,650
44%
24,650
26%
Michigan
219,950
42,250
19%
3,450
2%
107,950
49%
66,300
30%
Minnesota
87,800
15,000
17%
1,050
1%
35,050
40%
36,700
42%
New Jersey
168,250
22,100
13%
13,350
8%
75,900
45%
56,900
34%
New York
387,250
105,200
27%
11,150
3%
163,750
42%
107,150
28%
All Non-Expansion States
Total
1,155,850
191,300
17%
108,450
9%
544,950
47%
311,150
27%
Median
140,525
21,225
15%
13,400
10%
64,550
46%
42,000
30%
Florida
81,150
81,150
18%
43,650
9%
236,550
50%
108,950
23%
Georgia
31,250
31,250
16%
27,600
16%
67,950
39%
45,600
26%
Indiana
20,150
20,150
16%
8,100
6%
60,700
48%
37,350
30%
Missouri
22,300
22,300
12%
13,750
10%
64,150
46%
38,400
28%
Virginia
17,400
17,400
18%
13,050
9%
64,950
46%
47,050
33%
Wisconsin
19,050
19,050
18%
2,300
2%
50,650
48%
33,800
32%
SOURCE: Kaiser Family Foundation analysis of hospital inpatient data from the Agency for Healthcare Research and Quality, Healthcare Cost and Utilization Project (HCUP), State Inpatient Databases and quarterly 2014 data. Data available at: http://www.hcup-us.ahrq.gov/faststats/landing.jsp.
The quality of the U.S. health system is improving in many areas, but comparable countries continue to outperform the United States on key measures. In this brief on the Peterson-Kaiser Health System Tracker, analysts from the Kaiser Family Foundation compile an overall picture of health care quality in the United States, using the best available data from numerous sources on health outcomes, quality of care, and access to services.
Measuring the Quality of Healthcare in the U.S. explains that good data exists on how much money is spent on health care in the United States, but much less is known about the correlation between spending and outcomes, and about how much outcomes are influenced by the health care system itself. The brief also discusses why existing indicators are imperfect, and outlines the challenges of establishing meaningful national quality measures that can reliably show how the system is influencing the health of Americans.
The brief is part of the Peterson-Kaiser Health System Tracker, an online information hub dedicated to monitoring and assessing the performance of the U.S. health system.
Analysts from the Kaiser Family Foundation compiled an overall picture of health care quality in the United States, using the best available data from numerous sources on health outcomes, quality of care, and access to services.
The brief, Measuring the Quality of Healthcare in the U.S.,also discusses why existing indicators are imperfect, and outlines the challenges of establishing meaningful national quality measures that can reliably show how the system is influencing the health of Americans. The brief explains that we have good data on how much we are spending on health care in the United States, but know much less about what outcomes we are getting in return for that spending, and how much those outcomes are influenced by the health care system itself.
Findings based on existing quality indicators include:
The U.S. health system has improved on a wide variety of quality measures, including mortality amenable to health care; the number of hospital-acquired infections; and the percentage of children receiving all recommended doses of vaccines.
The United States has worsened on other measures, including health-related quality of life (self-reported healthy days and days in which activities were interrupted by poor health).
The United States outperforms countries of comparable wealth on some measures, including wait times for specialist visits and hospital admission rates for uncontrolled diabetes.
But, on a large number of measures, comparable countries outperform the United States, including life expectancy at birth; cost-related barriers to health care access; the prevalence of retained surgical items or unretrieved device fragments; and burden of disease, which takes into account years of life lost due to premature death and years of life lost to poor health or disability.
The Affordable Care Act requires private insurance plans to cover recommended preventive services with no out-of-pocket charges for patients. This slate of covered services can change when the U.S. Preventive Services Task Force and other authorized groups add or modify recommendations; the federal government also periodically issues clarifications to guide health plans in their coverage.
A new tracker from the Kaiser Family Foundation monitors the preventive services that must be covered for adults without cost sharing, providing in one place details about the services covered, federal guidelines governing coverage, the affected populations, and effective dates of coverage for each service.
The Preventive Services Tracker helps users easily find up-to-date coverage information on preventive services related to cancer, chronic conditions, health promotion, immunization, pregnancy, and sexual health.
Using authority in the Affordable Care Act, the Centers for Medicare and Medicaid Services (CMS) has launched demonstrations that seek to improve care and control costs for people who are dually eligible for Medicare and Medicaid. Nearly 355,000 beneficiaries in nine states are enrolled in these demonstrations as of June, 2015. Implemented beginning in July 2013, the demonstrations are changing the care delivery systems through which beneficiaries receive medical and long-term care services and the financing arrangements among CMS, the states, and providers. The demonstrations initially were approved for three years, but in July, 2015, CMS announced that states may extend their demonstrations for an additional two years.
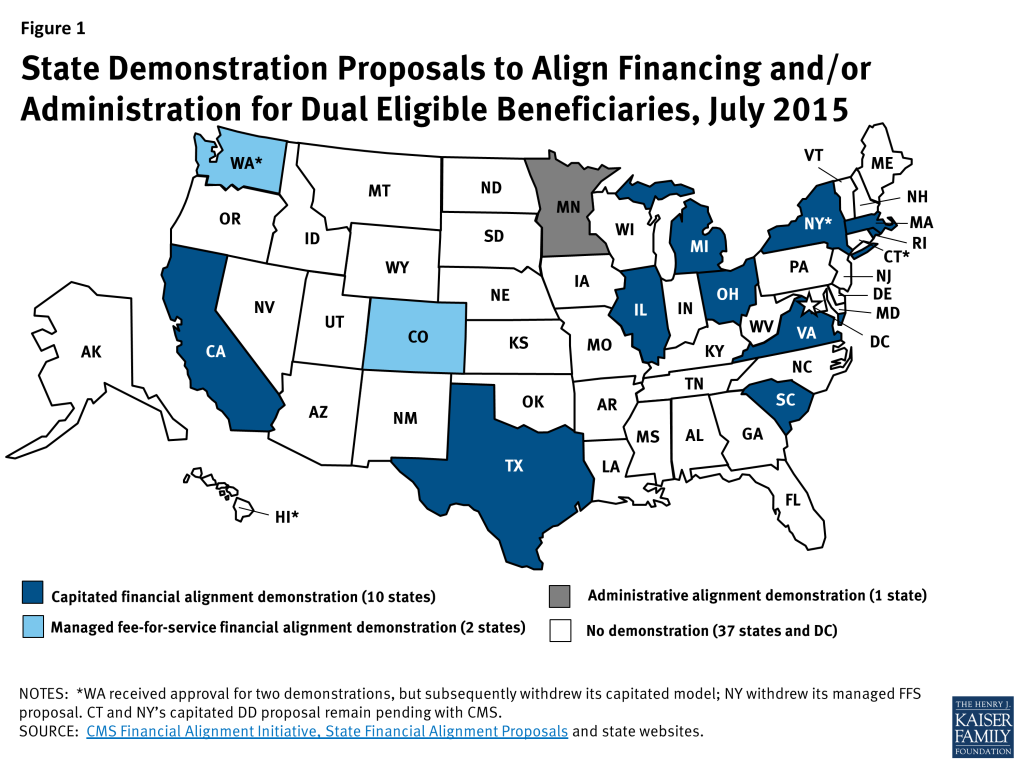
As of July 2015, CMS has finalized memoranda of understanding (MOUs) with 13 states to implement demonstrations:
Ten states (California, Illinois, Massachusetts, Michigan, New York, Ohio, South Carolina, Rhode Island, Texas, and Virginia) are testing a capitated financial alignment model;
Two states (Colorado and Washington) are testing a managed fee-for-service (FFS) financial alignment model; and
One state (Minnesota) is testing the integration of administrative functions without financial alignment (Figure 1).
Figure 1: State Demonstration Proposals to Align Financing and/or Administration for Dual Eligible Beneficiaries, July 2015
The status of past proposals from other states is detailed in the Appendix. This issue brief compares key provisions of the approved demonstrations, summarized in Table 1.
Table 1:State Dual Eligible Financial/Administrative Alignment Demonstrations Approved by CMS, July 2014
State
Estimated Number of Eligible Beneficiaries
Target Populationa and Geographic Area
Financial Model
Earliest Effective Enrollment Date
Savings Percentage Applied to Medicare and Medicaid Contributions to Baseline Capitated Rateb
CA
424,000
Adult dual eligible beneficiaries in 7 counties
Capitated
April 2014
1% minimum,
1.5% maximum in year 1;
2% minimum,
3.5% maximum in year 2;
4% minimum,
5.5% maximum in year 3c
CO
48,000
Adult dual eligible beneficiaries statewide
Managed FFS
September 2014
N/A (state shares savings with CMS retrospectively if savings and quality criteria met)
IL
135,825
Adult dual eligible beneficiaries in 21 counties grouped into 2 regions
Capitated
March 2014
1% in year 1;
3% in year 2;
5% in year 3;
MA
90,240
Non-elderly adult dual eligible beneficiaries in 1 partial and 8 full counties
Capitated
October 2013
0 in 2013,
1% in 2014 (remainder of year 1)d;
2% in year 2;
>4% in year 3e
MI
100,000
Adult dual eligible beneficiaries in 25 counties grouped into 4 regions
Capitated
April 2015
1% in year 1;
2% in year 2;
4% in year 3, except that year 3 savings will be 3% if at least 1/3 of plans have losses exceeding 3% of revenues in year 1
MN
36,000
Dual eligible beneficiaries age 65 and over enrolled in the Minnesota Senior Health Options program statewide
N/Af
September 2013
N/A (Minnesota’s demonstration will test the integration of administrative functions without financial alignment)
NY
170,000
Adult dual eligible beneficiaries in 8 counties who require nursing facility or nursing facility diversion and transition home and community-based waiver services or more than 120 days of community-based LTSSg
Capitated
January 2015
1% in year 1;
1.5% in year 2;
3% in year 3, except that year 3 savings will be 2.5% if at least 1/3 of plans have losses exceeding 3% of revenue in year 1h
OH
115,000
Adult dual eligible beneficiaries in 29 counties grouped into 7 regions
Capitated
May 2014
1% in year 1;
2% in year 2;
4% in year 3;
RI
30,000
Adult dual eligible beneficiaries statewide
Capitated
December 2015
1% in year 1;
1.25% in year 2;
3% in year 3, except that year 3 savings will be 1.5% if at least 1 plan has losses exceeding 3% of revenue in all regions in year 1
SC
53,600
Dual eligible beneficiaries age 65 and over statewide who live in the community at the time of enrollment
Capitated
February 2015
Same as Ohio
TX
168,000
Adult dual eligible beneficiaries with disabilities who qualify for SSI or Medicaid waiver HCBS in 6 counties
Capitated
March 2015
1.25% in year 1.a;i
2.75% in year 1.b;j
3.75% in year 2;
5.5% in year 3
VA
78,600
Adult dual eligible beneficiaries in 104 localities grouped into 5 regions
Capitated
April 2014
Same as Michigank
WA
21,000
High cost/high risk adult dual eligible beneficiaries statewide except in 2 urban counties
Managed FFSl
July 2013
Same as Colorado
Table 1 Notes and Sources:
Notes: a See the Appendix for subpopulations excluded from each state’s demonstration. b Demonstration savings in the capitated models will be derived upfront by reducing CMS’s and the state’s respective baseline contributions to the plans by a savings percentage for each year. c California’s maximum demonstration-wide savings percentages, along with county-specific interim savings percentages, will be used to determine the demonstration’s risk corridors. d Massachusetts reduced its 2013 savings from 1% to zero. Demonstration year 1 in Massachusetts begins in 2013 and runs through December 2014. e Massachusetts anticipates savings of greater than 4% (approximately 4.2%) in year 3 to make up for forgone savings in year 1. f Minnesota’s administrative alignment demonstration will take place in its existing capitated delivery system in which Medicaid MCOs also qualify as Medicare Advantage D-SNPs. g New York’s capitated proposal for beneficiaries who have DD and need LTSS remains pending with CMS. h This determination will be based on at least 15 months of data (demonstration year 1 in New York encompasses July 2014 through December 2015). i Demonstration year 1.a in Texas is March to Dec. 2015. j Demonstration year 1.b in Texas is 2016. k This determination will be based on at least 20 months of data and in all regions in which plans participate (demonstration year 1 in Virginia encompasses February 2014 through December 2015). l Washington withdrew its capitated demonstration which was approved by CMS for 2 urban counties.
Dual eligible beneficiaries include seniors and non-elderly people with significant disabilities, some of whom are among the poorest and sickest beneficiaries covered by either Medicare or Medicaid. The predominant existing service delivery models for these beneficiaries typically involve little to no coordination between the two programs. Dual eligible beneficiaries account for a disproportionate share of spending in the Medicare and Medicaid programs. In the case of Medicare, this is mainly due to their relatively poorer health status, which requires higher use of medical services compared to other program beneficiaries. In the case of Medicaid, dual eligible beneficiaries’ relatively high spending is generally attributable to their greater need for LTSS.
Key Demonstration Provisions
Geographic Area and Target Population
Four states’ (Colorado, Minnesota, Rhode Island, and South Carolina) demonstrations are statewide, while the others are limited to certain regions.
The states’ target populations for their demonstrations vary, with ten states (California, Colorado, Illinois, Michigan, New York, Ohio, Rhode Island, Texas, Virginia, and Washington) including both elderly and non-elderly beneficiaries. Among the states targeting sub-populations:
Massachusetts targets non-elderly people with disabilities;
South Carolina targets elderly beneficiaries who live in community-based settings at enrollment;
New York focuses on elderly and non-elderly beneficiaries who receive nursing facility services or nursing facility diversion and transition home and community-based waiver services or who require more than 120 days of community-based LTSS; and
Texas targets elderly and non-elderly beneficiaries with disabilities who qualify for Supplemental Security Income (SSI) benefits or certain Medicaid home and community-based waiver services for seniors and adults with physical disabilities.
Michigan is the only capitated demonstration state to include both beneficiaries with DD and DD services.
Enrollment
Estimated Number of Eligible Beneficiaries
CMS has stated that it plans to limit enrollment in the demonstrations to no more than two million dual eligible beneficiaries nationally. As of July 2015, CMS has approved 13 demonstrations in which an estimated over 1.4 million beneficiaries are eligible to enroll. (Not all beneficiaries who are eligible to participate in the demonstrations are expected to enroll.) The estimated number of beneficiaries eligible for California’s demonstration is nearly 30 percent of the total number of beneficiaries eligible for all demonstrations approved to date and exceeds the number of eligible beneficiaries in each of the other states with approved demonstrations. Enrollment in Los Angeles County, capped at 200,000 beneficiaries, will be greater than the number of beneficiaries eligible to participate in any of the other demonstration states (Figure 2).
Figure 2: CMS Has Approved 13 Financial and/or Administrative Alignment Demonstrations, in which Over 1.4 Million Dual Eligible Beneficiaries Will Be Eligible to Enroll, as of July 2015
Enrollment Timeline
Enrollment has begun in all of the states with demonstrations approved to date except Rhode Island, which will begin its demonstration in December, 2015. States vary in the amount of time that beneficiaries have been enrolled in their demonstrations: some states have enrolled beneficiaries for about two years (Washington, Massachusetts), while other states began enrolling beneficiaries in early 2015 (New York, South Carolina, Texas, Michigan) (Figure 3).
Figure 3: Earliest Effective Enrollment Dates in Financial/Administrative Alignment Demonstrations for Dual Eligible Beneficiaries
Enrollment Process and Beneficiary Choices
Nearly all of the capitated demonstrations (except for some counties in California, in which beneficiaries are automatically enrolled in the demonstration without an initial voluntary enrollment period) began with a voluntary enrollment period in which beneficiaries could “opt in” to the demonstration and select a managed care plan (Rhode Island also plans to begin with a voluntary opt in period). The voluntary enrollment period is followed by passive enrollment periods in which the remaining beneficiaries will be automatically assigned to a managed care plan. To effectuate passive enrollment, states are developing “intelligent assignment” algorithms to preserve continuity of providers and services when assigning beneficiaries to plans.
Beneficiaries retain the right to opt out of the demonstration at any time but must take affirmative action to do so. In all states, beneficiaries can opt out of the demonstration and choose another delivery system (i.e., FFS, Medicare Advantage, Program of All-Inclusive Care for the Elderly ) for their Medicare benefits. However, states may seek CMS approval to require beneficiaries to enroll in Medicaid managed care even if they opt out of the financial alignment demonstration for their Medicare benefits, and five states with capitated demonstrations (California, Illinois, New York, Ohio, and Texas) have indicated that they are doing so. By contrast, five states with capitated demonstrations (Massachusetts, Michigan, Rhode Island, South Carolina, and Virginia) allow beneficiaries who opt out of the demonstration to remain in the FFS delivery system for both their Medicare and Medicaid benefits (Table 2).
Table 2:Beneficiary Enrollment Choices in the Capitated Financial Alignment Demonstrations
State
Managed Care Enrollment Required for:
Medicare
Medicaida
California
No
Yesb
Illinois
No
Yesc
Massachusetts
No
No
Michigan
No
No
New York
No
Yesd
Ohio
No
Yese
Rhode Island
No
No
South Carolina
No
No
Texas
No
Yesf
Virginia
No
No
NOTES: a CMS approval is necessary for states to require beneficiaries to enroll in Medicaid managed care, even if beneficiaries opt out of the financial alignment demonstration for their Medicare benefits. b California’s § 1115 waiver was amended to require beneficiaries to enroll in managed care plans for their Medicaid benefits, including LTSS. c Illinois has a draft § 1115 waiver application seeking to require Medicaid managed care enrollment. d New York’s § 1115 waiver requires beneficiaries in the financial alignment demonstration geographic area who receive more than 120 days of LTSS to enroll in a Medicaid MLTSS plan. e Ohio’s MOU indicates that the state may seek additional § 1915(b)/(c) waiver authority to require beneficiaries to enroll in Medicaid managed care. f Texas’s existing § 1115 waiver requires adult dual eligible beneficiaries to enroll in Medicaid managed LTSS.
Given the complexities of the enrollment decision, beneficiaries are likely to need individual in-person options counseling to make their choice. Five states (California, Illinois, Massachusetts, Virginia, and Washington) have received CMS funding to date to support beneficiary outreach, education, and options counseling in their demonstrations through their State Health Insurance Program and Aging and Disability Resource Centers.
In Washington’s managed FFS demonstration, beneficiaries are automatically enrolled in a health home network but retain the choice about whether to receive Medicaid health home services; other Medicare and Medicaid services will continue to be provided on a FFS basis. Similarly, in Colorado’s managed FFS demonstration, beneficiaries will be automatically assigned to the Regional Care Collaborative Organization in their geographic area to access care coordination services but may disenroll from the demonstration at any time.
Minnesota’s administrative alignment demonstration does not involve passive enrollment; instead enrollment in Senior Health Options plans remains voluntary, although the demonstration will test an integrated enrollment system.
Care Delivery Model
The ten states with capitated demonstrations are using managed care plans to coordinate services for beneficiaries through a person-centered planning process. Person-centered planning focuses on the strengths, needs, and preferences of the individual beneficiary instead of being driven by the care delivery system.
Some states require or allow their managed care plans to contract with other entities to provide services in their demonstrations (Table 3). Massachusetts requires its plans to contract with community-based organizations to provide Long-Term Supports coordinators as independent members of the beneficiary’s care team, Michigan requires its plans to contact with existing Medicaid Prepaid Inpatient Health Plans (PIHPs) to provide behavioral health services, and Ohio requires its plans to contract with Area Agencies on Aging to coordinate home and community-based waiver services for enrollees over age 60. (Illinois, New York, Rhode Island, South Carolina, Texas, and Virginia’s MOUs do not include any similar requirements). California requires its plans to establish MOUs with county behavioral health agencies to provide specialty mental health services and with county social services agencies to coordinate In Home Supportive Services . Demonstration health plans in Los Angeles County are subcontracting with other Medicare Advantage plans to offer a variety of benefit packages to enrollees in California’s demonstration.
Washington’s managed FFS demonstration is using Medicaid health home care coordination organizations to manage services among existing Medicare and Medicaid providers, and Colorado is using its existing Medicaid Accountable Care Collaborative program to coordinate Medicare and Medicaid services for beneficiaries in its demonstration.
Minnesota’s administrative alignment demonstration maintains the existing Senior Health Options program delivery system in which Medicaid managed care plans contract with the state and also are qualified as Medicare Advantage Special Needs Plans focused on dual eligible beneficiaries (D-SNPs) under contract with CMS.
Financing
Ten states (California, Illinois, Massachusetts, Michigan, New York, Ohio, Rhode Island, South Carolina, Texas, and Virginia) are testing CMS’s capitated financial alignment model, in which managed care plans will receive capitated payments from CMS for Medicare services and the state for Medicaid services.
Anticipated program savings in the capitated financial alignment demonstrations are deducted up-front from CMS’s and the state’s respective baseline contributions to health plans by a savings percentage for each year (Table 1). CMS will contribute the Medicare portion of the capitated rate. The Medicaid portion of the capitated rate includes both the federal and state funding. None of the MOUs explicitly states the basis for the savings percentages, although Illinois’ MOU notes that it currently has one of the highest rates of potentially avoidable hospital admissions among dual eligible beneficiaries nationally and one of the highest proportions of spending on institutional services compared to HCBS. While California’s MOU specifies minimum savings percentages of 1% in year one, 2% in year two, and 4% in year three, it also includes maximum savings percentages of 1.5% in year one, 3.5% in year two, and 5.5% in year three, making the maximum savings percentages in California among highest of the approved demonstrations to date. Texas’s MOU specifies savings percentages of 1.25% in year 1.a (March to December 2015), 2.75% in year 1.b (2016), 3.75% in year 2, and 5.5% in year 3.
All 10 capitated financial alignment demonstrations include provisions to withhold a portion of the capitated rate that plans can earn back if specified quality measures are met. California also requires its plans to provide incentive payments from the quality withhold funds to county behavioral health agencies based on achievement of service coordination measures, and Michigan requires its plans to reward the PIHPs that will provide behavioral health services when the plan earns the withheld payment. South Carolina plans must provide financial incentives to providers that achieve NCQA patient-centered medical home certification.
Two states (Colorado and Washington) are testing CMS’s managed FFS model in which providers will continue to receive FFS reimbursement for both Medicare and Medicaid-covered services. Any savings in these demonstrations will be determined retrospectively, with the state eligible to share in savings with CMS if savings targets and quality standards are met.
Minnesota’s administrative alignment demonstration will not test one of CMS’s financial alignment models. Instead, Minnesota’s Senior Health Options program will maintain its existing capitated integrated payment and delivery system arrangements involving Medicaid MCOs that also qualify as Medicare Advantage D-SNPs. Plans will be allowed to integrate Medicare and Medicaid primary care payments to promote care coordination through health care homes and improved coordination among primary, acute, and LTSS and among physical and behavioral health services.
Benefits
The 10 capitated financial alignment demonstrations include nearly all Medicare and Medicaid services in the plans’ benefits package and capitated payment. All states include nursing facility services in the plans’ capitated payment and benefits package. Eight of the 10 states testing the capitated model (Illinois, Michigan, New York, Ohio, South Carolina, Rhode Island, Texas, and Virginia) include beneficiaries who receive certain Medicaid home and community-based waiver services, while two states (California and Massachusetts) exclude all HCBS waiver enrollees from their demonstrations. Plans are allowed to offer additional benefits, outside the traditional Medicare and Medicaid benefits packages, as appropriate to beneficiary needs. All states require their health plans to offer beneficiaries the option to self-direct their LTSS (Table 3).
Five of the capitated states require plans to offer additional benefits as part of the demonstration. Massachusetts plans must offer certain diversionary behavioral health and community support services that are not otherwise covered as well as expanded Medicaid state plan benefits. Ohio’s § 1915(b)/(c) Medicaid waiver, which operates concurrently with the demonstration, includes expanded Medicaid state plan benefits and additional HCBS. California’s demonstration includes dental, vision, and non-emergency medical transportation benefits, and its plans may offer additional HCBS. South Carolina’s demonstration includes a palliative care benefit for enrollees with a serious, chronic or life-threatening illness who may not meet hospice criteria. Michigan’s health plans must offer adaptive medical equipment and supplies, community transition services, fiscal intermediary services to support self-direction, personal emergency response systems, and respite services (Table 3).
Table 3:LTSS in the Capitated Financial Alignment Demonstrations
State
Nursing facility services included
Home and community-based waiver services included
DD population / services included
Traditional Medicaid benefits package expanded
Plans can offer supplemental benefits
Self-direction option required
Required contracting/ service coordination
CA
Yes
No
No
Yes – plans must provide dental, vision and non-emergency medical transportation services
Yes
Yes
Yes – plans must have MOUs with county mental health and substance use agency for behavioral health services and county social service agency for IHSS
IL
Yes
Yes (except DD)
No
Not mentioned in MOU
Yes
Yes
Not mentioned in MOU
MA
Yes
No (may seek to include in future)
No
Yes – plans must provide diversionary behavioral health and community support services and (unspecified) expanded Medicaid state plan benefits
Yes
Yes
Yes – plans must provide Long-Term Supports coordinator form independent community-based organization as a member of the care team
MI
Yes
Yes
Yes
Yes – plans must provide adaptive medical equipment and supplies, community transition services, fiscal intermediary for self-direction, personal emergency response system, respite
Yes
Yes
Yes – plans must contract with PIHP for behavioral health services
NY
Yes
Yes (NF diversion and transition waiver only)
No*
Not mentioned in MOU
Yes
Yes
Not mentioned in MOU
OH
Yes
Yes (except DD)
No
Yes – expects to require plans to provide (unspecified) expanded Medicaid state plan benefits and additional HCBS
Yes
Yes
Yes – plans must contract with AAA to coordinate HCBS for beneficiaries over age 60
RI
Yes
Yes (except DD)
DD population enrolled but LTSS excluded
Not mentioned in MOU
Yes
Yes
Not mentioned in MOU
SC
Yes
Yes (elderly/
disabled, HIV/AIDS, and mechanical ventilation waivers only)
No
Yes – plans must provide palliative care benefit
Yes
Yes
Not mentioned in MOU
TX
Yes
Yes (seniors and people with physical disabilities who meet NF level of care only)
No
Not mentioned in MOU
Yes
Yes
Not mentioned in MOU
VA
Yes
Yes (elderly/
disabled with consumer direction waiver only)
No
Not mentioned in MOU
Yes
Yes
Not mentioned in MOU
WA
Yes
Yes (except DD)
No
Not mentioned in MOU
Yes
Yes
Not mentioned in MOU
NOTES: *NY’s capitated proposal for beneficiaries who have DD and need LTSS is pending with CMS.
Washington’s managed FFS demonstration adds Medicaid health home services but does not otherwise change the existing Medicare and Medicaid benefits packages. Similarly, Colorado offers care coordination services but otherwise does not change the existing Medicare and Medicaid benefits packages.
Minnesota’s administrative alignment demonstration will continue to provide Medicare benefits at least equivalent to the basic benefit levels included in Medicare Parts A, B, and D and Medicaid benefits based on existing Medicaid MCO contracts.
Demonstration Ombudsman
CMS has announced a funding opportunity for states with approved MOUs to support the planning, development, and provision of independent ombudsman services in the demonstrations, with eight states (California, Colorado, Illinois, Massachusetts, Michigan, Ohio, Virginia, and Washington) awarded funding to date. Rhode Island’s MOU anticipates receiving CMS ombudsman funding. Six states (Colorado, Illinois, Michigan, Ohio, Texas, and Washington) are using an ombuds office within state government, although independent of the state Medicaid agency, while four states are using an ombuds entity outside of state government (California, Massachusetts, New York, and Virginia). Minnesota’s MOU provides that the state’s managed care ombudsman will provide input on plan and system-wide performance but does not provide further details.
Appeals
All of the capitated demonstration states provide beneficiaries with a single integrated notice of appeal rights, and the existing Medicare Part D appeals process for prescription drugs will continue to apply in all demonstrations. Minnesota’s administrative alignment demonstration is building on the integrated appeals system already established in its Senior Health Options program by adding a single integrated notice of appeal rights and standardizing the timeframes to request Medicare and Medicaid appeals. By contrast, Colorado and Washington’s managed FFS demonstrations do not make any changes to the existing Medicare and Medicaid appeals systems.
One of the capitated financial alignment demonstrations (New York) includes a fully integrated four level appeals process for all services traditionally covered by Medicare Parts A and B and Medicaid. New York requires its demonstration health plans to continue providing benefits while appeals are pending for both prior-approved Medicare and Medicaid services if the beneficiary so requests within 10 days of the date of the notice. (Continued benefits pending appeal is currently available under federal law for Medicaid services but not for Medicare services.)
Five of the capitated demonstration states (Illinois, Massachusetts, Rhode Island, South Carolina, and Virginia) require beneficiaries to first exhaust an internal health plan appeal before proceeding to external appeals, while four of the capitated demonstration states (California, Michigan, Ohio, and Texas) allow beneficiaries to choose whether to first file an internal health plan appeal or instead to proceed directly to a fair hearing for Medicaid-covered services.
Nine of the capitated demonstrations states (Illinois, Massachusetts, Michigan, New York (described above), Ohio, South Carolina, Rhode Island, Texas, and Virginia) require health plans to continue Medicare and Medicaid benefits while internal health plan appeals are pending; beneficiaries may request that Medicaid benefits continue while fair hearings are pending, but Medicare benefits will not continue during external appeals. California’s demonstration does not currently provide for continued Medicare benefits pending appeal. California’s MOU provides that the existing Medicare and Medicaid appeals processes will continue at least through demonstration year one, and the state will work to create a more integrated appeals process in future years.
Looking Ahead
As the demonstrations are implemented, additional details about several features are emerging, including how beneficiaries are being notified, counseled, and enrolled; how the demonstrations are being monitored and overseen; how beneficiary ombuds programs are being implemented; and how the demonstrations are being evaluated. CMS has contracted with RTI International to conduct an overall evaluation of the demonstrations as well as state-specific evaluations. The MOUs provide that the evaluations will include site visits, analysis of program data, focus groups, key informant interviews, analysis of changes in quality, utilization, and cost measures, and calculation of savings attributable to the demonstrations. The evaluation findings are to be reported quarterly, although there is likely to be a lag in data availability.
The approved MOUs provide additional information about how CMS and the states envision the demonstrations working and insight into the framework and policy decisions that CMS may apply when developing MOUs with other states that submitted proposals. Additional details are specified in the three-way contracts between CMS, the state, and demonstration plans in the capitated model, in the states’ final demonstration agreement with CMS in the managed FFS model, and in policy guidance. Key areas to continue to consider as the demonstrations are implemented include:
how beneficiaries are making their enrollment choices;
what the actual sources of program savings will be;
how beneficiaries’ access to medically necessary services and supports is being ensured;
how the demonstrations are affecting beneficiary access to HCBS;
how beneficiaries are navigating the demonstrations’ grievance and appeals processes;
whether continuity of care and intelligent assignment provisions are sufficient to prevent care disruptions and the extent to which beneficiaries’ current providers are participating in demonstration health plan networks;
how plans and providers are accommodating the needs of beneficiaries with disabilities; and
what impact the demonstrations are having on care quality and health outcomes.
While the demonstrations offer the potential opportunity to improve care coordination, lower program costs, and achieve outcomes such as better health and the increased use of HCBS instead of institutional care, at the same time the high care needs of many dual eligible beneficiaries increases their vulnerability when care delivery systems are changed.
Appendix
Table 4:State Interest in Financial Alignment Demonstrations for Dual Eligible Beneficiaries as of August 2015
State
Awarded Design Contract
Submitted Letter of Intent
Submitted Capitated Proposal to CMS
SubmittedManaged FFS Proposal to CMS
MOU Signed with CMS
Alabama
Alaska
X
Arizona
X
X
Arkansas
California
X
X
X
Capitated
Colorado
X
X
X
Managed FFS
Connecticut*
X
X
X
Delaware
X
DC
X
Florida
X
Georgia
Hawaii
X
X
Idaho
X
X
Illinois
X
X
Capitated
Indiana
X
Iowa
X
X
Kansas
X
Kentucky
X
Louisiana
Maine
X
Maryland
X
Massachusetts
X
X
X
Capitated
Michigan
X
X
X
Capitated
Minnesota*
X
X
X
Administrative
Mississippi
Missouri
X
X
Montana
X
Nebraska
Nevada
X
New Hampshire
New Jersey
New Mexico
X
X
New York*
X
X
X
X
Capitated
North Carolina
X
X
X
North Dakota
Ohio
X
X
Capitated
Oklahoma
X
X
X
X
Oregon
X
X
X
Pennsylvania
X
Rhode Island
X
X
Capitated
South Carolina
X
X
X
Capitated
South Dakota
Tennessee
X
X
X
Texas
X
X
Capitated
Utah
Vermont
X
X
X
Virginia
X
X
Capitated
Washington*
X
X
X
X
Capitated (withdrawn);
Managed FFS
West Virginia
Wisconsin
X
X
X
Wyoming
TOTAL:
15
38
21
8
13
NOTES: *MN received approval for administrative alignment only, without financial alignment. WA received approval for two demonstrations, but subsequently withdrew its capitated model; NY withdrew its managed FFS proposal. CT and NY’s capitated DD proposal remain pending with CMS.
In his latest column for The Wall Street Journal’s Think Tank, Drew Altman discusses why public concern over drug prices is the “tip of the iceberg” representing broader concerns about out-of-pocket health care costs.
All previous columns by Drew Altman are available online.
Medicaid is the nation’s primary health insurance program for low-income and high-need Americans. Because of the program’s joint federal-state financing structure, Medicaid has a unique role in state budgets because it is both an expenditure item and a source of federal revenue for states. States have significant flexibility within broad federal rules to administer their Medicaid programs. Policy decisions, as well as other factors such as the economy, demographics and state tax capacity are key factors in determining the types and amounts of revenue that states collect as well as how they budget those funds across programs.
Under the Affordable Care Act (ACA), Medicaid was expanded to nearly all adults with incomes at or below 138 percent FPL. However, the June 2012 Supreme Court decision effectively made the Medicaid expansion optional for states. As of September 1, 2015, 31 states including DC have adopted the Medicaid expansion.1
For those that expand, the federal government pays 100 percent of the Medicaid costs for those newly eligible from January 2014 through December 2016. The federal share then phases down gradually to 90 percent in 2020 and remains at that level thereafter, well above traditional rates. The effects of the Medicaid expansion on state budgets and economies have been key issues for policy makers.
This brief, prepared with the Rockefeller Institute of Government, the public policy research arm of the State University of New York, is designed to provide some insight into the underlying economic and fiscal conditions in expansion and non-expansion states leading up to 2014. Analysis focuses on the typical (i.e. median) state for each group. This analysis will provide a framework against which to measure the impact of expansion decisions going forward. The sections focus on: demographics, tax capacity and revenue, state budgets and employment. Key findings include:
The typical expansion state was in a better position across the factors analyzed leading up to the ACA Medicaid expansion in 2014.
Median poverty and uninsured rates were higher in non-expansion states. 2, 3
Across different measures, the median tax capacity for expansion states has been higher. 4
Median tax collections per capita have historically been higher in expansion states. 5
The typical expansion state has historically raised more tax revenue as a share of available resources; the gap between these two groups has increased over time. 6
The typical expansion state spent more per capita on Medicaid and K-12 education prior to the major ACA coverage expansions. 7
Health-related employment remained strong during the recession for both groups of states; the typical expansion state has historically had a higher share of employment coming from the health sector. 8
Key Findings: How Do Expansion And Non-expansion States Compare? – Demographics
Introduction
This brief, prepared with the Rockefeller Institute of Government, is designed to provide insight into the underlying economic and fiscal conditions in expansion and non-expansion states leading up to 2014, providing a framework against which to measure the impact of expansion decisions going forward. Each section of this paper presents a series of charts illustrating the key findings between expansion and non-expansion states followed by a summary of the key findings. The sections focus on: demographics, tax capacity and revenue, state budgets and employment. Additional details on the methodology and the variables are included in Appendix A; also included is a summary of the findings is located in the Appendix summary table.
Key Findings
How do Expansion and Non-expansion States Compare? – Demographics
The demographic make-up of a state is a reflection of state fiscal conditions and affects state spending priorities. Several key factors include age, poverty and particularly for looking at expansion vs. non-expansion states, insurance coverage.
Age
Nationally, children make up nearly a quarter of the population, while the elderly represent almost one-seventh of the population. Since 2000, the growth among children has been relatively flat while growth among the elderly has been increasing at a faster pace. 1
The typical non-expansion state has a relatively higher share of the population that are children while the typical expansion state has a relatively higher share of the population that are elderly adults. Children as share of the total population is about 4% higher in a typical non-expansion state (25.1% vs. 24.1%) and people over age 65 as share of the total population is about 5% higher in a typical expansion state (14.9% vs. 14.2%). 2
From 2000 through 2013, both expansion states and non-expansion states have seen declines in the share of the population that are children and increases in the share that are elderly adults. 2
Median Household Income
Nationally, the real median household income had fallen from its pre-recession peak of over $56,000 to under $52,000 in 2012. Median household income in 2013 was still below pre-recession levels (as well as 2000 levels), but had started to increase slightly since 2012.
The typical expansion state has historically had a higher real median household income than the typical non-expansion state. 3
Median household income in 2013 for the typical expansion and non-expansion states was below both pre-recession peaks and 2000 levels. 3
There is also variation within each group; some non-expansion states (e.g. Virginia and Utah) had some of the highest median household incomes in 2013 while some expansion states (e.g. Arkansas and West Virginia) had some of the lowest median household incomes in 2013. 4
Poverty Rate
Over the 2000-2013 period, the national poverty rate peaked in 2010 and has since slowly fallen to 14.5% in 2013.
The typical non-expansion state has historically had a higher poverty rate than the typical expansion state. 5
There is also variation within each group; three of the highest-poverty states in 2013 were expansion states (Arizona, Kentucky, and New Mexico), while several non-expansion states had very low poverty rates, including South Dakota, Utah, and Virginia. 6
Uninsured Rate
Prior to the ACA’s major coverage expansions in 2014, over half of all Americans were enrolled in private health insurance (employer and other private coverage), 15.6% were enrolled in Medicaid, 14.7% were enrolled in Medicare and 13.4% were uninsured. 7
The typical non-expansion state had a higher share of uninsured people prior to the ACA major coverage expansions than the typical expansion state. The number of uninsured people as share of total population was 13.4% in the typical non-expansion state, which is about 17% higher (13.4% vs. 11.5%) compared to the typical expansion state. 8
Key Findings: How Do Expansion And Non-expansion States Compare? – Revenue And Tax Capacity
In debating adoption of the Medicaid expansion, many states have tried to assess the implications for state revenues. For example, some expansion states like Kentucky have noted increased tax revenues since adopting the Medicaid expansion. However, leading up to the implementation of the ACA, expansion and non-expansion states have historical differences across key measures of revenue and tax capacity including tax collections, capacity, and effort. There are also notable differences in the composition of tax revenue sources and tax policy.
Tax Collections
At a national level, state tax capacity has been increasing since the Great Recession.
Both groups of states saw declines in real per capital tax collections during the Great Recession; the typical expansion state has recovered faster than the typical non-expansion state. 1
Tax Capacity
The typical expansion state had greater tax capacity whether measured by personal income, GDP or total taxable resources (TTR) per capita. Tax capacity was about 12% to 16% higher in the median expansion state in 2012, depending on the measure. 2
There are some exceptions. Wyoming is a non-expansion state that had a higher TTR per capita than any expansion state in 2012 except Alaska, driven by tax revenue potential from oil and minerals. There are some expansion states (West Virginia and Kentucky) which had some of the lowest TTR per capita in this period.
There has been a widening gap between expansion and non-expansion states in terms of their fiscal capacity. In 2000, the typical expansion state had a TTR per capita 8% higher than the typical non-expansion state ($49,109 vs. $53,070); by 2012, the difference had grown to 16% ($51,805 vs. $60,091). 3
Tax Collections as a Share of Tax Capacity
The typical expansion state raises much more (25% more) in state and local tax revenue per capita than the typical non-expansion state. 4
The typical expansion state raises more, even relative to their greater tax capacity; state and local tax revenues as a percent of TTR were about 14% higher in the typical expansion state (7.7% vs. 6.7%). Over time, tax collections as a share of TTR have increased in the typical expansion state (7.3% in 2000 vs. 7.7% in 2012) but decreased in the typical non-expansion state (7.2% in 2000 vs. 6.7% in 2012). 5
Composition of Tax Revenue Sources
Nationally, 32% of the $1.4 trillion tax revenue collected by state and local governments came from property taxes, followed by general sales taxes (23%) and personal income taxes (22%). Nearly $6 in $10 in tax revenues were collected by state governments; the remainder was collected by localities. 6
The typical non-expansion state relies much more on relatively regressive general sales taxes (28.8% compared to 18.0% in the typical expansion state.) The typical expansion state relies slightly more on relatively progressive personal income taxes. 7
There are some exceptions. Non-expansion states like Maine, Virginia, and Wisconsin rely little on sales taxes while expansion states like New Hampshire, Nevada and Washington do not have broad-based income taxes.
Tax Policy Changes
The analysis of state government legislated tax changes shows that the typical expansion and non-expansion states responded to fiscal challenges created by the Great Recession differently; that the typical expansion state notably raised taxes since fiscal year 2008 while the typical non-expansion state had lowered taxes. 8
Key Findings: How Do Expansion And Non-expansion States Compare? – State Budgets
A significant part of discussions in states over the adoption of the Medicaid expansion has been about state spending priorities. Unlike the federal government, states are generally required to balance their budgets; budgets therefore are a reflection of spending priorities within available resources. Several key factors include total state and local budget spending (spending from all sources – state, federal, and local) as well as spending across categories. Data in this section reflect total spending by state and local governments; this includes federal dollars spent by states and localities as well as spending from state and local sources. In state budgets, Medicaid financing is unique compared to other state spending programs due to the federal matching structure. For those states that adopt the expansion, the share of funding for Medicaid from federal dollars is expected to increase given the higher matching rate for those newly eligible under the Medicaid expansion.
Total State and Local Spending Per Capita
Spending by state and local governments has slowed in recent years since the Great Recession; direct general expenditures actually declined in 2011 and 2012 compared to the prior year. 1
The typical expansion state has state and local government spending that is 17% more per-capita than the typical non-expansion state ($8,713 vs. $7,414). 2
Wyoming and Louisiana are notable exceptions; both are non-expansion states that spent more per-capita than many expansion states. Some expansion states (e.g. Arizona and Nevada) spent notably less than the typical non-expansion state. 3
Distribution Across Spending Categories
Nationally, state and local governments spent the largest amount (federal, state and local dollars) on a per capita basis for K-12 education, followed by Medicaid-related spending and higher education in FY 2012. 4
The typical expansion state spent more per capita on Medicaid-related spending (+24%); K-12 education (+18%); police (+20%) and corrections (+11%). 5
By contrast, the typical non-expansion state spent more per-capita on health and hospitals (+21%), highways (+5%) and higher education (+3%) than the typical expansion state. 5 This may be a reflection of the more rural nature of non-expansion states (hence, higher spending on highways) as well as that non-expansion states have more hospitals owned by state and local governments (leading to higher spending on health and hospitals.) 2
Change in spending on Medicaid, K-12, Health and Hospitals over time
Medicaid-related spending continued to grow during the Great Recession while spending on health and hospitals slowed and spending through K-12 education declined. 6
Following the start of the Great Recession, the typical expansion state saw stronger growth in real per capita state-local government spending on Medicaid in comparison to non-expansion states. 7 However, real Medicaid spending per capita declined from 2011-2012, which would have included the end of additional federal matching funds temporarily extended during the Great Recession.3
Following the start of the Great Recession, both groups saw declines in K-12 spending, though the declines in K-12 spending were much smaller in the typical expansion state. (-0.8% vs. -1.9% on an average annual basis from 2008 to 2012.) 7
Key Findings: How Do Expansion And Non-expansion States Compare? – Employment
Also part of discussions in states over the adoption of the Medicaid expansion has been the effect on employment. State debates have also examined the potential employment gains from the new expansion spending and increased economic activity; early evidence from some expansion states like Kentucky have noted increased employment since adopting the Medicaid Expansion.
Unemployment
After peaking in 2010 at the height of the economic downturn, the national unemployment rate in 2013 had fallen to 7.4 percent.
During the Great Recession, both expansion and non-expansion states saw notable increases in the unemployment rate. Unemployment rates have continued to fall for the typical state in both groups since peaking in 2009 or 2010. 1
There is a notable amount of variation within both groups in terms of the unemployment rate. Expansion states in 2013 had employment rates ranging from 9.5% in Nevada down to 2.9% in North Dakota; Non-expansion states had unemployment rates ranging from 8.7% in Mississippi to 3.8% in South Dakota. 2
Total Employment
The total number of jobs fell significantly during the economic downturn; while employment had increased in the years leading up to the major ACA coverage expansions, total nonfarm employment had yet to return to pre-Recession levels.
Health-Related Employment
As total employment levels declined in response to the Great Recession, employment in health and related fields remained strong. 3
As a result, health-related employment has increased as a share of total employment over time, particularly since the Great Recession. 4
Health-related employment in the typical expansion state has historically been higher than in the typical non-expansion state. 5
All states saw strong growth in health-related employment from 2000 through 2013; however growth in this sector slowed for both groups in 2008-2013 compared to the earlier period (2000 to 2007). 6
Appendices: Appendix A – Methodology And Definitions
This analysis focused a series of demographic, fiscal, budget and employment indicators available publicly from the Bureau of Labor Statistics, the Census Bureau, and Department of Treasury, and the Bureau of Economic Analysis. Additional information about the variables included follows. The analysis focused on differences between expansion and non-expansion states over the period from 2000 through 2013 expect for a few sources where the latest available data was for 2012. Analysis of data from the Census Survey of Government Finances, which includes state and local revenue as well as direct general expenditures regardless of fund source (state, local or federal4 ), examines the period from 2004 to 2012; the US Census did not conduct the survey for local governments for 2001 and 2003. Included as expansion states for this analysis were the 31 states that had adopted the Medicaid expansion as of July 2015; however, the District of Columbia is frequently excluded from median calculations in this analysis as it is not consistently included in all data sources. Non-expansion states include the 19 states that have not adopted the expansion at this time as well as Utah where adoption of the expansion is currently under discussion.(Exhibit A.1) To examine differences between these groups, this analysis focuses on the typical expansion state and the typical non-expansion state, which is defined as the median value for each group. Additionally, all monetary values have been converted to real 2013 dollars to control for inflationary changes.
Exhibit A.1: Over half of states have adopted the Medicaid expansion.
Demographics
Age. State spending priorities are affected by the types of populations they serve. For example, states with higher shares of older populations face higher demands for long term care services, which may lead to higher Medicaid spending as Medicaid is the largest purchaser of long term care services. In contrast, states with higher shares of children may face higher demands for education services.
Median Household Income. Household income, which is a measure of all income from those age 15 and older living in the same household, is a common measure of relative wealth of state residents.
Poverty Rates. Many government assistance programs are targeted to help low-income families. Programs administered or supported by the United States Department of Health and Human Services (HHS) use the department’s federal poverty guidelines. The federal poverty guideline for a family of three in the 48 contiguous states and the District of Columbia was $19,530 in 2013.
Health Insurance. The existing status of health insurance coverage and the number of uninsured have been commonly discussed as factors in a state’s decision to adopt the Medicaid expansion. Coverage varied across states due to the availability of employer-based coverage, the scope of public coverage, regulations in the non-group market, poverty rates, and demographics. The share of the population that is uninsured highlights the gap among different coverage options.
Tax Collections and Revenue
Tax Collections. How much tax revenue is collected determines the size of state budgets that lawmakers must then allocate to different spending priorities. A number of factors play into how much is collected – the state tax capacity (how much state and local governments could potentially collect), the composition of state and local taxes (e.g. general sales taxes, property taxes, etc.) and tax policy changes lawmakers elect to make.
Tax Capacity. A state’s tax capacity refers to the potential amount state and local governments could collect through taxes. There are several measures of tax capacity, such as personal income, a state’s gross domestic product as well as a lesser known measure of a state’s total taxable resources – a measure developed by the Treasury Department that addresses concerns with the incompleteness of other measures.
Tax Effort/Tax Collections as a Share of Capacity. Tax capacity is just one factor in determining how much tax revenue states and local governments collect. How much states and localities collect as a share of their potential is a measure of tax effort. Tax collections alone only illustrate the amount the state was able to collect; collections as a share of their capacity controls for the fact that some states are able to potentially collect more.
Composition of Tax Revenue Sources. State and local governments draw their tax revenues from different sources. The most common sources of tax revenue are property taxes, general sales taxes, personal income taxes, corporate income taxes and selective sales taxes (e.g. alcohol and tobacco.) Tax revenues are also separately collected by state and local governments.
Tax Policy Changes. Another factor in determining the amount of revenue that states collect relates to state lawmaker decisions on tax policy. As with determining spending priorities, state lawmakers also determine the tax rates and types of taxes enacted in a state.
State Budgets and Spending
Total State Budget Spending. Data in this section reflect total spending by state and local governments; this includes federal dollars spent by states and localities as well as spending from state and local sources.
Spending categories. This analysis focuses on the following categories of spending:
Medicaid-related spending: Refers to medical vendor payments according to Census definitions for their annual survey of state and local government finances. This does not include all Medicaid spending, but refers to payments under public welfare programs made directly to private vendors for medical assistance and hospital or health care on behalf of low-income or other medically needy persons. It captures most, but not all, Medicaid spending.
Health and Hospitals: Refers to spending related to public health programs and other activities (e.g. public health administration, vita statistics, etc.) as well as support for public or private hospitals outside of public welfare programs (e.g. Medicaid). It can include construction costs of hospitals as well.
K-12 Education: Refers to spending for operation, maintenance and construction of public schools and facilities for elementary and secondary education, including vocational-technical education.
Employment
Employment. Employment, or the number of jobs, is a strong indicator of economic conditions. This analysis focused on total non-farm employment, which includes private sector and government employment.
Unemployment. Unemployment is also a strong indicator of economic conditions. The unemployment rate is measure of the share of the labor force who are not employed; individuals who are no longer looking for work or those under the age of 16 are not counted as part of the labor force and are excluded from such calculations.
Health-Related Employment. Employment in the health and social assistance sectors as defined by the NAICS definition. This includes jobs in ambulatory health care (physician office, dental offices, etc.) outpatient care centers, medial and diagnostic laboratories, hospitals, home health care, nursing facilities and among others.
Appendices: Appendix Summary Table
Expansion
Non-expansion
Demographics
Age
Higher Median Share of the Total Population that are Elderly Adults.
Shares of the population for children are declining and growing for the elderly for both groups.
Higher Median Share of the Total Population that are Children.
Shares of the population for children are declining and growing for the elderly for both groups.
Median Household Income
Higher Real Median Household Income.
Lower Real Median Household Income.
Poverty Rate
Lower Median Poverty Level.
Higher Median Poverty Level.
Health Insurance
Lower Median Uninsured Rate.
Higher Median Uninsured Rate.
Revenue and Tax Capacity
Tax Collections
Faster Recovery since the Great Recession.
Slower Recovery since the Great Recession.
Tax Capacity
Higher Median Level of Tax Capacity, Regardless of Measure.
Median Level of Tax Capacity has been Increasing at a Faster Rate over Time.
Lower Median Level of Tax Capacity, Regardless of Measure.
Median Level of Tax Capacity has been Increasing at a Slower Rate over Time.
Tax Effort(Collections as a Share of Capacity)
Median Collections per Capita is higher.
Median Tax Collections as a Share of Tax Capacity is Higher and has been Increasing on Average.
Median Collections per Capita is lower.
Median Tax Collections as a Share of Tax Capacity is Lower and has been Decreasing on Average.
Composition of Tax Revenue Sources
Typical State relies more on Personal Income Taxes.
Typical State relies more on General Sales Taxes.
Tax Policy Changes
State lawmakers have acted to raise taxes in a number of years since 2008.
State lawmakers have acted to cut taxes in a number of years since 2008.
State Budgets
Total State and Local Budget Spending
Higher Median Total Budget Spending per capita.
Lower Median Total Budget Spending per capita.
Distribution Across Spending Categories
Higher Median Spending per capita levels on Medicaid, K-12 Education, Police and Corrections.
Higher Median Spending per capita levels for Health and Hospitals, Highways and Higher Education.
Change in Spending Across programs
Stronger Growth in Median Spending per capita for Medicaid post-recession.
Smaller Decline in Median Spending per capita for K-12 Education post-recession.
Weaker Growth in Median Spending per capita for Medicaid post-recession.
Larger Decline in Median Spending per capita for K-12 Education post-recession.
Employment
Unemployment
Median Unemployment Rate has Declined in Recent Years.
Median Unemployment Rate has Declined in Recent Years.
Health Sector Employment
Health-related Employment is a Higher Share of Total Employment.
Strong growth in health-related employment for both groups; growth slowed in 2008-2013.
Health-related Employment is a Lower Share of Total Employment.
Strong growth in health-related employment for both groups; growth slowed in 2008-2013.
Over a quarter of hospitals in Non-expansion states were owned by state and local governments in 2013 compared to 16% of hospitals in Expansion states. Hospitals by Ownership Type, 2013. Kaiser Family Foundation, State Health Facts. https://modern.kff.org/other/state-indicator/hospitals-by-ownership/#
Additionally, the higher spending per capita for higher education in the typical non-expansion state may be due, in part, to the fact that most expansion states are industrialized, urbanized, northeastern states which have extensive network of private higher education institutions. Therefore, these states may be outliers when it comes to higher education because they don’t spend as much per capita due to existence of large number of private higher education institutions. ↩︎
The American Recovery and Reinvestment Act (ARRA) provided states with enhanced Medicaid matching rates between October 2008 and June 2011. This enhanced match provided states with $103 billion over the 11 quarters it was in effect. This allowed for state spending on the program to fall; the only two years in the history of Medicaid when annual state funds spending decreased.
Miller, Vic, Andy Schneider, Laura Snyder and Robin Rudowitz. Impact of the Medicaid Fiscal Relief Provisions in the American Recovery and Reinvestment Act (ARRA). Kaiser Commission on Medicaid and the Uninsured, October 2011. https://modern.kff.org/medicaid/issue-brief/impact-of-the-medicaid-fiscal-relief-provisions/.
Smith, Vern et al. Medicaid in a Historic Time of Transformation: Results from a 50-State Medicaid Budget Survey for State Fiscal Years 2013 and 2014. Kaiser Commission on Medicaid and the Uninsured, October 2014. https://modern.kff.org/medicaid/report/medicaid-budget-survey-archives/. ↩︎
Direct expenditures spent on medical vendor payments (E74) may include funds spent from any kind of source the state or local government has available to use for. State and local government expenditures data in this survey are collected by function and do not distinguish if the source of funds used was coming from a federal, state or local fund. It may be possible that state and local governments are using federal receipts also to fund medical vendor payments which are not reflected in these expenditure statistics.nEmail correspondence with officials at the Census Bureau, June 2015. ↩︎