KFF designs, conducts and analyzes original public opinion and survey research on Americans’ attitudes, knowledge, and experiences with the health care system to help amplify the public’s voice in major national debates.
In a new policy insight, the Kaiser Family Foundation’s Tricia Neuman and Juliette Cubanski examine a 1990 federal law that ensures that people age 65 and older are able to buy a Medigap policy when they sign up for Medicare, but denies younger Medicare beneficiaries with disabilities the same right unless they live in a state that requires it.
Medicare provides coverage for a wide array of medical and drug benefits, but, with its deductibles, cost-sharing requirements, and lack of an annual out-of-pocket spending limit, many people on Medicare purchase Medigap supplemental insurance to help cover their out-of-pocket costs. Roughly 11 million of the 57 million people on Medicare—around 20 percent of all beneficiaries—have a Medigap policy, which helps protect against catastrophic expenses, spreads costs over the course of the year, and simplifies medical bills and paperwork. Thanks to a 1990 federal law, people age 65 and older are able to buy a Medigap policy when they sign up for Medicare, but younger Medicare beneficiaries with disabilities are not granted the same right unless they live in a state that requires it.
Today, Medicare covers 9 million people under 65 with disabilities. Most people under 65 who qualify for Medicare must first become eligible to receive disability insurance benefits (SSDI) and then wait 24 months for Medicare coverage to begin. Given this pathway to Medicare, it may not be a surprise that younger beneficiaries with disabilities have poorer self-reported health status than seniors on Medicare, along with higher rates of cognitive impairments and functional limitations, and lower incomes, with half having income of $17,000 or less. And even with Medicare, beneficiaries under 65 with disabilities report greater difficulty accessing the care they need, sometimes because they cannot afford the cost. For some, this may be related to not having supplemental coverage, such as Medigap, to help with their out-of-pocket costs. In fact, a much smaller share of beneficiaries under 65 with disabilities than seniors have a Medigap policy (2% versus 17%, respectively), and a much higher share have no supplemental coverage whatsoever (21% versus 12%).
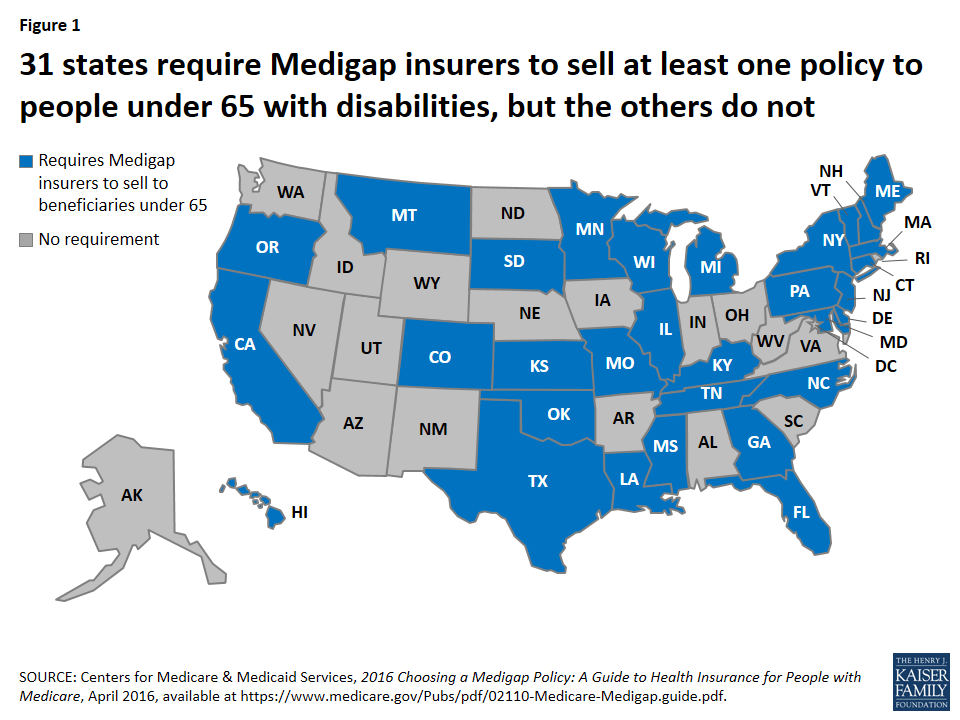
The substantially lower rate of Medigap coverage among under age 65 adults with disabilities may be due in large part to the provision in the federal law mentioned above that gives Medicare beneficiaries age 65 and older the right to purchase a Medigap policy during the first six months after they enroll in Medicare Part B and under other limited circumstances, but does not provide the same guarantee to younger people who are entitled to Medicare due to having a disability. According to the Centers for Medicare & Medicaid Services, 31 states have gone beyond the federal minimum standard to require insurers in their states to provide at least one kind of Medigap policy to beneficiaries younger than age 65, but the other 19 states and DC have not (Figure 1).
Figure 1: 31 states require Medigap insurers to sell at least one policy to people under 65 with disabilities, but the others do not
In effect, the 1990 federal law created a gap in Medigap for beneficiaries under 65 with disabilities. Back then, insurers resisted the idea of providing an open enrollment period with guaranteed-issue rights to younger adults with disabilities on Medicare. At the time, many Medigap policies covered some prescription drug costs, and there was particular concern about relatively high drug spending among people under 65 with disabilities that would drive up insurers’ costs, which would lead to higher premiums.
More than 25 years later, things have changed. Medigap policies sold today are prohibited from covering prescription drug costs, now that Medicare Part D provides a prescription drug benefit. This means Medigap insurers are no longer on the hook for their policyholders’ drug costs, which are indeed much higher for younger beneficiaries with disabilities than for seniors, on average, according to our research. But Medicare per capita costs are similar for younger beneficiaries with disabilities and seniors when Part D spending is excluded (Figure 2).
Figure 2: Average Medicare per capita spending in 2014 was similar for beneficiaries under age 65 with disabilities and those over age 65, when Part D drug spending is excluded
In light of these data, it’s not clear what the justification is for treating younger adults with disabilities differently from older adults when it comes to buying a Medigap policy. Revising federal law related to Medigap open enrollment rights and protections could help to reduce the gap in Medigap coverage between younger and older beneficiaries, help alleviate cost-related access problems among the relatively small but vulnerable group of people under 65 who qualify for Medicare, and provide more equitable treatment to Medicare beneficiaries across the states.
About eight of 10 of the 2.6 million people who died in the US in 2014 were people on Medicare, making Medicare the largest insurer of health care provided during the last year of life.1 In fact, roughly one-quarter of traditional Medicare spending for health care is for services provided to Medicare beneficiaries in their last year of life—a proportion that has remained steady for decades.2 The high overall cost for health care received in the last year of life is not surprising given that many who die have multiple serious and complex conditions.
Aside from cost, several other factors contribute to difficult clinical and policy discussions about whether patients are getting the care they want or need as they approach the end of their lives. Research has found, for example, that most adults (90 percent) say they would prefer to receive end-of-life care in their home if they were terminally ill, yet data show that only about one-third of Medicare beneficiaries (age 65 and older) died at home.3
In 2016, Medicare began covering advance care planning—discussions that physicians and other health professionals have with their patients regarding end-of-life care and patient preferences—as a separate and billable service. The following 10 FAQs provide information on Medicare’s role in end-of-life care and advance care planning. In addition to defining relevant terms, and explaining Medicare’s current and future coverage for end-of-life care, these FAQs also describe recent relevant rules released by the Administration and additional proposals from Congress regarding advance care planning and care for people with serious and terminal illness.
Q1: What is “end-of-life care” and does Medicare cover it?
A: End-of-life care encompasses all health care provided to someone in the days or years before death, whether the cause of death is sudden or a result of a terminal illness that runs a much longer course. For people ages 65 and over, the most common causes of death include cancer, cardiovascular disease, and chronic respiratory diseases.4 Medicare covers a comprehensive set of health care services that beneficiaries are eligible to receive up until their death. These services include care in hospitals and several other settings, home health care, physician services, diagnostic tests, and prescription drug coverage through a separate Medicare benefit. Many of these Medicare-covered services may be used for either curative or palliative (symptom relief) purposes, or both. Medicare beneficiaries with a terminal illness are eligible for the Medicare hospice benefit that includes additional services—not otherwise covered under traditional Medicare—such as bereavement services. The Medicare hospice benefit is discussed in more detail in Question 5.
Q2: What is “advance care planning” and does Medicare cover it?
A: Advance care planning involves multiple steps designed to help individuals a) learn about the health care options that are available for end-of-life care; b) determine which types of care best fit their personal wishes; and c) share their wishes with family, friends, and their physicians. In some cases, patients who have already considered their options may need only one advance care planning conversation with their physician. However, experts state that frequently, beneficiaries may require a series of conversations with their physician or other health professionals to clearly understand and define their end-of-life wishes.5
Starting January 1, 2016, Medicare began covering advance care planning as a separate service provided by physicians and other health professionals (such as nurse practitioners who bill Medicare using the physician fee schedule). Medicare now covers advance care planning provided in medical offices and facility settings, including hospitals. As with most other physician services, beneficiaries are subject to cost sharing for advance care planning provided by their physician or health professional. If Medicare beneficiaries desire advance care planning during their annual wellness visit, physicians and other health professionals may provide it during the visit and bill Medicare separately for it. However, beneficiaries will have not have any cost sharing liability for advance care planning provided in conjunction with their annual wellness visits.
Q3: Are policymakers, such as CMS or Congress, considering changes in Medicare’s coverage of advance care planning?
A: Yes. The agency that runs Medicare, the Centers for Medicare and Medicaid services (CMS), finalized regulations in fall 2015 that allow Medicare to pay physicians and other qualified health care professionals for providing advance care planning to beneficiaries.6 Specifically, in a proposed regulation released July 8, 2015, CMS introduced two new billing codes—previously recommended by the American Medical Association—for advance care planning provided to Medicare beneficiaries. On October 30, 2015, CMS finalized these proposed provisions, allowing physicians and other health professionals to bill Medicare for advance care planning, as a separate service, starting January 1, 2016. Previous Medicare coverage rules only allowed reimbursement for advance care planning under very limited circumstances.7
In Congress, prior to this new CMS regulation on advance care planning, two bipartisan bills pertaining to advance directives and end-of-life care were introduced—one in the Senate and one in the House. In the Senate, Sen. Mark Warner and Sen. Johnny Isakson introduced the Care Planning Act of 2015 (S.1549), with other cosponsors.8 This legislation included coverage under Medicare for advanced illness planning and care coordination services, including structured discussions about treatment options and patient preferences, to Medicare beneficiaries who have a serious progressive or life-threatening illness. In the House, Rep. Earl Blumenauer and 59 cosponsors introduced the Personalize Your Care Act of 2013 (H.R.1173).9 This legislation included Medicare and Medicaid coverage for advance care planning consultations between patients and doctors or other health care professionals.
Q4: What are “advance directives”? Are health care facilities, such as hospitals or skilled nursing facilities, required to keep records of Medicare patients’ advance directives?
A: Advance directives are written instructions that are intended to reflect a patient’s wishes for health care to guide medical decision-making in the event that a patient is unable to speak for her/himself. Advance directives typically result from advance care planning and often take the form of a living will, which defines the medical treatment that patients prefer if they are incapacitated, or designation of a certain person as a medical power of attorney.10 Advance directives fall under state regulation, and the required forms for formal advance directives vary from state to state.11
Studies have found that about 4 in 10 Americans ages 65 and older do not have advanced directives or have not written down their own wishes for end-of-life medical treatment.12 Additionally, demographic differences appear to play a role in the likelihood of having advanced directives.13 Specifically, African Americans and Hispanics have advance directives at lower rates compared to whites, as do people with lower incomes and lower levels of completed education.14 Researchers have identified several factors that contribute to these differences, including cultural and religious differences, communication challenges between patients and medical staff, distrust of medical care systems, and awareness of advance directive options.15
The Patient Self-Determination Act, which took effect in 1991, included a list of Medicare requirements for health care facilities regarding advance directives. Under this law, facilities such as hospitals and skilled nursing facilities must ask each patient upon admission if he or she has an advance directive and record its existence in the patient’s file.16 Facilities cannot require any patient to create an advance directive before providing treatment or care, and likewise, Medicare patients are not required to have an advance directive before they receive care.17 Recent surveys show that among long-term care patients, those receiving care in a facility (such as a nursing home or hospice facility) are more likely to have advance directives in place.18
Q5: Does Medicare cover hospice care? How many Medicare beneficiaries use hospice?
A: Yes. For terminally ill Medicare beneficiaries who do not want to pursue curative treatment, Medicare offers a comprehensive hospice benefit covering an array of services, including nursing care, counseling, palliative medications, and up to five days of respite care to assist family caregivers. Hospice care is most often provided in patients’ homes.19 Medicare patients who elect the hospice benefit have little to no cost-sharing liabilities for most hospice services.20 In order to qualify for hospice coverage under Medicare, a physician must confirm that the patient is expected to die within six months if the illness runs a normal course. If the Medicare patient lives longer than six months, hospice coverage may continue if the physician and the hospice team re-certify the eligibility criteria.
Of all Medicare beneficiaries who died in 2014, 46 percent used hospice—a rate that has more than doubled since 2000 (21 percent).21 The rate of hospice use increases with age, with the highest rate existing among decedents ages 85 and over. Hospice use is also higher among women than men and among white beneficiaries than beneficiaries of other races/ethnicities. Hospice care accounts for about 10 percent of traditional Medicare spending in beneficiaries’ last year of life.22 Medicare Advantage plans do not cover hospice care; therefore, when a Medicare Advantage enrollee receives hospice care, his or her hospice coverage falls under traditional Medicare (Parts A and B).23
While many researchers, policymakers, and patient advocates cite the numerous benefits of hospice care in providing appropriate end-of-life care to Medicare patients, questions have been raised about the growth in for-profit hospice agencies, citing differences in the average care needs of the patients they serve compared with those served by non-profit agencies.24
Q6: What is “palliative care” and does Medicare cover it?
A: Palliative care can be integral to end-of-life care in that it generally focuses on managing symptoms and providing comfort to patients and their families. While palliative care is common among people receiving end-of-life care, it is not necessarily restricted to people with terminal illnesses. The Center to Advance Palliative Care emphasizes that palliative care is commonly used among people living with serious, complex, and chronic illnesses, including cancer, heart disease, general pain, or depression.25 Close to half (45 percent) of all Medicare beneficiaries have four or more chronic conditions for which palliative care services may be clinically indicated to alleviate symptoms—either in combination with or instead of curative treatment.26 The Medicare hospice benefit (described in Question 7) also covers palliative care for beneficiaries with terminal illness.
Q7: How much does Medicare spend on end-of-life care, and for which services?
A: Among seniors in traditional Medicare who died in 2014, Medicare spending averaged $34,529 per beneficiary – almost four times higher than the average cost per capita for seniors who did not die during the year.27 Other research shows over the past several decades, roughly one-quarter of traditional Medicare spending for health care is for services provided to beneficiaries ages 65 and older in their last year of life.28
Medicare spending during the year of death decreases with age after age 73 (Figure 1), suggesting that patients, families, and providers may be opting for less intensive and less costly end-of-life interventions for beneficiaries as they grow older. Specifically, per capita Medicare spending among decedents in 2014 peaked at age 73 ($43,353) and decreased by almost half ($23,181) by age 95.29 Approximately half of total Medicare spending for people who died in a given year goes toward hospital inpatient expenses, while hospice and skilled nursing services each accounted for about 10 percent of Medicare spending.30
Figure 1: Among traditional Medicare beneficiaries over age 65 who die during the year, Medicare per capita spending decreases with age, 2014
Q8: Did the Affordable Care Act (ACA) affect Medicare coverage for end-of-life care or advance care planning?
A: No. The final ACA legislation did not include provisions that would allow physicians or other health professionals to seek separate Medicare payment for consultations on advance care planning. A House-passed predecessor bill (H.R.3200) included provisions that would have established Medicare reimbursement for advance care planning, as well as programs to increase public awareness of advance care planning, but these provisions were dropped from the final ACA legislation.31 Confusion regarding the ACA persisted even after it passed, as seen in a Kaiser Family Foundation survey which found that in 2013, more than one-third (35 percent) of people ages 65 and over incorrectly believed that a panel was created by the ACA to make end-of-life decisions for Medicare beneficiaries.32
Q9: Has the Institute of Medicine (IOM) made any recommendations regarding advance care planning and end-of-life care?
A: In fall 2014, the IOM released a comprehensive report, Dying in America: Improving Quality and Honoring Individual Preferences Near the End of Life, which included five recommendations aimed to increase the quality of end-of-life care and improve the ability for patients to choose their own treatment plan.33 In brief, the IOM recommendations call for:
Coverage of comprehensive care for patients with advanced serious illnesses who are nearing the end of life by both government and private health insurers;
The development of quality metrics and standards for clinician-patient communication and advanced care planning, with insurance reimbursement tied to performance on these standards;
Strengthening clinical training and licensing/credentialing requirements in palliative care;
Federal and regulatory action to establish financial incentives for integrating medical and social services for people nearing the end of life, including electronic health records that incorporate advanced care planning;
Widespread efforts to provide information to the public on the benefits of advance care planning and the ability to for individuals to choose their own course of treatment.
Q10: How does the public feel about advance care planning and Medicare’s role in end-of-life preferences?
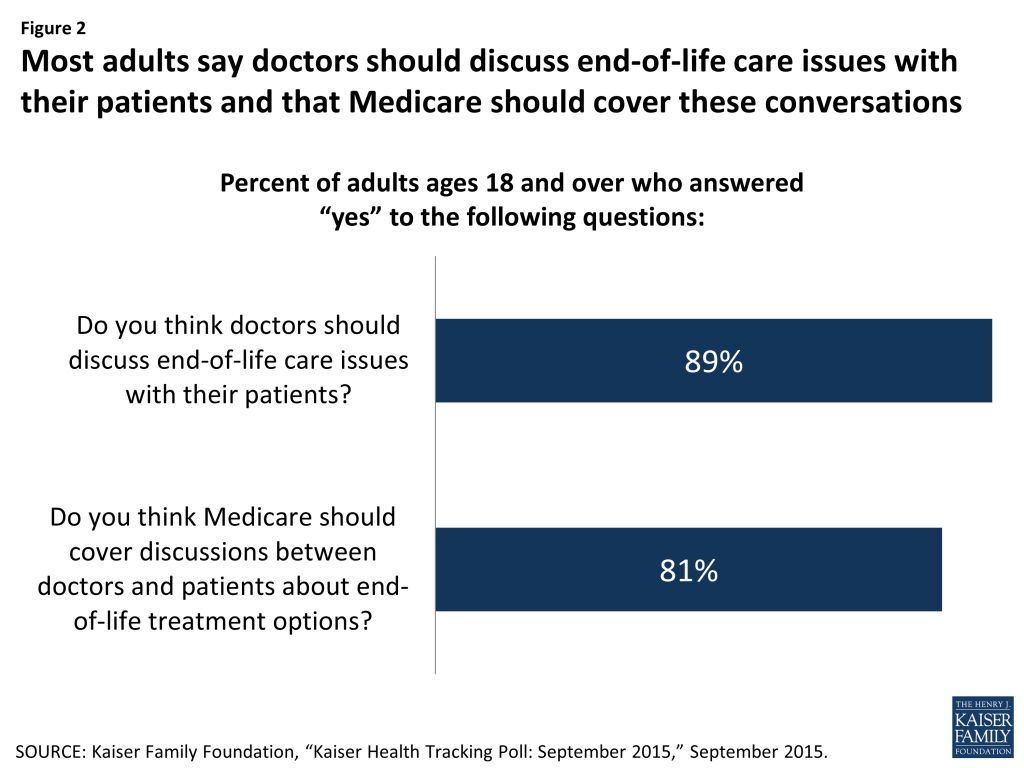
A: By and large, the public supports having doctors discuss end-of-life care issues with their patients, and having Medicare and private insurance cover these discussions (Figure 2). A recent Kaiser Family Foundation survey found that about 9 in 10 adults (89 percent) say doctors should discuss end-of-life care issues with their patients, yet only 17 percent of adults say they have had such a discussion with their doctor or health care provider. Among adults ages 65 and older, the share is somewhat higher (27 percent). Among all adults who said they had not had a discussion with their doctor or other health care provider about end-of-life care wishes, half said that they would want one. The majority of adults (81 percent) say Medicare should cover discussions between doctors and patients about end-of-life treatment options—comparable to the share (83 percent) favoring private insurance coverage for similar conversations.34 (This survey was conducted prior to the release of final regulations allowing Medicare coverage of advance care planning.)
Figure 2: Most adults say doctors should discuss end-of-life care issues with their patients and that Medicare should cover these conversations
Gerald F. Riley and James D. Lubitz, “Long-Term Trends in Medicare Payments in the Last Year of Life,” Health Serv Res 2010;45 (2): 565-76; Christopher Hogan et al., “Medicare Beneficiaries’ Costs of Care In The Last Year of Life,” Health Aff (Millwood) 2001;20(4):188-95. ↩︎
Approaching Death: Improving Care at the End of Life, Institute of Medicine, 1997; Joan M. Teno et al., “Change in End-of-Life Care for Medicare Beneficiaries,” JAMA 2013;309(5):470-77. ↩︎
Prior to January 2016, neither physicians nor beneficiaries could seek reimbursement from Medicare for advance care planning if those discussions are the sole purpose of the visit. Instead, to be covered under Medicare, these discussions must have occurred either when they were part of appointments made for other reasons (such as illness or injury) or during the one-time “Welcome to Medicare” visit that may occur within a beneficiary’s first 12 months of Medicare enrollment. In 2010, CMS included advance care planning as a voluntary part of the ACA-established annual wellness visit in Medicare, but retracted this provision before it could take effect in January of 2011. CMS explained that it retracted this provision because the agency did not have ample “opportunity to consider prior to the issuance of the final rule the wide range of views on this subject held by a broad range of stakeholders.” ↩︎
U.S. House, Omnibus Budget Reconciliation Act of 1990, Conference Report (to Accompany H.R. 5835), 101 H. Rpt. 101-964, printed Oct. 27, 1990, Sec. 4206; Adrienne L. Jones, Abigail J. Moss, and Lauren D. Harris-Kojetin, “Use of Advance Directives in Long-term Care Populations,” Centers for Disease Control and Prevention: Division of Health Care Statistics, January 2011, http://www.cdc.gov/nchs/data/databriefs/db54.pdf. ↩︎
Anne Wilkinson, Neil Wenger, and Lisa R. Shugarman, “Literature Review on Advance Directives” HHS Office of the Assistant Secretary for Planning and Evaluation, June 2007, available at http://aspe.hhs.gov/daltcp/reports/2007/advdirlr.pdf; Deborah Carr, “Racial Differences in End-of-Life Planning: Why Don’t Blacks and Latinos Prepare for the Inevitable?” OMEGA 2011;63(1):1-20; GB Zaide et al., “Ethnicity, race, and advance directives in an inpatient palliative care consultation service,” Palliat Support Care 2013;11(1):5-11; Lauren H. Nicholas et al., “Regional Variation in the Association Between Advance Directives and End-of-Life Medicare Expenditures,” JAMA 2011;306(13):1447-53; Kimberly S. Johnson, Maragatha Kuchibhatla, and James A. Tulsky, “What explains racial differences in the use of advance directives and attitudes toward hospice care?” J Am Geriatr Soc 2008;56(10):1953-58. ↩︎
Health care providers can, however, refuse a treatment, but must notify the patient and/or their agent upon admission of any objections to the advance directive. For more information, see GAO report “Patient Self-Determination Act: Providers Offer Information on Advance Directive but Effectiveness Uncertain,” p. 45, August 1995, available at http://www.gpo.gov/fdsys/pkg/GAOREPORTS-HEHS-95-135/pdf/GAOREPORTS-HEHS-95-135.pdf. ↩︎
Medicare Payment Advisory Commission, Report to the Congress: Medicare Payment Policy, Chapter 12: “Hospice Services,” March 2015. ↩︎
There is no deductible for hospice care in traditional Medicare. In general, cost-sharing is limited to copayments of up to $5 per prescription for outpatient prescription drugs (typically for pain and symptom management) and 5 percent coinsurance for inpatient respite care, if used. ↩︎
Kaiser Family Foundation analysis of a five percent sample of 2014 Medicare claims from the CMS Chronic Conditions Data Warehouse. ↩︎
Melissa W. Wachterman, Edward R. Marcantonio, Roger B. Davis, and Ellen P. McCarthy, “Association of hospice agency profit status with patient diagnosis, location of care, and length of stay.” JAMA 2011;305(5):472-9; R. C. Lindrooth and B. A. Weisbrod, “Do religious nonprofit and for-profit organizations respond differently to financial incentives? The hospice industry.” J Health Econ 2007;26(2):342-57. ↩︎
Puerto Rico’s debt crisis has been the subject of national media and legislative action over the last several months. Additionally, a number of major news outlets have reported on an impending Puerto Rico health care crisis related to demographic and health care financing issues, and exacerbated by the current economic situation and the growing number of Zika virus transmissions. The following slides provide a quick snapshot of Puerto Rico’s population, as well as current and upcoming issues that are impacting the island’s health care system.
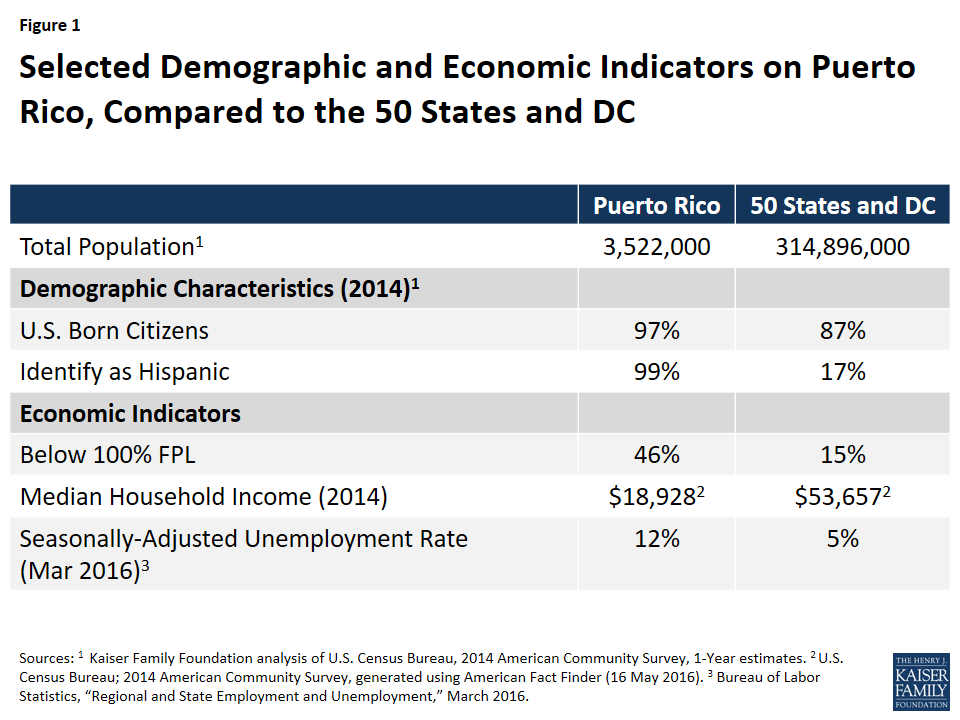
1. How does Puerto Rico compare to the 50 States and DC on Key Demographic and Economic Indicators?
Figure 1: Selected Demographic and Economic Indicators on Puerto Rico, Compared to the 50 States and DC
The Commonwealth of Puerto Rico is a U.S. territory located in the Caribbean, with a population of roughly 3.5 million people. Puerto Ricans are U.S. citizens by birth but they differ from the 50 states and DC on a variety of demographic and economic indicators:
Puerto Rico is much less racially/ethnically diverse than the 50 states and DC, with nearly its entire population identifying as Hispanic.
The island fares worse economically, with a poverty rate three times higher than that of the states, and an unemployment rate that is more than twice as high. Additionally, a substantial share of the labor force works in the services industry.1
2. How is Puerto Rico’s Population Changing?
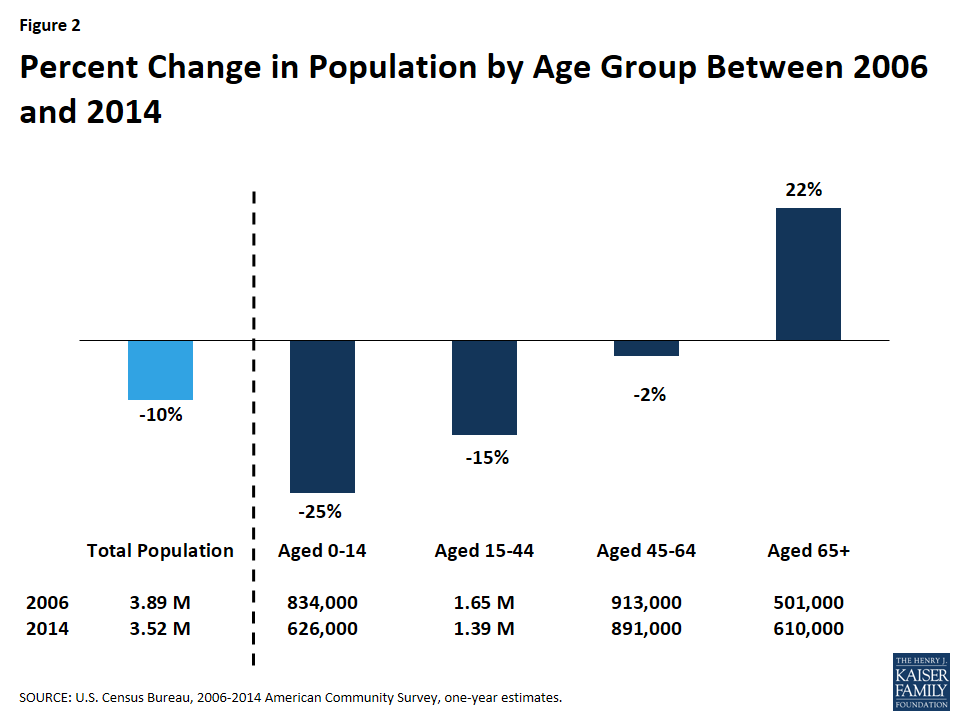
Figure 2: Percent Change in Population by Age Group Between 2006 and 2014
Puerto Rico’s economic recession began in 2006.2, 3 Between 2006 and 2014, its population had declined by ten percent, primarily due to the largest outmigration of Puerto Ricans to the U.S. mainland since the 1950s.4,5,6 Young people represent a disproportionate share of those who have migrated, with a 25% drop in the number of people between the ages of 0-14 and a 15% drop in those aged 15-44. The number of seniors on the island has increased by 22% since 2006.
3. How does Puerto Rico compare to the 50 States and DC on Key Health Indicators?
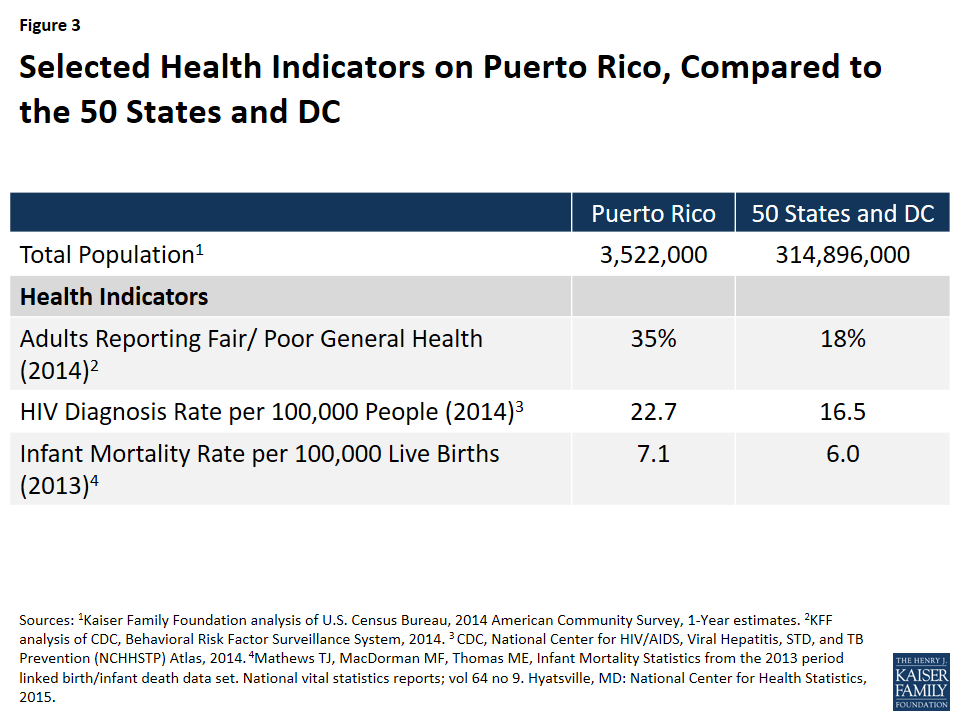
Figure 3: Selected Health Indicators on Puerto Rico, Compared to the 50 States and DC
As with Puerto Rico’s demographic and economic indicators, the island differs from the 50 states and DC on several key health indicators:
The share of adults reporting fair/poor general health is twice as high in Puerto Rico compared to the rest of the United States.
HIV and infant mortality rates are also higher in Puerto Rico compared to the rest of the U.S.
4. How is Zika affecting Puerto Rico?
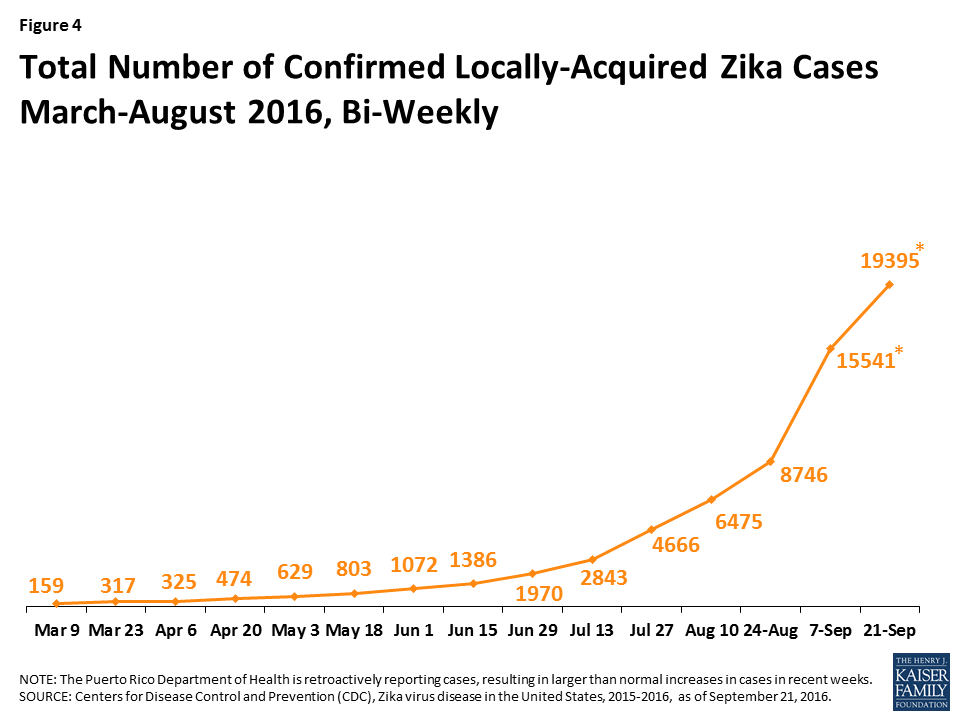
Figure 4: Total Number of Confirmed Locally-Acquired Zika Cases, March-August 2016, Bi-Weekly
The first case of locally-acquired Zika virus in the United States was reported in Puerto Rico in December 2015,7 and the number of cases on the island have risen dramatically to 19,395 as of September 21, 2016,8 and are expected to continue to grow.9 Locally-acquired Zika is transmitted through the bite of infected mosquitos and the virus can cause microcephaly and other severe fetal brain defects among infected pregnant women. In addition, CDC is investigating the link between Zika and Guillain-Barré Syndrome, a rare disease that causes muscle weakness, and sometimes, paralysis. On August 12, 2016, the US Department of Health and Human Services declared the Zika outbreak in Puerto Rico to be a public health emergency. The declaration allows Puerto Rico to 1) apply for funds to hire and train individuals to assist in controlling the spread of Zika, including outreach and education programs through the U.S. Department of Labor’s National Dislocated Worker Grant, and 2) temporarily reassign staff of local public health department to help combat the spread of Zika.10 The virus poses a public health and financial challenge to the island—according to the CDC, the dollar amount of caring for a single child with birth defects is estimated to be in the millions.11
5. What is the Health Coverage of the Population?
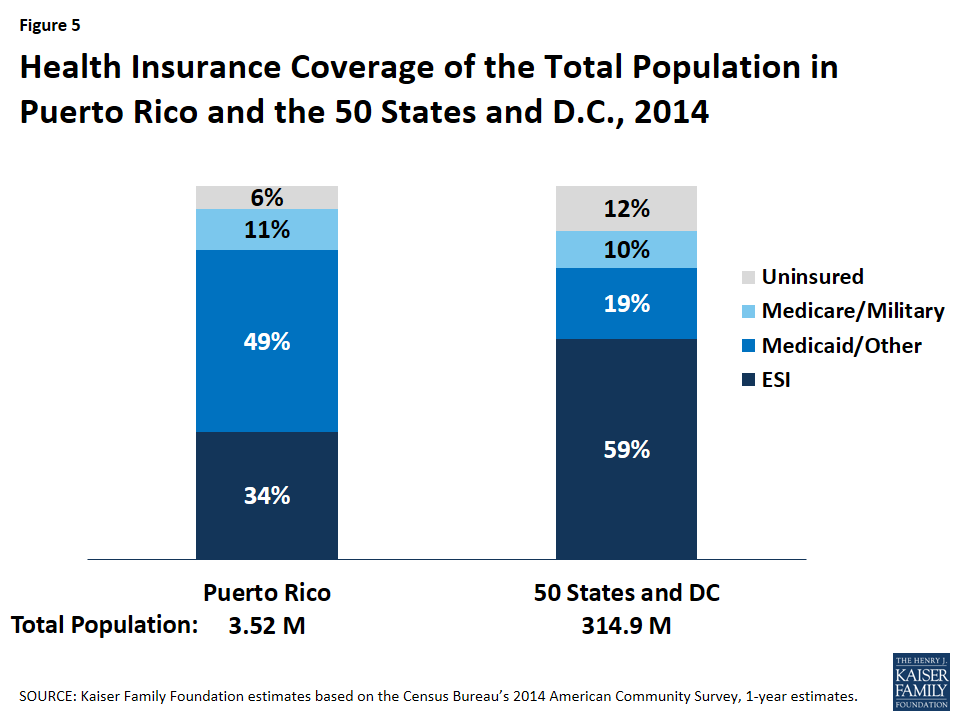
Figure 5: Health Insurance Coverage of the Total Population in Puerto Rico and the 50 States and D.C., 2014
Owing in part to high unemployment and poverty rates, almost half of Puerto Ricans are covered by Medicaid, while about one-third are covered by Employer Sponsored Insurance (ESI). An additional 11% of the population is covered by Medicare. Puerto Rico’s Medicaid and Medicare programs are delivered predominantly through managed care.12,13
6. How Does Medicaid Funding in Puerto Rico Compare to the States?
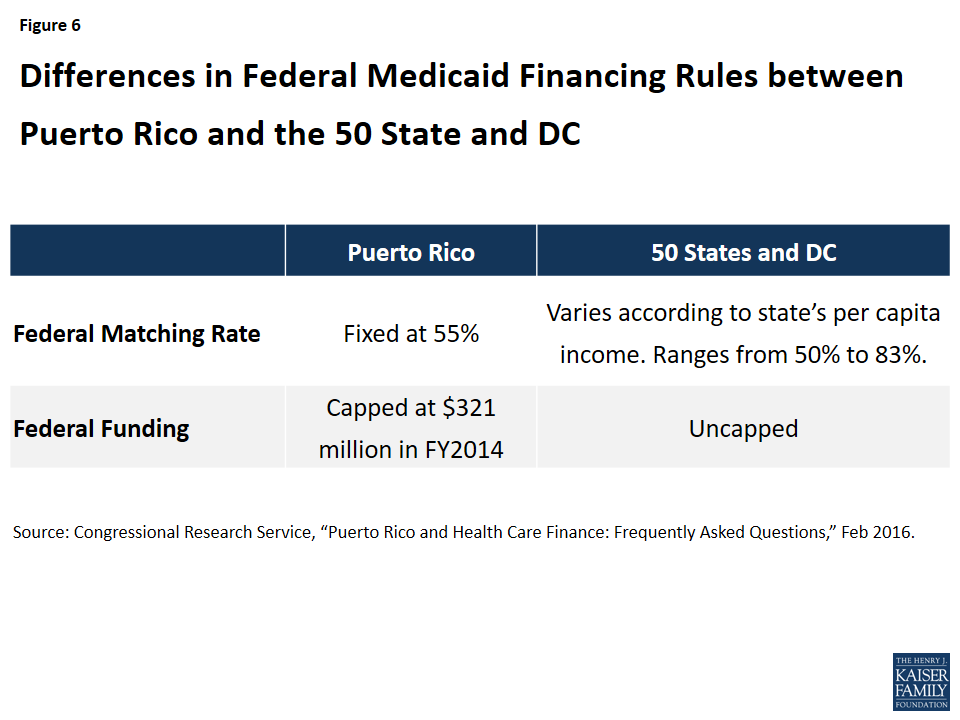
Figure 6: Differences in Federal Medicaid Financing Rules between Puerto Rico and the 50 State and DC
While Medicaid covers a large part of the Puerto Rican population, federal Medicaid funding to the island differs from that of the 50 states and DC in two important ways. While the latter receive a federal matching rate that ranges from 50%-83%, depending on the per capita income of the state in a given year, Puerto Rico’s federal matching rate is fixed at 55%. Moreover, unlike the 50 states and DC, Puerto Rico’s annual federal Medicaid allotment is capped, and the island generally exhausts its federal Medicaid allotment prior to the end of the fiscal year.14,15
Additionally, Medicare Advantage (MA) payment rates in Puerto Rico are substantially lower than that of the states,16 leading to lower reimbursement rates to providers and plans. CMS has issued a final rate notice for Medicare Advantage Payment Policies for CY 2017 that are expected to increase revenue for MA plans in Puerto Rico.17
7. What is the Breakdown of Puerto Rico’s Federal Medicaid Funding?
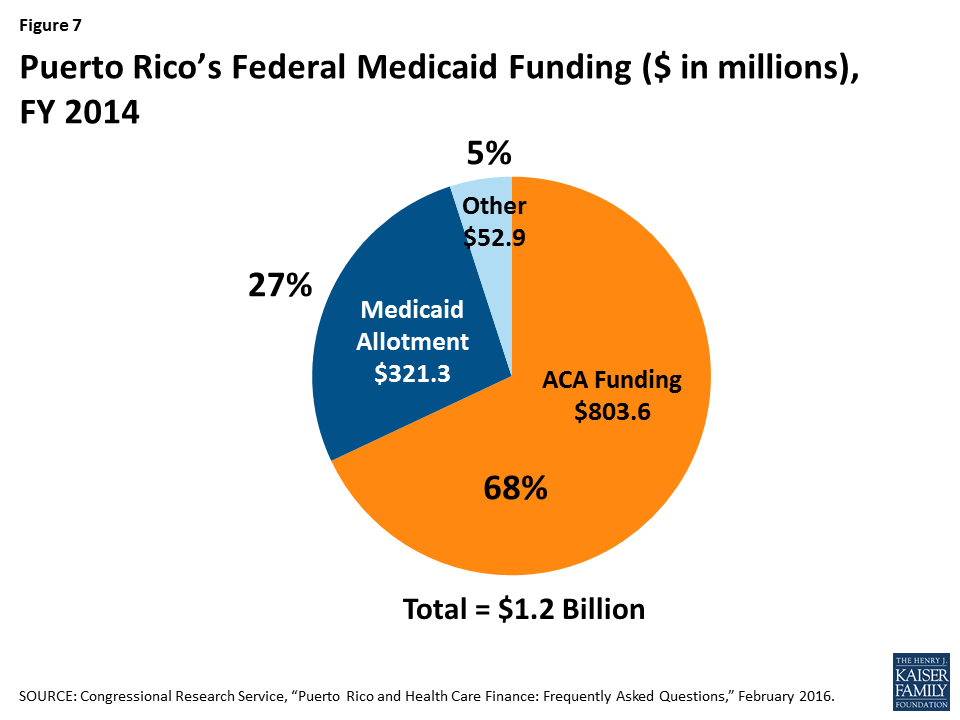
Figure 7: Puerto Rico’s Federal Medicaid Funding ($ in millions), FY 2014
The ACA made two temporary sources of Medicaid funding available to Puerto Rico in addition to its annual Medicaid cap. The first funding source is a $5.5 billion allotment available between July 2011 and September 2019. Puerto Rico has relied heavily on this allotment and in FY 2014, it made up 68% of total federal Medicaid funding to the territory. In that same fiscal year, Puerto Rico had used 42% of the $5.5 billion. The second source of funding was a $925 million allotment the island received in lieu of funds it would have received for creating its own Marketplace. These funds are also available through FY 2019 and can only be accessed after the first source of ACA funding has been depleted.18 Both sources of funding are estimated to be exhausted by the end of FY 2017.19 Absent reauthorization of ACA funds, Puerto Rico will face additional challenges financing its Medicaid program.
8. What Challenges is Puerto Rico’s Health Care System Facing?
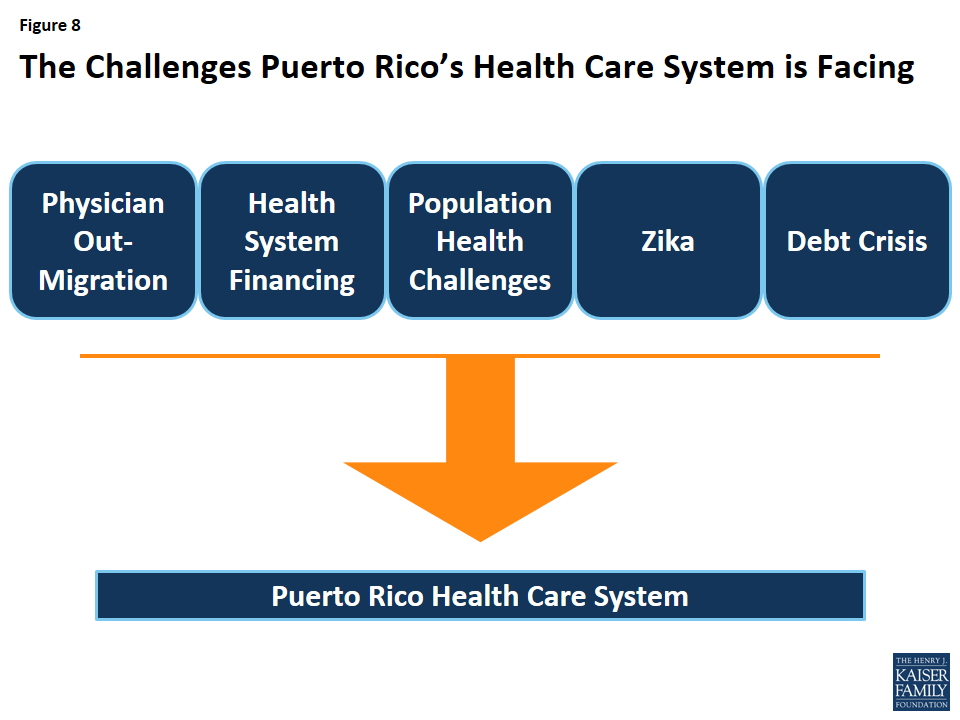
Figure 8: The Challenges Puerto Rico’s Health Care System is Facing
Puerto Rico’s health care system faces a number of challenges—as young people migrate to the U.S. mainland, seniors now make up a larger share of the population than they did a decade ago; health indicators are worse than that of the rest of the United States; the island’s public insurance system covers over half the population and faces financing challenges; and the number of Zika virus transmissions have increased substantially over the last few months, and are expected to continue. In addition, the island has experienced a substantial outmigration of physicians to the U.S. mainland, particularly among specialists and sub-specialists.20,21,22
The debt crisis is making it more difficult for the island to respond to these issues. Delayed payments by the government to Medicare and Medicaid managed care plans have caused a cascade of payment delays to medical providers and suppliers, and there have been reports of power and water shortages in hospitals, delays in the arrival of medical supplies, the laying off of hospital workers, and the closure of hospital floors and service areas. As the number of Zika cases mount, Puerto Rico’s health care system and economy is likely to face even greater challenges.23,24 ,25
After several months of congressional debate, the Puerto Rico rescue bill known as PROMESA was signed into law on June 30, 2016. The law places Puerto Rico’s fiscal affairs under a federal oversight board, allows for the restructuring of some of Puerto Rico’s debts, and includes a temporary stay on bondholder lawsuits.26 While the law represents a first step toward economic recovery, it does not address the critical issues facing Puerto Rico’s health care system, including the impending expiration of ACA funding, the limits imposed by the capped Medicaid financing structure, or the mounting cases and future consequences of Zika on the island.
The latest Kaiser Family Foundation/CNN partnership poll explores the views and experiences of white Americans without college degrees (a group defined in this survey as “working-class whites”), including how they feel about their own lives and the direction of the country, their attitudes towards government, their economic priorities, feelings about immigration and increasing racial and ethnic diversity, and personal experiences with employment and finances. It also compares this group’s attitudes and experiences with those of whites with college degrees, as well as those of blacks and Hispanics without college degrees (working-class blacks and Hispanics). Finally, the survey explores the views of different subgroups within the white working class, including variations by partisanship, age, income, region of the country, and religious identification.
The latest Kaiser Family Foundation/CNN partnership poll explores the views and experiences of white Americans without college degrees (a group defined in this survey as “working-class whites”1 ), including how they feel about their own lives and the direction of the country, their attitudes towards government, their economic priorities, feelings about immigration and increasing racial and ethnic diversity, and personal experiences with employment and finances. It also compares this group’s attitudes and experiences with those of whites with college degrees, as well as those of blacks and Hispanics without college degrees (working-class blacks and Hispanics). Finally, the survey explores the views of different subgroups within the white working class, including variations by partisanship, age, income, region of the country, and religious identification.
This report summarizes key findings from the survey, organized into four themes:
Conventional wisdom: Ways the poll findings confirm conventional wisdom about the white working class and areas where the results contradict the common narrative about this group;
Race versus class: Areas where whites without college degrees differ from and are similar to their working-class black and Hispanic counterparts;
Not a monolith: the most interesting subgroup differences in attitudes within the white working class; and
Politics and partisanship: Key findings related to the political alignments of the white working class and how they differ from white Americans with college degrees.
Summary of Findings: Section 1: Conventional Wisdom
Much has been studied and written about the white working class during the 2016 election season. In many ways, the findings from our survey confirm the findings from other studies, and conform to what has come to be “conventional wisdom” about the white working class:
This group is unhappy about the direction of the country overall. Over half (53 percent) are very dissatisfied with the country’s economic situation, 47 percent say America’s best days are behind us, and 50 percent expect their children to have a worse standard of living than they have now – all much higher than for college-educated whites 1.
The white working class is resentful of government and feels cut out of the political process. Two-thirds (68 percent) are dissatisfied with the influence people like them have on politics, 56 percent say the government in Washington does not represent their views well at all 2, and 62 percent say the federal government deserves all or most of the blame for the economic problems facing the working-class 3.
Whites without a college degree are nervous about cultural changes taking place in the United States. About two-thirds (65 percent) say Christian values are under attack, and almost four in ten (38 percent) say increasing racial and ethnic diversity is harmful because “some people feel like they no longer belong” 4.
This group has a more negative view of immigrants and immigration than other groups. Almost half (47 percent) see immigrants as a burden on the country, and 55 percent say the government should attempt to deport all people living in the country illegally 5. Over six in ten (63 percent) say that immigrants from Muslim countries increase the risk of terrorist attacks, and about half say that Latin American immigrants add to the crime problem and take jobs away from Americans – much higher than for other groups 6.
Working-class white voters are a base of support for Donald Trump – six in ten say they would consider voting for him, compared with four in ten (39 percent) college-educated white voters and much smaller shares of black and Hispanic voters without college degrees 7. Two-thirds (68 percent) of working-class white voters say they would definitely not vote for Hillary Clinton, while half of college-educated whites and large majorities of working-class black and Hispanic voters say they’d consider voting for her 8.
In other ways, the survey findings run counter to the prevailing narrative about this group:
Personally, things appear to be going well for the white working class. A large majority – 76 percent – say they are optimistic about how things are going in their own lives, and only 18 percent say they are angry 9. Nearly two-thirds (63 percent) are satisfied with their own personal financial situation 10.
Most working-age whites without college degrees are employed in secure jobs. Seventy-two percent of those ages 18-64 are employed either full- or part-time. More than three-quarters (77 percent) of those who are working feel their job is secure 11. More than four in ten (42 percent) of those under age 65 say they or someone in their household received a raise or a promotion in the past year 12.
Trade is not a major driving issue for working-class whites. While seven in ten (69 percent) feel that trade agreements with other countries has cost the U.S. jobs, just 12 percent pick trade as the top economic issue for the next president to address, ranking behind the availability of good jobs, the income gap between the rich and poor, and taxes 13.
Working-class whites are no more likely than whites with college degrees to report experiences with addiction. Thirty-one percent say someone close to them has been addicted to alcohol, prescription painkillers, or illegal drugs, almost identical to the share among whites with college degrees 14.
Summary of Findings: Section 2: Race Versus Class
The survey reveals some differences between working-class whites and their black and Hispanic counterparts in some experiences and attitudes:
Compared with working-class blacks and Hispanics, working-class whites are less likely to see their lack of a college degree as a barrier. Half (51 percent) say their life would be no different if they had a 4-year college degree, while about three-quarters of working-class blacks (73 percent) and Hispanics (74 percent) believe having a degree would make their lives better 1.
Whites without college degrees differ from their black and Hispanic counterparts in their employment and housing situations. Among those of working age, just 14 percent of whites without college degrees are un- or under-employed, compared with 31 percent of working-class blacks and 22 percent of working-class Hispanics 2. Further, two-thirds (67 percent) of working-class whites say they are homeowners (including those who say they’re paying off a mortgage), about double the 32 percent of working-class blacks and 36 percent of working-class Hispanics who say they own homes 3.
Whites without college degrees are less optimistic about their children’s future than their black and Hispanic counterparts; 23 percent expect their children to have a better standard of living than their own, compared with 36 percent of working-class blacks and 48 percent of working-class Hispanics 4.
Attitudes towards immigration and trade differ by race within the working-class. Nearly half (47 percent) of working-class whites see immigrants as a burden on our country, while majorities of working-class blacks (57 percent) and Hispanics (74 percent) say they strengthen the country 5. On international trade, working-class whites (69 percent) are almost twice as likely as working-class blacks (37 percent) and Hispanics (37 percent) to think that trade agreements with other countries have cost the U.S. jobs 6.
Some of these differences are driven by partisanship; working-class whites are much more likely than working-class blacks or Hispanics to identify as Republicans (34 percent versus 3 percent and 11 percent, respectively), and much less likely to identify as Democrats (22 percent versus 63 percent and 42 percent) 7.
However, it also reveals many ways in which these three groups report similar attitudes and experiences:
Majorities of working-class whites (53 percent), blacks (74 percent), and Hispanics (61 percent) say the government doesn’t do enough to help “people like you,” while most college-educated whites (60 percent) say it does about the right amount 8.
Majorities of working-class people across racial lines say it’s becoming harder for people like them to get ahead financially, find good jobs, own a home or have a secure retirement (though working-class blacks are less likely than whites to say it’s gotten harder to afford health care or get a good education) 9.
Many working-class whites, blacks, and Hispanics report making various sacrifices in the past year to make ends meet. About half of whites and Hispanics in this group, and two-thirds of blacks say they’ve taken on an extra job or worked extra hours, and nearly as many say they’ve postponed medical or dental care. About four in ten working-class whites and blacks (along with a quarter of Hispanics) say they’ve unexpectedly taken money out of long-term savings, and about 3 in 10 in each group say they’ve increased their credit card debt. One notable difference: working-class blacks stand out as more likely than either whites or Hispanics in saying that they’ve borrowed money from friends or family in the past year 10.
Still, the vast majority of working-class whites, blacks, and Hispanics, say they feel happy and optimistic about how things are going in their own lives 11.
Summary of Findings: Section 3: Not A Monolith
White Americans without college degrees are not a monolithic group in terms of their attitudes and experiences. Below are a few subgroup findings that illustrate some of the nuances within this group.
On the direction of the country:
While working-class whites as a whole are split on whether America’s best days are ahead or behind, some groups stand out as more likely than others to see the country’s best days ahead (Democrats, those with higher incomes, those living in urban areas, and those with no religious preference), while others stand out as more likely to believe the best days are in the past (Republicans, Evangelical Christians, those living in rural areas, and those with lower incomes) 1.
Other groups are also more likely to believe America’s best days are behind us, including those who see immigrants as a burden on the country (61 percent), and those who say someone in their household has lost a job or had work hours reduced in the last year (57 percent) 2.
Views on the future also differ by age; about a third of those under age 30 expect their children to have a worse standard of living than they do now, compared with half or more in older age groups 3.
On views of government:
Views of whether the federal government is doing enough to help “people like you” are strongly correlated with income; 69 percent of those with household incomes less than $30,000 say the government doesn’t do enough, more than twice the share of those earning $75,000 or more (31 percent) 4.
Perhaps corresponding with this income difference, those who report that their household received at least one government benefit in the past year (excluding Medicare and Social Security, which are provided nearly universally to seniors), are more likely than those who receive no benefits to say the government doesn’t do enough to help people like them (63 percent versus 47 percent) 5.
Rural working-class whites are more likely than those living in urban areas to say the federal government does not represent the views of people like them well at all (64 percent versus 52 percent) and that the government deserves all or most of the blame for the economic problems facing the working-class (71 percent versus 51 percent) 6.
On cultural change, immigration, and increasing diversity:
Views on cultural changes vary among working-class whites by religious identification. For example, 89 percent of working-class whites who are Evangelical Christians believe Christian values are under attack in America today, compared with 73 percent of mainline Protestants, 61 percent of Catholics, and 41 percent of those with no religious preference. Similarly, 48 percent of Evangelical Christians say increasing diversity is threatening American culture, compared with 39 percent of mainline Protestants, 28 percent of Catholics, and 19 percent of those with no religious preference 7.
Views on cultural changes also vary by age; 73 percent of 18-29 year-old working-class whites say that increasing racial and ethnic diversity is enriching American culture, a figure that stands at 51 percent among those ages 65 and over 8.
There are also variations within working-class whites’ views on immigration; 61 percent of rural working-class whites say the government should attempt to deport all people living in the United States illegally, while about half (49 percent) of urban working-class whites agree 9.
Working-class whites in the South are about twice as likely as those in other regions to say they’ve personally been negatively impacted by illegal immigrants taking jobs in their community (40 percent versus between 18 to 22 percent in other regions) 10.
On their personal lives:
Almost half (45 percent) of working-class whites with household incomes under $30,000 say they are worried about how things are going in their own lives, compared with just 30 percent of those with incomes of at least $75,000 11.
One quarter (25 percent) of working-class whites in the South do not have health insurance, compared with between 5 and 10 percent in other regions 12.
On politics:
Besides the obvious partisan differences in candidate support, there are also correlations between working-class whites’ attitudes and their level of support for presidential candidates. For example, 84 percent of working-class white voters who see increasing racial and ethnic diversity as a threat to US culture say they would consider voting for Donald Trump, compared with 45 percent of those who say diversity enriches the culture. Similarly, 78 percent of working-class white voters who say immigrants are a burden on the country say they would consider voting for Trump, compared with 38 percent of those who believe immigrants strengthen the country 13.
Summary of Findings: Section 4: Politics And Partisanship
The survey reveals some large partisan gaps within the white working class, but also some areas where the attitudes of white partisans without college degrees differ sharply from their college-educated counterparts.
Politically, whites without a college degree are about as likely as college-educated whites to identify as Republicans (34 percent versus 31 percent), but much less likely to identify as Democrats (22 percent versus 35 percent]. Four in ten working-class whites (42 percent) identify as conservative, while just 18 percent call themselves liberal 1.
Among working-class whites, Republicans are much more likely than Democrats to say America’s best days are behind us (59 percent versus 25 percent), that they’re very dissatisfied with the country’s economic situation (62 percent versus 37 percent), and that they expect their children to have a worse standard of living than they do now (64 percent versus 33 percent) 2.
Partisanship sharply divides what members of this group see as the top economic issue for the next president to address. Among Democrats in this group, 40 percent say the income gap between the rich and poor, 33 percent say the availability of good paying jobs, 10 percent say taxes, a scant 6 percent say trade and almost none cite government regulation of business. For Republicans in this group, jobs rank first (32 percent), followed by taxes (21 percent), with 13 percent pointing to trade, 12 percent to regulation and just 8 percent to the income gap 3.
When asked about increasing racial and ethnic diversity generally and immigration specifically, there is a partisan gap among working-class whites. However, both Democrats and Republicans in this group tend to see those changes as more negative/threatening than do their college-educated counterparts. For example, the poll reveals a divide on whether immigrants to the U.S. strengthen or burden the country, with white working class Republicans most apt to see them as a burden (62 percent), 22 percentage points higher than among white Republicans with college degrees (40 percent]. Meanwhile, working-class white Democrats are almost 30 points more apt than college-grad white Democrats to say the same (35 percent versus 6 percent) 4.
Having a college degree seems to play a bigger role than partisanship in people’s assessments of whether the federal government is doing enough to help people like them. About half of working-class white Democrats (55 percent) and Republicans (52 percent) say the federal government isn’t doing enough for “people like you,” while both Democrats and Republicans with college degrees are far less likely to say the same (26 percent and 30 percent, respectively) 5.
There are some signs in the poll that white Democrats without college degrees are not as unified behind the Democratic Party as are Democrats with college degrees. For example, 22 percent of self-identified Democrats who are working-class white voters say they would consider voting for Donald Trump, versus just 2 percent of white Democrats with college degrees 6. And fully 23 percent of this group of Democrats say they would definitely not vote for Hillary Clinton, well above the 3 percent of white Democrats with college degrees who say the same. Republicans are more unified across this educational divide 7.
More than 4 in 10 working-class white Democrats (44 percent) say Christian values are under attack in America today, compared with just 13 percent of white college-grad Democrats. More than 8 in 10 white Republicans say the same, regardless of education level 8.
While white working class Democrats express mostly positive impressions of immigrants from Muslim and Latin American countries, they are considerably more likely than college-educated white Democrats to express skepticism of these immigrants. For example, 47 percent of white working class Democrats say immigrants from Muslim countries increase the risk of terrorist attacks in the U.S., compared with just 16 percent of college-educated white Democrats. And white working class Democrats are more than twice as likely as college-educated white Democrats to say immigrants from Latin American countries add to the crime problem (37 percent versus 14 percent), and more than three times as likely to say these immigrants take jobs away from Americans (39 percent versus 11 percent) 9.
Methodology
The Kaiser Family Foundation/CNN Working-Class Whites Poll was conducted August 9-September 5, 2016, among a nationally representative random digit dial (RDD) telephone sample of 1,614 adults ages 18 and older, living in the United States, including Alaska and Hawaii (Note: persons without a telephone could not be included in the random selection process). Computer-assisted telephone interviews conducted by landline (471) and cell phone (1,143, including 716 who had no landline telephone) were carried out in English and Spanish by SSRS. CNN and the Kaiser Family Foundation both contributed financing for the survey, and teams from both organizations worked together to develop the survey questionnaire and analyze the data. Each organization is responsible for its content.
For the purposes of this poll, “working-class�� is defined as those who have attained less than a four-year college degree, excluding those between the ages of 18-24 who are currently enrolled in school. “College graduates” includes those who have attained at least a four-year degree. To ensure there were enough respondents to capture the views and experiences of working-class whites, blacks, and Hispanics, the full sample includes additional interviews with randomly selected respondents from these groups (commonly referred to as an “oversample”), for a total of 701 working-class whites, 129 working-class blacks, and 136 working-class Hispanics. Results for all groups have been adjusted to reflect their actual national distribution (See weighting description below). The sample plan consisted of three elements: 1) respondents reached by RDD to landline telephones or cell phones (1098 total, including 385 working-class whites, 70 working-class blacks, 99 working-class Hispanics, and 329 whites with four-year college degrees); 2) respondents reached by RDD to landlines or cell phones within Census blocks with an estimated large share of white individuals with less than a college degree (294 total, including 181 working-class whites, 7 working-class blacks, 2 working-class Hispanics, and 77 whites with four-year college degrees), and 3) prescreened respondents reached by calling back phone numbers where respondents previously interviewed for other RDD surveys indicated that they had no college degree and were white (135), black (52), or Hispanic (35). Both the RDD landline and cell phone samples were provided by Marketing Systems Group (MSG).
To randomly select a household member for the landline samples, respondents were selected by asking for the adult male or female currently at home who had the most recent birthday based on a random rotation. If no one of that gender was available, interviewers asked to speak with the adult of the opposite gender who had the most recent birthday. For the cell phone samples, interviews were conducted with the adult who answered the phone.
A multi-stage weighting process was applied to ensure an accurate representation of the national adult population. The first stage of weighting involved corrections for sample design, including a correction for oversampling, the likelihood of non-response for the prescreened sample, and an adjustment to account for the fact that respondents with both a landline and cell phone have a higher probability of selection. The second weighting stage was conducted for working-class whites and for all other respondents separately, weighting to match estimates for the national population using data from the Census Bureau’s 2015 March supplement of the Current Population Survey (CPS). In addition, the distribution of phone use was estimated based on each group’s weighted phone use distribution as captured in the past year on the SSRS Omnibus poll, a weekly, nationally representative RDD landline and cell phone survey. The weighting parameters used were age, gender, race/ethnicity (for the non-working-class white sample), nativity (for Hispanic respondents only), education, marital status, census region, population density of the respondents’ county, and telephone use. In the final weighting stage, each group (working-class whites, all others) was weighted to reflect its actual share in the U.S. adult population. All statistical tests of significance account for the effect of weighting.
The margin of sampling error including the design effect for the full sample is plus or minus 3 percentage points. Numbers of respondents and margins of sampling error for key subgroups are shown in the table below. For results based on other subgroups, the margin of sampling error may be higher. Sample sizes and margins of sampling error for other subgroups are available by request. Note that sampling error is only one of many potential sources of error in this or any other public opinion poll. Kaiser Family Foundation public opinion and survey research is a charter member of the Transparency Initiative of the American Association for Public Opinion Research.
Group
N (unweighted)
MOSE
Total
1614
+/-3 percentage points
White Working Class
701
+/-5 percentage points
White College Graduates
406
+/-6 percentage points
Black Working Class
129
+/-10 percentage points
Hispanic Working Class
136
+/-9 percentage points
Total Registered Voters (RV)
1364
+/-3 percentage points
White Working Class RV
602
+/-5 percentage points
White College Graduate RV
377
+/-6 percentage points
Black Working Class RV
105
+/-11 percentage points
Hispanic Working Class RV
96
+/-11 percentage points
The full KFF/CNN poll results are representative of the U.S. adult population, including people of all races. The reported results focus on the total sample, reflective of all adult people in the U.S., as well as whites without college degrees, blacks without college degrees, Hispanics without college degrees, and whites who have graduated from college. While the responses for some smaller groups of the US population, for example, Asian-Americans and people of mixed race, are counted in the “total” poll responses, the number of respondents who identify as Asian or as mixed race was too small to report separately, since the margin of sampling error around any poll result from these subgroups would be so large that the result would be unreliable and potentially misleading.
Endnotes
For purposes of this survey, we excluded from the “working-class” definition those adults between the ages of 18-24 who are currently enrolled in school. ↩︎
In January, 2014, Ohio implemented a traditional Medicaid expansion, according to the terms set out in the Affordable Care Act. Subsequently, the operating budget passed by the state legislature in June, 2015 required Ohio to seek specific changes to its existing expansion by applying for a Section 1115 demonstration waiver. On June 15, 2016, the state submitted its waiver proposal, called the Healthy Ohio Program, to the Centers for Medicare and Medicaid Services (CMS), and on September 9, 2016, CMS denied the waiver application.
This is the first time that CMS considered a waiver application in a state that already had implemented a traditional expansion and the first time that CMS has denied a Medicaid expansion waiver application. Waiver applications in other states that already have implemented traditional expansions (Arizona and Kentucky) remain pending with CMS. CMS’s decision about Ohio’s waiver application may offer insights into how the agency might respond to similar requests from other states.
Ohio’s proposed waiver asked for authority to implement a number of changes that would have altered the terms of coverage for Medicaid expansion adults as well as some traditional Medicaid adults, such as non-expansion parents and pregnant women. Specifically, Ohio’s proposal would have:
Created health savings accounts, which would have been used to pay a $1,000 annual deductible (funded by the state) and copayments at maximum state plan amounts (funded by beneficiary contributions);
Imposed monthly premiums, equal to the lesser of 2 percent of annual income or $99 per year, as a condition of eligibility for all beneficiaries except pregnant women and those with zero income;
Conditioned the start of coverage on payment of the first monthly premium;
Disenrolled beneficiaries from coverage for failing to pay monthly premiums or for failing to provide requested renewal documentation after 60 days;
Established a healthy behavior program; and
Referred all beneficiaries working fewer than 20 hours per week to a workforce development agency.
Ohio also sought to waive the statutory obligation to provide a fair hearing to people who were never enrolled in coverage due to non-payment of their initial monthly premium or who were disenrolled from coverage due to non-payment of subsequent premiums. The fair hearing provision has never been waived by CMS. Additionally, fair hearings are required by the Due Process Clause of the U.S. Constitution, which is outside the Secretary’s Section 1115 waiver authority.
Ohio also proposed to increase copayments for expansion and traditional adults affected by the waiver to the maximum amounts allowable under federal law; such increases do not require waiver authority to implement.
CMS noted that Ohio’s existing traditional expansion has been successful and that the state’s waiver application estimated that policy changes under the proposal “would lead to over 125,000 people losing coverage each year” compared to the current expansion. Since affordable coverage options became available through the Medicaid expansion and the Marketplace, Ohio’s nonelderly adult uninsured rate fell from 16.3% in 2013 to 9.3% in 2015, and over 607,000 adults in Ohio have obtained coverage through the Medicaid expansion as of December 2015.
While Section 1115 waivers typically involve negotiation between CMS and the state, Ohio’s waiver application indicated that it was unable to modify its terms due to the state law that required it to seek the waiver. Similarly, the state indicated that it could not change the proposal in response to public comments. The state reported that 84% of the public comments it received indicated that the waiver would be unaffordable for beneficiaries, and 72% indicated that the waiver would result in decreased enrollment. State level public comment also noted the program’s complexity, with 65% indicating that the program would be too complex for beneficiaries, 55% indicating that the program would be administratively complex for the state and health plans, and 53% indicating that the program would be administratively burdensome for providers. The waiver application indicated that only 1% of state level public comments received supported the proposal.
Table 1 describes the major elements of Ohio’s proposed Section 1115 demonstration as submitted to and denied by CMS.
Would have modified the state’s existing Medicaid program for both expansion adults and traditional adults by:
Creating health savings accounts with 2 components: (1) core funds comprised of monthly beneficiary contributions and incentive dollars earned by completing healthy behaviors, which would be used to fund copayments and additional services not covered by Medicaid; and (2) non-core funds consisting of a state-funded annual deductible, which would be used to pay the first $1,000 of Medicaid-covered services;
Imposing monthly contributions equal to the lesser of 2 percent of income or $99 per year as a condition of eligibility for all beneficiaries except pregnant women and those with zero income;
Conditioning the start of coverage on payment of the first monthly contribution;
Disenrolling beneficiaries from coverage for non-payment of monthly contributions or failing to provide requested renewal documentation after 60 days;
Establishing a healthy behavior program that would allow beneficiaries to earn health savings account dollars to fund copayments or medically necessary services that are not covered by Medicaid;
Allowing beneficiaries to carry forward any monthly contributions remaining in their health savings account to reduce the next year’s required contributions, and any remaining healthy behavior rewards and deductible funds if certain preventive services are received;
Allowing beneficiaries who lose eligibility due to increased income to transfer remaining health savings account funds into another account to pay private health insurance premiums and cost-sharing; and
Referring all beneficiaries working fewer than 20 hours per week to a workforce development agency.
Duration:
Requested 5 year approval from January 1, 2018 to December 31, 2022.
Coverage Groups Required to Enroll in Waiver:
Would have included all adult Medicaid beneficiaries age 18 and older who qualify for the ACA’s Medicaid expansion and those who qualify through other poverty-related pathways, including Section 1931 parent/caretakers; Transitional Medical Assistance; 18, 19 and 20 year olds; pregnant women; Title IV-E 18 year olds; former foster care youth ages 18 to 26; and breast/cervical cancer beneficiaries. These beneficiaries must have enrolled in Healthy Ohio even if they also qualify for home and community-based waiver services.
Monthly Contributions:
Would have imposed monthly contributions for all beneficiaries (except pregnant women and those with zero income) equal to the lesser of 2 percent of annual household income or $99 per year (up to $8.25 per month).
Beneficiaries would have accrued debt for any months in which they received coverage but failed to make a monthly contribution.
Employers could have contributed up to 50% of a beneficiary’s required contributions, and not-for-profit organizations could have contributed up to 75%; however, beneficiaries must have paid at least 25% of the total required contribution.
Effective Coverage Date:
Would have conditioned the start of coverage on payment of the initial monthly contribution, with coverage effective the first day of the month in which the payment is made instead of the application date. Coverage for pregnant women and individuals with no income would have begun on the first day of the month in which their application was approved.
Also would have waived 3 months retroactive coverage for most adults (except pregnant women).
Disenrollment for Failure to Provide Renewal Documents:
Would have disenrolled beneficiaries who did not submit requested documentation to renew coverage within 61 days. Individuals could have re-enrolled if they did not have outstanding debt from unpaid monthly contributions.
Disenrollment for Failure to Make Monthly Contributions:
Monthly health savings account contributions would have been a condition of eligibility, and beneficiaries who did not pay within 60 days will be dis-enrolled. Individuals could have re-enrolled only after paying debt owed.
Health Savings Accounts:
Beneficiary/core portion of account: Beneficiaries’ required monthly contributions (described above) would have gone into the core portion of the account and would have been used for copays and medically necessary services not included in the Medicaid benefit package. These contributions would have belonged to the beneficiary and would have been refunded upon termination from waiver coverage (or if eligible, transferred to a Bridge Account, as described below). Any dollars earned from healthy behavior incentives (described below) also would have gone into the core portion of the account.
State/non-core portion of account: The state would have contributed $1000 annually to the non-core portion of the account to fund initial healthcare expenses, similar to a deductible, until these funds were depleted.
MCO account contributions: MCOs could have contributed to beneficiary health savings accounts to pay the cost of participation in health-related incentive programs, such as smoking cessation or weight loss.
Account statements: Beneficiaries would have received monthly account statements showing their account activity, balances, and contributions.
Account roll-over funds to reduce future monthly contributions: Beneficiaries could have carried forward any remaining funds from beneficiary or third party monthly contributions in the core portion of their account to the next year, which could have been used to reduce or eliminate future monthly contributions. The total account value, including any roll-over funds, is limited to $10,000.
Co-Payments:
Copayments would have been at maximum state plan amounts and would have been paid at the point of service from the core portion of the health savings account via an MCO-issued debit card. Pregnant women were exempt from copayments. Copayments would have been waived once funds in the core portion of the beneficiary’s health savings account (from monthly contributions and healthy behavior incentives) was exhausted.
Healthy Behavior Program:
Healthy behavior incentive points and activities: Beneficiaries could have earned up to 320 points per year in the core portion of their health savings account for achieving specific healthcare goals or benchmarks. Each point would have been equivalent to one dollar. Providers could have awarded up to 100 points, and the state could have awarded up to 200 points. Standards for awarding healthy behavior points would have been further detailed prior to waiver implementation and may have included completion of a smoking cessation or weight management program, adherence to a prescription drug regimen, or other activities. In addition, beneficiaries who established an electronic funds transfer (EFT) to automatically make their monthly account contributions could have earned 20 points; however, these points would have been deducted if the beneficiary terminated the EFT.
Use of healthy behavior incentive funds: Like monthly account contributions, funds earned by healthy behavior points could have been used for copayments or qualifying medically necessary services that are not covered by Medicaid, such as over-the-counter medications. Such additional services would have been defined annually by the state.
Account roll-over funds for completing preventive care: Beneficiaries who obtained recommended preventive services could have carried forward all remaining health savings account funds, including any core funds from healthy incentive points and any non-core balance from the state-contributed deductible, to the following year. Carried over core funds (healthy behavior incentives) could have been used to reduce future monthly contributions. Carried over non-core (deductible) funds would have been added to the following year’s deductible funds. Specific preventive services would have been determined by the state annually based on CDC recommendations. (As described above, beneficiaries could have carried forward any core account funds remaining from monthly contributions to reduce future contributions regardless of whether preventive services were completed.)
Bridge Account:
Beneficiaries who left Medicaid as a result of increased income could have transferred their entire health savings account balance (core and non-core funds) into a Bridge Account, which could have been used to pay premiums and cost-sharing for employer-sponsored or individual market private insurance.
Those who regained Healthy Ohio eligibility before exhausting their Bridge Account would have had the balance transferred back to a health savings account under the waiver.
Delivery System:
Benefits would have been delivered through a statewide mandatory capitated managed care program under § 1115 authority, which would have been separate from the state’s existing § 1915(b) managed care system for other coverage groups. Would have offered choice of at least 2 MCOs per region.
Benefits:
Expansion adults would have continued to receive an alternative benefit plan that contained the same benefits as the Medicaid state plan; however, expansion adults would have continued to be exempt from the state plan limits on mental health and long-term care services.
Traditional adults would have continued to receive the Medicaid state plan benefit package, which includes limits on mental health services and 90 days of long-term care coverage (after which they would have transferred to fee-for-service Medicaid).
Behavioral health services (which are carved out of the state’s existing managed care program) would have been included in the MCO benefit package under the waiver. Home and community-based waiver services would continue to have been carved out of managed care and paid fee-for-service.
Annual and Lifetime Limit:
After the non-core health savings account funds ($1,000 state-funded annual deductible) was depleted, MCOs would have been responsible for covered benefits up to $300,000 per year and $1,000,000 per lifetime. Beneficiaries who exceeded these limits would have been transferred to the state’s fee-for-service or traditional Medicaid managed care delivery systems.
Work Referral:
Would have referred all beneficiaries who work less than 20 hours per week to a workforce development agency; however, work would not have been required as a condition of Medicaid eligibility.
Financing:
The state anticipated that the waiver would have met budget neutrality requirements and saved $995 million over the five year demonstration period. Compared to the without waiver estimates, the per member per month costs per coverage group under the waiver would have been greater, but there would have been fewer eligible member months.
Status:
CMS denied the waiver application on September 9, 2016.
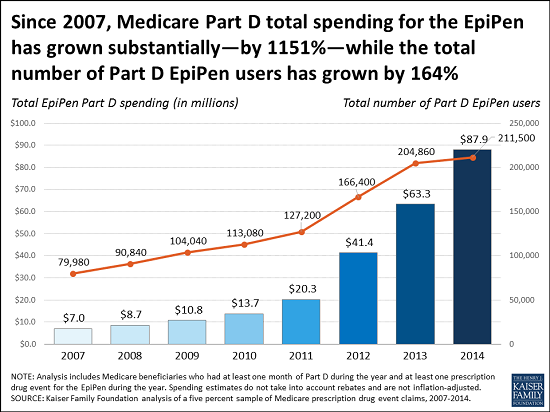
As policymakers in Washington scrutinize the rising cost of the EpiPen auto-injector, a new analysis from the Kaiser Family Foundation shows that Medicare Part D spending for the potentially life-saving device increased by more than 1000 percent between 2007, the year after the Part D drug benefit took effect, and 2014, the most recent year for which data are available. The higher spending partly results from more Part D enrollees using EpiPens during that period, but is primarily driven by a five-fold increase in average Medicare per-prescription spending on the EpiPen, up from $71 in 2007 to $344 in 2014. The analysis illustrates that rising prices for the EpiPen affect public programs and taxpayers, as well as consumers and private insurers.
Annual rates of growth for Part D EpiPen spending per prescription were significantly higher each year than growth in average per capita costs for the Medicare drug benefit overall and the growth in medical care prices overall. Total Medicare Part D spending for the EpiPen is based on Medicare claims data, unadjusted for rebates, because drug-specific rebates between manufacturers and plans are not disclosed. The analysis also illustrates the potential effect of rebates using average rebate amounts for all Part D drugs, from the Medicare’s actuaries. The estimates suggest that even if total Part D spending for the EpiPen was lower each year as a result of rebates, we would still expect to see a similar trend in the rate of Medicare Part D spending growth for the EpiPen.
New KFF/CNN Survey Finds Majority of Working-Class White Americans Optimistic About Their Own Lives, But Many Are Unhappy with the Direction of the Country
As the 2016 presidential election focuses attention on the perspectives of white Americans without college degrees, a new survey from the Kaiser Family Foundation and CNN delves deeply into the views and experiences that shape their lives and their political leanings.
CNN is featuring findings from the poll in digital and on-air reports throughout this week, including in tonight’s edition of Anderson Cooper 360 at 8 p.m. Eastern Standard Time.
The survey finds the majority of working-class whites say they are optimistic about how things are going in their own lives and are satisfied with their own personal financial situation. However, over half are very dissatisfied with the economic situation in the United States, and almost as many say America’s best days are behind us.
Other topics in the survey include personal experiences of working-class white Americans and their attitudes on broader issues, such as their satisfaction with government, economic priorities, immigration, and increasing racial and ethnic diversity.
The poll also compares this group’s views to those of college-educated whites and working-class blacks and Hispanics, and it details important divides in attitudes and experiences among working-class whites, noting differences by party affiliation, age, income, religion, region of the country, and whether they live in an urban or rural area.
Detailed results for select questions can be found here and the Foundation will post a full report on survey findings in the next few days.
Teams from the Foundation and CNN worked together to develop the questionnaire and analyze the data. Each organization is solely responsible for the content it publishes based on the data. The survey was conducted from Aug. 9-Sept. 5 among a nationally representative random digit dial telephone sample of 1,614 adults, including 701 working-class whites (defined for this poll as whites without 4-year college degrees). Interviews were conducted in English and Spanish by landline (471) and cell phone (1,143). The margin of sampling error is plus or minus 5 percentage points for results based on working-class whites.
With three years of expanded coverage under the ACA in place, many states have shifted focus from outreach and enrollment to strengthening delivery systems and enhancing access to care to meet the needs of their growing covered populations. Based on case studies and focus groups, this brief reviews delivery systems and access to care for Medicaid enrollees in Colorado, Connecticut, Kentucky, and Washington as of Spring 2016. Each of these states expanded Medicaid and experienced large gains in Medicaid enrollment. The findings provide an on-the-ground view of Medicaid delivery systems and enrollees’ experiences accessing care three years after implementation of the Medicaid expansion. This brief builds on previous reports that examined states’ preparation for implementation prior to the initial ACA open enrollment period and their experiences after completion of the first and second open enrollment periods. Together, this work provides an in-depth understanding of ACA implementation from multiple perspectives, tracking and documenting experiences that may help shape efforts moving forward. Key findings from this brief include the following:
The study states use varied models to deliver care to Medicaid enrollees. Kentucky and Washington provide care through Medicaid managed care plans, while Connecticut and Colorado rely on fee-for-service models. Connecticut administers services through four administrative services organizations (ASOs) for medical services, behavioral health, dental care, and non-emergency transportation.
While the Medicaid delivery systems vary across the study states, they all have features to coordinate care and provide targeted case management to high-risk individuals. These include connecting individuals to medical homes, linking individuals to other services to address their broad needs, and utilizing care managers to help reduce emergency department use. Colorado and Washington are using regional approaches to coordinate care. In Colorado, most enrollees receive care on a fee-for-service basis, but enroll in one of seven Regional Care Collaborative Organizations (RCCOs). The RCCOs are designed to connect enrollees to Medicaid providers, including a primary care provider to serve as their medical home, and social services and to coordinate their care. In Washington, regional Accountable Communities of Health (ACHs) work in tandem with the managed care plans to identify regional priorities, coordinate activities, and distribute funds to help integrate health care and social services and improve population health.
Overall, stakeholders and focus group respondents report Medicaid enrollees in the study states have generally good access to primary and specialty care, although there are some access challenges. Stakeholders, focus group respondents, and state data suggest that enrollees generally are accessing needed services, including primary and preventive care as well as most specialty services and prescription drugs. Stakeholders also indicated that Medicaid expansion has significantly increased individuals’ access to specialty care, since many individuals were unable to access specialty services while uninsured. However, they also point to some access challenges, including limited availability of providers and inaccurate provider directories. Some of these challenges reflect limited provider participation in Medicaid, while others are access challenges that extend beyond Medicaid, such as overall provider shortages in rural areas. Stakeholders also pointed to the importance of being able to measure and monitor access over time.
Enrollees appear to face particular challenges accessing dental and behavioral health services. All four study states provide adult dental benefits. Focus group respondents indicated that they highly value this coverage and many had obtained services, including cleanings, fillings, and extractions. However, respondents and stakeholders identified some challenges accessing dental care, including limited availability of dentists accepting Medicaid patients and long waits for appointments. Focus group respondents and stakeholders also pointed to challenges accessing behavioral health services. Stakeholders indicated a need for additional behavioral health providers, particularly addiction treatment providers given the current heroin and opioid addiction crisis.
The study states have pursued initiatives to increase provider participation in Medicaid. Connecticut moved to streamlined, statewide policies, including a statewide fee schedule and drug formulary, and bi-weekly provider payments, which state officials believe helped increase provider participation. It also extended the temporary increase in primary care rates established under the ACA. Colorado also maintained the temporary primary care rate increase, and state officials noted that they are conducting a broader review of provider rates. Colorado is also working to expand capacity in rural areas by enabling primary care providers to consult electronically with specialists. In 2014, Kentucky expanded access to behavioral health providers by allowing Medicaid to contract with individual providers (rather than through community mental health centers), creating additional provider types (such as licensed drug and alcohol counselors), and adding coverage of additional behavioral health services to Medicaid. Washington has sought to ensure provider participation by adopting strong network adequacy standards for managed care plans.
Community health centers (CHCs) in the study states reported they have made a variety of investments to expand access to care, in part, due to enhanced revenues from the Medicaid expansion. However, some respondents cited challenges to meeting increased demands for care and continued growth, including increasing competitive pressures for clinical staff and a need for funding to support capital development.
Looking ahead, the states are pursuing changes to their Medicaid delivery systems. The Governor in Kentucky is seeking to make changes to its Medicaid program under a waiver, which may affect enrollment and access to care moving forward. Connecticut, Colorado, and Washington are pursing initiatives to transform their health care delivery systems, including Medicaid, with a focus on integrating physical and behavioral health care, adopting new payment models, and addressing social determinants of health. A growing set of initiatives at the federal level are helping to facilitate these state efforts through both technical assistance and funding. These delivery system reform efforts are broad-based efforts that are still in early stages of implementation. It will take time for the states to fully implement these initiatives and for impacts on health outcomes to materialize. Continued monitoring of these initiatives over time will be important to assess their effects on access to care.
Issue Brief
Introduction
As of Spring 2016, states had completed the third open enrollment period (OE3) for the Health Insurance Marketplaces and most of the 32 states, including DC, that had adopted the Medicaid expansion to low-income adults were well into their third year of implementation. With three years of expanded coverage in place, many states have increasingly shifted focus from outreach and enrollment to strengthening delivery systems and enhancing access to care to meet the needs of their growing covered populations.
This brief provides an on-the-ground view of Medicaid delivery systems and access to care in four states—Connecticut, Colorado, Kentucky, and Washington—three years into implementation of the ACA and highlights specific strategies the states are utilizing to enhance access and strengthen their delivery systems. These states implemented the Medicaid expansion in 2014 and have had successful implementation experiences with large increases in Medicaid enrollment. As such, their experiences may help inform other state efforts moving forward. A separate brief reviews these states’ experiences with outreach and enrollment during OE3.
This brief is based on case studies conducted by the Kaiser Family Foundation’s Commission on Medicaid and the Uninsured (KCMU) during Spring 2016. Working with PerryUndem Research/Communication, the Foundation conducted 28 in-person and phone interviews with a range of stakeholders in each state, including Medicaid and Marketplace officials, consumer advocates, assisters, and hospital and community health center (CHC) representatives. In addition, focus groups were conducted with Medicaid and Marketplace enrollees in each state. This work builds on previous analyses that examined states’ preparation for implementation prior to the initial ACA open enrollment period in October 2013 and subsequent reports examining state experiences after completion of the first and second open enrollment periods. Together, this work provides an in-depth understanding of ACA implementation from multiple perspectives, tracking and documenting experiences that may help shape efforts moving forward.
Key Findings
Study State’s Medicaid Delivery Systems
The study states are using varied models to deliver care to Medicaid enrollees (Figure 1). Kentucky and Washington provide care through Medicaid managed care plans. In contrast, beginning in 2012, Connecticut terminated its managed care contracts and now utilizes a managed fee-for-service system that is administered through four administrative service organizations (ASOs) for medical services, behavioral health, dental care, and non-emergency transportation. Colorado has traditionally relied on a fee-for-service model to deliver care. In 2011, it implemented its Accountable Care Collaborative (ACC). Under the ACC, most enrollees continue to receive care on a fee-for-service basis, but enroll in one of seven Regional Care Collaborative Organizations (RCCOs) across the state, which are intended to connect enrollees to Medicaid providers and social services and help coordinate care.
Figure 1: Medicaid Delivery System Models
While the Medicaid delivery systems vary across the study states, they have features designed to coordinate care for Medicaid enrollees. In Colorado and Washington, care is coordinated through a regional approach.
Connecticut implemented a primary care medical home (PCMH) initiative and has connected about 40% of enrollees to PCMHs, which have extended hours, coordinate care, and use electronic health records (higher shares of enrollees have a primary care doctor but may not be attributed to a PCMH). Connecticut pays enhanced fees and performance bonuses to PCMHs and withholds a percentage of the fees paid to ASOs, which they can earn back based on measures of quality and patient care experience. The state reports that under this model, per member per month costs have declined, including a 6% decline last year, and measures point to improvements in care.
Colorado connects Medicaid enrollees with a RCCO and a primary care medical provider (PCMP) to serve as their medical home. The model intends for the PCMP to be the primary source of most medical services for the enrollee and for the PCMP to connect individuals to specialty services and provide health education. As of June 2015, about 70% of Medicaid enrollees were in a RCCO, and about 75% of RCCO enrollees had a PCMP.1 The state provides enhanced payments to PCMPs and RCCOs that meet specific performance targets and other goals. However, most focus group respondents did not have a primary care provider and a number reported challenges managing their care. They also did not know whom to contact for assistance navigating the health system. Consistent with these experiences, a 2015 evaluation of the ACC found inconsistent contact between primary care providers and enrollees and the need for patient education on the role of the PCMP.2
Washington and Kentucky rely on managed care plans to coordinate care for Medicaid enrollees. In Washington, Accountable Communities of Health (ACHs) work in tandem with the managed care plans to identify regional priorities, coordinate activities, and distribute funds in efforts to integrate the delivery of health care and social services and improve population health. However, the ACHs are not risk-bearing entities, do not deliver services, and will not replace the role of managed care plans.
The states also provide targeted care management for high-risk individuals. Connecticut uses Medicaid claims data and predictive modeling to identify high-utilizers and high-risk enrollees for whom the ASOs provide care coordination and intensive care management. This care management includes addressing social determinants of health, such as housing stability and physical safety. The medical and behavioral health ASOs embed care managers in many health centers and include them in hospital discharge processes. Stakeholders in Connecticut reported that the care management has helped to reduce emergency department use. In Washington, the managed care plans connect Medicaid enrollees with chronic conditions to a care manager who is responsible for managing all aspects of their care. The plans also embed care managers in health centers to ensure care is coordinated within the health centers and across providers outside the health center. Kentucky also has efforts focused on increasing care management for Medicaid enrollees who are high-utilizers of emergency department care.
Access to Care for Medicaid Enrollees
Overall, stakeholders and focus group respondents report Medicaid enrollees in the study states have generally good access to primary and specialty care. Focus group respondents indicated that they generally are accessing needed services including primary and preventive care. Stakeholders and focus group respondents also reported that Medicaid enrollees are able to access most specialty services, including care for chronic conditions, surgeries, imaging, and lab tests, as well as prescription drugs. Stakeholders also indicated that Medicaid expansion has significantly increased individuals’ access to specialty services. They noted that, while individuals could access primary care through clinics while uninsured, it was very difficult for them to obtain specialty care. With Medicaid coverage, individuals are able to access specialty care more easily and quickly. Other data also point to good access to care for Medicaid enrollees in these states. For example, one study shows that the share of Medicaid enrollees in Colorado who visited a health professional, had a preventive care visit, visited a specialist, or had a usual source of care was comparable to or better than those with private coverage and much better than the uninsured.3 Studies also show that the Medicaid expansion in Kentucky was associated with significant reductions in skipping medications because of cost, decreases in trouble paying medical bills among low-income adults, and reductions in unmet medical need.4
However, some access challenges remain. Some focus group respondents indicated that some providers they reached out to were not accepting Medicaid patients. In Colorado, statewide data also show that one in five Medicaid enrollees did not get needed care because the doctor’s office was not accepting their insurance, double the rate for the total population. However, this rate has remained around 20% since 2009, despite the large growth in Medicaid enrollment post-ACA.5 Other access challenges were associated with managed care plan provider networks and formularies. For example, in Kentucky and Washington, some focus group respondents noted that their health plan provider directories were inaccurate and out-of-date. Some respondents in Kentucky also indicated that they needed to switch providers because their provider was not participating with their health plan. One stakeholder in Kentucky noted that one of the large managed care plans in Lexington did not include the University of Kentucky in its provider network, which significantly limited access to specialists for enrollees in that plan. A few respondents indicated they had challenges obtaining medications or had to switch to a different medication because it was not included on their plan’s formulary. These plan-related challenges were not limited to Medicaid, as focus group respondents enrolled in Marketplace plans reported similar issues. Other access challenges, such as provider shortages and transportation issues in rural areas, also extended beyond Medicaid.
I couldn’t find a doctor and I checked all the books that they sent me. Most of the information was outdated. -Davita, Kentucky Medicaid enrollee
All four study states provide adult dental benefits, which Medicaid enrollees highly value, but enrollees and other stakeholders pointed to challenges accessing dental care in three of the four states. Washington and Connecticut provide comprehensive adult dental benefits, while the adult benefits in Colorado and Kentucky are more limited.6 Focus group respondents indicated that they highly value this coverage and many had obtained dental services, including cleanings, fillings, and extractions. Stakeholders and respondents indicated that health centers, in particular, are a key source of dental care for Medicaid enrollees. However, respondents and stakeholders identified some challenges accessing dental care, including limited availability of dentists accepting Medicaid patients and long waits for appointments. Stakeholders recognized that dentist participation and access generally is better for children compared to adults, and that access is often more challenging in rural areas. In Kentucky, stakeholders reported that there is better access in Louisville compared to other areas due to its proximity to a dental school. In contrast to the other study states, state officials in Connecticut noted that they have some of the best dental care access in the country and that enrollees generally can access services within a five-mile radius in about a day. Consistent with these reports, focus group respondents in Connecticut reported good access to dental care. Officials indicated that several factors contribute to this access, including close engagement with the dental Administrative Services Organization (ASO), a strong partnership with the state dental association, a previous lawsuit that found inadequate access, increased rates, and enhanced focus on provider engagement.
Since I’ve had Husky we’ve been able to get a lot of my dental stuff done, myself as well as my son. -Pam, Connecticut Medicaid enrollee
I think it’s because there were so many people enrolling and there weren’t enough dentists taking Apple Health …It’s pretty much like whenever you can get in because there are so few [dentists] that take it. -Nicholas, Washington Medicaid enrollee
Focus group respondents and stakeholders also pointed to challenges accessing behavioral health services. Some focus group participants in Kentucky and Colorado noted long waits and difficulty finding mental health providers. Two participants in Colorado also reported difficulty and delays obtaining medication to address their behavioral health needs. Across the study states, stakeholders indicated a need for additional behavioral health providers to address mental health and substance use disorder needs. Stakeholders in Washington and Connecticut indicated that the limited supply of addiction treatment providers is particularly challenging in light of the current heroin and opioid addiction crisis. Washington has an initiative to divert people with substance use disorders from jail into treatment, but there are insufficient Medicaid providers to treat all who need care. Stakeholders in Washington also noted that lack of reimbursement to behavioral health organizations for activities such as home visits as well as separate electronic health records for physical and behavioral health present barriers to fully addressing patients’ needs. Stakeholders across the study states also pointed to growing populations of non-English-speaking and ethnically and culturally diverse enrollees as an emerging challenge related to behavioral health access and utilization.
…I couldn’t find a mental health professional to fill my prescriptions -Eileen, Colorado Medicaid enrollee
Provider Capacity
The study states have pursued initiatives to increase provider participation in Medicaid.
In Connecticut, state officials noted that under its previous managed care model, providers faced challenges that limited participation, including administrative hurdles, slow payments, and variation in utilization management tools and rate schedules across plans. As the state moved away from the managed care model to its current fee-for-service model with ASOs, it worked to increase physician participation by implementing streamlined and uniform provider requirements, a statewide fee schedule and drug formulary, and bi-weekly provider payments. Officials indicate that this streamlined approach has increased participation among primary care providers and specialists. Connecticut also extended the temporary increase in primary care rates established under the ACA, but officials suggest that the other factors had a larger influence on provider participation than the rate increase.
Colorado also maintained the primary care rate increase, and state officials noted that, as part of efforts to ensure access, they are conducting a broader review of provider rates. Colorado is also working to expand physician capacity in rural areas through a recently adopted approach that enables primary care providers to consult electronically with specialists. Stakeholders also pointed to the importance of being able to measure and monitor access. One initiative in the state, the Access to Care Index, provides regional-level data on utilization and access barriers (Box 1).
In 2014, Kentucky expanded access to behavioral health providers by allowing Medicaid to contract with individual providers (rather than through community mental health centers), creating additional provider types (such as licensed drug and alcohol counselors), and adding coverage of services to Medicaid (such as additional services for substance use disorder treatment). State officials noted that adding new providers required Medicaid certification, new licensure categories, changes in state regulations, and coordination with the plans to integrate these new providers. One study shows that more than 300 new behavioral health providers enrolled in Kentucky Medicaid and at least 13,000 individuals with a substance use disorder received related treatment services during the first year of expansion.7
Washington has sought to ensure adequate provider participation by adopting strong network adequacy standards for managed care plans. State officials noted that they work with plans to resolve identified access issues. The state is also considering options for increasing participation of dentists, including examining the fee schedule for adult dental care and contracting dental care to a third-party administrator.
Community health centers (CHCs) have expanded capacity following Medicaid expansion. CHCs in the study states reported they have made a variety of investments to expand access to care, in part, due to enhanced revenues from the Medicaid expansion. Examples of enhancements include adding clinical staff, including behavioral health providers; building dental clinics and expanding dental service capacity; providing intensive care management; addressing social determinants of health (e.g., housing); and adding case managers. However, some health centers cited challenges to meeting increased demands for care and continued growth, including increasing competitive pressures for clinical staff. For example, stakeholders in Kentucky indicated that health centers have to compete for primary care providers because hospitals are increasingly purchasing family medicine practices. Similarly, in Colorado, stakeholders indicated that provider recruitment and retention challenges hinder continued growth since health center salaries are not competitive with the private market. A stakeholder in Connecticut also noted that funds for capital development are key for supporting increased capacity among health centers moving forward.
The Colorado Access to Care Index is designed to measure whether the increase in Coloradans with health coverage following the implementation of the ACA is translating into a change in the ability to access care, help communities across Colorado better understand access to care challenges, and guide conversations about how to address these challenges. The statewide index score increased to 7.8 in 2015 from 7.7 in 2013, both out of a possible 10 points, showing that access to care is trending upward.
The Colorado Access to Care Index is based on about 30 measures that primarily come from the Colorado Health Access Survey, which is a survey of over 10,000 households in Colorado fielded by the Colorado Health Institute. The Colorado Index is produced biennially and tracks health access changes among the 21 regions within the state, by income-level (0-138% FPL, 139-400% FPL, and over 400% FPL), and for two racial/ethnic groups (Hispanic and Non-Hispanic White Coloradans).9 Measures are divided into three categories: potential access, barriers to care, and realized access.
A comparison of the 2013 and 2015 Index scores for the three income-level groups suggests that although access remains more limited for low-income compared to higher income populations in Colorado, access disparities between the income groups appear to be narrowing. The overall access score for the Medicaid-eligible population (below 138% FPL) increased from 6.5 in 2013 to 7.2 (out of 10) in 2015 and the overall access score for the population eligible for Marketplace subsidies (139-400% FPL) increased from 7.7 in 2013 to 8.0 in 2015. However, the scores for both of these populations remain below the overall access scores for the population above 400% FPL, which decreased slightly from 8.8 in 2013 to 8.7 in 2015. The disparity between income groups is greatest for the potential access category scores, suggesting that addressing potential access barriers (e.g. insurance coverage rates and provider availability) for low-income populations might be an efficient approach to reducing access disparities more broadly.10
Key Issues Looking Ahead
In Kentucky, the governor is pursuing a waiver to make changes to coverage under the state’s existing Medicaid expansion program.11 On June 22, 2016, Governor Bevin released his proposed Section 1115 demonstration waiver application called Kentucky HEALTH (Helping to Engage and Achieve Long Term Health) as an alternative to the current Medicaid expansion. The proposed waiver includes many provisions similar to those in Indiana’s Medicaid expansion waiver (including a high deductible account and premiums), but also includes provisions not approved to date in other states, such as a work requirement and graduated premiums based on length of time in the program that will exceed Marketplace levels for those above 100% FPL. The proposal includes a number of changes that would affect Medicaid expansion enrollees as well as traditional non-disabled Medicaid enrollees. Kentucky estimates that projected Medicaid enrollment will decrease over the 5-year waiver period. The proposed waiver was open for public comment at the state level through July 22, 2016, during which the state received over 1,400 comments. The state submitted the waiver proposal to CMS on August 24, 2016.
Integrating physical and behavioral health care is a key focus in the states. In Kentucky, managed care plans provide both physical and behavioral health services to Medicaid enrollees. The state integrated these services when it launched its managed care program in 2011. In contrast, Connecticut, Colorado, and Washington currently provide physical and behavioral health services to Medicaid enrollees through separate entities, but each has efforts underway to integrate this care.
In Washington, managed care plans provide physical care services while regionally operated Behavioral Health Organizations (BHOs) provide behavioral health services. Medicaid managed care plans in Washington are working with the BHOs to place behavioral health providers in primary care settings, with the goal of increasing identification of substance use disorders and access to treatment. The state launched a fully integrated managed care pilot program in two counties on April 1, 2016, and plans to integrate services statewide by 2020. State officials reported that the pilot program transition has gone smoothly so far, and credited efforts by the local ACH to bring together key stakeholders and help garner provider support.
In Colorado, the RCCOs currently are responsible for physical care, while separate Behavioral Health Organizations (BHOs) provide behavioral health care. In 2018, Colorado plans to reorganize its system to integrate physical and behavioral health. Under the new model, Regional Accountable Entities (RAEs) will replace the RCCOs and BHOs and provide both physical and behavioral health care. The state also plans to increase accountability of the RAEs for improved health outcomes and cost efficiencies by tying a greater proportion of administrative payments to value.
Connecticut has separate ASOs for medical and behavioral health care. However, through a collaboration between Medicaid and the Department of Mental Health and Addiction Services, the state implemented a behavioral health home program for people with a diagnosed mental illness and high Medicaid spending that coordinates and integrates physical and behavioral health care as well as referrals for community-based services. Most of the behavioral health homes are local mental health authorities. Connecticut also is one of eight states participating in a federal demonstration of certified community behavioral health clinics that aims to expand access to high quality integrated physical and behavioral health care.
Connecticut, Colorado, and Washington also have broader initiatives underway to transform delivery systems, including efforts to move to value based payments and address social determinants of health.
Connecticut plans to move to a value-based payment strategy in Medicaid under which it will offer shared savings to community health centers and other entities that meet a set of care coordination standards that build on the patient centered medical home and include new standards for behavioral health integration and links to community supports. The state plans to move about one-third of Medicaid enrollees to this value-based payment program with implementation slated to begin January 1, 2017. Connecticut also has an inter-agency, public/private Supportive Housing Initiative to develop long-term solutions to the housing and other needs of individuals with behavioral health needs and/or substance use disorders.
Washington has a waiver pending with CMS that would use Delivery System Reform Incentive Payments (DSRIPs) to fund Medicaid delivery system transformation projects led by the ACHs that focus on health systems capacity building, care delivery redesign, and population health improvement. In addition, the waiver seeks to provide supportive housing and supported employment services to certain Medicaid beneficiaries. The state expects these initiatives to improve health outcomes, reduce costs, build better linkages to non-health sectors, affect the social determinants of health, and foster a health system that supports wellness and recovery.
Colorado, Connecticut, and Washington have received State Innovation Model (SIM) grants to support broader transformation of state health care systems that will include Medicaid and other payers. Under its SIM model, Colorado is seeking to provide access to integrated primary and behavioral health services, with value-based payments structures, for 80% of state residents by 2019. In addition to integrating physical and behavioral health services by 2020, the Healthier Washington Plan aims to shift to an outcomes-based system for paying providers and adopt a collaborative, regional approach to building healthier communities. Toward the goal of payment system reform, the state has implemented an Accountable Care Organization for public employees; launched the Practice Transformation Support Hub to provide training and tools to providers to help reorient physician practices; and developed 55 common measures to track health system performance and inform public and private health care purchasing. Connecticut has similar goals to transform the health care delivery system through movement toward value-based payment and adoption of an advanced medical home model; enhanced coordination among community organizations, providers, schools, and other local entities to improve population health; and increased consumer engagement in making informed health care decisions and managing their own health.
Conclusion
As of the end of the third open enrollment period, these four states have had significant enrollment growth in their Medicaid programs through the Medicaid expansion. With this growth, they have increasingly turned attention to delivery of and access to care for the increasing population covered by the program. The case study states vary in how they deliver care through their Medicaid programs, but all include elements to coordinate care for enrollees. Overall, these case study and focus group findings suggest that, despite the large enrollment growth since implementing the ACA, Medicaid enrollees generally are able to access the preventive, primary, and specialty care they need. However, they do face some access challenges. Some of these challenges reflect limited provider participation in Medicaid, while others are access challenges that extend beyond Medicaid, such as overall provider shortages in rural areas. Enrollees appear to face particular challenges accessing dental and behavioral health services. The study states have undertaken efforts to increase provider participation and expand provider capacity and are continuing work to address remaining access gaps.
Looking ahead, the Governor in Kentucky is seeking to make changes to its Medicaid program under a waiver, which may affect enrollment and access to care moving forward. Connecticut, Colorado, and Washington are pursing initiatives to transform their broad health care delivery systems, including Medicaid, with a focus on integrating physical and behavioral health care, adopting new payment models, and addressing social determinants of health in an effort to improve overall population health. A growing set of initiatives at the federal level are helping to facilitate these state efforts through both technical assistance and funding. These delivery system reform efforts are broad-based efforts that are still in early stages of implementation. It will take time for the states to fully implement these initiatives for impacts on health outcomes to materialize. Continued monitoring of these initiatives over time will be important to assess their impacts on access to care.
Methods
The findings in this brief are based on structured interviews with key stakeholders and focus groups with Medicaid and Marketplace enrollees conducted by the Kaiser Commission on Medicaid and the Uninsured and PerryUndem Research/Communications in four states, Colorado, Connecticut, Kentucky, and Washington, in May 2016. In total, we conducted 28 in-person and phone interviews with a range of stakeholders in each state, including Medicaid and Marketplace officials, consumer advocates, assisters, and hospital and community health center (CHC) representatives. Two focus groups were held in each state, one with individuals enrolled in Medicaid coverage and the other with individuals with income less than 300% of the federal poverty level ($35,640 for an individual in 2016) enrolled in coverage through the Marketplace. The focus groups were held in Denver, Colorado; Hartford, Connecticut; Lexington, Kentucky; and Seattle, Washington. Each focus group consisted of 8 participants with a total of 64 participants, including 32 enrolled in Medicaid and 32 enrolled in Marketplace coverage. Focus group participants were selected to provide a mix of demographic characteristics, including age, race/ethnicity, and health status. Most individuals had used services since obtaining their current coverage.
The authors gratefully acknowledge Michael Perry, Sean Dryden, and Naomi Mulligan Kolb with PerryUndem Research/Communication for their work managing the fieldwork logistics, conducting the interviews, and moderating the focus groups. They also extend their deep appreciation to all the participants for sharing their perspectives and experiences to inform this project.
Three years into the implementation of the ACA, many states continue to streamline their eligibility and enrollment processes and refine their outreach efforts and consumer assistance programs in order to maintain and expand on the coverage gains achieved to date. Based on case studies and focus groups, this brief reviews experiences with Medicaid and Marketplace enrollment, renewal, and consumer assistance in Colorado, Connecticut, Kentucky, and Washington as of Spring 2016. These states implemented the Medicaid expansion and established a state-based Marketplace (SBM) in 2014. This brief builds on previous reports that examined states’ preparation for implementation prior to the initial ACA open enrollment period and their experiences after completion of the first and second open enrollment periods. Together, this work provides an in-depth understanding of ACA implementation from multiple perspectives, tracking and documenting experiences that may help shape efforts moving forward. Key findings from this brief include the following:
Eligibility systems worked well during OE3, with fewer glitches than previous years. States continued to enhance system functionality between OE2 and OE3, improving system performance and providing consumers enhanced options to compare plans. Some system challenges persist for certain individuals and situations, such as immigrants and families with mixed coverage types. Colorado, Connecticut, and Washington are building on their systems to make continued improvements. In contrast, Kentucky is dismantling its Marketplace system, kynect. It transitioned to a new Benefind system for Medicaid enrollment following OE3 and plans to transition to Healthcare.gov for Marketplace enrollment for OE4.
Medicaid enrollment continued to grow during OE3, but this growth began to stabilize. All four states have experienced significant increases in Medicaid enrollment since initial implementation of the ACA. The slowing of enrollment growth during OE3 reflects the fact that the states had already enrolled most of the eligible population. The remaining eligible population includes harder to reach groups who will require more intensive, targeted efforts to enroll. Medicaid retention rates are high in the four study states, with nearly 90% of enrollees successfully renewing coverage. The study states are utilizing automated Medicaid renewal processes that generally appear to be working well. Reductions in Medicaid eligibility levels for parents in Connecticut and proposed changes to the Medicaid expansion in Kentucky may affect future enrollment in these states.
Marketplace enrollment increased in three of the study states during OE3. Colorado, Connecticut, and Washington experienced growth in Marketplace enrollment; however, Marketplace enrollment in Kentucky was flat from OE3. Several factors may have contributed to the lack of enrollment growth in Kentucky, including the exit of the CO-OP plan that had offered more affordable coverage and confusion over whether coverage through kynect remained available as the newly elected Governor ran on a campaign to dismantle kynect. With improvements in system performance and greater familiarity with the renewal process on the part of consumers, Marketplace renewal generally went smoothly in the four states. However, some enrollees expressed frustration that their plans were no longer available, forcing them to find a new plan.
Affordability of coverage continues to be a barrier for many Marketplace enrollees. Many individuals lack information about the availability of subsidies to reduce premium costs, but premiums can still be unaffordable for individuals even when the subsidies are applied. In addition, deductibles and other out-of-pocket costs also pose challenges for many Marketplace enrollees. Marketplace officials reported exploring strategies to provide consumers with more information on costs, including building on the decision support tools they had developed and noted the need for more education about the availability subsidies to reduce out-of-pocket costs.
Local level outreach and enrollment initiatives remained key for supporting successful enrollment and renewal. Consumer awareness of ACA coverage has increased compared to prior open enrollment periods, but there remain gaps in knowledge about the availability of financial assistance for Marketplace coverage and a continued need to educate consumers about how to use their coverage and how cost-sharing and deductibles work. During OE3, the case study states employed ongoing local level outreach and enrollment strategies that built on successful efforts from previous open enrollment periods. These initiatives included targeted efforts to reach specific populations, such as immigrants and people of color. Funding decreases led to some shifts away from broad mass media campaigns.
A broad range of individuals and organizations provided application and enrollment assistance, most of whom provided assistance in prior years. This experience, coupled with improved systems, enabled them to devote more time to outreach and helping people understand their benefits, as well as addressing post-enrollment problems and tax-related issues. Increased emphasis by the Marketplaces on finding and enrolling consumers into qualified health plans, as well as cuts to assister funding, led to some restructuring of assister networks. Future funding for consumer assistance remains a concern across the states, and particularly in Kentucky where the future role for kynectors is uncertain. Call center capacity and operations improved compared to prior years, but some challenges remained related to the quality of the assistance provided and long waits during peak times.
Looking ahead, states seek to build upon and sustain coverage gains. Three of the study states will continue to make improvements to their eligibility and enrollment systems to streamline further the enrollment and renewal processes for Medicaid and the Marketplace. They also plan to continue investments in outreach and consumer assistance efforts to find and enroll harder to reach populations, though a greater emphasis on enrolling consumers into QHPs coupled with funding constraints may lead to restructuring of navigator and other assister networks. With affordability of Marketplace coverage a concern, state officials are exploring strategies to address costs and help consumers make informed health plan choices. In contrast, efforts in Kentucky to dismantle its integrated eligibility and enrollment platform, kynect, and proposed changes to the Medicaid expansion may have implications for continued strong enrollment in Medicaid.
Issue Brief
Introduction
As of Spring 2016, states had completed the third open enrollment period (OE3) for the Health Insurance Marketplaces established by the ACA and most of the 32 states, including DC, that had adopted the Medicaid expansion to low-income adults were well into their third year of implementation. With three years of expanded coverage in place, many states have streamlined their eligibility and enrollment processes with the goal of increasing enrollment and retention of Medicaid and Marketplace enrollees. They continue to invest in outreach and consumer assistance, even as these efforts and programs evolve in response to changes in funding and priorities.
In Spring 2016, the Kaiser Family Foundation’s Commission on Medicaid and the Uninsured (KCMU) conducted case studies to gain an on-the-ground view of ACA implementation in four states, Colorado, Connecticut, Kentucky, and Washington, after completion of OE3. Working with PerryUndem Research/Communication, the Foundation conducted 28 in-person and phone interviews with a range of stakeholders in each state, including Medicaid and Marketplace officials, consumer advocates, assisters, and hospital and community health center (CHC) representatives. In addition, focus groups were conducted with Medicaid and Marketplace enrollees in each state. This work builds on previous analyses that examined states’ preparation for implementation prior to the initial ACA open enrollment period in October 2013 and subsequent reports examining state experiences after completion of the first and second open enrollment periods. Together, this work provides an in-depth understanding of ACA implementation from multiple perspectives, tracking and documenting experiences that may help shape efforts moving forward.
The four states included in these case studies implemented the Medicaid expansion and established a state-based Marketplace (SBM) in 2014. As of OE3, all four states had very successful experiences implementing the coverage expansions. As such, these states’ experiences may provide key lessons about factors contributing to successful enrollment and greater insight into access and utilization of care as a growing number of people gain coverage. This brief reviews these states’ experiences with enrollment and renewal in Medicaid and Marketplace coverage, as well as outreach and consumer assistance during OE3. A separate brief reviews the experiences of Medicaid enrollees with access to care and explores state efforts to transform the Medicaid and broader health care delivery system.
Key Findings
Enrollment and Renewal
Perspectives on the Third Open Enrollment Period
Stakeholders in all four study states viewed OE3 as successful. They reported that systems functioned smoothly with fewer glitches than in previous years. Overall, enrollment continued to grow and Marketplaces were largely stable with the exception of some high profile plan exits. Moreover, stakeholders felt consumer awareness and understanding of coverage options and how to navigate enrollment and renewal processes improved compared to prior years. However, stakeholders also pointed to remaining challenges, including difficulties enrolling immigrant and mixed immigration status families as well as families with mixed coverage, in which some individuals qualify for Medicaid and others qualify for Marketplace coverage. Stakeholders also noted reductions in funding for outreach and enrollment assistance resources. In Kentucky, the gubernatorial election included significant debate around the future of coverage through its Marketplace, kynect, as well as the Medicaid expansion, with the newly elected Governor running on a platform to dismantle kynect. This led to confusion among consumers about the availability of kynect, which stakeholders felt dampened enrollment.
All four study states have had large declines in their uninsured rates since implementation of the ACA, which continued through OE3 (Table 1). Stakeholders agree that successful enrollment into the ACA coverage options contributed to these large declines, which have led to record low uninsured rates in each of the study states. Even with the significant success in reducing the number of uninsured, stakeholders in the states believe it is possible to achieve continued coverage gains by increasing enrollment of the remaining uninsured who are eligible for coverage. They noted that many of the remaining uninsured are eligible for Medicaid and that through continued efforts they should be able to find and enroll these individuals.
Table 1: Uninsured Rates for the Nonelderly Population
U.S.
Colorado
Connecticut
Kentucky
Washington
Nonelderly Uninsured Rate, 2013
16.6%
14.7%
10.5%
18.8%
18.3%
Nonelderly Uninsured Rate, 2015
10.5%
6.7%
5.7%
6.8%
9.3%
Percentage Point Change Between 2013 and 2015
-6.1%
-8.0%
-4.8%
-12.0%
-9.0%
Source: Health Insurance Coverage: Early Release of Estimates from the National Health Interview Survey, 2013 and 2015.
Eligibility Systems
During OE3, all four states had an integrated eligibility system that made eligibility determinations for both Medicaid and Marketplace coverage. In the four study states, the Marketplace eligibility system served as the online enrollment pathway for both Marketplace and Medicaid coverage during OE3 (Figure 1). In Colorado, the state also maintains a separate online Medicaid application, called PEAK, which allows individuals to apply for Medicaid and other programs, such as food and cash assistance, simultaneously. After OE3, Kentucky began dismantling its kynect eligibility system.
Figure 1: Integrated Medicaid and Marketplace Systems
States continued to enhance system functionality between OE2 and OE3. For example, during OE2, Washington utilized a premium aggregation approach in which consumers paid premiums to qualified health plans (QHPs) directly through the Marketplace system, Washington Healthplanfinder; however, problems with the system led to many consumers experiencing delays in completing the enrollment process. Washington eliminated premium aggregation from its system in OE3, which Marketplace officials reported significantly reduced problems for consumers. For OE3, Colorado implemented an expedited enrollment path that uses a set of initial dynamic income questions to direct people to the right program. It also added new decision support tools for consumers, including formulary and network tools, which officials indicated were particularly useful for helping individuals with chronic conditions select a QHP. In addition, Colorado added a broker referral tool to help individuals identify local brokers and implemented an online chat function. However, the chat function was not as successful as the state anticipated, and it will likely eliminate it next year. In Connecticut, AccessHealthCT launched a decision support tool during OE3; stakeholders noted that about 30% of consumers spent nearly 15 minutes using the tool to help them select a QHP.
Stakeholders in all four study states reported that eligibility systems worked well during OE3 with fewer glitches than in previous years. In Connecticut, stakeholders pointed to faster system operations and fewer shutdown periods. They also indicated that many previous system issues that had produced duplicate applications had been resolved. In Colorado, state officials reported that the share of individuals receiving real-time eligibility determinations has improved from year to year, and that during OE3, approximately 80% of applicants received a determination upon completion of an application. Stakeholders in Kentucky and Washington noted that, in addition to improved system functionality during OE3, increased consumer familiarity with the systems contributed to improved experiences. Most participants in the Medicaid and Marketplace focus groups also reported that the systems were functioning better compared to previous years, though some said they continued to experience problems enrolling or renewing online.
Initially it was confusing….it was much smoother now. I think they worked out all the kinks, so it’s much easier to navigate and to reenroll. -Kevin, Colorado Marketplace enrollee
While systems are functioning well overall, some challenges remain for certain individuals and situations. Stakeholders reported that some groups, including immigrants and mixed immigration status families as well as children turning 19, continue to experience problems with eligibility determinations. In Colorado, stakeholders also pointed to issues coordinating between the Connect for Health CO Marketplace system and the PEAK Medicaid eligibility system as well as with county Medicaid offices. For example, they noted that updates or information entered through the PEAK system did not always successfully transfer to Connect for Health CO, which sometimes led to enrollment delays or coverage losses. In Connecticut, stakeholders indicated that there had been some delays between an individual receiving an eligibility determination through AccessHealthCT and having their information entered into the Medicaid enrollment system, since this is still a manual process. The state has worked to reduce this delay and is working with providers to ensure enrollees can access care while this data entry is pending. In Washington, while the elimination of premium aggregation resolved many problems, some consumers reported that they did not receive their subsidies and were charged the full price for their premium. The Marketplace recognized that some insurers are having trouble transferring subsidy data to the Marketplace system, resulting in an about 5,000 people being overcharged, and is resolving these problems on a case-by-case basis.
Three of the study states are building on their existing systems to make continued improvements going forward, while Kentucky is dismantling its system. Connect for Health CO is planning additional system enhancements, including a total out-of-pocket calculator. Washington Healthplanfinder is considering adding a similar tool, but officials referenced some concerns about the ability to provide accurate information. In Connecticut, a new Medicaid enrollment system is set to launch in October, which will be better integrated with the AccessHealthCT eligibility determination system and allow for a more fully automated enrollment process. Despite these planned improvements, stakeholders indicated that resource limitations remain a challenge to system upgrades. In Connecticut, a lower than expected Marketplace budget limited funding available for system maintenance and improvements. Similarly, in Colorado, officials from Connect for Health CO indicated that funding for system fixes dropped from $8.7 million to $2.0 million planned for OE4. In contrast to the other three study states, Kentucky is dismantling its single integrated Medicaid and Marketplace system, kynect. The state will transition to Healthcare.gov for Marketplace eligibility determinations in OE4, and launched a new state-level system, called Benefind, to processes eligibility determinations for Medicaid and other assistance programs (see Box 1).
Box 1: Dismantling kynect in Kentucky
After taking office, Governor Matt Bevin began moving forward to transition Kentucky from its fully state-run Marketplace, kynect, to a federally-supported state-based Marketplace. As part of this transition, the state is dismantling the kynect eligibility system, which provided integrated eligibility determinations for Marketplace and Medicaid coverage. Beginning in OE4, the state plans to rely on Healthcare.gov for Marketplace eligibility determinations. In February 2016, the state launched a new Benefind eligibility system, which serves as the state online application and eligibility determination system for Medicaid and other programs, such as cash and food assistance.
Transitioning to Healthcare.gov. The Department of Health and Human Services (HHS) identified key milestones and requirements that Kentucky must meet to transition to Healthcare.gov.1 On June 1, the state met the initial test of its ability to communicate with Healthcare.gov.2 It has additional dates to determine connectivity and work through real cases leading up to the beginning of open enrollment in November. In addition, the state is responsible for developing a communication plan for the transition, although the details of this plan are not yet available.
Launch of Benefind. The state had planned Benefind prior to the decision to dismantle kynect. It originally intended for it to serve as an online multi-benefit application in addition to kynect. However, it now is the state’s sole online enrollment pathway to Medicaid. Stakeholders noted a range of challenges that emerged when the system launched. For example, the system incorrectly generated letters notifying individuals they were no longer eligible for services (Medicaid and other programs), enrollment assisters (called kynectors) had limited access to the system to help individuals, and there were long waits for call center help. In addition, lack of communication about the transition to Benefind led to confusion among the public. Stakeholders noted that the system was working better by early May, and they expected continued improvements.
Medicaid Enrollment and Renewal
Enrollment in Medicaid remained strong in the four states, with growth stabilizing during the OE3. Across the four study states, Medicaid enrollment has been successful, outpacing enrollment in the Marketplaces. All four states have experienced significant enrollment growth since initial implementation of the ACA (Table 2). Stakeholders noted that although enrollment growth continued during OE3, it leveled off compared to the prior two years since they had already enrolled so many of the eligible population. Stakeholders noted that those who have not yet enrolled are harder to reach and often need more assistance with the application and enrollment process. Two states have made or are planning to make changes to their Medicaid programs that will likely affect enrollment. Connecticut reduced parent eligibility from 205% to 155% of the federal poverty level in 2015. Many of these parents were able to maintain coverage through Transitional Medicaid Assistance (TMA); however, this TMA coverage ended on August 1, 2016. The state plans to help the nearly 18,000 parents affected by this change to transition to Marketplace coverage, but anticipates that some individuals may lose coverage when their TMA coverage ends. In Kentucky, Governor Bevin has submitted a request to the Centers for Medicare and Medicaid Services to alter the Medicaid expansion by charging premiums, among other changes that, if approved, could affect enrollment in future years.
Table 2: Medicaid and CHIP Enrollment
U.S.
Colorado
Connecticut
Kentucky
Washington
Pre-ACA Average Monthly Medicaid/CHIP Enrollment
56,392,477
783,420
704,387*
606,805
1,117,576
Total Monthly Medicaid/CHIP Enrollment as of June 2016
72,675,726
1,356,251
771,512
1,225,842
1,776,842
Percent Change in Enrollment
27%
73%
10%
102%
59%
*Connecticut did not report pre-ACA Average Monthly Medicaid/CHIP Enrollment; data reported here are from March 2014.Source: Medicaid & CHIP Monthly Applications, Eligibility Determinations, and Enrollment Report: February 2014-June 2016 (preliminary), Centers for Medicare and Medicaid Services. Medicaid and CHIP Application, Eligibility Determination and Enrollment Data.
All four of the study states have implemented automated renewal processes in Medicaid that are generally working well. Stakeholders indicated that automated processes have improved the timeliness and processing of renewals. Overall, the share of renewals completed through automated processes ranged from 60% in Kentucky to 70-80% in Washington and Connecticut. In addition, officials in all four states estimated that about 90% of enrollees are successfully renewed. While renewals generally are working well, stakeholders referenced some remaining challenges. For example, officials in Washington noted that the majority of Medicaid renewals occur during the Marketplace open enrollment period, creating an additional burden for Medicaid, Marketplace, and call center staff, as well as the website during a period of high-volume enrollments. Stakeholders in Colorado noted that renewal letters are confusing for enrollees and system issues are leading to some individuals losing coverage even though they thought they had successfully renewed. The state is working to make the renewal notice more client friendly. In Connecticut, stakeholders reported the renewal process is generally working smoothly; however, when enrollees report changes to their information on file, staff must manually enter the changes into the legacy Medicaid system, which can lead to delays in completing the process. The launch of the new Medicaid system later this year should further streamline the renewal process.
You even have the option of clicking to verify that your income hasn’t changed and if it hasn’t changed, you just submit and it’s automatically applied. –Michael, Kentucky Medicaid enrollee
I feel like it was automatic because… I didn’t do anything. And they have all your information so I just know I got a new card. –Eva, Connecticut Medicaid enrollee
Marketplace Enrollment and Renewal
The study states had varying experiences in plan participation and premium increases in their Marketplaces going into OE3 (Table 3). Competition in the Marketplaces was strong, with robust plan participation; however, CO-OP plans in Kentucky and Colorado both exited the markets prior to OE3. The exit of the CO-OP in Kentucky had particularly significant effects because it was the lowest-cost plan and had about 50,000 people enrolled. Marketplaces in both states conducted outreach to individuals enrolled in the CO-OP plans to help them enroll in a new plan. In contrast, the Marketplaces in Connecticut and Washington were relatively stable, with no major plan exits. Stakeholders in Washington noted some small carriers left the market, but these exits did not cause major disruptions for consumers. Average premium increases for QHPs in the four states also varied. In each state, the percent change in the premium for the silver benchmark plan in the largest city ranged from an increase of 32% in Denver to a decrease of 11% in Seattle. In Colorado, there remains significant geographic variation in price points, with very high prices in resort areas.
Table 3: Marketplace Changes between 2015 and 2016
Colorado
Connecticut
Kentucky
Washington
Carriers
Number of Carriers in Marketplace, 2016
81
42
73
114
Net Change in Number of Carriers in Marketplace, 2015-2016
-2
0
+2
+1
Status of state CO-OP
Closed
Will close in 2017
Closed
N/A
Percent Change in Monthly Benchmark Silver Plan Premium 2015-2016
Marketplace enrollment increased in three of the study states during OE3. In Colorado, Connecticut, and Washington, Marketplace enrollment grew (Table 4). In Connecticut, stakeholders noted that 20,000 new enrollees signed up for Marketplace coverage, which was a nearly 20% increase over OE2. Officials in Washington reported that, after not meeting Marketplace enrollment targets in OE2, enrollment rebounded in OE3 and it met enrollment goals. Stakeholders in Colorado also reported strong Marketplace enrollment in OE3. They noted that 48% were new enrollees in OE3, which was the highest share of new enrollees among all states. In contrast, Marketplace enrollment in Kentucky was nearly unchanged compared to OE2 and only 9% higher than enrollment as of December 2015. Stakeholders cited a number of possible reasons for the leveling off of enrollment, including confusion over whether coverage through kynect remained available following the Governor’s election, as well as some problems with the renewal process.
[The renewal process] was very easy. We kept the same Silver level and everything and I don’t even remember going online. I think it was one of these things like just sign this if you want to keep everything the same or whatever. –Lucinda, Connecticut Marketplace enrollee
My plan…wasn’t renewed, so I had to change and they had…very similar options, but honestly that was the most confusing thing. I’m like ‘this is basically exactly what I had,’…but they called it something else. –Elisa, Colorado Marketplace enrollee
Marketplace renewal generally went smoothly in the study states, but changes in QHP availability created confusion for consumers. Stakeholders reported that consumers had greater familiarity with the renewal process, which contributed to a more positive consumer experience. While some focus group participants reported the renewal process was seamless and straightforward, others expressed frustration that their plans were no longer available, forcing them to find a new plan. The need to change plans occurred in both states where insurers exited the market and in states where insurer participation did not change. In Kentucky, there were some challenges with passive renewals. When individuals initially enrolled in kynect, they had the option to choose only one year of auto-enrollment. Many individuals who selected this option and who auto-renewed last year were not aware that they needed to take action to complete enrollment during OE3, which may have led to some people losing coverage.
Despite gains in Marketplace enrollment, affordability of coverage remained an enrollment barrier. In some cases, individuals lack information about the availability of subsidies, but in other cases, the premiums and cost-sharing are still unaffordable for individuals even when the subsidies are applied. Marketplace focus group participants in Kentucky, Washington, and Connecticut said their premiums were manageable but expensive, and the cost put more pressure on their household finances. Some participants reported missing payments and others worried about being able to keep up with their payments. Participants in Colorado generally reported their premiums were affordable. However, stakeholders in Colorado noted that premiums in some geographic areas, such as the resort towns, remain very high.
It’s manageable. For three people I can’t really complain. – Amy, Connecticut Marketplace enrollee
I’ve definitely made lifestyles choices in the last year, like I don’t have a car anymore…I’ve made adjustments so I can afford insurance. – Roniq, Washington Marketplace enrollee
Marketplace officials in Colorado, Connecticut, and Washington expressed concern about the affordability of coverage and indicated they were exploring strategies to provide consumers with more information on costs, including building on the decision support tools they had developed. In Kentucky, stakeholders noted that plans were more affordable for people who qualified for cost-sharing reductions and worried about the long-term affordability of plans for those who do not qualify for subsidies.
I feel like what I’m paying for isn’t that affordable considering I still have to pay a lot if I do go to the doctor or anything like that happens. -Jessica, Kentucky Marketplace enrollee
Deductibles and other out-of-pocket costs also pose challenges for many Marketplace enrollees. While most Marketplace focus group participants appreciated having coverage, those with high deductible plans worried about what would happen if they experienced a major medical need. Respondents who qualified for cost-sharing reductions did not appear to be facing affordability challenges, but those with income just over the threshold for this assistance reported significant challenges. Stakeholders in Connecticut noted that about 12% of individuals who would qualify for cost-sharing reductions by enrolling in Silver plans have instead enrolled in Bronze plans, leading them to face greater out-of-pocket costs for care. Similarly, stakeholders in Colorado and Washington were concerned that many consumers were enrolling in Bronze plans to minimize premium costs, but would have difficulty affording their deductible and out-of-pocket costs.
Coverage Transitions
While no major problems were identified with people moving from Marketplace to Medicaid coverage, stakeholders noted that some people losing Medicaid may not be transitioning to Marketplace coverage. In Colorado, stakeholders indicated that there is a lack of awareness among individuals about the availability of Marketplace coverage and subsidies that may be contributing to gaps in coverage after individuals lose Medicaid eligibility. To try to address this issue, Connect for Health Colorado officials are targeting outreach on those who receive a Medicaid denial notice, are eligible for subsidies in the Marketplace, but fail to enroll. Stakeholders in the study states also indicated that there may be gaps in coverage for people moving from Medicaid to Marketplace because of the requirement to select a QHP within a certain period of time. Officials in Washington noted that systems changes implemented following OE3 have created a more seamless process that allows consumers losing Medicaid coverage to select a QHP after the 23rd of the month to avoid a gap in coverage.
Outreach, Marketing, and Consumer Assistance
Consumer Awareness
Across the study states, stakeholders agreed that consumer awareness of ACA coverage options has improved compared to prior years, but that gaps in knowledge about availability of financial assistance in the Marketplaces persist. Stakeholders indicated that, overall, individuals have much better understanding of coverage options as well as enrollment and renewal requirements and processes than they did in OE1 and OE2. However, there remain some gaps in knowledge about the availability of Marketplace coverage and subsidies, particularly among the lower-income population covered by Medicaid. Stakeholders in Connecticut and Washington noted that consumers need education on the availability of cost-sharing reductions and the differences between Silver and Bronze plans. Stakeholders in all states also pointed to continued needs to improve health insurance literacy among individuals enrolling in coverage by providing education about what their insurance covers and how to use it. Particularly for Marketplace consumers, assisters in Washington emphasized the importance of helping clients understand what deductibles are and how they work. In Kentucky, in addition to helping clients select a Marketplace plan or a Medicaid managed care plan, assisters reported encouraging individuals to use primary care providers in lieu of relying on the hospital emergency department when they seek care.
Outreach and Marketing
Consistent with previous years, the study states employed a wide range of local level outreach and enrollment strategies. Stakeholders in all four study states emphasized the importance of ongoing outreach to maintain and grow enrollment in coverage. In OE3, they utilized activities that built on successful strategies in year one and two and relied on community partnerships through libraries, churches, and schools. Stakeholders in Washington noted that assisters were often available at community locations and community events, such as health fairs, to provide outreach and education. In Connecticut, officials from AccessHealthCT met with community leaders across the state to engage their support in conducting outreach to eligible consumers. Assisters and Marketplaces also deployed targeted efforts to reach specific populations, including immigrants, people of color, and the LGBT community. In Washington, assisters worked with county court systems to provide outreach and enrollment assistance to inmates being released from jail. The state Department of Corrections is now looking to adopt a similar approach statewide. Kentucky also has similar efforts underway, which began in year two and continued in OE3.
I was walking through the mall and I saw the little booth and…it didn’t look too busy so I stopped in and I said how long does this take, and they said about 30 minutes…It was real smooth when I went with them. -Adam, Kentucky Marketplace enrollee
In Kentucky, enrollment storefronts placed in the community continued to be highly successful in OE3. Following successful efforts in previous years, Kentucky offered two enrollment storefronts during OE3, which had high visibility. Focus group participants in Kentucky were aware of the storefronts and several reported using them to get help applying for coverage. Assisters, known as kynectors, and other stakeholders noted that the enrollment storefronts provide the opportunity to have key enrollment staff co-located in one place to assist with complex cases. Stakeholders in Washington indicated the Marketplace is considering establishing storefronts in five counties for OE4 as a way to improve convenience for consumers and increase visibility of coverage options. Colorado only had one storefront available during OE3. While the storefront was successful, stakeholders did not view it as such a significant driver of enrollment compared to Kentucky.
Funding decreases led to some reductions in mass media campaigns. For example, Colorado and Washington shifted away from television advertising toward digital marketing. Stakeholders in Colorado noted there were more limited media buys for cable television during OE3. Washington did not run any television ads, and radio ads were limited to mostly Spanish-language radio. Stakeholders in Kentucky reported that a longstanding marketing contract ended in December and the state did not put any additional marketing efforts in place. They suggested that the absence of a marketing campaign added to public confusion regarding the Governor’s decision to dismantle kynect and uncertainty about whether coverage remained available. In contrast, AccessHealthCT continued its mass media campaign to continue building the brand and to drive enrollment in QHPs. Stakeholders indicated that a renegotiation of the marketing contracts for OE3 provided the same marketing push for less money.
Consumer Assistance
As in previous years, navigators, certified application assisters (CACs), CHCs, and agents and brokers all provided application and enrollment assistance to consumers. Most of the individuals and programs providing assistance in OE3 had provided assistance in prior years. Stakeholders in Colorado and Washington reported that this previous experience coupled with improved systems enabled assisters to devote more time to outreach and helping people understand how to use their coverage and the scope of their benefits. Assisters also assumed a larger role in addressing post-enrollment problems and tax-related issues. Brokers continue to play a significant role in the study states. In Colorado and Kentucky, brokers account for 50% of assisted enrollments. Focus group participants in Colorado who relied on brokers were generally satisfied with the assistance they received. However, some stakeholders remain concerned about whether brokers receive adequate training on coverage options. AccessHealthCT also relies heavily on brokers to provide enrollment assistance, but there are concerns that reductions in commissions paid for Marketplace plans will limit broker willingness to continue this role in the future.
Increased emphasis on finding and enrolling consumers into QHPs led to restructuring of assister networks. In Colorado, Connecticut, and Washington, assisters faced tensions between the goal of maximizing coverage regardless of coverage type and the Marketplaces’ emphasis on boosting QHP enrollment. To increase QHP enrollment, Washington Healthplanfinder restructured the Lead Organization (navigator) contracts, making full funding contingent on meeting separate Medicaid and QHP enrollment targets. While Healthplanfinder met overall QHP enrollment goals, this change led to some turnover among assister programs, including three Lead Organizations that did not renew their contracts, and restructuring of assister networks. In Colorado, stakeholders noted a lack of coordination between Health Coverage Guides responsible for helping consumers enroll in QHPs and assisters who help consumers enroll in Medicaid. Funding cuts have also contributed to restructuring of assister networks in Colorado and Connecticut. Unlike the other states, Connecticut eliminated its year-round in-person assister program following OE1 and transitioned some assisters to CACs. Its navigator program now consists of temporary workers hired during the open enrollment period who provide enrollment assistance in libraries and other locations. A new emphasis on expanding Marketplace enrollment, plus the need to assist the nearly 18,000 parents losing transitional Medicaid coverage, has renewed discussions in the state over whether or how to restructure the program.
In Kentucky, there is uncertainty about the future role and funding for kynectors. Kynectors continued providing outreach and enrollment assistance during OE3. However, when the Benefind Medicaid portal launched in February, kynectors were initially unable to assist clients who received termination notices or who needed to renew their coverage. Only state Medicaid eligibility workers could resolve these problems through the new system. Since then, the state has provided kynectors access to Benefind, and they can now assist their clients with the entire application or renewal process. Stakeholders noted that the kynector contracts have been extended through October 31st; however, contracts and funding for OE4 remain uncertain.
While stakeholders noted improvements in call center wait times and ability to respond to consumer needs, problems with capacity and staff capability remain. As systems have improved in the study states, the number of calls to call centers have dropped. In addition, states have adjusted call center capacity to meet anticipated demand. As a result, stakeholders noted that call center wait times during OE3 were shorter compared to prior years. However, stakeholders reported that there were still long waits during peak times, and there remain concerns about the quality of assistance provided through the centers. For example, in Washington, some focus group participants reported that the staff did not provide adequate answers to their questions. Similarly, stakeholders in Connecticut felt the call center training was not adequate, leaving the staff unable to handle complicated cases. AccessHealthCT negotiated a contract with a new vendor to run the call center that will reduce costs by 40-60%. Officials at Connect for Health CO expressed concern over long wait times and indicated that the state is examining how to improve call center capacity through contracting arrangements. In Kentucky, with the confusion around kynect and Benefind, the call center experienced increased call volume, and stakeholders reported that there were long wait times and limited capacity to deal with the calls. As issues related to the transition to Benefind are addressed, the call volume is expected to decline.
Conclusion
As of the end of the third open enrollment period, states were continuing to make progress with implementing the ACA coverage expansions. In the four study states, eligibility systems were working well, and Medicaid and Marketplace enrollment continued to grow. Consumer awareness of available coverage options has improved as has their knowledge of how to navigate enrollment and renewal processes and where to go to get help. Outreach and consumer assistance in year three built on successful strategies from prior years and remained an important component of state efforts to find and enroll eligible individuals.
Looking ahead, with coverage gains established, three of the study states will continue to make improvements to their eligibility and enrollment systems. However, new leadership in Kentucky is moving to dismantle the integrated eligibility and enrollment platform, kynect, shift to separate portals for Medicaid and QHP enrollment, and possibly change the terms of the state’s Medicaid expansion. It remains to be seen how these changes will affect health coverage rates overall. Affordability of Marketplace coverage remains a concern and state officials are exploring strategies to address costs and help consumers make informed health plan choices. Investments in outreach and consumer assistance efforts remain important, especially to find and enroll harder to reach populations. An increased focus on enrolling consumers into QHP coverage coupled with funding constraints may lead to further restructuring of navigator and other assister programs and may have implications for continued strong enrollment in Medicaid.
Methods
The findings in this brief are based on structured interviews with key stakeholders and focus groups with Medicaid and Marketplace enrollees conducted by the Kaiser Commission on Medicaid and the Uninsured and PerryUndem Research/Communications in four states, Colorado, Connecticut, Kentucky, and Washington, in May 2016. In total, we conducted 28 in-person and phone interviews with a range of stakeholders in each state, including Medicaid and Marketplace officials, consumer advocates, assisters, and hospital and community health center (CHC) representatives. Two focus groups were held in each state, one with individuals enrolled in Medicaid coverage and the other with individuals with income less than 300% of the federal poverty level ($35,640 for an individual in 2016) enrolled in coverage through the Marketplace. The focus groups were held in Denver, Colorado; Hartford, Connecticut; Lexington, Kentucky; and Seattle, Washington. Each focus group consisted of 8 participants with a total of 64 participants, including 32 enrolled in Medicaid and 32 enrolled in Marketplace coverage. Focus group participants were selected to provide a mix of demographic characteristics, including age, race/ethnicity, and health status. Most individuals had used services since obtaining their current coverage.
The authors gratefully acknowledge Michael Perry, Sean Dryden, and Naomi Mulligan Kolb with PerryUndem Research/Communication for their work managing the fieldwork logistics, conducting the interviews, and moderating the focus groups. They also extend their deep appreciation to all the participants for sharing their perspectives and experiences to inform this project.
Endnotes
Letter from Kevin Counihan, CEO, Health Insurance Marketplace to Vickie Yates Brown Glisson, Secretary, Kentucky Cabinet for Health and Family Services, dated 3.25.16. ↩︎