Medicare Advantage: How Robust Are Plans’ Physician Networks?

Authors: Gretchen Jacobson, Matthew Rae, Tricia Neuman, Kendal Orgera, and Cristina Boccuti
Published: Oct 5, 2017

Executive Summary

One of the biggest trade-offs between Medicare Advantage and traditional Medicare is that Medicare Advantage plans have a more limited network of doctors and other providers. The size and breadth of provider networks can be an important factor for beneficiaries when choosing between traditional Medicare and Medicare Advantage, and among Medicare Advantage plans. As of 2017, 19 million of the 58 million people on Medicare (33%) are enrolled in a Medicare Advantage plan, yet little is known about their provider networks.

19 million people on Medicare are in a #MedicareAdvantage plan, yet little is known about their provider networks.

This report is the first known study to examine the size and composition of Medicare Advantage plans’ physician networks. This analysis draws upon data from 391 plans, offered by 55 insurers in 20 counties, and accounted for 14% of all Medicare Advantage enrollees nationwide in 2015. Key findings include:
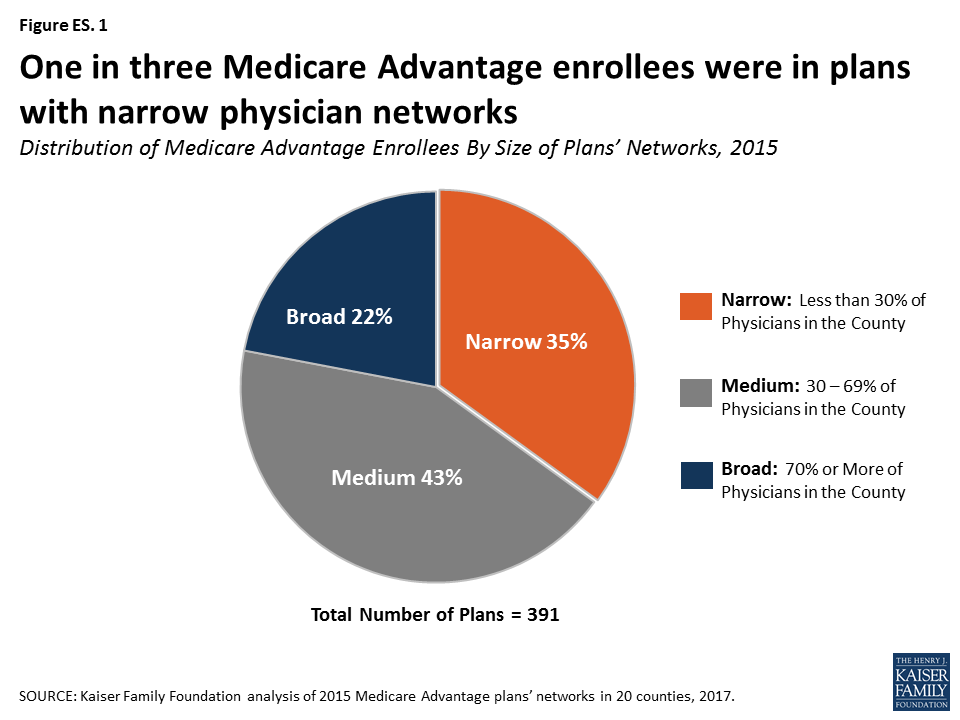
Figure ES-1: One in three Medicare Advantage enrollees were in plans with narrow physician networks
  • More than three in ten (35%) Medicare Advantage enrollees were in narrow-network plans while about two in ten (22%) were in broad-network plans. To some degree, the relative narrowness of plan networks masks the total number of physicians that enrollees could access, particularly in larger counties.
  • Medicare Advantage networks included less than half (46%) of all physicians in a county, on average.
  • Network size varied greatly among Medicare Advantage plans offered in a given county. For example, while enrollees in Erie County, NY had access to 60% of physicians in their county, on average, 16% of the plans in Erie had less than 10% of the physicians in the county while 36% of the plans had more than 80% of the physicians in the county.
  • Access to psychiatrists was typically more restricted than for any other specialty. Medicare Advantage plans had 23% of the psychiatrists in a county, on average; 36% of plans included less than 10% of psychiatrists in their county. Some plans provided relatively little choice for other specialties as well; 20% of plans included less than 5 cardiothoracic surgeons, 18% of plans included less than 5 neurosurgeons, 16% of plans included less than 5 plastic surgeons, and 16% of plans included less than 5 radiation oncologists.
  • Broad-network plans tended to have higher average premiums than narrow-network plans, and this was true for both HMOs ($54 versus $4 per month) and PPOs ($100 versus $28 per month).

Insurers may create narrow networks for a variety of reasons, such as to have greater control over the costs and quality of care provided to enrollees in the plan. The size and composition of Medicare Advantage provider networks is likely to be particularly important to enrollees when they have an unforeseen medical event or serious illness. However, accessing the information may not be easy for users, and comparing networks could be especially challenging. Beneficiaries could unwittingly face significant costs if they accidentally go out-of-network. Differences across plans, including provider networks, pose challenges for Medicare beneficiaries in choosing among plans and in seeking care, and raise questions for policymakers about the potential for wide variations in the healthcare experience of Medicare Advantage enrollees across the country.

Report

Introduction

For people on Medicare, one of the biggest trade-offs between Medicare Advantage and traditional Medicare is that Medicare Advantage plans have a more limited network of doctors and other providers. Medicare Advantage plans restrict the doctors, hospitals, and other providers from whom their enrollees can receive care, while traditional Medicare allows people to see any provider that accepts Medicare (overwhelming majority of providers). Seniors value having the ability to choose their own doctors as well as keep their existing doctors, and say that the doctors in the network are an important factor in their plan selections.1 

Although Medicare Advantage enrollment is rising rapidly, with one in three beneficiaries now in a Medicare Advantage plan, relatively little is known about Medicare Advantage plans’ provider networks.2  The Centers for Medicare and Medicaid Services (CMS) requires Medicare Advantage plans to include a specified number of physicians for each of the 26 specialties, along with hospitals, and other providers within a particular driving time and distance of enrollees;3  however, little information is available about the extent to which plans go beyond these basic requirements. A prior analysis showed that Medicare Advantage hospital networks vary greatly in size and composition.4  The size and composition of a plan’s physician network can have important implications for Medicare Advantage enrollees, including whether or not they can see a given physician (for HMO enrollees) or how much more they would need to pay for out-of-network care (for PPO enrollees).

When forming their networks, insurers may choose to contract with some but not all physicians for a variety of reasons. For example, the insurer may want to have greater control over the cost or quality of care provided by a physician or they may prefer to limit the number of physicians included in their network for other reasons. Curating and restricting their provider networks may also allow insurers to improve the coordination and efficiency of care for their enrollees.

At the same time, physicians may or may not want to be a part of a Medicare Advantage network. They may not want the extra paperwork and time that may come with accepting another insurer, may not want additional patients, or may have concerns with a plan’s payment rates or other terms of a given plan’s contract.

This report is the first known study to examine the size and composition of Medicare Advantage plans’ networks, focusing on physicians. This analysis draws upon data from 391 plans, offered by 55 insurers, in 20 counties, accounting for 14 percent of all Medicare Advantage enrollees nationwide in 2015. The report analyzes the size of provider networks across and within the 20 counties, overall and by specialty, and looks at the relationship between network size and other plan features, including plan types, premiums, star ratings, and insurers. We defined Medicare Advantage networks as broad if they included 70 percent or more of the physicians in a county, medium if they included between 30 and 69 percent of the physicians in a county, and narrow if they included less than 30 percent of the physicians in a county.

Growing evidence indicates that many plans do not maintain accurate directories.5  For example, in an investigation, CMS found that the directories had many errors and 45 percent of the doctors listed had incorrect information in plans’ directories.6  Unlike CMS, we do not assess the accuracy of the directories, nor do we assess whether the physicians in the directories actually accept the insurance.

Methods

For this analysis, we examined physician networks of Medicare Advantage Health Maintenance Organizations (HMOs) and local Preferred Provider Organizations (PPOs) offered in 20 counties in 2015 (Figure 1). We selected a geographically diverse set of counties that encompass a sizeable share of the total Medicare Advantage population. These counties range in size, per capita Medicare spending, the number of plans offered to Medicare beneficiaries, and Medicare Advantage penetration rates in 2015 (Table A1).
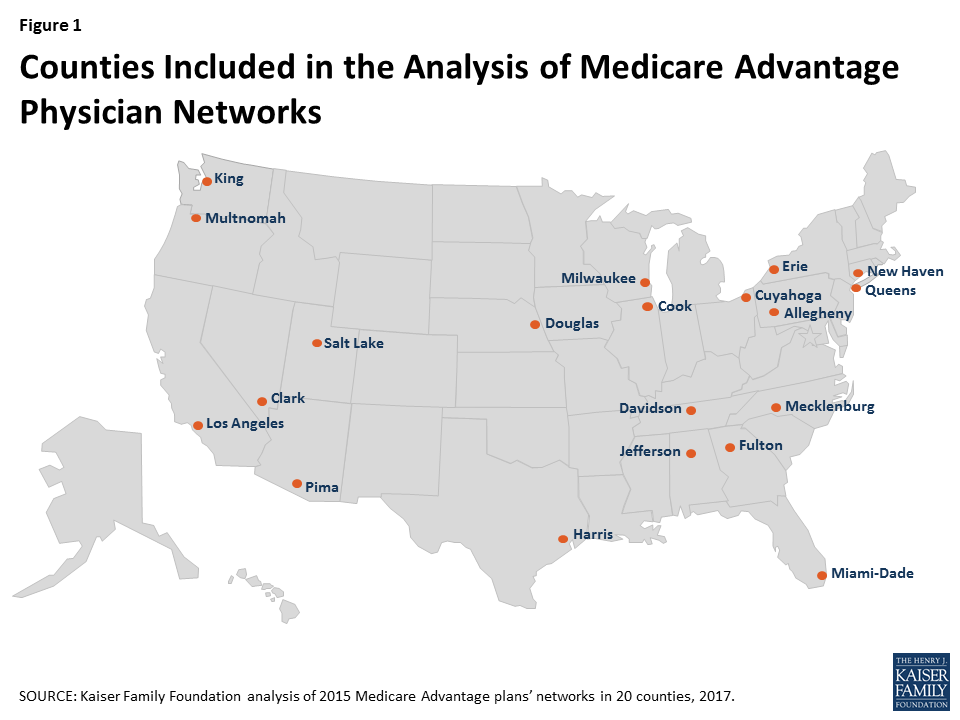
Figure 1: Counties Included in the Analysis of Medicare Advantage Physician Networks

We downloaded from each insurer’s website the provider directories for each Medicare Advantage plan offered in the 20 counties during the 2015 open enrollment period; provider directories could only be accessed directly from the insurers because the directories are not posted on the Medicare Plan Finder, the website developed by CMS to support Medicare Advantage plan comparisons. We converted the directories for each plan to a machine-readable format. We then matched the text in the directories against a national census of physicians maintained by SK&A using a text-matching method that searched the directories for the names of every doctor practicing in each county (see Appendix for details).

We categorized networks into one of three sizes based on the share of physicians in the county that were included in the directory: broad (70% or more of the physicians), medium (30-69% of the physicians), and narrow (less than 30% of the physicians). These categories are the same as those used in a prior analysis of Medicare Advantage hospital networks, and are the same cut-offs that were used in a McKinsey & Company report examining ACA Marketplace networks.7  The analysis included the 26 physician specialties that Medicare Advantage plans were required to include in their networks, and excluded all other specialties. For a more detailed description of the study methods, see the Appendix.

Results

Size of Plans’ Networks

By Plan

Medicare Advantage plan networks included less than half (46%) of all physicians in a county, on average, in 2015 (Figure 2). In comparison, other studies have found that about 30 percent of all physicians in a rating area were included in ACA Marketplace plans in 2014.8  About one in four (27%) plans had narrow networks (with less than 30% of physicians in the county), about half (52%) of all plans had medium-sized networks (with 30 to 69% of physicians in the county), and about one in five (21%) plans had broad networks (with 70% or more of the physicians in the county).
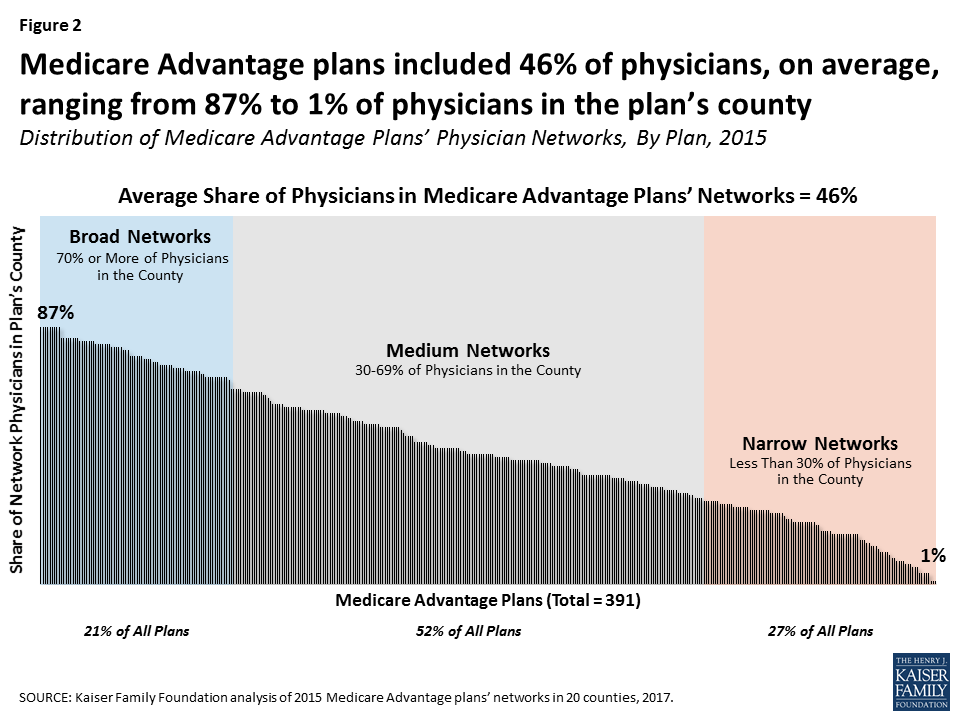
Figure 2: Medicare Advantage plans included 46% of physicians, on average, ranging from 87% to 1% of physicians in the plan’s county
By Enrollment

While about one in four (27%) Medicare Advantage plans had narrow networks, these plans included about one in three (35%) Medicare Advantage enrollees in the 20 counties in 2015, indicating that enrollees were somewhat disproportionately enrolled in plans with narrow networks (Figure 3). Four in ten (43%) enrollees were in plans with medium networks of physicians and about two in ten (22%) enrollees were in plans with broad networks of physicians. Some Medicare Advantage enrollees may be in plans with relatively narrow networks because they are comfortable with the way in which the plan delivers care, or they selected the plan based on other factors, such as low premiums.
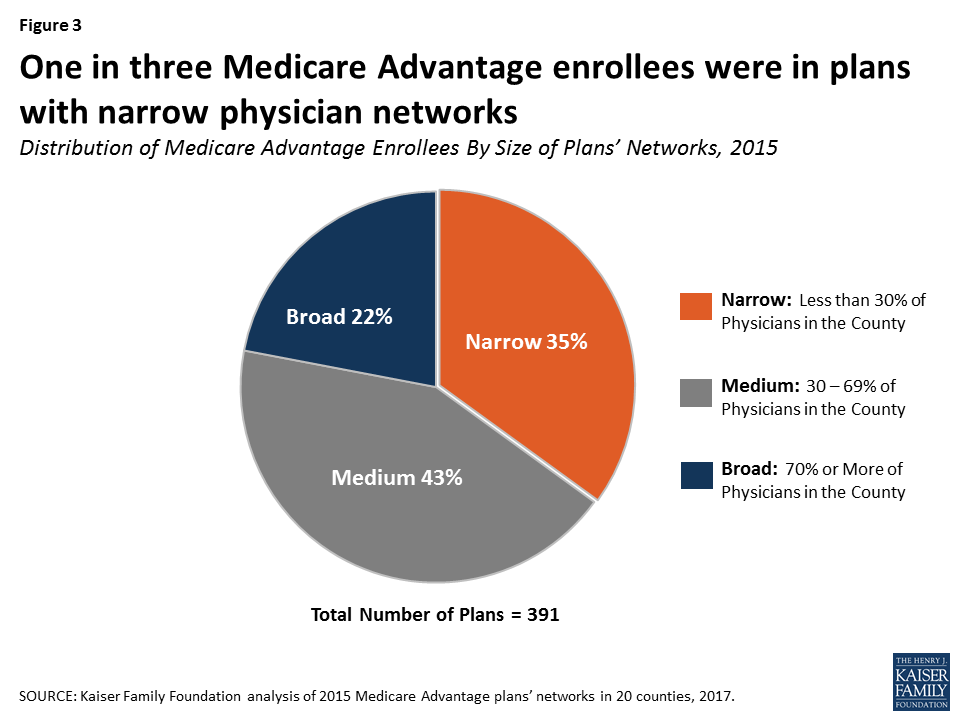
Figure 3: One in three Medicare Advantage enrollees were in plans with narrow physician networks

Closed-panel HMOs (also known as staff model HMOs) generally have narrow networks because the plans’ parent insurers directly employ the majority of physicians in insurer’s provider networks. This study includes some closed-panel HMOs, such as Kaiser Permanente, but the majority of enrollees in narrow-network plans in the study were not in closed-panel HMOs; the largest closed-panel HMO in the study was Kaiser Permanente, which included 26 percent of all enrollment in narrow-network plans and 10% of total enrollment in the study.

By County

Network size varied widely across counties in 2015 (Figure 4; Table A2). In three large counties (Clark, Harris, and Los Angeles), most Medicare Advantage enrollees were in plans with narrow physician networks. In contrast, in seven counties (New Haven, Salt Lake, Douglas, Milwaukee, Erie, Allegheny, and Mecklenburg), more than half of all Medicare Advantage enrollees were in plans with broad networks, including four counties in which nearly all Medicare Advantage enrollees were in plans with broad networks (Allegheny, Erie, Mecklenburg, and Milwaukee).
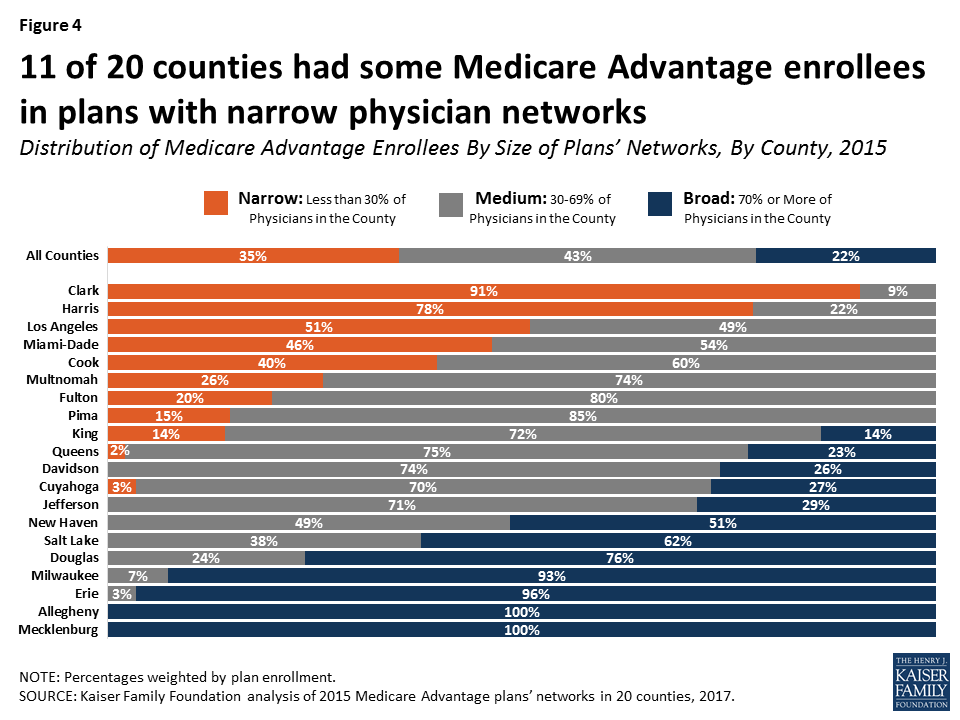
Figure 4: 11 of 20 counties had some Medicare Advantage enrollees in plans with narrow physician networks

Similarly, the average size of Medicare Advantage plans’ physician networks varied greatly across the 20 counties. In Allegheny County, for example, Medicare Advantage plans included in their provider networks 77 percent of all physicians practicing in the county, on average; in contrast, the Medicare Advantage plans in Miami-Dade County included just 25 percent of all physicians in the county, on average (Figure 5). In four counties (Allegheny, Mecklenburg, Milwaukee, and Salt Lake), Medicare Advantage enrollees had access to at least two-thirds of all practicing physicians in the county, on average; however, in three counties (Cook, Los Angeles, and Miami-Dade), enrollees had access to less than one-third of the physicians in the county, on average.
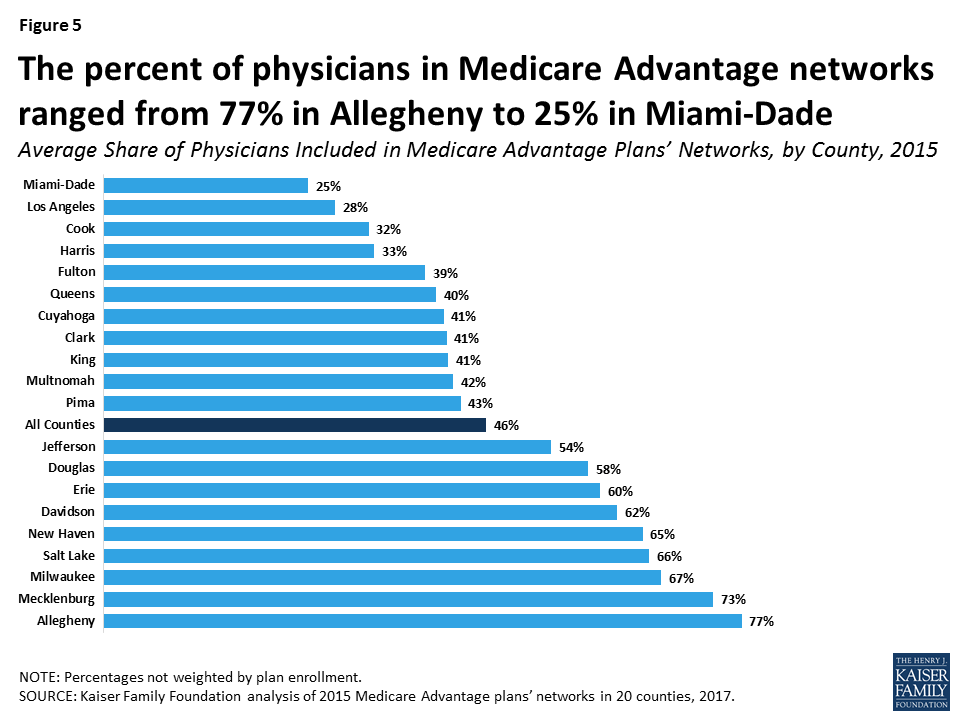
Figure 5: The percent of physicians in Medicare Advantage networks ranged from 77% in Allegheny to 25% in Miami-Dade

The percent of physicians included in a Medicare Advantage plan network may mask the large number of physicians that an enrollee can access, particularly for plans in large counties. For example, while the average plan in Los Angeles County included only 28 percent of the physicians in the county, there were over 13,000 physicians in Los Angeles County and the average plan in Los Angeles County included 3,758 physicians – more physicians than the average plan in any of the other counties in this study. In effect, even though Medicare Advantage plans in Los Angeles had some of the narrowest physician networks, enrollees in plans in Los Angeles often had access to more physicians than enrollees in broader plans in other counties. Nevertheless, even in large counties, Medicare Advantage enrollees in narrow-network plans have access to fewer physicians than enrollees in medium or broad-network plans or beneficiaries in traditional Medicare.

The size of Medicare Advantage provider networks also varied across plans within counties – an important consideration for beneficiaries choosing between plans (Figure 6; Table A3). For example, in Queens County, the size of plan networks ranged from 71 percent of the physicians in the county to as few as 6 percent of physicians in the county, with the average plan including 40 percent of physicians in the county. Similarly, while Medicare Advantage enrollees in Erie County had access to 60 percent of the physicians in the county, 16 percent of the plans in Erie had less than 10 percent of the physicians in the county while 36 percent of the plans had more than 80 percent of the physicians in the county.
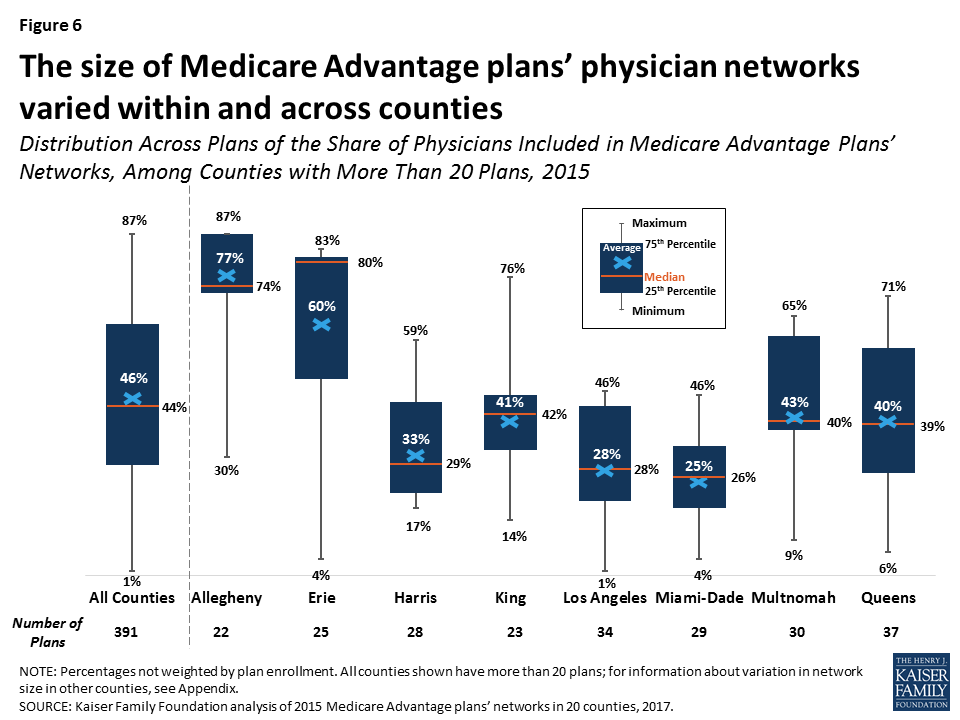
Figure 6: The size of Medicare Advantage plans’ physician networks varied within and across counties
By Specialty

Medicare Advantage plans included about four in ten (42%) primary care physicians in a county, on average, ranging from 20 percent in Miami-Dade to 77 percent in Allegheny (Table A4). However, the average share of physicians included in Medicare Advantage networks also ranged across specialties (Figure 7). For 12 of the 26 required specialties, Medicare Advantage plan networks included the majority of the physicians in their county, on average. The plan networks also included nearly half (43%) of geriatricians (not a required specialty) in a county, on average, ranging from 18 percent in Miami-Dade County to 88 percent in Allegheny County.
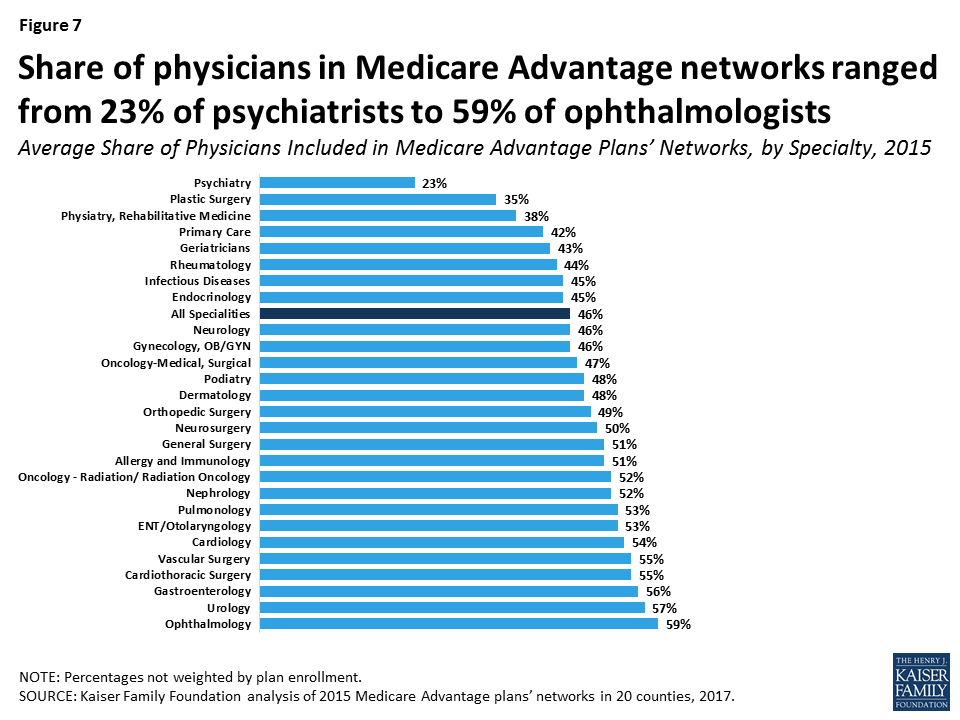
Figure 7: Share of physicians in Medicare Advantage networks ranged from 23% of psychiatrists to 59% of ophthalmologists

Access to psychiatrists was more restricted than for any other specialty, on average.9  On average, plans included less than one-quarter (23%) of the psychiatrists in a county, ranging from 7 percent in Los Angeles and Pima to 45 percent in Allegheny. More than one-third (36%) of the 391 Medicare Advantage plans included less than 10 percent of the psychiatrists in their county. The small share of psychiatrists in Medicare Advantage plan networks, particularly in some counties such as Los Angeles, raises the likelihood that beneficiaries in traditional Medicare receiving care for serious mental health issues would likely need to switch psychiatrists to remain in their plan’s network if they were to enroll in a Medicare Advantage plan.

Some plans included relatively small numbers of some specialties, indicating that enrollees would have relatively little choice in physicians (Figure 8). For example, 20% of plans included less than 5 cardiothoracic surgeons, 18% of plans included less than 5 neurosurgeons, 16% of plans included less than 5 plastic surgeons, and 16% of plans included less than 5 radiation oncologists. We examined whether these plans with limited access for some specialties were concentrated in counties with predominantly narrow networks, but found that they were generally spread across many counties, including counties with broader networks.
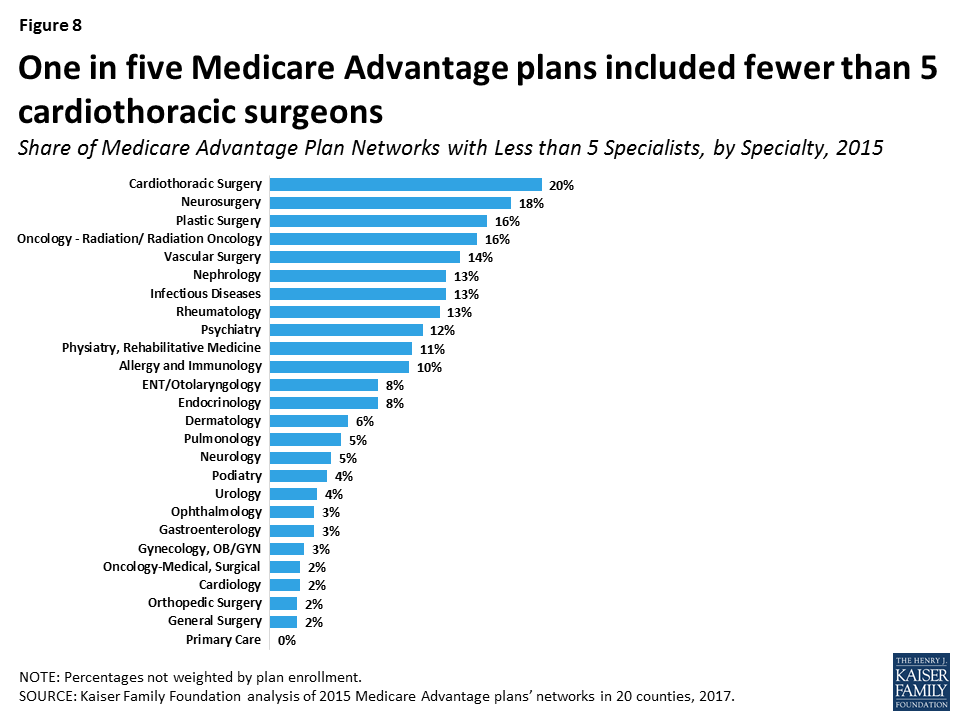
Figure 8: One in five Medicare Advantage plans included fewer than 5 cardiothoracic surgeons
Ratio of Enrollees to Network Physicians

To examine an additional indicator of network size, we calculated the ratio of Medicare Advantage enrollees for each network physician across the 20 counties, and found considerable variation both by county and by specialty. In Mecklenburg County, for example, enrollees were in plans that had 69 enrollees for each medical/surgical oncologist in network, on average. This ratio contrasts significantly from Clark County, which had an average of 2,486 Medicare Advantage enrollees for each medical/surgical oncologist (Figure 9). For psychiatrists, the range was even greater across counties—from an average of 43 enrollees per in-network psychiatrist in Douglas County to over 5,000 in Clark and Pima Counties (not shown).10  In general, plans had lower ratios for primary care physicians, with about half the counties averaging fewer than 30 Medicare Advantage enrollees for each in-network primary care physician (not shown).
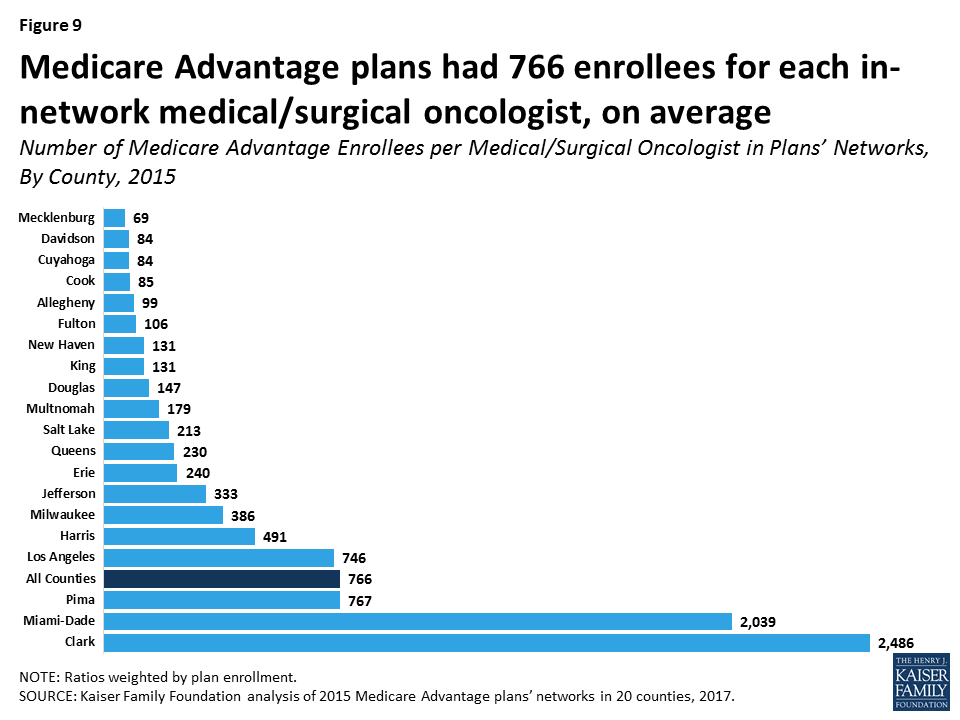
Figure 9: Medicare Advantage plans had 766 enrollees for each in-network medical/surgical oncologist, on average

These ratios supplement our overall analysis of network size in Medicare Advantage, but they do not, on their own, provide specific information about network adequacy for patient access to care. Without information on physicians’ actual caseloads (including Medicare Advantage, commercial insurance, Medicaid, and traditional Medicare patients), it is not possible to assess if counties with high enrollee-to-physician ratios indicate access issues. Nonetheless, Medicare beneficiaries in plans with higher ratios have fewer physicians per enrollee listed in their plans’ provider directories. Additionally, counties with higher shares of narrow-network plans tended to have higher ratios of enrollees to network physicians, which suggests a relationship between narrow networks and high enrollee-to-physician ratios.

Relationship Between Size of Plans’ Networks and Other Plan Features

HMOs versus PPOs

Medicare Advantage PPOs tended to have broader physician networks than Medicare Advantage HMOs (Figure 10). PPOs included 57 percent of physicians in their county, on average, compared to HMOs, which included 42 percent of physicians in their county, on average. The smaller size of the HMO networks compared to the PPO networks is important because most Medicare Advantage enrollees are in HMOs, which will not cover the cost of non-emergency care received from physicians outside the provider network. In contrast, PPOs will partly cover the cost of out-of-network care with beneficiaries paying a higher amount if they see an out-of-network provider.11 
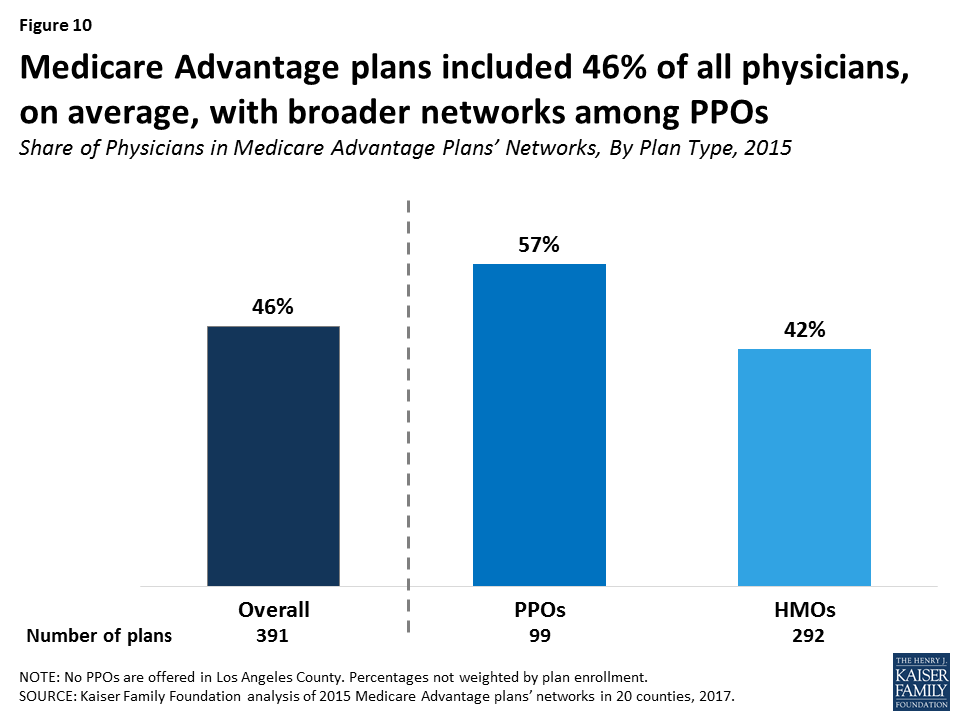
Figure 10: Medicare Advantage plans included 46% of all physicians, on average, with broader networks among PPOs

These results held across most counties, with the HMOs in most of the counties having narrower networks than PPOs, on average (Table A5). The differences between HMO and PPO networks are diluted by the fact that a number of insurers use the same network for their Medicare Advantage HMO and PPOs in a given county. Among PPOs offered by insurers that also offered an HMO in the county, 44 percent had the same provider network as the insurer’s HMO.12 

Network Size by Plan Premiums

Broad-network plans tended to have higher average premiums than narrow-network plans, and this was true for both HMOs ($54 versus $4 per month) and PPOs ($100 versus $28 per month; Figure 11).
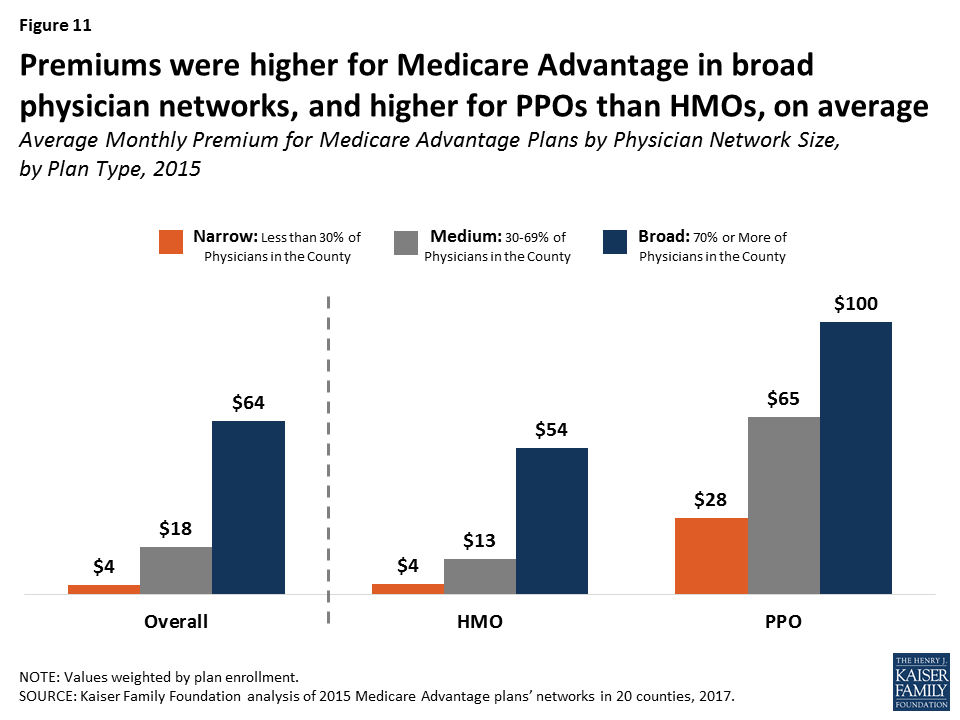
Figure 11: Premiums were higher for Medicare Advantage in broad physician networks, and higher for PPOs than HMOs, on average

While PPOs tend to have both higher premiums and broader networks than HMOs, the correlation between network size and premiums is independent of the correlation between network size and plan type.

In most but not all counties, broad-network plans typically had higher premiums than narrow-network plans. In 8 of the 11 of the counties that had a broad-network plan as well as medium and/or narrow-network plans (Allegheny, Davidson, Jefferson, King, Milwaukee, New Haven, Queens, and Salt Lake), the average premium was higher for broad-network plans than narrow and/or medium-network plans (Figure 12). In one county, Mecklenburg, only broad-network plans were offered. This finding is similar to findings from ACA Marketplace studies, and suggests that, in some counties, enrollees could use premiums as a rough proxy for network size.13 
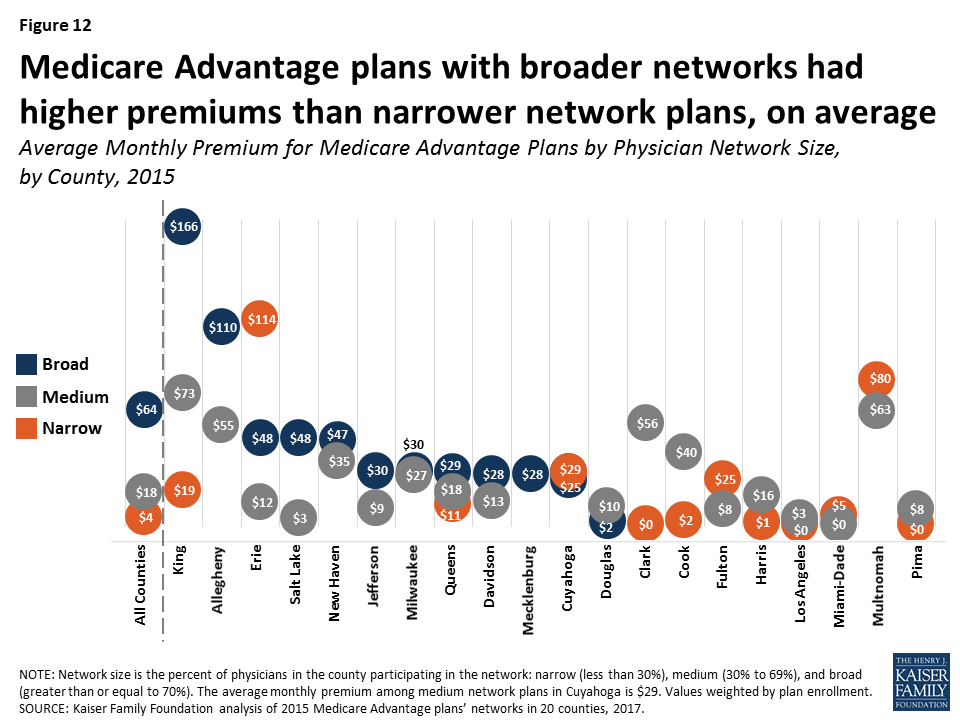
Figure 12: Medicare Advantage plans with broader networks had higher premiums than narrower network plans, on average

However, in 5 of the 12 counties with narrow-network plans (Cuyahoga, Erie, Fulton, Miami-Dade, and Multnomah), average premiums were higher for narrow-network plans than for medium and/or broad-network plans. 

Network Size By Star Rating

Medicare Advantage plans’ quality star ratings do not appear to be related to the size of plans’ networks: the average star ratings for narrow-network plans were similar to those for broad-network plans in 2015 (3.9 stars versus 4.0 stars, respectively; Figure 13). Similarly, examining the relationship within plan types, star ratings did not differ significantly for narrow and broad network PPOs (4.0 stars and 3.9 stars, respectively) and narrow and broad network HMOs (3.9 stars and 4.0 stars, respectively). For consumers, this finding suggests that star ratings are not a good proxy for network size.
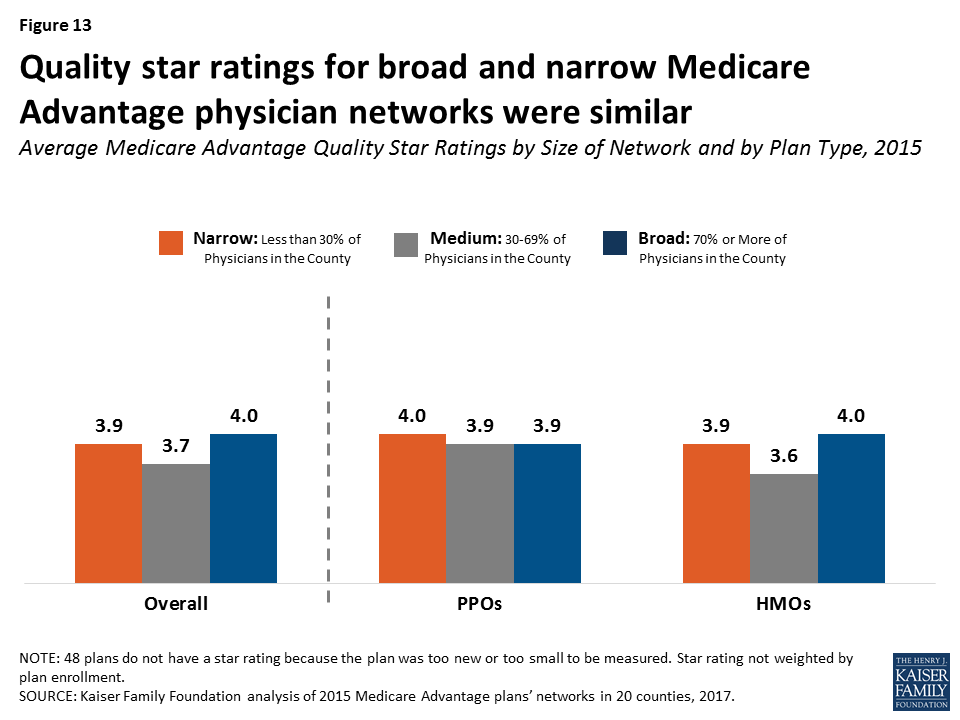
Figure 13: Quality star ratings for broad and narrow Medicare Advantage physician networks were similar

Variations in Networks By Insurer

Among the insurers offering plans in multiple counties, none consistently had broad or narrow networks. For example, while UnitedHealthcare had broad networks in Douglas, Mecklenburg, Milwaukee, Queens, and Salt Lake Counties, it had narrow networks in Clark, Harris, and Miami-Dade Counties. Likewise, Blue Cross Blue Shield (BCBS) affiliated plans had broad networks in seven counties (Allegheny, Davidson, Erie, Jefferson, King, Mecklenburg, and Salt Lake), but narrow physician networks in three counties (Harris, King, and Los Angeles). This finding suggests that local market characteristics typically are a stronger influence on network design than the philosophy or general practices of particular insurers. For consumers, this finding suggests caution against assuming a given insurer’s brand is a reliable proxy for network size.

Average County Network Size By Other County Characteristics

The average size of plans’ physician networks in a given county was not correlated with the Medicare Advantage penetration rate in the county, the Medicare spending quartile in the county, the extent to which enrollment in the county was concentrated in one plan, or enrollment. In other words, large plans with many enrollees did not have significantly broader networks than plans with fewer enrollees.

It is possible that specific local market characteristics that we could not measure, such as provider consolidation or the dominance of certain insurers in an area, are related to the size of networks. For example, in Clark County, most (55% in 2015) enrollees are in plans operated by UnitedHealthcare, which has relatively narrow networks in the county because it owns (through its Optum subsidiary) a large medical group that comprises most of its network.14 

Access To Provider Directories

The CMS Medicare Plan Finder, designed by CMS to help Medicare beneficiaries and others choose among competing plans, currently includes a link to each Medicare Advantage plan’s website, where beneficiaries can find a downloadable provider directory and/or a searchable database. Motivated consumers could check the directory or database to see if their doctors are included in the plan’s network. However, accessing the information may not be easy for users, and comparing networks could be especially challenging. Additionally, as was found in the prior analysis of Medicare Advantage hospital networks, as well as other studies, the information in the directories is often inaccurate.15 

The Medicare Plan Finder also posts an estimate of the total number of providers in the network, but the total includes physicians as well as other providers, such as hospitals, nurses, skilled nursing facilities, and laboratory testing sites. This estimate would not be helpful for Medicare beneficiaries who are looking to see if the plans available to them have a narrow or broad physician network. Further, the estimated number of providers displayed on the CMS website for each plan does not necessarily cover the same geographic area because some plans cover much broader areas than others. For example, the estimate for one plan may include the number of in-network providers in a county while the estimate for another plan may include the number of in-network providers in a state, the latter of which may or may not be useful for beneficiaries who may need to travel a great distance to see some of the in-network providers. As a consequence, the number of providers posted on the Medicare Plan Finder may not be particularly useful for people who are trying to compare plans to figure out how many physicians (or other providers) are available in-network in the area where they live.

Discussion

The results of this analysis, the first known study of Medicare Advantage physician networks, has important implications for the 19 million Medicare beneficiaries now enrolled in Medicare Advantage plans, and for the millions of Boomers who are becoming eligible for Medicare and choosing between traditional Medicare and Medicare Advantage plans.16  A prior analysis showed that Medicare Advantage hospital networks vary greatly in size and composition.17  The breadth and scope of provider networks has the potential to affect out-of-pocket costs and quality of care for Medicare enrollees. Medicare Advantage enrollees incur higher costs if they go out-of-network without prior approval in Medicare PPOs, and pay the full cost for out-of-network care in Medicare HMOs. With half of all Medicare beneficiaries living on an income of about $26,000 or less per person in 2016,18  the cost of out-of-network care could be prohibitively expensive. Provider networks can also be an important consideration for beneficiaries who value the ability to maintain care arrangements with specific physicians, or have access to certain specialists if they develop a serious medical condition. Many seniors as well as younger people find it difficult to navigate complex networks and incur “surprise” medical bills because they unintentionally went out of their plan’s network.19 

Seniors say they value having the ability to choose their own medical providers, and that provider networks are a key factor in choosing a health plan.20  Yet, seniors would be hard-pressed to compare the Medicare Advantage plan provider networks in their area to learn which have broad or narrow physician networks. The Medicare Plan Finder includes an estimate of the number of physicians and other providers in a plan’s network, but these estimates are not a reliable proxy for the relative size of a plan’s physician network.

Given the strong need for accurate, up-to-date provider directories to inform beneficiaries as they choose plans, CMS could consider a range of strategies to improve the quality of information available to current and prospective Medicare Advantage enrollees, in addition to its proposal to review all Medicare Advantage networks at least every three years.21  CMS could post provider directories for each Medicare Advantage plan, along with other information provided on the Medicare Plan Finder website. CMS could also require plans to produce provider directories in an easily comparable, uniform format to make it easier for consumers to compare the physician networks of Medicare Advantage plans in their area, as is required by plans participating in the ACA Marketplaces. Also, CMS could give insurers a stronger incentive to maintain current and accurate directories by incorporating a measure of these attributes in their star rating system.

This report documents that Medicare Advantage plans’ networks vary across the country and within counties – to a degree and in a manner that has not been previously recognized. The extent of this variation raises important questions about the experiences of current and future enrollees who unwittingly end up in narrow-network plans, as a result of their inability to evaluate plans’ provider networks. These wide variations in provider networks are also important for policymakers because they raise questions about the minimum standards for physician access and the lack of tools and resources to allow Medicare beneficiaries to compare the scope and composition of Medicare Advantage plans’ provider networks.

This issue brief was funded in part by The Retirement Research Foundation.

Appendix

Geographic Focus

This study examined Medicare Advantage plans available in 2015 in 20 counties: Allegheny County, PA; Clark County, NV; Cook County, IL; Cuyahoga County, OH; Davidson County, TN; Douglas County, NE; Erie County, NY; Fulton County, GA; Harris County, TX; Jefferson County, AL; King County, WA; Los Angeles County, CA; Mecklenburg County, NC; Miami-Dade County, FL; Milwaukee County, WI; Multnomah County, OR; New Haven County, CT; Pima County, AZ; Queens County, NY; and Salt Lake County, UT. The county is the smallest area, in general, that a Medicare Advantage plan must cover. Counties vary greatly in size and may not be the best metric to assess the health care market of particular locales, but an analysis at the county level provided the most complete set of data available for this type of analysis, as well as a reasonable snapshot of the health care market accessible to beneficiaries in that region.

Sources and Analysis of Data

We categorized networks into one of three sizes based on the share of physicians in the county that were included in the directory: broad (70% or more of the physicians), medium (30-69% of the physicians), and narrow (less than 30% of the physicians). The analysis included the 26 specialties that Medicare Advantage plans are required to include in their networks in 2015, and excluded all other specialties. For example, the analysis does not include pediatricians, diagnostic radiologists, anesthesiologists, or emergency medicine specialists.

The provider directories were collected from the websites of the insurers offering the plans during the Medicare Open Enrollment Period in order to best mimic what Medicare beneficiaries would access when selecting a plan. We focus our analysis on HMOs and local PPOs because the other types of Medicare Advantage plans either do not have networks (e.g., some private fee-for-service plans), have networks that are structured to cover areas larger than a county (e.g., regional PPOs), are paid in unique ways that influence the selection of providers available to beneficiaries (e.g., cost plans), or are not available for general enrollment (Special Needs Plans and employer group waiver plans). In 19 of 20 counties, both HMOs and local PPOs were available in 2015, with the exception of Los Angeles County, which only had Medicare Advantage HMOs. Of the 422 plans eligible to be included the analysis in the 20 counties, we were able to download the provider directories for 391 plans, including 292 HMOs and 99 local PPOs. These 391 plans accounted for 94 percent of the Medicare Advantage enrollment in the 20 counties. The provider directories missing from the analysis (31 out of 422 plans) either could not be downloaded and saved in a readable format, or were not available on the insurer’s website or directly from the insurer.

The directories were converted to machine-readable format and the text in the directories were matched against a national census of physicians maintained by SK&A using a text-matching method.22  The text-matching program searched the directories for the names of every doctor practicing in each county.

We converted the directories for each plan to a machine-readable format to conduct this analysis. Many PDF were saved as PDFs without text, requiring the files to be recreated in order to be read. Once converted to a machine-readable format, we matched the text in the directories against a national census of physicians maintained by SK&A using a text-matching method. SK&A Information Services Inc., maintains a national database of physicians, which they continuously update through a telephone verification process, and this analysis used an SK&A database prepared on January 4, 2016. The text-matching program searched the directories for the names of every doctor practicing in each county.

Using the R statistical software program, we used a publicly available PDF text converter to load each directory as a text file (.txt).23  The analysis excluded the following doctors:

  • Doctors who work exclusively for the Veterans Administrations (about a percent of all physicians).
  • Doctors whose listed specialty in SK&A was not a required category for Medicare Advantage plan networks.

SK&A assigns physicians up to two specialties. If a doctor’s primary classification was pediatrics or a select number of other specialties, they were excluded. The largest specialties not included in the analysis are pediatricians, diagnostic radiologists, anesthesiologists, emergency medicine specialists and optometrists. For the remaining doctors, we used the primary classification to categorize them into one of the 26 classifications established by CMS. For the remaining providers who were neither excluded nor classified, we turned to the secondary specialty and either grouped them with the 26 categories or dropped them. Nationally the largest specialty was primary care (32%) followed by gynecology OB/GYN (7%), cardiology (6%) and orthopedic surgery (6%). Geriatricians were defined separately; any doctor included in the analysis was grouped into a specialty as well as a geriatrician. Therefore, a geriatrician could be listed as both a primary care specialist, as well as a geriatrician. About one percent of physicians are geriatricians. In sum, more than 25% of doctors were excluded from the analysis.

The boundaries of counties do not always align with the zip codes available in the SK&A data. To be conservative, we included doctors who have at least one practice location in a zip code, which is at least partially included in one of the 20 counties. Our text-matching method searched for a string match of all the doctors in a given county. For each doctor’s name within the county, we flagged every occurrence where the last name was within three words of the first name. This method would identify both “Johnathan Hancock” and “Hancock, Johnathan” as well as cases in which the directory included a middle name or title such as “Johnathan Adam Hancock”, “Hancock IV, Johnathan Adam” or “Hancock, (Surgeon), Johnathan Adam”.

In addition, we searched last names and up to nine nicknames for every doctors in the county. For example, we would successfully identify “Johnathan Hancock” as either “John Hancock” or “Johnny Hancock”. We selected 435 formal names, which often have nicknames; for example Matt as a nickname for Matthew or Bill, Billy, Will, Willie, Willy as nicknames for William. Thirty-eight percent of physicians in the 20 counties had at least one nickname – about 0.64 percent had six or more nicknames (Elizabeth, Katherine, Margaret).

To reduce match errors with hyphenated last names – we eliminated punctuation – so regardless of whether a directory listed Kareem Abdul-Jabbar as “Kareem Abdul-Jabbar”, “Kareem Abdul Jabbar”, or “Kareem AbdulJabbar” we would successfully identify the doctor as practicing.

To test the validity of the text-matching program, 20 names were drawn at random from each of the 20 counties (400 names in total) using the SK&A dataset, and then a person searched for those names in the directories by hand, in the same fashion that an enrollee would look for their doctor. For 377 out of 400 names (94%), the person and the text-matching program agreed. Of the names that did not match, 3% were false-negatives (text-matching program did not count the physician in the directory when it should have done so) and 3% were false-positives, indicating that the totals were 99.8% accurate. The most important form of error may be the accuracy of the provider directory – our text analysis only identifies whether a provider is listed in the directory, not whether that provider is taking new patient or even still practicing in the service area. The error in our text analysis method may work to both overestimate and underestimate the percentage of doctors.

Some examples of potential false-positives – or cases in which out method would over estimate the number of doctors may include:

  • Cases in which the directory contains the name of someone who is not an eligible physician and there is an eligible physician by the same name practicing in the county but is not included in the network. For example, a plan does not include a primary care doctor named “Marie Curie” but does include an optometrist by the same name “Marie Curie”.
  • While most directories are structured as list of physicians followed by contact information it is possible that there are at least some occurrences of false-positives through the proximity of names. For example if a directory included the sentence, “Thomas Jefferson and John Adam were fierce political rivals” and there happened to be a physicians in the county named “John Jefferson” we would incorrectly identify him as a physician in the plan.
  • If a county included multiple doctors with the same name, and a plan only included one of these doctors in its network – we would incorrectly identify them all as participating. Only 502 instances occurred where there were duplicate names (out of 66,679 physicians).

Alternatively, there are cases in which our text analysis may undercount the percentage of doctors participating in the network. Some examples of true-negatives may include cases in which a directory lists a physician under a different name than the one listed in the SK&A directory. This may include cases in which the physician’s name is spelled differently in the directory and the SK&A database or the doctor uses only one of their two hyphenated last names.

Some of this study’s findings were aggregated by county and across counties by weighting each plan’s results by its enrollment using the Centers for Medicare and Medicaid Services Medicare Advantage Enrollment files for March 2015. Data on plan enrollment was made available by CMS for March 2015 (”State/County/Contract/Plan (CPSC) Enrollment Data”). No enrollment data is available for plans with fewer than 10 enrollees (7% of the plans in our sample).24  Categorization of the plans as Preferred Provider Organizations (PPO) and Health Maintenance Organization (HMO) was made by CMS.25 

Tables

Table 1. Characteristics of Counties Included in the Analysis, 2015
CountyLargest cityNumber of Plans Available in County (Universe)Number of Plans Successfully EvaluatedMedicare Advantage Enrollment EvaluatedMedicare Advantage Penetration RatePercent of Enrollment in County EvaluatedCounties’ Enrollment As Percent of National Medicare Advantage Market
All Counties4223911,512,62440%94%13.9%
Allegheny, PAPittsburgh2222100,83262%100%0.9%
Clark, NVLas Vegas111198,76738%100%0.8%
Cook, ILChicago191851,40417%64%0.7%
Cuyahoga, OHCleveland262018,23137%40%0.4%
Davidson, TNNashville151527,62442%100%0.2%
Douglas, NEOmaha131315,50123%100%0.1%
Erie, NYBuffalo252574,04356%100%0.6%
Fulton, GAAtlanta171521,93335%96%0.2%
Harris, TXHouston3128122,83839%100%1.1%
Jefferson, ALBirmingham121235,86242%100%0.3%
King, WASeattle262373,97634%98%0.7%
Los Angeles, CALos Angeles3534379,71543%99%3.3%
Mecklenburg, NCCharlotte151526,53531%100%0.2%
Miami-Dade, FLMiami3129204,50362%100%1.8%
Milwaukee, WIMilwaukee6531,69741%98%0.3%
Multnomah, ORPortland303043,94158%100%0.4%
New Haven, CTNew Haven161332,47528%94%0.3%
Pima, AZTucson131355,75446%100%0.5%
Queens, NYNew York City463752,73943%62%0.7%
Salt Lake, UTSalt Lake City131344,25441%100%0.4%
SOURCE: Kaiser Family Foundation analysis of CMS Medicare Advantage enrollment and landscape files for 2015.
Table 2. Distribution of Medicare Advantage Plans’ Physician Networks Versus Plan Enrollment, 2015
 Distribution of Medicare Advantage PlansDistribution of Medicare Advantage Enrollees
CountyNarrow(Less than 30%)Medium(30-69%)Broad(At Least 70%)Narrow(Less than 30%)Medium(30-69%)Broad(At Least 70%)
All Counties27%52%21%35%43%22%
Allegheny, PA0%5%95%0%0%100%
Clark, NV45%55%0%91%9%0%
Cook, IL39%61%0%40%60%0%
Cuyahoga, OH35%45%20%3%70%27%
Davidson, TN0%73%27%0%74%26%
Douglas, NE0%69%31%0%24%76%
Erie, NY16%28%56%0%3%96%
Fulton, GA27%73%0%20%80%0%
Harris, TX61%39%0%78%22%0%
Jefferson, AL0%83%17%0%71%29%
King, WA22%70%9%14%72%14%
Los Angeles, CA53%47%0%51%49%0%
Mecklenburg, NC0%0%100%0%0%100%
Miami-Dade, FL66%34%0%46%54%0%
Milwaukee, WI0%40%60%0%7%93%
Multnomah, OR20%80%0%26%74%0%
New Haven, CT0%62%38%0%49%51%
Pima, AZ31%69%0%15%85%0%
Queens, NY27%68%5%2%75%23%
Salt Lake, UT0%54%46%0%38%62%
SOURCE: Kaiser Family Foundation analysis of Medicare Advantage plans’ physician networks in 20 counties, 2017.
Table 3. Distribution Across Plans of the Share of Physicians Included in Medicare Advantage Plans’ Networks, 2015
 Number of PlansAverageMinimum25th PercentileMedian75th PercentileMaximum
All Counties39146%1%28%44%64%87%
Allegheny, PA2277%30%72%74%87%87%
Clark, NV1141%21%25%53%53%60%
Cook, IL1832%17%28%33%35%54%
Cuyahoga, OH2041%7%21%40%50%77%
Davidson, TN1562%37%56%65%68%77%
Douglas, NE1358%43%44%58%75%79%
Erie, NY2560%4%50%80%81%83%
Fulton, GA1539%11%29%40%54%59%
Harris, TX2833%17%23%28%43%59%
Jefferson, AL1254%42%43%52%55%82%
King, WA2341%14%32%42%46%76%
Los Angeles, CA3428%1%18%28%42%46%
Mecklenburg, NC1573%70%70%70%77%82%
Miami-Dade, FL2925%4%17%26%33%46%
Milwaukee, WI567%42%52%79%81%81%
Multnomah, OR3042%9%37%40%60%65%
New Haven, CT1365%53%54%66%73%73%
Pima, AZ1343%22%28%46%55%66%
Queens, NY3740%6%26%39%58%71%
Salt Lake, UT1366%34%59%63%82%83%
NOTE: All percentages are not weighted by the number of enrollees in each plan.SOURCE: Kaiser Family Foundation analysis of Medicare Advantage plans’ physician networks in 20 counties, 2017.
Table 4. Average Share of Physicians Included in Medicare Advantage Plans’ Networks, by County and Specialty, 2015
SpecialtyAll CountiesAllegheny ClarkCookCuyahogaDavidsonDouglas
All Specialties46%77%41%32%41%62%58%
Primary Care42%77%32%30%40%47%51%
Geriatricians43%88%38%37%46%68%76%
Allergy and Immunology51%75%41%33%43%67%78%
Cardiology54%86%52%43%41%82%65%
Cardiothoracic Surgery55%86%29%46%37%83%53%
Dermatology48%81%48%26%48%65%85%
Endocrinology45%85%36%28%33%66%63%
ENT/ Otolaryngology53%90%64%32%47%79%63%
Gastroenterology56%83%59%37%49%82%74%
General Surgery51%77%44%31%40%67%61%
Gynecology, OB/GYN46%75%51%30%40%53%66%
Infectious Diseases45%82%52%46%43%50%53%
Nephrology52%74%74%39%38%80%59%
Neurology46%75%35%33%35%74%61%
Neurosurgery50%80%69%34%42%90%51%
Medical, Surgical Oncology47%83%51%34%49%77%67%
Radiation/ Radiation Oncology52%47%71%43%56%88%38%
Ophthalmology59%88%57%39%51%73%74%
Orthopedic Surgery49%82%37%32%48%64%66%
Physiatry, Rehabilitative Medicine38%67%33%24%29%61%38%
Plastic Surgery35%79%10%27%35%39%55%
Podiatry48%77%42%31%38%63%69%
Psychiatry23%45%9%13%25%43%32%
Pulmonology53%88%56%43%41%71%62%
Rheumatology44%72%45%28%42%65%58%
Urology57%88%54%43%44%78%64%
Vascular Surgery55%93%24%32%49%61%71%
ErieFulton HarrisJeffersonKingLos AngelesMecklenburg
All Specialties60%39%33%54%41%28%73%
Primary Care57%32%28%50%39%32%71%
Geriatricians43%30%32%35%33%29%83%
Allergy and Immunology71%44%27%35%49%28%73%
Cardiology70%50%40%59%53%34%88%
Cardiothoracic Surgery68%53%45%77%51%40%79%
Dermatology60%39%31%46%42%17%78%
Endocrinology63%39%28%44%42%24%74%
ENT/ Otolaryngology62%44%27%51%46%27%87%
Gastroenterology68%52%37%68%52%32%85%
General Surgery67%45%40%68%45%31%77%
Gynecology, OB/GYN57%27%30%60%35%26%84%
Infectious Diseases60%49%36%51%47%26%56%
Nephrology61%48%43%41%46%39%60%
Neurology62%49%34%38%49%24%70%
Neurosurgery73%41%31%66%38%35%69%
Medical, Surgical Oncology55%54%23%35%48%26%77%
Radiation/ Radiation Oncology73%59%42%83%38%30%90%
Ophthalmology70%55%54%77%51%34%81%
Orthopedic Surgery59%43%36%59%43%24%79%
Physiatry, Rehabilitative Medicine53%31%25%50%40%18%73%
Plastic Surgery54%25%20%30%22%15%39%
Podiatry68%46%36%80%42%28%69%
Psychiatry36%18%25%34%22%7%30%
Pulmonology62%52%38%68%52%33%76%
Rheumatology54%31%28%42%52%24%60%
Urology66%51%51%86%46%32%79%
Vascular Surgery66%57%50%84%51%38%66%
Miami-DadeMilwaukeeMultnomahNew HavenPimaQueens Salt Lake
All Specialties25%67%42%65%43%40%66%
Primary Care20%65%35%54%41%37%60%
Geriatricians18%50%29%75%36%34%59%
Allergy and Immunology53%73%50%64%54%43%69%
Cardiology31%74%44%82%53%50%71%
Cardiothoracic Surgery35%90%54%79%51%43%74%
Dermatology24%63%48%79%44%44%68%
Endocrinology21%64%46%73%34%40%66%
ENT/ Otolaryngology34%69%60%77%52%50%78%
Gastroenterology44%73%61%79%48%50%72%
General Surgery33%70%54%79%51%45%67%
Gynecology, OB/GYN23%74%51%66%44%41%67%
Infectious Diseases27%62%30%45%59%34%55%
Nephrology37%79%56%73%60%38%67%
Neurology31%64%32%69%41%44%66%
Neurosurgery23%61%40%69%56%37%80%
Medical, Surgical Oncology24%71%34%68%39%46%72%
Radiation/ Radiation Oncology40%66%45%74%67%38%49%
Ophthalmology31%73%61%87%53%55%82%
Orthopedic Surgery27%77%44%83%53%39%73%
Physiatry, Rehabilitative Medicine10%55%31%61%29%43%60%
Plastic Surgery11%65%41%65%31%32%55%
Podiatry20%68%52%84%46%31%70%
Psychiatry10%41%23%26%7%20%37%
Pulmonology47%80%55%70%28%49%56%
Rheumatology38%54%44%66%50%35%52%
Urology44%77%57%88%50%54%71%
Vascular Surgery28%64%46%71%67%56%84%
NOTE: All percentages not weighted by the number of enrollees in each plan.SOURCE: Kaiser Family Foundation analysis of Medicare Advantage plans’ physician networks in 20 counties, 2017.
Table 5. Average Share of Physicians Included in Medicare Advantage HMO and PPO Networks, By County, 2015
CountyNumber of PlansSize of Provider Networks, by Plan Type
TotalHMOPPOOverallHMOPPO
All Counties3912929946%42%57%
Allegheny, PA2213977%80%73%
Clark, NV116541%30%56%
Cook, IL1812632%29%37%
Cuyahoga, OH2015541%33%65%
Davidson, TN1511462%57%75%
Douglas, NE138558%58%59%
Erie, NY2518760%65%47%
Fulton, GA1510539%34%48%
Harris, TX2819933%27%44%
Jefferson, AL129354%48%71%
King, WA2318541%37%58%
Los Angeles, CA3434028%28%N/A
Mecklenburg, NC159673%74%72%
Miami-Dade, FL2926325%24%30%
Milwaukee, WI53267%71%61%
Multnomah, OR30171343%40%46%
New Haven, CT1311265%65%66%
Pima, AZ1312143%41%66%
Queens, NY3733440%38%60%
Salt Lake, UT138566%60%74%
NOTE: No Medicare Advantage PPOs were offered in Los Angeles County in 2015. All percentages are not weighted by the number of enrollees in each plan.SOURCE: Kaiser Family Foundation analysis of Medicare Advantage plans’ physician networks in 20 counties, 2017.

Endnotes

  1. Jacobson G, Swoope C, Perry M, and Slosar M. “How are Seniors Choosing and Changing Health Insurance Plans?,” Kaiser Family Foundation, May 2014. Available at: http://modern.kff.org/medicare/report/how-are-seniors-choosing-and-changing-health-insurance-plans/. ↩︎
  2. Jacobson G, Damico A, Neuman T, and Gold M. “Medicare Advantage 2017 Spotlight: Enrollment Market Update,” Kaiser Family Foundation, June 2017. Available at: http://modern.kff.org/medicare/issue-brief/medicare-advantage-2017-spotlight-enrollment-market-update/. ↩︎
  3. See Centers for Medicare and Medicaid Services, CY2016 MA HSD Provider and Facility Specialties and Network Adequacy Criteria Guidance. Available at: https://www.cms.gov/Medicare/Medicare-Advantage/MedicareAdvantageApps/Downloads/CY2016_MA_HSD_Network_Criteria_Guidance.pdf. ↩︎
  4. A prior analysis found that 16 percent of Medicare Advantage plans had narrow hospital networks, defined as including less than 30 percent of the hospitals in a county. See Jacobson G, Trilling A, Neuman T, Damico A, and Gold M. “Medicare Advantage Hospital Networks: How Much Do They Vary?,” Kaiser Family Foundation, June 2016. Available at: http://modern.kff.org/report-section/medicare-advantage-hospital-networks-how-much-do-they-vary-results/. ↩︎
  5. US Government Accountability Office, “Medicare Advantage: Actions Needed to Enhance CMS Oversight of Provider Network Adequacy,” August 2015. Available at: http://www.gao.gov/assets/680/672236.pdf. Resneck JS, Quiggle A, Liu M, and Brewster DW. “The Accuracy of Dermatology Network Physician Directories Posted by Medicare Advantage Health Plans in an Era of Narrow Networks,” JAMA Dermatol., October 2014; 150(12):1290-1297. Available at: http://jamanetwork.com/journals/jamadermatology/fullarticle/1919439. ↩︎
  6. Centers for Medicare and Medicaid Services, “Online Provider Directory Review Report,” January 13, 2017. Available at: https://www.cms.gov/Medicare/Health-Plans/ManagedCareMarketing/Downloads/Provider_Directory_Review_Industry_Report_Final_01-13-17.pdf. ↩︎
  7. For a description of the network categories relative to McKinsey & Company’s categories, see the Methods section of Jacobson G, Trilling A, Neuman T, Damico A, and Gold M. “Medicare Advantage Hospital Networks: How Much Do They Vary?,” Kaiser Family Foundation, June 2016. Available at: http://modern.kff.org/report-section/medicare-advantage-hospital-networks-how-much-do-they-vary-results/. ↩︎
  8. Polsky D, Cidav Z, and Swanson A. “Marketplace Plans with Narrow Physician Networks Feature Lower Monthly Premiums Than Plans with Larger Networks,” Health Affairs, October 2016. Available at: http://content.healthaffairs.org/content/35/10/1842.abstract. ↩︎
  9. This finding is similar to those in another report discussing physician networks for mental health care in the ACA marketplaces; see Zhu J, Zhang Y, and Polsky D. “Networks In ACA Marketplaces Are Narrower For Mental Health Care Than For Primary Care,” Health Affairs, September 2017. Available at: http://content.healthaffairs.org/content/36/9/1624.abstract. ↩︎
  10. Note that 9 plans in our analysis had no psychiatrists in the directories, and are not included in the ratio analysis. We consider this to be a conservative method in estimating the enrollee burden; if these plans were included, the ratios of enrollees to psychiatrists would be larger. ↩︎
  11. Jacobson G, Damico A, Neuman T, and Gold M. “Medicare Advantage 2017 Spotlight: Enrollment Market Update,” Kaiser Family Foundation, June 2017. Available at: http://modern.kff.org/medicare/issue-brief/medicare-advantage-2017-spotlight-enrollment-market-update/. ↩︎
  12. Among plans offered in the same county by the same insurer, but without a common provider network, HMOs included 48 percent of all physicians in their county, on average, while PPOs included 58 percent of physicians in their county, on average. ↩︎
  13. Dafny L, Hendel I, Marone V, and Ody C. “Narrow Networks On The Health Insurance Marketplaces: Prevalence, Pricing, And The Cost Of Network Breadth,” Health Affairs, September 2017. Available at: http://content.healthaffairs.org/content/36/9/1606.abstract?sid=230cbad6-de5b-4c55-b4aa-26b01641a875. ↩︎
  14. Business Wire, “UnitedHealth Group Signs Definitive Agreement to Acquire Sierra Health Services, Inc.” March 12, 2007. Available at: http://www.businesswire.com/news/home/20070312005513/en/UnitedHealth-Group-Signs-Definitive-Agreement-Acquire-Sierra. ↩︎
  15. A prior analysis of Medicare Advantage hospital networks found that 11 out of 231 plans included hospitals that had been torn down or closed. See Jacobson G, Trilling A, Neuman T, Damico A, and Gold M. “Medicare Advantage Hospital Networks: How Much Do They Vary?,” Kaiser Family Foundation, June 2016. Available at: http://modern.kff.org/report-section/medicare-advantage-hospital-networks-how-much-do-they-vary-results/. See also Centers for Medicare and Medicaid Services, “Online Provider Directory Review Report,” January 13, 2017. Available at: https://www.cms.gov/Medicare/Health-Plans/ManagedCareMarketing/Downloads/Provider_Directory_Review_Industry_Report_Final_01-13-17.pdf. See also US Government Accountability Office, “Medicare Advantage: Actions Needed to Enhance CMS Oversight of Provider Network Adequacy,” August 2015. Available at: http://www.gao.gov/assets/680/672236.pdf. ↩︎
  16. Jacobson G, Damico A, Neuman T, and Gold M. “Medicare Advantage 2017 Spotlight: Enrollment Market Update,” Kaiser Family Foundation, June 2017. Available at: http://modern.kff.org/medicare/issue-brief/medicare-advantage-2017-spotlight-enrollment-market-update/. ↩︎
  17. A prior analysis found that 16 percent of Medicare Advantage plans had narrow hospital networks, defined as including less than 30 percent of the hospitals in a county. See Jacobson G, Trilling A, Neuman T, Damico A, and Gold M. “Medicare Advantage Hospital Networks: How Much Do They Vary?,” Kaiser Family Foundation, June 2016. Available at: http://modern.kff.org/report-section/medicare-advantage-hospital-networks-how-much-do-they-vary-results/. ↩︎
  18. Jacobson G, Griffin S, Neuman T, and Smith K. “Income and Assets of Medicare Beneficiaries, 2016-2035,” Kaiser Family Foundation, April 2017. Available at: http://modern.kff.org/medicare/issue-brief/income-and-assets-of-medicare-beneficiaries-2016-2035/. ↩︎
  19. For more information, see Pollitz, K. “Surprise Medical Bills,” Kaiser Family Foundation, March 2016. Available at: http://modern.kff.org/private-insurance/issue-brief/surprise-medical-bills/. ↩︎
  20. Jacobson G, Swoope C, Perry M, and Slosar M. “How are Seniors Choosing and Changing Health Insurance Plans?,” Kaiser Family Foundation, May 2014. Available at: http://modern.kff.org/medicare/report/how-are-seniors-choosing-and-changing-health-insurance-plans/. ↩︎
  21. Federal Register, Volume 82, No. 137, July 19, 2017. Available at: https://www.gpo.gov/fdsys/pkg/FR-2017-07-19/pdf/2017-15071.pdf. ↩︎
  22. See SK&A, Physician Data. Available at: http://www.skainfo.com/databases/physician-data. ↩︎
  23. Cichini, K. “Reading and Text Mining a PDF-File in R,” September 2012. Available at: http://thebiobucket.blogspot.com/2012/09/reading-and-text-mining-pdf-file-in-r.html. ↩︎
  24. See Centers for Medicare and Medicaid Services, Monthly Enrollment by Contract/Plan/State/County. Available at: https://www.cms.gov/research-statistics-data-and-systems/statistics-trends-and-reports/mcradvpartdenroldata/monthly-enrollment-by-contract-plan-state-county.html. ↩︎
  25. See Centers for Medicare and Medicaid Services, Plan Crosswalks. Available at: https://www.cms.gov/Research-Statistics-Data-and-Systems/Statistics-Trends-and-Reports/MCRAdvPartDEnrolData/Plan-Crosswalks.html. ↩︎
News Release

New Analysis Finds High Out-of-Pocket Spending Increased for People Covered by Large Employer Plans

Updated Brief Tracks Rise in Workers’ Out-of-Pocket Insurance Costs

Published: Oct 5, 2017


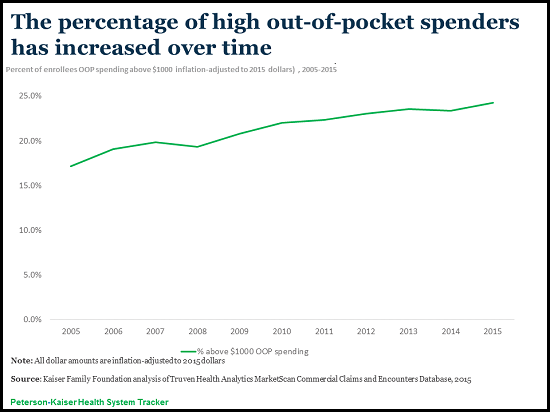
A new Kaiser Family Foundation analysis finds about one in four people (24%) covered by large employer plans spent more than $1,000 out-of-pocket on health care in 2015, an increase of seven percentage points from 17 percent in 2005.

About 1 in 10 people in such plans (12%) paid more than $2,000 out-of-pocket in 2015, a distribution that mirrors the distribution of overall health spending, according to the new analysis of claims data. Dollar amounts in the analysis are inflation-adjusted to 2015 dollars.

In addition to overall trends, the analysis also examines gender and age of high spenders, as well as differences in out-of-pocket health expenditures across diseases. It finds:

  • Among large-group enrollees spending more than $1,000 out-of-pocket in 2015, 59 percent were women, and 41 percent were men.
  • Older enrollees were more likely than younger enrollees to spend more than $1,000 out-of-pocket.
  • In 2015, average annual out-of-pocket spending for large-group enrollees diagnosed with common cancers ($1,510) and all circulatory diseases ($1,508) was nearly twice that for all enrollees ($778).

Additionally, an updated version of another analysis tracks a continuing trend of rising out-of-pocket costs outpacing costs paid by insurers for workers covered by their employer’s health plans.

The update finds that between 2005 and 2015, covered workers’ average out-of-pocket costs grew 66 percent, compared to health plans’ average payment per enrollee, which rose by 56 percent. Wages, meanwhile, rose by 31% during that period. Overall, workers’ out-of-pocket costs rose from an average of $469 in 2005 to $778 in 2015, while average payment by health plans rose from $2,932 to $4,563.

The chart collection, related brief, and updated analysis are available on the Peterson-Kaiser Health System Tracker.


Payments for Cost Sharing Increasing Rapidly Over Time

Published: Oct 5, 2017

This updated Kaiser Family Foundation analysis tracks a trend of rising out-of-pocket costs outpacing costs paid by insurers for workers covered by their employer’s health plans.

Between 2005 and 2015 covered workers’ average out-of-pocket costs grew 66 percent, outpacing health plans’ average payment per enrollee, which rose by 56 percent. Wages, meanwhile, rose by 31% during that period. Overall, workers’ out-of-pocket costs rose from an average of $469 in 2005 to $778 in 2015, while average payment by health plans rose from $2,932 to $4,563.

The brief examines a sample of claims from large employer plans contained in the Truven Health Analytics MarketScan Commercial Claims and Encounters Database.

The analysis is part of the Peterson-Kaiser Health System Tracker, an online information hub dedicated to monitoring and assessing the performance of the U.S. health system.

The Role of Medicaid and Impact of the Medicaid Expansion for Veterans Experiencing Homelessness

Authors: Samantha Artiga, Barbara DiPietro, and Petry Ubri
Published: Oct 3, 2017

Issue Brief

Key Takeaways

Veterans remain at higher risk of experiencing homelessness than the rest of the population. Although some veterans have access to health care through the Department of Veterans Affairs (VA), Medicaid plays an important role for this population, particularly those experiencing homelessness. This brief describes Medicaid’s role for veterans experiencing homelessness and provides insight into how the Affordable Care Act (ACA) Medicaid expansion has affected their coverage and access to care. It shows:

  • Veterans are more likely to experience homelessness than the overall population, and those experiencing homelessness have significant health needs. Veterans make up about 9% of the adult population but constitute nearly 12% of persons experiencing homelessness. Veterans who are poor; have a disability, chronic health condition, or mental health issue; lack support networks; and/or have a history of substance use are at particularly high risk of experiencing homelessness.
  • The ACA Medicaid expansion has led to increased coverage and access to care for veterans, including those experiencing homelessness. Medicaid plays an important role covering veterans who would otherwise be uninsured and supplements Medicare, private, VA or military coverage for others. Medicaid is particularly important for veterans experiencing homelessness who have high rates of chronic health conditions, disabilities, mental health issues, and alcohol or substance use disorders. Research shows that there have been gains in coverage among veterans overall since implementation of the Medicaid expansion. Moreover, data from Health Care for the Homeless (HCH) projects, which are clinics that serve individuals experiencing homelessness, show positive impacts of the Medicaid expansion for veterans experiencing homelessness. Specifically, data reported by nine HCH projects show higher rates of Medicaid coverage among veteran patients at HCH projects in expansion states than in non-expansion states. Further, four HCH projects able to report data for 2013 and 2016 show significant increases in the share of veteran patients covered by Medicaid over the period. Personal stories from veterans experiencing homelessness who gained coverage under the expansion and are connected to HCH projects also illustrate how Medicaid improved their access to care and health, providing greater stability in their overall lives.
  • Restructuring of Medicaid at the federal level or through waivers sought by states would have significant implications for veterans experiencing homelessness. Reductions in Medicaid, particularly loss of the Medicaid expansion, would likely result in many of these individuals becoming uninsured and going without needed care, which would lead to greater instability in their lives. Moreover, increases in out of pocket costs and/or work requirements could pose significant challenges for these individuals given their complex health needs and limited resources.

Introduction

This brief provides an overview of Medicaid’s role supporting health coverage and care for veterans, including those experiencing homelessness. In addition, through data from Health Care for the Homeless (HCH) projects and individual stories, it examines how the Affordable Care Act (ACA) Medicaid expansion has affected coverage and care for veterans experiencing homelessness.

Homelessness among Veterans

Although the number of veterans experiencing homelessness on a given night has declined by 17% since 2015,1  veterans remain more likely to experience homelessness than the overall population.2  Veterans make up about 9% of the adult population but constitute nearly 12% of persons experiencing homelessness.3  While the exact number of veterans experiencing homelessness is unknown given the difficulty of tracking the homeless population, the U.S. Department of Housing and Urban Development (HUD) estimates that, in 2015, nearly 133,000 veterans experienced sheltered homelessness at some point throughout the year.4  They also estimate that on a given night in January 2016, 40,000 veterans experienced homelessness, including over 13,000 unsheltered homeless veterans living on the streets.5 ,6 

Veterans experiencing homelessness have significant health needs that are often complicated and exacerbated by lack of housing. Veterans who are poor; have a disability, chronic health condition, or mental health issue; lack support networks; and/or have a history of substance use are at particularly high risk of experiencing homelessness.7  Veterans experiencing homelessness are disproportionately male (91%), young (43%), Black (39%), and live in a city (74%) as compared to the overall veteran population.8  Approximately 53% of veterans experiencing homelessness have some type of disability as compared to 28% of the overall veteran population.9  Homelessness is also associated with chronic health conditions, as these conditions can be a cause or preceding factor to homelessness or be the result of or exacerbated by lack of stable housing.10  Given the high needs of these individuals, homelessness is often associated with high rates of emergency department use and inpatient hospitalizations, and health complications.11 

The Role of Medicaid and Impact of the Medicaid Expansion

The #ACA #Medicaid expansion has led to increased coverage for veterans, including those experiencing homelessness.

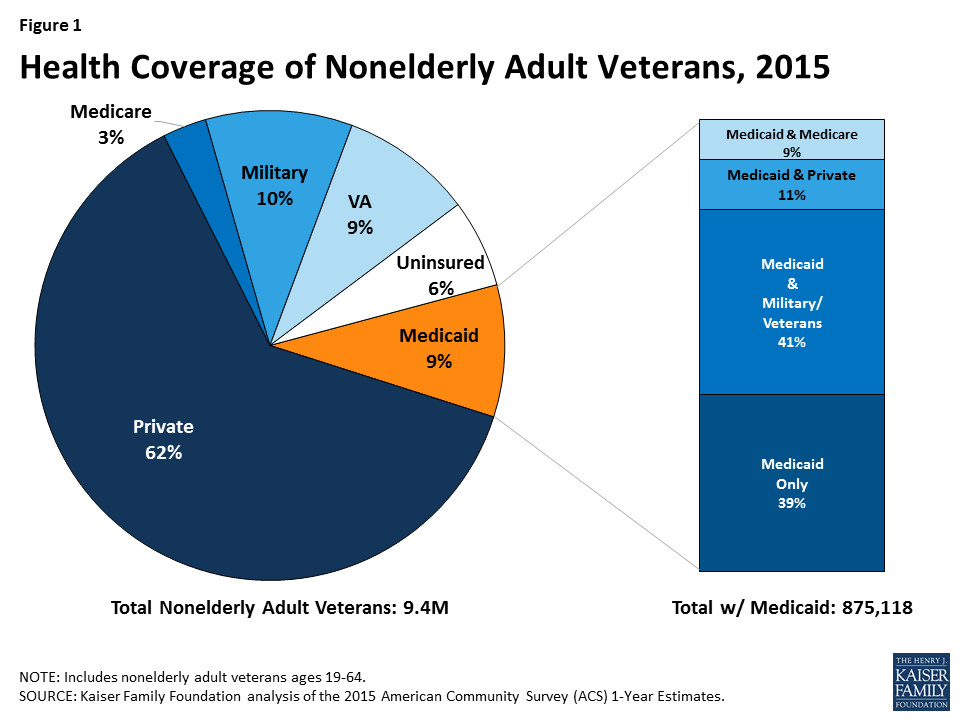
Medicaid plays an important role covering veterans who would otherwise be uninsured and supplements Medicare, private, VA or military coverage for others. Although the U.S. Department of Veterans Affairs (VA) offers health benefits to veterans, not all veterans can access care through the VA. Some veterans do not qualify for health benefits through the VA, some may not enroll even if they do qualify, and/or some veterans live outside of an area where a VA facility is located.12  As such, other sources of coverage, including Medicaid, are important for veterans. Medicaid covers 875,000, or nearly 1 in 10, nonelderly adult veterans overall (Figure 1). For nearly two in five nonelderly adult veterans (39%) with Medicaid coverage, Medicaid is their sole source of coverage. Medicaid serves as a supplement to military/VA, private, or Medicare coverage for the remaining 61% of veterans with Medicaid coverage, enhancing their ability to receive needed care and reducing out-of-pocket costs for care. Medicaid is particularly important for veterans experiencing homelessness who often lack access to other sources of coverage and have high rates of chronic health conditions, disabilities, mental health issues, and alcohol or substance use disorders.

Figure 1: Health Coverage of Nonelderly Adult Veterans, 2015

Medicaid coverage among veterans has increased since implementation of the ACA Medicaid expansion in 2014, contributing to improvements in access to care and health outcomes. The ACA Medicaid expansion to adults with incomes up to 138% of poverty made many adults, particularly adults without dependent children, newly eligible for the program in the 32 states that have adopted the expansion. Research shows that since implementation of the expansion, Medicaid coverage among veterans has increased and their uninsured rate has fallen.13 ,14 ,15  Research also shows that the Medicaid expansion has had a positive impact on access to and utilization of care among the low-income population, and that nonelderly veterans with Medicaid coverage fare better on measures of access and utilization than those who are uninsured.16 ,17  As presented below, data from HCH projects and personal stories from individuals further show that the Medicaid expansion has had positive impacts on coverage, access to care, and health outcomes for veterans experiencing homelessness.

Data from Health Care for the Homeless Projects

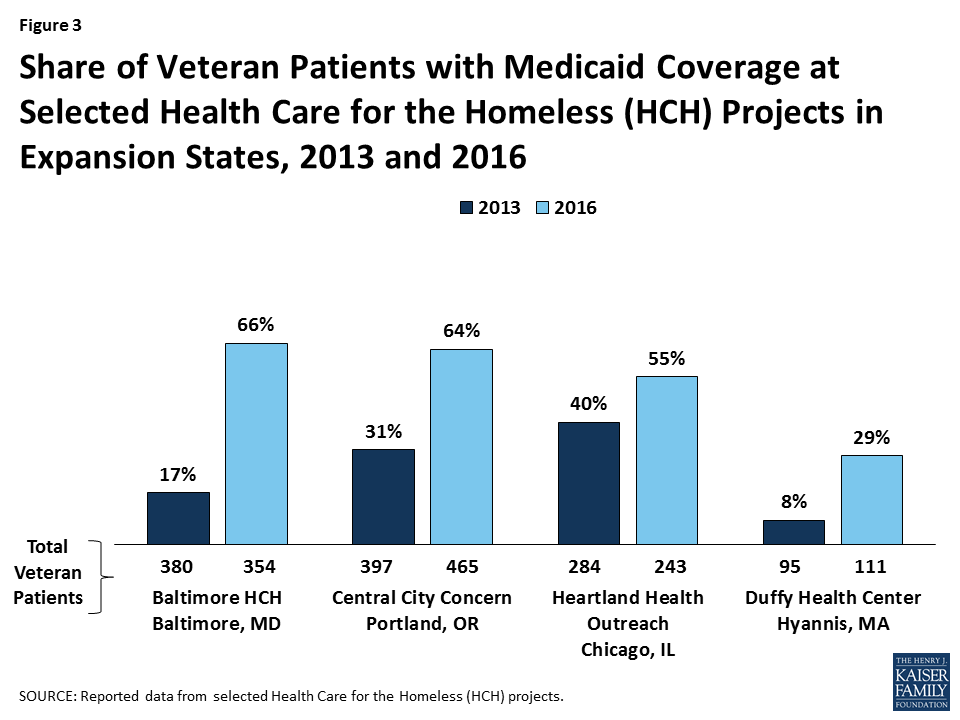
Data from a select number of HCH projects suggest that the Medicaid expansion led to broader Medicaid coverage among veterans experiencing homelessness. Specifically, data reported by nine HCH projects show that those in Medicaid expansion states have a much larger share of the veterans they serve covered by Medicaid (55%) compared those in non-expansion states (5%) (Figure 2). Moreover, four HCH projects in expansion states that were able to report data for both 2013 and 2016 show that the share of veterans they serve who have Medicaid coverage significantly increased from 2013 to 2016 (Figure 3).

Figure 2: Share of Veteran Patients with Medicaid Coverage at Selected Healthcare for the Homeless (HCH) Projects by State Medicaid Expansion Status, 2016
Figure 3: Share of Veteran Patients with Medicaid Coverage at Selected Health Care for the Homeless (HCH) Projects in Expansion States, 2013 and 2016

Personal Stories from Veterans Experiencing Homelessness

Personal stories from veterans experiencing homelessness who enrolled in Medicaid under the expansion and are connected to care through HCH projects also illustrate how Medicaid has improved their access to care and health outcomes. These experiences show that Medicaid coverage has enabled these individuals to access preventive health services; receive treatment for serious health issues, like cancer; and manage chronic health conditions and recovery from substance use disorders. Without the Medicaid expansion, many of these individuals would likely be uninsured. In contrast, a profile from a veteran experiencing homelessness who remains uninsured because his state has not adopted the Medicaid expansion shows how he continues to face challenges accessing the care he needs.

Medicaid was instrumental in supporting C.J.’s diagnosis and treatment for prostate cancer.

C.J., a 62-year old man, spent 11 years in the Army, including two tours in Germany training new recruits. He returned home with his wife and children, working at Fort Meade before moving to Baltimore where he worked in construction. Two years ago, C.J. started to notice pain and swelling in his pelvis, which worsened over time and made his job lifting heavy equipment more difficult. He had health insurance through his employer, but he could not afford the out-of-pocket costs to access care. Eventually, C.J. had trouble walking and had to take unpaid medical leave. After several months, he was laid off, losing both his job and his insurance and ultimately landing up with nowhere to live. After connecting to a health center, he was enrolled in Medicaid under the Medicaid expansion. Following several tests and biopsies, C.J. was diagnosed with prostate cancer. Medicaid enabled him to access the daily radiation treatments he needed to treat his cancer and transportation to get to these appointments. C.J. is hoping to be declared in remission at his next appointment and is grateful that he was able to access the care he needed through Medicaid.

“I don’t want to think about what would have happened without Medicaid. It would be a fast road to digging my grave.”

Medicaid helps C.L. manage his chronic health conditions and supports his continued recovery from substance use.

C.L. is a 53-year old man who served in the Army National Guard from 1980-1982 and then served on active duty from 1982-1983. He completed two additional years with the National Guard between 1991 and 1993. C.L. worked for the city government for nearly 20 years and had stable housing and employer-sponsored insurance. Escalating mental health and substance use issues led to his loss of employment in 2012 and, with it, his health insurance. Though he previously qualified for VA benefits, he could no longer access them due to changes in eligibility rules based on length of service. As such, C.L. became uninsured. C.L. has been homeless since 2012 and is currently staying at a transitional housing program in Baltimore City. He has diabetes, high blood pressure, depression, and an opioid use disorder. In 2014, C.L. gained Medicaid coverage through the Medicaid expansion. He has found it a great relief to know that the physical and behavioral services he needs are covered.

“I just got a prostate check and that was normal. I had a colonoscopy too, and they found non-cancerous polyps so I have to go back to check that soon. If I were uninsured, I’d worry a lot about whether I could afford to get those cancer tests.”

Medicaid enabled W.B. to fully recover from a work injury and receive treatment for his behavioral health needs, allowing him once again to seek work.

W.B. is a 51-year old man living in Portland, Oregon who served in the Navy for a year. After his service, he worked in construction until 2016, when he fell off a ladder on the job and tore his rotator cuff. He needed surgery but was laid off, losing his income, health insurance, and housing all at once. Fortunately, W.B. was connected to a health center that quickly enrolled him in Medicaid under the Medicaid expansion. With Medicaid, W.B. was able to get surgery for his shoulder and physical therapy. During his recovery, W.B. stayed at a medical respite program because he had no safe place to recuperate, which Medicaid also covered. During his stay at the respite center, W.B. also began treatment for depression and alcohol use. W.B. is now recovered and looking to get back to work.

With Medicaid, R.M. can access the physical and behavioral services he needs to stay healthy.

R.M. is a 56-year old man who was in the 101st Airborne division with the U.S. Army between 1979 and 1983. He currently struggles with mental health and substance use disorders. R.M. needed colostomy surgery in 2009, when he was previously uninsured. He was able to obtain the surgery through a charity care arrangement with a local hospital but wore a colostomy bag for two years because he could not find anyone willing to do a reversal surgery to remove it while he was uninsured. With Medicaid, R.M. is now able to obtain the services he needs, including therapy to support his recovery and other mental health needs; eyeglasses and regular eye exams; and screenings and preventive care, including an HIV test and flu shots.

“Losing Medicaid would make me worry a lot–I was blessed to get a charity case on my colostomy, but that doesn’t happen a lot. You don’t find many places that do charity work.”

Medicaid provided K.B. timely treatment for colon cancer and enabled him to address other longstanding conditions.

K.B. is a 65-year old man in Chicago, Illinois who spent two years in the Army during the 1970s. He worked in phone sales for many years. However, after his mother died in 1987, he lost his job and home and faced challenges with alcohol use. K.B. stayed intermittently with his son, then his brother, and then was living in a tent in a local park. He was previously uninsured but enrolled in Medicaid in 2015, after visiting a local health center; though he is now 65, he is not yet enrolled in Medicare.Later in 2015, K.B. gained stable housing through a veteran’s initiative. In 2016, K.B. was diagnosed with colon cancer. His Medicaid coverage enabled him to access timely treatment, and he is now cancer-free. He also had surgery to relieve a spinal cord compression, helping him regain better use of his arms and hands. With Medicaid, K.B. also is receiving the care and medications he needs to manage his high blood pressure, PTSD, and depression; maintain his recovery from alcohol use; and continue to monitor his cancer.

“If I didn’t have Medicaid, it would be all downhill because there are not a lot of places that can afford to supply the medications that I need. Hypertension killed both my parents, so I need to take care of myself and see the doctor regularly.”

Without Medicaid, K.S. remains uninsured and is going without needed care and eyeglasses as well as the preventive care he would like for peace of mind.

K.S. is a 42-year old man who served in the National Guard between 1994-2001. He worked construction and metal fabrication jobs for most of his life, but was laid off in 2016. He exhausted his savings and became homeless. Outreach workers in Jacksonville, Florida found K.S. sleeping on the beach when they connected him to a health center and a shelter placement. K.S. currently works day labor jobs and is searching for full employment, having recently received an Associate’s degree from Florida State College.K.S. suffers from neuropathy in his right leg, which gives him problems with balance and muscle spasms, and has also recently started to get migraines. Because K.S. is uninsured, the local health center is trying to obtain a charity care voucher so that he can get a CAT scan at the local hospital. He used to wear glasses, but they were broken when he became homeless and he is not able to replace them. Having Medicaid would facilitate K.S.’s ability to get care to treat his existing conditions as well as the preventive care that he would like for peace of mind.

“It would be nice to get a regular check-up…. I know there’s a lot of things if they are caught in time, they can be managed, but if not, they can be catastrophic….You just hope there’s nothing wrong, but it’s a scary thing not knowing.”

Looking Forward

Though rates of homelessness have been on the decline among the veteran population, veterans remain overrepresented among the homeless population and at high risk of experiencing homelessness. Medicaid plays an important role for veterans, covering some who would otherwise be uninsured and supplementing Medicare, private, VA or military coverage for others. Medicaid coverage is particularly important for veterans experiencing homelessness who often lack access to other coverage options and have high rates of chronic health conditions, disabilities, mental health issues, and alcohol or substance use disorders. The ACA Medicaid expansion led to coverage gains among veterans, including those experiencing homelessness, providing them access to a broad range of services to manage ongoing physical and behavioral health conditions and support recovery from alcohol and substance use disorders when necessary.

Restructuring of Medicaid at the federal level or through waivers sought by states would have significant implications for veterans experiencing homelessness given their significant health needs and limited resources. Reductions in Medicaid, particularly loss of the Medicaid expansion, would likely result in many of these individuals becoming uninsured and going without needed care, which would lead to greater instability in their lives and make it more difficult for them to pursue work and stable living arrangements. Moreover, increases in out of pocket costs and/or work requirements could pose particular challenges for these individuals. Similarly, these individuals also would have difficulty affording out of pocket costs for care if moved to private coverage.

This brief was prepared by Samantha Artiga and Petry Ubri with the Kaiser Family Foundation and Barbara DiPietro of the National Health Care for the Homeless (HCH) Council. The authors express their deep appreciation to the veterans who shared their time and experiences to inform this brief.

Endnotes

  1. The U.S. Department of Housing and Urban Development, Obama Administration Announces Nearly 50 Percent Decline in Veteran Homelessness [Website], August 1, 2016, Accessed August 24, 2017, https://portal.hud.gov/hudportal/HUD?src=/press/press_releases_media_advisories/2016/HUDNo_16-117. ↩︎
  2. U.S. Department of Housing and Urban Development and U.S., Department of Veterans Affairs, Veteran Homelessness: A Supplemental Report to the 2009 Annual Homeless Assessment Report to Congress, (Washington, DC: HUD and VA, 2010), https://www.hudexchange.info/resources/documents/2009AHARveteransReport.pdf. ↩︎
  3. The U.S. Department of Housing and Urban Development, The 2015 Annual Homeless Assessment Report (AHAR) to Congress: Part 2: Estimates of Homelessness in the United States, (Washington, DC: HUD, October 2016), https://www.hudexchange.info/onecpd/assets/File/2015-AHAR-Part-2.pdf. ↩︎
  4. Ibid. ↩︎
  5. The U.S. Department of Housing and Urban Development, Obama Administration Announces Nearly 50 Percent Decline in Veteran Homelessness [Website], August 1, 2016, Accessed August 24, 2017, https://portal.hud.gov/hudportal/HUD?src=/press/press_releases_media_advisories/2016/HUDNo_16-117. ↩︎
  6. U.S. Department of Veterans Affairs, VA Programs for Homeless Veterans, (Washington, DC: VA, January 2017), https://va.gov/homeless/Homeless_Programs_General_Fact_Sheet_JAN_2017.pdf. ↩︎
  7. Jack Tsai and Robert A Rosenheck, “Risk Factors for Homelessness Among US Veterans,” U.S. Department of Veterans Affairs, public Access Author Manuscript, Epidemiological Review 37, (2015):177-195, https://www.ncbi.nlm.nih.gov/pmc/articles/PMC4521393/pdf/nihms-709743.pdf. ↩︎
  8. The U.S. Department of Housing and Urban Development, The 2015 Annual Homeless Assessment Report (AHAR) to Congress: Part 2: Estimates of Homelessness in the United States, (Washington, DC: HUD, October 2016), https://www.hudexchange.info/onecpd/assets/File/2015-AHAR-Part-2.pdf. ↩︎
  9. Ibid. ↩︎
  10. Fargo J, Metraux S, Byrne T, Munley E, Montgomery AE, Jones H, et al. “Prevalence and risk of homelessness among US veterans,” Prev Chronic Dis 2012;9:110112. ↩︎
  11. Thomas P O’Toole, Erin E Johnson, Matthew L Borgia, and Jennifer Rose, “Tailoring Outreach Efforts to Increase Primary Care Use Among Homeless Veterans: Results of a Randomized Controlled Trial,” Journal of General Internal Medicine 30, 7 (July 2015):866-898. ↩︎
  12. Sidath Viranga Panangala, Health Care for Veterans: Answers to Frequently Asked Questions, (Washington, DC: Congressional Research Service, April 2016), https://fas.org/sgp/crs/misc/R42747.pdf. ↩︎
  13. Michael Dworsky, Carrie M Farmer, and Mimi Shen, Veterans’ Health Insurance Coverage Under the Affordable Care Act and Implications of Repeal for the Department of Veterans Affairs, Prepared for the RWJ Foundation and the NY State Health Foundation, (Santa Monica, California: RAND Corporation, September 2017), http://nyshealthfoundation.org/uploads/resources/veterans-health-insurance-coverage-under-the-affordable-care-act.pdf. ↩︎
  14. Kaiser Family Foundation, Medicaid’s Role in Covering Veterans, (Washington, DC: KFF, June 2017), http://modern.kff.org/infographic/medicaids-role-in-covering-veterans/. ↩︎
  15. Jennifer Haley, Genevieve Kenney, and Jason Gates, Veterans Saw Broad Coverage Gains Between 2013 and 2015, Prepared with support from the Robert Wood Johnson Foundation, (Washington, DC: Urban Institute, April 2017), https://www.urban.org/sites/default/files/publication/89756/2001230-veterans-saw-broad-coverage-gains-between-2013-and-2015.pdf. ↩︎
  16. Larisa Antonisse, Rachel Garfield, Robin Rudowitz, and Samantha Artiga, The Effects of Medicaid Expansion under the ACA: Updated Findings from a Literature Review, (Washington, DC: Kaiser Family Foundation, February 2017), http://modern.kff.org/medicaid/issue-brief/the-effects-of-medicaid-expansion-under-the-aca-updated-findings-from-a-literature-review/. ↩︎
  17. Kaiser Family Foundation, Medicaid’s Role in Covering Veterans, (Washington, DC: KFF, June 2017), http://modern.kff.org/infographic/medicaids-role-in-covering-veterans/. ↩︎

Puerto Rico: Fast Facts

Published: Oct 2, 2017
Selected Indicators on Puerto Rico, Compared to the 50 States and DC
 Puerto Rico50 States and DC
Total Population (2015)1 3,449,000317,480,000
Percent Change Since 20062 -12%+8%
Demographic Characteristics (2015)3 
U.S. Born Citizens97%86%
Identify as Hispanic99%18%
Over age 6518%15%
Below 100% FPL46%15%
Health Coverage (2015)4 
Medicaid/CHIP49%20%
Employer-Sponsored Insurance/Direct Purchase35%60%
Medicare or Military11%11%
Uninsured6%9%
Economic Statistics
Median Household Income (2016)5 $20,078$57,617
Seasonally-Adjusted Unemployment Rate (August 2017)6 10%4%
Health Statistics
Adults Reporting Fair/Poor General Health (2016)7 34%18%
Adults Reporting Diabetes (2016)8 15%11%
Adults Reporting Heart Attack or Heart Disease (2016)9 11%7%
Locally-Acquired Zika Virus Disease Cases (2016)10 34,963224
HIV Diagnosis Rate per 100,000 People (2015)11 17.114.7
Infant Mortality Rate per 1,000 Live Births (2013)12 7.16.0
Federal Medicaid Rules13 
Federal Matching RateFixed at 55%Ranges from 50-83% based on state’s per capita income
Federal FundingCapped at $357.8 million in FY 2018Uncapped
  • Puerto Rico, a U.S. territory, is located in the Caribbean. Puerto Ricans are natural-born U.S. citizens, with nearly 3.4 million U.S. citizens residing on the island.14 
  • Roughly one in two Puerto Ricans are enrolled in the island’s Medicaid program.15 
  • Unlike the 50 states and DC, annual federal funding for Puerto Rico is capped, meaning once federal funds are exhausted, the island no longer receives federal financial support for its Medicaid program during that fiscal year. The ACA provided an additional $6.4 billion one-time allotment, which is expected to exhaust by April 2018, leaving Puerto Rico with an $877 million shortfall in Medicaid funding.16 
  • Puerto Rico’s health care system faces a number of challenges. As young people migrate to the U.S. mainland, seniors now make up a larger share of the population. Health indicators are worse than that of the rest of the United States, and the island’s Medicaid program that covers half of the population faces financing difficulties in addition to Puerto Rico’s overall fiscal challenges.17 
  • Hurricane Maria has placed additional pressure on an already strained health care system with people in need of immediate medical care. News reports describe power outages throughout the island, many without clean drinking water, and hospitals without electricity or fuel for generators.18  19 
  1. Kaiser Family Foundation analysis of the 2015 American Community Survey, 1-Year Estimates. ↩︎
  2. Kaiser Family Foundation analysis of the 2006 and 2015 American Community Survey, 1-Year Estimates. ↩︎
  3. Kaiser Family Foundation analysis of the 2015 American Community Survey, 1-Year Estimates. ↩︎
  4. Ibid. ↩︎
  5. Gloria G. Guzman, Household Income: 2016, American Community Survey Briefs (U.S. Census Bureau, September 2017), https://www.census.gov/content/dam/Census/library/publications/2017/acs/acsbr16-02.pdf. ↩︎
  6. “State Employment and Unemployment,” United States Department of Labor, Bureau of Labor Statistics, accessed September 2017, http://www.bls.gov/news.release/laus.toc.htm. ↩︎
  7. Kaiser Family Foundation analysis of the 2016 Behavioral Risk Factor Surveillance System. ↩︎
  8. Ibid. ↩︎
  9. Ibid. ↩︎
  10. “2016 Case Counts in the US,” Centers for Disease Control and Prevention, May 2017, https://www.cdc.gov/zika/reporting/2016-case-counts.html. ↩︎
  11. Centers for Disease Control and Prevention, National Center for HIV/AIDS, Viral Hepatitis, STD, and TB Prevention (NCHHSTP) Atlas Plus, updated 2017, https://www.cdc.gov/nchhstp/atlas/index.htm. ↩︎
  12. Mathews TJ, MacDorman MF, Thoma ME, Infant Mortality Statistics from the 2013 period linked birth/infant death data set. National vital statistics reports; vol 64 no 9. Hyatsville, MD: National Center for Health Statistics, 2015. ↩︎
  13. “Medicaid Financing and Spending in Puerto Rico,” MACPAC, September 2017, https://www.macpac.gov/publication/medicaid-financing-and-spending-in-puerto-rico/. ↩︎
  14. Kaiser Family Foundation analysis of the 2015 American Community Survey, 1-Year Estimates. ↩︎
  15. Ibid. ↩︎
  16. Congress approved an additional $295.9 million in Medicaid funding under the Consolidated Appropriations Act, projected to exhaust in September 2017. “Medicaid Financing and Spending in Puerto Rico,” MACPAC, September 2017, https://www.macpac.gov/publication/medicaid-financing-and-spending-in-puerto-rico/. ↩︎
  17. Kaiser Commission on Medicaid and the Uninsured, 8 Questions and Answers about Puerto Rico (Washington, DC: Kaiser Commission on Medicaid and the Uninsured, September 2016), https://modern.kff.org/disparities-policy/fact-sheet/8-questions-and-answers-about-puerto-rico/. ↩︎
  18. Maggie Astor, “Puerto Rico: What Other Americans Should Know,” New York Times (September 26, 2017), https://www.nytimes.com/2017/09/25/us/puerto-rico-hurricane-american.html. ↩︎
  19. Olga Khazan, “The Crisis at Puerto Rico’s Hospitals,” The Atlantic (September 26, 2017), https://www.theatlantic.com/health/archive/2017/09/the-crisis-at-puerto-ricos-hospitals/541131/. ↩︎
News Release

Public Ranks Children’s Health Insurance, Marketplace Stabilization Higher Priorities than ACA Repeal

Republicans Prioritize Repeal, While Democrats Favor Making ACA Work Over Passing Single-Payer Plan

Published: Sep 22, 2017

Majorities Support Buy-In Ideas for Medicaid and Medicare

Among health priorities facing urgent deadlines in Washington in September, the public ranks repeal of the Affordable Care Act lower than reauthorizing funding for the Children’s Health Insurance Program (CHIP) and stabilizing individual health insurance marketplaces established by the ACA, the Kaiser Family Foundation’s new tracking poll finds.

About seven in 10 Americans — and majorities across parties — say it’s “extremely” or “very” important to reauthorize the Children’s Health Insurance Program before its funding expires at the end of the month (75%) and to pass legislation to stabilize ACA insurance marketplaces (69%) as the deadline looms for insurers to set 2018 premiums.

By comparison, just under half (47%) of Americans say it is important to continue efforts to repeal and replace the 2010 health law, despite the Senate’s September 30 deadline for passing such a bill with a 51-vote majority. Opinions differ by political party, however, with 71 percent of Republicans rating repeal as important, compared to 28 percent of Democrats and 47 percent of independents.

While Republicans prefer that GOP members of Congress focus on repeal efforts (66%) rather than on improving the way the ACA is working (28%), Democrats would rather their party’s Congressional delegation focus on improving the way the ACA is working (52%) over passing a national health care plan (43%). A majority of independents rank improving the ACA’s performance higher than focusing on either a national health care plan or ACA repeal.

The poll finds that public opinion on the ACA is divided following the introduction of alternative health bills by both Republicans and Democrats in mid-September. After a gradual increase over the past year, the favorability towards the ACA dropped six percentage points this month, with 46 percent of the public holding a favorable view in September compared to 52 percent in August. The new poll finds 44 percent of Americans have an unfavorable view of the ACA.

Medicaid and Medicare Buy-In Ideas More Popular than Single-Payer

In the days after Sen. Bernie Sanders introduced his “Medicare for all” bill, the poll finds that slightly more than half (54%) of the public favor a single-payer health system, with 43 percent opposing. However, the poll also finds attitudes may be swayed by counter messages.

Ideas for buying into Medicaid and Medicare find more support, although it is unclear where opinions would land after a public debate.

Two-thirds of the public (66%) favor a “Medicaid buy-in” that lets people use government subsidies to purchase health insurance through state Medicaid programs instead of purchasing a private plan through the marketplace. About one in four Americans (26%) oppose the idea.

Six in 10 (63%) of Americans favor a “Medicare buy-in” that allows individuals younger than 65 to buy insurance through Medicare. One-third (33%) oppose.

Among Republicans, 24 percent support a single-payer health plan; 39 percent favor a Medicaid buy-in; and 44 percent favor a Medicare buy-in. By comparison, 70 percent of Democrats support single-payer, 79 percent favor a Medicaid buy-in, and 75 percent favor a Medicare buy-in.

Majority Not Confident the President and Congress will Stabilize Marketplaces

Fielded days before senators ended a bipartisan effort to stabilize the ACA marketplaces, the poll finds that the public generally takes a dim view of the current status and immediate prospects for the ACA marketplaces.

Half say the marketplaces are collapsing, compared to 35 percent who say they’re not collapsing and 14 percent who say they don’t know.

A majority of the public (69%) say they’re “not too confident” or “not at all confident” that President Trump and Congress will be able to work together to improve the marketplaces. Three in 10 Americans (30%) say they’re “very” or “somewhat” confident.

Opinions about a proposed step to stabilize the marketplaces vary sharply by political party. A majority (66%) of Americans — including 90 percent of Democrats and 63 percent of independents — support Congress guaranteeing cost-sharing reduction payments to insurance companies to help cover out-of-pocket costs for lower-income people. However, about three in 10 Americans (28%), and more than half of Republicans (53%), say the payments constitute bailouts to insurance companies and should be stopped.

Other poll findings include:

  • Four in 10 (41%) Americans say actions by President Trump and his administration are generally “hurting” the way the ACA marketplaces are working; 20 percent say their actions are helping and 33 percent say their actions “are not having much impact”.
  • A majority of the public (63%) favor the broad idea of legislation permitting states more flexibility to change their health insurance programs, while three in 10 (31%) oppose. Opinions are subject to change with counter messages.

Designed and analyzed by public opinion researchers at the Kaiser Family Foundation, the poll was conducted from September 13 – 18 among a nationally representative random digit dial telephone sample of 1,179 adults. Interviews were conducted in English and Spanish by landline (404) and cell phone (775). The margin of sampling error is plus or minus 3 percentage points for the full sample. For results based on subgroups, the margin of sampling error may be higher.

Poll Finding

Kaiser Health Tracking Poll – September 2017: What’s Next for Health Care?

Authors: Ashley Kirzinger, Bianca DiJulio, Liz Hamel, Bryan Wu, and Mollyann Brodie
Published: Sep 22, 2017

Findings

KEY FINDINGS:

  • The September Kaiser Health Tracking Poll, fielded largely prior to the most recent Republican effort to repeal the 2010 health care law, finds three-fourths of the public saying it is important for Congress to work on reauthorizing funding for the State Children’s Health Insurance Program (CHIP), which provides health care coverage for uninsured children. Democrats prioritize reauthorizing CHIP funding and stabilizing the ACA marketplaces, with at least eight in ten saying each is an important priority for Congress to work on now. These are also the highest-ranking priorities among independents, with about seven in ten saying the same about both reauthorizing CHIP and stabilizing the marketplaces. Republicans, on the other hand, are more likely to prioritize continuing efforts to repeal and replace the ACA, with 71 percent saying that is important for Congress to do now.
  • In general, Republicans are more likely to want Republicans in Congress to focus on repeal efforts than on improving the way the Affordable Care Act (ACA) is working (66 percent v. 28 percent), while most Democrats want Democrats in Congress to focus on improving the way the ACA is working (52 percent) rather than trying to pass a national health care plan (43 percent). A majority of independents want Democrats and Republicans in Congress to focus their efforts on improving the way the ACA is working rather than focusing on either a national health care plan or repealing the ACA.
  • Half of the public thinks the ACA marketplaces are “collapsing.” One proposed step Congress could take to stabilize the markets and control costs for people who purchase their own plans is to guarantee cost-sharing reduction (CSR) payments to insurance companies. The Trump Administration has said they may stop making these payments, which has led to insurance companies saying they may raise premiums or stop participating in the marketplaces. Two-thirds of the public – including majorities of Democrats and independents – say Congress should guarantee the CSR payments in order to help stabilize the insurance market while about three in ten of the overall public and about half of Republicans (53 percent) say these payments constitute bailouts to the insurance companies and should be stopped. Overall, about seven in ten Americans are not confident that President Trump and Congress will be able to work together to make improvements to the ACA marketplaces.
  • Overall views of the ACA are once again divided, with 46 percent expressing a favorable view and 44 percent expressing an unfavorable view. While overall favorability increased over the past year, this month finds a return to a divided public that characterizes most of the last seven years.
  • This month’s Kaiser Health Tracking Poll examines public support for a variety of competing health care policies aimed at improving or replacing the 2010 health care law, including plans to allow people to “buy in” to Medicaid or Medicare.

After the Senate failed to pass a bill to repeal parts of the 2010 Affordable Care Act (ACA) in late-July, some lawmakers have turned their attention to various competing national health policy issues, including efforts to stabilize the ACA marketplaces, proposals to create a single-payer health care system, and the reauthorization of funding for the State Children’s Health Insurance Program (CHIP), while some have continued to focus on repealing and replacing the ACA. This month’s Kaiser Health Tracking Poll examines how Americans are prioritizing the competing health care issues as well as their attitudes toward possible changes to the current health care system.

What Should Congress Work on Now?

Congress has a number of competing priorities for the month of September, and when asked about several of the issues they may address this month, a large majority of the public see reauthorizing funding for CHIP and passing legislation to stabilize the ACA marketplaces as important priorities for Congress to work on now. Specifically, three-fourths of the public (75 percent) say it is “extremely” or “very” important for Congress to work on reauthorizing funding for CHIP, the program which provides health care coverage for uninsured children. This is followed by seven in ten (69 percent) who say the same about passing legislation to stabilize the ACA marketplaces in order to minimize premium increases and encourage more insurers to offer health plans. Fewer, but still about half, say it is “extremely” or “very” important for Congress to work on reforming the tax code, which may cut taxes for some individuals (49 percent), or work on continuing efforts to repeal and replace the 2010 health care law (47 percent).

Figure 1: Most Say Reauthorizing CHIP and Stabilizing the ACA Are Important Priorities for Congress to Work on Now

Priorities Vary by Party, With More Republicans Focused on ACA Repeal and More Democrats and Independents Prioritizing CHIP Funding and ACA Stabilization

Not surprisingly, most Democrats prioritize reauthorizing CHIP funding and stabilizing the ACA marketplaces, with at least eight in ten saying each is an important priority for Congress to work on now. These are also the highest-ranking priorities among independents, with about seven in ten saying the same about both reauthorizing CHIP and stabilizing the marketplaces. Republicans, on the other hand, are more likely than Democrats and independents to prioritize continuing efforts to repeal and replace the ACA, with 71 percent saying that is important for Congress to do now. Still, many Republicans say it is important for Congress to now work on reforming the tax code (63 percent), reauthorizing CHIP funding (62 percent), and stabilizing the ACA marketplaces (57 percent).

Table 1: What Should Congress Work on Now?

Percent who say each of the following is extremely or very important for Congress to work on now: 

TotalDemocratsIndependentsRepublicans
Reauthorizing funding for the State Children’s Health Insurance Program75%89%72%62%
Passing legislation to stabilize the Affordable Care Act marketplaces69817257
Reforming the tax code, which may cut taxes for some individuals49385063
Continuing efforts to repeal and replace the 2010 health care law47284771
Note. Question wording modified. See topline for full question wording.

Improving the ACA v. Competing Health Care Plans

With debate about whether lawmakers should pursue a bill to stabilize the ACA, repeal and replace it, or aim for a single-payer health system, this month’s Kaiser Health Tracking Poll asked generally whether the public thinks the members of their party should focus their efforts on improving the way the ACA is working or focus their efforts towards other recent proposals. Republicans are more likely to want Republicans in Congress to focus on repeal efforts than on improving the way the ACA is working (66 percent v. 28 percent), while most Democrats want Democrats in Congress to focus on improving the way the ACA is working (52 percent) rather than trying to pass a national health care plan (43 percent).

Figure 2: Republicans Want Their Leaders to Continue ACA Repeal Efforts, Democrats Want Their Leaders to Improve the ACA

Most independents want both Democrats and Republicans in Congress to focus their efforts on improving the way the ACA is working rather than focusing on either a national health care plan or repealing the ACA.

Figure 3: Independents Want Both Democrats and Republicans in Congress to Focus on Improving the ACA

Uncertainty over the Future of the ACA Marketplaces

Currently about 10.3 million people have health insurance purchased through the ACA marketplaces or exchanges, where people who don’t get coverage through their employers can shop for insurance and compare prices and benefits.1  This month’s findings indicate that most Americans think the ACA marketplaces are facing significant issues and while they favor Congress taking actions to stabilize the marketplaces, they are not confident that President Trump and Congress will be able to work together to make improvements to the marketplaces.

Half of the Public Thinks the ACA Marketplaces are Collapsing

While most experts maintain that the ACA marketplaces are not collapsing,2  much of the public holds a different view. Half of the public say the marketplaces are collapsing, while about one-third say they are not collapsing (35 percent) and an additional 14 percent say they “don’t know.” The majority of Republicans (62 percent) and independents (53 percent) say the marketplaces are collapsing, as do four in ten Democrats (38 percent).

Figure 4: Most Republicans and Independents Say ACA Marketplaces Are Collapsing, as do a Large Share of Democrats

Congressional Efforts to Stabilize the Marketplaces

For the past several weeks, the Senate Committee on Health, Education, Labor, and Pensions has held hearings on how to stabilize the ACA marketplaces or exchanges. One proposed step Congress could take to stabilize the markets and control costs for people who purchase their plans on their own is to guarantee payments to insurance companies that help cover the cost of deductibles and copayments for lower-income Americans (known commonly as ‘cost-sharing reduction (CSR) payments). The Trump Administration has said they may stop making these payments, which has led to insurance companies saying they may raise premiums or stop participating in the marketplaces. When asked what Congress should do, two-thirds of the public say Congress should guarantee the CSR payments in order to help stabilize the insurance market while three in ten (28 percent) say these payments constitute bailouts to the insurance companies and should be stopped. While the majority of Democrats (90 percent) and independents (63 percent) say Congress should guarantee the CSR payments, about half of Republicans (53 percent) say the payments should be stopped.

Figure 5: Democrats and Independents Favor Congress Guaranteeing CSR Payments, Republicans Want Payments Stopped

Public confidence that President Trump and Congress will be able to work together to make improvements to the ACA marketplaces is low, with about seven in ten Americans saying they are either “not too confident” (28 percent) or “not at all confident” (42 percent) while three in ten say they are “very confident” (8 percent) or “somewhat confident” (22 percent) that they will be able to work together. Most Republicans (55 percent) are confident that President Trump and Congress will be able to work together while most Democrats and independents are not confident (85 percent and 70 percent, respectively).

Figure 6: Most Republicans, But Fewer Democrats and Independents, Are Confident Trump and Congress Can Improve ACA Marketplaces

The Trump Administration’s Role in the Stability of the ACA Marketplaces

Four in ten of the public (41 percent) say the actions taken by President Trump and his administration are generally “hurting” the way the marketplaces are working while one-third (34 percent) say their actions are “not having much impact;” fewer, one in five, say their actions are “helping” the ACA marketplaces. These responses are largely driven by party, with almost half of Republicans (46 percent) saying the Trump administration’s actions are “helping,” while seven in ten Democrats (69 percent) say their actions are “hurting.” Independents are more divided, with similar shares saying the Trump administration’s actions are “not having much impact” (39 percent) or “hurting” (38 percent), while fewer say their actions are “helping” (19 percent).

Figure 7: Perceptions of Whether Trump Administration is Helping or Hurting ACA Marketplaces Varies by Party Identification

ACA Favorability

With the ongoing debates over the future of the ACA and stability of the individual marketplaces, this month’s poll finds 46 percent of the public has a favorable view of the ACA and 44 percent has an unfavorable view. While the overall favorability has increased gradually over the past year, this month finds a decrease in favorability since last month (down six percentage points from 52 percent in August) and a return to a divided public that characterizes most of the last seven years. In fact, the decline in favorability is across all groups including Democrats, independents, and Republicans.3 

Figure 8: Public Again Divided in Views of the Affordable Care Act

Attitudes to Recent Proposed Changes to the Current Health Care System

During the past few weeks, Congressional members of both political parties have announced plans to reform the current health care system. This month’s tracking poll examines the public’s attitude toward some of these proposed changes.

Increasing State Flexibility in Health Care

As part of the ongoing discussions about the future of the 2010 health care law, several Republican in Congress have proposed changes that would increase the role of states in running their own health insurance programs. Enhancing state flexibility is a key feature in proposals to stabilize the ACA marketplaces.

The majority of the public (63 percent) favor the broad idea of Congress passing legislation that would give states more flexibility to make changes to their health insurance programs while about three in ten (31 percent) oppose this. However, some of these attitudes can be swayed upon hearing counter-messages.

Figure 9: While Most Favor Increased State Flexibility, Attitudes Can Be Swayed by Counter-Messages

When those who initially say they favor giving states more flexibility hear that states can already modify their programs as long as the changes don’t decrease the number of people with insurance, change what is covered by insurers, or make insurance unaffordable, about one-fourth (17 percent of the public overall) change their view and now oppose Congress passing such legislation, resulting in about half (48 percent) of the overall public opposed. On the other hand, one-fifth of those initially opposed to the legislation (7 percent of the public overall) change their mind after hearing that some state leaders say it is currently too difficult for them to make changes that they believe are better for their state, increasing overall support to 70 percent.

Letting Individuals “Buy Into” Medicaid

The public has favorable views of the Medicaid program,4  and some lawmakers are suggesting that one way to help ensure that uninsured individuals and those who purchase their own insurance, including lower-income individuals who receive help from the government to pay their premiums, have sufficient options for health insurance is to let them buy into Medicaid, the government health insurance program for low-income adults and children. Although it is unclear where opinions may land after this idea becomes publicly debated, this month’s poll finds a majority of the public (66 percent) – including most Democrats (79 percent) and independents (72 percent) – favor letting people use government subsidies to buy health insurance through state Medicaid programs instead of purchasing a private insurance plan through the marketplace. Republicans are more divided with about half (49 percent) saying they oppose and four in ten (39 percent) saying they favor such a plan.

Figure 10: Majority of Democrats and Independents Favor Medicaid “Buy-In,” Half of Republicans Oppose Such a Plan

Letting Younger People “Buy Into” Medicare

Another proposal being put forth by Democratic lawmakers is to allow individuals under the age of 65 to buy insurance through Medicare, the government health insurance program for adults 65 or older and for younger adults with long-term disabilities. The majority of Democrats (75 percent) and independents (64 percent) favor this proposal, while Republicans are divided with about half (51 percent) opposing this proposal while 44 percent favor it. Yet once again, it is unclear where these opinions would land if this proposed idea becomes part of the public debate.

Figure 11: Democrats and Independents Favor Medicare “Buy-In,” Republicans Are Divided in their Views

Single-Payer, Government Run Health Plan

On September 13, 2017, Senator Bernie Sanders announced his “Medicare for All” bill, a single-payer plan in which all Americans would get health insurance from one government-run, national health plan.5  This month’s Kaiser Health Tracking Poll finds that while a slight majority of the public is in favor of a single-payer system, attitudes can be swayed by counter-messages.

There is a strong partisan divide in attitudes toward a national health plan with a majority of Democrats (70 percent) favoring such a plan, while a majority of Republicans (72 percent) oppose it. Independents are also largely in favor of such a plan, with roughly six in ten (59 percent) saying they “favor” it compared to four in ten (39 percent) who say they “oppose” it. This month’s poll findings are similar to the June Kaiser Health Tracking Poll with one notable exception – the share of Republicans who say they “strongly oppose” a national health plan is up 13 percentage points (from 48 percent in June to 61 percent this month).

Figure 12: Democrats and Independents Favor National Health Plan While a Large Share of Republicans Strongly Oppose
Americans Have Varied Reasons for Their Opinions Towards Single-Payer

This month’s survey also asked the public to say in their own words the reasons why they either favor or oppose a national health plan.  Among those who say they favor a national health plan, one in five (21 percent) say they favor it because “it improves access to health care or health insurance.” This is followed by similar shares who say they favor such a plan because it will “decrease the cost of health care or health insurance” (13 percent) and because it “works in other countries’ (10 percent). Among those who oppose a national health plan, three in ten (28 percent) say it is because they “don’t want the government involved” while a smaller share say it is because of a “lack of choice” (18 percent).

Figure 13: Favorable Views of Single-Payer Are Because It Improves Access, Unfavorable Views Are Due to Government’s Involvement
Attitudes on a National Health Plan May Change After Hearing Counter-Messages

Although a slight majority of the public favors a national health plan, attitudes are malleable when given counter-messages. Among those who initially favor having a national health plan in which all Americans would get their insurance from a single government plan, about four in ten (23 percent of the public overall) say they now oppose it after hearing that opponents say such a plan would require many Americans to pay more in taxes. Similar shares also say they now oppose a national health plan after hearing that it would give the government too much control over health care (18 percent of the public overall) and eliminate the role of employers in health care (17 percent of the public overall). These shifts result in about six in ten of the public opposing a national health plan.

Figure 14: Arguments Against National Health Plan Sway Some Initial Supporters

On the other hand, opposition towards a national health plan is also somewhat malleable, with total support growing to as high as seven in ten of the public after some are persuaded with counter-messages. For example, when those who initially oppose a national health plan are told that supporters say such a plan would ensure that all Americans have health insurance, roughly four in ten now say they favor such a plan (16 percent of the public overall). A similar share (14 percent of the public overall) change their mind after hearing that supporters say such a plan would reduce health insurance administrative costs. Slightly fewer (9 percent overall), say they now favor a national health plan after hearing that supporters say such a plan would reduce the role of all private health insurance companies in health care.

Figure 15: Some Who Initially Oppose National Health Plan Can Be Persuaded

Perceived Impact of a National Health Insurance Plan

Despite the significant changes associated with a national health plan, few perceive that such a plan will affect them personally. Nearly half (48 percent) say the quality of their own health care would “stay about the same” and about four in ten say they think the availability of health care treatments, and their choice of doctors and hospitals would “stay about the same” if a national health plan were put into place. On the other hand, smaller shares (less the one-third) say each of these would get “better” or “get worse” if a national health plan was put into place.

Figure 16: More Think Their Health Care Costs, Quality, and Availability, as well as Choice in Providers Would Stay the Same

These opinions are largely driven by party identification with about half of Republicans saying the cost, quality, and availability of their health care as well as choice of doctors and hospitals would get “worse,” while a larger share of Democrats and independents say these would “stay the same” if a national health plan was put into place than say they would get “worse.”

Table 2: Larger Shares of Republicans Think Health Care Will Be Made “Worse” Under National Health Plan
Percent who say each of the following will be made “worse” if a national health plan was put into place: TotalDemocratsIndependentsRepublicans
Availability of health care treatments to you and your family29%16%28%49%
Your choice of doctors and hospitals29142848
Quality of your own health care28152649
The cost of health care for you and your family28162545

Methodology

This Kaiser Health Tracking Poll was designed and analyzed by public opinion researchers at the Kaiser Family Foundation (KFF). The survey was conducted September 13-18, 2017, among a nationally representative random digit dial telephone sample of 1,179 adults ages 18 and older, living in the United States, including Alaska and Hawaii (note: persons without a telephone could not be included in the random selection process). Computer-assisted telephone interviews conducted by landline (404) and cell phone (775, including 496 who had no landline telephone) were carried out in English and Spanish by SSRS of Media, PA. Both the random digit dial landline and cell phone samples were provided by Marketing Systems Group (MSG). For the landline sample, respondents were selected by asking for the youngest adult male or female currently at home based on a random rotation. If no one of that gender was available, interviewers asked to speak with the youngest adult of the opposite gender. For the cell phone sample, interviews were conducted with the adult who answered the phone. KFF paid for all costs associated with the survey.

The combined landline and cell phone sample was weighted to balance the sample demographics to match estimates for the national population using data from the Census Bureau’s 2015 American Community Survey (ACS) on sex, age, education, race, Hispanic origin, and region along with data from the 2010 Census on population density. The sample was also weighted to match current patterns of telephone use using data from the July-December 2016 National Health Interview Survey. The weight takes into account the fact that respondents with both a landline and cell phone have a higher probability of selection in the combined sample and also adjusts for the household size for the landline sample. All statistical tests of significance account for the effect of weighting.

The margin of sampling error including the design effect for the full sample is plus or minus 3 percentage points. Numbers of respondents and margins of sampling error for key subgroups are shown in the table below. For results based on other subgroups, the margin of sampling error may be higher. Sample sizes and margins of sampling error for other subgroups are available by request. Note that sampling error is only one of many potential sources of error in this or any other public opinion poll. Kaiser Family Foundation public opinion and survey research is a charter member of the Transparency Initiative of the American Association for Public Opinion Research.


GroupN (unweighted)M.O.S.E.
Total1179±3 percentage points
Party Identification
   Democrats352±6 percentage points
   Republicans280±7 percentage points
   Independents413±6 percentage points
Trump Approval
   Approve of President Trump471±5 percentage points
   Disapprove of President Trump661±5 percentage points


Five Ways the Graham-Cassidy Proposal Would Affect Women

Published: Sep 21, 2017

On September 25, 2017, an amended version of the Graham-Cassidy bill to repeal and replace the Affordable Care Act (ACA) was introduced in the U.S. Senate. The bill would make major reforms to the current health care system by repealing the ACA’s Medicaid expansion, capping Medicaid spending, and eliminating Marketplaces and income-based subsidies.  The bill would establish a new block grant program for states, but overall the funding levels for the coverage expansion and Medicaid would be substantially lower than under current law, and states that have expanded Medicaid would be disproportionately affected by the cut and reallocation of funding.  Because of the dramatic changes that the bill could make in health care financing and insurance coverage, it would have a direct impact on the availability and scope of coverage for millions of women with private insurance and Medicaid.

The bill would:

1. Permit states to exclude maternity care and preventive services under the block grant The ACA requires all individual plans to cover ten categories of essential health benefits (EHB), including maternity care, mental health, and prescription drugs. It also requires all private plans to cover preventive services, such as contraceptives and mammograms, without cost sharing.

  • The Graham-Cassidy proposal would allow states to establish rules for covered benefits for plans in their states. If states eliminate the requirement for maternity coverage, plans on the individual market would be allowed to exclude coverage for these services, as many did before the ACA. Some states have separate requirements to cover maternity services, but most do not. This would create a patchwork of requirements that vary across the country, and women in some states may not be able to purchase an individual plan that covers maternity care.
  • By allowing states to determine their own benefit package, states may also decide to exclude the no-cost coverage provision for contraceptives and other preventive services in the individual market, but employer-based plans would still be required to cover these services as well as maternity care.

2. Ban all Marketplace plans and issuers receiving block grant funds from covering abortion, and bar small employers from receiving tax credits if their plans cover abortion. The ACA allows states to choose whether to ban all plans in their Marketplaces from covering abortion beyond Hyde limitations. As of September 2017, 26 states have enacted laws limiting or banning coverage of abortion in ACA Marketplaces.

  • Under the Graham-Cassidy bill, the Marketplaces would remain in effect until 2020, but all Marketplace plans would be prohibited from covering abortion beyond Hyde restrictions. This would take away authority from the states to decide whether to ban abortion coverage, and would be in direct conflict with existing state policies in California, New York and Oregon1  that require plans to cover abortion.
  • Small employers would be disqualified from receiving federal tax credits if their plans include abortion coverage beyond Hyde limitations.
  • New block grant funds could not be used to pay for abortion or for health insurance coverage of abortion.
  • Health Savings Account (HSA) funds would be prohibited from being used to pay for either abortion services or premiums for plans that include abortion coverage beyond Hyde.

All of these policies would require women to shoulder the full cost of abortion services –even in cases when the pregnancy is a threat to their health, in cases of certain fetal demise or severe fetal anomaly.

3. Prohibit Planned Parenthood clinics from receiving federal Medicaid reimbursements for one year. Federal law already bars federal dollars from being used to pay for abortions other than those to terminate pregnancies that are a result of rape, incest or a threat to the pregnant woman’s life.

  • The Graham-Cassidy proposal would ban Planned Parenthood from receiving Medicaid reimbursement for non-abortion services, including family planning care and STI services. While the bill only bars funding for one year, this cut would effectively eliminate a significant share of revenues to Planned Parenthood and result in many clinic closures across the country.
  • It would increase funds to Community Health Centers (CHCs), but there is no requirement for CHCs to use these funds for reproductive care. In addition, CHCs may not have the capacity to fill the gap in care that would arise by the loss of Planned Parenthood as a Medicaid provider.

4. Allow states to permit insurers to charge higher premiums to people with pre-existing conditions. The ACA prohibits insurers from varying premiums based on health status.

  • The Graham-Cassidy bill would allow states to set rules relating to insurer rating practices. While states are prohibited from allowing insurers to rate premiums based on gender or genetic information, states may allow insurers to rate based on health status, age, occupation, marital status, neighborhood, and duration of coverage. In states that allow insurers to rate based on health status, insurers would be permitted to check applicants’ health status at the time of the first application, and again at the time of renewal, and raise premiums accordingly. This would have the effect of raising premiums for people with conditions such as pregnancy, prior C-section, or clinical depression.
  • While insurers would not be permitted to turn applicants down, many people with pre-existing conditions would no longer be able to afford health insurance. Because women are more likely than men to have a pre-existing medical condition, they could be disproportionately disadvantaged in states that choose to allow health status rating.

5. Eliminate the ACA’s Medicaid expansion and restructure the program from an entitlement to a capped program with limited federal financing. The ACA allowed states to extend Medicaid eligibility to most individuals with incomes up to 138% of poverty, expanding coverage to many low-income women who do not have children and low-income parents.

  • The Graham-Cassidy bill would end the Medicaid expansion and ban states from extending Medicaid coverage to women and men who do not have children. This would effectively make Medicaid coverage available only to women who become pregnant or are very poor with children.
  • The loss of federal financing would also potentially force some states to roll back eligibility for parents to the very low levels that were in place before the ACA. This means some new mothers would likely lose Medicaid after the 60-day post-partum period.
  • Beginning in 2020, the proposal would convert federal Medicaid funding from an open-ended matching system to a “per enrollee cap” unless states opt for a “block grant.” This would shift responsibility to states to finance the program at current levels. In particular, family planning services would lose its enhanced federal match of 90%, potentially leaving states with less incentive to cover the more effective (but expensive) methods of contraception like IUDs.

If enacted, the Graham-Cassidy bill would have considerable impact on women, particularly low-income women who rely on subsidies and those who are on Medicaid. Given the gains that women have made in access to meaningful and affordable coverage, they have much at stake in the current debate over the future of our nation’s private and public insurance programs.

  1. Starting in 2019, Oregon will require all plans to include abortion coverage. ↩︎
News Release

Graham-Cassidy-Heller-Johnson Plan to Replace ACA Funding With a New Block Grant and Cap Medicaid Would Decrease Federal Funding for States by $160 Billion from 2020-2026; Then a $240 Billion Loss in 2027 if the Law is Not Reauthorized

Redistribution of ACA Funds in the New Block Grant Would Lead to $180 Billion Loss for 31 States That Expanded Medicaid and a $73 Billion Gain for 19 Non-Expanding States Through 2026

Published: Sep 21, 2017

The Senate is preparing to vote next week on the Graham-Cassidy proposal to repeal and replace the Affordable Care Act and to cap the Medicaid program. A new state-by-state Kaiser Family Foundation analysis finds that the major financing changes in the bill would reduce federal spending by $160 billion over the 2020-2026 period.

In 2020, the new health care plan proposed by Senators Lindsay Graham and Bill Cassidy and others replaces funding for the ACA’s Medicaid expansion and individual insurance market subsidies with a block grant program funded through 2026. States would have broad flexibility to use the funds and ability to waive ACA insurance rules, such as prohibiting higher premiums for those with pre-existing conditions, to establish health coverage programs for their residents. The plan would also cap federal funding for the Medicaid program on a per-enrollee basis beginning in 2020.

Analysis finds financing changes in Graham-Cassidy would ↓ federal spending to states by $160 billion from 2020-2026

KFF’s state-by-state analysis of the block grant replacing the ACA’s Medicaid expansion and insurance subsidies finds that there would be $107 billion less than what the ACA would have provided for during the 2020-2026 period. With the plan’s redistribution of ACA funds, a typical Medicaid expansion state would see a 11 percent decline in federal funds while a non-expansion state would see a 12 percent increase.

The redistribution of funding among states would cause some large shifts for particular states. Five states would see a reduction of 30 percent or more for the 2020-2026 period: New York (-35%), Oregon (-32%), Connecticut (-31%), Vermont (-31%) and Minnesota (-30%). Six states would see at least a 40 percent increase in federal funding: Tennessee (44%), South Dakota (45%), Georgia (46%), Kansas (61%), Texas (75%), and Mississippi (148%). In actual dollars, the states with the largest potential loss in federal funds for the same period are California, New York, and Pennsylvania. Texas, Georgia, Tennessee, and Mississippi would see the largest increase in actual dollars.

All federal funds for the proposed state block grants to replace the ACA would cease in 2027 and new congressional action would be needed to continue funding. For 2027 alone, the loss to states in federal funding from current ACA funding and the Medicaid per-enrollee cap would be $240 billion.

Beyond repealing many provisions of the ACA, the Graham-Cassidy plan, like the Better Care Reconciliation Act (BCRA) the Senate voted down in July, would convert the Medicaid program’s open-ended federal funding to a capped per-enrollee allotment to most states going forward from 2020. Under the plan, nearly all states would see a decrease in federal Medicaid funding for a $53 billion decline nationally from 2020 to 2026.

While some states would gain funding from the Graham-Cassidy ACA block grant provisions compared to current law, the Medicaid per-enrollee cap proposal would offset some or all of those gains. Ohio, Maine and Louisiana are states where gains under the ACA block grant provisions are fully offset by the Medicaid changes, leading to a net loss in federal funds for these states.

KFF did not estimate the magnitude of the coverage loss that would result from the law, because it is dependent on actions by each of the fifty states that is difficult to predict in advance.

State-by-State Estimates of Changes in Federal Spending on Health Care Under the Graham-Cassidy Bill

Authors: Rachel Garfield, Larry Levitt, Robin Rudowitz, and Gary Claxton
Published: Sep 21, 2017

A new health care bill recently introduced by a number of senators led by Senators Lindsey Graham and Bill Cassidy would repeal major elements of the Affordable Care Act (ACA), make changes to other ACA provisions, fundamentally alter federal Medicaid financing, and reduce federal spending for health coverage. Key provisions of the Graham-Cassidy proposal would:

  • Repeal the ACA Medicaid expansion and individual insurance market subsidies—including premium tax credits, cost-sharing reductions, and the basic health program—as of 2020.
  • Create a new block grant program to states, which replaces the ACA’s Medicaid expansion and insurance subsidies, for years 2020-2026. States would have flexibility to use these funds to cover the cost of high-risk patients, assist individuals with premiums and cost-sharing, pay directly for health care services, or provide health insurance to a limited extent to people eligible for Medicaid.
  • Convert federal funding for the traditional Medicaid program from an open-ended basis to a capped amount.

The bill also repeals the penalties under the ACA’s individual and employer mandates and allows states to waive benefit requirements and community rating in the individual and small group markets. The proposal would fundamentally alter the current federal approach to financing health coverage for more than 80 million people who have coverage through the ACA (Medicaid expansion or marketplace) or through the traditional Medicaid program.

Graham-Cassidy Plan Would Decrease Federal Funding for States by $160 Billion from 2020-2026

In this brief, we estimate changes in federal funding due to the new block grant program and the Medicaid per enrollee cap on a state-by-state basis under the Graham-Cassidy bill relative to current law. This analysis addresses changes in federal funding for health coverage under the bill but does not project changes in the number of people covered. This analysis is not intended to replace a comprehensive score by the Congressional Budget Office (CBO), which would typically look at changes in federal spending and revenues, coverage, and premiums, addressing all provisions of the bill; however, CBO does not produce state-by-state estimates of the effects of legislation. A description of the methods underlying the analysis is in the “Methods” box at the end of the brief.

Key Findings

  • Based on our estimates, overall federal funding for coverage expansions and Medicaid would be $160 billion less than current law under the Graham-Cassidy bill over the period 2020-2026. Thirty-five states plus the District of Columbia would face a loss of funding.
  • We estimate that federal funding under the new block grants would be $107 billion less than what the federal government would have spent over the period 2020-2026 for ACA coverage.
  • There would be a significant redistribution in federal funding across states under the block grant.  Overall expansion states would lose $180 billion for ACA coverage and non-expansion states would gain $73 billion over the 2020-2026 period.  A typical Medicaid expansion state would see an 11% reduction in federal funds for coverage compared to an increase of 12% in a typical non-expansion state.
  • The Medicaid per enrollee cap would lead federal spending for the traditional Medicaid program to be $53 billion lower from 2020-2026 than it would be under current law. This represents one-third of the reduction in federal funds from the block grant and the per capita cap over that period.  Because per enrollee caps become more binding over time, by 2027, federal spending for the traditional Medicaid program would be $15 billion lower than under current law.
  • Almost all states face a potential loss of federal funds for their traditional Medicaid programs under the per enrollee cap; thus, the per enrollee cap offsets some or all of the gains some states may realize under the block grant and further cuts federal spending in states that may see a loss under the block grant.
  • Block grants under the Graham-Cassidy bill end in 2026. If they are not renewed, federal funding for coverage would decrease by $240 billion in 2027 alone.

State-by-State Effects of Block Grants

Starting in 2020, the Graham-Cassidy bill replaces the ACA’s Medicaid expansion and individual insurance subsidies with a fixed block grant to states. The formula for calculating the block grant is complex but generally works as follows:

  • Total federal funding for all states would be $136 billion in 2020 (plus a $10 billion reserve that could be used in future years), $146 billion in 2021, $157 billion in 2022, $168 billion in 2023, $179 billion in 2024, $190 billion in 2025, and $190 billion in 2026. There is no authority in the bill for the block grant to continue after 2026.
  • Allotments to states for 2020 would be based on current federal spending by state for the Medicaid expansion and individual insurance market subsidies, trended forward to 2019. States would have some flexibility in choosing a base period for the initial allotments.
  • Allotments for 2026 would be based on the distribution of legal residents with incomes from 50% to 138% of the poverty level across states. State allotments would be phased down or up for years between 2020 and 2026.
  • If the formula produces total state allotments that are greater (or less) than the designated national amounts, they are phased up (or down) on a prorated basis. There would be adjustments across states for population changes, health risk, and the value of coverage provided to people. In addition, the Secretary has discretion to make additional changes to the allocation based on state population factors that affect health expenditures.

Overall, we estimate that federal funding under the new block grants would be $107 billion less than what the federal government would have spent over the period 2020-2026 for expanded Medicaid coverage, premium tax credits, cost-sharing subsidies, and the basic health program (Table 1 and Figure 1).

Figure 1: Change in Federal Spending for Coverage Expansions under Graham-Cassidy by Medicaid Expansion Status ($ Billions), 2020-2026

There would be a significant redistribution in federal funding across states under the block grant proposed in the Graham-Cassidy bill. In general, states that have expanded Medicaid under the ACA and/or have had substantial enrollment in the health insurance marketplaces would see reductions in federal spending for coverage expansions, while other states would see increases. The median change in federal funds under the block grant program relative to current law is -11% for Medicaid expansion states, for a total of $180 billion in reduced funding over 2020-2026, versus a median increase of 12% (a total of $73 billion) in states that have not expanded Medicaid (Figure 1).

Five states would see a reduction in federal funds of 30% or more from 2020-2026: New York (-35%), Oregon (-32%), Connecticut (-31%), Vermont (-31%), and Minnesota (-30%). Six states would see at least 40% more in federal funds under the proposal: Tennessee (44%), South Dakota (45%), Georgia (46%), Kansas (61%), Texas (75%), and Mississippi (148%). States with the largest potential loss of federal funds are California (-$56 billion), New York (-$52 billion), and Pennsylvania (-$11 billion). Texas would see $34 billion more in federal funds, and Georgia, Tennessee, and Mississippi would see large gains ($10 billion, $7 billion, and $6 billion, respectively) over the period.

Because actual state allotments under the block grant may vary based on state-specific factors and the Secretary’s authority to further adjust the formula, actual state experiences under the block grant may differ. It is uncertain how additional adjustments would be used to alter states’ allotments up or down.

Unlike the marketplace subsidies and Medicaid expansion under the ACA, the block grants are fixed and would not adjust based on the number of people covered or increases in health care costs. The block grants end after 2026, and further action by Congress would be required to continue them. If Congress did not extend the block grants, we estimate a reduction in federal funding for expanded coverage relative to current law of $225 billion in 2027 alone (Table 3).

State-by-State Effects of Capping Medicaid Spending

The proposal also converts the traditional Medicaid program for low-income parents, children, people with disabilities, and the elderly from one with open-ended federal financing to one in which federal Medicaid spending for most enrollees would be limited to a set amount per enrollee, similar to previous repeal and replace legislation. The capped financing structure would work as follows:

  • States would use data from FY 2014-2017 to develop base year per enrollee spending that would be inflated to 2019 based on the medical component of the consumer price index (CPI-M).
  • Beginning in 2020, federal spending would be limited to the federal share of spending based on per enrollee amounts calculated by inflating the base year spending by CPI-M for children and adults and CPI-M plus one percentage point for the elderly and disabled.
  • Beginning in 2025, these rates would be further limited to the CPI-U (or general inflation) for children and adults and to CPI-M for the elderly and people with disabilities.

As a result of these limits, federal Medicaid financing would grow more slowly than estimates under current law. Over the 2020-2026 period, we estimate that federal Medicaid spending would be $53 billion lower than it would be under current law (Table 2). Per enrollee caps become more binding over time, and in 2027 alone, we estimate that federal spending for the traditional Medicaid program would be $15 billion lower than under current law (Table 3).

State-by-state estimates vary depending on the current size of the state’s Medicaid program and its case mix of enrollment across eligibility groups. However, the vast majority of states1  face a potential loss of federal funds for their traditional Medicaid programs under the per enrollee cap.

Figure 2: Change in Federal Spending under Graham-Cassidy due to ACA Block Grant and Medicaid Per Capita Cap ($ billions), 2020-26

The per enrollee cap offsets some of the gains the state may realize under the block grant or, in states that face a potential loss under the block grant, increases the drop in federal funds. Nationally, we estimate that the two provisions together would lead to a $160 billion reduction in federal funds to states from 2020-2026 (Figure 2 and Table 2). In some states (Ohio, Maine, and Louisiana), the potential loss of funds under the traditional Medicaid program fully offsets potential gains in federal funds under the block grant, leading to a net loss for the state.

Conclusion

The two main provisions in the Graham-Cassidy proposal—converting ACA coverage expansions to a block grant to states and converting traditional Medicaid financing to a federal per enrollee cap—affect coverage for more than 80 million Americans and have substantial implications for states’ ability to finance health coverage for their residents. Most states would lose federal funding under this proposal over the period 2020-2026. Because overall funding for health coverage is lower under the bill than we project under current law, the number of people uninsured would likely grow.

While some states—especially those that did not expand Medicaid under the ACA or did not experience significant enrollment in the health insurance marketplace—may gain new funds under the block grant, they would lose federal funds for their traditional Medicaid program. In addition, states that have already expanded Medicaid under the ACA or have seen big gains in marketplace enrollment would generally lose federal funds.

This bill leaves enormous discretion to states to determine what to do with federal block grant funding and what protections to provide in the individual and small group insurance markets.  The bill allows states to roll back the essential health benefits now offered in the nongroup and small group markets and to permit insurers to charge higher premiums to people with pre-existing conditions.  Because the ACA’s Medicaid expansion and private insurance subsidies end in 2020, every state would be expected to create new health insurance coverage programs from scratch. It is difficult to anticipate how much of the funds states will devote to coverage or what types of programs they will arrange, so estimating how many people will be covered, and the adequacy of that coverage, is quite difficult. Because the bill does not provide for block grants beyond 2026, federal funding would drop precipitously after that if Congress does not act to reauthorize funding, resulting in a significant increase in the number of people uninsured.

Table 1: Changes to Federal Spending for ACA Coverage under Graham-Cassidy($ Millions), 2020-2026
StateCurrent Law Federal Funds for ACA CoverageFederal Funds under Block Grant ProgramDifference ($)Difference (%)
US Total1,283,1071,176,000-107,107-8%
Alabama12,50416,5184,01532%
Alaska3,5833,308-275-8%
Arizona31,23828,305-2,933-9%
Arkansas15,06313,930-1,133-8%
California244,640188,672-55,969-23%
Colorado17,70615,419-2,288-13%
Connecticut17,89712,294-5,603-31%
Delaware5,1494,130-1,018-20%
DC2,9562,671-286-10%
Florida81,45173,894-7,557-9%
Georgia21,91431,8989,98446%
Hawaii5,4985,379-119-2%
Idaho4,3505,5081,15827%
Illinois43,08642,508-578-1%
Indiana25,66524,987-678-3%
Iowa9,28010,1068269%
Kansas4,5637,3482,78661%
Kentucky28,52123,133-5,388-19%
Louisiana20,29720,4341371%
Maine3,8794,2043258%
Maryland19,68518,082-1,603-8%
Massachusetts20,82718,979-1,848-9%
Michigan39,89134,960-4,931-12%
Minnesota28,17819,834-8,344-30%
Mississippi4,07910,1026,024148%
Missouri12,04116,4144,37336%
Montana6,0104,490-1,520-25%
Nebraska5,6494,923-726-13%
Nevada11,47110,601-870-8%
New Hampshire3,9473,641-306-8%
New Jersey34,31529,077-5,237-15%
New Mexico14,09211,914-2,178-15%
New York148,06296,438-51,623-35%
North Carolina40,37834,673-5,704-14%
North Dakota2,1381,975-164-8%
Ohio37,52639,2811,7555%
Oklahoma10,52612,7702,24421%
Oregon28,74419,544-9,200-32%
Pennsylvania57,43046,056-11,373-20%
Rhode Island4,9384,191-747-15%
South Carolina11,67416,2184,54439%
South Dakota1,7472,54279545%
Tennessee15,40222,1406,73844%
Texas45,51979,79234,27375%
Utah5,9187,7171,79930%
Vermont3,4772,407-1,070-31%
Virginia15,67620,4594,78331%
Washington32,94727,631-5,317-16%
West Virginia8,6578,128-530-6%
Wisconsin11,33814,8263,48931%
Wyoming1,5861,548-38-2%
SOURCE: Kaiser Family Foundation estimates, September 2017.
Table 2: Total Change in Federal Spending under Graham-Cassidy due toACA Block Grant and Medicaid Per Capita Cap ($ Millions), 2020-2026
StateChange in Federal Funds Due to Block GrantChange in Federal Funds Due to Medicaid Per Enrollee CapTotal Change in Federal Funds ($)
US Total-107,107-52,759-159,867
Alabama4,015-5853,430
Alaska-2750-275
Arizona-2,933-1,562-4,495
Arkansas-1,133-1,138-2,271
California-55,969-5,711-61,680
Colorado-2,288-573-2,860
Connecticut-5,603-156-5,759
Delaware-1,018-146-1,164
DC-286-335-621
Florida-7,557-2,155-9,712
Georgia9,984-2,6457,339
Hawaii-119-164-283
Idaho1,158-309849
Illinois-578-1,228-1,807
Indiana-678-831-1,509
Iowa826-421405
Kansas2,786-3412,445
Kentucky-5,388-958-6,346
Louisiana137-804-667
Maine325-379-54
Maryland-1,603-981-2,584
Massachusetts-1,848-1,707-3,555
Michigan-4,931-2,280-7,211
Minnesota-8,344-1,016-9,359
Mississippi6,024-7625,262
Missouri4,373-1,3313,042
Montana-1,5200-1,520
Nebraska-726-180-906
Nevada-870-282-1,153
New Hampshire-306-148-454
New Jersey-5,237-1,252-6,489
New Mexico-2,178-808-2,986
New York-51,623-645-52,268
North Carolina-5,704-2,465-8,170
North Dakota-164-70-233
Ohio1,755-2,365-610
Oklahoma2,244-9471,298
Oregon-9,200-578-9,778
Pennsylvania-11,373-1,004-12,377
Rhode Island-747-231-977
South Carolina4,544-1,3733,171
South Dakota795-109685
Tennessee6,738-1,9784,759
Texas34,273-5,82328,449
Utah1,799-6431,156
Vermont-1,070-207-1,277
Virginia4,783-9173,866
Washington-5,317-1,155-6,472
West Virginia-530-435-964
Wisconsin3,489-5622,927
Wyoming-38-62-100
SOURCE: Kaiser Family Foundation estimates, September 2017.
Table 3: Total Change in Federal Spending under Graham-Cassidy due toACA Block Grant and Medicaid Per Capita Cap ($ Millions), 2027
StateLoss of Federal Funds for ACA Coverage if Congress Does Not Extend Block GrantLoss of Federal Funds Due to Medicaid Per Enrollee CapTotal Loss of Federal Funds
US Total-225,072-15,001-240,073
Alabama-2,058-155-2,212
Alaska-6320-632
Arizona-5,559-462-6,021
Arkansas-2,734-326-3,060
California-43,846-1,718-45,564
Colorado-3,172-164-3,335
Connecticut-3,196-51-3,248
Delaware-924-41-964
DC-545-99-643
Florida-13,403-601-14,004
Georgia-3,606-763-4,369
Hawaii-998-47-1,045
Idaho-716-84-800
Illinois-7,656-346-8,002
Indiana-4,643-226-4,869
Iowa-1,659-116-1,775
Kansas-751-95-846
Kentucky-5,208-268-5,477
Louisiana-3,590-211-3,801
Maine-638-107-745
Maryland-3,525-290-3,815
Massachusetts-3,734-508-4,243
Michigan-7,159-648-7,807
Minnesota-4,965-287-5,252
Mississippi-671-208-879
Missouri-1,981-358-2,339
Montana-1,0480-1,048
Nebraska-930-50-980
Nevada-2,058-79-2,137
New Hampshire-704-43-747
New Jersey-6,115-359-6,474
New Mexico-2,570-238-2,807
New York-26,194-202-26,395
North Carolina-6,644-674-7,319
North Dakota-379-19-398
Ohio-6,790-687-7,477
Oklahoma-1,732-269-2,001
Oregon-5,194-162-5,356
Pennsylvania-10,181-231-10,412
Rhode Island-893-66-958
South Carolina-1,921-392-2,313
South Dakota-288-31-318
Tennessee-2,534-582-3,116
Texas-7,490-1,577-9,068
Utah-974-180-1,154
Vermont-619-59-678
Virginia-2,580-259-2,838
Washington-5,984-347-6,331
West Virginia-1,553-124-1,677
Wisconsin-1,866-175-2,041
Wyoming-261-17-278
SOURCE: Kaiser Family Foundation estimates, September 2017.

Methods

These estimates are based on Kaiser Family Foundation analysis. We combined data from a variety of sources to develop a baseline of future Medicaid enrollment and spending by state and future federal spending by state for marketplace premium tax credits, cost sharing reductions, and Basic Health Program coverage under current law. We then applied the policy changes in the proposal—specifically, the replacement of federal ACA coverage funds with a state block grant program and the use of a per enrollee cap on federal funds for traditional beneficiaries—to project future spending under the proposal and compare these estimates to our baseline. These estimates assume that states make no other policy changes other than those explicitly modeled. They therefore differ from estimates from the Congressional Budget Office (CBO). CBO also must account for all provisions in the legislation and make estimates about how the Secretary will respond to discretion to implement various provisions as well as how states and individuals will respond to changes in the law that are not incorporated into our estimates.

Our estimates for changes in federal spending nationally may differ from those released by CBO for a variety of other reasons. Our estimates are based on the most currently available data for federal spending on the Medicaid expansion and marketplace subsidies. Because the Congressional debate is in the context of a fiscal year 2017 budget resolution, CBO uses its March 2016 baseline to score health reform proposals, and this baseline is not adjusted for more recent data. CBO assumes that some additional states would expand Medicaid in future years under current law, while our estimates are based on current state Medicaid expansion decisions.

Baseline Medicaid Enrollment and Spending. We generated estimates of Medicaid enrollment and spending for full-benefit enrollees in FY2016 based on Kaiser Family Foundation analysis of the FY2015 Medicaid Statistical Information System (MSIS). We adjusted MSIS spending to CMS-64 spending to account for MSIS undercounts of spending. Because FY2015 MSIS data were missing some or all quarters for some states, we also adjusted the enrollment data using secondary data to represent a full fiscal year of enrollment. We accounted for a state’s expansion status, the number of quarters of missing data, and the state’s historical patterns of spending and enrollment in making state-by-state adjustments, using similar methods we used for estimates for earlier years. Because MSIS does not identify adults who are eligible through the ACA expansion versus pre-ACA pathways, we used the FY2015 Medicaid Budget and Expenditure System (MBES) data to break out enrollment and spending for Group VIII (ACA expansion) enrollees. We then inflated to FY2016 based on the CMS Office of the Actuary (OACT) estimates of annual changes in enrollment and spending by eligibility group, with the exception of enrollment for Group VIII, which was obtained from the available FY2016 MBES data. In some cases (e.g., states that expanded after FY2015), we made state-specific adjustments to the data.

We used the FY2016 base year data to project future Medicaid enrollment and spending by eligibility group. Because there is uncertainty around future growth rates in Medicaid and estimates vary widely, we used the average of OACT and Congressional Budget Office (CBO) predictions of future growth in Medicaid enrollment and spending per enrollee by eligibility group. We applied the same growth rates to all states. We calculated the federal/state split in spending by enrollment group for each year based on the relevant FMAP for the eligibility group and year. For non-expansion groups, we used the most recent FMAPs available (FY2018) for all years; for expansion groups, we used the FMAPs for each year as specified under current law, though we did not account for differential match rates for Group VIII enrollees who are not newly eligible and may qualify for a different match rate. Since these projections use national data and uniform growth rates, individual state estimates may have more detailed data.

Baseline Marketplace Spending. We estimated state-level federal spending for advanced premium tax credits (APTCs) for individual coverage through the marketplace based on data reflecting February 2017 effectuated enrollment and average APTCs publicly-available from CMS. Cost-sharing reduction (CSR) payments are based on data by county from CMS for healthcare.gov states, trended forward to 2017. For state-based exchanges, we assumed for each state that CSR payments represent the same percentage of average APTCs as that for healthcare.gov states. We included federal payments for Basic Health Programs for 2017 based on federal spending estimates from CBO, apportioned by state based on enrollment data from CMS. We then projected future total spending for APTCs, CSRs, and BHP based on growth rates from CBO projections of future spending for the sum of these provisions, using the latest CBO report of federal subsidies for health insurance coverage. We assumed that marketplace APTCs and CSRs for Alaska do not grow from 2017 to 2018, since that state is implementing a reinsurance program under an ACA waiver. Premiums are expected to drop in Alaska, lowering APTC amounts, but the federal government is also providing pass-through payments to the state under the waiver. Based on data included in the federal government’s approval letter for the waiver, we assume those amounts are offsetting.

Federal Spending Under Proposed Bill.

Market Based Block Grant Program: We used our estimates of 2017 federal spending for marketplace payments and ACA Medicaid expansion payments. For marketplace payments, we inflated 2017 to 2019 based on CBO projections of CPI-M; for Medicaid payments, we inflated 2017 to 2019 based on CPI-M as the inflations factor specified in the bill were not clear. We used the sum of federal marketplace and Medicaid expansion payments for 2019 to estimate state block grant allocations within the total federal allocation starting in 2020 as specified in the bill: 2020 allocations are based on actual state amounts, prorated up to the US total; 2026 allocations are based on the US total distributed across states according to the state’s share of legal resident population with income between 50% and 138% of poverty; and 2021-2025 are allocated by the difference between the state’s 2020 and 2026 allocations divided by six. Because 2020 actual spending was below the total US allocation, we shifted the $10 billion reserve fund to spending in 2026 as specified in the bill. While it would not affect the block grant allocations, the bill includes another provision that would eliminate Medicaid DSH reductions for 2021-2025 and provide for a one-time DSH increase in 2026 for states that experience “grant shortfalls.” We do not estimate the potential offset of the DSH policy due to limited data on future DSH allocations and cuts across states.

Medicaid Per Enrollee Cap: Our estimates of spending under the proposal to use a per enrollee cap first inflate FY2016 per enrollee spending to FY2019 based on CPI-M as specified in the bill. For FY2020 and on, we apply limits in growth in per enrollee spending as specified in the bill: from FY2020-2024, per enrollee growth is limited to CPI-M for adults and children and CPI-M+1 for aged and disabled; from FY2025 on, per enrollee growth is limited to CPI-U for adults and children and CPI-M for the aged and disabled. We use estimates of CPI-M and CPI-U from the CBO.2 ,3  We calculate the federal/state split in spending based on the most recent FMAPs available (FY2018) for all years. We assume no changes in Medicaid enrollment other than those explicitly modeled and calculate the difference in federal spending compared to the baseline. We exempt Alaska and Montana from the per enrollee cap because these states meet the rules for exemption (based on their block grant allotments) specified in the bill.

  1. Certain states with low population density are not subject to the per enrollee cap in a given year at Secretary discretion or if their allotment under the new block grant program is below the 2020 allotment increased by CPI-M.  We anticipate that this provision will affect at least Alaska and Montana. ↩︎
  2. Congressional Budget Office. The Budget and Economic Outlook: 2017 to 2027; January 24, 2017. ↩︎
  3. Congressional Budget Office. Cost Estimate: H.R. 1628, Better Care Reconciliation Act of 2017; June 26, 2017. ↩︎