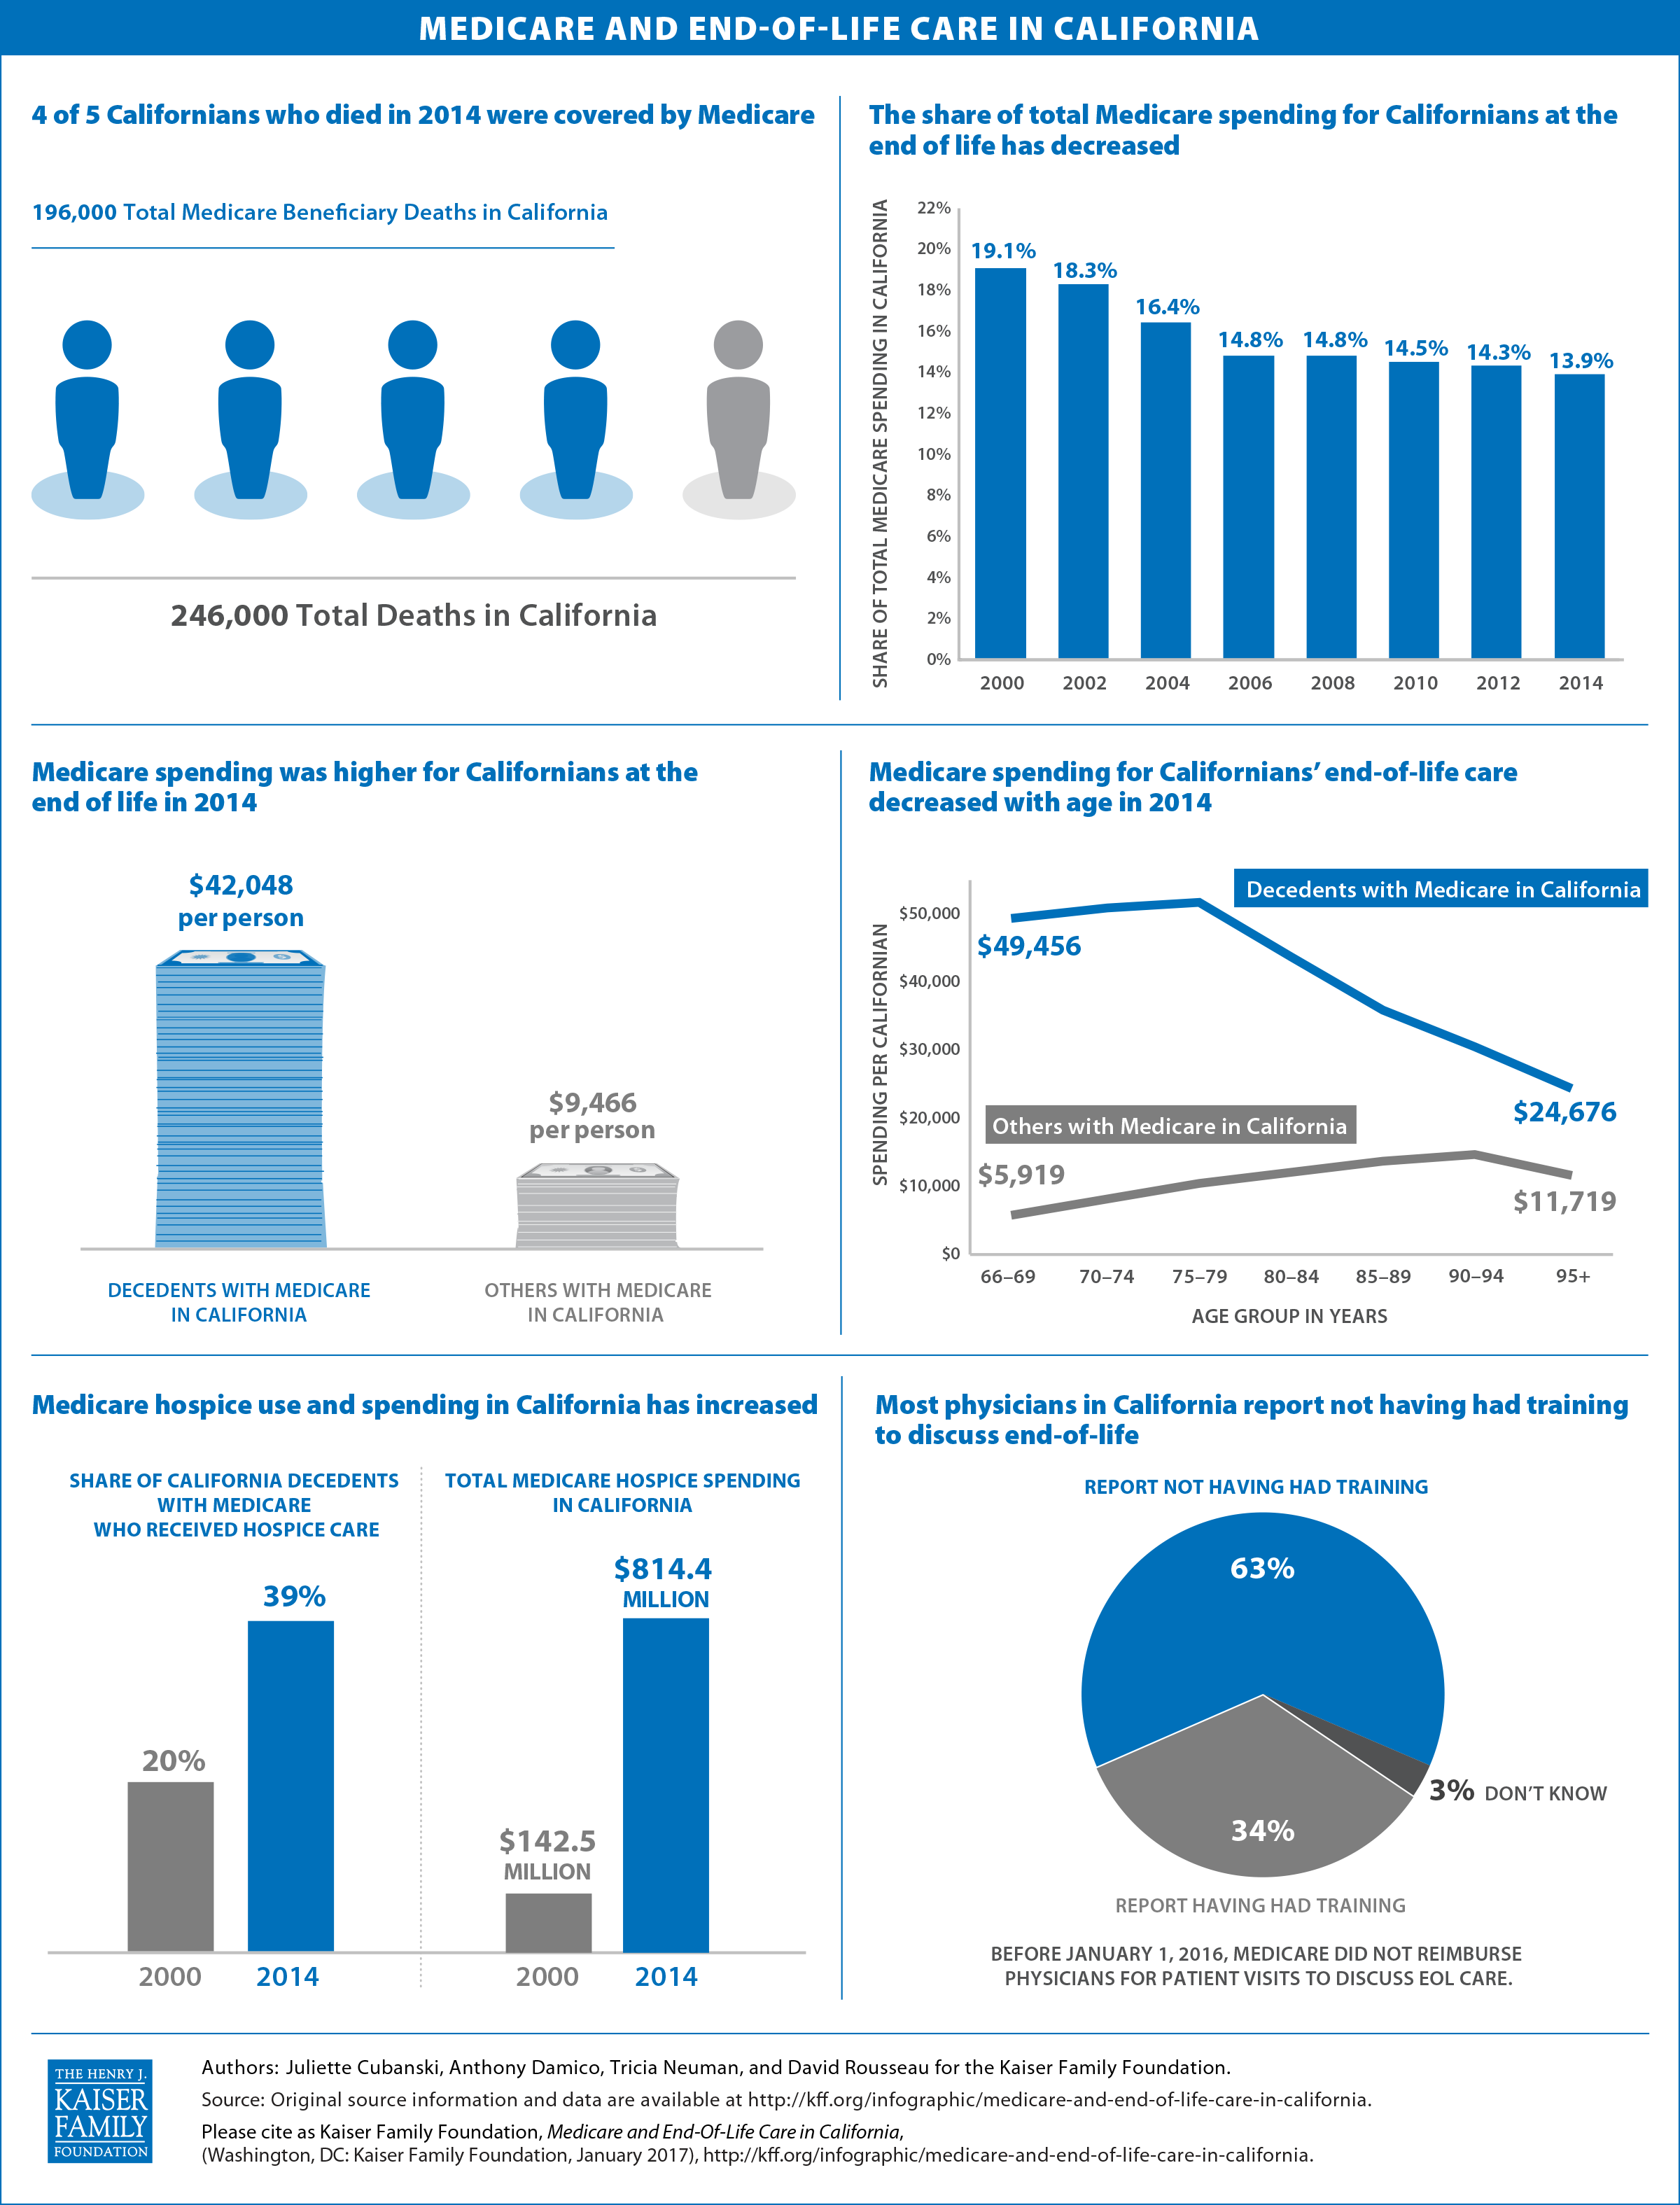
Medicare and End-of-Life Care in California
The independent source for health policy research, polling, and news.
As the Trump administration and Republican leadership in Congress begin a new term and seek to repeal the Affordable Care Act (ACA), a new 50-state survey from the Kaiser Family Foundation offers an in-depth profile of Medicaid and Children’s Health Insurance Program (CHIP) eligibility, enrollment, renewal, and cost sharing policies in each state as of January 2017, providing a baseline against which future policy changes may be measured.
Changes to Medicaid and CHIP could affect coverage for many of the nation’s low-income families and adults given the central role these programs play in providing coverage, as shown in the survey findings. As of 2017, 49 states cover children and 34 states cover pregnant women with incomes at or above two times the federal poverty level ($40,320 for a family of three). Thirty-two states cover low-income parents and other adults with incomes up to at least 138 percent of the federal poverty level ($27,820 for a family of three), reflecting their adoption of the ACA Medicaid expansion. In the 19 states that have not adopted the expansion, the median eligibility limit for parents remains at 44 percent of the federal poverty level and other adults without dependent children are not eligible regardless of income, except in Wisconsin.
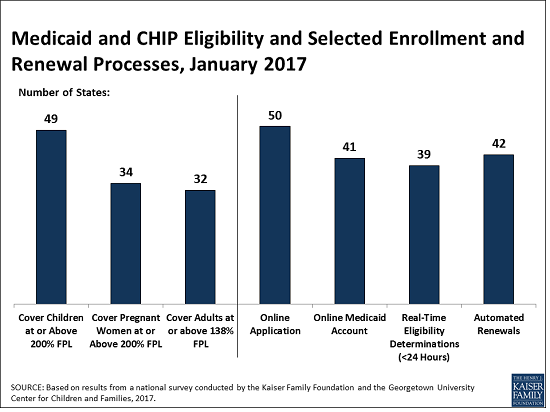
In addition to the impact on coverage, repeal of the ACA could alter Medicaid eligibility, enrollment, and renewal policies and processes in every state. The ACA standardized and streamlined these processes to move to a modernized, technology-driven approach. Following several years of state efforts to implement these processes through major upgrades to state eligibility systems, 50 states currently have an online application for Medicaid, 41 states offer an online account for enrollees to manage their Medicaid coverage, 39 states can determine Medicaid eligibility decisions within 24 hours, and 42 states are processing automated renewals. Since Medicaid systems coordinate or are integrated with Marketplace systems in all states, changes to the Marketplaces would also affect Medicaid.
Lastly, the survey provides detail on states’ continued use of available options to expand access to coverage and further streamline enrollment and renewal processes and provides information on states’ use of premiums and cost sharing in Medicaid and CHIP.
This 15th annual survey, Medicaid and CHIP Eligibility, Enrollment, Renewal, and Cost Sharing Policies as of January 2017: Findings from a 50-State Survey, conducted in the fall of 2016 with Georgetown University’s Center for Children and Families, offers an in-depth profile of eligibility, enrollment, renewal, and cost sharing policies in each state and can serve as a baseline for changes going forward. Reports from previous years can be found on KFF.org.
This 15th annual 50-state survey provides data on Medicaid and Children’s Health Insurance Program (CHIP) eligibility, enrollment, renewal and cost sharing policies as of January 2017, and identifies changes in these policies in the past year. (See Appendix Tables 1-21 for state data.) As discussion of repeal of the Affordable Care Act (ACA), broader changes to Medicaid, and reauthorization of CHIP unfolds, this report documents the role Medicaid and CHIP play for low-income children and families and the evolution of these programs under the ACA. The findings offer an in-depth profile of eligibility, enrollment, renewal, and cost sharing policies in each state as of January 2017, providing a baseline against which future policy changes may be measured.
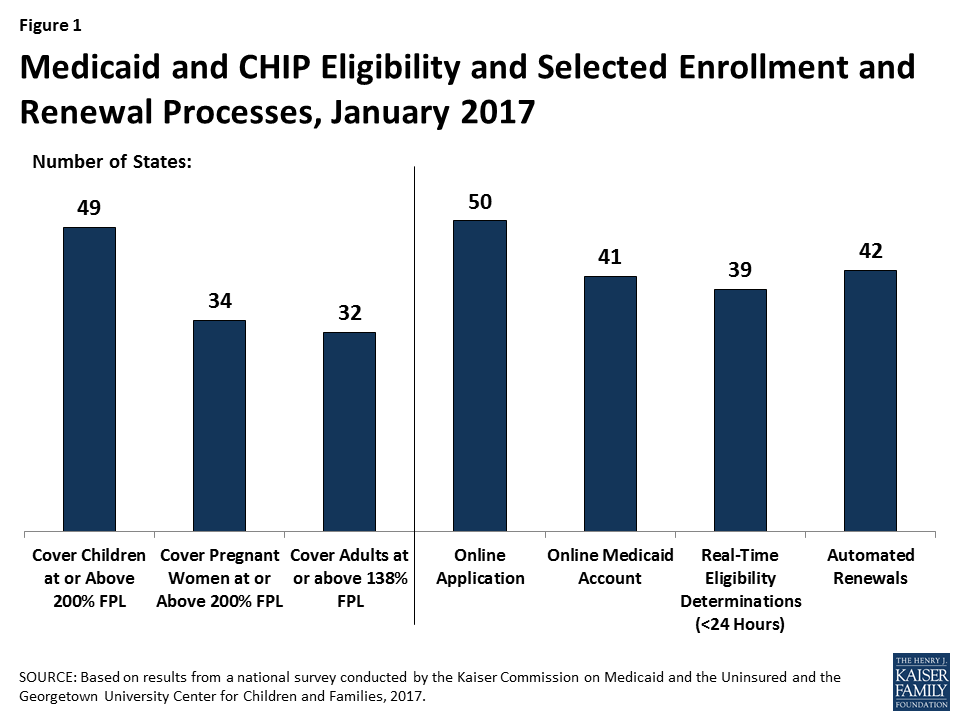
Medicaid and CHIP are the central sources of coverage for low-income children and pregnant women, with 49 states covering children and 34 states covering pregnant women with incomes at or above 200% FPL as of January 2017 (Figure 1). CHIP plays a key role across states, covering children in separate CHIP programs in 36 states, funding coverage for some children in Medicaid in 49 states, and supporting coverage for pregnant women in 19 states. In 2016, several states took up options to expand access to coverage for children and pregnant women.
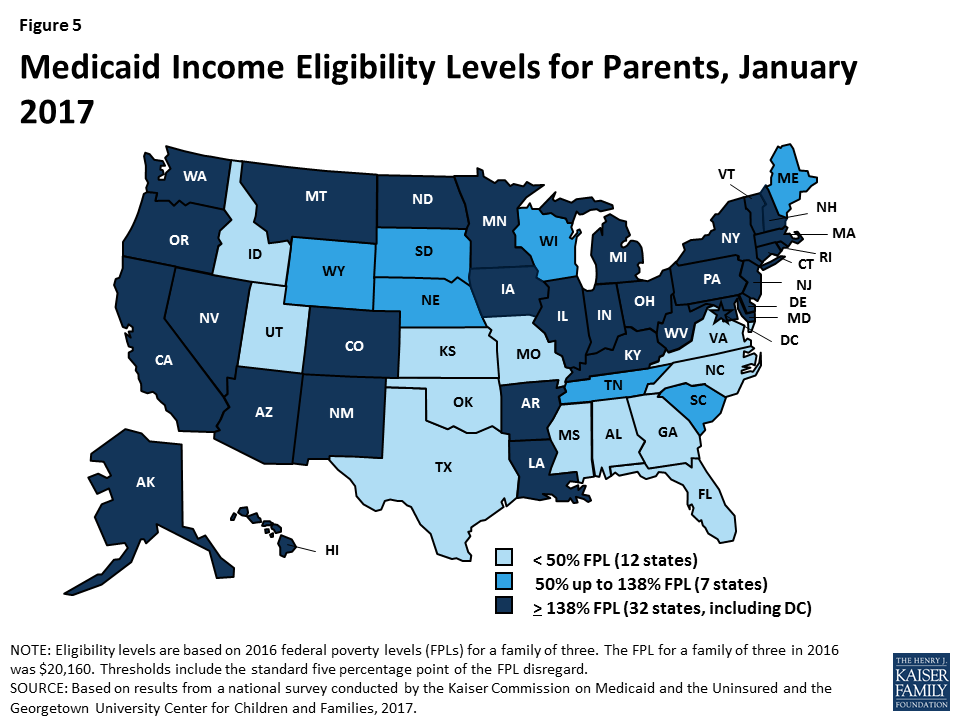
Medicaid’s role for low-income adults broadened under the ACA, with 32 states covering low-income parents and other adults with incomes up to 138% FPL ($16,394 for an individual or $27,820 for a family of three in 2016) under the Medicaid expansion as of January 2017. This count reflects Louisiana’s adoption of the expansion in 2016. In the 19 states that have not expanded, the median eligibility limit for parents is 44% FPL ($8,870 for a family of three as of 2016) and other adults are ineligible regardless of income, except in Wisconsin.
During 2016, states continued to upgrade and streamline Medicaid eligibility and enrollment systems and processes under the ACA, using federal funding available to support system development. As of January 2017, 50 states have an online Medicaid application, 41 states offer online accounts for enrollees to manage their coverage, 39 states make real-time Medicaid eligibility decisions, and 42 states process automated renewals. Moreover, Medicaid systems coordinate or are integrated with Marketplace systems in all states. In 12 of the states with a State-based Marketplace (SBM), there is one system that determines eligibility for Medicaid and Marketplace coverage. The remaining 39 states transfer data back and forth with the Federally-Facilitated Marketplace (FFM), HealthCare.gov, to coordinate eligibility decisions.
Use of premiums and cost sharing in Medicaid and CHIP varies across states and groups. As of January 2017, 30 states charge premiums or enrollment fees and 25 states charge cost sharing for children in Medicaid or CHIP. In most cases, these charges are limited to children in CHIP, because CHIP covers children with higher family incomes than those in Medicaid and the program has different premium and cost sharing rules. Given the low incomes of adults covered by Medicaid, most states do not charge adults premiums, and cost sharing amounts for adults are generally nominal. Overall, 39 states charge parents cost sharing, and 23 of the 32 states that have expanded Medicaid charge cost sharing for expansion adults. Six states have received waivers to charge premiums or monthly contributions for adults that are not otherwise allowed under law.
This year’s findings build on results from previous years, documenting state policy choices and state implementation of ACA changes to Medicaid, including the expansion to low-income adults and the streamlining of enrollment and renewal processes. Together, these changes have led to increased Medicaid and CHIP enrollment, which has helped to reduce the nation’s uninsured rate to historic lows of 10% for the population under age 65 and 5% for children as of June 2016.1 As discussion of repeal of the ACA, broader changes to Medicaid, and reauthorization of CHIP unfolds, the findings provide a baseline of state policies as of January 2017, against which future policy changes can be measured. Together they suggest:
Given the significant role of Medicaid and CHIP for low-income families across states, changes to these programs could affect coverage for many of the nation’s low-income families. The findings show that Medicaid and CHIP are central sources of coverage for low-income children and pregnant women in all states. Reauthorization of CHIP will have particularly important implications for children and pregnant women given the role CHIP plays complementing Medicaid to support their coverage across states. Loss of CHIP funding could put this coverage at risk and would create funding gaps for states. The findings also show how Medicaid’s role for low-income parents and other adults has broadened in states that implemented the ACA Medicaid expansion. If the Medicaid expansion was eliminated under a repeal of the ACA, many low-income parents and other adults would lose eligibility and potentially become uninsured, depending on what other coverage options may be available. Moreover, broader changes to the financing structure of Medicaid, coupled with reductions in federal Medicaid funding, could affect coverage for all groups of enrollees.
The ACA included changes in Medicaid eligibility, enrollment, and renewal policies and processes in all states, which could be affected by a repeal of the ACA. Under the ACA, all states have implemented new standardized streamlined eligibility, enrollment, and renewal policies, which have yielded modernized systems and processes that reduced paperwork for individuals and administrative burdens on states. Implementing these policies and processes has taken ongoing efforts by states since the ACA was enacted in 2010, with substantial investments of time and resources. It remains to be seen which of these policies or processes could be affected by a repeal of the ACA. However, reverting back to pre-ACA policies or implementing new policies would likely require major investments of time, staff, and resources. Moreover, changes to the Marketplaces could affect Medicaid eligibility systems and enrollment processes because the systems are interwoven in all states.
States are using available program options to expand access to coverage, further streamline enrollment and renewal processes, and charge premiums and cost sharing in Medicaid and CHIP. To date, states have taken up many available program options to expand coverage and further streamline enrollment and renewal processes, particularly for children and pregnant women. Most states also are using options to charge premiums and cost sharing to some Medicaid and CHIP enrollees. In most cases, states target premiums and above-nominal cost sharing to enrollees with relatively higher incomes. The program options available to states, states’ use of these options, and the role of waivers could be affected by a repeal of the ACA or broader efforts to restructure Medicaid.
This annual report presents Medicaid and CHIP eligibility, enrollment, renewal and cost sharing policies as of January 2017, and identifies changes in policies that occurred between January 2016 and 2017. As discussion around potential repeal of the Affordable Care Act (ACA), broader changes to the financing and structure of Medicaid, and reauthorization of CHIP unfold, this report offers an in-depth profile of eligibility, enrollment, renewal, and cost sharing policies in each state as of January 2017. This information may serve as a baseline against which future policy changes may be measured.
This report has documented state implementation of changes to Medicaid since the ACA was implemented in 2014, including the Medicaid expansion to low-income adults, changes to eligibility rules, and modernization and streamlining of enrollment and renewal processes. These changes have led to increases in Medicaid and CHIP enrollment, which rose by 17 million between Summer 2013 and October 2016,2 and helped reduce the nation’s uninsured rates to historic lows of 10% for the overall population under age 65 and 5% for children as of June 2016.3 This year’s survey finds continued state efforts to expand access to coverage for some groups and to implement the streamlined enrollment and renewal processes outlined in the ACA.
This report is based on a telephone survey of state Medicaid and CHIP program officials conducted by the Kaiser Commission on Medicaid and the Uninsured and the Georgetown University Center for Children and Families during Fall 2016. It includes findings in three key areas: Medicaid and CHIP Eligibility, Enrollment and Renewal Processes, and Premiums and Cost Sharing. State-specific information is available in Appendix Tables 1 to 21 at the end of the report. This report includes policies for children, pregnant women, parents, and other adults under age 65; it does not include policies for groups covered through Medicaid eligibility pathways for seniors and individuals with disabilities.
Most income eligibility limits for Medicaid and CHIP are based percentages of the federal poverty level (FPL). As of 2016, the FPL was $20,160 for a family of three and $11,880 for an individual. The ACA established a minimum Medicaid eligibility level of 133% FPL for children, pregnant women, and adults as of January 2014, and included a standard income disregard of five percentage points of the federal poverty level, which effectively raises this limit to 138% FPL. This expansion made many parents and other adults newly eligible for the program. Before the ACA, most states limited eligibility levels for parents to less than the poverty level and other adults generally were not eligible regardless of income. As enacted, the Medicaid expansion was to be implemented nationwide. However, the 2012 Supreme Court ruling on the ACA made the expansion to low-income adults optional. The minimum continues to apply nationwide for children and pregnant women, and, as a result of the minimum, 18 states transitioned coverage for some older children from separate CHIP programs to Medicaid during 2014.
The ACA also changed how financial eligibility is determined for non-disabled groups in Medicaid, including children, pregnant women, parents, and the new expansion adults, to be based on Modified Adjusted Gross Income (MAGI), as defined in the Internal Revenue Code. The ACA eliminated the use of income disregards and deductions other than the new standard disregard of five percentage points of the FPL and required states to convert their pre-ACA eligibility levels to MAGI-equivalent levels.
The findings below show eligibility levels for children, pregnant women, parents and other adults as of January 2017, and identify changes in eligibility that states made between January 2016 and 2017.
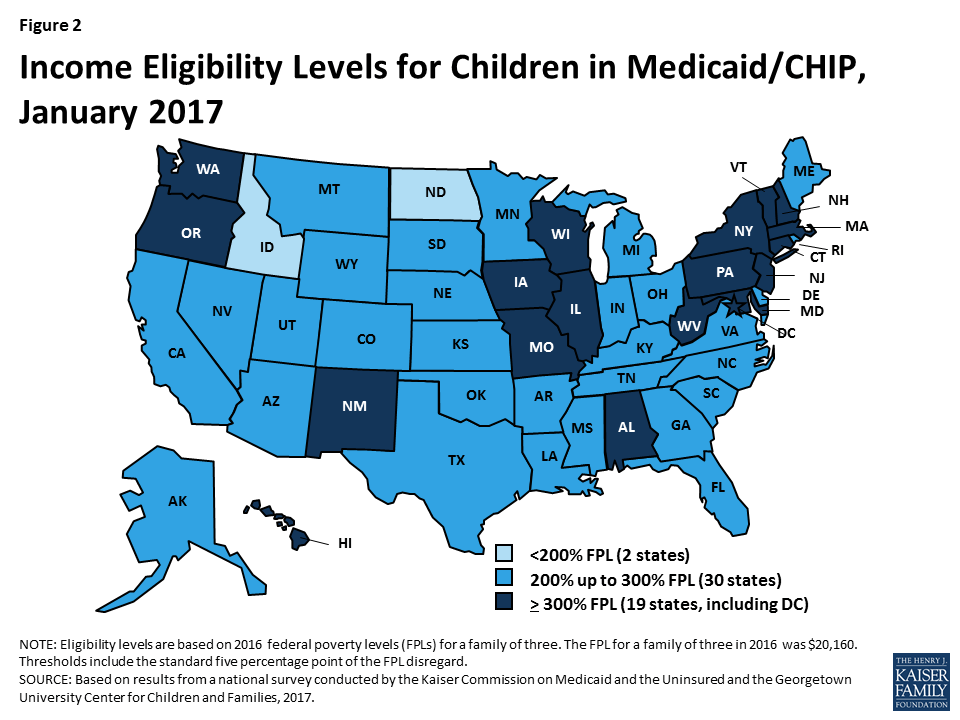
As of January 2017, 49 states cover children with incomes up to at least 200% FPL through Medicaid and CHIP, including 19 states that cover children with incomes at or above 300% FPL (Figure 2). Only two states (Idaho and North Dakota) limit children’s Medicaid and CHIP eligibility to lower incomes. Across states, the upper Medicaid/CHIP eligibility limit for children ranges from 175% FPL in North Dakota to 405% FPL in New York. Consistent with the past several years, children’s Medicaid and CHIP eligibility remained largely stable during 2016, with the exception of Michigan expanding eligibility to children with incomes up to 400% FPL who were affected by the Flint water crisis.4 This stability reflects the ACA’s maintenance of effort provision, under which states must keep children’s eligibility levels at least as high as the levels they had in place when the law was enacted in 2010 until 2019.
CHIP plays a substantial role covering children across states. As of January 2017, 36 states operate separate CHIP programs, and CHIP funding covers some children in Medicaid in 49 states. As of January 2017, enrollment is open in all separate CHIP programs. Arizona reopened enrollment in its CHIP program in July 2016; it had been closed to enrollment since late 2009, just prior to enactment of the ACA.
Several states took up options to cover more children through Medicaid and CHIP in 2016.
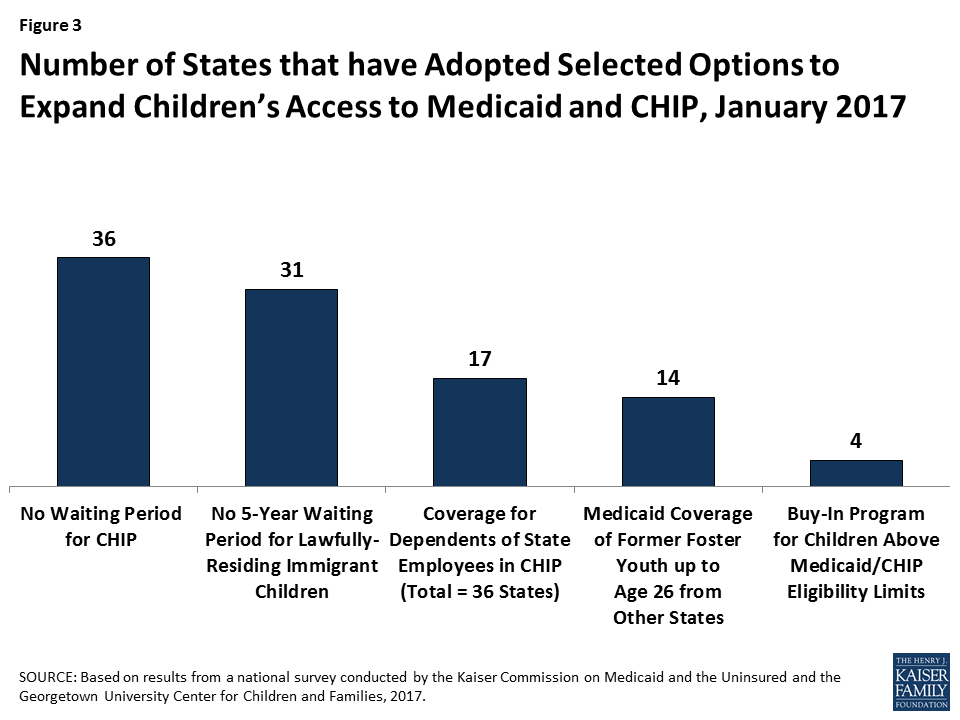
Four states have maintained programs that allow families above the upper income eligibility limit to buy into Medicaid or CHIP coverage for their children as of January 2017.6 The number of states offering buy-in programs declined from a peak of 15 in 2011 to 4 as of January 2017. An increasing number of states eliminated these programs in recent years, because many families above Medicaid and CHIP income limits gained new coverage options through the Marketplaces.
All states cover pregnant women with incomes up to at least 138% FPL, and 34 states cover pregnant women with incomes at or above 200% FPL as of January 2017 (Figure 4). Across states, eligibility for pregnant women ranges from 138% FPL in Idaho and South Dakota to 380% FPL in Iowa. Five states cover pregnant women through CHIP, and 16 states use CHIP funding to provide coverage through the unborn child option, under which states cover income-eligible pregnant women regardless of immigration status. Just under half of states (23 states) have taken up the option to cover lawfully residing immigrant pregnant women without a five-year waiting period. In addition, the District of Columbia, New Jersey, and New York use state-only funds to cover income-eligible pregnant women who are not otherwise eligible due to immigration status. During 2016, Michigan expanded Medicaid eligibility to pregnant women with incomes up to 400% FPL who were affected by the Flint water crisis. Missouri created a separate CHIP program for pregnant women with incomes between 201% and 305% FPL and adopted the unborn child option. Outside of these changes, Medicaid and CHIP coverage for pregnant women remained stable in 2016.

As of January 2017, over half of the states (29) have expanded access to family planning services through a waiver or the state option created by the ACA. States must provide family planning services as a covered benefit to Medicaid enrollees. Historically, some states also used waivers to provide family planning services to women or men who did not qualify for full Medicaid coverage. The ACA made a new option available for states to expand family planning services coverage. As of January 2017, 29 states have family planning expansion programs through a waiver or the state plan option.
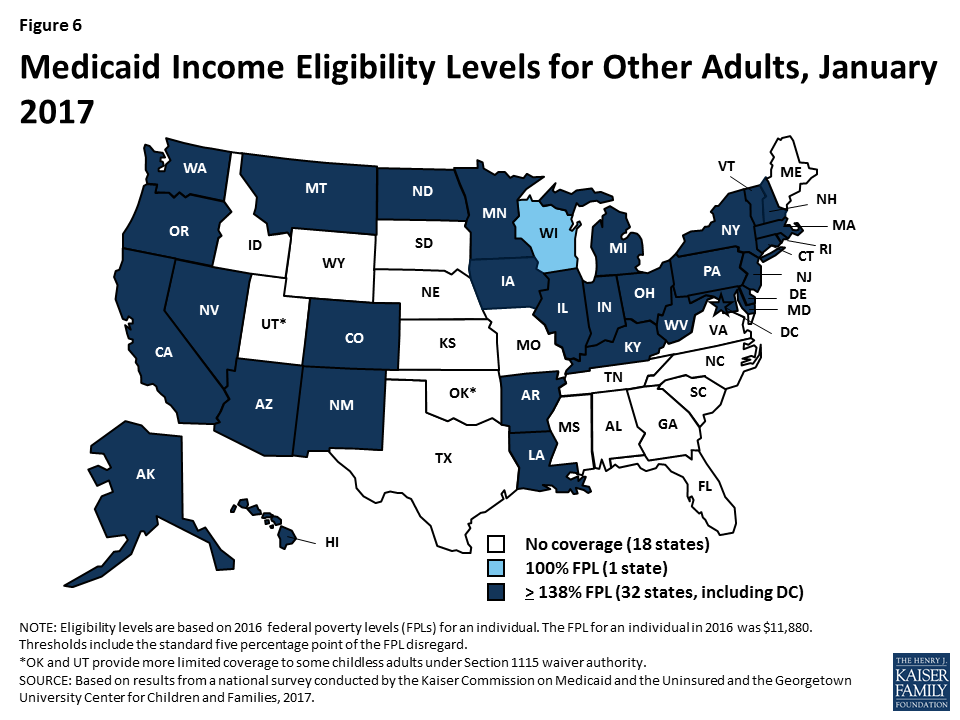
With Louisiana’s adoption of the Medicaid expansion during 2016, 32 states cover parents and other adults with incomes at up to at least 138% FPL as of January 2017 (Figures 5 and 6). Alaska, Connecticut, and the District of Columbia also extend coverage to parents and/or other adults with incomes above 138% FPL. In addition, two states, Minnesota and New York, have used the ACA Basic Health Program option to cover adults with incomes between 138% and 200% FPL, rather than having individuals in this income range access coverage through the Marketplace.
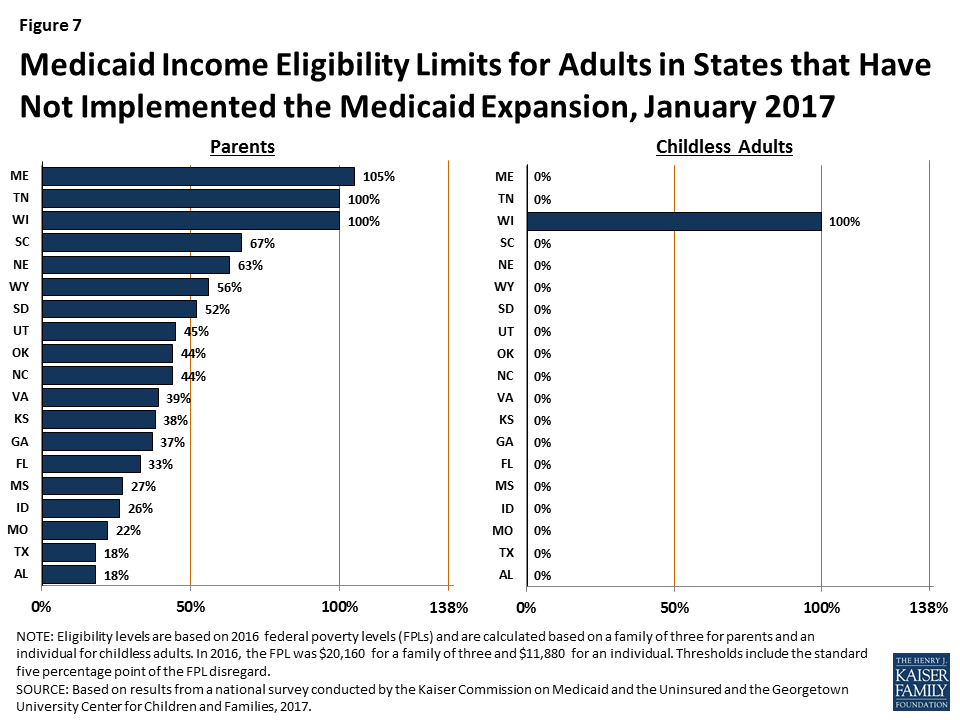
In the 19 states that have not expanded Medicaid, the median eligibility level for parents is 44% FPL, and other adults remain ineligible regardless of income, except in Wisconsin (Figure 7). Among the 19 non-expansion states, parent eligibility levels range from 18% FPL in Alabama to 105% FPL in Maine. Only 3 states—Maine, Tennessee, and Wisconsin—cover parents at or above 100% FPL, while 12 states limit parent eligibility to less than half the poverty level ($10,080 for a family of three as of 2016). Wisconsin is the only non-expansion state that provides full Medicaid coverage to other non-disabled adults, although its 100% FPL eligibility limit remains below the ACA expansion level and it does not receive the enhanced federal match for this coverage. While this study reports eligibility based on a percentage of the FPL, 13 non-expansion states base eligibility for parents on dollar thresholds (which have been converted to an FPL equivalent in this report). Twelve of these states do not routinely update the dollar standards, resulting in eligibility levels that erode over time relative to the cost of living. In non-expansion states, 2.6 million poor adults fall into a coverage gap.7 These adults earn too much to qualify for Medicaid, but not enough to qualify for subsidies for Marketplace coverage, which are available only to those with income at or above 100% of FPL.
The ACA standardized many streamlined enrollment and renewal procedures that states pioneered for children in the decades following the passage of CHIP in 1997. It also provided federal funding to support state upgrades to Medicaid eligibility systems, since many states had outdated systems that impeded updates to enrollment and renewal processes. Since the ACA was enacted, states have invested significant time and resources to upgrade or build new eligibility systems, using available federal funding. The modernized technology of these new systems has served as the cornerstone for states to implement the streamlined enrollment and renewal processes in the ACA. Under these processes, states are to use available electronic data to verify eligibility criteria at application and renewal; to provide individuals multiple methods to apply, including online, by phone, via mail, or in-person; to coordinate eligibility decisions with Marketplaces; and to renew Medicaid coverage every 12 months. Implementation of these processes has varied across states, in part reflecting different starting places before the ACA. However, as of January 2017, nearly all states have moved closer to the processes outlined in the ACA, with continued work occurring during 2016.
As a result of these efforts, the Medicaid enrollment and renewal experience has moved from a paper-based, manual process that could take days and weeks in some states to a modernized, technology-driven approach that can happen in real-time in a growing number of states. This shift has reduced burdens on individuals and states and led to shifting roles for eligibility workers, with some states scaling back or redirecting staff resources.
The findings below present the status of state systems and processes as of January 2017, and identify changes made to systems and processes during 2016. Unless otherwise indicated, the findings are for Medicaid systems and processes for children, pregnant women, parents and expansion adults. Many of the system upgrades and streamlined processes focused on these groups, and some separate eligibility rules and processes apply to seniors and individuals with disabilities. However, as indicated in the findings below, an increasing number of states are capitalizing on the federal funding available for system upgrades to expand improved systems to include all Medicaid groups and non-health programs.
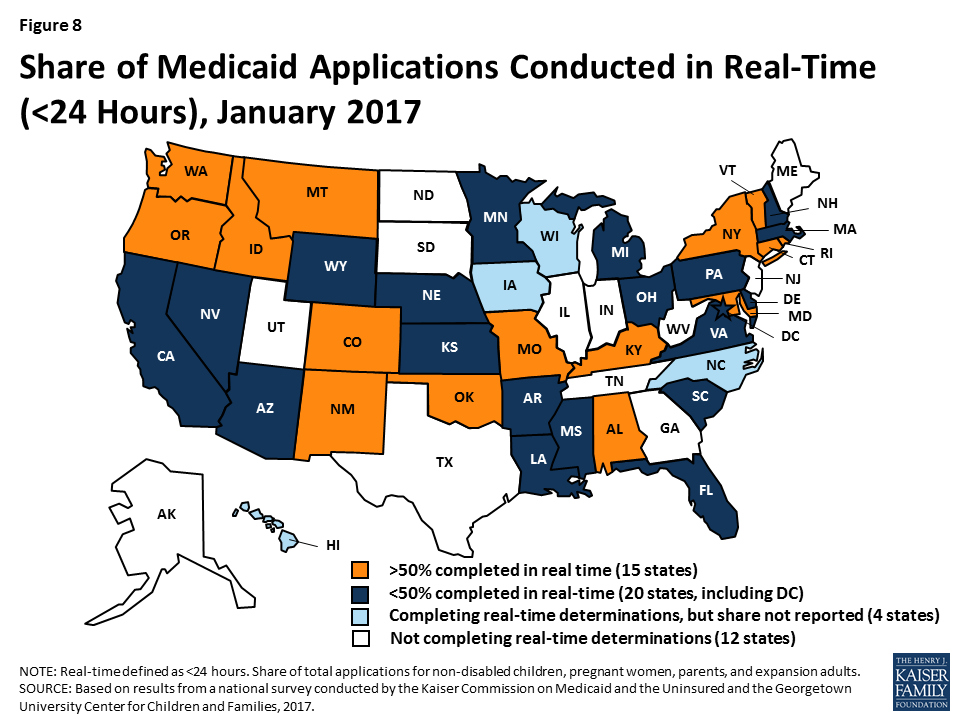
As of January 2017, 39 states can make Medicaid eligibility determinations in real-time (defined as within 24 hours). One of the notable features of upgraded eligibility systems is the ability to check against other electronic data sources in real-time or overnight to provide timely eligibility decisions. During 2016, Idaho and New Mexico began determining eligibility in real-time, and several more states anticipate reaching this milestone in early 2017. At least 50% of applications receive a real-time determination in 15 of the 35 states that were able to report this data (Figure 8), including 9 states that report over 75% of applications receive a real-time decision.
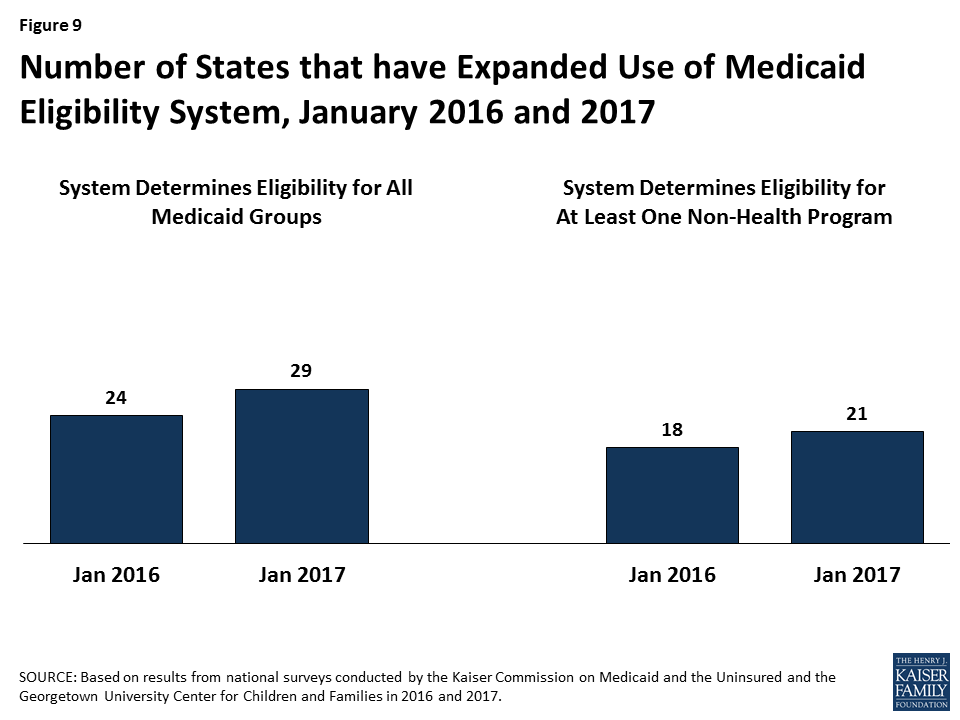
States are expanding improved Medicaid eligibility systems to include eligibility decisions for seniors and individuals with disabilities as well as non-health programs. Prior to the ACA, most states used one system to determine eligibility for all Medicaid groups as well as some non-health programs, such as the Supplemental Nutrition Assistance Program (SNAP) or Temporary Assistance for Needy Families (TANF). Given the complexity of system upgrades, many states initially built their new systems to determine eligibility for the non-disabled groups affected by the ACA streamlining changes. As new systems were launched for these groups, states continued to use their old systems to determine eligibility for seniors and individuals with disabilities as well as non-health programs. As states finished initial implementation of new systems, a number began expanding them to include other groups and programs, using the ongoing federal funding available for system upgrades. During 2016, the number of states with systems that determine eligibility for all Medicaid groups grew from 24 to 29 (Figure 9). The number of states that include at least one non-health program in their Medicaid system increased from 18 to 21. In addition, several states added additional non-health programs to their systems during 2016. Thirty states plan to expand their systems to include seniors and individuals with disabilities and/or additional non-health programs in 2017 and beyond.
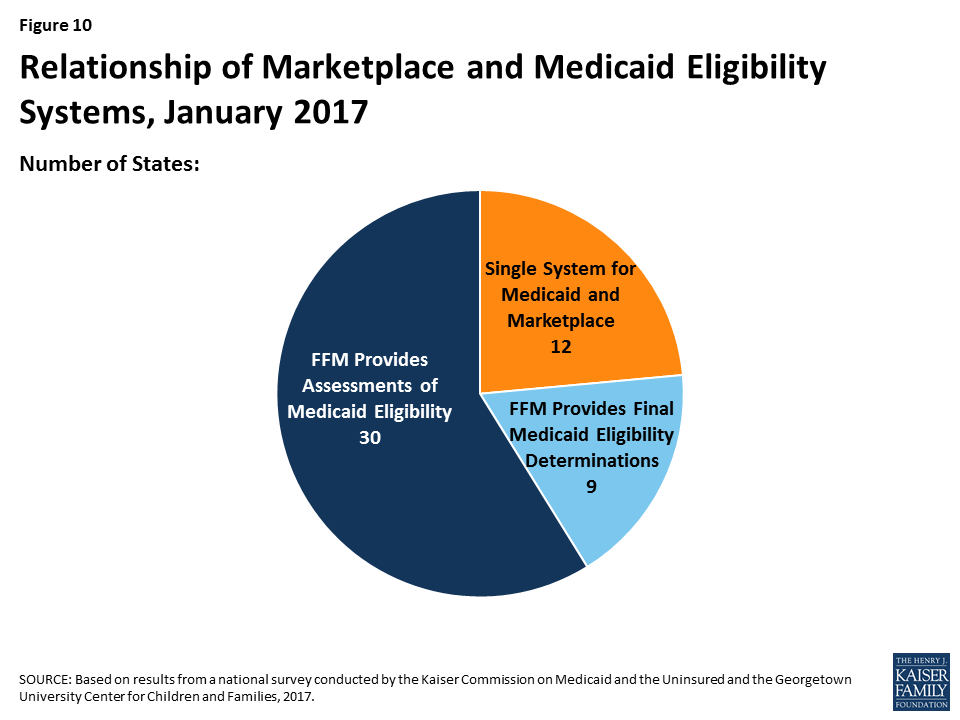
Medicaid eligibility systems are integrated with or connected to Marketplace systems in all states. In 12 of the states with a State-based Marketplace (SBM), there is one system that determines eligibility for both Medicaid and Marketplace coverage (Figure 10). The remaining 39 states coordinate with the Federally-Facilitated Marketplace (FFM), HealthCare.gov. This count reflects the dismantling of Kentucky’s SBM enrollment system, kynect, during 2016. States coordinating with the FFM must electronically transfer data back and forth with the FFM to coordinate Medicaid and Marketplace eligibility decisions. Nine of these states have authorized the FFM to make final Medicaid eligibility determinations based on the eligibility rules established by the state, enabling the states to enroll individuals in Medicaid after receiving the account transfer. During 2016, Louisiana began on relying final determinations to facilitate enrollment under its newly implemented Medicaid expansion. In the remaining 30 states, the FFM assesses Medicaid eligibility based on the state eligibility rules. In these states, after receiving the account transfer from the FFM, the Medicaid agency may check state data sources or request additional documentation before completing the eligibility determination. When the ACA was first implemented, there were significant problems with account transfers that contributed to delays in Medicaid enrollment. As of January 2017, only 6 states report ongoing, regular delays or difficulties with transfers, down from 20 as of January 2016.
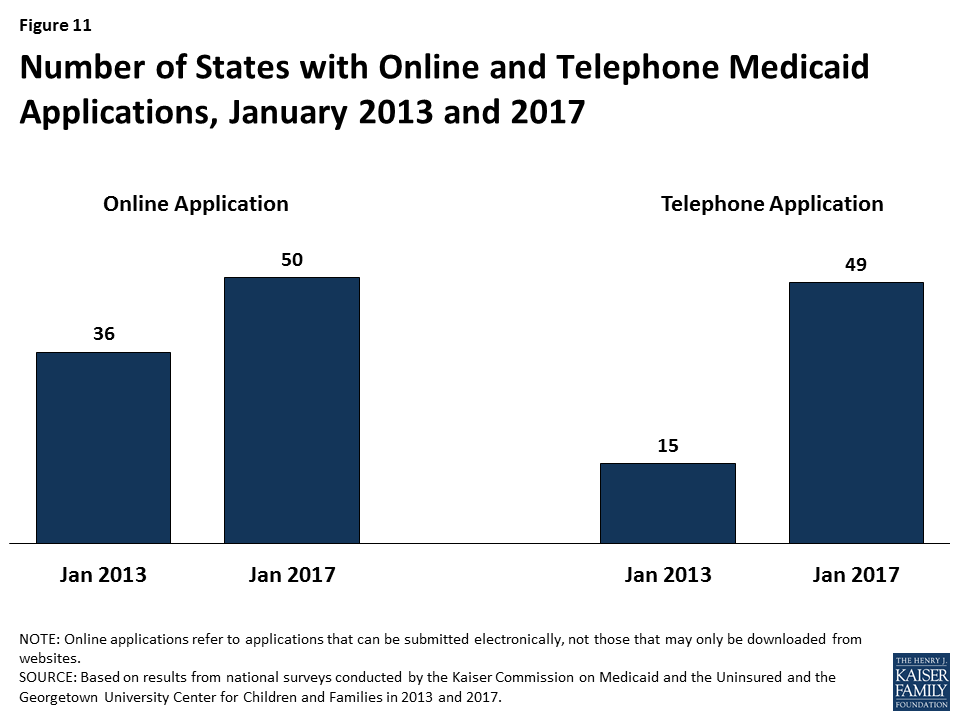
Individuals can apply for Medicaid online and by phone in nearly all states as of January 2017. Under the ACA, states must provide multiple methods for individuals to apply for health coverage, including online, by phone, by mail, and in person. In 2013, prior to ACA implementation, 36 states had an online Medicaid application and individuals could apply for Medicaid by phone in 15 states. As of January 2017, individuals can apply online for Medicaid in all states except Tennessee, and individuals can apply by phone in all states except Tennessee and Minnesota (Figure 11). At least 50% of Medicaid applications are submitted online in 18 of the 45 states that were able to report the share of applications received online.
The features and functions of online applications vary across states (Figure 12). In all 50 states with an online application, applicants can start, stop, and return to finish the application at a later time. Applicants can upload electronic copies of documents with their application, if needed, in 33 states. With the addition of Ohio in 2016, all Medicaid groups, including seniors and people with disabilities, can apply through the online application in 30 states. Individuals can also apply for a non-health program, such as SNAP or TANF, using the online application in half of states. This count includes Kentucky, which launched an online multi-benefit application in 2016.

Just over half of the states (26 states) have a web portal or secure login that enables consumer assisters to submit applications on behalf of consumers they help. Massachusetts and New Jersey added a portal for consumer assisters in 2016. In some states, the assister portals have additional functions or features that support the work of assisters, such as the ability to check a renewal date. These types of tools may help reduce workloads on state administrative staff, for example, if assisters are able to update addresses and other information. This functionality may also allow the state to track, monitor and report the work of assisters.
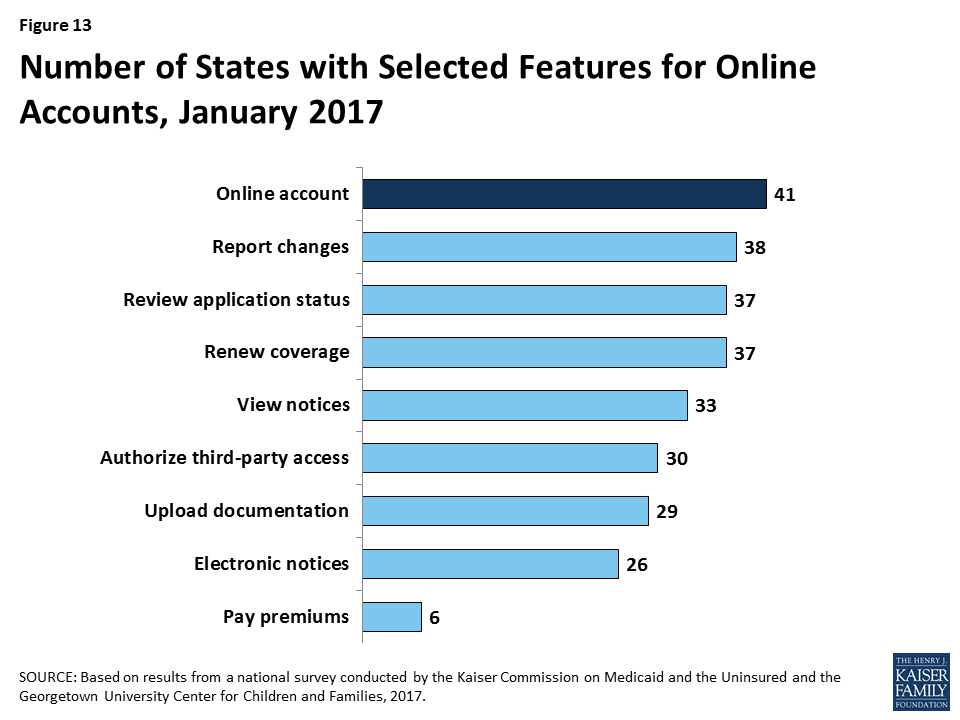
In 41 states, individuals can create an online account to manage their Medicaid coverage after enrollment (Figure 13). Most states provide a wide array of functions through online accounts and states have expanded functionality over time, with several states adding functions to their accounts in 2016. Most of these accounts allow enrollees to report changes, review the status of their application, to renew coverage, and to view notices. Smaller numbers allow enrollees to go paperless and receive electronic notices or to pay premiums. Online accounts create administrative efficiencies by reducing mailing costs, call volume, and manual processing of updates such as an address change. They also provide enrollees increased autonomy to manage and monitor their coverage.
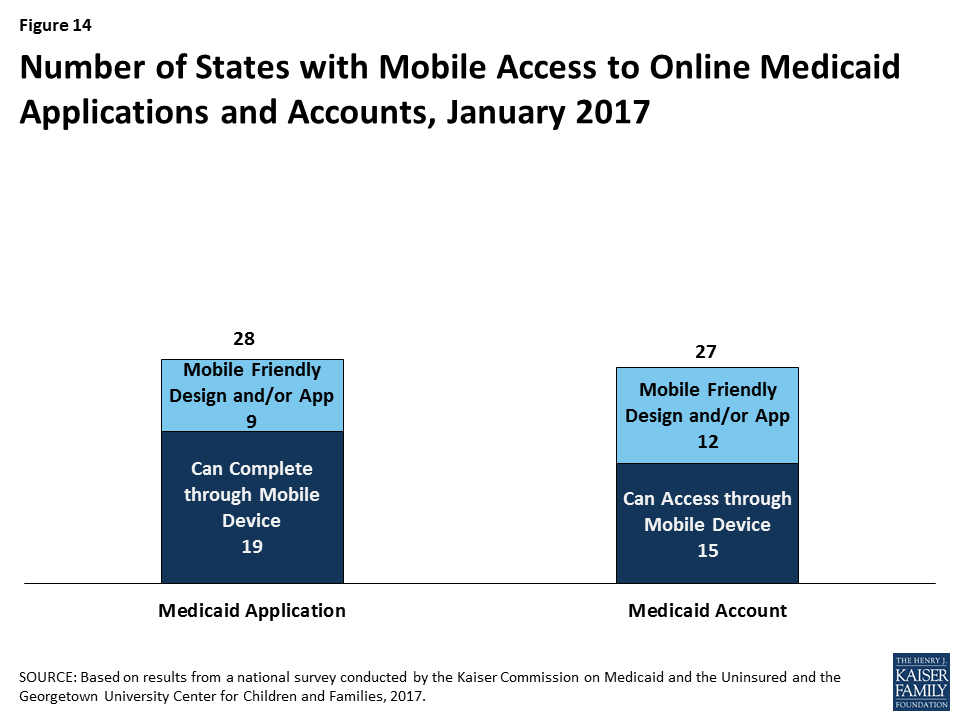
States have begun to make online applications and accounts accessible through mobile devices, such as phones or tablets. As of January 2017, individuals in 28 states can complete and submit the online Medicaid application through a mobile device. Nine of these states have designed a mobile-friendly version of the application and/or developed a mobile “app” for individuals to apply through a mobile device (Figure 14). Similarly, in 27 states, enrollees can access the online Medicaid account through a mobile device. In 12 of these states, there is a mobile-friendly version of the account and/or the state has created an “app” for enrollees to access the account through a mobile device. A number of states indicate that they plan to enhance mobile access to online applications and accounts in 2017 or beyond.
One major shift under the ACA has been for states to rely on data from reliable electronic data sources rather than paper documentation to verify eligibility for Medicaid and CHIP. This change provides for a faster, more efficient eligibility determination process that reduces paperwork requirements for individuals and eases administrative burden on states, although it required significant upfront work by states to establish system connections to other data sources.
All states verify income eligibility, as well as citizenship and qualified immigration status of applicants, as required in Medicaid and CHIP. States must verify citizenship or qualified immigration status in advance of enrollment. Individuals who attest to a qualified status but who cannot have their eligibility confirmed electronically must be given a reasonable amount of time to provide adequate documentation. Nearly all states (44 states) verify income prior to enrollment, while 7 states complete the verification after enrollment. Verification of other eligibility criteria, such as age/date of birth, state residency, and household size vary across states and criteria, reflecting state options to verify this information before or after enrollment or to rely on self-attestation of information. If a state relies on self-attestation, it must verify information if it has any data on file that conflicts with the self-attestation.
All states access income and other information from the Social Security Administration, and many states also use state wage and unemployment data to verify eligibility criteria. As of January 2017, more than two-thirds of states get income and other information through the federal data hub, which was established by the ACA. The data hub enables states to access information from multiple federal agencies, including the Internal Revenue Service, the Social Security Administration (SSA), the Department of Homeland Security (DHS), and a commercial database that provides earnings reported by large employers. States not using the federal hub rely on direct links to SSA and DHS databases that existed before the ACA. In addition, most states utilize state wage and unemployment data for income and other information. Fewer states rely on federal or state tax data.
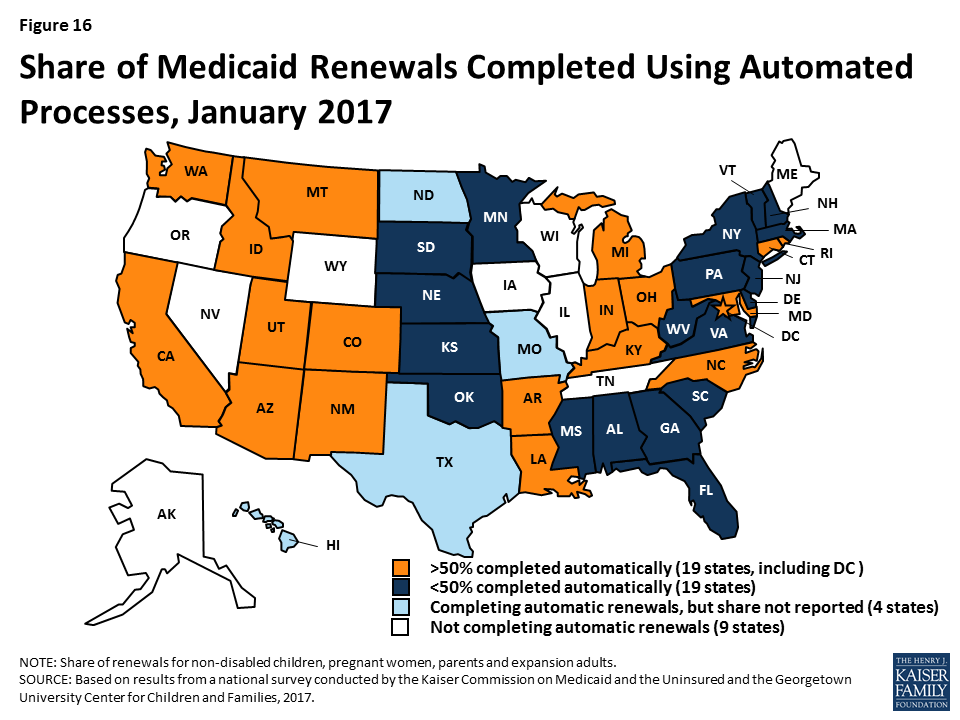
As of January 2017, 42 states were processing automated Medicaid renewals (Figure 15). This count includes five states that newly implemented automated renewal processes during 2016. Similar to data-driven enrollment, under the ACA, states are to use electronic data when available to renew coverage without requiring an individual to fill out a renewal form or provide documentation. This approach minimizes paperwork for individuals and reduces workloads for states. Among the 38 states able to report the share of renewals that are completed through automatic processes, 19 states report that more than 50% of renewals are automated (Figure 16), including 10 states with automatic renewal rates above 75%. In comparison, only 3 states reported that over 75% of renewals were automated as of January 2016.
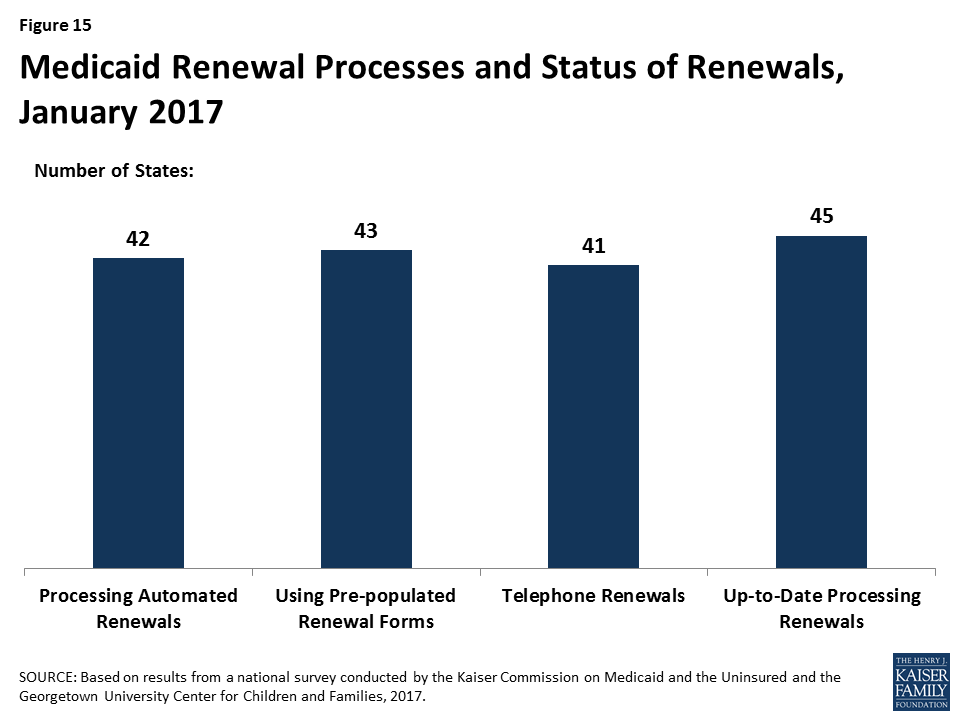
If a renewal cannot be completed based on available data, states are expected to send a pre-populated notice or renewal form to the enrollee and to allow individuals to renew by phone. Between January 2016 and 2017, the number of states able to send pre-populated renewal forms or notices increased from 41 to 43. In 13 states, the forms are populated using updated sources of data from electronic data matches. With the addition of Arkansas and Texas during 2016, individuals can renew Medicaid coverage by phone in 41 states as of January 2017.
Most states are up-to-date on renewals as of January 2017. Six states report ongoing delays in processing renewals, most often citing system challenges or staff capacity as contributing factors.
States can take up additional options to streamline enrollment and renewal beyond the processes standardized by the ACA. Most of these options have been available for many years prior to the ACA, but some were made newly available by the ACA. States’ use of these options may decline over time as states are able to achieve more real-time determinations and automated renewals through their standard processes. However, the options may remain useful for providing access to coverage for individuals who cannot have their eligibility verified in real-time. As of January 2017, states use a range of these options (Figure 17):

States have options to charge premiums and cost sharing in Medicaid up to maximum allowable charges under federal rules that vary by income and group (Box 1).8 These rules establish parameters for premiums and cost sharing given that Medicaid and CHIP enrollees have limited ability to pay out-of-pocket costs due to their modest incomes and a large body of research that shows that premiums and cost sharing can impede access to coverage and care for low-income families.9
Box 1: Medicaid and CHIP Premium and Cost Sharing Rules
Premiums in Medicaid. States may charge premiums for Medicaid enrollees with incomes above 150%, including children and adults. Medicaid enrollees with incomes below 150% FPL may not be charged premiums.
Cost Sharing in Medicaid. States may charge cost sharing in Medicaid, but allowable charges vary by income (see Table 1). Cost sharing cannot be charged for emergency, family planning, pregnancy-related services in Medicaid, preventive services for children, or for preventive services defined as essential health benefits in Alternative Benefit Plans in Medicaid. In addition, children enrolled through mandatory eligibility categories generally cannot be charged cost-sharing. The federal minimum eligibility standard for children is 133% FPL, although some states have higher minimum standards for children.
Limit on Out-of-Pocket Costs. Overall, premium and cost sharing amounts for family members enrolled in Medicaid may not exceed 5% of household income. This 5% cap is applied on a monthly or quarterly basis.
Premiums and Cost Sharing in CHIP. States have somewhat greater flexibility to charge premiums and cost sharing for children covered by CHIP, although there remain limits on the amounts that can be charged, including an overall cap of 5% of household income.
| Table 1: Maximum Allowable Cost Sharing Amounts in Medicaid by Income | |||
| <100% FPL | 100% – 150% FPL | >150% FPL | |
| Outpatient Services | $4 | 10% of state cost | 20% of state cost |
| Non-Emergency use of ER | $8 | $8 | No limit (subject to overall 5% of household income limit) |
| Prescription Drugs | |||
| Preferred | $4 | $4 | $4 |
| Non-Preferred | $8 | $8 | 20% of state cost |
| Inpatient Services | $75 per stay | 10% of state cost | 20% of state cost |
| Notes: Some groups and services are exempt from cost sharing, including children enrolled in Medicaid through mandatory eligibility pathways, emergency services, family planning services, pregnancy related services, and preventive services for children. Maximum allowable amounts are as of FY2014. Beginning October 1, 2015, maximum allowable amounts increase annually by the percentage increase in the medical care component of the Consumer Price Index for All Urban Consumers (CPI-U). | |||
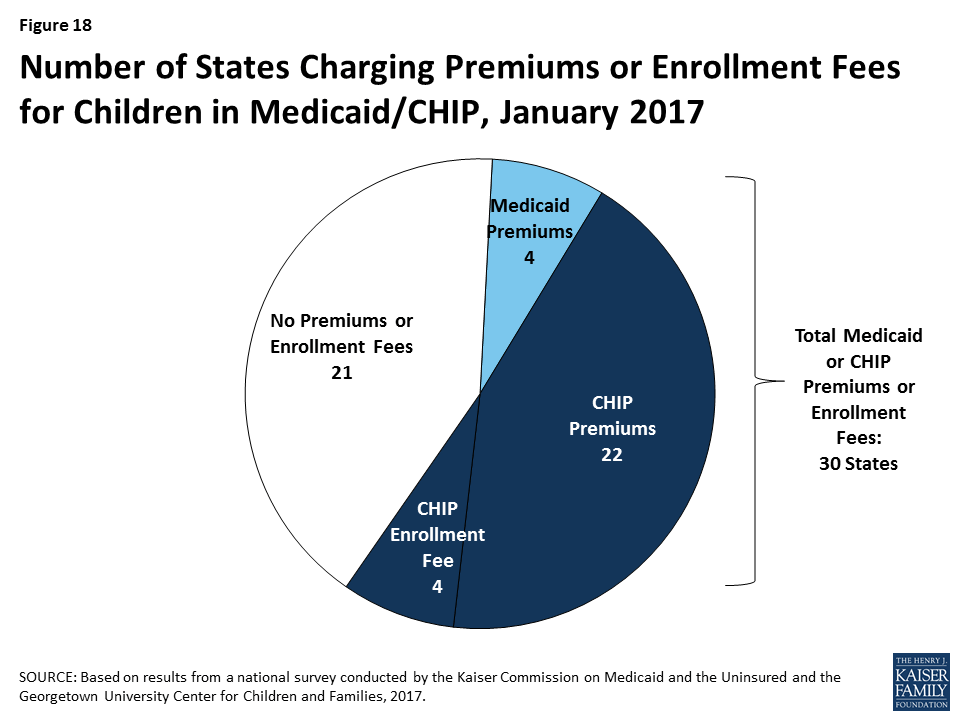
As of January 2017, 30 states charge premiums or enrollment fees for children in Medicaid or CHIP. Overall, 26 states charge monthly or quarterly premiums (4 in Medicaid and 22 in CHIP), and 4 states charge annual enrollment fees for CHIP (Figure 18). A larger number of CHIP programs have premiums and enrollment fees compared to Medicaid because the program covers children with relatively higher incomes and has different premium rules. In 22 of the 30 states charging premiums or enrollment fees, these charges begin for children in families with incomes at 150% FPL or higher, including 8 states that begin premiums at or above 200% FPL. Premium amounts vary across states, and most states scale the amounts by income. As part of the ACA protections for children’s coverage that extend through 2019, states may only increase premiums for cost-of-living adjustments or if the state had a routine premium adjustment approved prior to the enactment of the ACA. During 2016, there were no changes to premiums and enrollment fees for children outside of a routine adjustment.
State policies for non-payment of premiums vary. Among the 26 states charging monthly or quarterly premiums in Medicaid or CHIP, 21 provide a 60-day or longer grace period before cancelling coverage for non-payment. This count includes the 4 states that charge premiums in Medicaid, which must provide a minimum 60-day grace period and cannot require enrollees to repay outstanding premiums as a condition of re-enrollment. It also includes 17 states that charge premiums in separate CHIP programs. In contrast to Medicaid, CHIP programs must provide a minimum 30-day grace period and may impose up to a 90-day “lock-out period,” during which a child is not allowed to re-enroll. Among the 22 states charging monthly or quarterly premiums in CHIP, 4 limit the grace period to the minimum 30 days and 15 have a lock-out period for children disenrolled due to non-payment. Arizona reduced its lock-out period from three to two months when it reopened CHIP enrollment in 2016. Overall, 17 of the 26 states that charge monthly or quarterly premiums in Medicaid or CHIP require families to reapply for coverage before re-enrolling, subject to some exceptions. Consistent with Medicaid rules, the four states that charge premiums in Medicaid provide retroactive coverage. In addition, eight of the states that charge premiums in separate CHIP programs allow for retroactive reinstatement of coverage if outstanding premiums are paid.
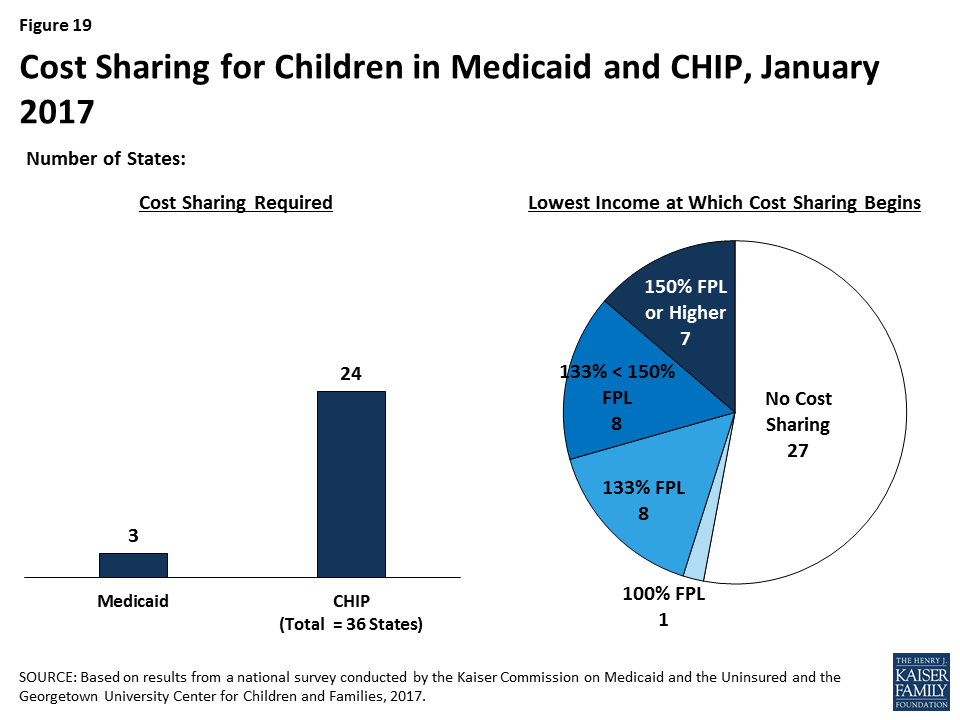
As of January 2017, 3 states charge cost sharing for children in Medicaid, while 24 of the 36 states with separate CHIP programs do so (Figure 19). Consistent with federal rules, cost sharing does not apply to children below 133% FPL in all of these states, except Tennessee, which has a waiver to begin cost sharing at 100% FPL. In 16 states, cost sharing begins between 133% and 150% FPL, while 7 states begin cost sharing at 150% FPL or higher. Cost sharing charges vary by service. For example, for a child with family income at 201% FPL, 20 states charge cost sharing for a physician visit, 12 charge for an emergency room visit, 18 charge for non-emergency use of the emergency room, 15 charge for an inpatient hospital visit, and 19 charge for prescription drugs, although, in some cases, charges only apply to brand name or non-preferred brand name drugs.
Because eligibility levels for parents and other adults are much lower than for children, in most states, these groups are not charged premiums. However, six states (Arizona, Arkansas, Indiana, Iowa, Michigan, and Montana) have received waivers to charge premiums or monthly contributions for adults that are not otherwise allowed under law. Arizona received this waiver approval during 2016. In addition, during 2016, Arkansas received approval to amend its existing waiver, which included changing from monthly income-based contributions to health savings accounts in lieu of point-of-service cost sharing to monthly premiums for individuals with incomes above 100% FPL.
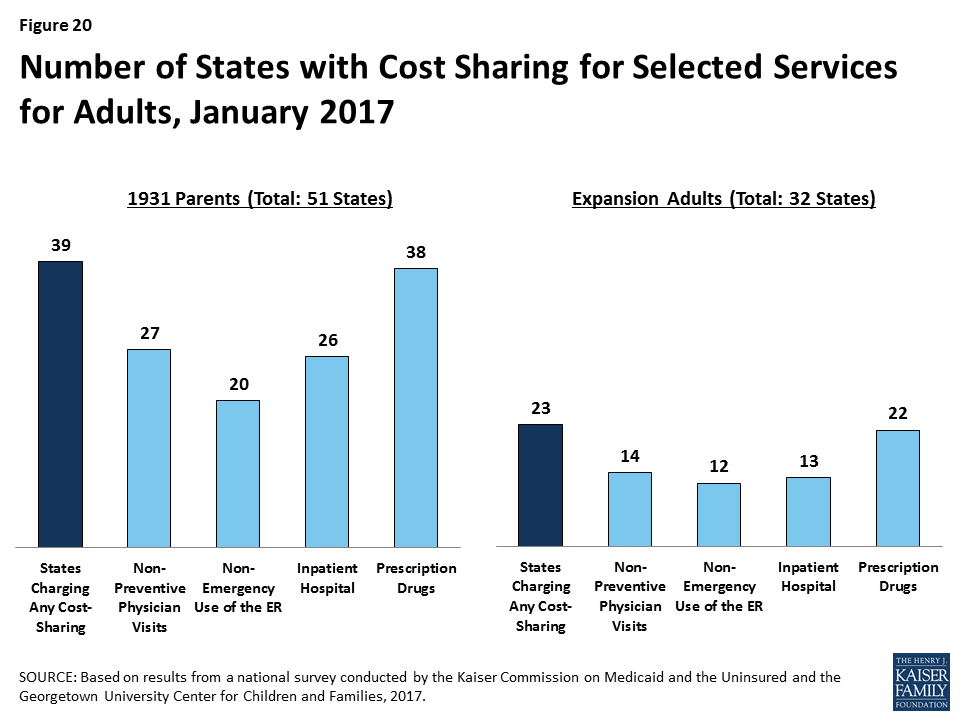
Among adults, 39 states charge parents cost sharing in Medicaid and 23 of the 32 states that have expanded Medicaid charge cost sharing for expansion adults. These counts reflect the elimination of copayments for parents and other adults in Oregon during 2016. Wisconsin, which is the only non-expansion state to cover other adults, also charges cost sharing but is not included the count for expansion adults. In most of the states that charge cost sharing for parents and/or expansion adults, cost sharing is required of all enrollees regardless of income. However, cost sharing amounts for adults are generally nominal, reflecting their low incomes. Cost sharing charges vary by service (Figure 20). Cost sharing for parents and expansion adults remained largely stable during 2016, aside from changes in a few states. Specifically, Oregon eliminated cost sharing for parents and expansion adults, Arizona and Montana increased cost sharing amounts for some services, and Iowa decreased the income at which cost sharing begins for expansion adults.
The findings of this 15th annual report illustrate the central role that Medicaid and CHIP play in covering low-income children and families today. They also show how the ACA expanded Medicaid’s role for low-income adults and led to modernization and streamlining of eligibility systems and enrollment processes. As debate over the future of the ACA, potential broader changes to Medicaid, and CHIP reauthorization unfold, these findings provide a baseline against which future policy changes may be measured. Looking ahead, these findings suggest:
Given the significant role of Medicaid and CHIP across states, changes to these programs could affect coverage for many of the nation’s low-income families. As the findings illustrate, Medicaid and CHIP serve as the base of coverage for low-income children and pregnant women across all states. The findings also show how Medicaid’s role for low-income adults has expanded in the 32 states, including DC, that have implemented the ACA Medicaid expansion. Since the ACA was enacted through October 2016, net Medicaid and CHIP enrollment has grown by over 17 million people, increasing total enrollment to over 74 million enrollees.10 These enrollment gains have helped to reduce the nation’s uninsured rate to a record low of 10% in for the overall population under age 65, and to bring the children’s uninsured rate to 5% as of June 2016.11 As such, changes to Medicaid or CHIP would affect many low-income families. The outcome of debate around reauthorization of CHIP will have particularly important implications children and pregnant women given the key role CHIP plays complementing Medicaid to support their coverage across states. Loss of CHIP funding could put this coverage at risk and would create funding gaps for states. If the Medicaid expansion was eliminated under a repeal of the ACA, many low-income parents and other adults would lose eligibility and potentially become uninsured, depending on what other coverage options may be available. Moreover, broader changes to the financing structure of Medicaid, coupled with reductions in federal Medicaid funding, could affect coverage for all groups of enrollees.
The ACA included changes in Medicaid eligibility, enrollment, and renewal policies and processes in all states, which could potentially be affected by a repeal of the ACA. The ACA established new standards for eligibility, enrollment, and renewal processes that accelerated state efforts to modernize and streamline their systems and processes to utilize electronic data, reduce paperwork requirements for individuals, and increase administrative efficiency for states. For most states, this has been a multi-year effort that has involved significant investments of time, staff, and resources, using available federal funding for system upgrades. State work has involved developing new business procedures; writing new state administrative rules; training staff; and designing and deploying complex eligibility systems. The administrative structure in some states has been transformed through these changes, with increasing efficiencies gained through automation leading to changing needs and roles for eligibility staff. It remains to be seen which of these policies or processes could be affected by a repeal of the ACA. However, reverting back to pre-ACA policies or implementing new policies would likely require major investments of time, staff, and resources. Moreover, changes to the Marketplaces could affect Medicaid eligibility systems and enrollment processes because the systems are interwoven in all states. For example, if SBM enrollment systems were dismantled, those states would need to move Medicaid eligibility decisions to a new system or potentially revert to an old system, if one has been maintained.
States are using available program options to expand access to coverage, further streamline enrollment and renewal processes, and charge premiums and cost sharing in Medicaid and CHIP. Under current program rules, states can choose from a range of options to expand coverage for many groups and further streamline enrollment and renewal processes beyond the new standardized processes included in the ACA. States have taken up many of these options, particularly to expand access to coverage for children and pregnant women. Most states also are using options to charge premiums and cost sharing to some Medicaid and CHIP enrollees. However, in most cases, states largely target premiums and above-nominal cost sharing to enrollees with relatively higher incomes. The program options available to states, states’ responses to these options, and the role of waivers could be affected by a repeal of the ACA or as part of broader efforts to restructure Medicaid.
Table 2: Waiting Period for CHIP Enrollment, January 2017
Table 3: State Adoption of Optional Medicaid and CHIP Coverage for Children, January 2017
Table 7: Coordination between Medicaid and Marketplace Systems, January 2017
Table 10: Features of Online Medicaid Accounts, January 2017
Table 11: Mobile Access to Online Medicaid Applications and Accounts, January 2017
Table 13: Presumptive Eligibility in Medicaid and CHIP, January 2017
Table 14: Express Lane Eligibility and 12-Month Continuous Eligibility for Children, January 2017
Table 15: Premium, Enrollment Fee, and Cost Sharing Requirements for Children, January 2017
Table 16: Premiums and Enrollment Fees for Children at Selected Income Levels, January 2017
Table 17: Disenrollment Policies for Non-Payment of Premiums in Children’s Coverage, January 2017
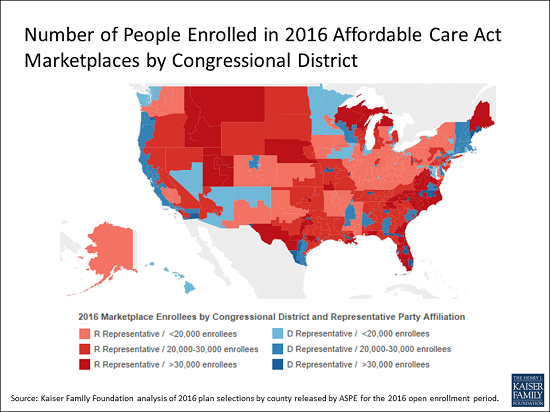
As the 115th U.S. Congress deliberates the future of the Affordable Care Act, a new interactive map from the Kaiser Family Foundation provides estimates of the number of people in each congressional district who enrolled in a 2016 ACA marketplace health plan and the political party of each district’s representative as of January.
The analysis, Interactive Maps: Estimates of Enrollment in ACA Marketplaces and Medicaid Expansion, finds that of 11.5 million ACA marketplace enrollees nationally as of March 31, 2016, 6.3 million live in districts with a Republican representative and 5.2 million live in districts represented by a Democrat.
The analysis also includes maps charting by state the total number of people enrolled under the ACA Medicaid expansion in 2015, along with the political parties of the governors and U.S. senators. Among states that adopted the Medicaid expansion as of January 2017, 16 have Republican governors, 14 have Democratic governors, and one has an Independent governor. In Washington, D.C., which also expanded Medicaid, the mayor is a Democrat.
All three maps can be embedded in web sites.
The Affordable Care Act’s contraceptive coverage provision made access to the full range of contraceptive methods available to millions of women with private insurance at no cost. Despite broad public support, this provision has been challenged by religious employers, with two cases reaching the Supreme Court.
It is unclear how or whether the new Trump administration and 115th Congress will address the contraceptive coverage requirement, either through administrative action or through efforts to repeal the ACA. If the requirement is modified or eliminated, no cost contraceptive coverage for millions of women is at stake, and the scope of a woman’s contraceptive coverage would again depend on her insurance plan and where she lives and works.
A new brief from the Kaiser Family Foundation explains the ACA’s contraceptive coverage rule, the impact it has had on women, and the potential state of coverage if the rule is modified or eliminated.
Contraceptive coverage under the Affordable Care Act (ACA) has made access to the full range of contraceptive methods affordable to millions of women. This provision is part of a set of services that has been identified by the Health Resources and Services Administration (HRSA) as key preventive services for women that are not addressed by the US Preventive Services Task Force or the CDC’s Advisory Committee on Immunization Practices, entities that identified preventive services that must be covered without cost-sharing under the ACA. On December 20, 2016, HRSA issued updated coverage requirements, accepting in whole the recommendations of the Women’s Preventive Services Committee, which is comprised of representatives of national groups with expertise in women’s health. These updated recommendations continue to include contraceptive coverage.
Since it was first issued in 2012, this provision has been controversial. While very popular with the public, with over 77% of women and 64% of men reporting support for no-cost contraceptive coverage (Figure 1), it has been the focus of litigation brought by religious employers, with 2 cases reaching the Supreme Court. As the Trump administration transitions to the White House, it remains to be seen specifically how or whether the new Administration and 115th Congress will address this particular provision. This brief explains the current contraceptive coverage rule, the impact it has had on coverage, and the potential state of coverage if the ACA rule is eliminated either through a full ACA repeal or administrative action.

Starting in 2012, all new private plans were required to cover, without cost-sharing, the full range of contraceptives approved by the Food and Drug Administration (FDA) as prescribed for women, counseling and services.1 This provision applies to all non-grandfathered individual, small and large group, and self-funded plans. Grandfathered plans do not have to comply with this requirement or the other insurance reforms in the ACA.
The Department of Health and Human Services (HHS) issued guidance in May 2015, which clarified that at least one form of all 18 FDA-approved methods of birth control must be covered without cost-sharing (Table 1). If a provider recommends a specific option or product, plans must cover it without cost-sharing as well. Insurers may use reasonable medical management, however, to limit coverage to brand-name drugs when a generic version exists, and can impose cost-sharing for equivalent branded drugs. Plans are required to have a “waiver” process for women who have a medical need for contraceptives otherwise subject to cost-sharing or not covered.2 In addition, plans must cover services such as contraceptive counseling, initiation of contraceptive use, and follow-up care, including management and evaluation, as well as changes to and removal or discontinuation of contraceptive methods.
| Table 1 : Minimum Contraceptive Coverage Requirements Clarified by HHS Guidance | |
| Contraceptive Method | Products/Options |
| Surgical sterilization | Also called tubal ligation |
| Implant sterilization | Only Essure available |
| Implantable Rod | Multiple |
| IUD – Copper | Only ParaGard available |
| IUD – Progestin | Multiple |
| Injection | Multiple |
| Oral contraceptives – combined | Multiple |
| Oral Contraceptives – progestin only | Multiple |
| Oral Contraceptives – extended/continuous use | Multiple |
| Patch | Multiple |
| Vaginal Ring | Only NuvaRing available |
| Diaphragm with Spermicide | Only Milex Omniflex available |
| Sponge with Spermicide | Only Today Sponge available |
| Cervical Cap with Spermicide | Only FemCap available |
| Female Condom | Multiple |
| Spermicide alone | Multiple |
| Emergency Contraception-Progestin | Multiple |
| Emergency Contraception- Ulipristal Acetate | Only ella available |
| SOURCES: FDA, Birth Control Guide and Departments of Labor, Health and Human Services, and Treasury, FAQs about Affordable Care Act Implementation (Part XXVI). | |
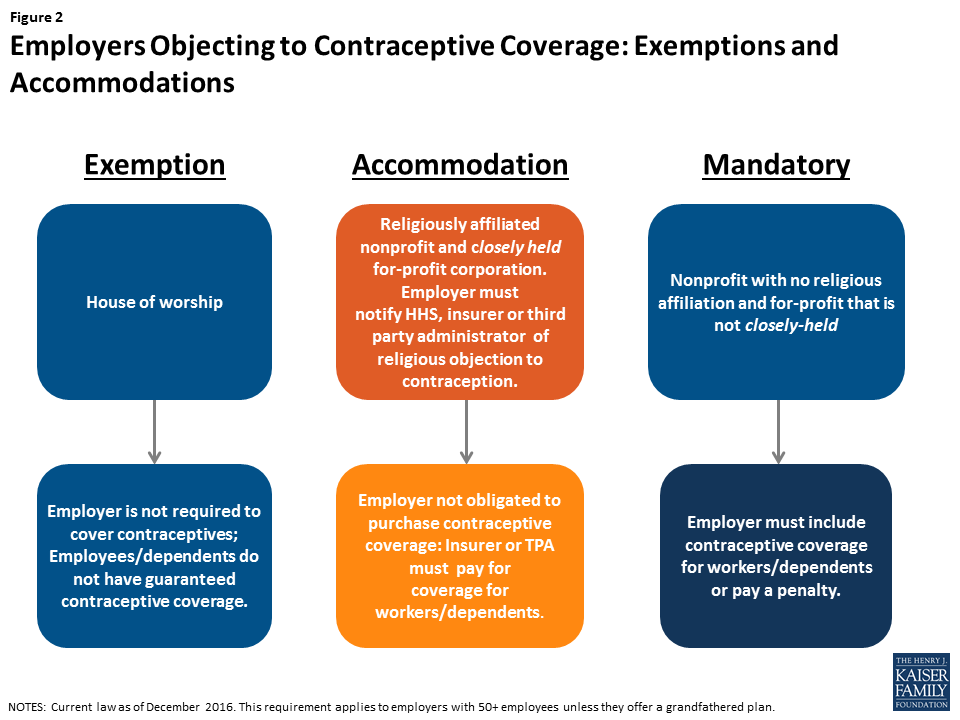
As the contraceptive coverage rules have evolved through litigation and new regulations, there are three categories of employers with differing requirements. Most employers are required to include the coverage in their plans. Houses of worship can choose to be exempt from the requirement if they have religious objections (Figure 2). This exception means that workers and dependents of exempt employers do not have coverage for either some or all FDA approved contraceptive methods, if their employer has an objection. Religiously affiliated nonprofits and closely held for-profit corporations are not eligible for an exemption, but may receive an accommodation. The Obama Administration originally crafted the accommodation to address the concerns of religiously-affiliated nonprofit employers, and then extended this same option to closely held for-profits after the Supreme Court ruling in Burwell v. Hobby Lobby. The accommodation allows these employers to opt out of providing and paying for contraceptive coverage in their plans by either notifying their insurer, third party administrator, or the federal government of their objection. The insurers then are responsible for covering the costs of contraception, which assures that their workers and dependents have contraceptive coverage, and relieves the employers of the requirement to pay for it.
While 10% of nonprofits with 5,000 or more employees have elected for an accommodation without challenging the requirement, this approach, however, has not been acceptable to all nonprofits with religious objections.3 Some are seeking an “exemption” from the rule, meaning their workers would not have coverage for some or all contraceptives, rather than an accommodation, which entitles their workers to full contraceptive coverage but releases the employer from paying for it. In May 2016, the Supreme Court remanded Zubik v. Burwell, sending 7 cases brought by religious nonprofits objecting to the contraceptive coverage accommodation back to the respective Courts of Appeal. The Court instructed the parties to work together to “arrive at an approach going forward that accommodates petitioners’ religious exercise while at the same time ensuring that women covered by petitioners’ health plans receive full and equal health coverage, including contraceptive coverage.”4 In July 2016, the Departments of Health and Human Services (HHS), Labor and Treasury issued a Request for Information (RFI) inviting public comments on “whether there are alternative ways (other than those offered in current regulations) for eligible organizations that object to providing coverage for contraceptive services on religious grounds to obtain an accommodation, while still ensuring that women enrolled in the organization’s health plans have access to seamless coverage of the full range of Food and Drug Administration-approved contraceptives without cost sharing.” The Obama Administration asked the courts to delay any action on the cases while they review the over 50,000 comments submitted. The next case status reports with the courts are due after the transition to the Trump Administration. It is not clear whether the Trump Administration will continue to defend these lawsuits, maintain the current regulations, or change the rules for employers with objections to contraceptive coverage. The Trump campaign supported expanding the exemption for nonprofits with religious objections, and incoming Secretary of Health and Human Services, Tom Price, stated in 2012, that he felt the contraceptive coverage requirement infringes on religious liberties.5 6
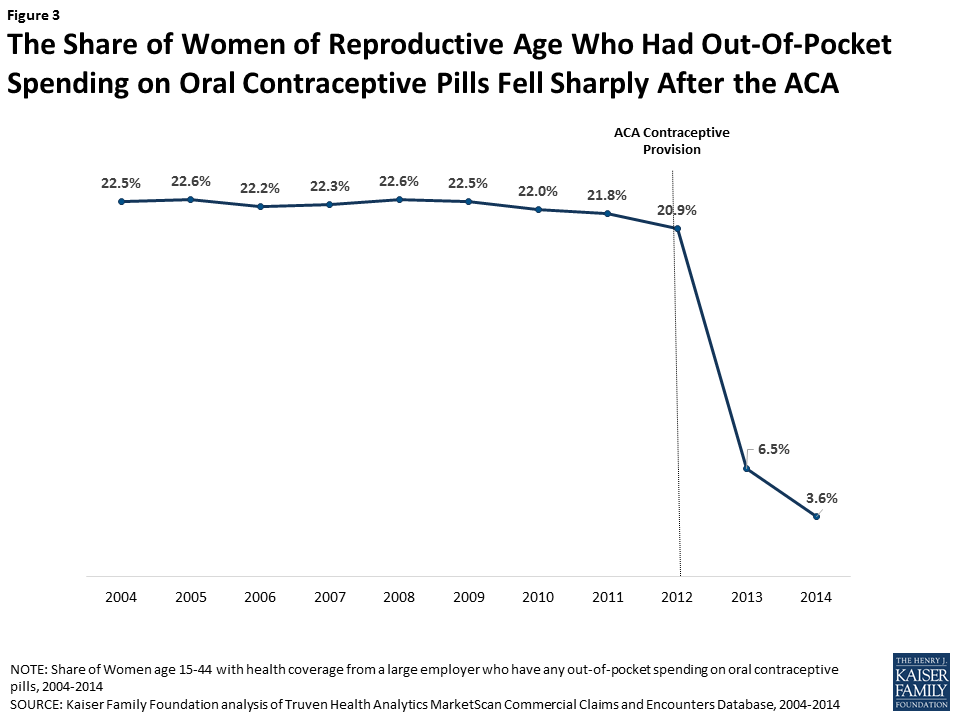
Contraceptive use among women is widespread, with over 99% of sexually-active women using at least one method at some point during their lifetime.7 Contraceptives make up an estimated 30-44% of out-of-pocket health care spending for women.8 Since the implementation of the ACA, out-of-pocket spending on prescription drugs has decreased dramatically (Figure 3). The majority of this decline (63%) can be attributed to the drop in out-of-pocket expenses on the oral contraceptive pill for women.9 One study estimates that roughly $1.4 billion dollars per year in out-of-pocket savings on the pill resulted from the ACA’s contraceptive mandate.10 By 2013, most women had no out-of-pocket costs for their contraception, as median expenses for most contraceptive methods, including the IUD and the pill, dropped to zero.11
This provision has also influenced the decisions women make in their choice of method. After implementation of the ACA contraceptive coverage requirement, women were more likely to choose any method of prescription contraceptive, with a shift towards more effective long-term methods.12 High upfront costs of long-acting methods, such as the IUD and implant, had been a barrier to women who might otherwise prefer these more effective methods. When faced with no cost-sharing, women choose these methods more often13 , with significant implications for the rate of unintended pregnancy and associated costs of childbirth.14
Finally, decreases in cost-sharing were associated with better adherence and more consistent use of the pill. This was especially true among users of generic pills. One study showed that even copayments as low as $6 were associated with higher levels of discontinuation and non-adherence,15 increasing the risk of unintended pregnancy.
More than half of women in the United States are insured through an employer-sponsored plan, either as the primary beneficiary or as a spouse or dependent. In 2000, a ruling by the Employment Equal Opportunity Commission (EEOC) found that employers that covered preventive prescription drugs and services, but did not cover prescription contraceptives, were in violation of the Civil Rights Act.16 The EEOC reasoned that failure to cover contraception constituted sex discrimination under Title VII and the Pregnancy Discrimination Act, which prohibits discrimination against women based on their ability to get pregnant. This ruling, however, did not address the issue of cost-sharing, nor the scope of coverage.
Prior to the passage of the ACA and the contraceptive coverage requirement, the 2010 Kaiser/HRET survey of employers found that 85% of large firms covered prescription contraceptives in their largest health plans17 , although they may have used cost-sharing and were not required to cover the full scope of contraceptive care, the amount of which can vary greatly by employer and type of plan. If the ACA contraceptive coverage rule is modified or eliminated, any requirement for the coverage of contraceptives without cost-sharing will fall back to the states. State laws, however, only apply to state regulated plans, not self-funded plans where 61% of covered workers are insured.18 In self-funded plans, the employer assumes the risk of providing covered services and usually contracts with a third party administrator (TPA) to manage the claims payment process. These plans are overseen by the Federal Department of Labor under the Employer Retirement Income Security Act (ERISA).
States have historically regulated insurance, and many have mandated minimum benefits for decades. Contraceptive coverage is no exception. Currently, 28 states require insurance plans to cover contraceptives, with a wide range of coverage and cost-sharing requirements, and exemptions among these mandates.19
Since the passage of the ACA, four states have strengthened and expanded the federal contraceptive coverage requirement. In 2014 California passed the Contraceptive Coverage Equity Act of 2014, which requires private and Medicaid managed care plans to cover all prescribed FDA-approved contraceptives for women without cost-sharing. Maryland enacted a very similar law in 2016, and it will go into effect in January 2018. Vermont also passed a similar law (effective January 2017) that applies to all health insurance plans, as well as coverage offered through Medicaid and all other public programs offered by the State. Illinois’s law, (effective January 2017) requires plans to cover all contraceptive methods, including all over-the-counter methods except male condoms, without cost-sharing.
While contraceptive coverage without cost-sharing will remain intact for fully insured plans in these 4 states, regardless of what happens with the ACA rule, state laws do not have jurisdiction over self-funded plans, under which many women are insured.
For the first time, the ACA set federal preventive services rules, including no-cost contraceptive coverage, for all insurance plans. If the Trump Administration modifies or eliminates the ACA contraceptive coverage rule, scope of coverage will depend on where a woman lives, where she works, and her insurance plan. Millions of women could lose no-cost coverage for the full range of contraceptive methods. Insurance companies and employers will be the ones to make choices about coverage and cost-sharing. For some women, their choices will be limited, and some of the most effective and costly methods will be out of financial reach.
The latest Kaiser Health Tracking Poll finds health care among the top issues Americans want President-elect Donald Trump and the next Congress to address in 2017. When asked which issue they would most like the next administration to act on in 2017, one-fourth of the public mention the economy and jobs (24 percent), followed by immigration (20 percent), and health care (19 percent). Among Democrats and independents, the economy and jobs is the top issue (23 percent and 24 percent, respectively) while the top issues for Republicans are immigration (30 percent) and economy and jobs (29 percent). Among all partisans, health care ranks among the top three issues that the public wants the next administration to act on in 2017.
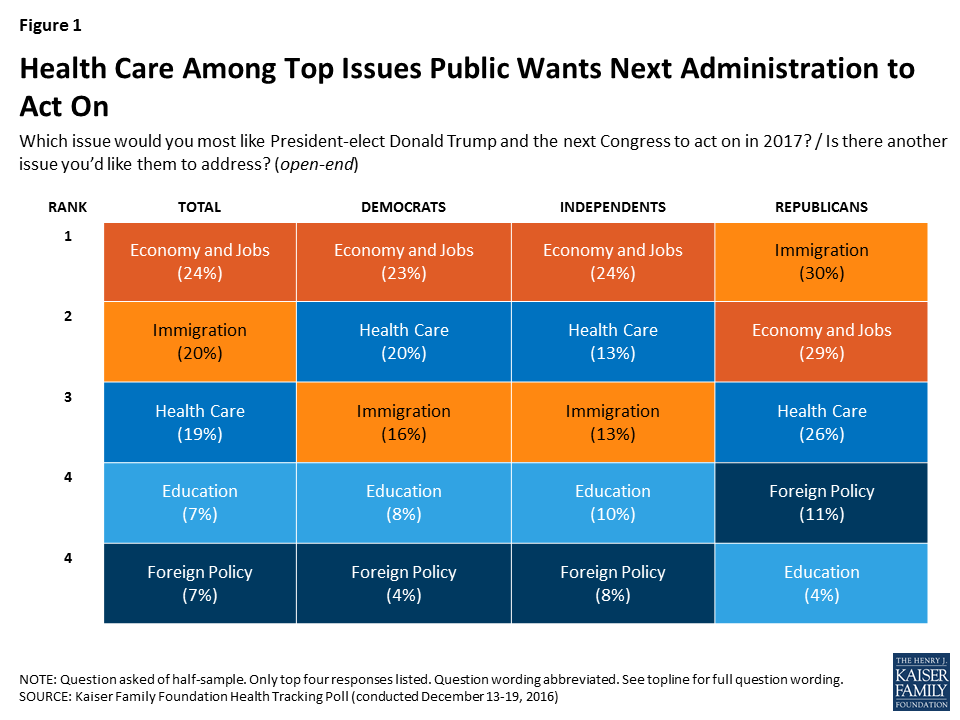
The top issue for voters who supported President-elect Donald Trump are similar to those among Republicans: economy and jobs (31 percent) and immigration (31 percent), followed closely by health care (27 percent).
When asked to mention which health care issue they would most like President-elect Trump and the next Congress to act on in 2017, about one-third of the public mention the Affordable Care Act (ACA) but attitudes are mixed between wanting the next administration to act on repealing the 2010 health care law (14 percent), improving/fixing the law (11 percent), or keeping/expanding the law (8 percent).
When asked about a series of health care priorities for President-elect Trump and the next Congress to act on, repealing the ACA falls behind other health care priorities. Two-thirds of the public (67 percent) say lowering the amount individuals pay for health care should be a “top priority” for President-elect Trump and the next Congress. This is followed by six in ten (61 percent) who say lowering the cost of prescription drugs should be a “top priority,” and nearly half (45 percent) who say dealing with the prescription pain killer addiction epidemic should be a “top priority.”
Smaller shares say repealing the 2010 health care law (37 percent), decreasing how much the federal government spends on health care over time (35 percent), and decreasing the role of the federal government in health care (35 percent) should be top priorities.
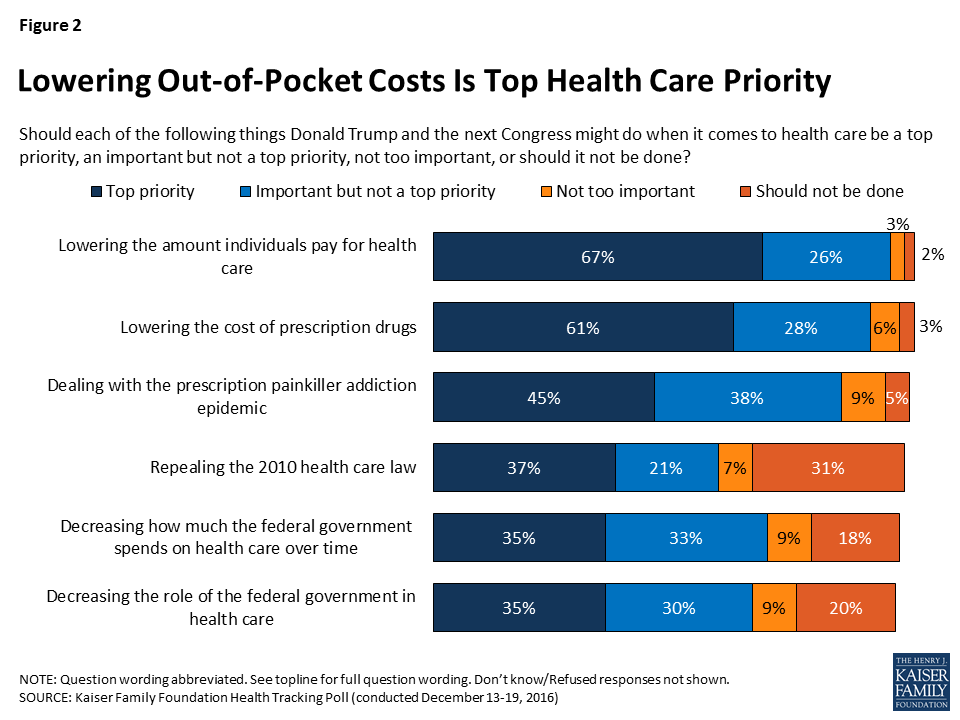
While about two-thirds of Democrats, Republicans, and independents say lowering the amount individuals pay for health care should be a “top priority,” partisans differ in how they prioritize other health care issues. Most notably, while 63 percent of Republicans say repealing the 2010 health care law should be a top priority – this view is shared by much smaller shares of independents (32 percent) and Democrats (21 percent). Similarly, Republicans (50 percent) are more likely than independents (34 percent) or Democrats (26 percent) to place a top priority on decreasing the role of the federal government in health care. By contrast, Democrats and independents are somewhat more likely than Republicans to place a top priority on lowering the cost of prescription drugs (67 percent, 61 percent, and 55 percent, respectively) and on dealing with the epidemic of prescription painkiller addiction (51 percent, 46 percent, and 39 percent, respectively).

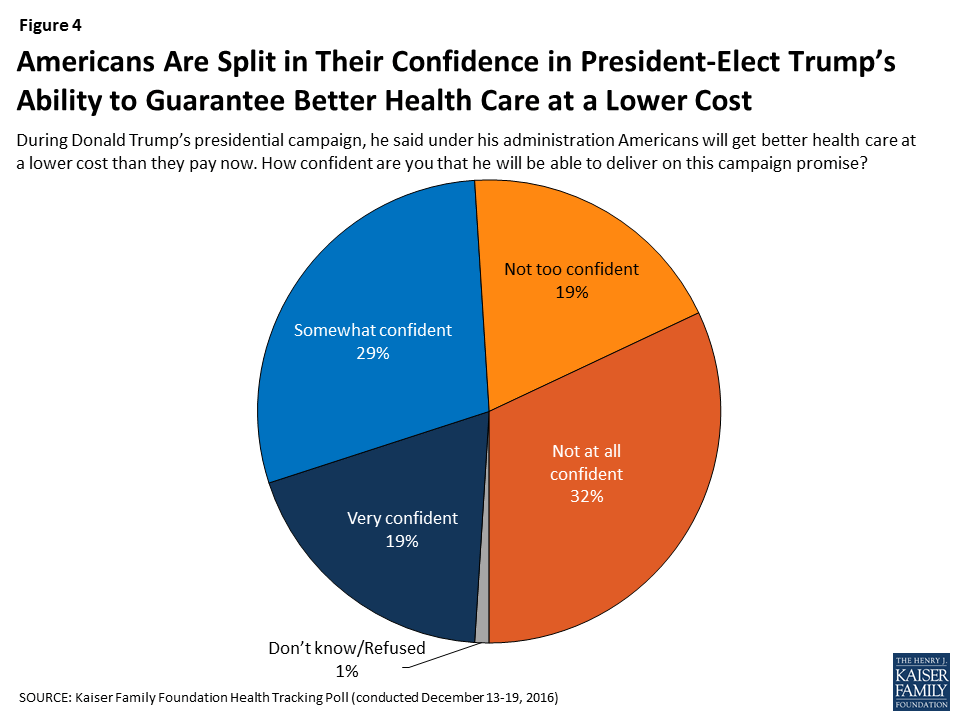
Lowering out-of-pocket health care costs is a top priority for Americans, and this was also a campaign promise from Donald Trump during his 2016 presidential campaign. When asked how confident they are in President-elect Trump’s ability to deliver on this campaign promise that Americans will get better health care at a lower cost than they pay now, Americans are split with similar shares saying they are either “not too confident” or “not at all confident” (51 percent) as saying they are “very confident” or “somewhat confident” (47 percent).
Confidence in President-elect Trump’s promise that Americans will get better health care at a lower cost is largely divided by party identification and 2016 vote choice with nearly nine in ten Republicans (85 percent) and Trump voters (86 percent) saying they are either “very” or “somewhat” confident in the next administration’s ability to deliver on this campaign promise. This is compared to 81 percent of Democrats and 86 percent of Clinton voters who say they are either “not too confident” or “not at all confident” that the next president will deliver on this promise.
Throughout the 2016 presidential election, it became clear that the two major political parties in the U.S. have competing views on the future of health care. When given two competing approaches to the future of health care, six in ten Americans (62 percent) prefer “guaranteeing a certain level of health coverage and financial help for seniors and lower-income Americans, even if it means more federal health spending and a larger role for the federal government” while about one-third (31 percent) prefer “limiting federal health spending, decreasing the federal government’s role, and giving state governments and individuals more control over health insurance, even if this means some seniors and lower-income Americans would get less financial help than they do today.”
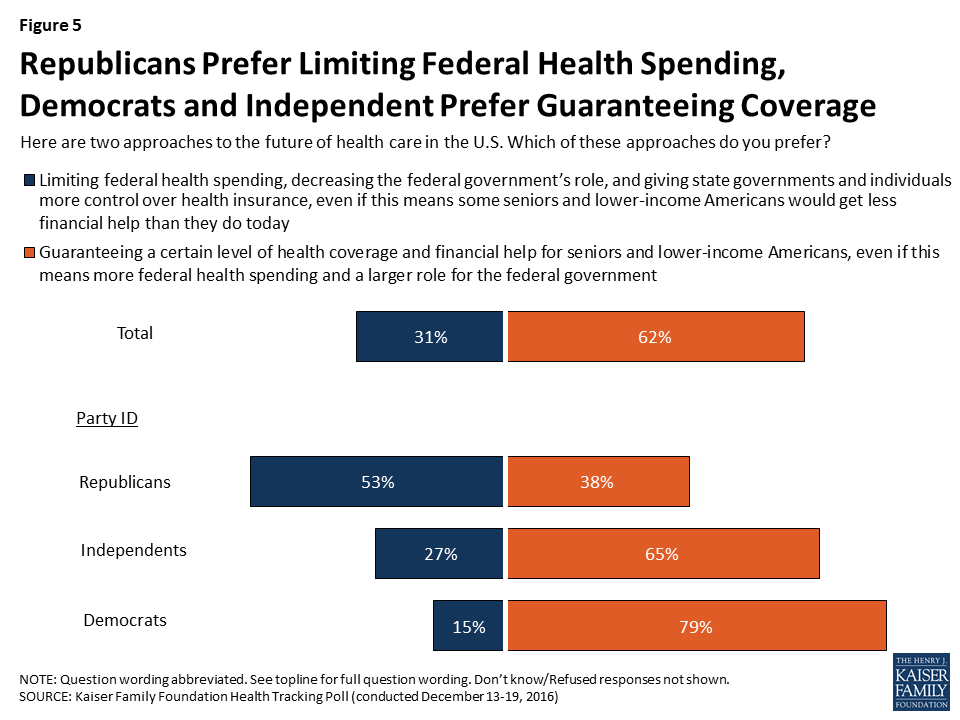
There are also partisan differences, with about half of Republicans (53 percent) preferring the approach that Republican leaders have coalesced around – limiting federal health spending, decreasing the federal government’s role, and giving states and individuals more control; this approach is preferred by much smaller shares of independents (27 percent) and Democrats (15 percent). The majority of Democrats (79 percent) and independents (65 percent) prefer guaranteeing a certain level of coverage for seniors and lower-income Americans – even if it means a larger role for the federal government and increased federal spending.
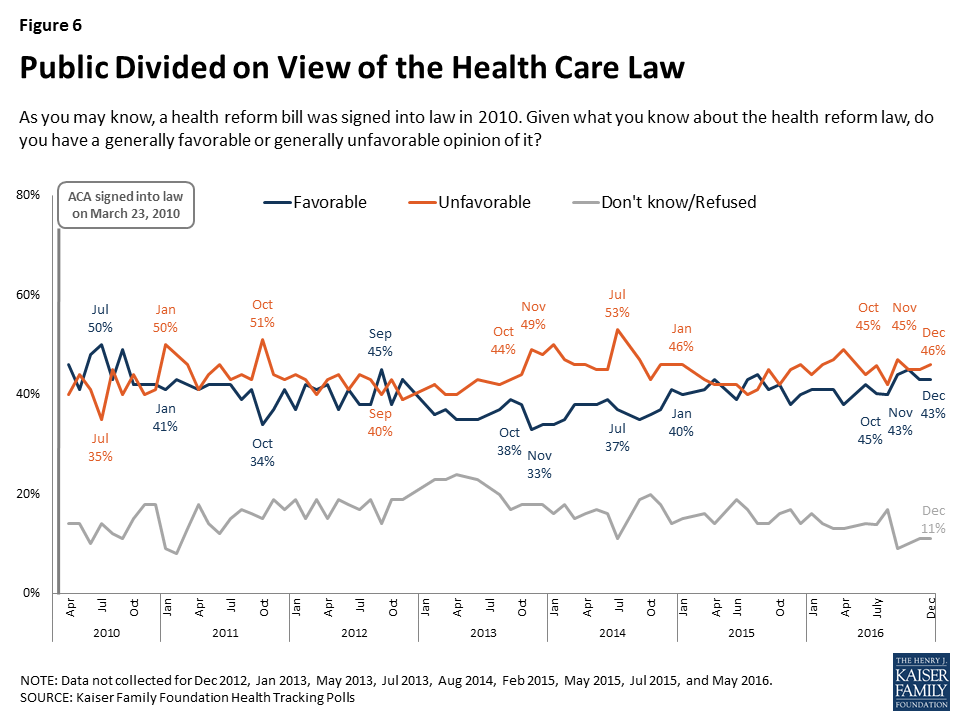
The future of the Affordable Care Act has been at the forefront of the political agenda since the 2016 election with President-elect Trump and Republican lawmakers in Congress saying they will quickly move to repeal the health care law in 2017. The latest survey finds public opinion towards the law is divided with similar shares of the public saying they have an unfavorable opinion (46 percent) as say they have a favorable opinion (43 percent) of the law, which is largely stable from previous months.
As Congressional lawmakers make plans for the future of the ACA, the latest Kaiser Health Tracking survey finds that – similar to overall attitudes towards the law – the public is also divided on what they would like lawmakers to do when it comes to the 2010 health care law.
Overall, 49 percent of the public think the next Congress should vote to repeal the law and 47 percent say they should not vote to repeal it. Of those who want to see Congress vote to repeal the law, a larger share say they want lawmakers to wait to vote on repeal until the details of a replacement plan have been announced (28 percent) than say Congress should vote to repeal the law immediately and work out the details of a replacement plan later (20 percent).

The survey examines the malleability of attitudes towards Congress repealing the health care law and finds that both supporters and opponents of Congress voting to repeal the law can be persuaded after hearing counter-messages. After hearing pro-repeal arguments, the share of the public supporting repeal can grow to as large as 60 percent, while counter-messages against repeal can decrease support to 27 percent.
Among those who originally said Congress should not vote to repeal the 2010 health care law, about one-fifth (22 percent) change their opinion after hearing that some consumers around the country have seen large increases in the cost of their health insurance – which is similar to the share who shifted their opinion after hearing that the country cannot afford the cost of providing financial help to individuals to purchase health insurance.
On the other side of the debate, some of those who originally said they support Congress voting to repeal the health care law are also persuaded by hearing arguments often made by opponents of the repeal efforts. The survey finds that a share shifts their opinion after hearing that some people with pre-existing conditions would no longer be able to get health coverage and after hearing that some of the roughly 20 million Americans who got health insurance as a result of the law would lose their coverage.

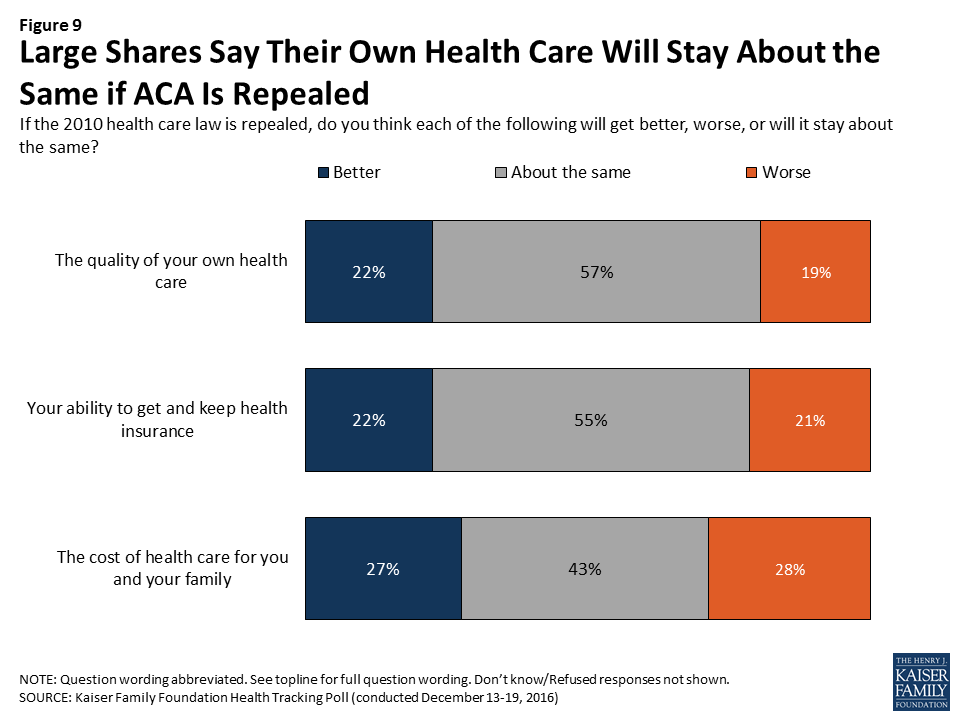
Overall, large shares of Americans say their own health care will “stay about the same” if lawmakers vote to repeal the 2010 health care law. More than half of Americans say the quality of their own health care (57 percent) and their own ability to get and keep health insurance (55 percent) will stay about the same if the law is repealed. Fewer (43 percent) say the cost of health care for them and their family will stay about the same if the law is repealed. In each of these cases, about equal shares believe their own situation will get better as say it will get worse.
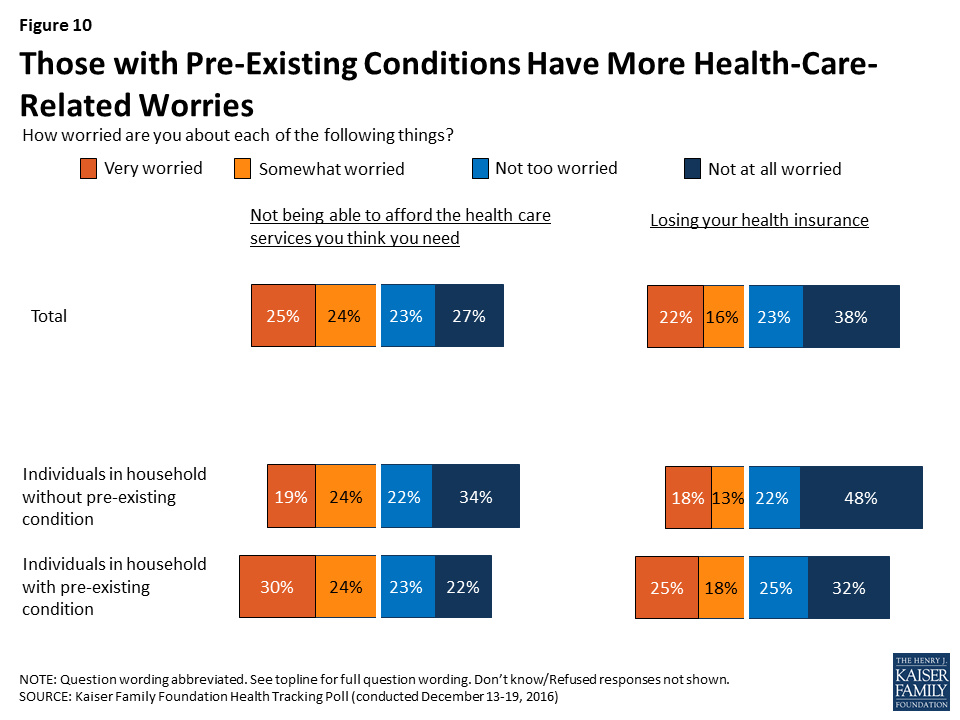
After being read a definition of “pre-existing condition,” just over half (56 percent) of U.S. adults say that they or someone in their household would be considered to have such a condition. Overall, these individuals are more likely than those without a pre-existing condition to say their access, quality, and cost of health care will get “worse” if the ACA is repealed. However, about one in five of these individuals say their access, quality, and cost of health care will get “better” if the ACA is repealed.
One-third of individuals who have someone in their household with a pre-existing condition say the cost of health care for them and their family will get worse if the ACA is repealed, compared to about one in five of those living in a household without someone with a pre-existing condition. Larger shares of those with a pre-existing condition also say their ability to get and keep health insurance will get worse than those without a pre-existing condition (24 percent vs. 17 percent), and the quality of their own health care will get worse (21 percent vs. 15 percent).
| Table 1: Those with Pre-existing Conditions More Likely to Say Repeal of the ACA Will Make Own Ability to Access Affordable and Quality Health Care Worse | |||
| Percent who say the following will get worse if the 2010 health care law is repealed: | Total | Households withPre-existing Condition | Households withoutPre-existing Condition |
| The cost of health care for you and your family | 28% | 33% | 22% |
| Your ability to get and keep health insurance | 21 | 24 | 17 |
| The quality of your own health care | 19 | 21 | 15 |
In addition, individuals with a pre-existing condition in their household also report being more worried about health-care related issues than those without a pre-existing condition. Slightly more than half (54 percent) of those with a pre-existing condition say they are either “very worried” or “somewhat worried” about not being able to afford the health care services they need, compared to 43 percent of those without a pre-existing condition. Similarly, 43 percent of those with a pre-existing condition are worried (either “very” or “somewhat”) about losing their health insurance compared to 30 percent of those without a pre-existing condition.
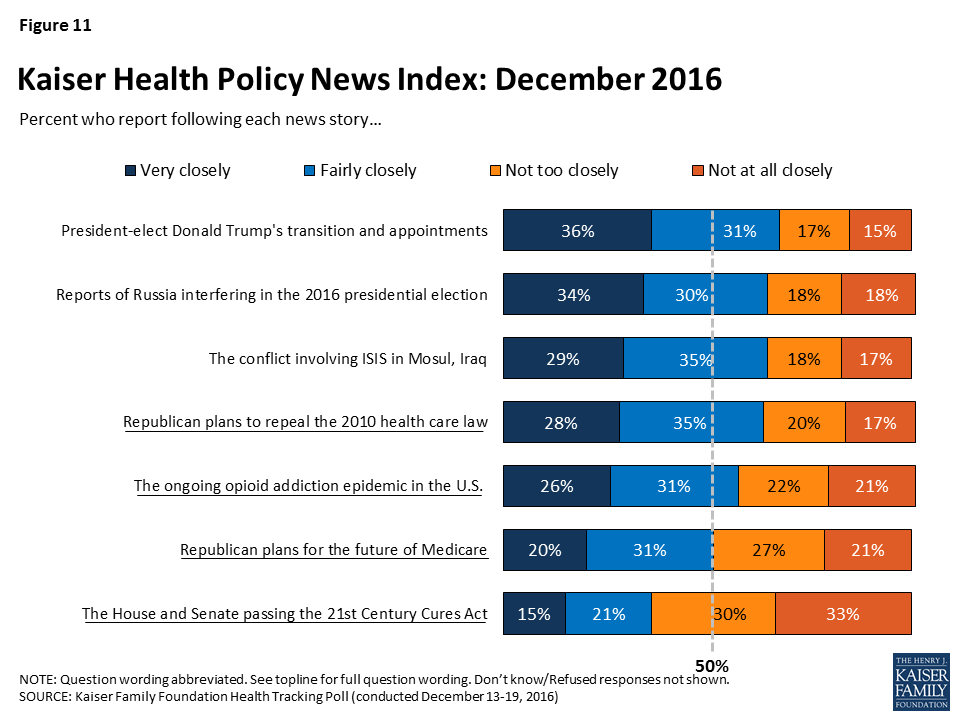
The latest Kaiser Health Tracking Poll finds President-elect Donald Trump’s transition and cabinet appointments was the most closely followed news story during the past month with seven in ten (68 percent) Americans closely following news about his transition. Other stories that captured the attention of Americans include the conflict involving ISIS in Mosul, Iraq (64 percent), the CIA’s report of Russia interfering in the 2016 presidential election (64 percent), and the top health policy story this month – Republican plans to repeal the ACA (63 percent). Other health policy stories followed by Americans this month include the ongoing heroin and prescription painkiller addiction epidemic in the U.S. (57 percent), Republican plans for the future of Medicare (51 percent), and the passing of the 21st Century Cures Act (37 percent).
This Kaiser Health Tracking Poll was designed and analyzed by public opinion researchers at the Kaiser Family Foundation (KFF). The survey was conducted December 13-19, 2016, among a nationally representative random digit dial telephone sample of 1,204 adults ages 18 and older, living in the United States, including Alaska and Hawaii (note: persons without a telephone could not be included in the random selection process). Computer-assisted telephone interviews conducted by landline (421) and cell phone (783, including 486 who had no landline telephone) were carried out in English and Spanish by Princeton Data Source under the direction of Princeton Survey Research Associates International (PSRAI). Both the random digit dial landline and cell phone samples were provided by Survey Sampling International, LLC. For the landline sample, respondents were selected by asking for the youngest adult male or female currently at home based on a random rotation. If no one of that gender was available, interviewers asked to speak with the youngest adult of the opposite gender. For the cell phone sample, interviews were conducted with the adult who answered the phone. KFF paid for all costs associated with the survey.
The combined landline and cell phone sample was weighted to balance the sample demographics to match estimates for the national population using data from the Census Bureau’s 2014 American Community Survey (ACS) on sex, age, education, race, Hispanic origin, and region along with data from the 2010 Census on population density. The sample was also weighted to match current patterns of telephone use using data from the July-December 2015 National Health Interview Survey. The weight takes into account the fact that respondents with both a landline and cell phone have a higher probability of selection in the combined sample and also adjusts for the household size for the landline sample. All statistical tests of significance account for the effect of weighting.
The margin of sampling error including the design effect for the full sample is plus or minus 3 percentage points. Numbers of respondents and margins of sampling error for key subgroups are shown in the table below. For results based on other subgroups, the margin of sampling error may be higher. Sample sizes and margins of sampling error for other subgroups are available by request. Note that sampling error is only one of many potential sources of error in this or any other public opinion poll. Kaiser Family Foundation public opinion and survey research is a charter member of the Transparency Initiative of the American Association for Public Opinion Research.
| Group | N (unweighted) | M.O.S.E. |
| Total | 1204 | ±3 percentage points |
| Half Sample A | 595 | ±5 percentage points |
| Half Sample B | 609 | ±5 percentage points |
| Voters in the 2016 Election | ||
| Total Voters | 934 | ±4 percentage points |
| Trump Voters | 371 | ±6 percentage points |
| Clinton Voters | 396 | ±6 percentage points |
| Party Identification | ||
| Democrats | 361 | ±6 percentage points |
| Republicans | 337 | ±6 percentage points |
| Independents | 372 | ±6 percentage points |
| Pre-Existing Condition | ||
| Individuals living in household with pre-existing condition | 691 | ±4 percentage points |
| Individuals living in household without pre-existing condition | 501 | ±5 percentage points |
As Congress begins to work on repealing and replacing the Affordable Care Act, the latest Kaiser Health Tracking Poll finds that one in five Americans (20%) support repeal alone, while three quarters either oppose repeal altogether (47%) or want to wait to repeal the law until the replacement plan’s details are known (28%).
Overall, the poll finds that nearly equal shares say that the next Congress should vote to repeal the law (49%) and that it should not vote to repeal it (47%), which mirrors the public’s overall views of the 2010 law (46% view it unfavorably, 43% favorably).
The debate surrounding repeal could influence the public’s views, as the poll finds that some people shift their opinions after hearing counter-arguments. For example, after hearing pro-repeal arguments about the law’s costs to individuals and the government, the share of the public supporting repeal grows as large as 60 percent, while anti-repeal arguments about people losing coverage and the impact on people with pre-existing conditions decreases support for repeal to as low as 27 percent.
When asked directly about their family’s health care costs, similar shares of the public say repealing the Affordable Care Act would make their situation worse (28%) as say it would make it better (27%). Most say their own ability to get and keep health insurance (55%) and the quality of their own health care (57%) will stay about the same if Congress votes to repeal the law.
Lowering Out-of-Pocket Costs, And Not the ACA, Tops Public’s Health Care Priorities for Washington
The public ranks health care as a top issue for President-elect Trump and the new Congress to address this year. About one in five (19%) name health care when asked an open-ended question about their top issue for 2017, behind jobs and the economy (24%) and similar to immigration (20%). Fewer cite education (7%) or foreign policy (7%) issues.
Among health care priorities, repealing Obamacare ranks well behind several other health-care issues that Americans want the next administration to work on with majorities of the public more directly focused on what consumers pay for their health care.
When asked about a series of health care priorities, two-thirds of the public (67%) say lowering the amount individuals pay for health care should be a “top priority” for President-elect Trump and the next Congress. Similar shares of Democrats, Republicans and independents name this as a top priority.
Nearly as many (61%) say lowering the cost of prescription drugs should be a “top priority,” while smaller shares say so about dealing with the prescription pain killer addiction epidemic (45%), repealing the 2010 health care law (37%), decreasing how much the federal government spends on health care over time (35%), and decreasing the role of the federal government in health care (35%).
Some of these issues rank lower in part because of sharp partisan divisions over their importance, most notably when it comes to repealing Affordable Care Act. About six in 10 Republicans (63%) name repeal as a top priority, compared to a third of independents (32%) and a fifth of Democrats (21%).
Partisans Split on How Big a Role Government Should Play in Health Care
Throughout the 2016 presidential election, it became clear that the two major political parties in the U.S. have different views on the future of health care. When given two competing approaches, six in ten Americans (62%) prefer “guaranteeing a certain level of health coverage and financial help for seniors and lower-income Americans, even if it means more federal health spending and a larger role for the federal government” while about three in 10 (31%) prefer “limiting federal health spending, decreasing the federal government’s role, and giving state governments and individuals more control over health insurance, even if this means some seniors and lower-income Americans would get less financial help than they do today.”
There are partisan differences, with about half of Republicans (53%) preferring the approach that Republican leaders have coalesced around – limiting federal health spending, decreasing the federal government’s role, and giving states and individuals more control. The majority of Democrats (79%) and independents (65%) prefer guaranteeing a certain level of coverage for seniors and lower-income Americans – even if it means a larger role for the federal government and increased federal spending.
Designed and analyzed by public opinion researchers at the Kaiser Family Foundation, the poll was conducted from December 13-19 among a nationally representative random digit dial telephone sample of 1,204 adults. Interviews were conducted in English and Spanish by landline (421) and cell phone (783). The margin of sampling error is plus or minus 3 percentage points for the full sample. For results based on subgroups, the margin of sampling error may be higher.
Medicare Advantage plans, which consist primarily of HMOs and PPOs, now cover almost 18 million people – nearly one-third of all Medicare beneficiaries. Medicare Advantage plans have been in the news lately because the proposed merger between Aetna and Humana, which together account for one-quarter of all Medicare Advantage enrollees, could further consolidate the Medicare Advantage market.
A Kaiser Family Foundation analysis, featuring the latest publicly available data on the 2017 Medicare marketplace, examines new information on plan availability, premiums, out-of-pocket limits and other features of Medicare Advantage plans. Overall, the analysis finds that the Medicare Advantage market has been relatively stable in recent years, with few changes in premiums, plan offerings, and insurer participation. Key findings include:
With nearly one-third of all Medicare beneficiaries enrolled in Medicare Advantage plans in 2016,1 there is ongoing interest in the evolution of this marketplace and how well it is working for people on Medicare. For the past several years, the Medicare Advantage market has appeared to be relatively stable, based on the metrics available, with few changes in average premiums, plan offerings, and insurer participation. Less information is available about cost-sharing for Medicare-covered services, extra benefits, or Medicare Advantage provider networks, including how they may have changed over time.2
This spotlight analyzes publicly available data to review the Medicare Advantage plans offered in 2017, with information on including plan availability, premiums, out-of-pocket limits and other plan features:
The design of Medicare Advantage plans is heavily influenced by the level of federal payments to plans and the requirements of plans. As of 2017, the payment reductions adopted in the Affordable Care Act (ACA) will be fully phased-in. The effects of these reductions have been partly blunted by quality-based bonus payments to plans and the way payment reductions were applied.3 In 2016, federal payments to plans are estimated to be 2 percent higher than traditional Medicare spending, on average, including the bonus payments.4
The Medicare Advantage market is highly consolidated nationwide and could become more so depending on the outcomes of the proposed Aetna-Humana and Anthem-Cigna mergers. Such market concentration can influence the competiveness and the stability of the market. More longer-term, some lawmakers are proposing to transform Medicare into a premium support system, building off of Medicare Advantage. A premium support system would likely look very different from current Medicare Advantage plans since it would change federal payments to plans and plans’ financial incentives, with uncertain effects for plans and beneficiaries.
In total, 2,034 Medicare Advantage plans will be available nationwide for individual enrollment in 2017, a number that has been relatively stable since 2011 (Figure 1). Among the plans that were available in 2016, 238 will be exiting the Medicare Advantage market, and 271 plans will be offered for the first time (Table A1). While virtually every state will see some change in the number of plans, most of the plans exiting the market in 2017 attracted relatively few enrollees in 2016. Just under 3 percent of all Medicare Advantage enrollees in 2016, 414,710 beneficiaries, will need to choose a new plan in 2017 because their plan exited.
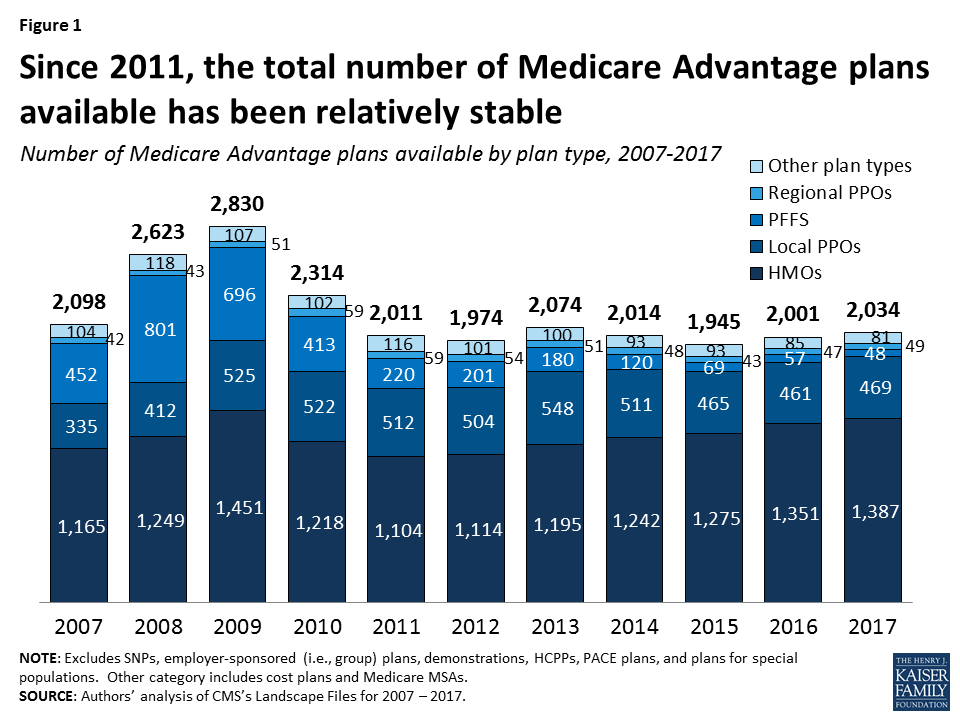
HMOs continue to account for the large majority of plans available, and will account for two-thirds of all plans offered in 2017 (Table A1). Since 2010, the number of HMOs has increased each year, with 36 more HMOs in 2017, while the availability of other plan types has either remained similar or decline.
Since 2012, the number of plans available to Medicare beneficiaries has been relatively stable. The average beneficiary will be able to choose from among 19 plans, on average, in 2017, the same number as in 2016 (Figure 2). Beneficiaries in metropolitan areas will be able to choose from 21 plans, on average, and beneficiaries in non-metropolitan areas will be able to choose from 11 plans, on average, the same as in 2016. Similarly, the average number of plans available to beneficiaries in the lowest cost counties (i.e., lowest quartile of counties) and in other counties will remain the same in 2017 as it was in 2016, ranging from 15 plans available in the lowest cost counties to 23 plans available in the highest cost counties; Table A2).
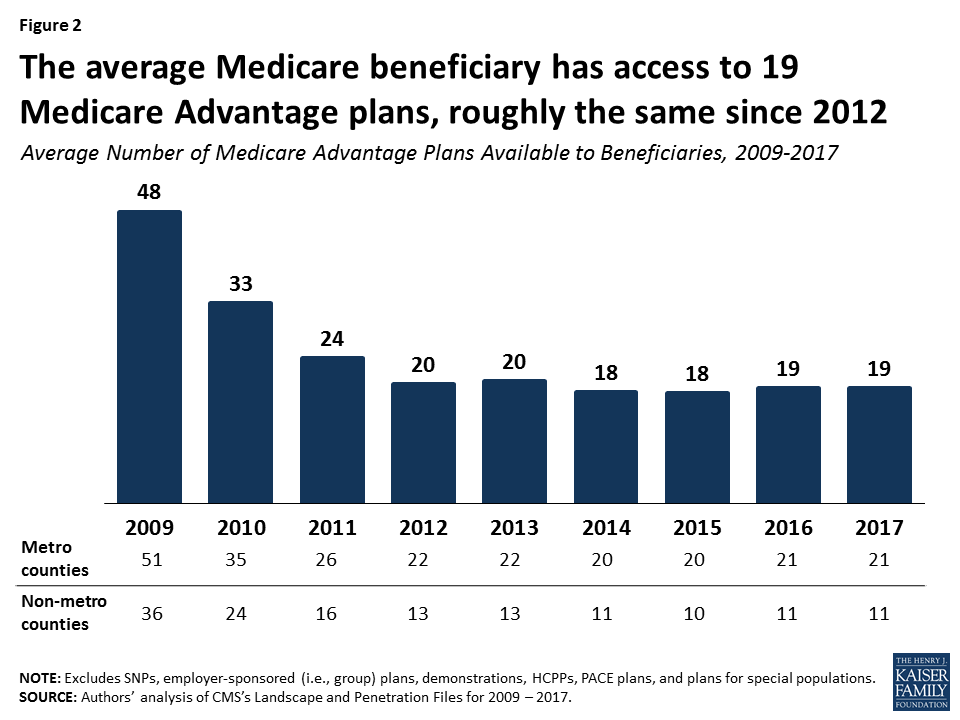
Despite the high number of plans available per beneficiary, relatively fewer plans are available in many counties. In almost one-third (30%) of counties, most of which are rural, beneficiaries can choose from five or fewer Medicare Advantage plans, including 10 percent of counties with less than 3 plans in 2017 (Figure 3). At the other end of the spectrum, in about one-quarter of counties, beneficiaries can choose from 16 or more plans, including 4 percent of counties in which beneficiaries can choose from more than 30 plans in 2017. About 14 percent of beneficiaries are in counties that have two plans or less and 54 percent of beneficiaries are in counties that have 5 or fewer plans.
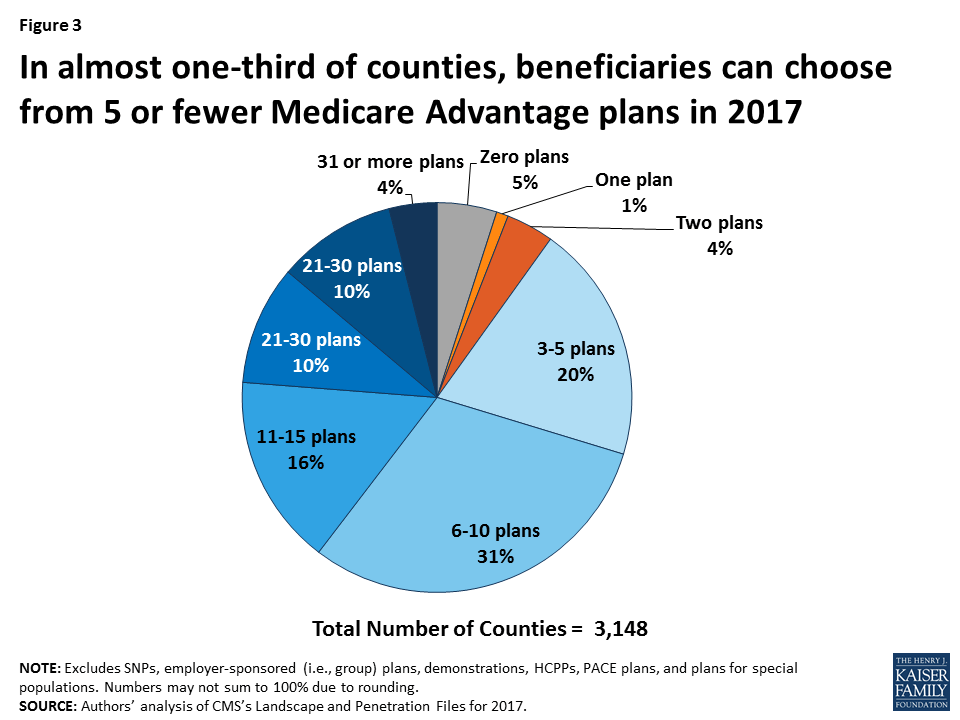
The average Medicare beneficiary will be able to choose from many plans, but in some areas, these plans will be offered by a handful of firms. The average Medicare beneficiary will be able to choose from plans offered by 6 firms, on average, in 2017, with sizeable variation across counties (Figure 4). One-quarter of beneficiaries will be able to choose from plans offered by three or fewer firms, while another quarter of beneficiaries will be able to choose from plans offered by 8 or more firms. The number of firms offering Medicare Advantage plans will be highest in the New York City area (Bronx, Kings, Queens, and New York Counties), Los Angeles County, and Orange County, California, where 15 or more firms will be offering Medicare Advantage plans. In contrast, in 439 counties in 26 states, most of which are rural counties with few Medicare beneficiaries, only one firm will offer Medicare Advantage plans in 2017, and in another 154 counties, zero firms will offer Medicare Advantage plans.
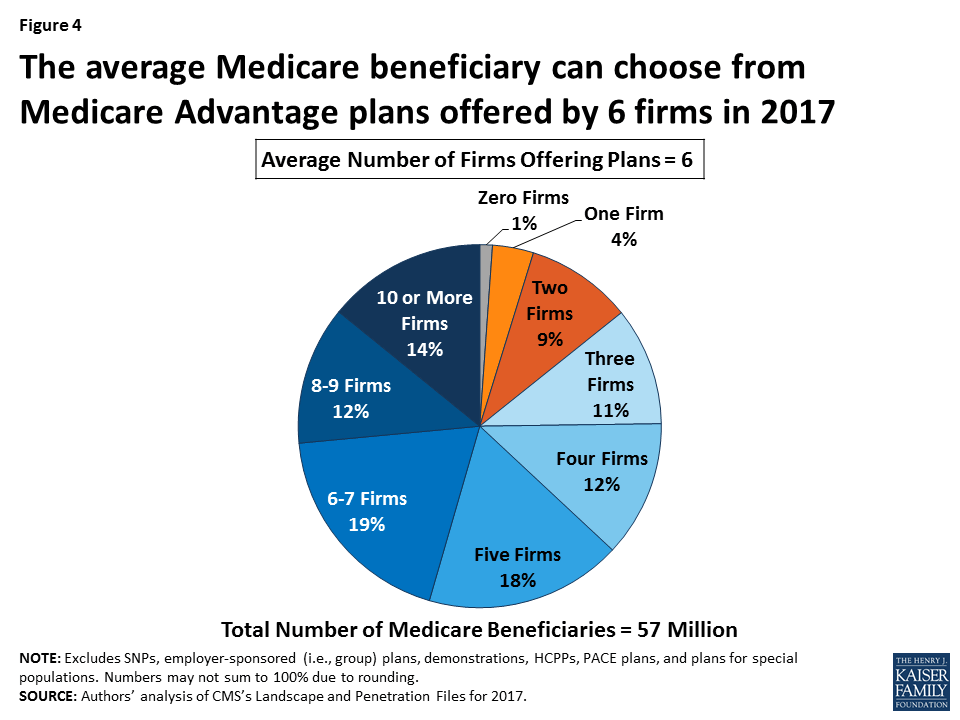
As in recent years, virtually all Medicare beneficiaries (99%) will continue to have access to a Medicare Advantage plan as an alternative to traditional Medicare (Figure 5). Virtually all beneficiaries in metropolitan areas (99%) and the vast majority of beneficiaries in non-metropolitan areas (97%) will continue to have access to at least one Medicare Advantage plan, similar percentages as in 2016. Consistent with prior years, in non-metropolitan counties relative to metropolitan counties, a smaller share of beneficiaries will have access to HMOs or local PPOs, and a slightly larger share of beneficiaries will have access to private fee-for-service (PFFS) plans and regional PPOs.
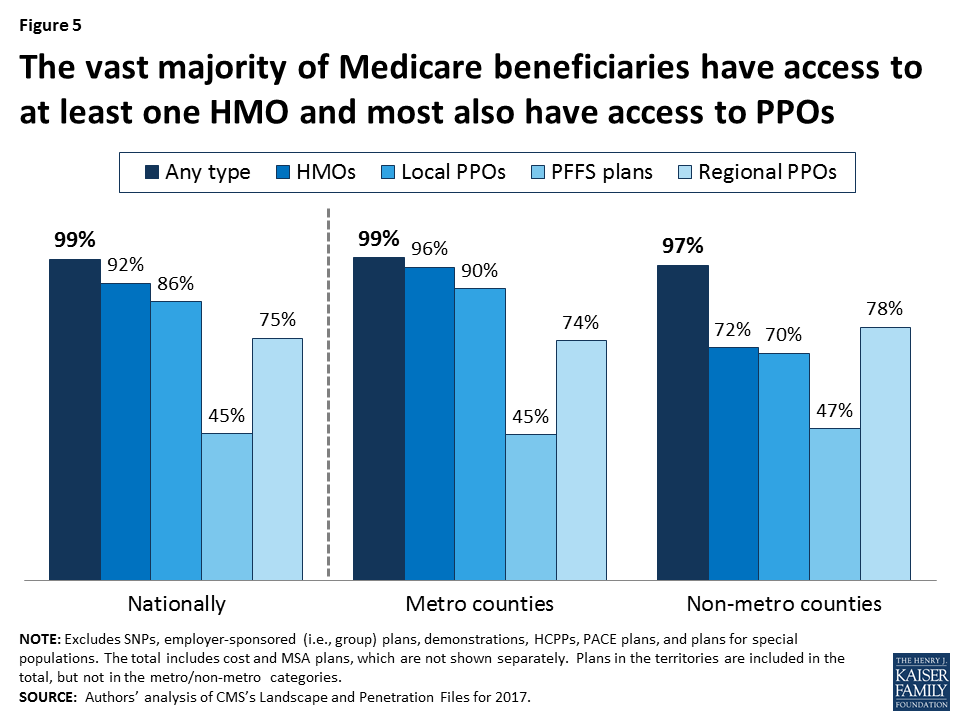
Half of the 271 new Medicare Advantage plans in 2017 are offered by UnitedHealthcare, Aetna, and firms affiliated with BlueCross BlueShield (BCBS; Figure 6). UnitedHealthcare alone accounts for about one-quarter of all new Medicare Advantage plans. Aetna and Humana, whose proposed merger is pending, together account for another one-quarter of new plans.
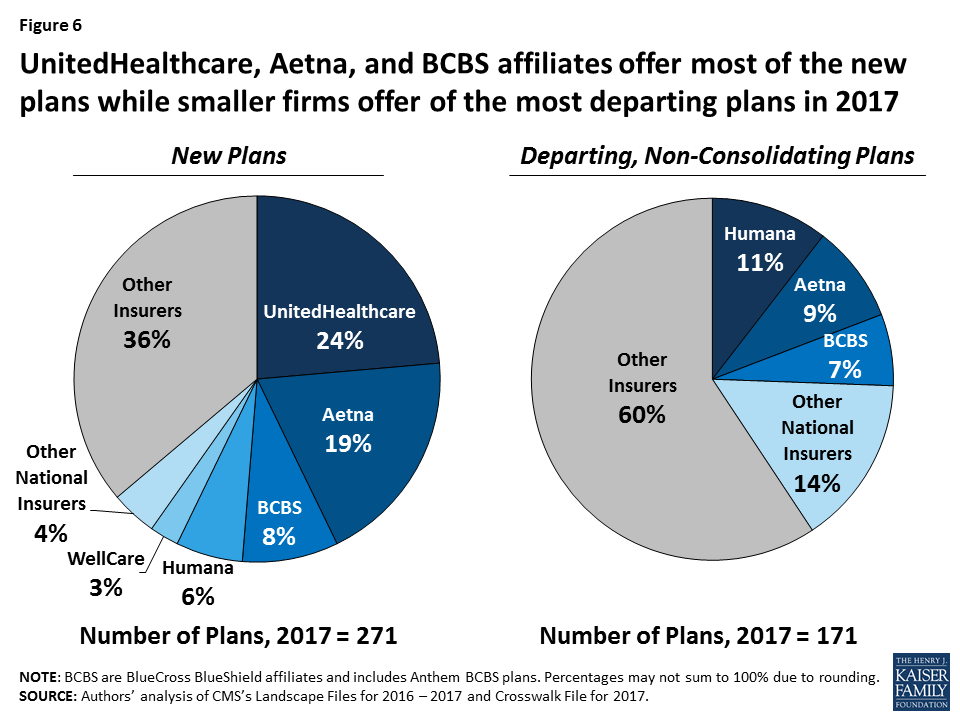
Fewer plans will be exiting than entering the Medicare Advantage market in 2017, and some firms will also be offering Medicare Advantage plans for the first time. Most of these appear to be local companies, some like SharpAdvantage in San Diego. These new firms will be in nine states: California, Illinois, Iowa, Georgia, Florida, Mississippi, North Dakota, Pennsylvania, and South Carolina.
Most (60%) of the 171 departing plans were offered by smaller firms that tend to have a more regional focus. Humana, Aetna, and BCBS affiliates comprise about one-quarter (26%) of the departing plans, with other national insurers, such as UnitedHealthcare, Cigna, Kaiser Permanente, Anthem and Wellcare, comprising a total of 15 percent, each with less than 3 percent of the departing plans.
Medicare beneficiaries enrolled in Medicare Advantage plans pay the Part B premium like other beneficiaries (less any rebate provided by the Medicare Advantage plan), and may also pay an additional monthly premium charged by the Medicare Advantage plan for benefits and prescription drug coverage. This analysis of premiums includes only Medicare Advantage plans that offer prescription drug coverage (MA-PDs). The minority of Medicare Advantage plans (12%) that do not cover prescription drugs are not included in the analysis, in order to better compare premiums across plan types and years. The analysis also weights plans by their 2016 enrollment to reflect the impact of premium changes on current enrollees. (Unweighted premiums, which reflect beneficiaries’ plan options, are in Appendix Table A3)
To examine how premiums will change for Medicare Advantage enrollees, assuming they remain in the same plan between 2016 and 2017, this spotlight examines the premiums among MA-PDs offered in both years and weights the premiums by plan enrollment in 2016. This analysis includes plans with no premiums as well as plans with monthly premiums. Enrollees may be able to prevent or reduce increases in premiums by switching to another plan. After the open enrollment period, we will analyze the premiums for plans selected by all Medicare Advantage enrollees in 2017.5 In recent years, average premiums, weighted by actual enrollment, have tended to be lower than estimates of weighted premiums based on prior year enrollment.
The difference reflects the net impact of beneficiaries making enrollment changes between one year and the next, and plan choices among new Medicare Advantage enrollees. Based on plan enrollment in the Fall of 2016, the average Medicare Advantage enrollee in a plan that will continue to be offered in 2017 will pay about $39 per month, an increase of $2 per month (or 4%) compared to 2016, if they stay in the same plan (Figure 7). In percentage terms, enrollees in PFFS plans will experience a larger increase in premiums (8% on average) than enrollees in other types of Medicare Advantage plans, assuming no change in enrollment. Monthly premiums, weighted for 2016 enrollment will be lower for enrollees in HMOs ($29 per month) than for enrollees in other types of Medicare Advantage plans.
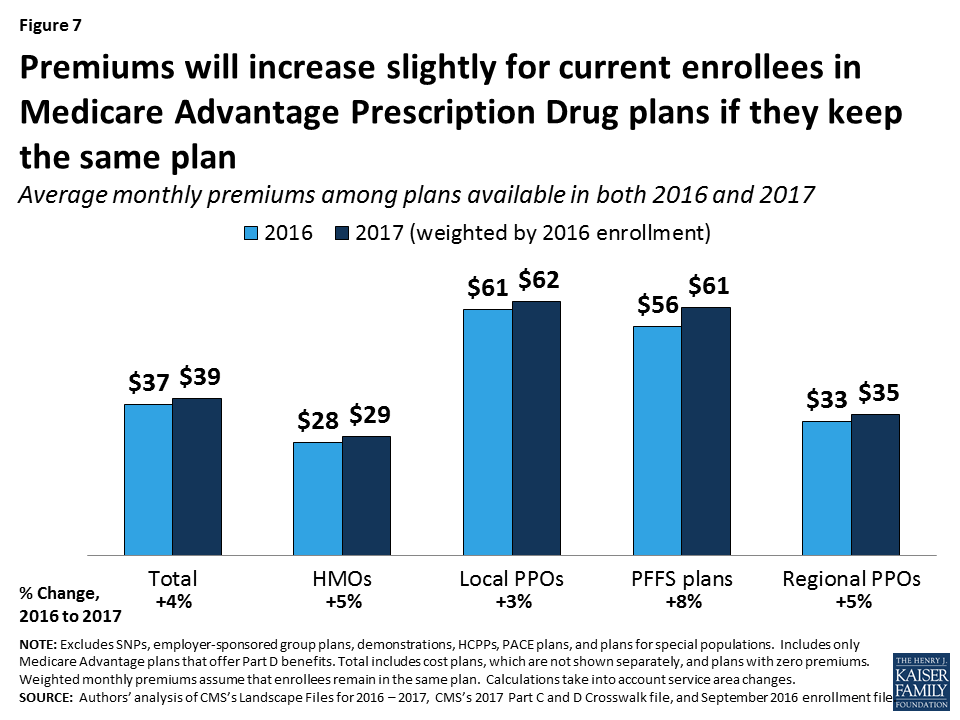
In general, enrollees in MA-PDs that will continue to be offered in 2017 had somewhat lower premiums (averaging $37 per month), on average, than enrollees in plans that will be exiting the market (averaging $42 per month; Table A1). However, the difference varies across plan types and these changes are difficult to interpret because plan premiums are a function of many plan-specific factors, as well region-specific factors.
Change in Premiums. While over half (56%) of Medicare Advantage enrollees will see no change in their premiums, some enrollees will experience increases or decreases in their monthly premium (Figure 8). About 8 percent of enrollees will see the largest increases, with monthly premiums increasing by $11 or more a month, if they do not change their plan. In contrast, one in seven MA-PD enrollees (15%) will see premiums decline in 2017, if they stay in the same plan.
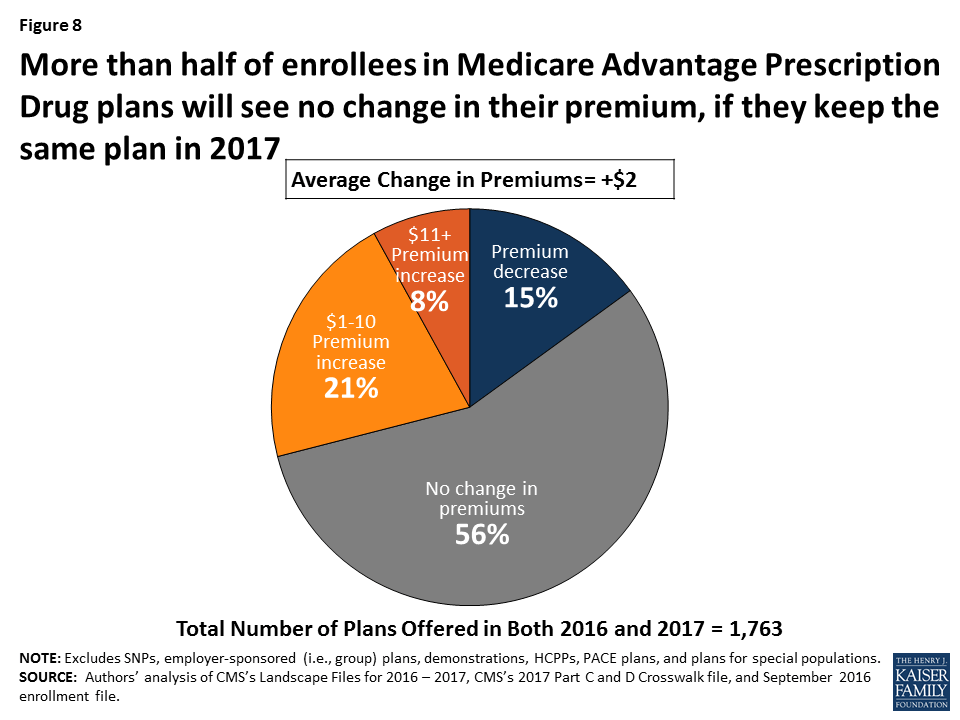
The change in monthly premiums also will vary somewhat across the country (Figure 9). In most states, average premiums will increase or decrease by less than $5 per month. However, in North Dakota, average premiums will decrease by about $8 per month, while in Massachusetts and Hawaii, average premiums will increase by more than $9 per month. Other work has shown that only about 10 percent of Medicare Advantage enrollees switch plans each year, and the share of people switching plans does not significantly increase until premiums increase by $20 or more per month, at which point 20 percent of enrollees switch plans, on average.6
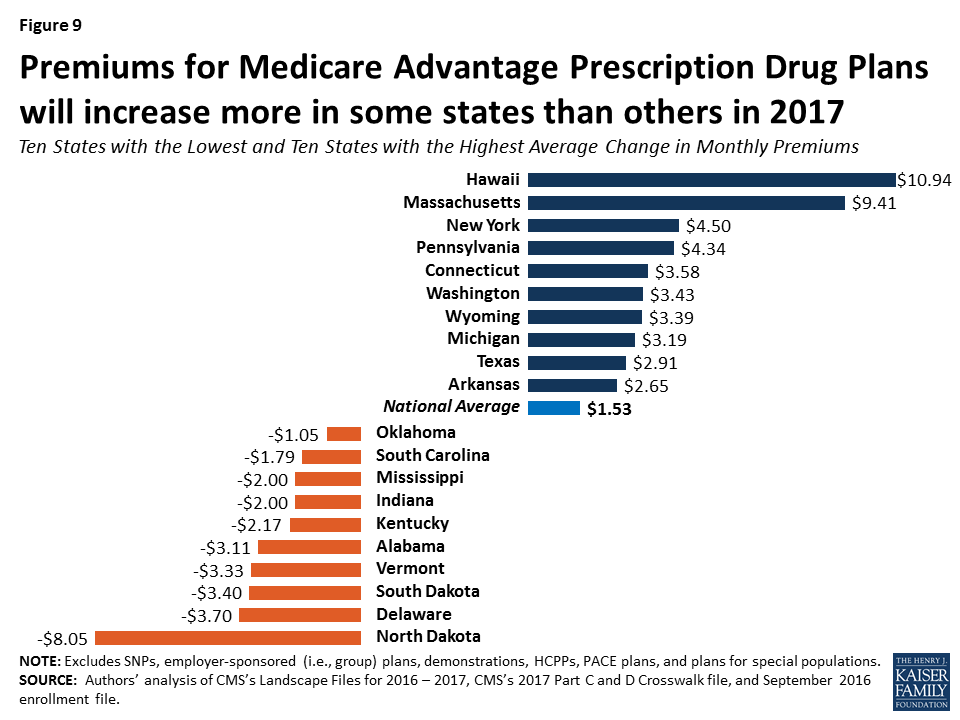
Medicare Advantage plans with no additional premium (other than the Medicare Part B premium) – so called “zero premium plans” – have been a feature of the Medicare Advantage landscape for many years. About four-fifths (81%) of all beneficiaries will have access to a zero-premium MA-PD in 2017, the same as in 2016 (Figure 10). The continued availability of zero-premium plans mainly reflects offerings among HMOs since zero-premium plans are less common among other plan types. More local PPOs will have zero premiums in 2017 but the share of local PPOs using this feature has varied over time.
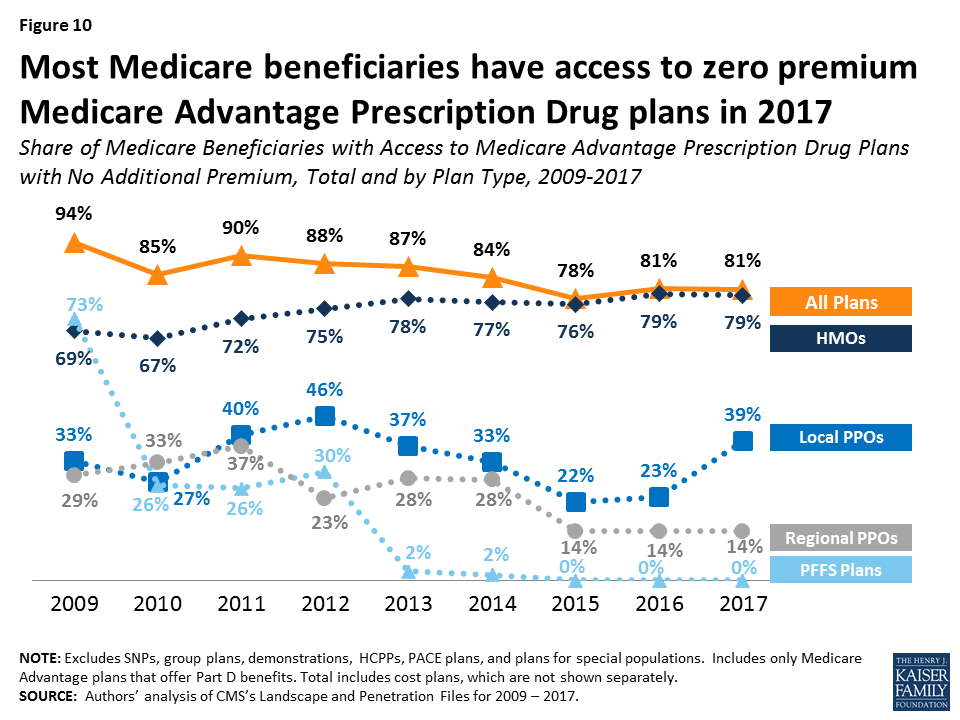
The traditional Medicare program does not include a limit on out-of-pocket spending for services covered under Parts A and B. In contrast, Medicare Advantage plans are required to limit enrollees’ out-of-pocket expenses for services covered under Parts A and B to no more than $6,700, with higher limits allowed for services received from out-of-network providers. Even before the 2011 implementation of this requirement, most Medicare Advantage plans (79% in 2010) voluntarily included a limit on enrollees’ out-of-pocket spending.7 CMS encourages plans to limit enrollees’ out-of-pocket expenses to no more than $3,400 per year, by allowing these plans to charge higher cost-sharing for some services. These out-of-pocket limits do not include expenses for Part D prescription drugs (which have a separate catastrophic threshold), nor do they include expenses for extra benefits or for services not covered by the plan.
Continuing the trend since 2011, out-of-pocket limits for MA-PDs will be higher in 2017 than in prior years, on average. In 2017, the average plan’s limit will be $5,332, up from $4,281 in 2011 (Figure 11).
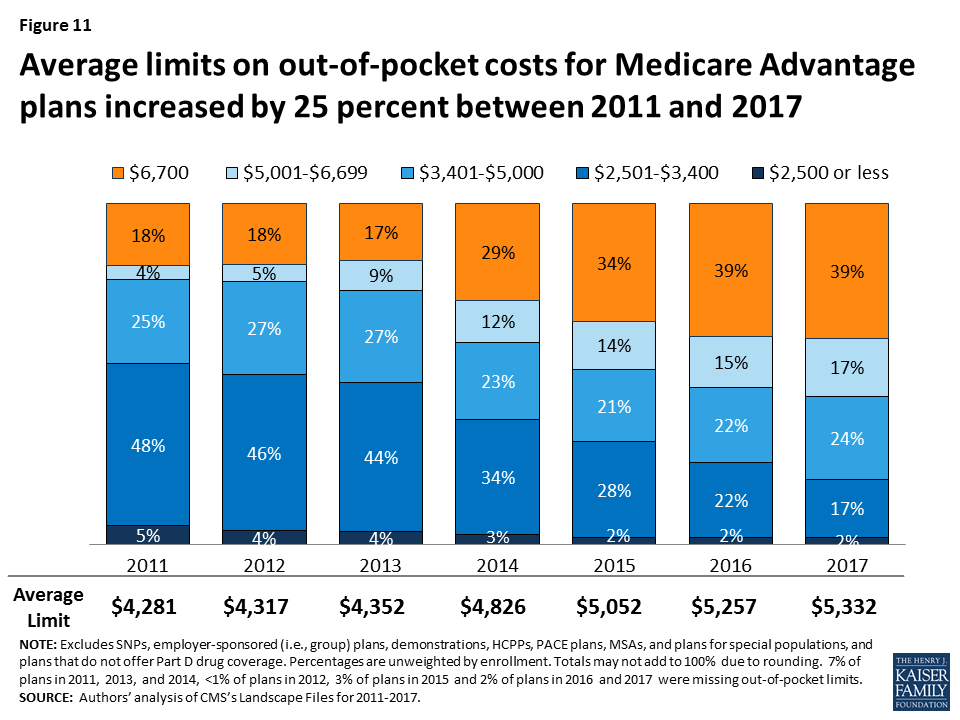
In 2017, two-fifths of plans (39%) will have limits equal to the maximum ($6,700), the same as in 2016. About 19 percent of plans will have a limit of $3,400 or less in 2017, a sharp decline since 2011 when over half (53%) of plans had limits of $3,400 or less. Average out-of-pocket limits are increasing across all plan types (Figure 12). Almost three-quarters (72%) of regional PPOs, half (51%) of local PPOs, and one-third (35%) of HMOs have out of pocket limits equal to $6,700. Limits at or below $3,400 are rare across all plan types.
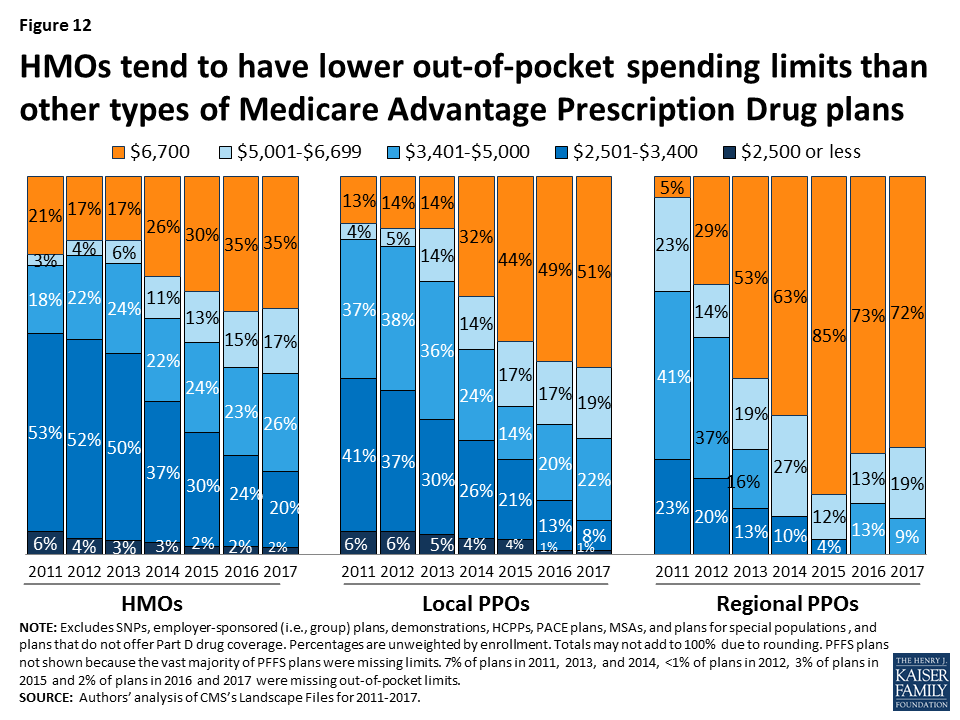
In 2017, the vast majority (88%) of Medicare Advantage plans will offer prescription drug coverage. Historically, plans without a drug benefit were developed for beneficiaries who may have access to other sources of prescription drug coverage, such as retiree health coverage from former employers or the Veterans Health Administration, as well as those who for any other reason do not want to purchase such coverage.
The standard design of the drug benefit includes an initial coverage deductible which is updated each year, and is $400 in 2017. Plans can vary the benefit design as long as they provide cost-sharing that is at least actuarially equivalent to the standard benefit. In 2017, half (51%) of MA-PDs will impose a deductible for prescription drug coverage. Since 2010, the average MA-PD deductible has quintupled from $26 in 2010 to $135 in 2017 (Figure 13). A smaller share of MA-PDs will charge the maximum deductible (10% in 2017 versus 16% in 2016). Deductibles are more frequently used in free standing PDPs and more charge the maximum allowed amount.8
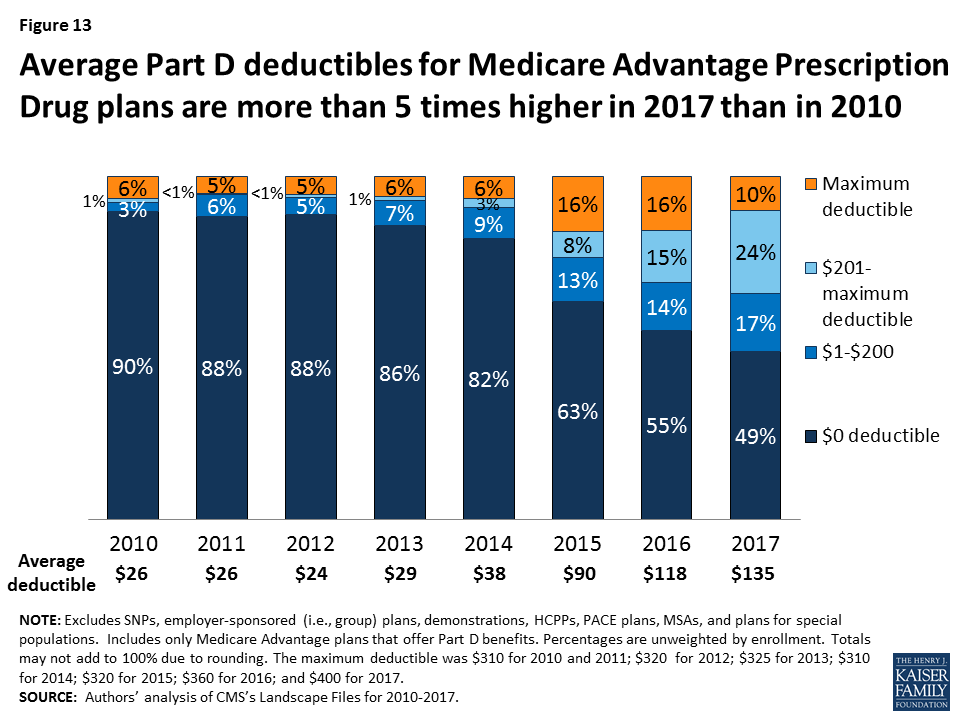
For many years, the CMS has posted quality ratings of Medicare Advantage plans to provide Medicare beneficiaries with additional information about plans offered in their area. All Medicare Advantage plans are rated on a 1 to 5-star scale, with 1 star representing poor performance, 3 stars representing average performance, and 5 stars representing excellent performance. CMS assigns quality ratings at the contract level, rather than for each individual plan. This means that every Medicare Advantage plan covered under the same contract receives the same quality rating, and most contracts cover multiple plans of the same type (e.g. HMO).
Since 2012, Medicare Advantage plans have received bonus payments based on their contract’s quality ratings, and plans within contracts with higher ratings also receive higher rebate amounts. In 2017, plans within contracts with 4 or more stars will receive bonuses of 5 percent. Plans in lower scoring contracts receive no bonuses. (Those too new or with too few enrollees in their contract to be rated get a bonus of 3.5 percent). These bonus percentages are doubled in some counties.9 Additionally, beneficiaries can enroll in a plan with 5 stars (the highest rating) at any time during the year, not just during the annual open enrollment period.
In 2017, about four in ten (41%) Medicare Advantage contracts will have ratings of four or more stars, similar to 2016 (Figure 14). Five percent of contracts received 5 stars, the highest rating possible. More than one-third (35%) of contracts will have average ratings (3 or 3.5 stars), and 2 percent of contracts will have below average ratings (2 or 2.5 stars) in 2017.
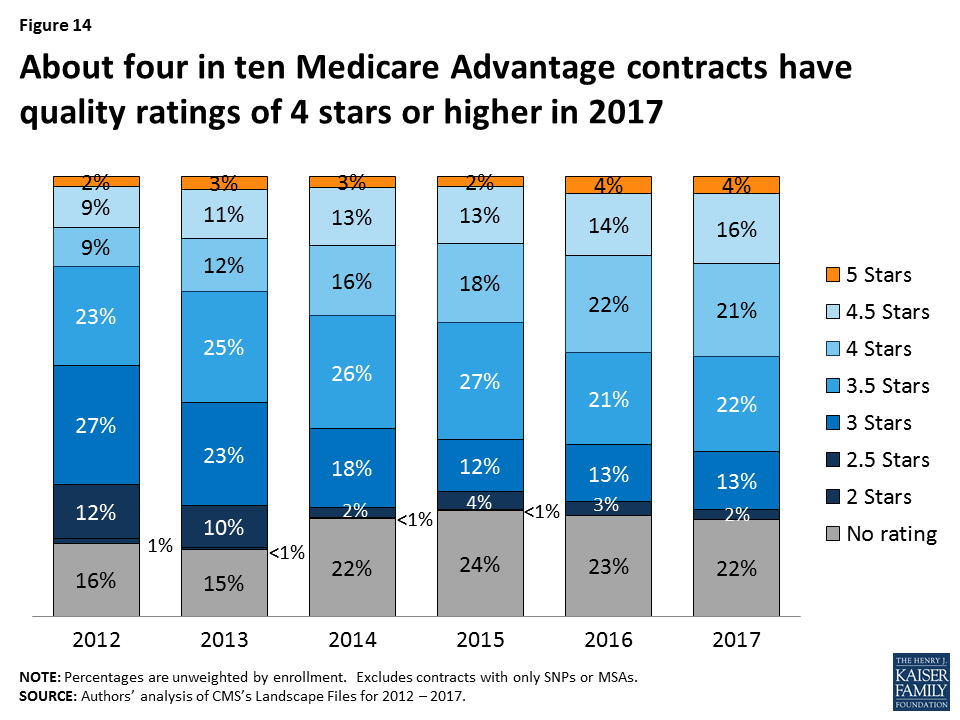
While many organizations offer Medicare Advantage plans, most plans are owned or affiliated with a small number of companies and organizations. In 2016, 7 firms and affiliates accounted for almost three-quarters of all enrollment: UnitedHealthcare, Humana, Blue Cross and Blue Shield (BCBS) affiliated companies (including Anthem BCBS plans), Kaiser Permanente, Aetna, Cigna, and Wellcare. These companies and affiliates account for 64 percent of the plans being offered in 2017 (Table A4).
Firm strategies are reflected both in the types of plans they offer and the share of beneficiaries to whom they are available (Figure 15; Table A5). Two firms with the largest footprints in the Medicare Advantage market are United Healthcare and Humana. In 2017, 74 percent of Medicare beneficiaries will have a United Health plan available to them for individual enrollment, and 83 percent will have a Humana plan. Humana’s footprint continues to be large despite recent declines in the total number of plans they offer nationwide. Humana offers diverse types of plans than most other firms. HMOs, local PPOs, and regional PPOs offered by Humana will be available to more than half of beneficiaries (56%, 58%, and 61%, respectively) and Humana PFFS plans will be available to about four in ten beneficiaries (39%). UnitedHealthcare offerings, in contrast emphasize HMOs. More than half of beneficiaries (61%) will have access to a UnitedHealthcare HMO in 2017, up from 55 percent of beneficiaries in 2016.
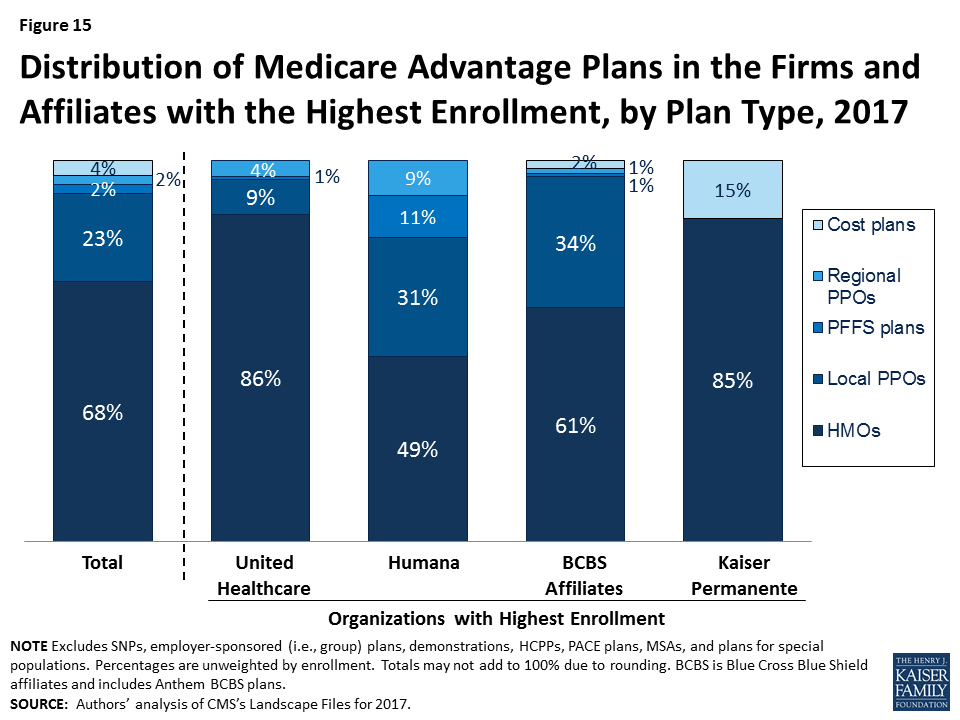
Aetna’s proposed merger with Humana has raised concerns about its potential to reduce competition in the Medicare market. Humana is a dominant firm in the Medicare Advantage market and a merger with Aetna would likely increase the dominance of the combined firms, even with some divestment. Even without a merger, Aetna’s footprint in the Medicare Advantage market has expanded since its acquisition of Coventry. In 2017, Aetna plans will be available to more than half (56%) of all beneficiaries, up from 49 percent in 2016 and 33 percent in 2014, the year after the acquisition of Coventry. Between 2016 and 2017, Aetna will greatly increase the number of local PPOs it offers, rising from 82 plans in 2016 to 117 plans in 2017. Accordingly, a larger share of beneficiaries will have access to an Aetna local PPO (52%) in 2017, up from four in ten (40%) beneficiaries in 2016, and one-third of beneficiaries (33%) in 2015.
Cigna and Anthem have also proposed to merge, although this would have less of an impact on the Medicare Advantage marketplace than the Aetna-Humana proposed merger. Nonetheless, with its conversion to for profit status and acquisition of other BCBS affiliates, Anthem BCBS has expanded the geographic scope of its Medicare Advantage market, and will be available to 24 percent of all Medicare beneficiaries in 2017. Cigna currently is a somewhat smaller player in the Medicare Advantage market, with its plans available to 20 percent of beneficiaries in 2017. If this merger is approved, concerns about the effects on competition in Medicare Advantage would likely be limited to a few specific markets.
Plan choices for beneficiaries will be relatively stable between 2016 and 2017, with very little change in the number or type of plans available to beneficiaries or the firms offering those plans. Firms continue to offer diverse products and most beneficiaries have a choice of HMOs and PPOs, while fewer beneficiaries have access to PFFS plans. Most beneficiaries will continue to have a wide choice of plans, including plans that require no additional premiums. Premium increases generally will be moderate but will vary considerably across enrollees. Medicare beneficiaries enrolling in a Medicare Advantage plan will find that the plans available to them, on average, have somewhat higher quality ratings in 2017 than in 2016 but provide less financial protection with higher limits on out-of-pocket costs.
Given the rise in Medicare Advantage enrollment, it is unfortunate that beneficiaries do not have more information that is readily available to facilitate plan comparisons and inform their choices. In particular, it remains challenging for consumers (and researchers) to obtain information that can be used to compare plan networks, cost sharing, and extra benefits, or the performance of individual plans on quality and efficiency metrics. Such information could be used to strengthen program oversight.
The multi-year experience of private plans in Medicare provides insight into the implications of choice for older adults and people with disabilities on Medicare. By its nature, the structure of the Medicare Advantage program and its reliance on competition among private plans demands much of plan enrollees, particularly if they want to maximize Medicare’s value. Since firms can make changes to their plans each year (e.g., premiums, cost-sharing, extra benefits and provider networks), each year’s choices bring potentially significant changes for beneficiaries to consider that can be particularly challenging for beneficiaries with serious health problems or cognitive limitations. Perhaps that is one reason why such a small share of Medicare Advantage enrollees change plans each year,10 unless confronted with relatively steep premium increases.
While Medicare Advantage has been relatively stable in recent years, it was not always so. Beneficiaries experienced considerable disruption in the late 1990s and early 2000s when firms departed many markets and reduced benefits under the Medicare +Choice program, the predecessor program to Medicare Advantage.11 The current stability in the Medicare Advantage market has benefited considerably from the current payment system which, even after the ACA payment reductions, pays plans, on average, 102 percent of the cost of coverage under traditional Medicare. Some lawmakers are now proposing to transform Medicare into a premium support system, building off of Medicare Advantage. A premium support system could be a major departure from the current program due to many factors, including a change in federal payments to plans and plans’ financial incentives, which would have uncertain effects for plans and beneficiaries.
Gretchen Jacobson, and Tricia Neuman are with the Kaiser Family Foundation; Anthony Damico is an independent consultant; and Marsha Gold is a Senior Fellow Emeritus with Mathematica Policy Research and independent consultant.
Box 1: Availability of Special Needs Plans in 2017
Special Needs Plans (SNPs) are a type of Medicare Advantage plan that was authorized in 2003 as part of the Medicare Prescription Drug, Improvement and Modernization Act (MMA) to provide a managed care option for beneficiaries with significant or relatively specialized health care needs. Medicare beneficiaries can enroll in a SNP if they are dually eligible for Medicare and Medicaid (D-SNPs), require an institutional-level of care (I-SNPs), or have a severe or chronic condition (C-SNP). Most SNPs are HMOs, but they can also be PPOs.
When SNPs were authorized, there were few requirements beyond those required of other Medicare Advantage plans. The Medicare Improvements for Patients and Providers Act (MIPPA) of 2008 established additional requirements for SNPs, including requiring all SNPs to provide a care management plan to document how care would be provided for enrollees and requiring C-SNPs to limit enrollment to beneficiaries with specific diagnoses or conditions. As a result of the MIPPA requirements, the number of SNPs declined in 2010. The ACA required D-SNPs to have a contract with the Medicaid agency for every state in which the plan operates, beginning in 2013.
In 2017, 578 SNPs will be available, similar years since 2013 (Figure 16; Table A6). The availability of SNPs will continue to vary across states. In 2017, at least one SNP of any type will be available in all states but six (AK, IA, ND, SD, VT, and WY). SNPs were not available in Nebraska and Rhode Island in 2016 but will be available in 2017; Nebraska will have one D-SNP and Rhode Island will have one D-SNP and two I-SNPs. As in past years, SNPs will be most numerous in selected high population states, notably Florida (97 plans), California (70 plans), and New York (45 plans).
The total number of D-SNPs will increase from 342 plans to 373 plans between 2016 and 2017, and the number of C-SNPs will decline from 139 plans in 2016 to 122 plans in 2017. Similar to prior years, most C-SNPs (72%) will focus on diabetes, chronic heart failure, or cardiovascular disorders. The total number of I-SNPs will increase from 69 plans in 2016 to 83 plans in 2017, and six new companies will offer I-SNPs for the first time in 2017 (accounting for 8% of plans).
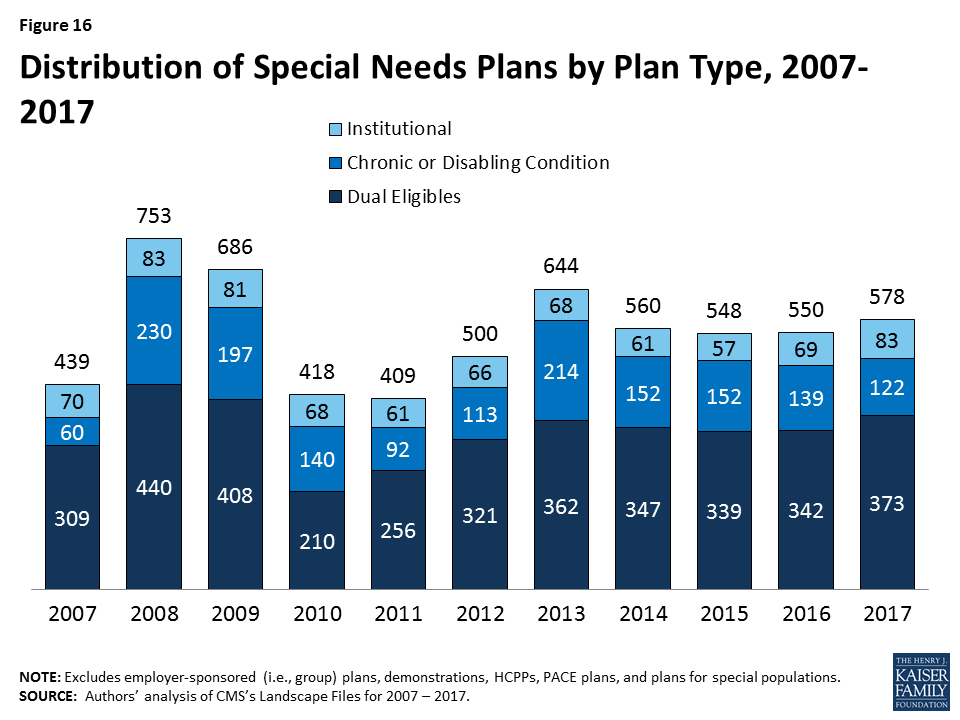
| Table A1. Medicare Advantage Plan Market Entries and Exits, Average Monthly Premiums and Average Out-of-Pocket Spending Limits for Medicare Advantage Prescription Drug plans (MA-PDs), Weighted by 2016 Enrollment, 2016-2017 | |||||||
| All Medicare Advantage Plans (MA-PD and MA-only plans) | All plans | HMO | Local PPO | PFFS | Regional PPO | Cost | MSA |
| 2016 Plan Total | 2,001 | 1,351 | 461 | 57 | 47 | 81 | 4 |
| Total number of staying plans | 1,763 | 1,193 | 400 | 47 | 47 | 72 | 4 |
| Number of staying plans with no service area reductions | 1,519 | 1,048 | 324 | 24 | 47 | 72 | 4 |
| Number of staying plans with reduced service areas | 185 | 99 | 63 | 23 | – | – | – |
| Number of consolidating plans, post consolidation | 59 | 46 | 13 | – | – | – | – |
| Total number of departing plans | 238 | 158 | 61 | 10 | – | 9 | – |
| Number of plans departing due to consolidation | 67 | 50 | 13 | – | – | 4 | – |
| Number of terminating plans | 171 | 108 | 48 | 10 | – | 5 | – |
| Number of new plans | 271 | 194 | 69 | 1 | 2 | 5 | – |
| 2017 Plan Total | 2,034 | 1,387 | 469 | 48 | 49 | 77 | 4 |
| Total Medicare Advantage enrollees, as of September 2016 | 12,282,452 | 8,496,896 | 2,065,184 | 225,353 | 1,065,036 | 427,283 | 2,700 |
| Number of staying plans’ enrollees | 11,867,742 | 8,223,231 | 1,951,216 | 198,751 | 1,065,036 | 426,808 | 2,700 |
| Number of enrollees losing access to their plan | 414,710 | 273,665 | 113,968 | 26,602 | – | 475 | – |
| Average premiums of MA-PDs, weighted by 2016 enrollment | |||||||
| Premiums for all plans, 2016 | $37.24 | $27.61 | $61.59 | $55.82 | $32.89 | $112.38 | $0.00 |
| Terminating plans, 2016 | $41.83 | $25.41 | $78.57 | $52.76 | N/A | $71.02 | N/A |
| Staying plans, 2016 | $37.08 | $27.69 | $60.60 | $56.23 | $32.89 | $112.42 | $0.00 |
| 2017 Premiums for remaining 2016 plans | $38.61 | $29.12 | $62.41 | $60.96 | $34.53 | $112.68 | $0.00 |
| Change in premiums for plans available in both 2016 and 2017 | $1.53 | $1.44 | $1.82 | $4.73 | $1.64 | $0.26 | $0.00 |
| Share of enrollees in MA-PDs with no premiums, among plans available in both 2016 and 2017 | |||||||
| 2016 | 49% | 59% | 24% | 8% | 45% | 1% | 100% |
| 2017 | 48% | 58% | 24% | 8% | 45% | 1% | 100% |
| Change in share of plans with no premiums | -1% | -1% | 0% | 0% | 0% | 0% | 0% |
| Average premiums paid per enrollee, among MA-PDs with premiums (excluding zero premium plans) and available in both 2016 and 2017 | |||||||
| 2016 | $73.11 | $67.99 | $79.98 | $60.91 | $59.60 | $113.90 | N/A |
| 2017 | $74.84 | $69.39 | $82.29 | $66.03 | $62.58 | $114.16 | N/A |
| Average out-of-pocket spending limits per year among MA-PDs, weighted by 2016 enrollment, among plans available in both 2016 and 2017 | |||||||
| 2016 | $5,204 | $4,974 | $5,661 | N/A | $6,595 | $3,538 | N/A |
| 2017 | $5,235 | $4,974 | $5,817 | N/A | $6,605 | $3,698 | N/A |
| Change in average out-of-pocket spending limits | $32 | $1 | $156 | N/A | $10 | $160 | N/A |
| Total MA-PD enrollees, as of September 2016 | 11,668,604 | 8,343,955 | 2,032,438 | 132,299 | 951,002 | 208,910 | – |
| Number of staying MA-PDs’ enrollees | 11,284,612 | 8,072,317 | 1,920,084 | 132,299 | 951,002 | 208,910 | – |
| Number of enrollees losing access to their MA-PD | 383,992 | 271,638 | 112,354 | – | – | – | – |
| NOTE: Excludes Special Needs Plans (SNPs), demonstrations, Health Care Prepayment Plans (HCPPs), Program of All Inclusive Care for the Elderly (PACE) plans, employer-sponsored (i.e., group) plans, and plans for special populations.SOURCE: Authors’ analysis of CMS’s Landscape Files for 2016 and 2017 and CMS’s 2016 and 2017 Part C and D Crosswalk file and September 2016 enrollment. | |||||||
| Table A2. Average Number of Plans Available to Beneficiaries by County of Residence, 2009-2017 | |||||||||
| 2009 | 2010 | 2011 | 2012 | 2013 | 2014 | 2015 | 2016 | 2017 | |
| National Average | 48 | 33 | 24 | 20 | 20 | 18 | 18 | 19 | 19 |
| Metro counties | 51 | 35 | 26 | 22 | 22 | 20 | 20 | 21 | 21 |
| Non-metro counties | 36 | 24 | 16 | 13 | 13 | 11 | 10 | 11 | 11 |
| Fee-for-Service Costs, by Quartile | |||||||||
| Lowest cost quartile | 45 | 28 | 18 | 17 | 17 | 17 | 15 | 15 | 15 |
| Second quartile | 46 | 31 | 20 | 17 | 16 | 15 | 14 | 15 | 15 |
| Third quartile | 44 | 30 | 20 | 17 | 18 | 16 | 16 | 17 | 17 |
| Highest cost counties | 53 | 37 | 30 | 24 | 24 | 21 | 22 | 23 | 23 |
| NOTE: Excludes SNPs, employer-sponsored (i.e., group) plans, demonstrations, HCPPs, PACE plans, and plans for special populations.SOURCE: Authors’ analysis of CMS’s Landscape and Penetration Files for 2009 – 2017. | |||||||||
| Table A3. Unweighted Average Monthly Premiums for Medicare Advantage Prescription Drug Plans, by Plan Type, 2009-2017 | ||||||||||
| 2009 | 2010 | 2011 | 2012 | 2013 | 2014 | 2015 | 2016 | 2017 | Change, 2016-2017 | |
| All Plans | $51.81 | $55.86 | $50.61 | $49.80 | $51.43 | $51.47 | $53.42 | $52.57 | $50.97 | -$1.60 |
| HMOs | $34.52 | $40.11 | $36.24 | $33.20 | $34.11 | $35.37 | $38.28 | $39.14 | $38.81 | -$0.33 |
| Local PPOs | $65.12 | $70.17 | $65.72 | $69.14 | $72.57 | $74.92 | $81.02 | $78.61 | $72.91 | -$5.70 |
| PFFS plans | $74.46 | $75.09 | $65.79 | $70.96 | $83.29 | $90.93 | $87.86 | $91.40 | $92.43 | $1.03 |
| Regional PPOs | $55.68 | $59.29 | $53.38 | $55.64 | $56.89 | $59.30 | $67.85 | $74.93 | $80.84 | $5.91 |
| NOTE: Excludes SNPs, demonstrations, HCPPs, PACE plans, employer-sponsored (i.e., group) plans, and plans for special populations. Premiums include plans with premiums as well as plans with no premiums. Cost plans are included in the total but are not shown separately.SOURCE: Authors’ analysis of CMS’s Landscape Files for 2009 – 2017. | ||||||||||
| Table A4. Number of Medicare Advantage Plans Available, by Plan Type and Firm, 2015-2017 | ||||||||||||||||||
| All | HMOs | Local PPOs | PFFS Plans | Regional PPOs | Cost Plans | |||||||||||||
| 2015 | 2016 | 2017 | 2015 | 2016 | 2017 | 2015 | 2016 | 2017 | 2015 | 2016 | 2017 | 2015 | 2016 | 2017 | 2015 | 2016 | 2017 | |
| Number of Plans – Total | 1945 | 2001 | 2034 | 1275 | 1351 | 1387 | 465 | 461 | 469 | 69 | 57 | 48 | 43 | 47 | 49 | 86 | 81 | 77 |
| UnitedHealthCare | 164 | 223 | 272 | 132 | 187 | 234 | 22 | 24 | 25 | 2 | 2 | 2 | 8 | 10 | 11 | 0 | 0 | 0 |
| Humana | 395 | 362 | 337 | 195 | 184 | 164 | 116 | 106 | 105 | 53 | 41 | 37 | 31 | 31 | 31 | 0 | 0 | 0 |
| BCBS – Total | 291 | 311 | 316 | 163 | 189 | 194 | 110 | 110 | 109 | 4 | 2 | 3 | 4 | 4 | 4 | 6 | 6 | 6 |
| Anthem BCBS | 54 | 62 | 65 | 35 | 45 | 48 | 16 | 14 | 14 | 0 | 0 | 0 | 3 | 3 | 3 | 0 | 0 | 0 |
| Other BCBS plans | 237 | 249 | 251 | 128 | 144 | 146 | 94 | 96 | 95 | 4 | 2 | 3 | 1 | 1 | 1 | 6 | 6 | 6 |
| Kaiser Permanente | 39 | 41 | 41 | 34 | 34 | 34 | 0 | 0 | 0 | 0 | 0 | 0 | 0 | 0 | 0 | 5 | 6 | 6 |
| Aetna | 195 | 203 | 233 | 121 | 119 | 113 | 74 | 82 | 117 | 0 | 0 | 0 | 0 | 2 | 3 | 0 | 0 | 0 |
| WellCare | 40 | 49 | 50 | 40 | 49 | 50 | 0 | 0 | 0 | 0 | 0 | 0 | 0 | 0 | 0 | 0 | 0 | 0 |
| Cigna | 43 | 46 | 43 | 40 | 43 | 41 | 3 | 3 | 2 | 0 | 0 | 0 | 0 | 0 | 0 | 0 | 0 | 0 |
| Other | 778 | 766 | 742 | 550 | 546 | 557 | 140 | 136 | 111 | 10 | 12 | 6 | 0 | 0 | 0 | 75 | 69 | 65 |
| NOTE: Excludes SNPs, demonstrations, HCPPs, PACE plans, employer-sponsored (i.e., group) plans, and plans for special populations. BCBS are BlueCross BlueShield affiliates, which includes Anthem BCBS plans. Total includes MSAs, which are not shown separately. For earlier years of data, see See Jacobson G, Gold M, Damico A, Neuman T, and Casillas, G. “Medicare Advantage 2016 Data Spotlight: Overview of Plan Changes.” December 2015. https://www.kff.org/medicare/issue-brief/medicare-advantage-2016-data-spotlight-overview-of-plan-changes/SOURCE: Authors’ analysis of CMS’s Landscape Files for 2015 – 2017. | ||||||||||||||||||
| Table A5. Share of Medicare Beneficiaries with Access to Firms’ Medicare Advantage Plan Offerings, by Plan Type and Firm, 2015-2017 | ||||||||||||||||||
| Any Plan | HMOs | Local PPOs | PFFS Plans | Regional PPOs | Cost Plans | |||||||||||||
| Firm | 2015 | 2016 | 2017 | 2015 | 2016 | 2017 | 2015 | 2016 | 2017 | 2015 | 2016 | 2017 | 2015 | 2016 | 2017 | 2015 | 2016 | 2017 |
| UnitedHealthcare | 69% | 70% | 74% | 49% | 55% | 61% | 18% | 13% | 10% | 2% | 2% | 2% | 32% | 32% | 33% | 0% | 0% | 0% |
| Humana | 86% | 85% | 83% | 56% | 58% | 56% | 54% | 53% | 58% | 44% | 43% | 39% | 61% | 61% | 61% | 0% | 0% | 0% |
| BCBS – Total | 71% | 72% | 72% | 54% | 58% | 58% | 46% | 45% | 41% | 1% | 1% | 3% | 15% | 15% | 15% | 2% | 2% | 2% |
| Anthem BCBS plans | 21% | 24% | 24% | 15% | 20% | 22% | 9% | 9% | 8% | 0% | 0% | 0% | 8% | 8% | 8% | 0% | 0% | 0% |
| Other BCBS plans | 58% | 55% | 55% | 46% | 44% | 43% | 37% | 36% | 33% | 1% | 1% | 3% | 7% | 7% | 7% | 2% | 2% | 2% |
| Kaiser Permanente | 15% | 17% | 17% | 13% | 13% | 13% | 0% | 0% | 0% | 0% | 0% | 0% | 0% | 0% | 0% | 2% | 2% | 2% |
| Aetna | 45% | 49% | 56% | 42% | 43% | 45% | 33% | 40% | 52% | 0% | 0% | 0% | 0% | 7% | 7% | 0% | 0% | 0% |
| Wellcare | 25% | 32% | 29% | 25% | 32% | 29% | 0% | 0% | 0% | 0% | 0% | 0% | 0% | 0% | 0% | 0% | 0% | 0% |
| Cigna | 19% | 20% | 20% | 19% | 20% | 20% | 2% | 2% | 1% | 0% | 0% | 0% | 0% | 0% | 0% | 0% | 0% | 0% |
| Others | 79% | 79% | 79% | 73% | 73% | 73% | 30% | 34% | 28% | 4% | 4% | 3% | 0% | 0% | 0% | 6% | 6% | 5% |
| NOTE: Excludes SNPs, demonstrations, HCPPs, PACE plans, employer-sponsored (i.e., group) plans, and plans for special populations. BCBS are BlueCross BlueShield affiliates, which includes Anthem BCBS plans. Any plan includes beneficiaries with access to an MSA (not shown separately). For earlier years of data, see See Jacobson G, Gold M, Damico A, Neuman T, and Casillas, G. “Medicare Advantage 2016 Data Spotlight: Overview of Plan Changes.” December 2015. https://www.kff.org/medicare/issue-brief/medicare-advantage-2016-data-spotlight-overview-of-plan-changes/SOURCE: Authors’ analysis of CMS’s Landscape Files for 2015 – 2017. | ||||||||||||||||||
| Table A6. Number and Type of Special Needs Plans, by State, 2016 and 2017 | ||||||||||||||||||||
| 2016 | 2017 | |||||||||||||||||||
| State | Overall | Dual eligibles | Institutional | Chronic conditions | Overall | Dual eligibles | Institutional | Chronic conditions | ||||||||||||
| Alabama | 6 | 4 | 2 | 0 | 6 | 4 | 2 | 0 | ||||||||||||
| Alaska | 0 | 0 | 0 | 0 | 0 | 0 | 0 | 0 | ||||||||||||
| Arizona | 33 | 21 | 4 | 8 | 30 | 19 | 4 | 7 | ||||||||||||
| Arkansas | 7 | 4 | 0 | 3 | 7 | 5 | 0 | 2 | ||||||||||||
| California | 72 | 31 | 4 | 37 | 70 | 28 | 4 | 38 | ||||||||||||
| Colorado | 9 | 4 | 3 | 2 | 9 | 4 | 3 | 2 | ||||||||||||
| Connecticut | 4 | 2 | 2 | 0 | 4 | 2 | 2 | 0 | ||||||||||||
| Delaware | 3 | 1 | 1 | 1 | 6 | 2 | 3 | 1 | ||||||||||||
| District of Columbia | 5 | 2 | 1 | 2 | 9 | 4 | 3 | 2 | ||||||||||||
| Florida | 94 | 58 | 6 | 30 | 97 | 64 | 8 | 25 | ||||||||||||
| Georgia | 14 | 8 | 2 | 4 | 20 | 12 | 3 | 5 | ||||||||||||
| Hawaii | 5 | 5 | 0 | 0 | 6 | 6 | 0 | 0 | ||||||||||||
| Idaho | 1 | 1 | 0 | 0 | 1 | 1 | 0 | 0 | ||||||||||||
| Illinois | 10 | 5 | 2 | 3 | 8 | 3 | 2 | 3 | ||||||||||||
| Indiana | 8 | 4 | 2 | 2 | 6 | 3 | 2 | 1 | ||||||||||||
| Iowa | 0 | 0 | 0 | 0 | 0 | 0 | 0 | 0 | ||||||||||||
| Kansas | 2 | 0 | 1 | 1 | 3 | 1 | 1 | 1 | ||||||||||||
| Kentucky | 13 | 8 | 1 | 4 | 13 | 9 | 1 | 3 | ||||||||||||
| Louisiana | 13 | 9 | 0 | 4 | 11 | 10 | 0 | 1 | ||||||||||||
| Maine | 4 | 2 | 1 | 1 | 4 | 2 | 1 | 1 | ||||||||||||
| Maryland | 10 | 3 | 3 | 4 | 12 | 3 | 5 | 4 | ||||||||||||
| Massachusetts | 9 | 7 | 1 | 1 | 10 | 7 | 2 | 1 | ||||||||||||
| Michigan | 6 | 4 | 1 | 1 | 6 | 4 | 1 | 1 | ||||||||||||
| Minnesota | 9 | 9 | 0 | 0 | 10 | 10 | 0 | 0 | ||||||||||||
| Mississippi | 6 | 4 | 0 | 2 | 6 | 6 | 0 | 0 | ||||||||||||
| Missouri | 12 | 3 | 5 | 4 | 8 | 3 | 3 | 2 | ||||||||||||
| Montana | 1 | 1 | 0 | 0 | 1 | 1 | 0 | 0 | ||||||||||||
| Nebraska | 0 | 0 | 0 | 0 | 1 | 1 | 0 | 0 | ||||||||||||
| Nevada | 7 | 0 | 1 | 6 | 7 | 0 | 1 | 6 | ||||||||||||
| New Hampshire | 1 | 0 | 1 | 0 | 1 | 0 | 1 | 0 | ||||||||||||
| New Jersey | 9 | 4 | 3 | 2 | 11 | 5 | 4 | 2 | ||||||||||||
| New Mexico | 3 | 2 | 1 | 0 | 6 | 6 | 0 | 0 | ||||||||||||
| New York | 53 | 37 | 11 | 5 | 45 | 31 | 11 | 3 | ||||||||||||
| North Carolina | 14 | 7 | 2 | 5 | 9 | 6 | 2 | 1 | ||||||||||||
| North Dakota | 0 | 0 | 0 | 0 | 0 | 0 | 0 | 0 | ||||||||||||
| Ohio | 18 | 11 | 4 | 3 | 18 | 12 | 5 | 1 | ||||||||||||
| Oklahoma | 1 | 0 | 1 | 0 | 1 | 0 | 1 | 0 | ||||||||||||
| Oregon | 11 | 7 | 3 | 1 | 15 | 8 | 6 | 1 | ||||||||||||
| Pennsylvania | 21 | 11 | 6 | 4 | 22 | 13 | 7 | 2 | ||||||||||||
| Puerto Rico | 15 | 13 | 0 | 2 | 16 | 14 | 0 | 2 | ||||||||||||
| Rhode Island | 0 | 0 | 0 | 0 | 3 | 1 | 2 | 0 | ||||||||||||
| South Carolina | 8 | 3 | 1 | 4 | 13 | 5 | 1 | 7 | ||||||||||||
| South Dakota | 0 | 0 | 0 | 0 | 0 | 0 | 0 | 0 | ||||||||||||
| Tennessee | 8 | 7 | 1 | 0 | 8 | 7 | 1 | 0 | ||||||||||||
| Texas | 31 | 22 | 2 | 7 | 36 | 26 | 2 | 8 | ||||||||||||
| Utah | 2 | 2 | 0 | 0 | 2 | 2 | 0 | 0 | ||||||||||||
| Vermont | 0 | 0 | 0 | 0 | 0 | 0 | 0 | 0 | ||||||||||||
| Virginia | 9 | 2 | 3 | 4 | 18 | 9 | 5 | 4 | ||||||||||||
| Washington | 8 | 6 | 2 | 0 | 9 | 6 | 3 | 0 | ||||||||||||
| West Virginia | 1 | 1 | 0 | 0 | 2 | 1 | 1 | 0 | ||||||||||||
| Wisconsin | 18 | 13 | 4 | 1 | 18 | 14 | 3 | 1 | ||||||||||||
| Wyoming | 0 | 0 | 0 | 0 | 0 | 0 | 0 | 0 | ||||||||||||
| Total, U.S. | 550 | 342 | 69 | 139 | 578 | 373 | 83 | 122 | ||||||||||||
| NOTE: Columns do not sum to U.S. total because some SNPs overlap state boundaries.SOURCE: Authors’ analysis of CMS’s Landscape Files for 2016-2017. | ||||||||||||||||||||