Living in an Immigrant Family in America: How Fear and Toxic Stress are Affecting Daily Life, Well-Being, & Health

Authors: Samantha Artiga and Petry Ubri
Published: Dec 13, 2017

Executive Summary

Immigration policy has been and continues to be a controversial topic in the U.S. Over the course of the election and since taking office, President Trump has intensified national debate about immigration as he has implemented policies to enhance immigration enforcement and restrict the entry of immigrants from selected countries the Administration believes may pose a threat to the country. The climate surrounding these policies and this debate potentially affect 23 million noncitizens in the U.S., including both lawfully present and undocumented immigrants, many of whom came to the U.S. seeking safety and improved opportunities for their families.1  They also have implications for the over 12 million children who live with a noncitizen parent who are predominantly U.S-born citizen children.2  We conducted focus groups with 100 parents from 15 countries and 13 interviews with pediatricians to gain insight into how the current environment is affecting the daily lives, well-being, and health of immigrant families, including their children. Key findings include:

For #immigrant families, increased fears are having significant negative effects on the health and well-being of #children.

Immigrant families, including those with lawful status, are experiencing resounding levels of fear and uncertainty. Fears affected participants across backgrounds and locations, with particularly pronounced effects for Latinos and Muslims. Undocumented parents fear being deported and separated from their children while many of those with lawful status feel uncertain about their status and worry they may lose their status or permission to remain in the U.S. These feelings of uncertainty escalated after rescission of the Deferred Action for Child Arrivals (DACA) program in September 2017. Parents said that although they try to shield their children from these issues, many children are hearing about them at school and fear potentially losing their parents to deportation or having to leave the U.S., the only home many have ever known.

“…we wake up every day with the fear of being deported, of the separation of our families, to have to leave the kids.” –Latino Parent, Boston, Massachusetts

“Uncomfortable and unstable; we feel that in any moment a new rule could be issued leading to expelling us and sending us back.” –Arabic-speaking Parent, Anaheim, California

Parents and pediatricians said that racism and discrimination, including bullying of children, have significantly increased since the election. Many felt that Latinos and Muslims have been the primary targets of increased racism and discrimination. They also noted that the increased bullying of children in schools extends beyond immigrants to children of color, regardless of their immigration status.

“They get bullied… told things like, ‘now you and your family will have to leave.’ …And so, even though those kids don’t actually have to worry about their immigration status, I think obviously a child, they don’t know the details of how the system works.” –Pediatrician, Pennsylvania

Daily life has become more difficult for immigrant families due to increased fear and uncertainty. Some parents said that it is harder to find employment in the current environment, further increasing financial strains on families. Increased fears also are affecting some families’ daily routines. Some parents, particularly those who are undocumented or who have an undocumented family member, said they are only leaving the house when necessary, such as for work; limiting driving; and no longer participating in recreational activities, like visiting their local park. As a result, they and their children are spending long hours in the house behind locked doors. Parents also indicated that they and their children are increasingly fearful of interacting with police or authorities.

“Before, there were many kids in the parks… but now… the kids spend more time inside these days, because we are afraid of being deported.” –Latino Parent, Boston, Massachusetts

“My spouse does not go out of the house… The last thing she wants is to get stopped and that they start asking her questions…” –Latino Parent, San Diego, California

Most parents said they are continuing to access health care for their children and maintaining their children’s Medicaid and CHIP coverage, but there were some reports of changes in health care use and decreased participation in programs. Parents note that they highly prioritize their children’s health and generally view hospitals and doctors’ offices as safe spaces. However, there were some reports of changes in health care use, including decreased use of some care, and decreased participation in Medicaid and CHIP and other programs due to increased fears.

“The thing is… if you are at the hospital you are safe. They can’t go into a hospital, a school or a church… because it is a sanctuary.” –Latino Parent, Chicago, Illinois

Increased fears are having significant negative effects on the health and well-being of children that have lifelong consequences. Parents and pediatricians reported that children are manifesting fears in many ways. They described behavioral changes, such as problems sleeping and eating; psychosomatic symptoms, such as headaches and stomachaches; and mental health issues, such as depression and anxiety. Parents and pediatricians also felt that fears are negatively affecting children’s behavior and performance in school. Pediatricians uniformly expressed significant concerns about the long-term health consequences of the current environment for children. They pointed to longstanding research on the damaging effects of toxic stress on physical and mental health over the lifespan. They also expressed concerns about negative effects on children’s growth and development, and felt that the current environment is compounding social and environmental challenges that have negative impacts on health.

“When you’re worried every day that your parents are going to be taken away or that your family will be split up, that really is a form of toxic stress… we know that it’s going to have long-term implications for heart disease, for health outcomes for these children in adulthood.”  –Pediatrician, Minnesota

Together these findings show that immigrant families across different backgrounds and locations are feeling increased levels of fear and uncertainty amid the current climate, and that these feelings extend to those with lawful status. The findings show that these fears are having broad effects on the daily lives and routines of some immigrant families. In addition, they point to long-term consequences for children in immigrant families, including poorer health outcomes over the lifespan, compromised growth and development, and increased challenges across social and environmental factors that influence health.

Issue Brief

Introduction

Immigration policy has been and continues to be a controversial topic in the U.S. Over the course of the election and since taking office, President Trump has intensified national debate about immigration as he has implemented policies to enhance immigration enforcement and restrict the entry of immigrants from selected countries the Administration believes may pose a threat to the country (Appendix 1). The climate surrounding these policies and this debate potentially affect 23 million noncitizens in the U.S., including both lawfully present and undocumented immigrants, many of whom came to the U.S. seeking safety and improved opportunities for their families.3  They also have implications for the over 12 million children who live with a noncitizen parent, who are predominantly U.S-born citizen children.4  This brief provides insight into how the current environment is affecting the daily lives, well-being, and health of immigrant families, including their children. The findings are based on focus groups with 100 parents in immigrant families from 15 countries and telephone interviews with 13 pediatricians who serve immigrant communities.

Methods

During Fall 2017, the Kaiser Family Foundation worked with PerryUndem Research/Communication to conduct focus groups with 100 parents in immigrant families. Focus group participants were selected to represent a range of races/ethnicities, countries of origin, and immigration statuses and to provide for geographic diversity of experiences. A total of 10 focus groups were conducted in 8 cities in 4 states (Chicago, Illinois; Boston, Massachusetts; Bethesda, Maryland; and Anaheim, Fresno, Los Angeles, Oakland, and San Diego, California). In addition, 13 telephone interviews were conducted with pediatricians and clinics serving immigrant families. With assistance from the American Academy of Pediatrics, pediatricians were identified who serve different immigrant populations across a range of states (Arkansas, California, District of Columbia, Illinois, Minnesota, North Carolina, Pennsylvania, Texas, and Vermont). The Blue Shield of California Foundation supported the focus groups and interviews conducted in California.

Focus groups were conducted in 5 languages with parents from 15 countries of origin. There were six Spanish-speaking focus groups with parents from Mexico, the Caribbean, and Central and South America; one group with Korean parents; one group with Portuguese-speaking parents from Brazil and Cape Verde; one group with Farsi-speaking parents from Afghanistan; and one group with Arabic-speaking parents from Iraq, Egypt, and Syria. Participants included individuals with a range of immigration statuses, including undocumented individuals, refugees/asylees, and lawful permanent residents (“green card” holders). (See Appendix 2 for an overview of selected immigration statuses.) Four of the groups were held in focus group facilities; the remaining six groups were organized and held in community-based organizations serving the community. Since participants in the groups hosted by community-based organizations were often receiving services through the organization, they generally were connected to more resources and more knowledgeable about their rights compared to the general community.

One-on-one telephone interviews were conducted with pediatricians. Interviewed pediatricians serve a variety of immigrant families, including Latino immigrants from Mexico and Central and South America as well as immigrants from an array of other countries and regions, including Bhutan, Burma, China, India, Korea, Myanmar, Mongolia, Vietnam, Yemen, the Democratic Republic of the Congo, Somalia, Ethiopia, Eritrea, Eastern Europe, and the Middle East.

Key Findings

Overview of Participating Parents and Their Families

Participating parents immigrated to the U.S. to escape war or gang activity in their native countries, for job and educational opportunities, and/or to reunite with family. Some parents told stories of losing loved ones to war or gang violence in their native countries and said they immigrated to the U.S. to find safety. Similarly, refugees and asylees immigrated to escape war or persecution in their native countries. Many parents also noted that their native countries have high rates of poverty, inadequate education systems, and poor job prospects, and that coming to the U.S. provides their families better educational and employment opportunities. Some participants also came to the U.S. to join other family members who had previously immigrated. Participants varied widely in their length of time in the U.S. Some have been in the U.S. for many years, while others arrived more recently. Some came to the U.S. as children and have no experience in their native countries. A number of participants, particularly refugees and asylees escaping war, expressed how grateful they were for the opportunity to be in the U.S.

“They killed three members of my family and… I left.” –Latino Parent, Boston, Massachusetts

“I am Salvadoran and, due to the war, I came here. My brother was killed and then I came here.” –Latino Parent, Boston, Massachusetts

“In Mexico there aren’t opportunities, even for young people. The environment is too violent.”    –Latino Parent, Chicago, Illinois

“Many of us came as children, and we had no idea about the future. Now we have no option but to stay because… we are afraid to go back to a place that we are not familiar with.” –Latino Parent, Bethesda, Maryland

“I’ve been here since I was 6 years-old; I have a daughter who is 6 years-old. I’m not familiar with any other country. I love this country.” –Latino Parent, Bethesda, Maryland

“…my dad brought us here so that way we could have better education.” –Latino Parent, Fresno, California

“The United States government took us in because we were not feeling safe in our countries and because we were being discriminated against. We thank the United States for that.” –Arabic-speaking parent, Anaheim, California

“One of the top reasons is safety in terms of bodily safety, mental, and emotional…” –Afghan Parent, Oakland, California

“…over there [in Mexico], there’s a lot of crime.” –Latino Parent, Fresno, California

Children of participating parents are mostly U.S.-born citizens. Similarly, pediatricians noted that in many families that they serve, the children are U.S. born citizens while one or both parents may be undocumented. Some parents also have older children that they brought with them to the U.S. who either have obtained status under the Deferred Action for Childhood Arrivals (DACA) program or are undocumented, and a few have children who are still in their native country. Parents noted that many of their children have never visited their native countries and that the U.S. is the only home they have known. Children of refugees and asylees include a mix of those that fled to the U.S. with their parents and younger children born in the U.S.

Finances and language barriers are a major concern for many participants. Participants generally have at least one worker in the family, often in service, construction, or landscaping jobs. Many noted that they are trying to find as much work as possible, but still are living paycheck to paycheck. They noted that the costs of rent and groceries continue to increase, making it difficult to make ends meet. Participants who arrived to the U.S. more recently, particularly those from Middle Eastern countries, described challenges assimilating to life in the U.S., noting the pressure to find employment quickly and the difficulty they face finding a job due to language and cultural barriers. Some noted that they had professional careers in their native countries and have had to work in less-skilled service jobs here in the U.S. as they become established.

Fears and Concerns Among Families

Parents and pediatricians said that fears of deportation and overall feelings of uncertainty have increased since the presidential election. Parents who are undocumented or who have an undocumented family member expressed growing fears that they will be separated from their children and/or spouse. Some also fear returning to their native country because of the violence and gang activity there. A number of participants have friends and/or family members who were recently detained or deported. They also described recent immigration raids and enforcement activity in their neighborhoods, along roadsides, and in their workplaces. One pediatrician noted that, although these fears among undocumented immigrants often are perceived to primarily affect Latinos, there are growing numbers of undocumented Asians who also are feeling increased fear.

“The area where I live… the majority of raids happen there. And we hear many cases about deporting people from their apartments in that area… The community is so scared.” –Latino Parent, Bethesda, Maryland

“If my husband is deported, how am I supposed to live here without him? There is no way. It breaks up a whole family.” –Portuguese-speaking Parent, Boston, Massachusetts

“…we wake up every day with the fear of being deported, of the separation of our families, to have to leave the kids.” –Latino Parent, Boston, Massachusetts

“…I am both mom and dad for my children… So, I must be there, and I think, God forbid it, but if I get detained, they will deport me…” –Latino Parent, Chicago, Illinois

“…everybody is afraid because they have their lives here. They don’t have papers, but they’ve got their life here and they don’t have anything in Mexico anymore because, I mean, it’s years ago. There’s no way they can support themselves over there.” –Latino Parent, Fresno, California

“It happened to me several times where you hear somebody knock on your door and they pick up your relatives and they take them and they lock them up.” –Latino Parent, Fresno, California

“They’re putting more pressure at the border. They check everything.” –Latino Parent, San Diego, California

“I think everybody is a lot more scared. There’s more fear in me personally speaking… now I feel it personally. Not before, but now I do.” –Latino Parent, Los Angeles, California

“The worst fears are that they’re going to separate us… that they’re going to be separating families.” –Latino Parent, Los Angeles, California

Feelings of increased fear and uncertainty extend to those with lawful status. For example, Korean parents in Chicago and Afghan parents in Oakland said they feel having a green card is no longer sufficient and that they need to obtain citizenship to secure their status. Some said that, even with a green card, they no longer feel safe traveling out of the country because they worry that they will have problems reentering the U.S. Some parents also said that it has become more difficult to obtain citizenship since the election, and that the length of time to obtain a green card or citizenship has increased. Arabic-speaking parents and a number of pediatricians reported that refugees and asylees feel unstable and worry about whether they will be able to remain in the country. Pediatricians emphasized that refugees and asylees come from histories of government persecution and that it is difficult for them to trust that they will remain protected. In addition, some parents expressed concerns that the government might eliminate Temporary Protected Status (TPS) for people from Nicaragua, El Salvador, and Honduras.5  Some parents said that, although current policies have not affected them, they are worried that rules may change, causing them to lose status or permission to remain in the U.S.

“I feel unsettled. Even though we already have the green card, if we do not apply for citizenship, I don’t think we can be at ease.” –Korean Parent, Chicago, Illinois

“Before this, we were living here with permanent residency without citizenship and we thought it wouldn’t be a problem… but after Trump was elected, I thought, if I want to live here and raise my son, I will need to apply for citizenship.” –Korean Parent, Chicago, Illinois

“Uncomfortable and unstable; we feel that in any moment a new rule could be issued leading to expelling us and sending us back.” –Arabic-speaking Parent, Anaheim, California

“There’s no stability. [The President] could write a tweet on Twitter tomorrow and turn things upside down.” –Arabic-speaking Parent, Anaheim, California

“…The new laws being approved, they have us with a sense of uncertainty… TPS… DACA, what’s gonna happen in six months?” –Latino Parent, Bethesda, Maryland

“The concern is that today it’s one group, and tomorrow it can be another. We may be happy today that we’ve been left alone, but tomorrow might be another story.” –Afghan Parent, Oakland, California

“When President Trump was elected there was just huge, huge fear in our refugee communities and our immigrant communities. It didn’t matter that they had legal status…” –Pediatrician, Vermont

“Even if they, themselves, may not be directly at risk because they should be in an immigration status that helps them, especially for refugees, they are so used to being afraid of government and distrustful of government…” –Pediatrician, California

Parents and pediatricians noted particular concerns among individuals that have obtained DACA. In the focus groups that were conducted prior to the rescission of DACA, parents expressed concerns about the security of DACA, fearing that it would be eliminated. In the groups conducted after the rescission of DACA, parents reported that fear and uncertainty among individuals with DACA had intensified, with many worrying about their current situation and losing hope for the future.

“The kids who are in school are also worried, the ones who are going to college, because we don’t know what will happen with DACA…”—Latino Parent, Boston, Massachusetts

“I speak in the case of DACA. Everybody is on the right path. Everybody is studying, but they still face risks. So it can happen to any of us… Everything depends on [the President] and on the laws they create.” –Portuguese-speaking Parent, Boston, Massachusetts

“It’s going backwards, because everything Obama helped the dreamers– well now everyone is scared because Trump wants to take that away…” –Latino Parent, San Diego, California

“…she was able to get DACA… if she won’t be able to renew it, she’s thinking they’re going to come and pick her up because they have all of her information.” –Latino Parent, Los Angeles, California

“…I have two cousins and they were under DREAM Act… they all have jobs and they were going to schools and… they know their whole lives here. And then for that to all just be taken away.”     –Latino Parent, Fresno, California

“I know someone with DACA who recently got it and…since he got his work permit a lot of doors opened up for him… So his dreams were like enormous, but now stopping DACA, he is so afraid.” –Latino Parent, Bethesda, Maryland

“[I was] in [the DACA application] process when we heard the news. It was really painful… I was doing things right, out on my own… to look for a future for me and my kids. So it’s like depression comes in—what am I going to do now?” –Latino Parent, Bethesda, Maryland

“Recently also, I have a couple of patients… more than a couple… who I’ve talked with recently, who are DACA recipients that are feeling very much unsure as to what their future is going to be.” –Pediatrician, District of Columbia

Parents varied in the levels of fear they felt. A variety of factors influenced the level of fear felt by parents, including their and their family members’ immigration statuses; experiences in their native countries; reasons for immigrating to the U.S.; length of time in the U.S.; the extent of diversity, support, and leadership in their local communities; and exposure to deportations and immigration raids. For example, some participants in California who were from Mexico noted a willingness to reestablish their lives in Mexico if they or a family member was deported, particularly those in San Diego who are close to the border. In contrast, participants from other countries who came to the U.S. to escape war and/or persecution said that returning to their native country is not an option. Parents who have been living in the U.S. for many years generally felt more secure than those who had arrived more recently. Parents connected to local community organizations felt they are more informed about their rights compared to others in the community and that rumors spread through social media or word of mouth often lead to increased fears and panic based on misinformation. One pediatrician noted that, among Asian communities, there is reluctance to talk about immigration status, which limits sharing of information and may contribute to increased fears stemming from rumors or misinformation.

“…the Latino communities here in the valley, specifically here in Fresno, perhaps you don’t feel supported because our leaders, our community leaders, they haven’t achieved the level to be able to offer the support to everyone.” –Latino Parent, Fresno, California

“That is the problem with many people, they don’t get informed, they don’t look for the real information. They are only based on what they heard on the news or what their friend told them.” –Latino Parent, Chicago, Illinois

Children are also feeling increased fear and uncertainty about potentially losing their parents to deportation or having to return to their parents’ native countries. Parents across the groups, including those with lawful status, recounted stories of their children and children in their community coming home in tears immediately after the presidential election and worrying about what would happen to them and if they would have to leave the country. Parents said that, although they try to shield their children from these issues, many children are hearing about them at school. Parents also said that some children have expressed fears and concerns about their parents’ home countries, noting that the U.S. is the only home they know.

“…after Trump was elected, children cried at school and said they had to migrate to Canada. The children talk about it among themselves a lot.” –Korean Parent, Chicago, Illinois

“After the inauguration, my youngest ones were crying because they thought I was going to be deported…” –Latino Parent, Chicago, Illinois

“My children would come home from school and say that at school they were saying that all parents would be deported…” –Portuguese-speaking Parent, Chicago, Illinois

“All the children, even if they were born here, are fearful. They fear that anytime they’ll come back from school and won’t find their parents there.” –Latino Parent, Chicago, Illinois

“And so she’s gotten sad. And she’s even cried just watching the news and seeing how immigration is doing raids and how they pick people up.” –Latino Parent, Fresno, California

“….she worries too much, more than what kids should worry about. I mean she’s just a little girl. I mean you can’t really tell her to not worry.” –Latino Parent, Fresno, California

“[My son] age 15… asks, ‘how am I going back to Brazil if I have to start all over again?…’ He says… ‘If I return, I have to start over and lose a lot of time, and I don’t know if I would adapt there again.’” –Portuguese-speaking Parent, Boston, Massachusetts

“Well my kids got scared for me. You know, when Donald Trump won, the youngest one hugged me and said ‘mom, you don’t have any of your papers.’” –Latino Parent, Los Angeles, California

“I think there’s just general fear and uncertainty that even kids that are in not-mixed citizenship status families, but… are either children of color or children who are Latino or children whose family prefer to speak Spanish…” –Pediatrician, North Carolina

“Honestly, it’s not just undocumented families… but also families where kids are LPRs [Lawful Permanent Residents] or have refugee status. I mean even those families—parents have come to me and said that their kids have been worried.” –Pediatrician, Pennsylvania

“…now to have these increased fears about whether or not they’re going to see their parents at the end of the day, are they going to be able to finish school, are they going to have to move…?  There is a tremendous amount of anxiety.” –Pediatrician, California

Participants and pediatricians said that racism and discrimination, including bullying of children of color in schools, have significantly increased since the election. A number of parents said their personal experiences with racism and discrimination have increased since the election and described recent incidents affecting themselves, friends, and/or family members. Many felt that Latinos, particularly Mexicans, and Muslims have been the primary targets of increased racism and discrimination. They also noted that bullying has increased for children in schools and that it extends beyond immigrants to children of color, regardless of their immigration status.

“There has always been racism, but right now it has come up to the surface.” –Latino Parent, Chicago, Illinois

“When I travel to places like the West or a place without Koreans or ethnically homogenous, when it is predominately white, I am a little scared.” –Korean Parent, Chicago, Illinois

“There are some racist people that became more comfortable since Trump was elected, and they express their hate towards immigrants more freely now.” –Arabic-speaking Parent, Anaheim, California

“…Where I work, I see personally that people discriminate me… and I have to intervene for my employees. I didn’t have to do it before, but now it’s like a rebirth of discrimination.” –Latino Parent, Bethesda, Maryland

“I work in landscaping, and we’re working and they see you working…and they just start yelling stuff at you…” –Latino Parent, Fresno, California

“…the thing is, this President, ever since he’s made some comments that are very racist, now people that are from here in Fresno and wherever you go…now they’re also going against us.”  –Latino Parent, Fresno, California

“…I think before Trump there was not as much discrimination as right now.” –Latino Parent, San Diego, California

“….my sister-in-law was at work and they forbade her from speaking Spanish.” –Latino Parent, San Diego, California

“After the inauguration, my daughter…could not be OK at school because there is a lot of racism.” –Latino Parent, Chicago, Illinois

“I have had both patients and parents just voluntarily tell me that their kids are facing more bullying.” –Pediatrician, Minnesota

“They get bullied…told things like, ‘now you and your family will have to leave.’….And so, even though those kids don’t actually have to worry about their immigration status, I think obviously a child, they don’t know the details of how the system works.” –Pediatrician, Pennsylvania

“…the fear of being one’s self—is it okay to be Muslim, to wear a hijab?—a lot of the kids are getting bullied for the way they look, the way they dress, their cultural identity, and so there’s a lot of anxiety.” –Pediatrician, California

Effects on Daily Lives

Some families, particularly those with an undocumented family member, are making changes in their daily lives and routines in response to fear of deportation. Some said that they only leave the house when necessary, for example, to work; that they limit their driving or only have people with legal status drive; and/or that they limit time out in their neighborhood. For example, parents in Boston said that families used to fill their local park with picnics and barbeques on the weekends but that it now sits empty. A number of parents and pediatricians indicated that families now spend long hours inside their homes behind locked doors, fearful whenever anyone comes to the door. Some parents and pediatricians also noted that school attendance declined immediately after the election and that it dips after an immigration raid or if there is a rumor of a raid in the community. Parents in Maryland and California said that some of the schools sent letters to reassure families of their safety in school, which they believe helped relieve fears. Families also are increasingly fearful of police and authorities, and some parents and pediatricians expressed concerns that individuals may be less likely to report assault, abuse, or other crimes. Other participants, particularly those who have lived in the U.S. for many years and who live in diverse communities with strong support, said that they are carrying on with their daily lives and regular routines despite increased fears.

“Before, there were many kids in the parks… but now… The kids spend more time inside these days because we are afraid of being deported.” –Latino Parent, Boston, Massachusetts

“We are fearful of opening the door or of seeing through the hole on the door who it is…” –Latino Parent, Boston, Massachusetts

“I am also concerned because if anything happens to us on the street, if we get assaulted or something, we won’t even be able to call the police because they will see we are immigrants.”      –Latino Parent, Boston, Massachusetts

“…but now around six or seven in the evening you won’t find anyone in [the neighborhood]… due to the fear we all feel about what is going to happen.” –Latino Parent, Chicago, Illinois

“My spouse does not go out of the house… The last thing she wants is to get stopped and that they start asking her questions…” –Latino Parent, San Diego, California

“Nowadays people are avoiding walking in certain places.” –Portuguese-speaking Parent, Boston, Massachusetts

“…most of them didn’t go to school on the first day after he won because everyone was afraid of something happening.” –Latino Parent, Boston Massachusetts

“At schools, they get up every morning with that fear of dropping their kids off, thinking that maybe they’re going to be detained.” –Latino Parent, Fresno, California

“When I’m driving, and [my son] sees a policeman, he starts to get really nervous, he’s very nervous.” –Latino Parent, Los Angeles, California

“We’ve been sent notes from the schools that we shouldn’t worry… and that we shouldn’t have any fears about sending the kids to school.” –Latino Parent, Los Angeles, California

“…when, in the Latino community, there is a message out to the community that ICE is making, is doing raids, then everybody stops, they stop sending their kids to school and they stop coming into the clinic.” –Pediatrician, California

Many participants said it is more difficult to find employment in the current environment, exacerbating financial challenges. A number felt that employment options had become more limited since the presidential election. They noted that fewer work permits are available and permits are not being renewed. Some also said that increased verification procedures by employers are causing some people to lose jobs, sometimes jobs they have held for many years. Given these challenges, participants said they now often have to go outside of their neighborhoods or community and/or travel long distances to find work, which increases commuting time and costs and makes child care more difficult. In some cases, individuals are no longer seeking work because they fear exposing themselves to authorities. Similarly, some parents in Maryland said they are fearful of volunteering in their children’s schools because the schools have documentation and background checks for parent volunteers.

“Right now, mostly, they are not giving permits; they want us to leave. So when we don’t have a work permit, nobody hires us.” –Latino Parent, Boston, Massachusetts

“The work situation is getting more difficult… if they know you don’t have documents… they start questioning why you are working there…” –Latino Parent, Chicago, Illinois

“It is more difficult to find a job, and we wake up every day with the fear of being deported, of the separation of our families, to have to leave the kids.” –Latino Parent, Boston, Massachusetts

“I would like to find another job, and it’s difficult to be able to go look for work because you don’t feel that same kind of trust or security that you had in previous years where you would just go and leave your information.” –Latino Parent, Bethesda, Maryland

“Many times I don’t work… because I feel I am safer just here in my house. And sometimes what my husband earns isn’t enough and so you have to limit yourself in many things.” –Latino Parent, Bethesda, Maryland

“Because I was working at a company that was a more or less big company… and I had to leave, because they said they were going to check out our documentation.” –Latino Parent, Los Angeles, California

Some parents have arranged for their children’s care in case they are detained or deported, while others are uncertain and fearful about what would happen to their children. Some parents have acquired power of attorney letters to authorize family members or friends to become their children’s guardians in case of detention or deportation. Some also reported receiving requests from neighbors, family members, and/or friends to become guardians for their children. However, other parents said they do not know who would care for their children if they were detained or deported and/or that they do not have friends or family here in the U.S. that they could turn to for help. One pediatrician noted that some parents were asking if they could designate the children’s hospital as a guardian for children with complex needs because they had no one else who could provide the level of care their children need.

Effects on Children’s Health and Well-Being

Increased fear among children is manifesting in many ways, including behavioral issues, psychosomatic symptoms, and mental health issues. Parents and pediatricians reported that fears are contributing to behavioral issues among children, including problems sleeping and eating, regression, increased restlessness and agitation, and withdrawal from family and friends. Children also are experiencing psychosomatic symptoms, including headaches, stomachaches, nausea, and vomiting. In addition, parents and pediatricians indicated that some children are experiencing anxiety, having panic attacks, displaying symptoms of depression, and/or expressing an overall loss of hope for the future. For example, one pediatrician recounted how a child whose father had been deported starting having panic attacks because she was afraid she would also lose her mother and be placed into foster care. Another pediatrician noted that, after the election, “fear of Trump” emerged as a chief complaint in her daily schedule.

“…they don’t express how they feel, they just try to stay close to mom, so she doesn’t go away. If she goes anywhere, then they go with her…” –Latino Parent, Boston, Massachusetts

“Mine is six. I’m not sure if he realizes what is going on, but he gets scared when I tell him I am going to travel. He tells me not to go because he says I am not coming back, that he won’t see me again.” –Portuguese-speaking Parent, Boston, Massachusetts

“…I would go to the library, we would go on the bus, but she said, ‘if we go to the library, immigration is going to take you, let’s not go.’ And so it showed me that her fear is so great that she would rather just not go to the library.” –Latino Parent, Bethesda, Maryland

“They come in with a physical complaint and then we get to the bottom of it, and the bottom of it is anxiety.” –Pediatrician, California

“…But losing… that supporter, that sort of emotional and financial supporter has been really difficult. Those are the families that I’d say probably when it comes to mental health issues, where I see that more intensely, where it’s… more dramatic in terms of the change, the shift in the child either being more withdrawn or acting out more, or being more anxious…”                    –Pediatrician, District of Columbia

“We had a lot of sleep problems that we’re helping kids with and helping parents with. We had a lot of children who were crying and maybe had some regressive behaviors.” –Pediatrician, Vermont

“So you can see some regressions in their development. Maybe they were potty-trained before and now they aren’t, maybe they were no longer wetting the bed at night and suddenly they are, maybe they’re more clingy than they were…” –Pediatrician, Texas

“…So children who might have sort of nonspecific symptoms like stomach pain or headaches.  And then when you talk to them, it’s because they’ve become really worried about their family and their parents and what’s going to happen to them.” –Pediatrician, Pennsylvania

“The kids who come in with concerns that you can kind of trace back to anxiety are usually the upper elementary age students, like the 3rd, 4th graders, to middle school students… 7th and 8th grade, who have nonspecific complaints like abnormal pain or headaches or decreased appetites… And then, in kids that are in the junior high to high school age range, it’s a little more overt: sadness, decreased appetite, not wanting to engage in usual activities, decreased in-school performance, those sorts of things.” –Pediatrician, Arkansas

Parents and pediatricians expressed concerns that increased fear and stress is negatively affecting some children’s performance in school. Parents and pediatricians said some children are having increased difficulty paying attention in school because of their stress and worries about potentially losing their parents. A couple of pediatricians noted an increase in school reports of attention-deficit/ hyperactivity disorder (ADHD), which they believe may be attention problems stemming from fear or anxiety. Others noted that some children are having increased behavioral problems that are interfering with their performance in school. For example, one parent noted that his son recently had issues at school resulting from standing up to other students that were bullying other Spanish-speaking students.

“Their grades go down, they don’t go to school with the same enthusiasm they used to. They go to school with fear of not finding their parents when they come back…” –Latino Parent, Boston, Massachusetts

“They start doing worse in school or they have behavior problems in school.” –Pediatrician, Texas

“…so it tends to be that children are either not interested in finishing assignments or in doing other work, because they’re just sort of focused on what the next thing is that’s going to happen to their parent who’s going through a proceeding.” –Pediatrician, Arkansas

Increased fears have also affected the well-being of parents and made it more difficult for them to focus on caregiving. A number of parents reported that they also are suffering increased anxiety and/or depression due to their fears. Some reported problems sleeping and eating as well as headaches and nausea due to stress and worry. Some pediatricians indicated that, in some cases, these fears have served as triggers for parents who have histories of trauma or persecution leading to depression and/or anxiety. Pediatricians also noted that, as parents experience increased stress and anxiety, they might have more difficulty focusing on caregiving and/or become more withdrawn from their children. A few pediatricians reported concerns about strains on family relationships, particularly when family members have different immigration statuses. For example, a younger sibling in the family may be a U.S.-born citizen while an older sibling may be undocumented or have DACA status.

“I had many nightmares. I would often dream immigration would come, and I would cry a lot. I would wake up shaking…” –Latino Parent, Chicago, Illinois

“And I got depressed, I was not hungry, I couldn’t sleep, I feared going outside. I would cry sometimes. I was not hungry for several days, it was like I was depressed.” –Latino Parent, Boston, Massachusetts

“Headaches from thinking so much because you just think about what’s going to happen. You think about the future; what if this happens, what am I going to do?” –Latino Parent, Bethesda, Maryland

“I think the anxiety would sort of paralyze people and they wouldn’t be able to parent. They wouldn’t be able to function, some people, because they were so overwhelmed and anxious; couldn’t go to work, couldn’t leave their home…” –Pediatrician, Vermont

Effects on Health Care Use

Most parents indicated that they have not made any changes in how they seek health care for their children in response to increased fears; however, some parents and pediatricians described changes in health care use. Most parents noted they are continuing to obtain health care for their children and that they trust their existing doctors and view their doctors’ offices and hospitals as safe spaces. They also noted that they prioritize obtaining care for their children over their fears. Pediatricians also reported that, in general, patients are continuing to get care. However, some parents and pediatricians reported declines in visits and/or changes in the timing of visits. For example, some pediatricians have observed decreases in well-child visits, in follow-ups on referrals with providers that families do not have an existing relationship with, and in expectant mothers seeking prenatal care. One pediatrician also reported that some parents are no longer opening their doors or answering phones for home health visits. Another pediatrician felt that parents had shifted from using scheduled visits to walk-in visits because they may be hesitant about providing information to schedule the visit. In Boston, some parents said that they try to schedule their children’s appointments in the morning because they feel like that is the safest time to be outside. In addition, one pediatrician reported that parents are bundling visits together to minimize the frequency of visits and limit their time outside the home. In Fresno, some parents said that they prefer to utilize Latino providers in the current environment.

“The thing is… if you are at the hospital you are safe. They can’t go into a hospital, a school, or a church… because it is a sanctuary.” –Latino Parent, Chicago, Illinois

“…you have to choose a doctor… that’s more Hispanic… the way things are right now with immigration…” –Latino Parent, Fresno, California

“I try now to make my appointments earlier in the morning so as not to stay too long outside. So, I try to do this early and then I stay calmly at home.” –Latino Parent, Boston, Massachusetts

“…We’ve had families… in particular, those families of high needs; saying things… like, ‘okay I have these three specialists appointments that we need to make. Let’s make them on the same day,’ …because they’re worried about being… out in public too often and at the risk of getting detained.” –Pediatrician, District of Columbia

“I think probably the most striking thing is that our home health workers were noticing that when they would knock on doors people weren’t answering…” –Pediatrician, Minnesota

“…We’ve also seen families making meaningful changes in access to care because of concerns about immigration status. So, families whose children need to see specialists who might’ve delayed those specialty appointments because they weren’t comfortable leaving their house or their neighborhood where they felt safe.” –Pediatrician, Pennsylvania

Pediatricians described some actions they are taking to help families feel safe. Pediatricians reported posting signage in their practices to communicate to families that their children are welcome and safe. One noted that the practice has placed bilingual staff outside the entrance to welcome families and ensure they do not encounter any difficulties when entering the clinic. Some indicated that they are taking steps to reassure families that they will keep their information confidential, so that families feel comfortable discussing immigration-related issues during health care visits. A number said that they have undertaken staff training to highlight the importance of confidentiality and best practices for discussing sensitive topics like immigration status. Two pediatricians also indicated that their practices had developed operational protocols so staff know what steps to take if immigration officials enter the practice. Some pediatricians noted that they have hosted events or provided referrals to help families understand their rights and assist families in planning in case they are detained or deported. Many pediatricians also reported writing letters to assist families involved in deportation proceedings.

“…We put posters all over the office stating that you are welcome or all are welcome… We have signs in the entryway… that we don’t discriminate on the basis of immigration status and refugees and immigrants are welcome in our office… And that’s something we implemented after the election…” –Pediatrician, Chicago

“…We created an ‘all are welcome’ button. It was really big effort to make… broad blanket statements that children were welcome… that the community was supporting… and I think that did help refugee families feel that the community would support them…” –Pediatrician, Vermont

“So we’ve seen a huge increase in the number of people that are just asking for letters just to have either for safety reasons or to give to an attorney or something like that.” –Pediatrician, Arkansas

Some pediatricians expressed concerns about the ambiguity of the borders around safe spaces and uncertainty about how to advise families amid the current environment. For example, one pediatrician indicated that while the hospital itself may be safe, it is unclear how far that border extends and whether protection extends to the parking lot. A pediatrician noted that practices near the U.S.-Mexico border are reporting increased presence of border patrol in parking lots of clinics and said that their presence is dissuading parents from bringing their children to clinics. In addition, a few pediatricians highlighted the challenges developing policies and protocols for staff on immigration related issues because the environment is constantly shifting.

Effects on Participation in Medicaid/CHIP and Other Programs

Parents generally reported that they are maintaining Medicaid and CHIP coverage for their children, but there were some reports of decreased participation in Medicaid and CHIP and other programs. Most participants have their children enrolled in Medicaid and CHIP and said that they intend to keep their children enrolled. Parents said they highly value Medicaid and CHIP coverage and that the coverage enables them to access needed care for their children. However, some parents and pediatricians reported that some families with eligible children are less interested in enrolling in Medicaid and CHIP. In addition, one clinic noted that some patients have asked to be disenrolled because they fear they may be putting undocumented family members at risk or jeopardizing family members’ lawful status. Pediatricians noted that they have observed sharper declines in participation in the Women, Infants, and Children (WIC) nutrition program and the Supplemental Nutrition Assistance Program (SNAP). They believe parents are more likely to view WIC and SNAP as federal programs that could expose their information to authorities. Parents and pediatricians also noted ongoing concerns in the community that use of Medicaid, CHIP, and other programs will negatively affect immigration status among those with lawful status or seeking residency or citizenship. Participants felt it would be helpful if official sources made more information available about how use of benefits could affect families’ immigration status. A few pediatricians indicated that they are uncertain about how to advise families on the use of benefits and enrollment in programs since policies could change. For example, one pediatrician indicated that she is more cautious about encouraging families to enroll in SNAP because doing so could potentially have negative consequences if policies change.

“I personally am afraid of trying to get my MassHealth [Medicaid] or something again, due to my permit… They are requesting many documents…” –Latino Parent, Boston, Massachusetts

“…they also ask for all your information and ICE will go to your house and that’s why you don’t apply yet, because they’re asking for all the information on all of your spouses, your children.”   –Latino Parent, San Diego, California

“…since I became a resident they told me don’t ask for anything from the government because the day you go and request your citizenship you can have problems. That’s what I always heard.” –Latino Parent, San Diego, California

“I’ve heard about the food stamps, that if you get the government to help you, it’s going to affect your status.” –Latino Parent, Los Angeles, California

“I’ve started hearing… questions about whether or not they should access services… So a few new moms of newborns asking if they should enroll their child who is a U.S. citizen and born here in this country, if they should enroll their child in WIC. And, even in some circumstances, deciding not to apply even though they would have qualified…” –Pediatrician, District of Columbia

“What I do have more and more families doing is not taking food stamps, not taking WIC, not wanting to take federal services because they’re afraid…” –Pediatrician, Vermont

“We haven’t seen a dip amongst families who are already enrolled, but we have seen families who had not previously applied decide not to move forward [with enrolling in Medicaid or CHIP].” —Pediatrician, Minnesota

“…I have noticed that more and more people who did not used to be afraid of getting… services like SNAP, for instance, are very nervous about that. And so I had two families last week who did not want to get those services even though they were in need…and then one family who was nervous about even reapplying for Medicaid, because… they thought that it would put in jeopardy the father’s ability to get a visa.” –Pediatrician, California

“…I just personally don’t encourage them the same way, whereas before I was much more confident in saying, ‘this isn’t an issue for you, don’t worry, if you enroll your kid who was born here, it won’t affect you at all.’ I don’t know that’s true anymore, so I can’t, I don’t say that with that confidence anymore.” –Pediatrician, California

Most participating parents are uninsured and said they delay or go without care due to cost. Those who are undocumented are not eligible for Medicaid and generally do not have access to private coverage. They primarily rely on clinics, but often avoid seeking care because of cost. Those parents with lawful status were more likely to have coverage, often through Medicaid, and were better able to access needed care.

Long-Term Implications for Children

Pediatricians uniformly expressed significant concerns about the long-term consequences of the current environment for children. They pointed to longstanding research on the damaging effects of toxic stress on physical and mental health over the lifespan (Box 1). They believe that the current environment is creating toxic stress for children and that this stress will result in physiological changes that contribute to increased rates of chronic disease and mental health disorders through adulthood. One pediatrician that serves families near the Mexico border noted that the stress for children in that environment is extreme, particularly because of the constant visual presence of border patrol and militarization of the area, which she says has increased since the presidential election. Pediatricians expressed concerns that declines in participation in WIC and SNAP will negatively affect healthy development of children. Similarly, they cautioned that reductions in health care use could result in more serious and costly conditions. Some pediatricians expressed concerns that the increased amount of time families are spending inside behind locked doors will compromise children’s development and reduce their enrichment opportunities and physical activity. Pediatricians also emphasized that the loss of a parent due to deportation negatively affects health and development of children in multiple ways, including the loss of economic and social support and disruption to the parent-child bond.

“I don’t want these kids to go to school anxious and depressed and not able to concentrate, but I’m also worried what it’s doing to their heart and their liver.” –Pediatrician, District of Columbia

“When you’re worried every day that your parents are going to be taken away or that your family will be split up, that really is a form of toxic stress …we know that it’s going to have long-term implications for heart disease, for health outcomes for these children in adulthood.”  –Pediatrician, Minnesota

“I think that we are going to have a generation of kids, who, especially in our immigrant homes, who are going to have more adverse childhood experiences than they would have. So, I think that we’re just setting up this generation of kids to have higher incidence of chronic disease, higher incidence of poor mental health, higher incidence of addiction…” –Pediatrician, California

“I think a huge worry is that children who have problems that are minor and fixable now… that, if those children go untreated, those could end up being bigger problems in the future that are going to be harder to treat and are really going to impact the child’s quality of life.” –Pediatrician, Pennsylvania

“I think that’s one of the things I worry about the most is, from a longstanding exposure standpoint, is kids losing the opportunity to have any kind of enrichment experiences because families are afraid to do anything that’s not essential. So I think that’s true, especially in the summer where a lot of the families that we took care of, the kids were at home watching TV all day because parents were uncomfortable leaving the house…” –Pediatrician, North Carolina

“If your parents are afraid to go to work, then you’ve got food insecurity issues. If they’re not signing up for different benefits and you’ve got food insecurity issues. …I mean I think this affects children in so many, so many ways that we can’t even understand. So we have children who are hungry, children who are hungry can’t learn. We have children who are stressed, children who are stressed can’t learn. We have children who are in families in need or have parents who are distressed…they’re worried about their parents, they can’t learn. They can’t be normal kids. They can’t play. They can’t develop. They can’t grow.” –Pediatrician, Vermont 

Box 1: Research on Effects of Toxic Stress on Learning, Behavior, and Health

Toxic stress can negatively affect a child’s physical, cognitive, and emotional development. When children experience prolonged and continuous stress, referred to as “toxic stress,” it can damage connections in the brain, resulting in issues with brain development and lifelong negative mental and physical health effects.

A growing body of literature finds that the threat of parental detention and deportation is a toxic stress.6  Children living with the constant threat of their parents’ deportation may have a constant and heightened state of anxiety that does not allow their body to return to baseline functioning. The American Academy of Pediatrics recently warned that the stress of living in fear of deportation among immigrant children could disrupt a child’s developmental processes and lead to long-term health concerns.7 

Research shows that toxic stress has short- and long-term negative effects on physical, mental, and behavioral health.8  In the short term, toxic stress can increase the risk and frequency of infections in children as high levels of stress hormones suppress the body’s immune system. It can also result in developmental issues due to reduced neural connections to important areas of the brain. Toxic stress is associated with damage to areas of the brain responsible for learning and memory. Over the long term, toxic stress may manifest as poor coping skills and stress management, unhealthy lifestyles, adoption of risky health behaviors, and mental health issues, such as depression. Toxic stress also is associated with increased rates of physical conditions into adulthood, including chronic obstructive pulmonary disease, obesity, ischemic heart disease, diabetes, asthma, cancer, and post-traumatic stress disorder.

Pediatricians and parents described how deportation and the rescission of DACA compound challenges for families and increase the risk of cyclical poverty. Pediatricians and parents both noted that losing a family member to deportation often results in loss of family income, leading to financial strains and sometimes food and housing insecurity. One pediatrician noted an increase in homelessness among children due to the loss of family members and income. Pediatricians said that these income losses will increase the likelihood of cyclical poverty among families. They also noted that many individuals with DACA were pursuing education and careers that could potentially move their families out of poverty and that this opportunity is lost with the DACA rescission. They have observed that some adolescents, particularly those who are undocumented or who have DACA, have lost hope for the future and are reconsidering plans to attend college or pursue certain job opportunities. They said this loss of hope and negative future outlook could affect their life choices and limit their potential achievements and economic gains. Parents and pediatricians also expressed concerns that immigrant families may become increasingly alienated from their broader communities as a result of the current environment. Pediatricians worried that this situation may lead families to feel more isolated and that children may face challenges formulating their identities.

“…you’re setting up not only social risk based on immigration status alone, but now also based on all the other social determinants of health. So families who live in a single parent family, meaning one parent was deported and they’re a single parent family are now at risk for poverty, at risk for educational inequity, at risk for all these other things that we know are also adverse childhood experiences, but then further place kids at risk for long-term effects.” –Pediatrician, North Carolina

“In Brownsville we have about 1,700 homeless children in the schools. Many of those children are homeless because of a parent that was deported or placed in detention.” –Pediatrician, Texas

“A lot of these kids are going to face insecurity regarding housing and food and just basic necessities… So long term, the economic and stability and emotional distress…” –Pediatrician, Illinois

“So I think there are a lot of downstream effects… changes in the DACA program don’t affect just the DACA recipient, but their parents if they’re helping out…the children…their siblings, whoever else is in the household…” –Pediatrician, District of Columbia

“…depending on what happens with the DACA program, there are so many kids in our community that were helped by that, that continued through college to get their degrees… I think that would really be a terrible loss for, not just the student and their families, but for our whole community if the work that they were able to do because they got DACA was to be halted where it is.” –Pediatrician, Arkansas

“…My children were born and grew up here and it wasn’t their choice… when they grow up, I am afraid that they might be alienated as well.” –Korean Parent, Chicago, Illinois

“…Not knowing whether or not you can stay, feeling like you don’t belong, not having a foot in, like a toe-hold in a place you can call home. I mean the long-term implications I think it’s just affecting how they formulate their identities.” –Pediatrician, Illinois

Conclusion

Together, these findings show that immigrant families across different backgrounds and locations are feeling increased levels of fear and uncertainty amid the current climate. Parents and children in families with an undocumented family member fear being separated from each other, and those with lawful status worry about the security and stability of their status and whether they may be affected by policy changes in the future. The findings show that these fears are having broad effects on the daily lives and routines of some immigrant families who are fearful to leave their home, limiting their participation in activities, and facing increased employment challenges. In addition, they point to long-term consequences for children in immigrant families, including poorer health outcomes over the lifespan, compromised growth and development, and increased challenges across a range of social and environmental factors that influence health.


This brief was prepared by Samantha Artiga and Petry Ubri with the Kaiser Family Foundation. The authors thank the Blue Shield of California Foundation for its support of the focus groups and interviews conducted in California. They also thank the American Academy of Pediatrics for its assistance in identifying pediatricians to interview for this work. Finally, they express their deep appreciation to the parents and pediatricians who shared their time and experiences to inform this brief.


Appendices

Appendix 1: Recent Changes in Immigration Policy, 2017

Executive Order: “Protecting the Nation from Foreign Terrorist Entry into the U.S.,” January 2017: Suspends entry of nationals from seven Muslim-majority countries — Iraq, Iran, Libya, Somalia, Sudan, Syria, and Yemen—into the U.S. for 90 days as well as all refugees for 120 days (and an indefinite ban on Syrian refugees), with an exception for religious minorities. States and other groups challenged the order, resulting in a temporary restraining order against enforcement of the ban. In March 2017, the Administration revised the order, removing the ban on nationals from Iraq, the indefinite ban on Syrian refugees, and the exception for religious minorities. In June 2017, the Supreme Court permitted a limited version of the revised ban to take effect, but ultimately dismissed legal challenges to the ban before ruling on its merits in October 2017, after the ban expired. In September 2017, the Administration released a new ban targeting primarily Muslim-majority countries—keeping Iran, Libya, Somalia, Syria and Yemen on the list, removing Sudan, and adding Chad as well North Korea and Venezuela. This version of the ban suspended entry of most nationals from these countries indefinitely (except Venezuela, where it is limited to government officials and their family) and enhanced screening and vetting requirements. On December 4, 2017 the Supreme Court, while not ruling on the merits, allowed this ban to go fully into effect while it continues to be challenged in the Fourth and Ninth Circuits and makes its way before the Supreme Court. A fourth ban was issued on October 24, 2017, requiring refugees from 11 Muslim-majority countries—Egypt, Iran, Iraq, Libya, Mali, North Korea, Somalia, Sudan, South Sudan, Syria, and Yemen—to undergo extreme vetting before entering the U.S. and preventing family members of refugees from joining them in the U.S. This ban is also being challenged in federal courts.

Executive Order: “Enhancing Public Safety in the Interior of the US,” January 2017: Expands the category of individuals classified as “priorities for removal,” prioritizing undocumented immigrants who have committed, been charged, or been convicted of a criminal offense, as well as those who have “committed acts that constitute a chargeable offense,” even if they are never convicted of an offense. Also disqualifies “sanctuary cities,” or jurisdictions that limit their role in civil immigration enforcement, from receiving federal grants. Cities are challenging the restriction of federal grants, including law enforcement funding, to “sanctuary cities” in the courts. The U.S. District Court permanently blocked the “sanctuary cities” provision. The Administration later narrowed the scope of the provision, but cities continue to challenge the new conditions on federal grants.

Executive Order: “Buy American Hire American,” April 2017: Encourages employers to verify all new hires through e-verify and calls for reforms to the H1B visa program that allows employers to find workers with highly specialized knowledge outside of the US.

Executive Order to Rescind Deferred Action for Childhood Arrivals (DACA) Program, September 2017: Rescinds DACA, which allowed for certain undocumented youth who came to the U.S. as children to be granted permission to stay in the U.S. and work for temporary renewable periods. DACA has protected nearly 800,0009  undocumented children over the past five years and currently protects nearly 690,000 immigrants.10  The Administration rescinded DACA in September 2017, and is no longer accepting applications for or renewals of DACA.11  Individuals’ DACA and work permits (employment authorization documents) remain valid until their expiration date.

Termination of Temporary Protected Status (TPS) Designation for Sudan, September 2017: Terminates TPS designation for Sudan effective November 2, 2018. Individuals currently residing in the U.S. under this TPS status must obtain an alternative lawful immigration status to remain in the U.S.12 

Termination of TPS Designation for Nicaragua, November 2017: Terminates TPS designation for Nicaragua effective January 5, 2019. Individuals currently residing in the U.S. under this TPS status must obtain an alternative lawful immigration status to remain in the U.S.13 

Termination of Central American Minors (CAM) refugee program, November 2017: Applications for CAM stopped being accepted November 9, 2017, and interviews for CAM cases will end January 31, 2018.14 

Termination of TPS Designation for Haiti, November 2017: Terminates TPS designation for Haiti effective July 22, 2019. Individuals currently residing in the U.S. under this TPS status must obtain an alternative lawful immigration status to remain in the U.S. Haitians with TPS will be required to reapply for Employment Authorization Documents to legally work in the U.S. until the termination date.15 

Appendix 2: Immigration Statuses and Eligibility for Health Coverage

Immigration Statuses

Lawfully present immigrants are non-citizens who are lawfully residing in the U.S. This group includes:

  • Lawful permanent residents (LPRs or “green card” holders): Individuals who have been granted permission to permanently reside and work in the U.S. Individuals may be granted lawful permanent residence while overseas or adjust to permanent status within the U.S.16 
  • Refugees: Individuals who are at risk of or have been subject to persecution in their home countries and are unable to return because they fear serious harm.17  Individuals may be granted refugee status from outside the U.S.; those who flee to the US may seek asylum or withholding of removal once in the U.S.
  • Asylees: Individuals who meet the same definition of refugees but are already in the U.S. or are seeking admission at a port of entry.18 
  • Other individuals who are authorized to live in the U.S. temporarily or permanently.

Undocumented immigrants are foreign-born individuals residing in the U.S. without authorization. This group includes individuals who entered the country without authorization as well as individuals who entered the country lawfully and stayed after their visa or status expired.

The Deferred Action for Childhood Arrivals (DACA) program, which was established in 2012, allowed for certain undocumented youth who came to the U.S. as children to be granted permission to stay in the U.S. for temporary renewable periods. The Administration rescinded DACA in September 2017 and is no longer accepting applications for or renewals of DACA.19 

Eligibility for Health Coverage Programs

Lawfully present immigrants may qualify for Medicaid and CHIP subject to certain restrictions. In general, lawfully present immigrants must have a “qualified” immigration status to be eligible for Medicaid or CHIP and many, including most LPRs or green card holders, must wait five years after obtaining qualified status before they may enroll. Some immigrants, such as those with temporary protected status, are lawfully present but do not have a qualified status and are not eligible. Some immigrants, such as refugees and asylees, do not have to wait five years before enrolling. For children and pregnant women, states can opt to eliminate the five-year wait and extend coverage to lawfully present immigrants without a qualified status.

Lawfully present immigrants can purchase coverage through the Affordable Care Act (ACA) Marketplaces and may receive subsidies for this coverage. These subsidies are available to people with incomes from 100% to 400% FPL who are not eligible for other coverage. In addition, lawfully present immigrants with incomes below 100% FPL may receive subsidies if they are ineligible for Medicaid based on immigration status. This group includes lawfully present immigrants who are not eligible for Medicaid or CHIP because they are in the five year waiting period or because they do not have a “qualified” status.

Undocumented immigrants and individuals granted DACA are not eligible to enroll in Medicaid or CHIP or to purchase coverage through the ACA Marketplaces.

Endnotes

  1. Kaiser Family Foundation, Health Coverage and Care for Immigrants, (Washington, DC: Kaiser Family Foundation, December 2017), https://modern.kff.org/disparities-policy/fact-sheet/health-coverage-of-immigrants. ↩︎
  2. Ibid. ↩︎
  3. Kaiser Family Foundation, Health Coverage and Care for Immigrants, (Washington, DC: Kaiser Family Foundation, December 2017), https://modern.kff.org/disparities-policy/fact-sheet/health-coverage-of-immigrants/. ↩︎
  4. Ibid. ↩︎
  5. Since these groups were conducted, the Department of Homeland Security announced that TPS will be eliminated for people from Nicaragua effective January 5, 2019. Department of Homeland Security, Acting Secretary Elaine Duke Announcement on Temporary Protected Status for Nicaragua and Honduras, (Washington, DC: Department of Homeland Security, November 6, 2017), https://www.dhs.gov/news/2017/11/06/acting-secretary-elaine-duke-announcement-temporary-protected-status-nicaragua-and. ↩︎
  6. Lisa M Edwards and Jacki Black, Stress Related to Immigration Status in Students: A Brief Guide for Schools, (Milwaukee, WI: Marquette University: February 2017), http://www.marquette.edu/education/news/documents/Immigration-RelatedStress-AGuideforSchools.pdf; Omar Martinez, Elwin Wu, Theo Sandfort, et. al., “Evaluating the Impact of Immigration Policies on Health Status Among Undocumented Immigrants: A Systematic Review,” Journal of Immigrant and Minority Health 17, 3 (June 2015):947-970; Human Impact Partners, Family Unity, Family Health: How Family-Focused Immigration Reform Will Mean Better Health for Children and Families, (Oakland, CA: Human Impact Partners, June 2013), http://www.familyunityfamilyhealth.org/uploads/images/FamilyUnityFamilyHealth.pdf; Jorge Delva, Pilar Horner, Ramiro Martinez, et. al., “Mental Health Problems of Children of Undocumented Parents in the United States: A Hidden Crisis,” Journal of Community Positive Practices XIII, 3 (2013):25-35; Karen Hacker, Jocelyn Chu, Carolyn Leung, et. al., “The Impact of Immigration and Customs Enforcement on Immigrant Health: Perceptions of Immigrants in Everett, Massachusetts, USA,” Social Science & Medicine 73, 4 (August 2011):586-594; David K Androff, Cecilia Ayon, David Becerra, et. al., “U.S. Immigration Policy and Immigrant Children’s Well-being: The Impact of Policy Shifts,” The Journal of Sociology & Social Welfare 38, 1 (March 2011):77-98; Ajay Chaudry, Randy Capps, Juan Manuel Pedroza, et. al., Facing Our Future: Children in the Aftermath of Immigration Enforcement, (Washington, DC: Urban Institute, February 2010), https://www.urban.org/sites/default/files/publication/28331/412020-Facing-Our-Future.PDF; Randy Capps, Rosa Maria Castañeda, Ajay Chaudry, and Robert Santos, Paying the Price: The Impact of Immigration Raids on America’s Children, Prepared for the National Council of La Raza, (Washington, DC: Urban Institute, 2007): https://www.urban.org/sites/default/files/publication/46811/411566-Paying-the-Price-The-Impact-of-Immigration-Raids-on-America-s-Children.PDF. ↩︎
  7. American Academy of Pediatrics (AAP), “AAP Statement on Protection Immigrant Children,” [Website], January 25, 2017, Accessed September 18, 2017, https://www.aap.org/en-us/about-the-aap/aap-press-room/Pages/AAPStatementonProtectingImmigrantChildren.aspx. ↩︎
  8. Center on the Developing Child, NGA Center for Best Practices, and National Conference on State Legislatures, In Brief: The Impact of Early Adversity on Children’s Development, (Cambridge, MA: Center on the Developing Child, Harvard University, 2015), https://46y5eh11fhgw3ve3ytpwxt9r-wpengine.netdna-ssl.com/wp-content/uploads/2015/05/inbrief-adversity-1.pdf; Hillary A Franke, “Toxic Stress: Effects, Prevention and Treatment,” Children 1 (2014):390-402; Sara B Johnson, Anne W Riley, Douglas A Granger, and Jenna Riis, “The Science of Early Life Toxic Stress for Pediatric Practice and Advocacy,” Pediatrics 131, 2 (February 2013):319-327; Jack P Shonkoff, Andrew S Garner, et. al., “The Lifelong Effects of Early Childhood Adversity and Toxic Stress,” Pediatrics 129, 1 (2012):e232-e246; Committee on Psychosocial Aspects of Child and Family Health, et. al., “Early Childhood Adversity, Toxic Stress, and the Role of the Pediatrician: Translating Developmental Science into Lifelong Health,” Pediatrics 129, 1(2012):e224-e231; National Scientific Council on the Developing, Child Persistent Fear and Anxiety Can Affect Young Children’s Learning and Development: Working Paper No. 9, (Cambridge, MA: National Scientific Council on the Developing Child, 2010), http://www.developingchild.net; Jack P Shonkoff, W Thomas Boyce and Bruce S McEwen, “Neuroscience, Molecular Biology, and the Childhood Roots of Health Disparities: Building a New Framework for Health Promotion and Disease Prevention,” Journal of the American Medical Association 301, 201 (2009):2252-2259; Jennifer S Middlebrooks and Natalie C Audage, The Effects of Childhood Stress on Health Across the Lifespan, (Atlanta, GA: Centers for Disease Control and Prevention (CDC), 2008), http://health-equity.lib.umd.edu/932/1/Childhood_Stress.pdf; Stanley D Rosenberg, Weili Lu, Kim T Mueser, et. al., “Correlates of Adverse Childhood Events Among Adults with Schizophrenia Spectrum Disorders,” Psychiatric Services 58, 2 (2007): 245-253; Shanta R Dube, Robert F Anda, Vicent J Felitti, et. al., “Childhood Abuse, Household Dysfunction, and the Rise of Attempted Suicide Throughout the Life Span: Findings from the Adverse Childhood Experiences Study,” JAMA 286, 24 (December 2001): 3089-3096; Vincent J Felitti, Robert F Anda, Dale Nordenberg, et. al., “Relationship of Childhood Abuse and Household Dysfunction to Many of the Leading Casues of Death in Adults: The Adverse Childhood Experiences (ACE) Study,” American Journal of Preventive Medicine 14, 4 (1998):245-258. ↩︎
  9. U.S. Citizenship and Immigration Services, Data Set: Form I-821D Deferred Action for Childhood Arrivals as of June 30, 2017, (Washington, DC: U.S. Citizenship and Immigration Services, September 20, 2017), https://www.uscis.gov/sites/default/files/USCIS/Resources/Reports%20and%20Studies/Immigration%20Forms%20Data/. ↩︎
  10. U.S. Citizenship and Immigration Services, Approximate Active DACA Recipients: Country of Birth As of September 4, 2017, (Washington, DC: U.S. Citizenship and Immigration Services, September 4, 2017), https://www.uscis.gov/sites/default/files/USCIS/Resources/Reports%20and%20Studies/Immigration%20Forms%20Data/. ↩︎
  11. National Immigration Law Center, “DACA,” [Website], Accessed December 1, 2017, https://www.nilc.org/issues/daca/. ↩︎
  12. U.S. Citizenship and Immigration Services, “Temporary Protected Status for Sudan to Terminate in November 2018,” [Press Release], September 18, 2017, Accessed December 7, 2017, https://www.uscis.gov/news/news-releases/temporary-protected-status-sudan-terminate-november-2018 ↩︎
  13. U.S. Department of Homeland Security, “Acting Secretary Elaine Duke Announcement on Temporary Protected Status for Nicaragua and Honduras,” [Press Release], November 6, 2017, Accessed December 1, 2017, https://www.dhs.gov/news/2017/11/06/acting-secretary-elaine-duke-announcement-temporary-protected-status-nicaragua-and. ↩︎
  14. U.S. Citizenship and Immigration Services, “In-Country Refugee/Parole Processing for Minors in Honduras, El Salvador and Guatemala (Central American Minors – CAM),” [Website], November 15, 2017, Accessed December 1, 2017, https://www.uscis.gov/CAM. ↩︎
  15. U.S. Department of Homeland Security, “Acting Secretary Elaine Duke Announcement on Temporary Protected Status for Haiti,” [Press Release], November 20, 2017, Accessed December 1, 2017, https://www.dhs.gov/news/2017/11/20/acting-secretary-elaine-duke-announcement-temporary-protected-status-haiti. ↩︎
  16. U.S. Citizenship and Immigration Services, “Permanent Resident Alien,” [Website], Accessed December 1, 2017, https://www.uscis.gov/tools/glossary/permanent-resident-alien. ↩︎
  17. U.S. Citizenship and Immigration Services, “Refugees & Asylum,” [Website], Accessed December 1, 2017, https://www.uscis.gov/humanitarian/refugees-asylum. ↩︎
  18. Ibid. ↩︎
  19. National Immigration Law Center, “DACA,” [Website], Accessed December 1, 2017, https://www.nilc.org/issues/daca/. ↩︎
News Release

Report and Video Highlight Challenges Facing Hurricane Maria’s Survivors in Puerto Rico

Published: Dec 11, 2017

A new Kaiser Family Foundation report and video find residents across Puerto Rico facing a wide range of daily and long-term challenges as they struggle to rebuild their lives after Hurricane Maria swept across the island Sept. 20 as a powerful category 4 storm.

Based on focus-group and individual interviews with 40 Puerto Ricans from 10 different regions of the island conducted in San Juan and Ponce in November 2017, the Voices from Puerto Rico: Reflections Two Months after Maria project reveals that residents still face incredible challenges and life is far from normal.  Common themes include:

  • The storm had significant negative effects on people’s physical and mental health, and many participants continue to experience depression, stress, and anxiety.
  • Participants continue to face challenges meeting basic needs, and daily life remained extremely challenging due to lack of electricity and limited work options.
  • Participants feel that recovery efforts have been slow and insufficient.
  • Despite these challenges, many believe Puerto Rico will recover, although they recognize recovery will likely take many years and believe that the people themselves have an important role to play in recovery.

The report and video are part of KFF’s ongoing work looking at the impact of the powerful hurricanes that hit the United States this year, including Hurricanes Irma and Maria in Puerto Rico and the U.S. Virgin Islands, and Hurricane Harvey in Houston and coastal Texas.

Voices from Puerto Rico: Reflections Two Months After Maria (Report)

Authors: Samantha Artiga and Barbara Lyons
Published: Dec 8, 2017

Introduction

Two months after Hurricane Maria made landfall, the Kaiser Family Foundation traveled to Puerto Rico to conduct focus groups and individual interviews with individuals affected by the storm. We spoke to 40 people from 10 different regions on the island (Appendix 1). See a companion video. Findings show:

  • Hurricane Maria was a terrifying and traumatic event for participants and their children. A number of participants suffered significant damage to their homes and property with some losing everything.
  • The storm had significant negative effects on physical and mental health, and many participants continue to experience depression, stress, and anxiety.
  • Two months after the storm, participants were continuing to face challenges meeting basic needs, and daily life remained extremely challenging due to lack of electricity and limited work options.
  • Participants felt that recovery efforts have been slow and insufficient.
  • Despite these challenges, many believe Puerto Rico will recover, although they recognize recovery will likely take many years and believe that the people themselves have an important role to play in recovery.

“I thought there was no end to it. We stood by the window, watching what was happening to my house. The wind and the rain wouldn’t stop…It was endless.”

“I saw the entire process of what happened to my house. It was a total loss. My dad was in tears out of helplessness in the face of that situation.”

“The place where I felt okay was the bathroom. If I had to cry, I cried. And sometimes I tried to muffle my sobs with the bath curtain.”

“I was not working for so long, because I used to work at schools and, if they are not open, I don´t work…that triggered a lot of anxiety….because…I used to be the one who made money.”

“…after two months, there are people who still can’t be reached because there is no road, they cannot leave their homes. They can’t get food.”

“And when he [President Trump] did his crazy things, throwing paper towels, he wasn’t valuing what we were going through, our pain.”

“They are taking so, so long, that I wonder, how is it possible that people who lost their homes aren’t given priority.”

“I would like Puerto Ricans on the outside and Americans to know there are brave people here, strong, and they are not giving up, because we are fighters.”


Issue Brief

Weathering the Storm

Weathering the storm was a terrifying and traumatic experience for participants. Some participants made preparations for the storm, while others anticipated the storm would pass by the island or not be as strong as predicted. Many stayed in their home to weather the storm and brought family and friends to stay with them. Others went to stay with family or friends who had sturdier homes. Participants described the frightening strength of the storm winds and significant rain and flooding. They said that the storm felt endless and they worried about the well-being of family members they were separated from during the storm.

“I didn’t believe it would get here. I mean, I thought it was coming but not with so much strength.”

“We got ready to go. Water, emergency provisions for home, tins, non-perishable goods. Also, I have a plastic container, which we call ‘Hurricane,’ in which we keep torches, candles, anything you may need.”

“I told my wife and my children to go with mom since that house is…made of cement all around.”

“I was holding a door for two hours so it wouldn’t get blown away… ! So, we did that until we came up with putting the sofa as a wedge…And the sofa even moved with the wind….but that was the best thing we could have done…. But that…is something I don´t want to go through again…”

“My mother has several conditions and she takes between 12-14 drugs, and that triggered a bit of anxiety in me…. That was my biggest concern, and so I stocked up on them before the hurricane came.”

“There was a moment when the wind stopped. And then it came on the other side… Later, when night had fallen, I could only see upwards and all the destruction and wondered ‘What could we do now. How can I start?'”

“I thought there was no end to it. We stood by the window, watching what was happening to my house. The wind and the rain wouldn’t stop, there were things flying, the trees falling. It was endless.”

“….we were really worried, wanted to know how they were and there were zero communications. It was quite desperate…during the hurricane it was terrible to think about our grandparents, which is the closest family we have.”

Immediate Aftermath of the Storm

Participants struggled to meet basic needs immediately following the storm. Many participants suffered significant damage to their homes and properties, with some losing everything. They said that in the immediate days and weeks following the storm, it was extremely difficult to meet basic needs and that lines, for water, food, gas, and money were up to 8-10 hours long. In the weeks following the storm, there were no communications on the island and travel around the island was difficult, making it challenging to check on the well-being of family and friends. Few received any aid in the days and weeks immediately following the storm. One silver lining several participants highlighted, was that the storm contributed to increased community and stronger relationships with their neighbors as they worked together following the storm.

“I saw the entire process of what happened to my house. It was a total loss. It exploded. A 100 year old mahogany tree fell on it and everything was gone… My dad was in tears out of helplessness in the face of that situation.”

“…it seemed someone had set a shower in my house, the whole house was leaking water.”

“We divided the tasks at home: my brothers went for fuel, I cooked, grandma helped me with the kids. Mom and my husband tidied up.….We knew that if we all went for fuel, we’d never finish what needed to be done at home. I waited in line 6 or 8 times for $10 worth of fuel. One of them took 6 hours, and in the end, it was only $10!”

“You’d stand in a huge line and when you arrived at the counter they’d tell you that you could only take two gallons per family. And then you’d think, well, at home we are five and we drink three gallons in just one day.”

“There was no way to communicate. You couldn’t drive, there were too many things blocking the roads, and there was no internet, no cell-phones…”

“The municipality came by my house with water and a bag of food about three weeks ago. But that was not long ago. In those first weeks, there was no help.”

“We have come closer together as a family and also with the neighbors.”

Effects on Physical and Mental Health

Participants said that access to health care was limited and chaotic immediately after the storm with limited staff, hospitals without power, injuries and deaths. They noted that pharmacies were unable to process insurance without power, so some had to pay out of pocket for medications. Some pharmacies provided medications on credit and /or without a prescription to help ensure continued access to medications. Participants noted that the ability to access health care has improved over time, but challenges persist, including longer waits, transportation challenges, and limited hospitals, clinics, and pharmacies, with many still running on inconsistent generator power. A number of participants had health coverage through Reforma, Puerto Rico’s Medicaid program, and said the coverage is key for accessing needed care for themselves and their children.

“I was worried about the baby, because of the bilirubin levels, and there was no sun. So I took her to the emergency and they kept her for 24 hours….in the same area where they brought the dead.”

“The pharmacy at the hospital had run out of many things after a month. It’s not that the pharmacy doesn’t want to sell it to us, it’s just not available.”

“You can get an appointment, but not as easily and frequently. What the physician does is give them prescriptions for a whole month. So we go and see him every month or month and a half.”

A number of participants said that the storm disrupted their access to medications and treatment. For example, several participants said they did not have access to insulin because they had no ability to refrigerate it, and one participant was unable to obtain dialysis treatment due to lack of power. Participants said it has been harder to manage chronic conditions like asthma, high blood pressure, and diabetes due to stress and anxiety, limited access to medication, and increased consumption of processed and canned foods and soda due to difficulties accessing fresh food.

“I ran out of insulin. I was told to put in tepid water in a glass. But I saw that the insulin wasn’t translucent, it had sort of crystallized, like sugar.”

“For my grandmother’s diabetes, the diet change has been terrible. It’s completely out of control. As there is no electricity, we cannot eat the same food.”

Participants also described profound effects on their mental and emotional health. They noted that while they try to be strong for their children and others, they feel desperation in moments alone. Many said they feel stressed and anxious and are having trouble sleeping at night. They also said that many of their children are fearful and frightened ever time it rains. Several were also affected by deaths they witnessed or knew of as a result of the storm.

“What I’ve seen around me is death. People who have committed suicide. After the hurricane, they have been in very sad situations, really.”

“The place where I felt okay was the bathroom. If I had to cry, I cried. And sometimes I tried to muffle my sobs with the bath curtain.”

“My husband goes hysterical. When he comes home from work he starts digging, with the flashlight, and tries to rebuild the porch. He hates the night, doesn’t sleep.”

“One of my grandchildren, whenever there’s heavy rain, she asks me to close the windows and get into the bathroom with her. I tell her to be calm, but she cannot.”

Life Two Months After the Storm

Daily life remains very difficult and disrupted two months after the storm. Participants said some basic needs still have not been addressed. Most are still without power, and where power has returned, it remains unpredictable. They also pointed to continued challenges accessing water and gas and noted that cell service and communication remains limited across the island. Participants described the struggles of daily life without power, noting that they are unable to keep fresh food, unable to cook inside their home, and or to use their washing machine. They emphasized that there is no relief from the heat and mosquitos and constant noise and air pollution from generators. They also said that there remain significant traffic jams and delays on the roads due to the lack of traffic lights.

“…we miss the comfort of things we used to take for granted. Like, we used to get up and we’d be able to take a shower, it was as simple as putting the clothes in the washing machine, and leaving…To have the comfort of cooking inside the house…”

“Even now I don’t have a signal at home. I have to go out on the highway. You can’t communicate. And things are very difficult.”

“To date, I am still in survival mode.”

“But now with my dad, I have to wake up much earlier. I had to bring them home with me, as they have no power or water since Irma. He’s diabetic and has conditions so I have to wake up a lot earlier and I have to medicate and take him home, then take the girls to school and get to work.”

Participants’ daily routines remain disrupted. Some participants are still displaced from their homes or have displaced family or friends living with them. Some children returned to school, but many schools are operating under shortened schedules. Some participants have returned to work, but a number went many days without work or lost their jobs. They noted that many jobs are not available right now because of the lack of power. Moreover, it is more difficult for parents to work given the more limited school hours.

“It has changed completely. We live in one space….Seeing those elderly people get up…and they were used to sitting on the balcony. Today, you find them crying because they cannot do it. It affects me. I adapt, but it affects me.”

“I’ve already relocated. I looked for a place to rent because my house must be reconstructed completely.”

“I found work last week. Prior to that I didn’t have a job, ever since Irma. I was a bartender but lost my job. Because my workplace was left without power and couldn’t operate.”

“…I was not working for so long, because I used to work at schools and, if they are not open, I don’t work. And that triggered a lot of anxiety…. Because…I used to be the one who made money. So although I tried to channel all those energies, I did get a bit hopeless.”

Views on Recovery Efforts

Participants feel that recovery efforts have been slow and that major gaps in basic needs remain two months after the storm. They did not feel that President Trump has provided much help or respect for the people of Puerto Rico. They said that assistance from FEMA has been slow and not well targeted. Some felt that FEMA is acting slow because FEMA funds were misused by some individuals after previous storm. In addition, many thought that local government is complicating and slowing down recovery efforts.

“…after two months, there are people who still can’t be reached because there is no road, they cannot leave their homes. They can’t get food. And you think, my God…but there is so much arriving!”

“And when he [President Trump] did his crazy things, throwing paper towels, he wasn’t valuing what we were going through, our pain.”

“They are taking so, so long, that I wonder, how is it possible that people who lost their homes aren´t given priority.”

“But they also have to think of the emergency we are in, they [FEMA] can’t take 60 days to assess a house, when it is obvious the assistance is needed.”

“The thing is, FEMA can’t do anything until the municipality and the state agree on something and they start moving.”

“I think FEMA is acting in a responsible way, being very cautious and studying properly every case. Because…in the other incidents, people would take the money and wouldn’t fix their homes. “

“I’d have to call [FEMA] three times on the same day and they’d give me different versions of the information. So, I’d have to take note of their names and the version they had given me. And this situation is like walking uphill, because these new employees don’t know what to tell you about the assistance…”

Thoughts on the Future

Participants believe the island will recover, but that it will take a long time, likely many years. They feel there remains great needs across the island, but that there is not enough recognition of the continued need and suffering. Many noted that they remain committed to staying on the island and recovery, even though staying is hard. Others are leaving because they are no longer able to find employment to support them. Many have family and friends that have already left the island. Participants want more transparency and information about recovery efforts, in particular, about where funding and supplies are going. They also believe that the people of Puerto Rico have a role to play in recovery themselves, and that they can’t just sit back and wait for assistance.

“I’d like to stay where I am, but it depends on the power and work. For the moment, I’m staying.”

“I have friends who have little children and left because the children couldn’t get used to not having electricity or water.”

“I’m looking for a job, and I’m analyzing other options I have, like starting my own business… but I have to do something.”

“It will be good. It will be slow, but it will be good.”

“I have faith in that it will get better. That the storm took some things, but it didn’t take our warrior hearts.”

“I would like Puerto Ricans on the outside and Americans to know there are brave people here, strong, and they are not giving up, because we are fighters.”

“I also think that it is not like we are just sitting here waiting for help to move. Because we are moving. But there comes a limit where you get stuck because you don’t have more resources.”

“We ourselves. Puerto Rico helping out Puerto Rico.”

Conclusion

These findings show that Hurricane Maria was a terrifying and traumatic event for many Puerto Ricans. Many suffered significant damage to their homes and property, with some losing everything, and many are struggling with mental and emotional effects of the storm and their losses. Two months after the storm, individuals were continuing to face challenges meeting basic needs, and daily life remained extremely challenging, due to lack of electricity and limited work options. Individuals feel that recovery efforts have been slow and insufficient and emphasized that the island still needs substantial help and resources to recover. Despite these challenges, many believe Puerto Rico will recover, although they recognize recovery will likely take many years and believe that the people themselves have an important role to play in recovery.

The authors extend their deep appreciation to the individuals who shared their time and stories as well as the individuals who helped make this project possible including, Perry Undem Research/Communication and Marisol Lugo Juan with Lighthouse Market Intelligence.

Appendix

Methods

The focus groups and interviews were conducted in Spanish and English in San Juan and Ponce, Puerto Rico, on November 18 and 19, 2017. The Kaiser Family Foundation worked with PerryUndem Research/Communication to conduct the focus groups and interviews. This brief highlights participants’ experiences during and immediately after the storm as well as how they were faring two months after the storm. It also provides an overview their thoughts on recovery efforts and their reflections on the future for themselves and the island.

Figure 1: Regions of Focus Group and Interview Participants

What Would a CVS/Aetna Merger Mean for Medicare?

Published: Dec 7, 2017

Source

Kaiser Family Foundation analysis of Centers for Medicare & Medicaid Services 2017 Part D plan filesKaiser Family Foundation, “Medicare Advantage 2017 Spotlight: Enrollment Market Update,” Figure 6, June 2017.

State Plans for CHIP as Federal CHIP Funds Run Out

Published: Dec 6, 2017

Federal funding for the Children’s Health Insurance Program (CHIP) expired on September 30, 2017. CHIP covers 8.9 million children in working families who earn too much to qualify for Medicaid but cannot afford or access private coverage. (See here for state Medicaid and CHIP eligibility limits for children.) This fact sheet provides an overview of state plans for CHIP as they grow closer to exhausting federal funds amid continued delay of Congressional action to extend funding. It is based on data collected from state Medicaid and CHIP officials by the Kaiser Family Foundation (KFF) and Health Management Associates (HMA) during November 2017, which updates data earlier reported in Summer 2017. The findings show that about three-quarters of states anticipate exhausting funding by the end of March 2018 and that several states have begun or will begin notifying families about coverage reductions before the end of 2017. As such, further delay in Congressional action is likely to result in confusion among families that could lead to coverage losses and administrative costs even if funding is extended in the next few weeks. See Appendix Table 1 for state data.

When Will States Run out of Funding?

Remaining funds available to states, including redistribution funds, are limited and anticipated to run out soon. Federal stopgap funds available to states include remaining federal funds from each state’s federal fiscal year (FY) 2017 CHIP allotment and redistribution funding from prior years provided by the Centers for Medicare and Medicaid Services (CMS) from a limited amount of unspent funds across all states. However, once states exhaust those funds, no additional funds will be available unless Congress enacts legislation. As of December 6, 2017, nine states have exhausted their FY 2017 allotments and have received redistribution funds from CMS to continue coverage. CMS is expected to release the final redistribution payments in the near-term, but these amounts will be insufficient to cover states’ FY 2018 CHIP shortfalls.1 

A third of states anticipate exhausting funding by the end of January 2018 (Figure 1). Among the 48 states2  that provided an estimate of when they will exhaust federal funds, including the 38 states that provided an update in November 2017, 16 states projected they will exhaust federal funds by the end of January 2018, and an additional 21 states projected they will exhaust federal funds by the end of March 2018. State projections are fluid and change as enrollment and costs fluctuate and states receive redistribution funds.

Figure 1: 16 states project exhaustion of federal CHIP funds before the end of January 2018

The majority of states will face a budget shortfall without an extension of federal funds because nearly all states assumed continued federal CHIP funding in their state fiscal year (SFY) 2018 state budgets. Because state budgets for SFY2018 have already been adopted, special legislative sessions and/or Governor action will likely be needed to address these shortfalls.

What are State Options to Respond to the Loss of Federal Funds?

State options to respond to the loss of federal CHIP funds vary based on how they have implemented their CHIP program. States have implemented their CHIP programs by creating a separate CHIP program, through a CHIP-funded Medicaid expansion, or using a combination of both approaches. Regardless of how states implement their program, they receive the enhanced (relative to Medicaid) matching rate for CHIP coverage, which was further increased by 23 percentage points under the Affordable Care Act (ACA). As of FY2016, about four in ten children covered through CHIP were in separate CHIP programs, and six in ten were in CHIP-funded Medicaid expansions.3 

  • States are not required to maintain separate CHIP coverage. States with separate CHIP programs can transition enrollees to Medicaid at the lower federal Medicaid match rate or discontinue coverage. Some states have state laws that require them to close the program and/or discontinue coverage if federal funds decrease. For example, Arizona must freeze enrollment if the federal match rate decreases, West Virginia must close the program if federal funding levels fall below the levels allotted in 1997, and Colorado cannot access provider taxes it uses to support coverage for some CHIP children without federal match.
  • States are required to maintain CHIP-funded Medicaid expansion coverage under the ACA maintenance of effort (MOE) requirement. They will face increased costs since they will receive the lower federal Medicaid match rate for this coverage.

What are Current State Plans for Addressing the Loss of Federal Funds?

Many states with separate CHIP programs are planning to reduce coverage in response to the loss of federal funding, and several plan to begin notifying families before the end of the year. Overall, 14 of the 24 states that reported November 2017 data and have a separate CHIP program indicated plans to reduce or limit separate CHIP coverage for children or pregnant women, while most of the remaining 10 states reported they had not yet determined specific plans for reducing coverage.

  • A total of 14 states reported plans to terminate or phase out coverage for children, including 5 states that plan to end coverage by the end of January 2018 (Figure 2).4  In addition, three states plan to take action in February (AL, OK, and WV), one state plans to take action in March (SD). The additional five states (MS, NC, ND, PA, and WY) plan to take action later or did not indicate a date for planned action. States will begin notifying families of the upcoming changes one month or more in advance of the planned action date. As of December 6, 2017, at least three states had begun informing families about potential changes. Colorado sent a warning to families about potential coverage losses5  and Utah6  and Oklahoma7  had posted notices on their websites warning of potential coverage reductions.
Figure 2: Five States Plan to End Coverage by January 31, 2018
  • Seven states reported plans to close new enrollment for children or establish a cap on the total number of children that can be enrolled in their separate CHIP program. Connecticut reported it will close enrollment or establish an enrollment cap on December 20th, 2017, and Alabama, North Carolina, and Virginia reported plans to close enrollment or establish an enrollment cap in January. Mississippi, Pennsylvania, and Utah also reported plans to take this action but did not specify planned dates of action.
  • In addition, several states reported plans to reduce CHIP coverage for pregnant women. Colorado and Virginia both plan to terminate or phase out coverage for enrolled pregnant women on January 31, 2018. Virginia also plans to close new enrollment for pregnant women or establish an enrollment cap on January 1, 2018. Oklahoma has also indicated plans to terminate coverage for pregnant women covered through its unborn child option as of February 28, 2018.8 

Several states indicated plans to transition children from separate CHIP programs to Medicaid. For example, Oregon, which anticipates exhausting its federal CHIP funds in December 2017, plans to transition children to Medicaid on January 1, 2018. In addition, Idaho and Louisiana indicated plans to transition children in February. States will face increased state costs for children transitioned from CHIP to Medicaid because they will receive the lower federal Medicaid match rate for this coverage.

States with CHIP-funded Medicaid expansion coverage must determine how they will fund the increased cost of covering these children at the lower federal Medicaid match rate. States can address these shortfalls by reducing costs in Medicaid, making reductions in other areas of the budget, or increasing revenues (Box 1). States will face challenges replacing federal dollars since many were already facing shortfalls heading into SFY 2018.9 

Box 1: Examples State Plans to Cover Increased Costs for CHIP-funded Medicaid Expansion Coverage

Alaska reported that it will request supplemental funding from the state general fund to address its estimated $7 million shortfall for SFY 2018.

Utah reported that it will end its separate CHIP coverage and that it requested approximately $11.3 million in additional funding from the state legislature to cover increased costs of its CHIP-funded Medicaid expansion coverage.

Hawaii reported that it would make reductions in other areas of the budget (outside of Medicaid/CHIP) and request an emergency appropriation for SFY 2018 to address its estimated $9.3 million shortfall.

How Will Coverage Reductions and Changes Affect Families and States?

Reductions in CHIP coverage will result in coverage losses for children and negative effects on children’s health and family finances. If states close enrollment and/or discontinue coverage for children in separate CHIP programs, some children could shift to their parents’ employer-sponsored plans or Marketplace plans, but others would become uninsured. Previously, some states closed enrollment in CHIP for limited periods in response to state budget pressures, and studies show that this led to coverage losses, left eligible individuals without access to coverage, and had negative effects on health and family finances (Appendix 2).

Implementing program changes to CHIP will also require administrative time and costs for states. States reported having to take an array of actions to implement program changes (Box 2). States need to build in time to conduct these actions as they plan to make program changes. In addition, states face administrative costs associated with these actions. For example, Connecticut estimates that implementing program changes will cost $250,000, Oklahoma estimates costs of $1.1 million, Pennsylvania estimates costs of $3.4 million, and South Dakota estimates costs of $200,000.10  Colorado previously estimated that eligibility system changes alone would cost $300,000.11  CMS indicated that states must factor such costs associated with the close out of the program into calculations of use of remaining federal funds.12 

Box 2: Administrative Actions to Implement Program Changes

  • Notifying families
  • Translating notices
  • Submitting state plan amendments to CMS
  • Conducting tribal consultation
  • Making changes to eligibility systems and other systems
  • Training eligibility staff
  • Redetermining eligibility for other programs
  • Notifying providers, managed care organizations (MCOs), and other stakeholders
  • Updating contracts with MCOs, vendors, and other third parties.

What Actions Remain for Congress to Extend Funding?

Multiple steps still remain for Congress to extend federal CHIP funding. As of early December 2017, the House had passed a bill to extend CHIP funding. In early October 2017, the Senate Finance Committee reported a bill out of committee to extend funding. However, the full Senate has not yet taken up action to extend funding. Final legislation still requires passage by the full Senate, resolution of any differences between the House and Senate bills, and signature by the President.

Further delay in Congressional action is likely to result in confusion among families that could lead to coverage losses and administrative costs even if Congress later extends funding. As states begin to notify families of changes in CHIP coverage, there is the potential for confusion among families that could lead to coverage losses, even if Congress later extends funding. Moreover, states are already beginning to take action to implement program changes, resulting in administrative time and costs. States will face additional administrative burdens and costs associated with reversing these changes and restarting coverage, if funding is extended.

Appendix Table 1: State CHIP Budget Assumptions and Projected Dates of Exhaustion of Federal Funds
StateHas separate CHIP coverage?SFY 2018 budget assumes continued federal funding?SFY 2018 budget assumes ACA enhanced match continues?State estimate of when it will exhaust federal funding1State reported update to funding exhaustion date in November 2017?
AlabamaYesYesYesFebruary 2018Yes
AlaskaYesNoMarch 2018Yes
ArizonaYesYesYesDecember 2017Yes
ArkansasYesYesYesJune 2018
California2YesNoJanuary 2018Yes
ColoradoYesYesYesJanuary 2018Yes
ConnecticutYesYesYesFebruary 2018Yes
DelawareYesYesYesJanuary 2018Yes
DCYesNR1st Q 2018Yes
FloridaYesYesYesJanuary 2018Yes
GeorgiaYesYesNRJanuary to March 20183
HawaiiYesYesFebruary 2018Yes
IdahoYesYesYesJanuary 2018Yes
IllinoisYesYesNoNR
IndianaYesYesNRSummer 2018
IowaYesYesYesMarch 2018Yes
KansasYesNRNRNR
KentuckyYesYesYesFebruary 2018
LouisianaYesYesYesFebruary 2018Yes
MaineYesYesNRNR
MarylandYesYesApril 2018Yes
MassachusettsYesYesYesJanuary 2018Yes
MichiganYesYesFebruary/March 2018
MinnesotaYesNRNovember 2017Yes
MississippiYesYesYesApril 2018Yes
MissouriYesYesNoSpring/Summer 2018Yes
MontanaYesYesYesFebruary 2018Yes
NebraskaYesNo2nd Q 2018
NevadaYesYesNROctober/November 2017
New HampshireNoN/ADecember 2017Yes
New JerseyYesYesYesMarch 2018Yes
New MexicoYesNRJuly 2018Yes
New YorkYesYesYesMarch 20184
North CarolinaYesYesYes1st Q 2018Yes
North DakotaYesYesYesMay 2018Yes
OhioYesNRFebruary 2018Yes
OklahomaYes5NoN/AMarch 2018Yes
OregonYesYesYesDecember 2017Yes
PennsylvaniaYesYesYesJanuary 2018Yes
Rhode IslandYesYesMarch 2018Yes
South CarolinaYesYesSFY 2019
South DakotaYesYesYesMarch 2018Yes
TennesseeYesYesYesLate springYes
TexasYesYesYesJanuary 2018Yes
UtahYesYesYesJanuary 2018Yes
VermontYesNo1st Q 2018
VirginiaYesYesYesJanuary 2018Yes
WashingtonYesYesYesSeptember 2017Yes
West VirginiaYesYesYesFebruary 2018Yes
WisconsinYesYesYesMarch 2018Yes
WyomingYesYesYesApril 2018Yes
NOTES: NR: Not reported. N/A: Not applicable; state budget does not assume continuation of CHIP funding. 1State projections vary with regard to whether they include redistribution funds; for some states, redistribution funds could temporarily extend funding beyond the projected exhaustion date. 2 Some counties in California provide separate CHIP coverage. 3Georgia reported Feb/March 2018 if they suspend eligibility, Jan 2018 if eligibility not suspended. 4New York reported “into CY 2018” in Summer 2017 and did not provide an updated estimate; March 2018 estimate is based on MACPAC projection. 5 Oklahoma has a separate CHIP program that provides premium assistance to some children and coverage for pregnant women through the unborn child option.SOURCES: Kaiser Family Foundation Survey of Medicaid Officials in 50 States and DC conducted by Health Management Associates, Summer 2017 with November 2017 updates. List of states with separate CHIP coverage is from a national survey conducted by the Kaiser Family Foundation with Georgetown University Center for Children and Families, January 2017, http://www.kff.org/medicaid/report/medicaid-and-chip-eligibility-enrollment-renewal-and-cost-sharing-policies-as-of-january-2017-findings-from-a-50-state-survey/.

Appendix 2: Effects of Previous State Enrollment Caps and Freezes

After Arizona froze CHIP enrollment in December 2009, enrollment fell by more than 60% from about 46,900 to 17,600 as of July 2011 (Figure 2).13  Just over four in ten disenrolled children moved to Medicaid due to declines in family income, but many others likely became uninsured.14  The children’s uninsured rate in Arizona grew following the enrollment freeze.15  Over the same period, the waiting list for CHIP grew to over 100,000 children and was continuing to grow at a rate of about 10,000 children per month.16 

Figure 3: Arizona CHIP KidsCare Enrollment, Dec. 2009-July 2011

In North Carolina, enrollment fell by nearly 30% from about 72,000 to 51,300 when it froze enrollment between January and October 2001. The number of children determined eligible for CHIP but placed on a waiting list grew to over 34,000.17  Most (60%) children added to the waiting list were previously enrolled in Medicaid and were unable to transition to CHIP.

Enrollment freezes negatively affected children’s health and family finances. In North Carolina, parents with children affected by the enrollment freeze said their children experienced periods of being uninsured and that almost all needed care during the time that they lacked coverage.18  Parents often had to delay care while their children were uninsured and reported difficulties obtaining prescription medications for their children.19  Parents also reported that obtaining care while their children were uninsured resulted in significant financial hardships, requiring them to cut back on necessities, borrow money from family or friends, and accrue debt for missed payments on bills.20 


  1. Brian Neale, “Programmatic and Financial Information Regarding CHIP in a Federal Funding Shortfall” (Center for Medicare and CHIP Services, November 2017), https://www.medicaid.gov/federal-policy-guidance/downloads/cib110917.pdf. ↩︎
  2. The District of Columbia is counted as a state for the purposes of this report. ↩︎
  3. Medicaid and CHIP Payment and Access Commission, Child Enrollment in CHIP and Medicaid by State, (December 2016), https://www.macpac.gov/publication/child-enrollment-in-chip-and-medicaid-by-state/. ↩︎
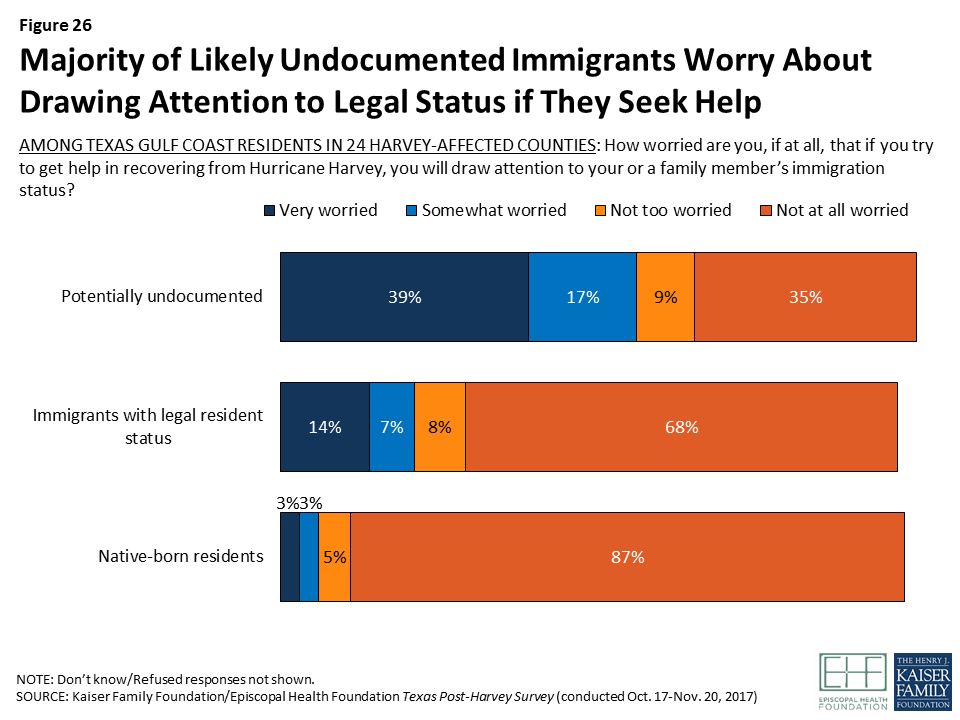
  4. Utah Department of Health, “Children’s Health Insurance Program,” accessed on December 6, 2017, http://health.utah.gov/chip/ ↩︎
  5. Colorado Department of Health Care Policy and Financing, “Families to Begin Receiving Letters on Future of CHP+” November 27, 2017, https://www.colorado.gov/hcpf/news/families-begin-receiving-letters-future-chp ↩︎
  6. Utah Department of Health, “Children’s Health Insurance Program,” accessed on December 6, 2017, http://health.utah.gov/chip/ ↩︎
  7. Oklahoma HealthCare Authority, “Children’s Health Insurance Program (CHIP) Updates,” last updated November 29, 2017, http://www.okhca.org/about.aspx?id=21203 ↩︎
  8. Ibid. ↩︎
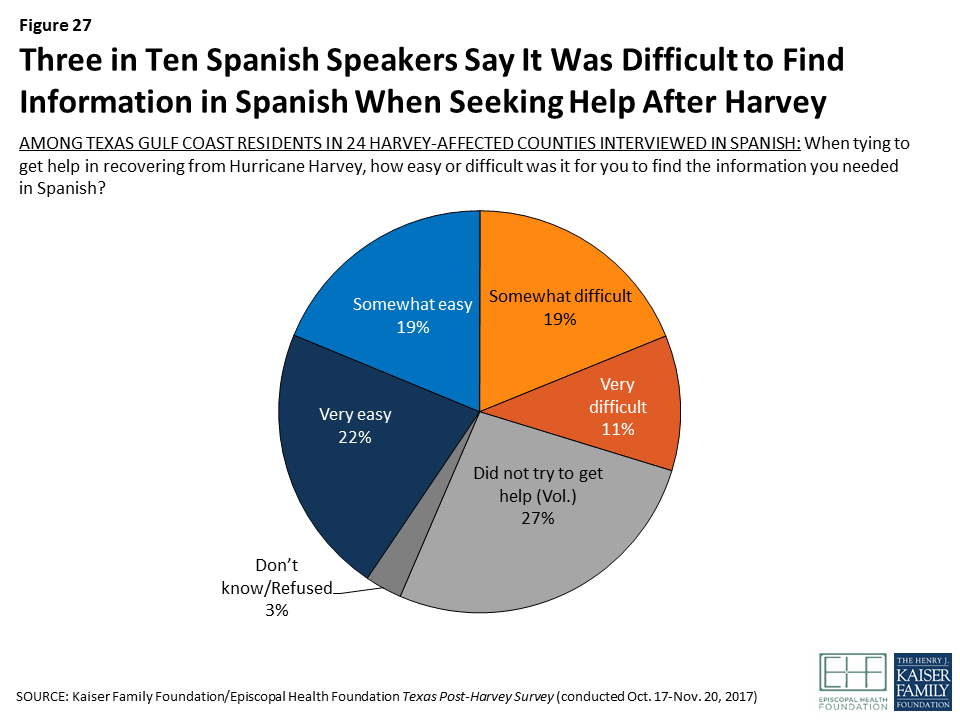
  9. Larisa Antonisse, Elizabeth Hinton, Robin Rudowitz, Kathleen Gifford, and Nicole McMahon, Governors’ Proposed Budgets for SFY 2018: Focus on Medicaid and Other Health Priorities (Washington, DC: Kaiser Family Foundation, April 2017), http://modern.kff.org/report-section/governors-proposed-budgets-for-fy-2018-focus-on-medicaid-and-other-health-priorities-issue-brief/ ↩︎
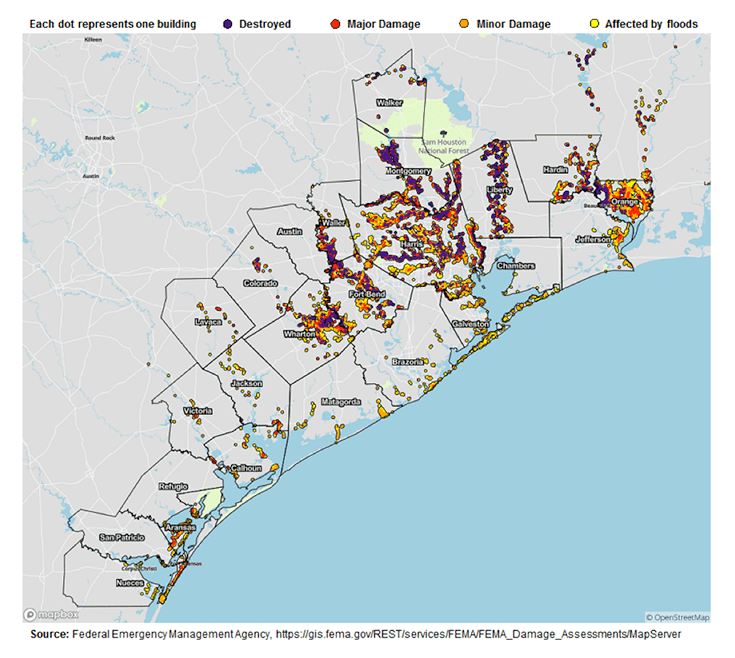
  10. Cost estimate for Oklahoma is combined federal and state costs. Other states did not specify whether the estimates they provided are for state costs alone or federal and state costs combined. ↩︎
  11. Colorado’s projected cost for eligibility system changes is from the state’s response to the Summer 2017 Medicaid budget survey. ↩︎
  12. Centers for Medicare and Medicaid Services, “Contingency Planning for a Title XXI Shortfall,” Children’s Coverage TAG, July 25, 2017. ↩︎
  13. Kaiser Commission on Medicaid and the Uninsured, The Arizona KidsCare CHIP Enrollment Freeze: How Has it Impacted Enrollment and Familes? (Washington, DC: Kaiser Commission on Medicaid and the Uninsured, September 2011), http://modern.kff.org/medicaid/issue-brief/the-arizona-kidscare-chip-enrollment-freeze-how/ ↩︎
  14. Ibid. ↩︎
  15. Elisabeth Wright Burak, Children’s Health Coverage in Arizona: A Cautionary Tale for the Future of the Children’s Health Insurance Program (CHIP) (Washington, DC: Georgetown Center for Children and Families, January 2015), http://ccf.georgetown.edu/wp-content/uploads/2015/01/Childrens-Coverage-in-Arizona-A-Cautionary-Tale-for-the-Future-of-Childrens-Health-Insurance-Program.pdf ↩︎
  16. Kaiser Commission on Medicaid and the Uninsured, The Arizona KidsCare CHIP Enrollment Freeze: How Has it Impacted Enrollment and Familes? (Washington, DC: Kaiser Commission on Medicaid and the Uninsured, September 2011), http://modern.kff.org/medicaid/issue-brief/the-arizona-kidscare-chip-enrollment-freeze-how/ ↩︎
  17. Ian Hill, Brigette Courtot, and Jennifer Sullivan, “Coping With SCHIP Enrollment Caps: Lessons From Seven States’ Experiences” Health Affairs 26 no.1 (January/February 2007): 258-268, http://content.healthaffairs.org/content/26/1/258.full.pdf ↩︎
  18. Pam Silberman, Joan Walsh, Rebecca Slifkin, and Stephanie Poley, The North Carolina Health Choice Enrollment Freeze of 2001 (Washington, DC: Kaiser Commission on Medicaid and the Uninsured, January 2003), https://modern.kff.org/wp-content/uploads/2002/12/4081-north-carolina-health-choice.pdf ↩︎
  19. Ibid. ↩︎
  20. Ibid. ↩︎

Voices from Puerto Rico: Reflections Two Months After Maria (Video)

Published: Dec 5, 2017

In this video, residents of Puerto Rico discuss their daily lives and views of recovery efforts two months after Hurricane Maria. They describe a climate of frustration, job loss and continuing economic disruption, a lack of basic services such as electricity and a rising toll on the population’s mental and physical health. A related report is also available.

Donor Government Funding for Family Planning in 2016

Authors: Adam Wexler, Jennifer Kates, and Eric Lief
Published: Dec 5, 2017

Key Points

Donor government funding for family planning decreased in 2016 compared to the prior year, with bilateral support falling from $1.34 billion in 2015 to $1.19 billion (-12%).

  • This marked the second year of declines in a row, following an initial increase after the London Summit on Family Planning held in 2012. These declines were largely due to currency fluctuations and the timing of donor disbursements, although even after accounting for these factors, funding in 2016 declined, returning to 2013 levels; funding from several donors decreased in real terms.
  • Among the 10 donor governments profiled, four governments decreased bilateral funding (France, Norway, the U.K., and the U.S.), five increased (Australia, Denmark, Germany, the Netherlands, and Sweden), and one remained flat (Canada).
  • The decline by the U.S. in 2016 (from US$638.0 million in 2015 to US$532.7 million in 2016) appears to reflect the timing of disbursements, as overall funding commitments by the U.S. have remained flat for several years.
  • Despite the decline, the U.S. was still the largest bilateral donor to family planning in 2016, providing 45% of total bilateral funding. The U.K. (US$203.4 million, 17%) was the second largest donor, followed by the Netherlands (US$183.1 million, 15%), Sweden (US$92.5 million, 8%), and Canada (US$43.8 million, 4%).
  • In addition to bilateral disbursements for family planning, donor governments also provided US$347.8 million in core contributions to UNFPA; this also represented a decline over the prior year period of US$44.8 million (-13%) compared to 2015 (US$392.6 million).1  Sweden provided the largest core contribution to UNFPA in 2016 (US$59.0 million), followed by Norway (US$46.8 million), the Netherlands (US$39.1 million), and the U.S. (US$30.7).

Report

Introduction

This report provides the latest data on donor government resources available for family planning activities in low- and middle-income countries. It is part of an effort by the Kaiser Family Foundation that began after the London Summit on Family Planning in 2012 where donors committed US$2.6 billion in additional funding to increase access to family planning by 2020 (see Appendix 1).2  This current report provides data on donor government disbursements in 2016, the most recent year available. It includes data from all members of the Organisation for Economic Co-operation and Development (OECD)’s Development Assistance Committee (DAC), as well as non-DAC members where data are available.3  Data are collected directly from donors and supplemented with data from the DAC. Ten donor governments that account for 98% of total disbursements are profiled in this analysis. Both bilateral assistance and core contributions to UNFPA are included. See methodology for more detail. For information on family planning funding from other sources (e.g. multilateral organizations, foundations, etc.) see Appendix 2.

Figure 1: Donor Government Bilateral Assistance for Family Planning, 2012-2016

Findings

Bilateral Assistance

In 2016, donor governments disbursed US$1,187.8 million in bilateral funding for family planning activities (see Table 1, Figure 1 & Appendix 3), a decline of more than US$150 million (-12%) compared to the 2015 level (US$1,344.0 million). This marks the second year of declines after initial increases following the London Summit in 2012. Much of the decline over the past two years can be attributed to two factors: 1) the rise in the value of the U.S. dollar compared to other currencies in 2015, which accounted for 36% of the decline; and 2) an apparent delay in the timing of disbursements by the U.S., which accounted for 42% of the decline (while U.S. funding declined by more than US$100 million in 2016, annual funding commitments appropriated by Congress have remained flat for the past several years; in addition, there have been other years where disbursements have varied from commitments; see Figure 2).4  However, even after accounting for currency fluctuations and the timing of disbursements, funding declined by 22% over the two-year period and returned to 2013 levels.

Among the donors profiled, five (Australia, Denmark, Germany, the Netherlands, and Sweden) increased FP funding in 2016, four decreased funding (France, Norway, the U.K., and the U.S.) and one remained flat (Canada). This was the case in current U.S. dollars as well as after adjusting for currency fluctuations.

Table 1: Donor Government Bilateral Disbursements for Family Planning, 2012-2016 (in current US$, millions)
Country20122013201420152016Difference
2015 – 20162012 – 2016
Australia$43.2$39.5$26.6$12.4$14.9$2.5(20.2%)$-28.3(-65.5%)
Canada$41.5$45.6$48.3$43.0$43.8$0.8(1.9%)$2.3(5.5%)
Denmark$13.0$20.3$28.8$28.1$30.7$2.6(9.3%)$17.7(136.2%)
France$49.6$37.2$69.8$68.6$39.9$-28.7(-41.8%)$-9.7(-19.6%)
Germany$47.6$38.2$31.3$34.0$37.8$3.8(11.2%)$-9.8(-20.6%)
Netherlands$105.4$153.7$163.6$165.8$183.1$17.3(10.4%)$77.7(73.7%)
Norway$3.3$20.4$20.8$8.1$5.7$-2.4(-29.6%)$2.4(72.7%)
Sweden$41.2$50.4$70.2$66.0$92.5$26.5(40.2%)$51.3(124.5%)
U.K.$252.8$305.2$327.6$269.9$203.4$-66.5(-24.6%)$-49.4(-19.5%)
U.S.$485.0$585.0$636.6$638.0$532.7$-105.3(-16.5%)$47.7(9.8%)
Other DAC Countries*$11.0$29.5$9.0$10.1$3.3$-6.9(-67.8%)$-7.7(-70.3%)
Total$1,093.6$1,325.0$1,432.7$1,344.0$1,187.8$-156.3  (-11.6%)$94.2  (8.6%)
*Austria, Belgium, Czech Republic, European Union, Finland, Greece, Hungary, Iceland, Ireland, Italy, Japan, Korea, Luxembourg, New Zealand, Poland, Portugal, the Slovak Republic, Slovenia, Spain, and Switzerland.
Figure 2: U.S. Funding for Family Planning, FY 2012-FY 2016

The United States was the largest bilateral donor in 2016 accounting for US$532.7 million or 45% of total bilateral assistance (see Figure 3). The U.K. (US$203.4 million, 17%) was the second largest bilateral donor, followed by the Netherlands (US$183.1 million, 15%), Sweden (US$92.5 million, 8%), and Canada (US$43.8 million, 4%).

Figure 3: Donor Governments as a Share of Total Bilateral Disbursements for Family Planning, 2016

Donor Contributions to UNFPA

While the majority of donor government assistance for family planning is provided bilaterally, donors also provide support for family planning activities through contributions to the United Nations Population Fund (UNFPA) (see Appendix 4). Most of UNFPA’s funding is from donor governments, which provide funding in two ways: 1) donor directed or earmarked contributions for specific activities (e.g. donor contributions to the UNFPA Supplies), which are included as part of bilateral funding above; and 2) general contributions to “core” activities that are untied and meant to be used for both programmatic activities (family planning, population and development, HIV-AIDS, gender, and sexual and reproductive health and rights) and operational support as determined by UNFPA.

In 2016, donor governments provided US$347.8 million in core contributions to UNFPA, a decrease of US$44.8 million (-13%) below 2015 levels (US$392.6 million) and US$123.7 million (-26%) below 2014 levels. Despite the overall declines, the majority of donors either increased funding (Germany and Sweden) or remained flat (Canada, France, Netherlands, and U.S.); four donors declined (Australia, Denmark, Norway and the U.K.); however U.K. contributions remained flat when measured in currency of origin. Sweden provided the largest core contribution to UNFPA in 2016 (US$59.0 million), followed by Norway (US$46.8 million), the Netherlands (US$39.1 million), and Denmark (US$28.1) (see Figure 4 and Table 2). Among the ten donors profiled, one donor – Norway – provided a larger contribution to UNFPA’s core resources than their total bilateral disbursement for family planning.

Figure 4: Donor Governments as a Share of UNFPA Core Contributions, 2016
Table 2: Donor Government Contributions to UNFPA (Core Resources), 2012-2016 (in current US$, millions)
Country20122013201420152016Difference
2015 – 20162012 – 2016
Australia$14.9$15.6$13.9$11.7$7.0$-4.7(-39.9%)$-7.9(-52.8%)
Canada$17.4$16.0$14.0$12.4$11.7$-0.7(-5.8%)$-5.7(-32.8%)
Denmark$44.0$40.4$41.9$35.7$28.1$-7.6(-21.3%)$-15.9(-36.1%)
France$0.5$0.0$0.0$0.6$0.8$0.2(39.3%)$0.3(67.2%)
Germany$20.7$24.0$24.7$21.3$24.4$3.1(14.4%)$3.7(17.7%)
Netherlands$49.0$52.4$48.4$39.7$39.1$-0.6(-1.5%)$-9.9(-20.2%)
Norway$59.4$70.6$69.1$55.6$46.8$-8.8(-15.7%)$-12.6(-21.1%)
Sweden$66.3$65.8$70.3$57.4$59.0$1.6(2.9%)$-7.3(-10.9%)
U.K.$31.8$31.5$33.1$30.8$25.0$-5.8(-18.8%)$-6.8(-21.4%)
U.S.$30.2$28.9$31.1$30.8$30.7$-0.1(-0.3%)$0.5(1.7%)
Other Donors$98.0$108.8$125.0$96.6$75.1$-21.5(-22.2%)$-22.9(-23.4%)
Total$432.2$454.0$471.5$392.6$347.8$-44.8  (-12.9%)$-84.4  (-19.5%)

Looking Ahead

As this report finds, family planning funding initially increased after the 2012 London Summit on Family Planning but more recently has begun to decline and future funding is uncertain.  While this recent decline is due to several factors, including currency fluctuations and the timing of disbursements, even after accounting for these factors, funding in 2016 had fallen to 2013 levels.  Moreover, future funding from the largest donor to family planning – the United States – is uncertain. In 2017, the Trump Administration ended funding to UNFPA and has proposed eliminating all bilateral funding in 2018. While the U.S. Congress has not yet finalized funding for the 2018 fiscal year, but is expected to continue bilateral funding at some level, this downward pressure on the family planning budget is likely to continue.

Against this uncertain backdrop, donors met in London earlier this year to renew their commitments to FP2020. In addition, following President Trump’s reinstatement and expansion of the Mexico City Policy, which requires foreign NGOs to certify that they will not “perform or actively promote abortion as a method of family planning” with non-U.S. funds as a condition for receiving U.S. global health assistance, the governments of Belgium, Denmark, the Netherlands, and Sweden co-organized the “SheDecides” conference in early 2017 to address potential funding losses to broader reproductive health. Whether these new and renewed commitments can increase overall FP funding levels or replace potential declines from the U.S. remains to be seen and ongoing tracking of donor government efforts will continue to be critical.

Methods

Bilateral and multilateral data on donor government assistance for family planning (FP) in low- and middle-income countries were collected from multiple sources. The research team collected the latest bilateral assistance data directly for 10 governments: Australia, Canada, Denmark, Germany, France, the Netherlands, Norway, Sweden, the United Kingdom, and the United States during the first half of 2017. Data represent the fiscal year 2016 period for all governments. Direct data collection from these donors was desirable because they represent the preponderance of donor government assistance for family planning and the latest official statistics – from the Organisation for Economic Co-operation and Development (OECD) Creditor Reporting System (CRS) (see: http://www.oecd.org/dac/stats/data) – which are from 2015 and do not include all forms of international assistance (e.g., funding to countries such as Russia and the Baltic States that are no longer included in the CRS database).  In addition, the CRS data may not include certain funding streams provided by donors, such as FP components of mixed-purpose grants to non-governmental organizations. Data for all other OECD DAC member governments – Austria, Belgium, Czech Republic, the European Union, Finland, Greece, Hungary, Iceland, Ireland, Italy, Japan, Korea, Luxembourg, New Zealand, Poland, Portugal, the Slovak Republic, Spain, and Switzerland – who collectively accounted for less than 2 percent of bilateral family planning disbursements, were obtained from the OECD CRS and are from calendar year 2015.

For purposes of this analysis, funding was counted as family planning if it met the OECD CRS purpose code definition: “Family planning services including counselling; information, education and communication (IEC) activities; delivery of contraceptives; capacity building and training.”5  Where it was possible to identify funding amounts, family-planning-related activities funded in the context of other official development assistance sectors (e.g. education, civil society) are included in this analysis. Project-level data were reviewed for Canada, Denmark, France, Germany, the Netherlands, Norway, and Sweden to determine whether all or a portion of the funding could be counted as family planning. Family-planning-specific funding totals for the United States were obtained through direct data downloads and communications with government representatives. Funding attributed to Australia and the United Kingdom is based on a revised Muskoka methodology as agreed upon by donors at the London Summit on Family Planning in 2012. Funding totals presented in this analysis should be considered preliminary estimates based on data provided by representatives of the donor governments who were contacted directly.

It was difficult in some cases to disaggregate bilateral family planning funding from broader reproductive and maternal health totals, as the two are sometimes represented as integrated totals. In addition, family-planning-related activities funded in the context of other official development assistance sectors (e.g. education, civil society) have in the past remained largely unidentified.  For purposes of this analysis, we worked closely with the largest donors to family planning to identify such family-planning-specific funding where possible. In some cases (e.g. Canada), specific FP percentages were recorded for mixed-purpose projects.  In other cases, it was possible to identify FP-specific activities by project titles in languages of origin, notwithstanding less-specific financial coding. In still other cases, detailed project descriptions were analyzed. (see Appendix 3 for detailed data table).

Bilateral funding is defined as any earmarked (FP-designated) amount and includes family planning-specific contributions to multilateral organizations (e.g. non-core contributions to the Global Programme to Enhance Reproductive Health Commodity Security at UNFPA). U.S. bilateral data correspond to amounts disbursed for the 2016 fiscal year. UNFPA contributions from all governments correspond to amounts received during the 2016 calendar year, regardless of which contributor’s fiscal year such disbursements pertain to.

With some exceptions, bilateral assistance data were collected for disbursements. A disbursement is the actual release of funds to, or the purchase of goods or services for, a recipient.  Disbursements in any given year may include disbursements of funds committed in prior years and in some cases, not all funds committed during a government fiscal year are disbursed in that year. In addition, a disbursement by a government does not necessarily mean that the funds were provided to a country or other intended end-user. Enacted amounts represent budgetary decisions that funding will be provided, regardless of the time at which actual outlays, or disbursements, occur. In recent years, most governments have converted to cash accounting frameworks, and present budgets for legislative approval accordingly; in such cases, disbursements were used as a proxy for enacted amounts.

UNFPA core contributions were obtained from United Nations Executive Board documents. UNFPA estimates of total family planning funding provided from both core and non-core resources were obtained through direct communications with UNFPA representatives. Other than core contributions provided by governments to UNFPA, un-earmarked core contributions to United Nations entities, most of which are membership contributions set by treaty or other formal agreement (e.g., United Nations country membership assessments), are not identified as part of a donor government’s FP assistance even if the multilateral organization in turn directs some of these funds to FP.  Rather, these would be considered as FP funding provided by the multilateral organization, and are not considered for purposes of this report.

The fiscal year period varies by country.  The U.S. fiscal year runs from October 1-September 30. The Australian fiscal year runs from July 1-June 30.  The fiscal years for Canada and the U.K. are April 1-March 31.  Denmark, France, Germany, the Netherlands, Norway, and Sweden use the calendar year.  The OECD uses the calendar year, so data collected from the CRS for other donor governments reflect January 1-December 31. Most UN agencies use the calendar year and their budgets are biennial.

All data are expressed in US dollars (USD).  Where data were provided by governments in their currencies, they were adjusted by average daily exchange rates to obtain a USD equivalent, based on foreign exchange rate historical data available from the U.S. Federal Reserve (see: http://www.federalreserve.gov/) or in some cases from the OECD.  Data obtained from UNFPA were already adjusted by UNFPA to represent a USD equivalent based on date of receipts.

Appendices

Appendix 1: London Summit on Family Planning (2012)

In July 2012, the U.K. Government and the Bill & Melinda Gates Foundation, in partnership with UNFPA, civil society organizations, developing countries, donor governments, the private sector, and multilateral organizations met at the London Summit on Family Planning (FP2020) and made commitments aimed at improving access to voluntary family planning services.

London Summit on Family Planning Goals & Outcomes: “By 2020, the goal is to deliver contraceptives, information, and services to a total of 380 million women and girls in developing countries so they can plan their families.”

  • Sustain coverage for the estimated 260 million women in the world’s poorest countries who are currently using contraceptives (as of June 2012); and
  • Provide family planning for an additional 120 million women in these countries.
  • The Summit resulted in stated commitments totaling US$2.6 billion in additional funding for family planning activities from all sources (donor governments, non-governmental organizations, philanthropies, multilateral organizations, and domestic resources).

Appendix 2: Other Sources of Funding for FP in Low- & Middle-Income Countries

In addition to donor governments, there are three other major funding sources for family planning assistance: multilateral organizations, the private sector, and domestic resources.

Multilateral Organizations: Multilateral organizations are international organizations made up of member governments (and in some cases private sector and civil society representatives), who provide both core contributions as well as donor-directed funding for specific projects. Core support from donors is pooled by the multilateral organization, which in turn directs its use, such as for family planning. Donor-directed or earmarked funding, even when provided through a multilateral organization, is considered part of a donor’s bilateral assistance.

The primary multilateral organization focused on family planning is the United Nations Population Fund (UNFPA), which estimates that it spent US$319 million (US$76 million from core resources and US$243 million from non-core resources), or 40% of its total resources, on family planning activities in 2016.6  Another important source of multilateral assistance for family planning is the World Bank which provides such funding under broader population and reproductive health activities and hosts the Secretariat for the Global Financing Facility (GFF).

Private Sector: Foundations (charitable and corporate philanthropic organizations), corporations, faith-based organizations, and international non-governmental organizations (NGOs) provide support for FP activities in low- and middle-income countries not only in terms of funding, but through in-kind support; commodity donations; and co-investment strategies with government and other sectors. For instance, the Bill & Melinda Gates Foundation has become a major funder of global health efforts, including family planning activities, and is a core partner of FP2020. In 2016, the Gates Foundation provided US$181 million for family planning.7 

Domestic Resources: Domestic resources include spending by country governments that also receive international assistance for FP and spending by households/individuals within these countries for FP services.  Such resources represent a significant and critical part of the response.  Since the London Summit, a total of 41 low- and middle-income countries have made specific commitments to increase their family planning spending.

Appendix 3: Donor Government Bilateral Disbursements for Family Planning, 2012-2016* (in current US$, millions)
Country20122013201420152016Notes
Australia$43.2$39.5$26.6$12.4$14.9Australia identified A$18.4 million in bilateral FP funding for the 2016-17 fiscal year using the FP2020-agreed methodology, which includes funding from non-FP-specific activities (e.g. HIV, RH, maternal health and other sectors) and a percentage of the donor’s core contributions to several multilateral organizations (e.g. UNFPA). For this analysis, Australian bilateral FP funding did not include core contributions to multilateral institutions. However, it was not possible to identify and adjust for funding to other non-FP-specific activities in most cases. Data for 2016 are preliminary.
Canada$41.5$45.6$48.3$43.0$43.8Bilateral funding is for family planning and reproductive health components of combined projects/activities in FY16-17; family planning-specific activities cannot be further disaggregated. Reproductive health activities without family planning components are not reflected.  This is a preliminary estimate.
Denmark$13.0$20.3$28.8$28.1$30.7Bilateral funding is for family planning-specific activities in 2016.
France$49.6$37.2$69.8$68.6$39.9Bilateral funding is new commitment data for a mix of family planning, reproductive health and maternal & child health activities in 2012-2016; family planning-specific activities cannot be further disaggregated.
Germany$47.6$38.2$31.3$34.0$37.8Bilateral funding is for family planning-specific activities.
Netherlands$105.4$153.7$163.6$165.8$183.1The Netherlands budget provided a total of US$469.5 million in 2016 for “Sexual and Reproductive Health & Rights, including HIV/AIDS” of which an estimated US$183.1 million was disbursed for family planning and reproductive health activities (not including HIV); family planning-specific activities cannot be further disaggregated.
Norway$3.3$20.4$20.8$8.1$5.7Bilateral funding is for family planning-specific activities, narrowly-defined under the corresponding DAC subsector 13030. Overall bilateral and multilateral Norwegian support to Sexual and Reproductive Health and Rights (SRHR) including family planning was NOK1.186 billion ($142 million) in 2016.
Sweden$41.2$50.4$70.2$66.0$92.5Bilateral funding is for combined family planning and reproductive health activities; family planning-specific activities cannot be further disaggregated. None of Sweden’s top-magnitude health activities appears to reflect an exclusive family-planning-specific subsector focus, indicative of the integration of FP activities into broader health initiatives in ways similar to those employed by some other governments. It thus may not be possible to identify exact amounts of Swedish bilateral or multi-bi FP financing.
U.K.$252.8$305.2$327.6$269.9$203.4In the financial year 2016/17, the UK spending on family planning was £171.23 million. This is a provisional estimate, using the FP2020-greed methodology, which includes funding from non-FP-specific activities (e.g., HIV, RH, maternal health and other sectors) and a percentage of the donor’s core contributions to several multilateral organizations. For this analysis, UK bilateral FP funding of £155.4 million was calculated by removing unrestricted core contributions to multilateral organizations. However, it was not possible to identify and adjust for funding for other non-FP-specific activities in most cases. The nominal 2014-16 US$ decrease is significantly exchange-rate-related. Bilateral funding is for combined family planning and reproductive health, consistent with the agreed-on methodology. A final estimate will be available after DFID publishes its annual report for 2016/17 in 2018.
U.S.$485.0$585.0$636.6$638.0$532.7Bilateral funding is for combined family planning and reproductive health activities; while USAID estimates that most funding is for family planning-specific activities only, these cannot be further disaggregated.
Other DAC Countries**$11.0$29.5$9.0$10.1$3.3Bilateral funding was obtained from the Organisation for Economic Co-operation and Development (OECD) Credit Reporting System (CRS) database and represents funding provided in the prior year (e.g. data presented for 2016 are the 2015 totals, the most recent year available; 2015 presents 2014 totals; etc.).
Total$1,093.6$1,325.0$1,432.7$1,344.0$1,187.8
*For purposes of this analysis, family planning bilateral expenditures represent funding specifically designated by donor governments for family planning as defined by the OECD DAC (see methodology), and include: stand-alone family planning projects; family planning-specific contributions to multilateral organizations (e.g. contributions to UNFPA Supplies); and, in some cases, projects that include family planning within broader reproductive health activities. During the FP2020 Summit, donors agreed to a revised Muskoka methodology to determine their FP disbursements totals. This methodology includes some funding designated for other health sectors including, HIV, reproductive health (RH), maternal health, and other areas, as well as a percentage of a donor’s core contributions to several multilateral organizations including UNFPA, the World Bank, WHO, and the Global Fund to Fight AIDS, Tuberculosis and Malaria. Among the donors profiled, Australia and the U.K. reported FP funding using this revised methodology.
**Austria, Belgium, Czech Republic, European Union, Finland, Greece, Hungary, Iceland, Ireland, Italy, Japan, Korea, Luxembourg, New Zealand, Poland, Portugal, the Slovak Republic, Slovenia, Spain, and Switzerland.

Appendix 4: United Nations Population Fund (UNFPA) Mission, Goals, & London Summit on Family Planning Commitment (2012)

Created in 1969, UNFPA supports sexual and reproductive health activities in many low- and middle-income countries and was a key partner in the London Summit on Family Planning.

UNFPA Goal: “The goal of UNFPA is to deliver a world a world where every pregnancy is wanted, every childbirth is safe and every young person’s potential is fulfilled. To accomplish this, UNFPA works to ensure that all people, especially women and young people, are able to access high quality sexual and reproductive health services, including family planning, so that they can make informed and voluntary choices about their sexual and reproductive lives.”8 

UNFPA Mandate:

  • “Build the knowledge and the capacity to respond to needs in population and family planning;
  • Promote awareness in both developed and developing countries of population problems and possible strategies to deal with these problems;
  • Assist their population problems in the forms and means best suited to the individual countries’ needs; and
  • Assume a leading role in the United Nations system in promoting population programmes, and to coordinate projects supported by the Fund.”9 

UNFPA London Summit on Family Planning Commitment (2012): “UNFPA will double the proportion of its resources focused on family planning from 25% to 40 % based on current funding levels, bringing new funding of at least US$174 million per year from core and noncore funds. This will include a minimum of US $54 million per year, from 2013-2019, in increased funding for family planning from UNFPA’s core resources.”

Endnotes

  1. Includes core-contributions from members of the OECD DAC only; core contributions from non-DAC donors are not included in this total. ↩︎
  2. The Kaiser Family Foundation initiated a family planning resource tracking project in 2013, adapting the methodology it has long used to track donor government spending on HIV. Since 2002, the Joint United Nations Programme on HIV/AIDS (UNAIDS) and the Kaiser Family Foundation have been tracking donor government assistance for HIV in low- and middle-income countries by the donor government members of the Organization for Economic Co-operation and Development’s (OECD) Development Assistance Committee (DAC). For the methodological approach used to monitor donor government spending on HIV see: https://modern.kff.org/global-health-policy/report/financing-the-response-to-aids-in-low/. ↩︎
  3. Includes funding from 29 DAC member countries and the European Union(EU). ↩︎
  4. U.S. appropriations for family planning (FP) activities in a given fiscal year may be disbursed over a multi-year period. Therefore, while U.S. appropriations for FP have been relatively flat over the past several years, the actual disbursements have fluctuated over the same period. ↩︎
  5. OECD, The List of CRS Purpose Codes and Voluntary Budget Identifier Codes, July 2017. ↩︎
  6. UNFPA, Direct communication, September, 2017. ↩︎
  7. Bill & Melinda Gates Foundation, Direct communication, November, 2017. ↩︎
  8. UNFPA, “Frequently Asked Questions” (http://www.unfpa.org/frequently-asked-questions), accessed November, 2017. ↩︎
  9. UNFPA, “Frequently Asked Questions” (http://www.unfpa.org/frequently-asked-questions), accessed November, 2017. ↩︎
News Release

Donor Government Funding for Family Planning Fell in 2016 for the Second Year in a Row

Published: Dec 5, 2017

new Kaiser Family Foundation report finds that donor government funding for family planning declined in 2016 for the second year in a row, decreasing to US$1.19 billion compared to US$1.34 billion in 2015.

While the declines over this two-year period were largely due to exchange rate fluctuations and the timing of donor disbursements which accounted for 78 percent of the overall decrease, there were actual cuts in funding from some donor countries which accounted for 22 percent. Among the 10 donors profiled in the report, four donors decreased funding, including the two largest donors (the U.S. and the U.K.); five increased funding; and one remained flat.

The U.S. remained the largest donor, providing US$532.7 million, or 45 percent of total bilateral funding for family planning programs in 2016. The U.K. (US$203.4 million) was the second largest bilateral donor, followed by the Netherlands (US$183.1 million), Sweden (US$92.5 million), and Canada (US$43.8 million).

This analysis is being released at the same time as Family Planning 2020’s (FP2020) annual report.

An Early Assessment of Hurricane Harvey’s Impact on Vulnerable Texans in the Gulf Coast Region: Their Voices and Priorities to Inform Rebuilding Efforts

Authors: Liz Hamel, Bryan Wu, Mollyann Brodie, Shao-Chee Sim, and Elena Marks
Published: Dec 5, 2017

Executive Summary

In late August 2017, Hurricane Harvey pummeled the Texas Gulf Coast, dropping record amounts of rainfall and causing damage with estimates ranging as high as $190 million.1  In an effort to understand the needs and circumstances of vulnerable Texans affected by the hurricane, the Kaiser Family Foundation and the Episcopal Health Foundation partnered to conduct a representative survey of adults living in 24 counties along the Texas coast that were particularly hard-hit. The survey – which was conducted between two to three months after Harvey made landfall – allows for examination of the views and experiences of residents in these counties overall, as well as in four distinct geographic regions: Harris County (the county where Houston is located and the largest in terms of population); the counties surrounding Harris that are part of the same Regional Council of Governments (“Outside Harris”); the three counties (Orange, Jefferson, and Hardin) that make up the “Golden Triangle” area east of Houston where the cities of Beaumont, Orange, and Port Arthur are located; and several counties to the southwest of Houston that make up the coastal area including Corpus Christi and Rockport (“Coastal”). In addition to the survey, the partners conducted three focus groups in Houston and two in Beaumont with low- and middle-income residents who were affected by the storm.

Key findings from the survey include:

Two-thirds of residents of the 24 hard-hit Texas counties surveyed report being affected by Hurricane Harvey in terms of damage to their homes or vehicles, employment disruption, or income loss. Four in ten sustained damage to their home, nearly half experienced an interruption or loss of employment or some other loss of income, and one in five had a vehicle that was damaged. One in nine remain displaced from their homes at the time of the survey.

Effects of the hurricane were unevenly distributed by geography and demographics. Black and Hispanic residents, those with lower incomes, and those living in the Golden Triangle and Coastal areas were more likely to be affected by property damage or income loss than other residents.

Health and mental health issues affected a smaller share of the population, but some residents report struggling to get needed health care, and focus groups suggest some may have unmet mental health needs. One in six affected residents say someone in their household has a health condition that is new or worse as a result of Harvey, and nearly two in ten feel that their own mental health is worse because of the storm. Among those with a new or worsened health condition, six in ten say they have skipped or postponed needed medical or dental care, cut back on prescriptions, or had problems getting mental health care since the storm.

About half of those who have applied for disaster assistance from FEMA or the SBA say their application is still pending or has been denied, and many of those who were denied say they were not told the reason for the denial and were not given information on how to resubmit their application. About a quarter of those whose homes were damaged say they had any flood insurance. Four in ten of those who were affected say they expect none of their financial losses to be covered by insurance or other assistance.

The financial situations of most people affected by Harvey are tenuous. About half of affected residents say they have no savings whatsoever, and another quarter say that if they lost their job or other source of income, their savings would be exhausted in less than 6 months.

Survey: Three months after Hurricane Harvey, nearly half of affected Texas residents say they are not getting the help they need to recover

Nearly half of affected residents say they are not getting the help they need to recover from the hurricane. Particular areas that stand out where residents say they need more help include applying for disaster assistance and repairing damage to their homes.

Local, county, and state governments receive high marks from residents for their response to Hurricane Harvey so far. Residents are more mixed in their views of how the U.S. Congress has responded, and responses tilt negative when it comes to President Trump’s response. Four in ten affected residents are not confident relief funds will benefit those most in need.

For the community overall, including for affected residents, the top priorities seen for the recovery focus on basic needs, including financial assistance and housing. Top priorities are getting financial assistance to those who need it, rebuilding destroyed homes, and making more affordable permanent and temporary housing available.

Key Findings: Introduction

Hurricane Harvey made landfall as a Category 4 hurricane near Rockport, Texas on August 25, 2017. Three months later, many Texans in the affected areas continue to recover and rebuild their lives and their communities from this unprecedented natural disaster.

With a record 52 inches of rainfall and massive winds in parts of the region, the flooding caused by the storm had widespread and devastating effects. A total of 41 counties in Southeast Texas were designated as federal disaster areas. As of mid-November, 888,866 individual assistance applications had been received by the Federal Emergency Management Agency (FEMA) and $8.73 billion in federal funds had been provided to affected Texans.2  In some of the hardest hit communities, many residents remain displaced from their homes, and finding continued shelter for these individuals is a major public policy concern. The storm also affected more than 1 million students and 220 school districts across the region.

In order to provide policymakers, funders, and others working on the recovery effort with reliable information about how Texas residents were affected by Hurricane Harvey and what their needs and priorities are when it comes to recovery, the Kaiser Family Foundation and the Episcopal Health Foundation partnered to conduct a representative survey of residents in 24 counties along the Texas Gulf Coast that were heavily impacted by property damage from the storm. Both partners worked together to design the survey and analyze the results. The 24 counties were chosen based on a mapping analysis of Harvey property damage developed by FEMA (see Appendix A Figure One), in an effort to examine a contiguous area of counties that suffered the largest share of property damage. The region surveyed divides into four groupings of counties: Harris County (the county where Houston is located and the largest in terms of population); the counties surrounding Harris that are part of the same Regional Council of Governments (“Outside Harris”); the three counties that make up the “Golden Triangle” area east of Houston where the cities of Beaumont, Orange, and Port Arthur are located; and several counties to the southwest of Houston that make up the coastal area including Corpus Christi and Rockport (“Coastal”).3 

These 24 counties are home to approximately 7.95 million people, which represents 94 percent of the total population in the 41 counties that were declared as federal disaster areas. This region is incredibly diverse in terms of race and ethnicity (40 percent White, 36 percent Hispanic, 16 percent Black, six percent Asian, and two percent others). On average about 15 percent of the people in the affected region are officially designated as living in poverty, with wide variations in poverty across the counties.4  These counties are also diverse in their population density; eight of the counties we surveyed were designated as rural counties and 16 as urban counties.

The survey was designed to represent the views of residents living in the region overall, and also be able to describe the views and experiences of those living in each of the four regions. In order to represent some of the most vulnerable groups affected by the storm, the survey also included oversamples of lower-income residents, Black and Hispanic residents, and those living in the areas that had the largest amount of property damage as reported by FEMA. Results for the region overall have been weighted to reflect the demographics of the overall population. The survey was fielded from late October through late November, roughly two to three months after Harvey made landfall.

In addition to the survey, the partners conducted five focus groups (three in Houston and two in Beaumont) on October 8 and 9 with lower- and middle-income residents who experienced damage to their homes and/or a loss of income as a result of Hurricane Harvey. The focus group findings highlighted in this report help provide context and add the human story behind some of the quantitative findings from the survey.

Key Findings: Section 1: The Big Picture: Who Was Affected By Harvey And How?

Housing, Property Damage, Employment, and Income Effects

Hurricane Harvey left a trail of physical destruction along the Texas Gulf Coast, and the survey finds that a large share of area residents felt the effects in their own lives. Overall, two-thirds of adults in the 24 Texas Gulf Coast counties surveyed say they were adversely affected by the hurricane, either because their home or vehicle was damaged or because they or a family member in their household experienced the loss of a job, decreased wages, or other lost income.

More specifically, more than four in ten residents (43 percent) report that their home was damaged, including one in five who say their home had major damage (16 percent) or was completely destroyed (3 percent). About one in five (21 percent) also say they owned a vehicle that was damaged or destroyed by Harvey. Nearly half (46 percent) say they or someone in their household experienced employment-related effects of the hurricane, including losing a job or being laid off (12 percent), having hours cut back at work (32 percent), or some other loss of income such as from a small business or unpaid missed days of work (32 percent).

Figure 1: Two-Thirds of Residents in Harvey-Affected Texas Gulf Coast Counties Report Experiencing Property Damage or Income Loss

For more detail on residents’ housing and transportation situation, see Section 4For more detail on residents’ employment and financial situation, see Section 5

The effects of Hurricane Harvey were felt more heavily in some communities than others. Geographically, those in the Golden Triangle (77 percent) and Coastal counties (74 percent) were more likely to report being affected than those in Harris County and the counties that surround it (65 percent and 63 percent, respectively), with differences largely driven by higher rates of property damage. Effects were also distributed unevenly across demographic groups, with Black and Hispanic residents and those with lower incomes more likely to report being affected. For Hispanics, this disparity is largely driven by higher rates of employment- related effects, while for Blacks it is driven both by employment effects and by higher rates of damage to their homes and vehicles. Not surprisingly, those with lower incomes – who are less likely to hold salaried jobs and more likely to work on an hourly or contract basis – are more likely to report adverse effects on employment and income as a result of the storm. However, the income disparity is not limited to employment effects; lower- and middle-income individuals are also more likely to report damage to their homes compared to those with higher incomes.

Figure 2: Share of Texas Gulf Coast Population Affected by Hurricane Harvey Differs by Geography, Race/Ethnicity, and Income
 Table 1: Detailed Effects of Hurricane Harvey by Geographic Region, Race/Ethnicity, and Income
Percent who report the following as a result of Hurricane Harvey:Geographic RegionRace/EthnicitySelf-reported Income(% of FPL)
Harris CountyOutside HarrisGolden TriangleCoastalWhiteBlackHisp.<100100 to <200200 to <400400+
Home was damaged (NET)38%42%62%64%38%55%45%53%44%44%32%
Major damage/ destroyed1522352321231622201917
Minor damage2319264016322931242414
Vehicle was damaged2415321416302325232018
Someone in household experienced income/job loss4940464431466559504829
NET Affected in any of above ways6563777455737979656753

Since race and income are correlated, it can be difficult to determine whether the disparities in storm-related effects are driven more by one factor or the other. Our analysis indicates that both race/ethnicity and income play a role, but that some racial and ethnic differences persist regardless of income. For example, Hispanic residents at both higher and lower income levels are more likely than their white counterparts to say someone in their household experienced employment-related disruptions as a result of the storm – specifically having hours cut back at work. Nearly six in ten (58 percent) Hispanics who report incomes below 200 percent of the federal poverty level (FPL) say this happened, compared with three in ten lower-income Blacks (31 percent) and two in ten lower-income whites (19 percent). And for those with self-reported incomes above 200 percent of poverty, Hispanics are almost twice as likely as whites to say a family member had their hours cut back (37 percent versus 20 percent).5 

Table 2: Percent Reporting Different Effects from Hurricane Harvey by Race and Income
Percent who report the following as a result of Hurricane Harvey:Self-reported Income <200% FPLSelf-reported Income 200% FPL or higher
WhiteHispanicBlackWhiteHispanic
Home was damaged46%48%59%35%42%
Vehicle was damaged162532*1720
Someone in household was laid off or lost a job14172256
Someone in household had hours cut back at work1958*31*2037*
Someone in household had other loss of income3145*371936*
NET Affected in any of above ways6182*74*5371*
Note: * indicates statistically significant difference from white residents in the same income category.

Effects on Physical and Mental Health

In addition to the reported effects on people’s finances and living situations, some residents also report problems with their physical and mental health as a result of Hurricane Harvey. Overall, 13 percent of residents in the 24-county area (including 17 percent of those who suffered property damage or income losses and 4 percent of those who did not) say someone in their household has a health condition that is new or has gotten worse as a result of Harvey. Similarly, 13 percent of all residents (including 18 percent of those who suffered property or income losses and 3 percent of those who did not) feel that their own mental health has gotten worse as a result of the hurricane.

Figure 3: Some Residents Report Health Effects From Harvey, Particularly for Those Affected by Property Damage or Income Loss

For more detail on residents’ health care challenges, see Section 6

Key Findings: Section 2: Are Affected Residents Getting The Help They Need?

Residents’ General Level of Recovery

Three months after the storm, residents’ self-reported level of recovery from Hurricane Harvey is somewhat mixed. Among those who were affected by property damage or income loss from the storm, just over half say their lives are largely (25 percent) or almost back to normal (31 percent), while about four in ten say their lives are still somewhat (28 percent) or very disrupted (16 percent). Once again, those living in the Golden Triangle area appear to be the hardest hit, with roughly six in ten affected residents saying their lives are still somewhat (29 percent) or very disrupted (33 percent).

Figure 4: Affected Residents in the Golden Triangle Are More Likely to Say Their Personal Situation Is Still Disrupted After Harvey

When asked to name in their own words the biggest challenge facing their family in recovering from Hurricane Harvey, affected residents focus on basic needs like housing and financial stability. One-third (33 percent) say their biggest challenges are financial, including general financial problems (11 percent), making up lost wages (8 percent), and problems keeping up with bills (6 percent). Another third (32 percent) mention housing-related challenges, including 16 percent who mention home repairs and 5 percent who mention trying to find a new living situation. Eight percent mention transportation issues including the need to repair or replace a vehicle, five percent mention health challenges, including mental health or stress, and four percent name family-related issues.

Figure 5: Those Affected by Harvey Cite Financial Issues, Housing as Biggest Challenges in Personal Recovery

The survey shows there is room for progress in getting needed help to affected residents. Nearly half (45 percent) of those who were affected in terms of property damage or income loss say they are getting the help they need to recover from Hurricane Harvey, while an equal share (45 percent) say they are not. Here, too, progress is uneven, with Black residents and those with lower incomes more likely to say they’re not getting the help they need.

Figure 6: Blacks and Lower-Income Residents Less Likely to Say They Are Getting the Help They Need to Recover from Harvey

Experiences with Disaster Assistance

One major source of help for people affected by natural disasters in the U.S. is disaster assistance provided by the Federal Emergency Management Agency (FEMA) and low-interest loans provided by the U.S. Small Business Administration (SBA). Overall, about four in ten (44 percent) residents who were affected by Hurricane Harvey, including 59 percent of those whose homes were damaged, say they have applied for assistance from FEMA or the SBA. Among those who applied, one quarter (26 percent) say their application has been approved and one-third (33 percent) say it was denied. Another 19 percent say their application is still pending, and 16 percent are not sure of the status.

Among those who applied for assistance from FEMA or the SBA, those who report incomes at least four times FPL (45 percent) and those whose home had major damage or was destroyed (36 percent) are more likely to say their application was approved. In addition, white and Hispanic residents who applied for assistance are more likely than Black residents who applied to say their application was approved (34 percent, 28 percent, and 13 percent, respectively).

Figure 7: Roughly Four in Ten Harvey-Affected Residents Say They Applied for Disaster Assistance, with Mixed Results

Among the 30 percent of those who applied for FEMA or SBA assistance who say their application was denied, four in ten (38 percent) say they were not told why their application was denied, and six in ten (59 percent) say they were not given information on how to revise and resubmit their application.

Figure 8: Many Who Were Denied FEMA Aid Say They Weren’t Told Why, and Most Did Not Receive Information on How to Resubmit

When those who did not apply for FEMA assistance were asked why they did not apply, most (63 percent) said they had only minor damage or did not feel they needed the help. However, some said they lacked information about how to apply (12 percent), they didn’t think they would qualify (8 percent), or they thought it would be too much hassle or too difficult to go through the process (5 percent).

Focus group highlight: Disaster assistance

The focus group discussions indicated that there is a lot of confusion and misinformation among affected residents about the different ways to get assistance. Participants were frustrated by the bureaucracy of applying for help, which they don’t feel they have time for while taking care of their families, trying to find work, and rebuilding their homes (a few participants said it took at least 3 hours of waiting to speak with a live operator on a FEMA call). There was also the perception that FEMA adjusters were temporary hires, not well-trained or familiar with the affected communities, and that your likelihood of getting approved for assistance depended on the particular adjuster who visited your home.

In the Hispanic groups in particular, there was a resistance to taking out loans that they’d be repaying for many years. Many thought that SBA loans would come with high interest rates. Others were frustrated that in order to get an SBA loan you need to have money in the bank and a minimum credit score, which many of them did not have, and some undocumented immigrants mentioned the need to have a social security number to apply. These discussions suggest that people could benefit from navigators to understand the different sources of help (FEMA, SBA, Red Cross and other charities) and to navigate the application and appeals process.

“And then the FEMA lines are, you can’t even get through. Then you have to go through the whole process with FEMA. They may still come out and, just like [indicates another focus group participant], I was denied just like him. Right now, even if I want to try and go through a whole process to even fight with FEMA, I have to go through a whole entire appeal. My roof is still…there’s still big bubbles in the roof.” – 40-year-old Black female, Houston

“They came to my house and they walked [around] my house and saw the damage. And they gave me $364.29. I know people who didn’t have as much damage as I had that got thousands… I think it just all depends on the person that came to your house. The man that came to my house, he was like giving us real serious. He wasn’t caring, he wasn’t compassionate. He was in and out. But I have a friend that had a lady and she was very nice. She came and walked through the house. She was compassionate. She didn’t even have as much damage as I did and she got like $2500.” – 59-year-old Black female, Beaumont

“There’s a certain way you have to answer it [the application for assistance]. If you answer one question [ wrong ], even if you misunderstood or didn’t understand it or comprehend the question, they deny you.” – 29-year-old Hispanic male, Beaumont

“If FEMA was referring us to the Small Business Loan, why do have to have all this credit score and amount of money saved up? We could go through a regular bank.” – 40-year-old Black female, Houston

Areas where Additional Help is Needed

Related to this confusion around accessing FEMA benefits, the most common area in which residents say they need more help is applying for disaster assistance, with 34 percent of affected residents saying they need help in this area. A close second is repairing damaged homes, an area in which 29 percent of affected residents say they need assistance. Some also say they need help finding affordable permanent or temporary housing, finding a job, getting transportation, and accessing medical care and mental health care. For most of these areas, Black residents, those with lower incomes, and those in the Golden Triangle area are more likely than others to say they need more help.

Table 3: Many Affected Residents Say They Need Help in Different Areas
Percent of those AFFECTED by Harvey who say they need more help in each area: Total affected residentsGolden TriangleSelf-reported Income <200% FPLBlack residents
Applying for disaster assistance34%47%43%55%
Repairing damage to home29523538
Finding affordable permanent housing17252327
Getting medical care17222627
Finding temporary housing13242024
Finding a job13172019
Getting transportation10121523
Getting mental health care10131421

When asked about the different types of help they may have received from government agencies, local charities, or other organizations, about a third of affected residents (35 percent) say they’ve gotten help paying for food, including half (51 percent) of those living in the Coastal region and 41 percent living in the Golden Triangle area. Much smaller shares of affected residents say they’ve gotten help paying for housing or utilities (9 percent), paying for health care (7 percent), finding employment (5 percent), or accessing mental health services (5 percent).

Figure 9: A Third of Harvey-Affected Residents Say They’ve Gotten Help Paying for Food, Far Fewer Report Getting Help in Other Are

Key Findings: Section 3: What Do Residents See As The Biggest Priorities For Recovery, And How Do They Rate The Local, State, And Federal Response?

When asked about priorities for rebuilding and recovery in their area, Texas Gulf Coast residents – including those who were affected by the hurricane and those who weren’t – identify many areas where more resources are needed, with the largest focus being on financial help and housing for those in need. The highest-ranking priority overall is getting financial help to people who need it; 64 percent say more resources are necessary in this area and when forced to choose, 19 percent pick it as the top priority. A close second is rebuilding destroyed homes (63 percent say more resources are necessary and 17 percent choose it as the top priority). Ranking third and fourth are making more affordable permanent and temporary housing available, with nearly six in ten saying more resources are necessary and 12 percent choosing each as the top priority. About half also say more resources are needed in cleaning up pollutants released by the flooding (49 percent), removing trash and debris (49 percent), and helping small businesses affected by the storm (48 percent), while about four in ten say the same about repairing damaged schools (42 percent), getting mental health services to those who need them (42 percent), and repairing roads and highways (40 percent). Ranking of priorities is similar when looking at responses only among those who were directly affected by the storm.

Figure 10: Priorities For Rebuilding Harvey-Affected Areas Focus on Financial Help and Housing

Looking at residents overall – including those who were affected by the storm and those who weren’t – most give their local, county, and state governments positive marks for the job they’re doing responding to Hurricane Harvey, with about seven in ten saying each is doing an excellent, very good, or good job. Ratings are more divided when it comes to the U.S. Congress, with 46 percent saying they’re doing at least a good job and 43 percent saying they’re doing a fair or poor job. Ratings are more negative for President Trump, with half (49 percent) saying the president is doing a fair or poor job responding to the hurricane and about four in ten (43 percent) giving him positive ratings.

Figure 11: Local, County, and State Governments Receive Positive Marks for Harvey Response; President and Congress More Mixed

Among those who were directly affected by the storm, views of the government’s response are similar, but tend to lean more negative than among the public overall. In particular, affected residents living in the Golden Triangle area, the counties surrounding Harris County, are more likely than those living in Harris and the Coastal counties to say each level of government is doing a fair or poor job responding to the hurricane. For example, about four in ten residents of the Golden Triangle and the counties surrounding Harris say that government officials in their county are doing a fair or poor job responding to Harvey, compared with about a quarter in Harris County and the Coastal counties. The exception to this pattern is in ratings of President Trump, whom Harris County residents rate more negatively than others.

Table 4: Ratings of Government Response to Harvey Among Those Directly Affected
Percent of those AFFECTED by Harvey who say each is doing a “fair” or “poor” job responding to Hurricane Harvey:Total affected residentsHarris CountyOutside HarrisGolden TriangleCoastal
Local officials in your city or town25%22%31%35%*23%
Government officials in your county282436*38*25
Texas state officials25242833*22
The U.S. Congress4441504943
President Trump5358*464846
Note: * indicates statistically significant difference from at least one other region.

Overall, about six in ten residents – including majorities in each of the four geographic areas – say they are very or somewhat confident that the money being spent on hurricane relief in Texas will benefit the people who need it most, while 38 percent say they are not too or not at all confident. However, those who were directly affected by the storm are more likely than those who were not affected to say they are not confident that money spent on relief will reach those who need it most (42 percent versus 30 percent, rising to nearly half – 46 percent – among those whose homes had major damage or were destroyed). Those who remain displaced from their homes (52 percent), those who say their FEMA application was denied (56 percent), those who say they or a family member have a health condition that is new or worse as a result of the storm (58 percent), and those who feel their own mental health is worse (59 percent) are particularly likely to lack confidence that funds will reach the people who need them most.

Figure 12: Four in Ten Harvey-Affected Residents Are Not Confident Relief Funds Will Benefit Those Most in Need
Focus group highlight: Equity in distribution of aid

In each of the five focus groups, when asked about the channels for receiving help after the hurricane, participants raised concerns about some people abusing the system and getting help they don’t need, while others who really need help are going without it. There was some tension in the groups between the need to verify information from people applying for aid to make sure abuse doesn’t happen, and wanting the process to be simpler so people who need help can get it faster.

“I’ve dealt with this in Wisconsin. I’ve dealt with FEMA like on three different occasions. It was nothing near as dramatic as I dealt with here. And I had less problems there than I had here. I just don’t get it. They can pick and choose. Is it cherry-picking? How do they do it? Do they cherry-pick, just like with Red Cross?” – 40-year-old Black female, Houston

“So many millions of dollars – they said that on TV. They don’t know where the money is, where the help is. The economic help. It’s not gonna reach us. It’s gonna reach those who have the money, who have insurance.” – 45-year-old undocumented Hispanic male, Houston

“I know people that came from Louisiana in 2005 after Katrina. They were living large. They were exchanging FEMA checks…and getting stuff they didn’t need.” – 42-year-old Hispanic male, Houston

Key Findings: Section 4: More Details On Housing And Transportation Issues

HOUSING DAMAGE AND DISPLACEMENT

The most visible and catastrophic harm wrought by Hurricane Harvey was the damage – sometimes irreparable – to residents’ homes and living spaces. As noted in Section 1, more than four in ten residents (43 percent) of the 24 counties surveyed say their home was damaged as a result of the hurricane, including 3 percent who say it was completely destroyed, 16 percent who say it suffered major damage requiring more than a month to repair, and 23 percent who say there was minor damage that could be repaired within a month. The numbers are starkest in the Golden Triangle, where 62 percent reported damage, including 35 percent who say their home either had major damage or was destroyed. Reported home damage was also common, but less severe, in the Coastal counties; 64 percent in that area say their home was damaged, with the major portion (40 percent) saying the damage was minor and could be repaired within a month.

Figure 13: Four in Ten Texas Gulf Coast Residents Report Home Damage Due to Harvey, Higher in Golden Triangle and Coastal Area

In addition to these geographic disparities, Black residents and those with lower incomes were also somewhat more likely than their white and higher-income counterparts to report damage to their homes.

Figure 14: Lower-Income and Black Residents More Likely to Report Home Damage Due to Harvey

More than half (55 percent) of those whose homes were damaged by Harvey are homeowners, but 42 percent (including 60 percent of those with self-reported incomes below the federal poverty level) are renters. Renters are more likely than owners to report that the damage to their home was minor (62 percent versus 48 percent), while owners whose homes were damaged are more likely to say the damage was major or that their home was destroyed (50 percent versus 37 percent).

Among those whose homes were damaged, half (48 percent) say they had homeowners’ or renters’ insurance and 23 percent had flood insurance; combined, 51 percent report having at least one type of insurance. Lower-income residents are much less likely to report having insurance; three in ten (30 percent) of those with self-reported incomes below 100 percent FPL whose homes were damaged say they had any. Similarly, Black and Hispanic residents are less likely than whites to report having insurance; among those whose homes were damaged, two-thirds of whites, half of Blacks, and one-third of Hispanics say they had any insurance.

Figure 15: Among Those with Home Damage, Lower-Income, Black, and Hispanic Residents Less Likely to Report Having Insurance
Focus group highlight: Homeowners and flood insurance

Among focus group participants, many homeowners did not have flood insurance and either say they were told they didn’t need it or that they just didn’t think it was worth the cost. Even among those who have purchased flood insurance, many seemed to lack the knowledge and skills (literacy) to navigate the insurance system.

“In my area they tell me, you don’t need flood insurance because you don’t live next to a lake, or you don’t have any water near you. So you don’t need flood insurance, just the hazard insurance in case you have a fire or something. How can you imagine that everything was going to flood like this?” – 58-year-old Hispanic male, Houston

“I’ve been paying for this insurance all this time and I think I got one thing, but I just never went to just actually get a full low-down on what it was. I come to find out…I got this insurance, but the water would have to come through the window.” – 64-year-old Black male, Beaumont

Overall, 37 percent of those living in the 24 Texas counties surveyed, rising to 54 percent in the Golden Triangle area and 68 percent in the Coastal counties, say they evacuated or left their home for some amount of time as a result of Hurricane Harvey. About one in nine residents overall (11 percent), including 24 percent in the Golden Triangle area, were still displaced from their homes at the time of the survey. Among those who have not returned to their pre-Harvey home, half say their housing costs have increased, including 28 percent who say they’ve increased a lot.

Figure 16: One in Ten Residents in Harvey-Affected Counties, Including a Quarter in Golden Triangle, Have Not Returned to Their Homes

Most residents who evacuated temporarily say they feel safe after returning to their homes, however some report that they are living in unsafe conditions. Among those who evacuated and have returned to their homes, 32 percent say they moved back in before they felt it was safe, including 13 percent (rising to 24 percent in the Golden Triangle area) who still felt their home was unsafe at the time of the survey.

Focus group highlight: Living conditions

Most focus group participants who have returned to their homes said they felt safe because they’re more comfortable at home than anywhere else (those who were staying with relatives pointed out how stressful that can be). Still, many reported living in unsafe conditions: one woman with a hole in her roof has to take out buckets each time it rains, another sleeping on the couch in her living room can’t cook in her kitchen because of debris falling from the ceiling. While most renters said their landlords were treating them well overall, a few had complaints about landlords not fixing things and sometimes leaving them living in dangerous situations. Many were also afraid to push back on their landlords for fear that they would have to move out and would have nowhere else to go.

“We’ve got this, like a lot of people, just this open roof, where water…I have two buckets where the water is draining in. And I’ve had quotes come in to fix the roof, and it’s too much. We don’t have thousands of dollars sitting in the bank. I’m living there, but every time it rains I’m like, ‘Okay, get the buckets out.’ I’ve got plastic draped over it. And I’m going through a lot of health issues…I’m not working too well right now. I’m home watching this water drain in, and I’m like, ‘What else is gonna come in through the roof?’ I mean I had a rat come in the house once. I’m scared to death. It’s just an awful way of living.” – 55-year-old white female, Houston

“My landlords, they know I have 3 babies – 8 months, 2 years, and 4 years. I have a sewer problem. I have sewer water that’s underneath about half of my house. When the hurricane hit, I had water raise up, probably about the full 3 feet under the house. And my floors are like bowing now. They’ve been taking my rent money, promising me to come fix stuff. And they just haven’t come… I’m a single mom of three, and I just don’t have – it’s what about $150 to go to court? I know the options I can take…going, taking them to small claims court. In the end, we’d have to move. My closest family is in Austin. I don’t have anybody down here. I don’t wanna be like the other people at the homeless shelter with my babies. Housing’s limited right now.” – 29-year-old white female, Beaumont

“I’m still scrubbing and it’s moldy and it stinks. I tell [my landlords] and they say, ‘You know we have other people, I’ll get to you.’ They do the best they can here and there. – 53-year-old Black female, Houston

“It’s hard staying with relatives though. It’s fine to visit relatives, but when you actually have to stay, it’s not the same.” – 47-year-old Black female, Houston

Vehicle Damage and Transportation Issues

Beyond damage to their homes, many residents report having damage to a vehicle as a result of the hurricane. Overall, 21 percent of residents say they had a vehicle such as a car or truck that was damaged by Harvey, including somewhat larger shares of those living in the Golden Triangle and Harris County compared with other areas, and a larger share of Black residents compared with whites.

Figure 17: Black and Hispanic Residents and Those in Golden Triangle and Harris County More Likely to Report Vehicle Damage

Among those whose vehicle was damaged, about half (51 percent) say they have been able to repair or replace their vehicle, while the other half (47 percent) say they have not. Lower-income adults who experienced vehicle damage are less likely than those with higher incomes to say they’ve been able to repair or replace their vehicle. Among those who have not been able to repair or replace their vehicle, about half (51 percent) say there is convenient public transportation in their area that allows them to get to work or other places they need to go, while the other half (48 percent) say there is not.

Figure 18: Lower-Income Residents with Harvey-Related Vehicle Damage Less Likely to Report Having Vehicle Repaired or Replaced

Key Findings: Section 5: More Details On Employment And Financial Issues

Employment Disruption and Loss of Income

While damage to homes and other property was surely the most visible impact of Hurricane Harvey, interruptions in employment were a common occurrence and caused financial disruptions for many residents, particularly when combined with the cost of repairing damage to their home or repairing or replacing a damaged vehicle. Overall, nearly half (46 percent) of residents say they experienced some type of job or income loss as a result of Harvey, including 12 percent who say they or a family member was laid off or lost a job, 32 percent who say someone in their household had their hours cut back at work, and 32 percent who say they experienced another loss of income, such as from a small business or unpaid missed days of work.

Job and income effects were evenly distributed geographically for the most part, but were much more commonly reported among Hispanic (65 percent) and Black residents (46 percent) compared with whites (31 percent), and among those with lower incomes compared to those with higher incomes.

Figure 19: Hispanic, Black, and Lower-income Residents More Likely to Report Employment-Related Effects from Harvey

On the other hand, some residents report taking on extra work since the hurricane; three in ten residents affected by the storm say that since Harvey, they or another family member in their household has taken on an extra job or worked more hours to make ends meet.

Focus group highlight: Employment disruptions

Focus group participants reported a range of employment disruptions in the wake of Hurricane Harvey. For many, the effects were temporary, while others were still struggling to find work three months after the storm. Many participants were self-employed or contract or hourly workers who lost several weeks of work due to the storm, but had since returned to work. Some reported that they still had less work than they did before Harvey, while others said their work level returned to normal after several weeks. A few who work in construction or home repairs said that after a lull, they now have more work than they did before the storm. On the other hand, a few participants – particularly in the Beaumont groups – reported that they had lost their jobs entirely and were still without work several months after the hurricane.

“I work installing alarm systems. It was touch and go, like everyone said, for about almost a month because I didn’t have places to go to, then the traffic was so bad. We were doing 10% of what we normally do on a day because we couldn’t get around. It was slow because in this industry you start getting clients slowly. You start putting clients on the line, and by the time they’re ready to go, then that’s when you start doing installations…I would say 5-6 weeks before I was really back into it.” – 38-year-old Hispanic male, Houston

“I’m still without a job. My whole job was destroyed. I worked at a library, and they don’t know when it will be open. I’m still looking for a job. I filed for unemployment but it will stop next week. I need to find work before next week.” – 24-year-old Black female, Beaumont

“There is more work now. Absolutely more work. Everybody that works construction, cleaning – a lot of work.” – 58-year-old Hispanic male, Houston

Financial Circumstances of Affected Individuals

While insurance payments and FEMA assistance may be a financial help for some, many residents either don’t have access to these benefits or don’t expect them to cover a major portion of their financial losses. Among all those who were affected by the storm, just one in five (22 percent) expect that insurance and other financial assistance they receive will cover most of the financial losses they experienced. Three in ten (29 percent) say they expect it to cover just some of their losses, and 42 percent say they expect none of their losses to be covered.

Similarly, among those who had a vehicle damaged, half say they expect insurance to cover none of the cost of repairing or replacing their vehicle, while 27 percent expect insurance to cover most of the cost and one in five say it will cover just some. Lower-income adults are much less likely than those with higher incomes to say insurance will cover most of the cost of repairing or replacing a vehicle (19 percent of those who report incomes below 200 percent FPL versus 4o percent of those with higher incomes).

Figure 20: About Half of Those Affected by Harvey Expect at Least Some of Their Financial Losses to be Covered

The financial impacts of Hurricane Harvey have led to serious consequences for some residents who were affected by the storm, particularly among Black and Hispanic residents and those with lower incomes. For example, three in ten (29 percent) affected residents – rising to 36 percent of Hispanics and 40 percent of those who report incomes below the poverty level – say that since Harvey, they have fallen behind in paying their rent or mortgage. One quarter of affected residents, including 37 percent of Black residents, say they have had problems paying for food since the storm. In addition, about four in ten affected residents say that since the hurricane, they have borrowed money from friends or relatives (39 percent), and one in eight (13 percent) say they have borrowed from a payday lender to make ends meet.

Table 5: Financial Problems Reported by Those Affected by Hurricane Harvey
Total residentsRace/EthnicitySelf-reported Income (% of FPL)
WhiteBlackHispanic<100100 to <200200 to <400400+
Percent of AFFECTED residents who say each has happened since Harvey:
Fallen behind in paying rent or mortgage29%18% 31% 36% 40% 29% 32% 8%
Had problems paying for food25 17372533292410
Had utilities turned off because you didn’t pay the bill10 5 12 14 17 12 7 3
Percent of AFFECTED residents who say they have done the following since Harvey to make ends meet:
Borrowed money from friends or relatives3928554150473618
Taken on an extra job or worked extra hours3028283330334319
Borrowed money from a payday lender13214201716133

It’s worth noting that the financial circumstances of many of those who were affected by Harvey were tenuous even before the hurricane, and few report having many financial resources to fall back on. About half (48 percent) of affected residents say they have no savings whatsoever, and another quarter (24 percent) say that if they lost their job or other source of income, their savings would be exhausted in less than 6 months. This level of financial instability is much more common among Black and Hispanic residents compared with whites, and among those with lower incomes compared with higher-income individuals.

Figure 21: Many Harvey-Affected Residents Say They Do Not Have Savings to Fall Back On
Focus group highlight: Financial stress

Most focus group participants we spoke with were feeling financially stressed. Many were living paycheck-to-paycheck before Hurricane Harvey hit, and did not have the means to absorb the financial hit of missing several weeks of work because of the storm. They feel behind on their bills and prioritize financial help to allow them to catch up. Some are still struggling to pay for food and basic items like clothing for their children. For many (particularly among Hispanics), there was pride associated with working one’s own way back from a bad situation and not taking “handouts.” Many thought of themselves as entrepreneurs and didn’t want something for free, but would like a boost to help get their business going or to find more work.

“Yes, we’re still catching up. We’re still catching up with our bills. We’re not at where we were at before. And now you’re having to limit a lot… My son wanted a pizza. They’re charging me like $5 for a pizza I pay $1 for at the store…I was trying to save a few bucks that I do have, but for my son of course I’m going to do it for him. I spent that $5 even though we were not going to have enough to eat again for the next couple days.” – 42-year-old Hispanic female, Houston

“The stress we get is because we don’t have the money to fix things, so the help to cope with stress will be economic help actually.” – 37-year-old undocumented Hispanic female, Houston

“[Asked what type of help you need] Financing to help you get through until the insurance money comes. For a lot of people, by the time the insurance money comes you had to take money from so many other places, borrow so much money from family and friends. Some of that money you have to use just to get even on what you got behind on.” – 64-year-old Black male, Beaumont

Key Findings: Section 6: More Details On Health And Mental Health Issues

Health Conditions and Access to Care

Below the surface, and often related to the housing and financial problems they are facing, some residents report problems with their physical and/or mental health as a result of their experiences with Hurricane Harvey. Overall, one in eight residents (13 percent) say they or another family member in their household has a health condition that is new or has gotten worse as a result of the storm. Those who were affected by home damage or income loss are more likely to report a new or worsened health condition (17 percent), but still a small share of those who were not affected (4 percent) report such a condition. Among those who were affected, Black and residents and those living in the Golden Triangle are somewhat more likely to report a decline in the health of someone in their household (25 percent each).

Among those who report that someone in their household has a new or worsened health condition, 38 percent mention a respiratory condition such as asthma, allergies, or cough, and 20 percent mention mental health issues including anxiety, depression, and general stress.

Figure 22: Blacks, Whites, and Golden Triangle Residents More Likely to Say Someone in Household Has Health Problems Due to Harvey

While Hurricane Harvey may have led to new or worsened health problems for some residents, it’s worth noting that many affected residents lacked consistent access to health insurance and health care providers even before the storm. Four in ten (39 percent) of those who were affected by Harvey say that they do not have health insurance. Reported lack of coverage is highest among Hispanic (53 percent) and Black residents (39 percent) affected by the storm, as well as those who report incomes below 200 percent of the poverty level (53 percent).

In addition, three in ten Harvey-affected residents (31 percent) say they have no usual place they go for care when they are sick or need advice about their health, or that their usual source of care is a hospital emergency room. This is highest among affected Black (39 percent) Hispanic residents (38 percent) and those with self-reported incomes below 200 percent of poverty (40 percent).

Figure 23: Minorities and Lower-Income Adults Affected by Harvey More Likely to Lack Health Insurance and Access to Health Providers

Since Hurricane Harvey, some residents report skipping or postponing medical care or having problems paying medical bills, with much higher rates among those who have someone in their household with a new or worse health condition resulting from the storm. For example, 36 percent of those who say someone in their household has a new or worse health condition due to Harvey say that they or another family member has put off or postponed getting needed health care since the storm, 32 percent say a family member has skipped dental care or check-ups, and 31 percent say they have not filled a prescription, cut pills in half, or skipped doses of a medicine. In addition, 10 percent of residents overall, including 26 percent of those with a health problem due to Harvey, say they’ve had problems paying medical bills since the storm.

Figure 24: Six in Ten of Those with Harvey-Related Health Conditions Say They Have Postponed Some Type of Medical or Dental Care
Focus group highlight: Accessing health care

Many participants in the focus groups did not have health insurance, though some who were working have insurance through their jobs and some others in Houston have access to a county health program. Most of the uninsured said insurance was just too expensive and they prefer to deal with health issues as they happen. Many reported relying on home remedies or visiting clinics or urgent care centers when they get sick.

“My insurance just went out, and I know it’s gonna cost me going to the clinic. I’m just kind of calling around trying to figure out what’s going to be the cheapest one. Because even with unemployment, I’m not getting what I was getting when I was working.” – 29-year-old white female, Beaumont

“Whatever your gramma told you to do, that’s the remedy. Ibuprofen for pain and tea for your throat. That’s it. And you save $250 on doctor’s visits.” – 33-year-old undocumented Hispanic female, Houston

Stress and Mental Health Issues

The trauma associated with living through a disaster like Harvey and its aftermath can lead to increased stress and declines in mental health for some people. While most residents of the Texas counties surveyed (64 percent) say their mental health is excellent or very good, those who were affected by Harvey are less likely than those who were not affected to rate their mental health as excellent (35 percent versus 48 percent) and more likely to rate it as fair or poor (17 percent versus 7 percent).

Overall, 13 percent of residents – including 18 percent of those who were affected by property damage or income loss and 3 percent of those who were not affected – feel that their mental health has gotten worse as a result of the storm. Among those who were affected, some also say they have had a harder time controlling their temper or felt they had a shorter fuse since Harvey (22 percent), that they’ve increased their alcohol use (7 percent), or that they’ve started a new medication for mental health problems since Harvey (6 percent).

Mental health needs may be most acute in the Golden Triangle area. Among affected residents, those living in the Golden Triangle are more likely to say their mental health has gotten worse (33 percent) and that they’ve had a harder time controlling their temper since the storm (36 percent).

Figure 25: One-third of Harvey-Affected Residents Report Some Effect on Mental Health Due to Harvey, Highest in Golden Triangle

Access to care is also a problem for some with mental health needs. Fifteen percent of those who say their mental health is worse as a result of the hurricane say they or a family member have had problems getting mental health care since the storm.

In addition to formal mental health services, informal support networks can be a key source of help for individuals coping with the stress of living through a disaster like Hurricane Harvey. The survey finds that few affected residents report having a robust support network of relatives and friends living nearby. Just one in five affected residents (19 percent) say they have “a lot” of people nearby who they can rely on for help or support, with another 17 percent saying they have “a fair amount.” Six in ten say they have “just a few” (47 percent) or no people living nearby who they can rely on (17 percent). Black and Hispanic residents and those with lower incomes are also more likely than others to say they lack a robust support network.

Table 6: Many Affected Residents Say They Lack Nearby Support Networks
Thinking about your personal support network – how many people do you have living nearby who you can rely on for help and support?Total affected residentsRace/EthnicitySelf-reported Income(% of FPL)
WhiteBlackHispanic<100100 to <200200 to <400400+
A lot/A fair amount (NET)36%48%26%31%25%25%42%57%
A lot1929121613142134
Fair amount1719141512122123
Just a few/No people living nearby (NET)6452746875755842
Just a few4739515355574332
No people living nearby1714241520181410
Focus group highlight: Mental health issues

Most focus group participants reported some level of increased stress or mental strain due to the storm. Several said that whenever it starts raining, they have flashbacks or start worrying. Others said the stress comes from the financial problems they face and multiple worries about how they are going to find enough work to get back on their feet financially, while finding time to fix up their house and take care of their families. Some mentioned their children’s stress levels, or the strain of trying to keep things “normal” for their kids while they were personally stressed. To deal with stress, some people said they focus on work, others said they spend time with family, have a few drinks, and fire up the barbecue. Many (particularly in Beaumont) said they turned to prayer.

While acknowledging mental health problems, most participants tended to downplay the importance of seeking professional help and see their ability to address other stressors, especially economic and housing, as key to resolve their mental stress. When asked about whether they sought mental health counseling, most hadn’t considered it, with the exception of one young woman in Beaumont. But many seem to have unmet mental health needs. One young man who was unemployed said, “I really don’t have a way of coping with it, I just live with it,” and another young man sitting next to him said, “You took the words right out of my mouth.”

“Whenever it rains I get very scared that it’s gonna start over.” – 52-year-old Hispanic female, Houston

“I feel stressed out still. Even though it’s over, I still have that stress. You know, thinking that we have to fix that room, that we need another car, my husband has been working only for a week and a half. He needs to switch jobs now because the person he was working with, his home was flooded.” – 37-year-old undocumented Hispanic female, Houston

“My mother is 83 and she is a cancer survivor for over 17 years. Now, she’s going to her sister’s house during the week and then she’ll come stay with me on the weekends… My mom is such a ticker for worrying about being a burden on someone else… Thanksgiving is a major holiday for her. We may have a hundred people at our house… We’ll cook dinner, and we’ll cook for everybody there. And like, ‘Okay, what are we going to do this year?’ She’s always saying, ‘This may be my last year’… Sometimes the weight can be really, really heavy – not just for you but for everybody. Our family’s close. So when something affects one, it’s like a domino effect because it’s gonna affect everybody. But we pull together.” – 53-year-old Black female, Beaumont

“We survived today, and we’re gonna get through tomorrow. I’m not gonna go pay $65 an hour to go talk to somebody about what’s going on.” – 42-year-old Hispanic female, Houston

“I pray, but it’s getting to the point to where it’s starting to affect where like my stress on being able to take care of my kids is overwhelming. They have like MMHR I think, and they have like just the counseling. I’ve been thinking of calling…just because I feel like it’s just overwhelming.” – 29-year-old white female, Beaumont

Key Findings: Section 7: Language And Immigration Issues

Immigrants, particularly those who do not speak English well or do not have legal resident status in the U.S., can be particularly vulnerable to the effects of natural disasters and their aftermath for many reasons, including that they may lack the literacy necessary to navigate the systems in place to help people affected, they may be ineligible for benefits, or they may be hesitant to seek help for fear of exposing their own or a family member’s legal status.

Figure 26: Majority of Likely Undocumented Immigrants Worry About Drawing Attention to Legal Status if They Seek Help

The survey used questions to determine the likely immigration status of respondents by asking those who were born outside the U.S. whether they were a permanent resident (i.e. had a green card) when they came to the U.S. or if their status had been changed to permanent resident since arriving. Overall, 12 percent of residents in the 24-county area, including 27 percent of Hispanics, say they have not been granted permanent resident status, indicating that they are likely to be undocumented immigrants. Of this group, seven in ten (73 percent) were directly affected by Harvey, including two-thirds (68 percent) who experienced a disruption in their employment and three in ten who say their home was damaged.

Among those who are likely to be undocumented immigrants, a majority says they are very worried (39 percent) or somewhat worried (17 percent) that if they try to get help in recovering from the hurricane, they will draw attention to their own immigration status or that of a family member. Even among immigrants who are legal residents, about one in five (21 percent) worry about drawing attention to someone else’s status.

Language issues also presented a barrier for some individuals, regardless of immigration status. Among Hispanics who completed the survey in Spanish (42 percent of all Hispanics), three in ten say it was very or somewhat difficult to find the information they needed in Spanish when trying to get recovery help, while four in ten say it was easy and another quarter say they did not seek help.

Figure 27: Three in Ten Spanish Speakers Say It Was Difficult to Find Information in Spanish When Seeking Help After Harvey
Focus group highlight: Language and immigration issues

Two of the focus groups in Houston were conducted in Spanish, including one with individuals who identified as undocumented immigrants. Most Spanish speakers said that when seeking information or help since the hurricane, they were able to find people to help them in Spanish. However, most also felt that it took longer to get help in Spanish than in English, and that Hispanics were getting less help than others. For those who are undocumented, some said they did not want to seek assistance because they expected to be asked for a social security number, or they feared being reported to immigration. Most turned to informal networks (friends, families, and neighbors) for help rather than official sources.

“They check it [identification] for everything. Even for giving you help, they want your social security. They want to look at your taxes.” – 45-year-old undocumented Hispanic male, Houston

“My sister-in-law, they were gonna cut off her power and the company said to call an organization. First thing they told her is, ‘If you don’t have a Texas ID, we cannot help you.’” –42-year-old undocumented Hispanic female, Houston

“What happens is, as Hispanics in the Hispanic community, we don’t really have a federal program or a government program to help the small businesses like ours. We don’t really have an agency that we can go to.” – 58-year-old Hispanic male, Houston

Key Findings: Conclusion

Overall, the survey and focus group results provide an early snapshot of the biggest challenges facing vulnerable Texas Gulf Coast residents three months after Hurricane Harvey cut its wide swath across the region. With about half of affected individuals saying they are not getting the help they need to recover from the storm, residents prioritize basic needs like repairing damaged homes, help finding temporary and permanent shelter, and financial assistance to help affected individuals get back on their feet. The results also suggest that there is ongoing confusion about the different ways to get financial assistance, and that many affected residents could benefit from navigators or other resources to help with the application process. Finally, these results demonstrate that lower-income individuals, Black and Hispanic residents, and those living in the Golden Triangle area were particularly hard-hit by the effects of Harvey and continue to lag in the recovery, suggesting that organizations focused on recovery should keep a focus on these communities as they move forward from short-term to long-term recovery efforts.

Appendices

Appendix A: Survey and Focus Group Methodology

Survey Methodology

The Kaiser Family Foundation/Episcopal Health Foundation Post-Harvey Survey was conducted by telephone October 17 – November 20, 2017 among a random representative sample of 1,635 adults age 18 and older living in 24 counties along the Texas Gulf Coast. The counties were chosen based on a mapping analysis of Harvey property damage developed by FEMA, in an effort to examine a contiguous area of counties that suffered the largest share of property damage (see Figure 1). The region was further divided into four groupings of counties: 1) Harris County; 2) Counties surrounding Harris (Liberty, Chambers, Galveston, Brazoria, Matagorda, Wharton, Colorado, Austin, Waller, Fort Bend, Montgomery, and Walker counties); 3) Golden Triangle (Jefferson, Hardin, and Orange counties); and 4) Coastal counties (Nueces, San Patricio, Refugio, Aransas, Calhoun, Victoria, Jackson, and Lavaca counties).

Appendix A – Figure 1: Counties included in survey sample based on FEMA damage assessments

Interviews were administered in English and Spanish, combining random samples of both cellular and landline telephones (note: persons without a telephone could not be included in the random selection process). Sampling, data collection, weighting and tabulation were managed by SSRS in close collaboration with Kaiser Family Foundation and Episcopal Health Foundation researchers. Episcopal Health Foundation paid for the costs of the survey fieldwork, and Kaiser Family Foundation contributed the time of its research staff. Both partners worked together to design the survey and analyze the results.

The sampling procedures were designed to reach set numbers of respondents in each of the four county-groups and to oversample particular vulnerable subpopulations who were likely to require assistance in the aftermath of the hurricane, namely: people who experienced property damage as a result of the hurricane, those with household incomes near or under poverty level, Hispanic residents (in particular, non-native Hispanics), and Black residents. Some respondents were reached by oversampling cellular and landline numbers matching directory-listings in areas where data from the Federal Emergency Management Agency (FEMA) indicated large amounts of property damage due to Harvey. The sampling and screening procedures included an oversample component designed to increase the number of low-income respondents, specifically low-income Hispanic and Black respondents. This included 104 respondents who were reached by calling back respondents in the affected areas who had previously completed an interview on the SSRS Omnibus poll and indicated they fit one of the oversample criteria (based on income and race).

The dual frame cellular and landline phone sample was generated by Survey Sampling International (SSI) using random digit dial (RDD) procedures. All respondents were screened to verify that they resided in one of the 24 counties covered by this study at the time Harvey hit Texas. For the landline sample, respondents were selected by asking for the youngest adult male or female currently at home based on a random rotation. If no one of that gender was available, interviewers asked to speak with the youngest adult of the opposite gender. For the cell phone sample, interviews were conducted with the adult who answered the phone.

A multi-stage weighting design was applied to ensure an accurate representation of the population of each county-group. The first stage of weighting involved corrections for sample design, including accounting for oversampling of the most-affected areas, as well as non-response for the callback sample. In the second weighting stage, demographic adjustments were applied to account for systematic non-response along known population parameters, within each county-group. Population parameters included gender, age, race, Hispanic origin (broken down by nativity), educational attainment, and phone status (cell phone only or reachable by landline). This stage excluded the low-income oversample component. Based on this second stage of weighting, estimates were derived for the share of low-income respondents (Black, Hispanic and other) in the population. The third stage of weighting included all respondents in each county-group and included income-status (low or high) by race/ethnicity based on the previous stage’s outcomes. In the last stage each county-group was weighted to accurately represent its adult-population share within the 24-county region. Weighting parameters were provided by SSI based on estimates from the U.S. Census Bureau’s 2016 American Community Survey (ACS) for Harris County and 5-year (2011-2015) cumulative data from the ACS for other county groups.

The margin of sampling error, including the design effect for the full sample, is plus or minus 3 percentage points. Numbers of respondents and margins of sampling error for key subgroups are shown in the table below. For results based on other subgroups, the margin of sampling error may be higher. Sample sizes and margins of sampling error for other subgroups are available by request. Note that sampling error is only one of many potential sources of error in this or any other public opinion poll. Kaiser Family Foundation public opinion and survey research is a charter member of the Transparency Initiative of the American Association for Public Opinion Research.

GroupN (unweighted)Margin of sampling error
Total residents1,635+/-3 percentage points
            Harris714+/-5 percentage points
            Outside Harris310+/-7 percentage points
            Golden Triangle305+/-7 percentage points
            Coastal306+/-6 percentage points
Affected by Harvey1,113+/-4 percentage points
            Harris461+/-6 percentage points
            Outside Harris186+/-9 percentage points
            Golden Triangle239+/-8 percentage points
            Coastal227+/-8 percentage points

Focus Group Methodology

As part of this project, the Kaiser Family Foundation and the Episcopal Health Foundation conducted focus groups to gather qualitative data from vulnerable populations affected by Hurricane Harvey. Topics covered in the focus groups were similar to those covered in the survey. The groups were held in Houston on November 8-9, 2017 and Beaumont on November 9, 2017. In total, five two-hour groups were conducted with eight participants each.

To qualify for each group, individuals must have said: 1) that their total family income from all sources in 2016, before taxes, was less than $60,000; and 2) that they experienced damage to their home or vehicle or lost job-related income as a result of Hurricane Harvey, and that the loss was at least a minor problem for them and their family. In addition, participants in each session were recruited with several additional aims: That at least half said their loss of income or property was a major problem for them and their family, and at least half said they their home had major damage or was destroyed. Recruitment also aimed to target a mix of owners and renters.

In Houston, two groups were conducted with Hispanics in Spanish – one of which consisted of participants who self-identified as undocumented immigrants. A third Houston group, consisting of mixed races/ethnicities, was conducted in English. In Beaumont, two groups were conducted in English, one with Black residents and the other with participants of mixed races/ethnicities. Participants in four of the groups were given an incentive of $100, and participants in one Houston group were given $125 since the group was conducted in the morning, a more difficult time to recruit for.

ConneXion Research recruited and provided moderator services for each group. The Houston groups were held at ConneXion’s research facility, and the Beaumont groups were held at a health service organization. The screener questionnaire and discussion guide was developed by researchers at the Kaiser Family Foundation and the Episcopal Health Foundation. Groups were audio and video recorded with participants’ permission. Focus group costs were paid for by the Episcopal Health Foundation.

Appendix B: Additional Resources

In Episcopal Health Foundation’s (EHF) initial effort to study the scope of property damage caused by Harvey, staff created a user-friendly, interactive map by using a geographic information system (GIS) mapping file from the FEMA website. The analysis was conducted using parcel data on buildings and homes, as well as flood inundation data showing the depth of water levels in different areas. EHF staff also overlaid the CDC-developed social vulnerability index data on these maps, identifying communities in need of additional support to prepare or recover from a disaster. Staff further identified and analyzed FEMA application data at the zip code level across the 41 counties, showing tremendous diversity of needs in the region.

Endnotes

  1. Vox News, “The stunning price tags for Hurricanes Harvey and Irma, Explained,” September 18, 2017. https://www.vox.com/explainers/2017/9/18/16314440/disasters-are-getting-more-expensive-harvey-irma-insurance-climate ↩︎
  2. Office of the Texas Governor, Commission to Rebuild Texas Update: Issue 10, November 2017. https://gov.texas.gov/news/post/commission-to-rebuild-texas-update-issue-10 ↩︎
  3. The counties included in each cluster are: Cluster One: Harris County; Cluster Two (Surrounding Harris): Liberty, Chambers, Galveston, Brazoria, Matagorda, Wharton, Colorado, Austin, Waller, Fort Bend, Montgomery, and Walker counties; Cluster Three (Golden Triangle): Orange, Jefferson and Hardin; and Cluster Four (Coastal): Nueces, San Patricio, Refugio, Aransas, Calhoun, Victoria, Jackson, and Lavaca counties. ↩︎
  4. Analysis of U.S. Census Bureau American Community Survey data. ↩︎
  5. There were not enough higher-income Black residents in the sample to analyze. ↩︎
News Release

Survey: Three Months after Hurricane Harvey, Nearly Half of Affected Texas Residents Say They are Not Getting the Help They Need to Recover

Residents’ Top Priorities for Rebuilding Focus on Financial Help and Housing; Most Give Local and State Governments Good Marks for Response, But Lower for Federal Officials

Published: Dec 5, 2017
KFF EHF logos.png

KFF/EHF Survey Examines Residents’ Experiences and Views in 24 Hard-Hit Counties across Texas

Two-thirds (66%) of residents across 24 Texas counties report that they suffered property damage, employment disruptions and/or lost income due to Hurricane Harvey, finds a new Kaiser Family Foundation/Episcopal Health Foundation survey. One in nine residents in these hardest-hit counties remain displaced from their homes three months after the storm.

The survey also finds nearly half (45%) of those who suffered losses across the region say they are not getting the help they need to recover, and four in 10 (42%) say they are not confident that relief funds will reach those most in need.

While Harris County and the entire region suffered major damage, the survey results show that the storm disproportionately affected Black and Hispanic residents, low-income residents and people living in both the “Golden Triangle” area, which includes Beaumont, Orange, and Port Arthur, and in the “Coastal” area including Rockport and Corpus Christi.

postharveychart1.png

The new KFF/EHF partnership survey probes deeply into the experiences and views of residents in Houston, Harris County and the many other Texas communities hit hardest by the storm and its aftermath. The partners also conducted five focus groups in Houston and Beaumont as part of the project, which aims to provide leaders working on relief efforts with reliable information about Texas residents’ needs and priorities for ongoing recovery.

“The conventional wisdom that Texans hit by Hurricane Harvey have recovered is wrong,” said Drew Altman, president and CEO of the Kaiser Family Foundation. “The people in the hardest-hit areas are telling us that they still face major hurdles before their lives return to normal.”

“We want government and other recovery funds to use this information to make good decisions about how to reach those most in need,” said Elena Marks, president and CEO of the Episcopal Health Foundation. “This survey gives an important voice to hard-hit communities that may have been forgotten, especially those with the greatest needs and fewest resources following the storm.”

Across the Region, Most Residents Report Suffering Property Damage or Lost Income

The survey provides an extensive look at the breadth of the storm damage to residents’ property and incomes. For example:

  • More than four in ten (43%) report that their home was damaged, including about one in five who say their home either suffered major damage (16%) or was completed destroyed (3%). In the Golden Triangle and Coastal areas, about six in ten report damage to their home.
  • Among those whose homes were damaged, about half (48%) say they had homeowners’ or renters’ insurance, and roughly a quarter (23%) had flood insurance. Lower-income residents, Blacks and Hispanics were all less likely to report having any type of insurance.
  • Nearly half (46%) say they or someone else in their household lost job-related income as a result of the storm, such as getting fewer hours at work (32%), losing a job entirely (12%) or losing income from a small business or unpaid missed days (32%). These income disruptions affected a greater share of Hispanic (65%) and Black (46%) residents compared to White residents (31%).
  • One in five (21%) say they had a car or other vehicle that was damaged or destroyed.
  • Four in 10 (43%) affected residents say they do not expect any of their financial losses to be covered by insurance or other assistance.

Residents’ Top Priorities for Relief: Financial Help and Housing

When asked about priorities for rebuilding and recovery in their area, getting financial help to people who need it tops residents’ lists: nearly two-thirds (64%) say more resources are necessary in this area. A close second is rebuilding destroyed homes (63%), followed by making more affordable permanent housing (58%) and temporary (56%) housing available. These priorities also top the list among those residents who lost property or income due to the storm.

postharveynextchart.png

The large share who want more efforts to get financial help to people in need may reflect the community’s mixed success in navigating federal aid programs. Overall about four in 10 (42%) of affected residents say they applied for financial assistance from the Federal Emergency Management Agency (FEMA) or the Small Business Administration (SBA).

Among those who applied, one quarter (26%) say their application was approved and one-third (33%) say it was denied. The remainder say it is still pending (19%) or they are not sure (16%). Among those who were denied, four in 10 (38%) say they were not given a reason, and six in 10 (60%) say they were not given information on how to revise and resubmit their application.

Perhaps not surprisingly, affected residents say that help applying for disaster assistance topped their personal needs – with a third (34%) saying they needed more help in this area.  A close second is repairing damaged homes, named by 29 percent of affected residents.

Hurricane Harvey’s financial effects have led to serious hardships for many affected residents.  For example, three in ten (29%) of all affected residents report that they or a household member have fallen behind in their rent or mortgage payments since the storm. The shares are largest among Hispanic (36%) and Black residents (31%) and those with self-reported incomes below the federal poverty level (40%).

These financial difficulties reflect that many affected residents have limited financial resources – with nearly half (48%) saying they have no savings at all, and another quarter (24%) saying they would use up their savings within six months if they lost their job or other sources of income.

Some Face New Mental and Physical Health Challenges and Difficulties Affording Care

The storm and its aftermath also are taking a toll on people’s mental and physical health. Overall, 13 percent of residents say someone in their household has a new or worsening health condition due to the hurricane, rising to 17 percent among those who suffered property or income losses.

Many confronting these emerging health problems are struggling to afford and obtain care. About six in 10 (59%) say they have skipped or postponed needed medical or dental care, cut back on prescriptions or had difficulty getting mental health care since the storm.

In addition, 13 percent of residents overall, including 18 percent of those affected by property or income loss, say their mental health has gotten worse as a result of Harvey.

Some affected residents also say they have had a harder time controlling their temper or felt they had a shorter fuse since Harvey (22%), that they have increased their alcohol use (7%), or that they’ve started a new medication for mental health problems since Harvey (6%).

Mental health needs appear most acute in the Golden Triangle area. Among affected residents, those living in the Golden Triangle are more likely to say their mental health has gotten worse (33%) and that they’ve had a harder time controlling their temper since the storm (36%).

Residents Rate Local and State Response Positively, But are Mixed on Federal Officials

Most residents give their local, county, and state governments positive marks for the job they are doing responding to Hurricane Harvey. About seven in 10 say each is doing an excellent, very good, or good job.

Ratings are less positive for federal authorities. Similar shares say that Congress is doing at least a good job (46%) as say it is doing a fair or poor job (43%). Ratings for President Trump are lower still, with about half (49%) saying he is doing a fair or poor job and about four in 10 (43%) saying he is doing at least a good job.

METHODOLOGY

Designed and analyzed by researchers at the Kaiser Family Foundation and the Episcopal Health Foundation, the Texas Post-Harvey Survey was conducted by landline and cellular telephone October 17 – November 20, 2017 among a random sample of 1,635 adults ages 18 and older living in 24 Texas counties that suffered large amounts of property damage from Hurricane Harvey according to FEMA reports. The region was further divided into four groupings of counties: Harris County (N=714), Counties surrounding Harris (N=310), Golden Triangle (N=305), and Coastal counties (N=306). See report for a full list of counties. The margin of sampling error including the design effect for the full sample is plus or minus 3 percentage points. For results based on other subgroups, the margin of sampling error may be higher.

Filling the need for trusted information on national health issues, the Kaiser Family Foundation is a nonprofit organization based in Menlo Park, California.

The Episcopal Health Foundation (EHF) believes all Texans deserve to be healthy. EHF is committed to transforming the health of our communities by going beyond just the doctor’s office. By providing millions of dollars in grants, working with congregations and community partners, and providing important research, we’re supporting solutions that address the underlying causes of poor health. EHF was established in 2013 and is based in Houston. With more than $1.2 billion in estimated assets, the Foundation operates as a supporting organization of the Episcopal Diocese of Texas and works across 57 Texas counties.  #HealthNotJustHealthcare