KFF designs, conducts and analyzes original public opinion and survey research on Americans’ attitudes, knowledge, and experiences with the health care system to help amplify the public’s voice in major national debates.
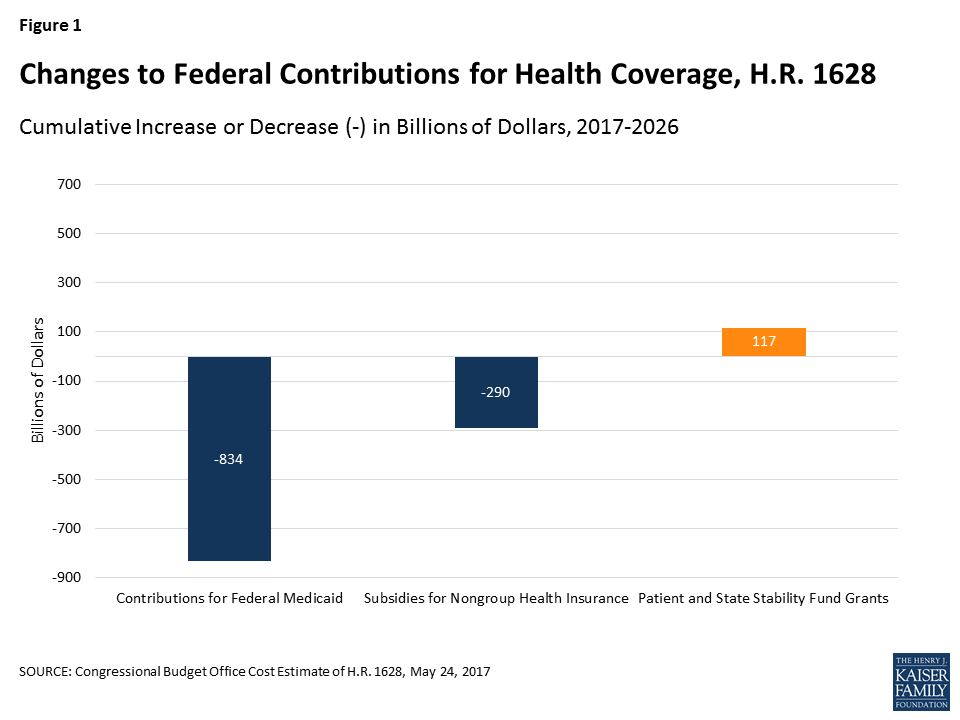
Congress is currently debating the American Health Care Act (AHCA), passed by the House on May 4th 2017. This bill would end the enhanced federal matching funds for the Affordable Care Act (ACA) Medicaid expansion and fundamentally restructure federal Medicaid financing for other eligibility groups. Currently, the federal government matches state Medicaid spending with no limit. The AHCA would cap and significantly reduce federal Medicaid financing provided to states through a per capita cap or, at state option, a block grant for certain populations. Specifically, the AHCA would cap federal Medicaid funding per enrollee starting in FY2020. Each state would have its own federal per enrollee cap based on its Medicaid per enrollee expenditures in 2016 trended forward to 2019. Per enrollee caps would be set for each state by eligibility group. Beginning in 2020, these per enrollee amounts would increase by a set index per eligibility group. These same growth rates would apply to all states. The Congressional Budget Office estimates that the AHCA would reduce federal Medicaid spending by $834 billion from 2017 through 2026.
Current variation in state Medicaid spending per enrollee reflects the flexibility built into the program for states to make policy choices to administer their programs within broad federal rules as well as other factors such as the availability of revenues, demand for service, health care markets, and state budget and policy processes. Using a base year and a uniform index to establish the federal caps, as proposed in the AHCA, would lock in variation in states’ Medicaid spending levels per enrollee and reduce the federal contribution to Medicaid over time. As a result, the proposal would have differential impacts on states’ ability to address changing needs and new health challenges. To understand the potential implications of per capita cap proposals, this data note shows variation in per full-benefit enrollee spending by state and eligibility group.
Medicaid Spending Per Full-Benefit Enrollee
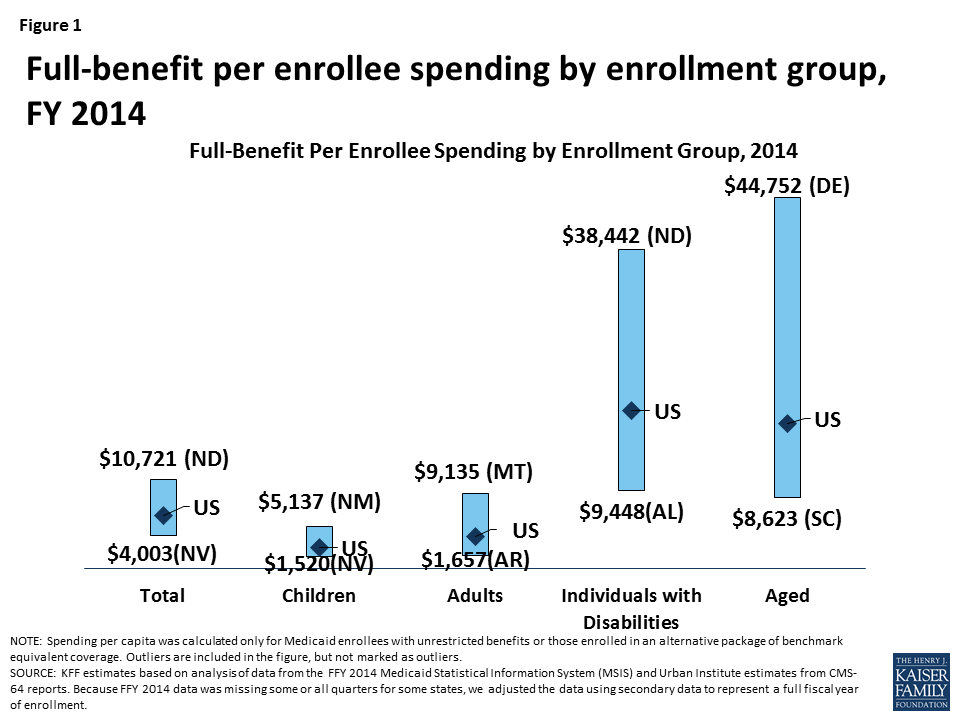
Some Medicaid enrollees are only eligible for “partial benefits.” For example, “partial-benefit enrollees” include those eligible for family planning services only, people who receive only emergency services, those in premium assistance programs, and dual eligibles for whom Medicaid covers only Medicare premiums and cost sharing. Under the AHCA, spending for “partial benefit” enrollees is not subject the cap.1 Among full-benefit enrollees who would be subject to a cap, average Medicaid spending per enrollee was $6,396 in 2014. Per enrollee spending is higher among the aged and individuals with disabilities due to the higher use of complex acute services and long-term care among these populations ($17,476 and $19,033, respectively, for FY 2014). Average spending per Medicaid enrollee was lower for adults and children ($3,955 and $2,602, respectively). For each eligibility group, there is considerable variation across states in per enrollee spending (Figure 1 and Map 1). An additional table provides an index value to show how per enrollee amounts for each state compare to the average per enrollee spending for the US as a whole. For example, spending for full-benefit enrollee ranges from $4,003 to $10,721, or 0.63 (63%) to 1.68 (168%) of the US per enrollee amount.
Figure 1: Full-benefit per enrollee spending by enrollment group, FY 2014
Interactive Map 1: Spending Per Full-Benefit Enrollee, FY 2014 (back to top)
>
Health care spending across payers consistently shows that a small group of high-spenders account for a large majority of the spending. Even within a specific eligibility group within a state, spending varies considerably. We examined states with average per enrollee spending close to the national median and found that wide variation in spending within the eligibility group within states. For example, average spending per disabled enrollee in Pennsylvania is $18,310, but spending ranges from $1,051 for those in the first quartile to $116,515 for those in the top 5th percentile of spending. In Louisiana, spending per aged enrollee ranges from an average of $143 for those in the first quartile to $70,173 for those in the top 5th percentile of spending. Despite the general lower cost for child enrollees, the variation in spending per child was wide in Oklahoma. Similarly, the variation in adult spending per enrollee was wide in Ohio, an expansion state, as well as Mississippi, a non-expansion state. Under a per enrollee cap in federal Medicaid funds, states may face incentives to enroll individuals with lower per enrollee costs or may be challenged to finance their programs if a larger share of high cost individuals enroll.
Table 1: Average Spending Per Full-Benefit Enrollee by Percentile in Select States, FY 2014
Percentile
Aged in Louisiana
Individuals with Disabilities in Pennsylvania
Adults in Ohio
Adults in Mississippi
Children in Oklahoma
0-25%
$143
$1,051
$530
$1,103
$131
>25-50%
$1,436
$10,846
$2,898
$3,625
$735
>50-75%
$16,685
$17,977
$4,981
$4,341
$1,849
>75-90%
$39,931
$23,432
$6,845
$6,293
$4,269
>90-95%
$50,036
$34,642
$10,492
$10,147
$8,186
>95%
$70,173
$116,515
$20,143
$22,205
$24,571
NOTE: We selected states with spending per enrollee for the given eligibility group that was at or close to the national median.SOURCE: KFF estimates based on analysis of data from the FFY 2014 Medicaid Statistical Information System (MSIS) and Urban Institute estimates from CMS-64 reports.
Methods
This analysis is based on KFF estimates from the 2014 Medicaid Statistical Information System (MSIS) and Urban Institute estimates from CMS-64 reports. We adjusted MSIS spending to CMS-64 spending to account for MSIS undercounts of spending. Due to differences in the way CMS-64 and MSIS handle spending for managed long-term services and supports (MLTSS) and increased use of MLTSS in Medicaid, we have revised our methodology of adjusting MSIS to CMS-64. As a result, spending per enrollee totals in this note are not comparable to previously published KFF analysis of Medicaid spending amounts from the MSIS.
Because FY 2014 MSIS data was missing some or all quarters for some states, we also adjusted the enrollment data using secondary data to represent a full fiscal year of enrollment. We accounted for a state’s expansion status, the number of quarters of missing data, and the state’s historical patterns of spending and enrollment in making state-by-state adjustments.
Specifically, for states missing any quarter of enrollment data, we adjusted total enrollment using fiscal year totals in the Medicaid Budget and Expenditure System (MBES), adjusted to account for underlying differences in data between MSIS and MBES. For non-expansion states, we adjusted the distribution of enrollment by eligibility group by using either the existing MSIS data (if any quarters were available) or the previous year’s distribution. For expansion states, we adjusted the distribution of enrollment by eligibility group using either the existing MSIS data (if any expansion quarters were available), the median for expansion states with a full year of data, or the state’s historical distribution (if historical data indicated a higher share of adult enrollment than medians). We estimated full-benefit enrollment among aged, child, and disabled enrollees based on each state’s historical full/partial beneficiary split. We estimated full-benefit enrollment among adult enrollees using either each state’s historical full/partial beneficiary split (for non-expansion states) or, for expansion states, the existing MSIS data (if any expansion quarters were available), the median for expansion states with at least one quarter of expansion data, or the state’s historical distribution (if historical data indicated a higher share of adult enrollment than medians).
We followed a similar approach for adjusting spending data, though fewer spending adjustments were necessary as the spending data had already been adjusted to the full-year CMS-64 data and did not need to account for missing quarters. For non-expansion states with no data, we adjusted the available FY 2013 MSIS data to the FY 2014 CMS-64 data. For expansion states with no data, we estimated total spending using data from the CMS-64 data and distributed the spending by eligibility group based on the median distribution for expansion states. For expansion states that did not have data covering the post-expansion period, we allocated spending across eligibility groups using either the median for other expansion states or the state’s historical distribution (if historical data indicated a higher share of adult spending than medians). We estimated the share of spending for full-benefit enrollees using the same approach used for enrollment.
Adjustments vary across states, and some adjustments were made for the following states: Alabama, Alaska, Colorado, Delaware, District of Columbia, Florida, Illinois, Kansas, Kentucky, Maine, Maryland, Montana, Nevada, New Hampshire, New Mexico, North Carolina, North Dakota, Rhode Island, South Carolina, Texas, and Wisconsin. Due to these adjustments, enrollment and spending estimates here may not match other analysis based on the MSIS data or state’s own reporting systems.
Table 2: Medicaid Spending per Full-Benefit Enrollee (back to top)
>
NOTES: Due to a data quality issue, we are unable to report spending for the elderly in New Mexico. However, we do include this spending in state and national spending per enrollee calculations.
SOURCE: KFF estimates based on analysis of data from the FFY 2014 Medicaid Statistical Information System (MSIS) and Urban Institute estimates from CMS-64 reports. Because FFY 2014 data was missing some or all quarters for some states, we adjusted the data using secondary data to represent a full fiscal year of enrollment.
Table 3: Ratio of State Per Enrollee Spending to the Average US Per Enrollee Medicaid Spending by Eligibility Group (back to top)
>
NOTES: Data represent the ratio of state per full-benefit enrollee spending to the average per full-benefit enrollee spending in the U.S. For example, spending for full-benefit enrollee ranges from $4,003 to $10,721 or 0.63 (63%) of the national average to 1.68 (168%) of the national average. Due to a data quality issue, we are unable to report spending for the elderly in New Mexico. However, we do include this spending in state and national spending per enrollee calculations.
SOURCE: KFF estimates based on analysis of data from the FFY 2014 Medicaid Statistical Information System (MSIS) and Urban Institute estimates from CMS-64 reports. Because FFY 2014 data was missing some or all quarters for some states, we adjusted the data using secondary data to represent a full fiscal year of enrollment.
Eliminating partial-benefit enrollees (including those eligible for family planning services only or dual eligibles for whom Medicaid covers only Medicare premiums and cost sharing but not other Medicaid services) provides a better understanding of what Medicaid spends for people eligible for the full scope of benefits. Eliminating partial-benefit enrollees from the computation of per enrollee spending generally increases estimates of per enrollee spending (because partial-benefit enrollees tend to be less expensive than full-benefit enrollees). This is particularly true for aged beneficiaries, as a relatively large share of enrollees in this category are partial benefit enrollees for whom Medicaid only pays Medicare cost sharing and premiums. ↩︎
Grayson K. Vincent and Victoria A. Velkoff, The Next Four Decades: The Older Population in the United States: 2010 to 2050 (Washington, DC: US Census Bureau, May 2010), https://www.census.gov/prod/2010pubs/p25-1138.pdf
Gretchen Jacobson, Associate Director of the Foundation’s Program on Medicare Policy, testified on June 7, 2017 before the U.S. House Committee on Ways and Means, Subcommittee on Health as part of the Committee’s hearing on Promoting Integrated and Coordinated Care for Medicare Beneficiaries. Her testimony focused on the challenges and opportunities presented by three approaches for integrating and coordinating care for high-cost, high-need Medicare beneficiaries, many of whom are dually eligible for Medicare and Medicaid. These approaches included Medicare Advantage Special Needs Plans (SNPs), the Program of All-Inclusive Care for the Elderly (PACE), and value-based insurance design (VBID) for beneficiaries who choose to enroll in Medicare Advantage plans.
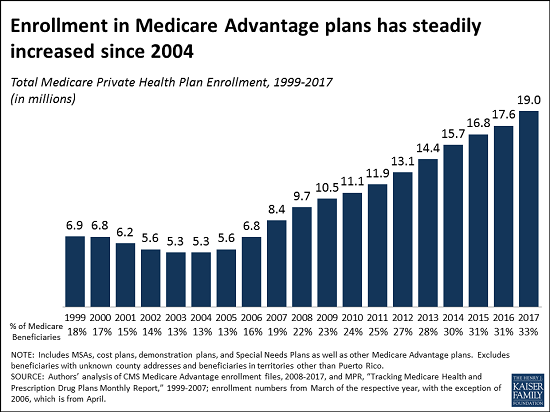
For the first time, 1 in every 3 people with Medicare is enrolled in Medicare Advantage, the private Medicare plans that have played an increasingly large role in the Medicare program over the past decade, according to a new analysis from the Kaiser Family Foundation.
Medicare Advantage enrollment has more than tripled since 2004, reaching 19 million, or 33 percent of enrollees, in 2017, the analysis shows. That milestone is up from 17.6 million beneficiaries (31% ) in 2016, and 11.1 million beneficiaries (24%) in 2010, the year in which Congress reduced payments to Medicare Advantage plans as part of the Affordable Care Act. The Congressional Budget Office has projected that enrollment in Medicare Advantage will continue to rise, reaching 41 percent of all beneficiaries by 2026.
Medicare Advantage enrollment continues to be highly concentrated among a handful of insurers, both nationally and in local markets, the new analysis shows. UnitedHealthcare and Humana together account for 41 percent of enrollment in 2017, for instance, and in 17 states one company has more than half of all Medicare Advantage enrollment – an indicator that these markets may not be very competitive. (Antitrust concerns – in Medicare Advantage and other insurance markets – scuttled recent proposed mergers between Humana and Aetna and Anthem and Cigna.)
The new analysis, Medicare Advantage 2017 Spotlight: Enrollment Market Update, examines trends in this market, including premiums and cost sharing; enrollment and market penetration at the state- and large metropolitan county-level; Medicare Advantage enrollment by firm nationally; and market share of the top three Medicare Advantage firms by state.
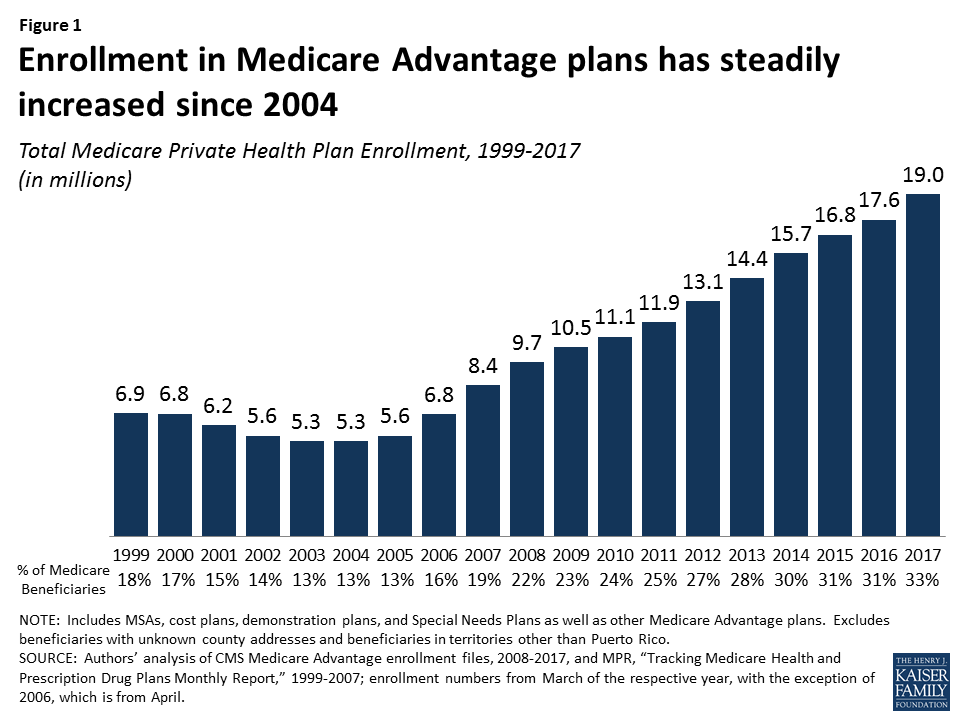
Medicare Advantage plans have played an increasingly larger role in the Medicare program as the share of Medicare beneficiaries enrolled in Medicare Advantage has steadily climbed over the past decade. The trend in enrollment growth is continuing in 2017, and has occurred despite reductions in payments to plans enacted by the Affordable Care Act of 2010 (ACA). This Data Spotlight reviews national and state-level Medicare Advantage enrollment trends as of March 2017 and examines variations in enrollment by plan type and firm. It analyzes the most recent data on premiums, out-of-pocket limits, and quality ratings. Key findings include:
Enrollment Growth. Since the ACA was passed in 2010, Medicare Advantage enrollment has grown 71 percent. As of 2017, one in three people with Medicare (33% or 19.0 million beneficiaries) is enrolled in a Medicare Advantage plan (Figure 1).
Figure 1: Enrollment in Medicare Advantage plans has steadily increased since 2004
Market Concentration. UnitedHealthcare and Humana together account for 41 percent of enrollment in 2017; enrollment continues to be highly concentrated among a handful of firms, both nationally and in local markets. In 17 states, one company has more than half of all Medicare Advantage enrollment – an indicator that these markets may not be very competitive.
Medicare Advantage Penetration. At least 40 percent of Medicare beneficiaries are enrolled in Medicare private plans in six states: CA, FL, HI, MN, OR, and PA. In contrast, fewer than 20 percent of Medicare beneficiaries are enrolled in Medicare Advantage plans in 13 states, plus the District of Columbia.
Premiums and Cost-Sharing. While average Medicare Advantage premiums paid by MA-PD enrollees have been relatively stable for the past several years ($36 per month in 2017), enrollees may be liable for more of Medicare’s costs, with average out-of-pocket limits increasing 21 percent and average Part D drug deductibles increasing more than 9-fold since 2011; however, there was little change in out-of-pocket limits and Part D drug deductibles from 2016 to 2017.
Medicare Advantage enrollment is projected to continue to grow over the next decade, rising to 41 percent of all Medicare beneficiaries by 2027.1 As private plans take on an even larger presence in the Medicare program, it will be important to understand the implications for beneficiaries covered under Medicare Advantage plans and traditional Medicare, as well as for plans, health care providers and program spending.
Overall Trends in Enrollment
Nationwide Enrollment
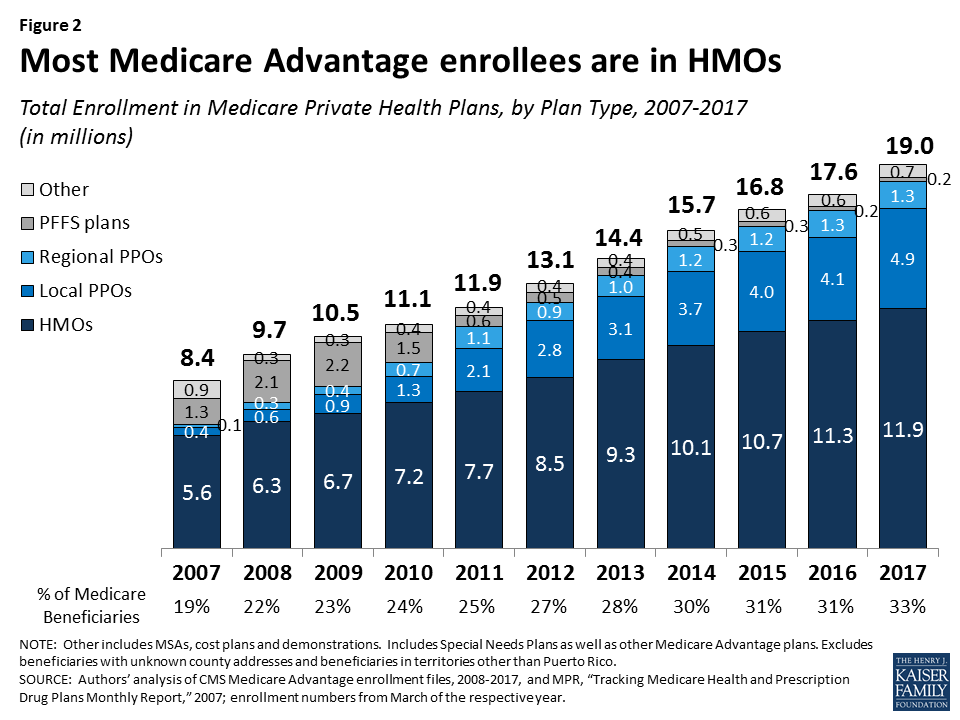
In 2017, one in three (33%) Medicare beneficiaries – 19.0 million people – is enrolled in a Medicare Advantage plan (Figure 1). Total Medicare Advantage enrollment grew by about 1.4 million beneficiaries, or 8 percent, between 2016 and 2017. The growth reflects the ongoing expansion of the role of Medicare Advantage plans in the Medicare program.2
Trends in Enrollment by Plan Type
As has been the case each year since 2007, about two out of three (63%) Medicare Advantage enrollees are in HMOs in 2017. One-third of enrollees are in PPOs – with more in local PPOs (26%) than regional PPOs (7%) – and the remainder are in Private Fee-For Service (PFFS) plans (1%) and other types of plans (3%), including cost plans and Medicare Medical Savings Accounts (MSAs).
HMOs. Enrollment in HMOs increased by 0.6 million to 11.9 million beneficiaries in 2017 (Figure 2 and Table A1).
PPOs. Enrollment in local PPOs increased by 0.8 million, with 4.9 million beneficiaries in local PPOs. In 2017, 1.3 million beneficiaries are in regional PPOs, similar to 2016.
Figure 2: Most Medicare Advantage enrollees are in HMOs
A key difference between an HMO and a PPO is that the latter covers part of the cost of care from providers outside of the plan’s provider network. Local PPOs, like HMOs, are required to serve areas no smaller than a county, whereas regional PPOs are required to serve areas defined by one or more states.
Group Enrollment
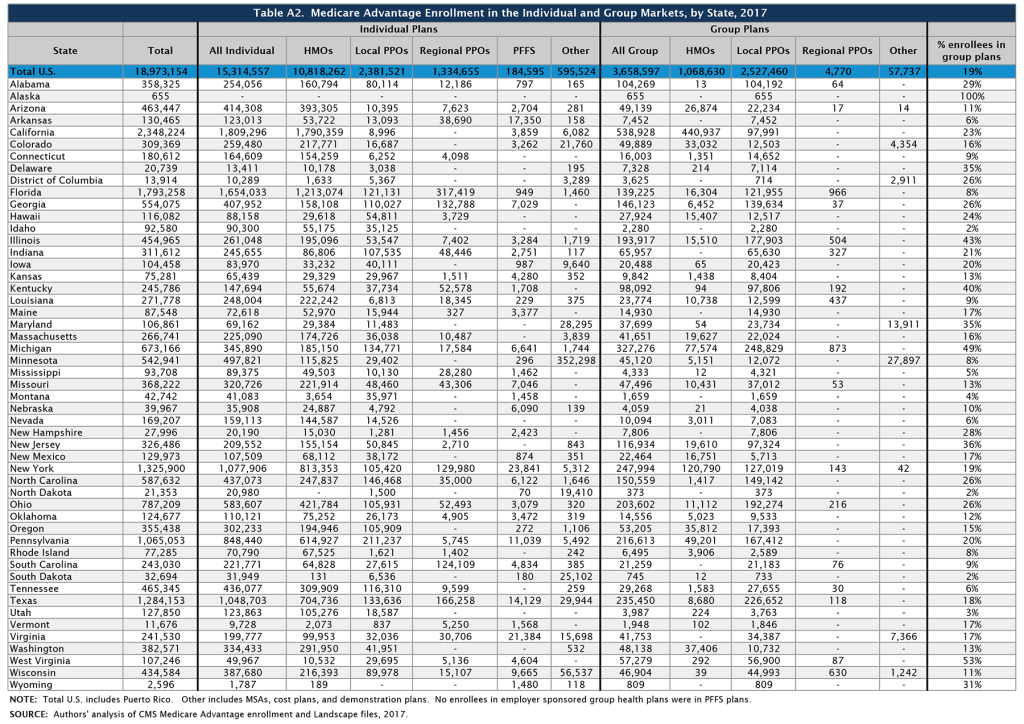
About 3.7 million of the 19.0 million enrollees (19%) are in a group plan in 2017 (Figure 3 and Table A2). Most Medicare beneficiaries who enroll in Medicare Advantage plans do so as individuals, but some enroll through group plans, comprised largely of plans sponsored by unions and employers for retirees. Under these arrangements, employers or unions contract with an insurer and Medicare pays the insurer a fixed amount per enrollee to provide benefits covered by Medicare, and the employer or union, and sometimes also the retiree as well, pays a premium for any additional benefits or lower cost-sharing. In contrast to the Medicare Advantage individual market where HMOs dominate, more than two-thirds (69%) of group plan enrollees are in local PPOs.
Figure 3: About one in five Medicare Advantage enrollees are in group plans and enrollment in group plans has doubled since 2008
Some states have a much larger than average share of Medicare Advantage enrollees in group plans, including Alaska (100%), West Virginia (53%), Michigan (49%), Illinois (43%), Kentucky (40%), and New Jersey (36%). Between 2016 and 2017, enrollment in Medicare Advantage group plans grew at least as much as enrollment in individual plans in all states except ten (HI, KY, MI, MN, MT, NE, OR, UT, WI, and WV) and the District of Columbia. Over this period, the share of Medicare beneficiaries in group plans increased considerably in Alabama and New Jersey due to changes in the states’ benefits for former state employees for the 2017 plan year.
In Alabama, enrollment in group plans increased by almost 90,000 beneficiaries between 2016 and 2017, due in large part to the Public Education Employees’ Health Insurance Plan (PEEHIP) automatically enrolling their retirees into a Medicare Advantage group plan operated by UnitedHealthcare for the 2017 plan year. In New Jersey, enrollment in group plans increased by more than 60,000 beneficiaries, mostly due to the State Health Benefits Program only offering coverage to retirees through Medicare Advantage group plans beginning in 2017. These changes reflect a larger trend by large employers and unions to limit their liability for retirees’ health costs by contracting with Medicare Advantage plans.
In addition, some employers or unions are addressing cost concerns by ending their group coverage for retiree health – either by terminating coverage altogether, or by offering retirees a defined contribution that could be used to purchase a Medigap policy (to supplement traditional Medicare) or a Medicare Advantage plan. This dynamic, which alters the share and composition of Medicare beneficiaries in the group and individual Medicare Advantage markets, respectively, is not captured in available Medicare Advantage data. This data gap makes it more difficult to understand the reasons behind trends in enrollment in both markets.3
Medicare Advantage Enrollment Growth by State
Medicare Advantage enrollment increased in all states in 2017, with the exception of North Dakota where enrollment declined slightly (by 1%) (Table 1). In eight states (AK, AL, DE, MD, NH, NJ, VT, and WY) enrollment increased by 20 percent or more. Since the penetration rates in these states were far below the national average and some have relatively few enrollees, their growth rates can be sensitive to small changes in enrollment.
In most states, the majority of enrollees are in HMOs; however, in 12 states (AK, AL, HI, IL, IN, IA, KS, KY, MI, MT, NC, and WV), the majority of enrollees are in local PPOs (Table A1). Additionally, in a few states (MN, ND, and SD), the preponderance of private plan enrollees is in cost plans, which are paid differently from Medicare Advantage plans and allow enrollees to see any Medicare provider and pay the cost-sharing they would pay in traditional Medicare. Regional PPOs also play an outsized role in some states, with at least 30 percent of enrollees in regional PPOs in 4 states (AR, MS, SC, and VT).
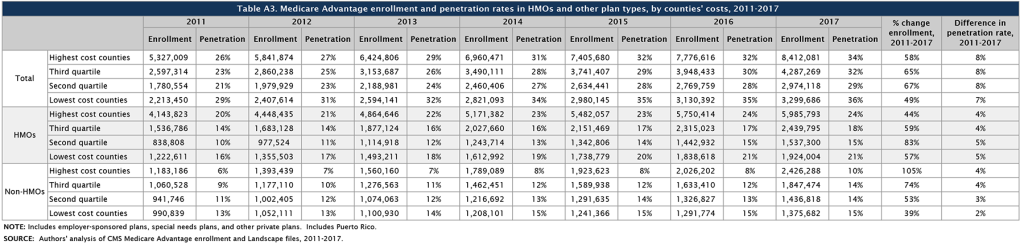
Enrollment Growth by County, based on Medicare Spending Quartiles
The Affordable Care Act reduced payments to all Medicare Advantage plans, and varied payment policy with the level of traditional Medicare spending in counties, grouped into four quartiles. As of 2017, payments are fully phased-in and range from 95 percent of traditional Medicare spending for counties in the top quartile of Medicare spending to 115 percent of traditional Medicare spending for counties in the bottom quartile.
Between 2011 and 2017, the counties in the middle quartiles saw the largest growth in Medicare Advantage enrollment (65% and 67% for the third and second quartiles, respectively) with the lowest growth in the lowest cost counties (49%; Table A3). The relationship between county cost and growth rates appears to vary between HMOs (which have a longer history with the program) and other plan types (mostly PPOs) that are newer. While HMOs showed little relationship between county cost and enrollment growth over the 2011-2017 period, enrollment in other types of plans grew more rapidly in higher than lower-cost counties.
Table 1. Medicare Advantage Enrollment and Penetration Rate, by State, 2016-2017
State
2016 Total Enrollment
2017 Total Enrollment
Change in Total Enrollment,2016-2017
Percent Change in Enrollment,2016-2017
2016 Penetration Rate
2017 Penetration Rate
Total U.S.
17,625,200
18,973,154
1,347,954
8%
31%
33%
Alabama
257,218
358,325
101,107
39%
26%
36%
Alaska
93
655
562
604%
<1%
1%
Arizona
442,282
463,447
21,165
5%
38%
39%
Arkansas
121,543
130,465
8,922
7%
20%
21%
California
2,244,709
2,348,224
103,515
5%
39%
40%
Colorado
293,275
309,369
16,094
5%
36%
37%
Connecticut
165,722
180,612
14,890
9%
26%
28%
Delaware
16,792
20,739
3,947
24%
9%
11%
District of Columbia
12,292
13,914
1,622
13%
14%
15%
Florida
1,670,266
1,793,258
122,992
7%
41%
42%
Georgia
508,161
554,075
45,914
9%
33%
34%
Hawaii
113,451
116,082
2,631
2%
46%
45%
Idaho
90,435
92,580
2,145
2%
31%
31%
Illinois
405,756
454,965
49,209
12%
19%
21%
Indiana
279,338
311,612
32,274
12%
24%
26%
Iowa
98,790
104,458
5,668
6%
17%
18%
Kansas
67,733
75,281
7,548
11%
14%
15%
Kentucky
229,916
245,786
15,870
7%
26%
28%
Louisiana
249,920
271,778
21,858
9%
31%
33%
Maine
75,116
87,548
12,432
17%
24%
27%
Maryland
88,998
106,861
17,863
20%
9%
11%
Massachusetts
246,018
266,741
20,723
8%
20%
21%
Michigan
621,118
673,166
52,048
8%
32%
34%
Minnesota
510,713
542,941
32,228
6%
55%
56%
Mississippi
85,208
93,708
8,500
10%
15%
16%
Missouri
337,119
368,222
31,103
9%
29%
31%
Montana
39,200
42,742
3,542
9%
19%
20%
Nebraska
37,169
39,967
2,798
8%
12%
12%
Nevada
157,379
169,207
11,828
8%
34%
35%
New Hampshire
20,756
27,996
7,240
35%
8%
10%
New Jersey
245,651
326,486
80,835
33%
16%
21%
New Mexico
120,099
129,973
9,874
8%
32%
33%
New York
1,243,714
1,325,900
82,186
7%
37%
38%
North Carolina
547,079
587,632
40,553
7%
30%
32%
North Dakota
21,627
21,353
-274
-1%
18%
17%
Ohio
748,125
787,209
39,084
5%
34%
35%
Oklahoma
116,489
124,677
8,188
7%
17%
18%
Oregon
339,461
355,438
15,977
5%
44%
44%
Pennsylvania
1,022,462
1,065,053
42,591
4%
40%
41%
Rhode Island
72,954
77,285
4,331
6%
35%
37%
South Carolina
224,130
243,030
18,900
8%
23%
24%
South Dakota
31,158
32,694
1,536
5%
20%
20%
Tennessee
440,394
465,345
24,951
6%
35%
36%
Texas
1,174,621
1,284,153
109,532
9%
32%
33%
Utah
120,237
127,850
7,613
6%
34%
35%
Vermont
9,671
11,676
2,005
21%
7%
8%
Virginia
219,382
241,530
22,148
10%
16%
17%
Washington
360,712
382,571
21,859
6%
30%
30%
West Virginia
103,805
107,246
3,441
3%
25%
25%
Wisconsin
410,771
434,584
23,813
6%
38%
39%
Wyoming
2,079
2,596
517
25%
2%
3%
NOTE: Includes employer-sponsored plans, special needs plans, and other private plans. Total U.S. includes Puerto Rico.SOURCE: Authors’ analysis of CMS Medicare Advantage enrollment and Landscape files, 2016-2017.
Medicare Advantage Penetration
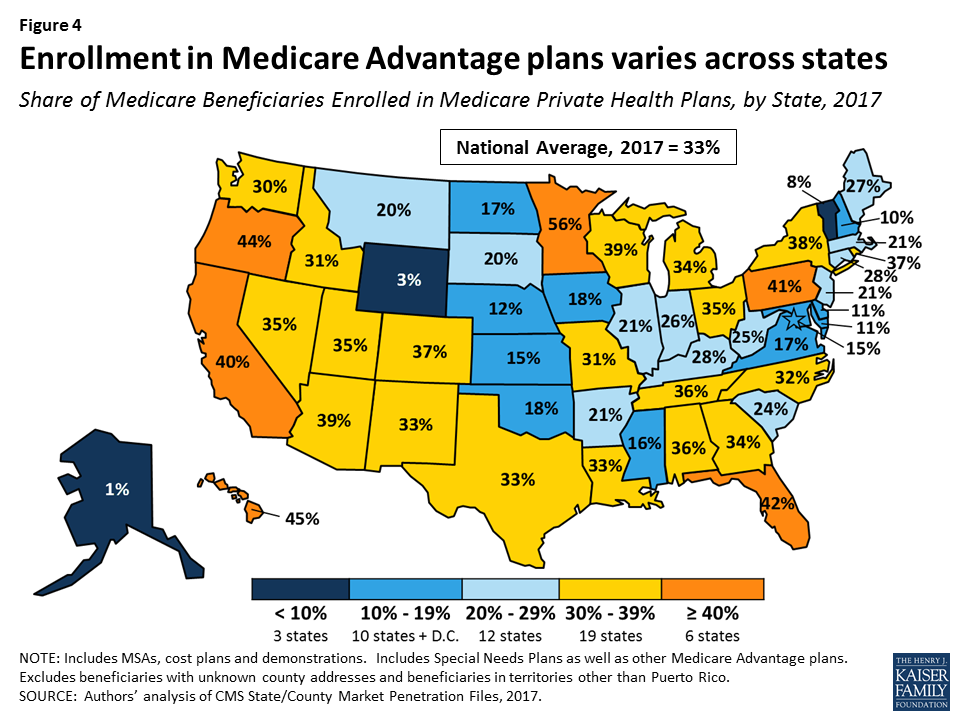
In half of all states, at least 30 percent of Medicare beneficiaries are enrolled in Medicare private plans, including 6 states (CA, FL, HI, MN, OR, and PA) in which at least 40 percent of beneficiaries are enrolled in Medicare private plans (Figure 4). While Medicare Advantage enrollment is increasing in many states, Medicare Advantage enrollment continues to be very low (less than 10 percent of Medicare beneficiaries) in 3 states (AK, VT, and WY). This variation reflects the history of managed care in the state, the uneven prevalence of employer-sponsored insurance for retirees, and growth strategies pursued by various Medicare Advantage sponsors, among other factors.
Figure 4: Enrollment in Medicare Advantage plans varies across states
Within states, Medicare Advantage penetration varies across counties. For example, 56 percent of beneficiaries in the Bronx in New York City, New York are enrolled in Medicare Advantage plans whereas only 19 percent of beneficiaries in Suffolk County (Long Island), New York are enrolled (Table A4).
Medicare Advantage penetration also varies across metropolitan counties, such that not all metropolitan counties have high Medicare Advantage penetration rates. For example, only 14 percent of Medicare beneficiaries are enrolled in Medicare private plans in Baltimore, Maryland, but 65 percent of Medicare beneficiaries are enrolled in Medicare private plans in Miami-Dade County, Florida (Figure 5).
Figure 5: Medicare Advantage penetration varies widely across large metropolitan counties in 2017
Medicare Advantage Enrollment, by Firm and Affiliates
Enrollment by Firm and Affiliates
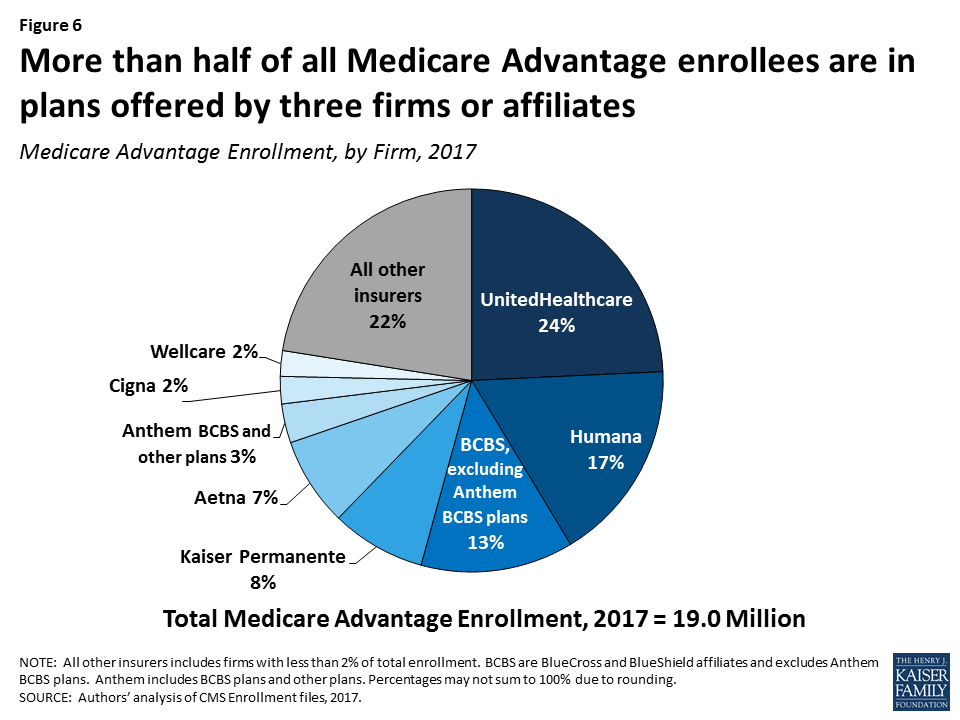
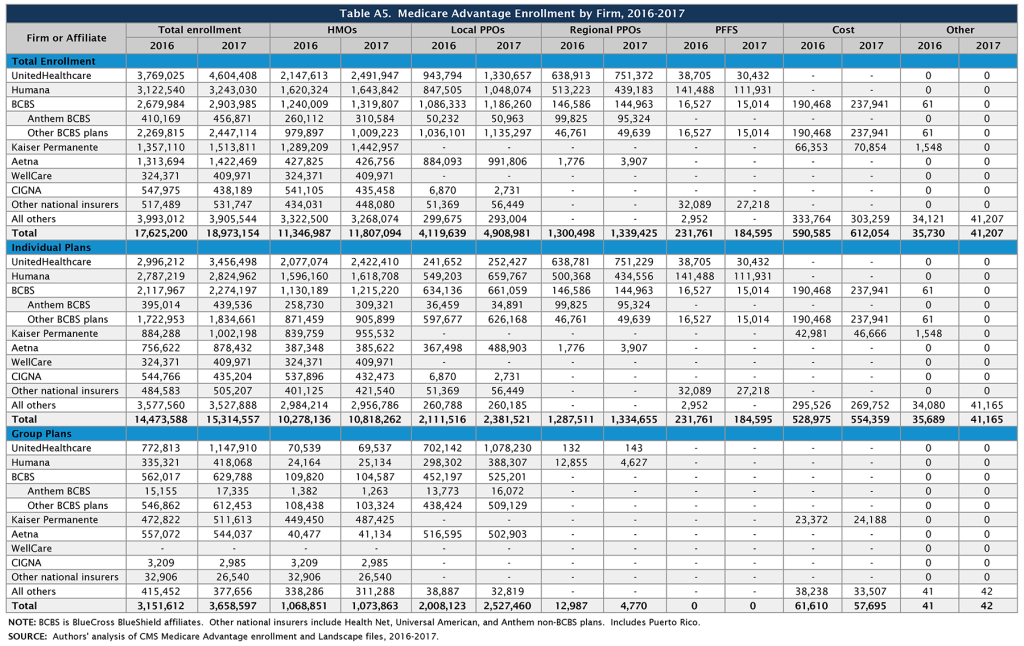
Medicare Advantage enrollment tends to be highly concentrated among a small number of firms (Figure 6). In 2017, UnitedHealthcare, Humana, and the BCBS affiliates (including Anthem BCBS plans) together account for well over half (57%) of Medicare Advantage enrollment. Eight firms or affiliates accounted for about three-quarters (77%) of the market, including UnitedHealthcare, Humana, Blue Cross Blue Shield (BCBS) affiliated plans (excluding Anthem), Kaiser Permanente, Aetna, Anthem, Cigna, and Wellcare. Enrollment in UnitedHealthcare’s plans grew more than any other firm, increasing by more than 800,000 beneficiaries between 2016 and 2017, and the firm’s share of the Medicare Advantage market increased from 21 percent in 2016 to 24 percent in 2017 (Table A5). In 2016-2017, major mergers were under regulatory review for four of these firms (Humana with Aetna, Anthem with Cigna). It is not clear how the prospect of a merger may have affected each firm’s Medicare Advantage market strategy over this period. The mergers were not allowed to proceed due to concerns about the potential effects on market competition.
Figure 6: More than half of all Medicare Advantage enrollees are in plans offered by three firms or affiliates
Market Concentration by State
In most states, a few firms dominate Medicare Advantage enrollment (Figure 7). Similar to prior years, in every state other than Oregon, the three largest firms or BCBS affiliates account for more than 50 percent of enrollment. In 38 states and the District of Columbia, at least 75 percent of enrollees are in plans offered by one of three firms. In 17 states, one company has more than half of all Medicare Advantage enrollment – an indicator that these markets may not be very competitive (Table A6). Except for three states with small enrollments (the Dakotas and Alaska), all of these states are dominated by either UnitedHealthcare, Humana, or BCBS affiliated plans. (Medica Holding Company’s plans dominate enrollment in the Dakotas and Aetna’s plans dominate enrollment in Alaska.)
Figure 7: In most states, three firms or affiliates account for more than three-quarters of Medicare Advantage enrollment
UnitedHealthcare is a major player in the Medicare Advantage markets of 42 states and the District of Columbia; the firm has the largest share of enrollment in 24 states (up from 19 states in 2016) and is among the top three firms in an additional 18 states and the District of Columbia. Humana has the largest share of enrollment in 7 states (down from 10 states in 2016) and is among the top 3 firms in another 22 states. Plans offered by BCBS affiliates have the most enrollees in 8 states and are among the top firms in another 15 states.
Kaiser Permanente’s presence is more geographically focused than other major national firms, with a heavy concentration in California, Colorado, the District of Columbia area, Hawaii, Georgia, and Oregon. Kaiser Permanente also recently added to its presence in Washington with its acquisition of Group Health Cooperative. In some states, locally operated plans play a much larger role than the national firms, and include Martin’s Point Health Care (ME), Tufts Associated HMO (MA), Presbyterian Healthcare Services (NM), and Medica Holding Company (ND and SD). New West, which had the most Medicare Advantage enrollees in Montana between 2011 and 2015, announced in 2016 that it is going out of business and did not offer Medicare Advantage plans in 2017 Other firms appear to have offset this loss in plan options as Medicare Advantage enrollment in Montana has continued to grow. EmblemHealth, a New York-based not-for-profit plan, had the most Medicare Advantage enrollees in Connecticut from 2014 to 2016, but UnitedHealthcare replaced it in this position in 2017.
Premiums
Medicare Advantage enrollees are responsible for paying the Part B premium, in addition to any premium charged by the plan. This brief analyzes premiums for Medicare Advantage plans that offer prescription drug benefits (MA-PDs) because the vast majority (89%) of Medicare Advantage enrollees is in MA-PDs and Medicare Advantage enrollees who seek prescription drug benefits are required to get them through their plan if the plan offers prescription drugs.
Average Premium Trends
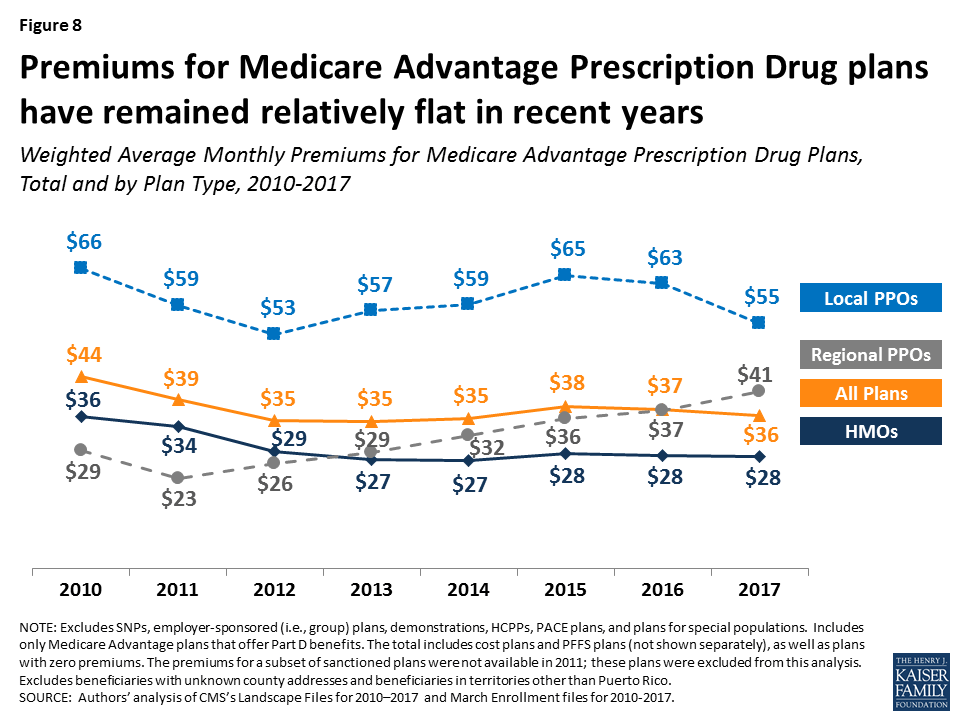
The average MA-PD enrollee pays a monthly premium of about $36 in 2017, about $1 per month less than in 2016 (Figure 8). Actual premiums paid by enrollees vary widely, across and within counties, by plan type and other plan characteristics. Average premiums range from $28 per month for HMO enrollees to $55 per month for local PPO enrollees and $41 per month for regional PPO enrollees. Overall, average premiums at the national level have been relatively steady for plan enrollees since 2012, although premiums for regional PPO enrollees have increased.
Figure 8: Premiums for Medicare Advantage Prescription Drug plans have remained relatively flat in recent years
Zero Premium Plans
In 2017, as in prior years, most Medicare beneficiaries (81%) had a choice of at least one “zero premium” MA-PD,4 plans that charge no additional premium for coverage of Medicare Part A, B, and D benefits , other than the monthly Part B premium. Plans can offer zero-premium MA-PDs by using their rebate (the difference between the plan bid and the maximum federal payment or benchmark) to reduce the Part D premium.
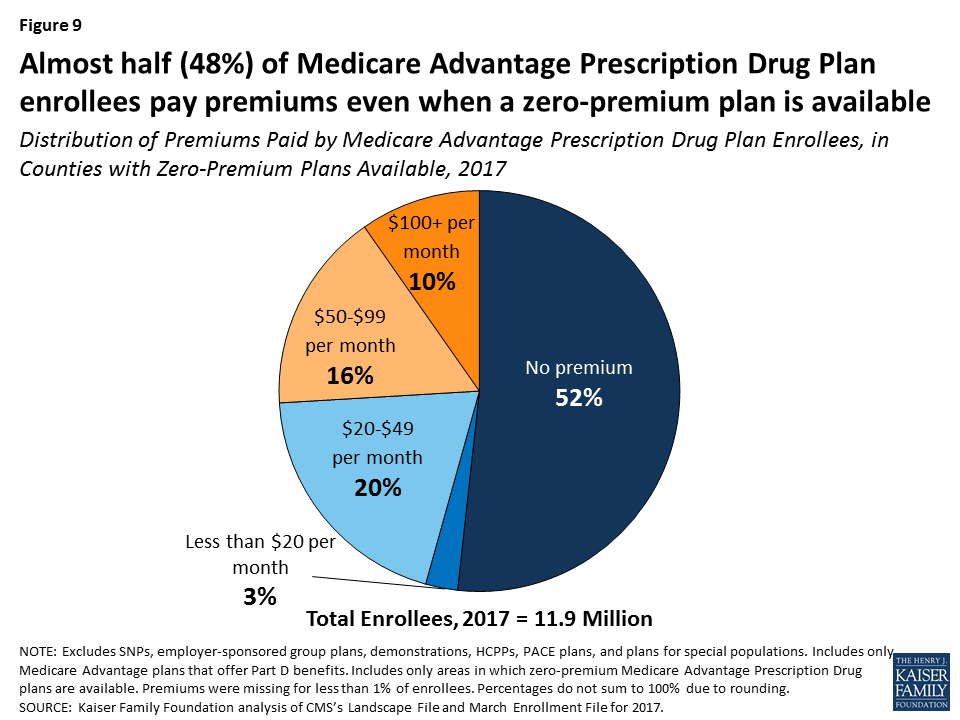
While seniors have said that premiums are important factor in their plan choice,5 the data indicate that other factors must also play an important role. Among MA-PD enrollees with access to a zero premium plan (97% of all MA-PD enrollees), only about half (52%) are enrolled in such a plan (Figure 9). More than one-quarter (26%) of MA-PD enrollees with access to a zero premium plan are in plans with premiums of $50 per month or more, including 10 percent with premiums of $100 per month or more. In total, only half (50%) of MA-PD enrollees are in a zero premium plan in 2017, including about 400,000 MA-PD enrollees (3%) who do not have access to a zero premium plan.
Figure 9: Almost half (48%) of Medicare Advantage Prescription Drug Plan enrollees pay premiums even when a zero-premium plan is available
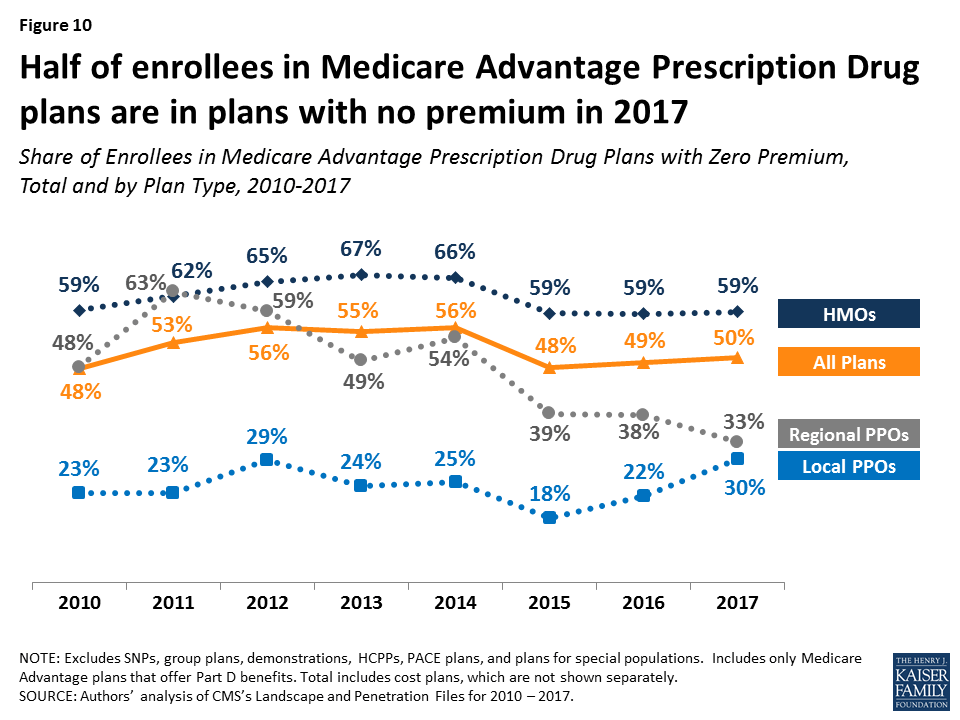
Between 2016 and 2017, the share of enrollees in zero premium MA-PDs remained relatively unchanged (49% in 2016 versus 50% in 2017) (Figure 10). Similar to prior years, a larger share of HMO enrollees is enrolled in zero premium plans (59%) than regional PPO enrollees (33%) or local PPO enrollees (30%).
Figure 10: Half of enrollees in Medicare Advantage Prescription Drug plans are in plans with no premium in 2017
Premium Variation Across States
Comparing premiums across states is complicated by the fact that premiums reflect many factors, including the underlying costs of care in a given county relative to the national average, the level of payments to Medicare Advantage plans in the area, and firms’ strategy about whether to use plans’ rebates to offer extra benefits, reduce cost-sharing, or lower premiums. Additionally, as previously discussed, premiums vary across plan types and enrollment by plan type varies across states.
Average monthly MA-PD premiums paid per enrollee range from $6 (Florida) to $131 (Minnesota, which mainly has cost plans rather than risk-based plans), relative to the $36 per month average premium paid by enrollees in 2017 (Figure 11). Average monthly premiums exceed $70 in six states: Hawaii, Massachusetts, Michigan, Minnesota, North Dakota, and Pennsylvania. In contrast, average monthly premiums are less than $20 in nine states: Arizona, Iowa, Florida, Louisiana, Missouri, Nebraska, Nevada, New Mexico, and Texas.
Figure 11: Weighted average monthly premiums for Medicare Advantage Prescription Drug plan enrollees vary across the country
Premiums also vary greatly within a state since plans and federal payments to plans vary by county. For example, MA-PD enrollees pay an average of $4 per month in Los Angeles County, California but $66 per month in San Francisco County, California. Similarly, MA-PD enrollees pay, on average, $20 per month in Queens County, New York (a part of New York City) but $74 per month in Albany, New York.
Cost Sharing
Medicare Advantage plans are required to provide all Medicare covered services, and have some flexibility in setting cost-sharing for specific Medicare-covered services. In addition, since 2011 Medicare Advantage plans have been required to limit enrollees’ out-of-pocket expenditures for services covered under Parts A and B – in contrast with traditional Medicare. In 2011, CMS began requiring all Medicare Advantage plans to limit enrollees’ out-of-pocket expenditures for Part A and B in-network services to no more than $6,700 annually, and recommended a limit of $3,400 or lower.6
Out-of-Pocket Limits
In 2017, the average out-of-pocket limit for MA-PD enrollees is $5,219, about the same as in 2016 ($5,223) and up from $4,313 in 2011 (Figure 12). HMO enrollees have generally had lower out-of-pocket limits than enrollees in local PPOs or regional PPOs, and this remains the case in 2017. More than half of all enrollees (52%) are in plans with limits above $5,000 in 2017, similar to 2016. More than one-third of all enrollees in 2017 (36%) are in plans with limits at the $6,700 maximum, similar to 2016 and up from 32 percent in 2015 and 17 percent in 2011 (data not shown). As out-of-pocket limits approach the maximum allowed limit, it is important to look at other dimensions of cost sharing to better understand how beneficiaries with different needs are affected by year-to-year changes and trends in Medicare Advantage cost-sharing for benefits covered under Parts A and B.
Figure 12: Out-of-pocket limits for Medicare Advantage Prescription Drug plan enrollees have increased between 2011 and 2017
Part D Cost Sharing
The standard Medicare Part D benefit in 2017, for both stand-alone prescription drug plans (PDPs) and MA-PDs, has a $400 deductible and 25 percent coinsurance up to an initial coverage limit of $3,700 in total drug costs, followed by a coverage gap (the so-called “donut hole”) where beneficiaries pay a larger share of total costs until their total out of pocket Part D spending reaches $4,950. After exceeding this catastrophic threshold, beneficiaries pay 5 percent of the cost of drugs. Both stand-alone Medicare prescription drug plans (PDPs) and MA-PDs have the flexibility to vary the cost-sharing design of their Part D benefit; however, CMS limits the plans’ deductibles and in 2017 the deductible cannot exceed $400.
Part D Deductibles
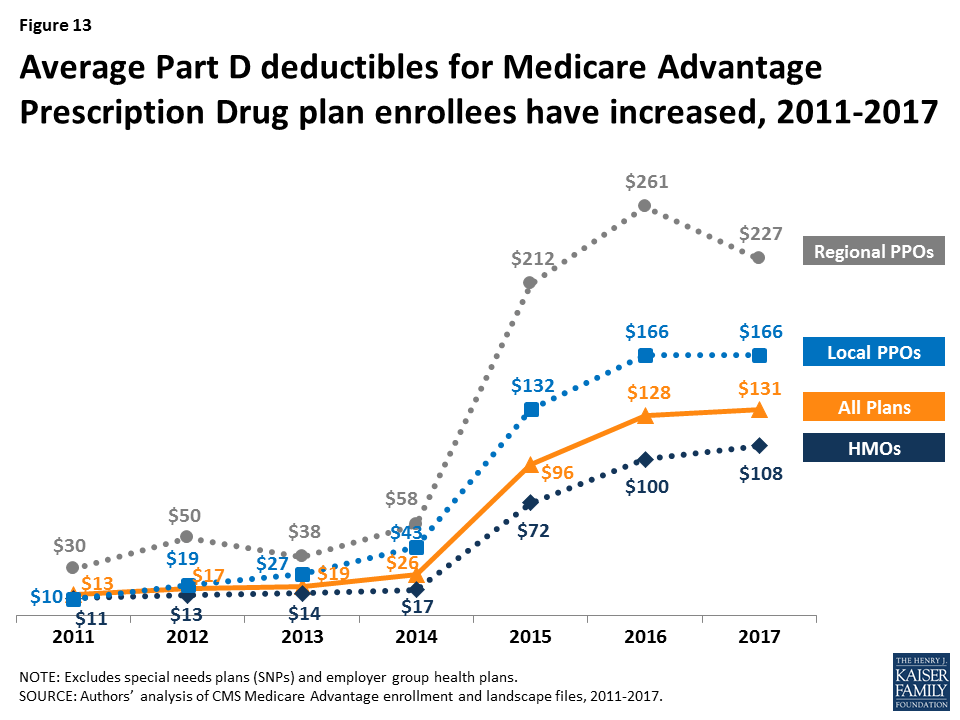
Average Part D drug deductibles for MA-PD enrollees have steadily climbed since 2011, with the largest increases between 2014 and 2016 (Figure 13). The average Part D deductible for MA-PD enrollees is $131 in 2017, up from $128 in 2016. Enrollees in HMOs continue to have lower average drug deductibles ($108) than enrollees in local PPOs ($166) or enrollees in regional PPOs ($227) in 2017.
Figure 13: Average Part D deductibles for Medicare Advantage Prescription Drug plan enrollees have increased, 2011-2017
In 2017, just 8 percent of MA-PD enrollees are in a plan with the maximum Part D deductible. Less than half (46%) are in plans with no Part D deductible and an equal share (46%) have deductibles less than $400 (data not shown). Among Medicare Advantage enrollees, those in HMOs (54%), followed by local PPOs (36%), are most likely to be in a plan with no deductible; only 8 percent of regional PPO enrollees are in a plan with no Part D deductible (data not shown).
Star Quality Ratings
For many years, CMS has posted quality ratings of Medicare Advantage plans to provide beneficiaries with additional information about plans offered in their area. All plans are rated on a 1 to 5-star scale, with 1 star representing poor performance, 3 stars representing average performance, and 5 stars representing excellent performance. CMS assigns quality ratings at the contract level, rather than for each individual plan, meaning that each plan covered under the same contract receives the same quality rating (and most contracts cover multiple plans of the same type). Since 2012, Medicare Advantage plans with 4 or more stars and plans without ratings have been receiving bonus payments based on quality ratings.7 Beneficiaries can enroll in a plan with 5 stars at any time during the year, not just during the annual open enrollment period.
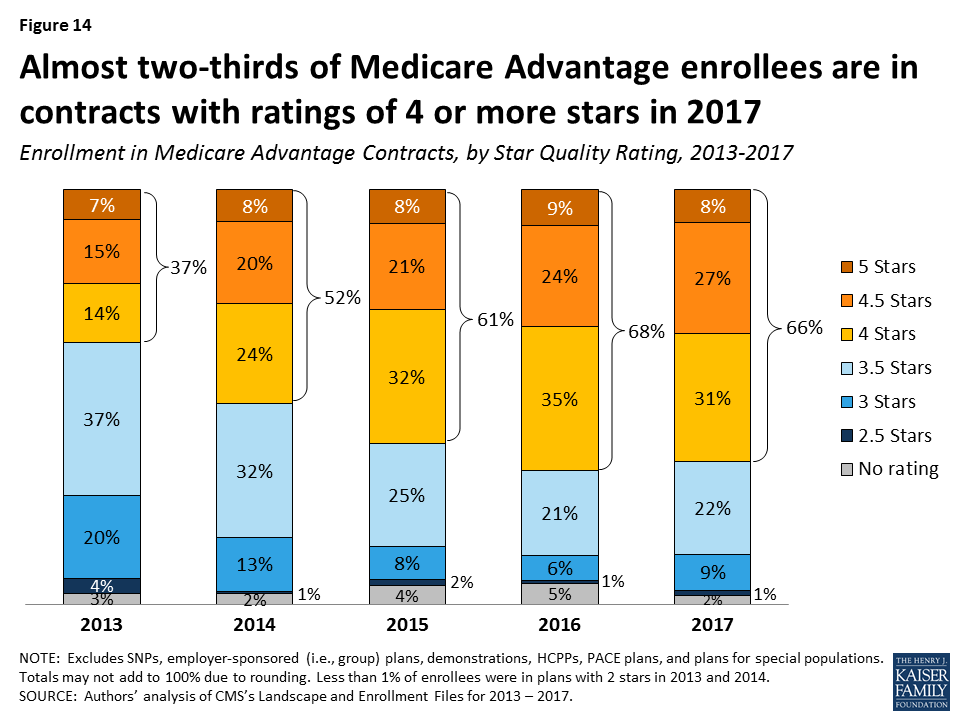
In 2017, 66 percent of Medicare Advantage enrollees are in plans with 4 or more stars, a slight decrease from 68 percent in 2016 (Figure 14). A somewhat larger share of enrollees is in plans with 3 stars in 2017 (9% in 2017 versus 6% in 2016). Overall, enrollment by star quality ratings appears to have been relatively stable since 2015. Much of the increase in enrollment in plans with four or more stars has occurred in the plans with 4 or 4.5 stars, while the share of enrollees in plans with 5 stars has been relatively stable.
Figure 14: Almost two-thirds of Medicare Advantage enrollees are in contracts with ratings of 4 or more stars in 2017
Notably, while a larger share of beneficiaries is in a Medicare Advantage plan with relatively high star ratings, seniors have said in focus groups that they do not use the star ratings to select their plan.8 Nonetheless, the star ratings may be correlated with factors that seniors do use to select their plan, including provider networks, and plan benefits and costs, and thus may be correlated with enrollment.
Discussion
Medicare Advantage enrollment has steadily increased both nationally and across states since 2005, with one-third of Medicare beneficiaries enrolled in Medicare Advantage plans in 2017. Enrollment continues to be highly concentrated among a handful of firms, both nationally and in local markets; UnitedHealthcare and Humana together account for 41 percent of enrollment in 2017. Average premiums paid by enrollees have remained relatively flat since 2011, but out-of-pocket limits have increased 21 percent and Part D drug deductibles have increased more than 9-fold since 2011, suggesting that enrollees have less financial protection in plans than they have in the past. More granular information about benefits and plans’ cost-sharing is needed to fully understand costs incurred by beneficiaries with different service needs, how Medicare Advantage enrollees’ out-of-pocket costs compare to beneficiaries in traditional Medicare, how they vary across plans, and how out-of-pocket costs in Medicare Advantage plans have changed since the ACA. Additionally, there is a growing but still inconclusive literature on the differences in quality of care between Medicare Advantage and traditional Medicare, particularly with respect to high-need, high cost patients.9
Looking to the future, both the Congressional Budget Office and the Health and Human Services (HHS) Office of the Actuary (OACT) project that Medicare Advantage enrollment and penetration rate will continue to grow over the next decade, with CBO projecting that about 41 percent of Medicare beneficiaries will be enrolled in Medicare Advantage in 2027. As this growth continues, it will be increasingly important to assess how well the Medicare’s current payment methodology, and the competitive model behind Medicare Advantage is working to enhance efficiency and hold down beneficiary costs and Medicare spending. It will also be important to understand the implications for beneficiaries in both Medicare Advantage plans and traditional Medicare, in terms of costs, benefits, premiums, quality of care, patient outcomes, and access to providers.
As Medicare Advantage takes on an even larger presence in the Medicare program, careful stewardship and oversight by policymakers is needed to make sure that plans provide value to the Medicare program, and the 57 million beneficiaries it covers.
Gretchen Jacobson and Tricia Neuman are with the Kaiser Family Foundation; Anthony Damico is an independent consultant; and Marsha Gold is a Senior Fellow Emeritus with Mathematica Policy Research and independent consultant.
Appendices
Appendix A: Special Needs Plans
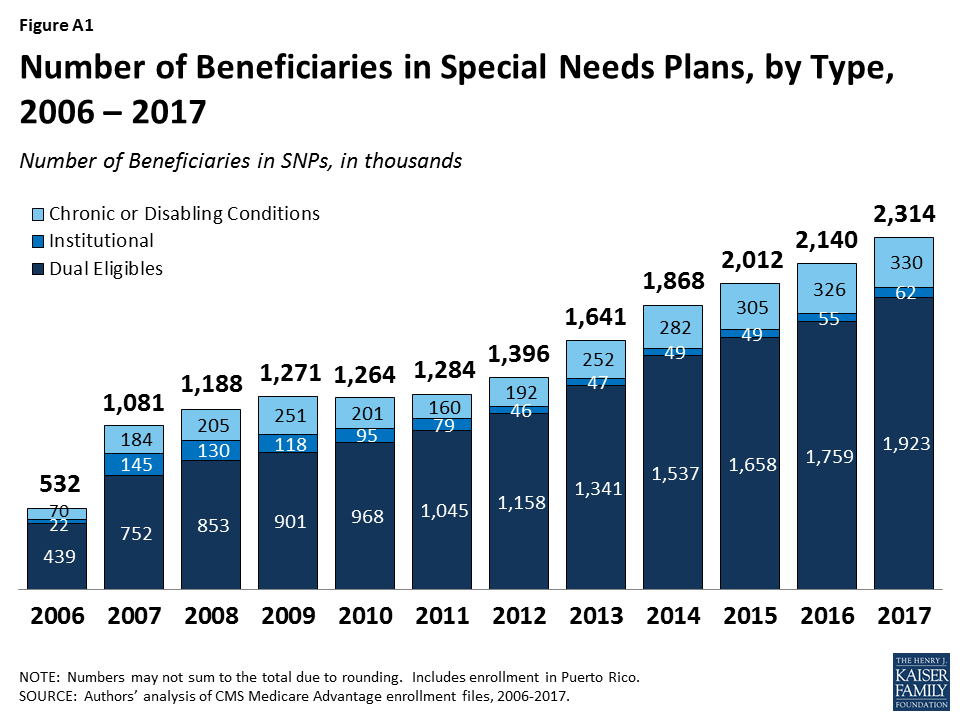
Special Needs Plans (SNPs) restrict enrollment to specific types of beneficiaries with significant or relatively specialized care needs, including beneficiaries: (1) dually eligible for Medicare and Medicaid (D-SNPs); (2) requiring a nursing home or institutional level of care (I-SNPs); or (3) with severe chronic or disabling conditions (C-SNPs.)
Enrollment in SNPs increased from 2.1 million to 2.3 million beneficiaries between 2016 and 2017 (Figure A1 and Table A7). In 2017, SNP enrollees account for about 12 percent of total Medicare Advantage enrollment, but account for a larger share of the Medicare Advantage enrollment in some states. In three states and the District of Columbia, enrollment in SNPs comprises more than one-fifth of Medicare Advantage enrollment (40% in DC, 28% in SC, 22% in AR, and 21% in AZ; data not shown).
Figure A1: Number of Beneficiaries in Special Needs Plans, by Type, 2006 – 2017
The majority of SNP enrollees (81%) are in plans serving those dually eligible for Medicare and Medicaid (D-SNPs). Enrollment of dually eligible beneficiaries in D-SNPs varies greatly by state, and is particularly prevalent in Hawaii (53%) and Arizona (42%) (Table A7). In 2017, almost half (46%) of Medicare Advantage enrollees who received Part D Low-Income Subsidies (LIS) were in SNPs; this percentage has been relatively stable since 2008.
Separately, several states are undertaking demonstrations with CMS to improve the alignment of Medicare and Medicaid for dually eligible beneficiaries using a capitated model, with the first state (Washington) beginning enrollment in its demonstration in July 2013. Enrollment in the demonstrations has been relatively low and as of March 2017, more than 392,000 dually eligible beneficiaries were enrolled in the demonstrations.
Appendix B: Tables
Table A1. Medicare Advantage Enrollment by State and Plan Type, 2017
State
Total
Distribution of Enrollment, by State and Plan Type
% in HMOs
% in Local PPOs
% in Regional PPOs
% in PFFS Plans
% in Cost Plans
% in Other Plans
Total U.S.
18,973,154
63%
26%
7%
1%
3%
<1%
Alabama
358,325
45%
51%
3%
<1%
0%
<1%
Alaska
655
0%
100%
0%
0%
0%
0%
Arizona
463,447
91%
7%
2%
1%
<1%
0%
Arkansas
130,465
41%
16%
30%
13%
0%
<1%
California
2,348,224
95%
5%
0%
<1%
<1%
<1%
Colorado
309,369
81%
9%
0%
1%
7%
1%
Connecticut
180,612
86%
12%
2%
0%
0%
0%
Delaware
20,739
50%
49%
0%
0%
0%
1%
District of Columbia
13,914
12%
44%
0%
0%
45%
0%
Florida
1,793,258
69%
14%
18%
<1%
<1%
<1%
Georgia
554,075
30%
45%
24%
1%
0%
0%
Hawaii
116,082
39%
58%
3%
0%
0%
0%
Idaho
92,580
60%
40%
0%
0%
0%
0%
Illinois
454,965
46%
51%
2%
1%
<1%
0%
Indiana
311,612
28%
56%
16%
1%
0%
<1%
Iowa
104,458
32%
58%
0%
1%
9%
<1%
Kansas
75,281
41%
51%
2%
6%
0%
<1%
Kentucky
245,786
23%
55%
21%
1%
0%
0%
Louisiana
271,778
86%
7%
7%
<1%
0%
<1%
Maine
87,548
61%
35%
<1%
4%
0%
0%
Maryland
106,861
28%
33%
0%
0%
39%
<1%
Massachusetts
266,741
73%
22%
4%
0%
0%
1%
Michigan
673,166
39%
57%
3%
1%
0%
<1%
Minnesota
542,941
22%
8%
0%
<1%
70%
0%
Mississippi
93,708
53%
15%
30%
2%
0%
0%
Missouri
368,222
63%
23%
12%
2%
0%
0%
Montana
42,742
9%
88%
0%
3%
0%
0%
Nebraska
39,967
62%
22%
0%
15%
<1%
<1%
Nevada
169,207
87%
13%
0%
0%
0%
0%
New Hampshire
27,996
54%
32%
5%
9%
0%
0%
New Jersey
326,486
54%
45%
1%
0%
0%
<1%
New Mexico
129,973
65%
34%
0%
1%
0%
<1%
New York
1,325,900
70%
18%
10%
2%
<1%
<1%
North Carolina
587,632
42%
50%
6%
1%
0%
<1%
North Dakota
21,353
0%
9%
0%
<1%
90%
1%
Ohio
787,209
55%
38%
7%
<1%
0%
<1%
Oklahoma
124,677
64%
29%
4%
3%
0%
<1%
Oregon
355,438
65%
35%
0%
<1%
0%
<1%
Pennsylvania
1,065,053
62%
36%
1%
1%
0%
1%
Rhode Island
77,285
92%
5%
2%
0%
0%
<1%
South Carolina
243,030
27%
20%
51%
2%
0%
<1%
South Dakota
32,694
<1%
22%
0%
1%
77%
0%
Tennessee
465,345
67%
31%
2%
0%
0%
<1%
Texas
1,284,153
56%
28%
13%
1%
2%
<1%
Utah
127,850
83%
17%
0%
0%
0%
0%
Vermont
11,676
19%
23%
45%
13%
0%
0%
Virginia
241,530
41%
28%
13%
9%
9%
1%
Washington
382,571
86%
14%
0%
0%
0%
<1%
West Virginia
107,246
10%
81%
5%
4%
0%
0%
Wisconsin
434,584
50%
31%
4%
2%
12%
1%
Wyoming
2,596
7%
31%
0%
57%
0%
5%
NOTE: Total U.S. includes Puerto Rico. Includes employer-sponsored plans, special needs plans, and other private plans. Other includes MSAs and demonstration plans.SOURCE: Authors’ analysis of CMS Medicare Advantage enrollment and Landscape files, 2017.
Table A2: Medicare Advantage Enrollment in the Individual and Group Markets, by State, 2017
Table A6. Market Share of the Top Three Medicare Advantage Firms, by State, 2017
State
Total
Firm 1
Firm 2
Firm 3
Other Firms
Enrollment
Share for 3 Firms
Name
Share
Name
Share
Name
Share
Share
Alabama
358,325
72%
UnitedHealth Group, Inc.
32%
BCBS
24%
Humana Inc.
15%
28%
Alaska
655
100%
Aetna Inc.
85%
UnitedHealth Group, Inc.
15%
N/A
N/A
0%
Arizona
463,447
73%
UnitedHealth Group, Inc.
45%
BCBS
15%
Humana Inc.
13%
27%
Arkansas
130,465
77%
UnitedHealth Group, Inc.
33%
Humana Inc.
31%
BCBS
12%
23%
California
2,348,224
73%
Kaiser Foundation Health Plan, Inc.
47%
UnitedHealth Group, Inc.
18%
SCAN Health Plan
8%
27%
Colorado
309,369
88%
UnitedHealth Group, Inc.
41%
Kaiser Foundation Health Plan, Inc.
34%
Humana Inc.
13%
12%
Connecticut
180,612
81%
UnitedHealth Group, Inc.
34%
EmblemHealth, Inc.
27%
Aetna Inc.
20%
19%
Delaware
20,739
87%
Aetna Inc.
46%
CIGNA
21%
UnitedHealth Group, Inc.
20%
13%
District of Columbia
13,914
91%
Kaiser Foundation Health Plan, Inc.
45%
UnitedHealth Group, Inc.
40%
Aetna Inc.
6%
9%
Florida
1,793,258
68%
Humana Inc.
34%
UnitedHealth Group, Inc.
26%
BCBS
8%
32%
Georgia
554,075
81%
UnitedHealth Group, Inc.
47%
Humana Inc.
20%
Aetna Inc.
13%
19%
Hawaii
116,082
80%
BCBS
31%
Kaiser Foundation Health Plan, Inc.
27%
UnitedHealth Group, Inc.
23%
20%
Idaho
92,580
75%
BCBS
33%
PacificSource Health Plans
22%
UnitedHealth Group, Inc.
21%
25%
Illinois
454,965
74%
UnitedHealth Group, Inc.
37%
Humana Inc.
24%
Aetna Inc.
13%
26%
Indiana
311,612
88%
UnitedHealth Group, Inc.
34%
Humana Inc.
33%
BCBS
21%
12%
Iowa
104,458
90%
UnitedHealth Group, Inc.
36%
Aetna Inc.
36%
Humana Inc.
18%
10%
Kansas
75,281
92%
Aetna Inc.
45%
Humana Inc.
33%
UnitedHealth Group, Inc.
14%
8%
Kentucky
245,786
92%
Humana Inc.
59%
BCBS
18%
UnitedHealth Group, Inc.
15%
8%
Louisiana
271,778
90%
Humana Inc.
62%
PH Holdings, LLC
22%
Vantage Holdings, Inc.
6%
10%
Maine
87,548
84%
Martin’s Point Health Care, Inc.
46%
Aetna Inc.
20%
UnitedHealth Group, Inc.
19%
16%
Maryland
106,861
66%
Kaiser Foundation Health Plan, Inc.
39%
UnitedHealth Group, Inc.
17%
CIGNA
10%
34%
Massachusetts
266,741
78%
Tufts Associated HMO, Inc.
37%
UnitedHealth Group, Inc.
22%
BCBS
18%
22%
Michigan
673,166
84%
BCBS
56%
Spectrum Health System
19%
Henry Ford Health System
10%
16%
Minnesota
542,941
81%
BCBS
45%
Medica Holding Company
19%
UCare Minnesota
17%
19%
Mississippi
93,708
95%
Humana Inc.
61%
WellCare Health Plans, Inc.
25%
CIGNA
10%
5%
Missouri
368,222
79%
UnitedHealth Group, Inc.
36%
Aetna Inc.
27%
Humana Inc.
16%
21%
Montana
42,742
100%
BCBS
81%
Humana Inc.
16%
UnitedHealth Group, Inc.
3%
<1%
Nebraska
39,967
94%
UnitedHealth Group, Inc.
53%
Aetna Inc.
27%
Humana Inc.
14%
6%
Nevada
169,207
87%
UnitedHealth Group, Inc.
46%
Humana Inc.
31%
Renown Health
10%
13%
New Hampshire
27,996
83%
UnitedHealth Group, Inc.
57%
Harvard Pilgrim Health Care, Inc.
14%
Humana Inc.
12%
17%
New Jersey
326,486
89%
UnitedHealth Group, Inc.
40%
Aetna Inc.
26%
BCBS
22%
11%
New Mexico
129,973
81%
Presbyterian Healthcare Services
36%
BCBS
24%
UnitedHealth Group, Inc.
21%
19%
New York
1,325,900
53%
UnitedHealth Group, Inc.
25%
BCBS
17%
Healthfirst, Inc.
11%
47%
North Carolina
587,632
84%
UnitedHealth Group, Inc.
43%
Humana Inc.
24%
BCBS
17%
16%
North Dakota
21,353
98%
Medica Holding Company
90%
Humana Inc.
8%
UnitedHealth Group, Inc.
1%
2%
Ohio
787,209
67%
BCBS
26%
Aetna Inc.
25%
Humana Inc.
16%
33%
Oklahoma
124,677
76%
UnitedHealth Group, Inc.
27%
Humana Inc.
26%
CommunityCare Managed Healthcare Plans of OK, Inc.
23%
24%
Oregon
355,438
50%
Health Net, Inc.
19%
Kaiser Foundation Health Plan, Inc.
17%
UnitedHealth Group, Inc.
14%
50%
Pennsylvania
1,065,053
71%
BCBS
33%
Aetna Inc.
22%
UPMC Health System
15%
29%
Rhode Island
77,285
100%
BCBS
69%
UnitedHealth Group, Inc.
30%
PACE Organization of Rhode Island
<1%
0%
South Carolina
243,030
92%
UnitedHealth Group, Inc.
51%
Humana Inc.
38%
Aetna Inc.
3%
8%
South Dakota
32,694
98%
Medica Holding Company
77%
Humana Inc.
15%
Aetna Inc.
6%
2%
Tennessee
465,345
77%
Humana Inc.
29%
BCBS
28%
UnitedHealth Group, Inc.
20%
23%
Texas
1,284,153
74%
UnitedHealth Group, Inc.
35%
Humana Inc.
31%
CIGNA
7%
26%
Utah
127,850
81%
UnitedHealth Group, Inc.
54%
Intermountain Health Care, Inc.
18%
Aetna Inc.
9%
19%
Vermont
11,676
99%
UnitedHealth Group, Inc.
85%
MVP Health Care, Inc.
13%
Aetna Inc.
2%
1%
Virginia
241,530
85%
Humana Inc.
55%
UnitedHealth Group, Inc.
21%
Kaiser Foundation Health Plan, Inc.
9%
15%
Washington
382,571
76%
UnitedHealth Group, Inc.
32%
Kaiser Foundation Health Plan, Inc.
31%
BCBS
14%
24%
West Virginia
107,246
90%
Humana Inc.
70%
Aetna Inc.
15%
BCBS
5%
10%
Wisconsin
434,584
69%
UnitedHealth Group, Inc.
38%
Humana Inc.
16%
Ministry Health Care, Inc.
15%
31%
Wyoming
2,596
98%
UnitedHealth Group, Inc.
67%
Aetna Inc.
26%
Memorial Hospital of Laramie County
5%
2%
NOTE: Territories are excluded. BCBS is Blue Cross and Blue Shield affiliated health plans.SOURCE: Authors’ analysis of CMS Medicare Advantage enrollment and Landscape files, 2017.
Table A7. Enrollment in Special Needs Plans (SNPs), by Plan Type and State, 2017
State
Enrollment in Special Needs Plans
Total Dual Eligibles (in 2014)
% of Dual Eligibles inD-SNPs
Total
Dual eligibles(D-SNPs)
Chronic or disabling conditions(C-SNPs)
Institutional(I-SNPs)
Total U.S.
2,022,154
1,642,039
318,421
61,694
11,063,740
15%
Alabama
51,525
51,003
0
522
222,740
23%
Alaska
0
0
0
0
17,420
<1%
Arizona
98,451
84,530
11,453
2,468
199,180
42%
Arkansas
28,377
14,497
13,880
0
138,480
10%
California
183,920
135,606
45,825
2,489
1,424,500
10%
Colorado
13,380
10,227
110
3,043
112,220
9%
Connecticut
24,477
21,493
0
2,984
181,120
12%
Delaware
2,342
1,273
529
540
30,440
4%
District of Columbia
5,524
5,322
135
67
32,580
16%
Florida
335,927
262,979
68,601
4,347
819,220
32%
Georgia
106,934
58,201
45,665
3,068
330,800
18%
Hawaii
21,020
21,020
0
0
39,860
53%
Idaho
2,245
2,245
0
0
45,980
5%
Illinois
15,162
10,831
3,607
724
402,620
3%
Indiana
6,462
4,678
819
965
205,580
2%
Iowa
0
0
0
0
91,920
<1%
Kansas
1,078
1,027
51
0
71,540
1%
Kentucky
9,633
8,338
1,174
121
198,640
4%
Louisiana
38,907
37,393
1,514
0
218,100
17%
Maine
3,747
3,559
144
44
96,480
4%
Maryland
13,538
6,352
4,118
3,068
148,480
4%
Massachusetts
42,875
42,575
181
119
320,920
13%
Michigan
13,022
12,915
87
20
330,840
4%
Minnesota
39,147
39,147
0
0
149,660
26%
Mississippi
16,413
16,413
0
0
172,020
10%
Missouri
27,673
14,620
12,548
505
199,400
7%
Montana
219
219
0
0
27,420
1%
Nebraska
33
33
0
0
45,340
<1%
Nevada
10,745
11
10,133
601
60,200
<1%
New Hampshire
200
31
0
169
35,120
<1%
New Jersey
24,092
21,662
229
2,201
229,660
9%
New Mexico
18,044
18,044
0
0
86,000
21%
New York
248,436
230,153
755
17,528
900,480
26%
North Carolina
24,691
21,828
112
2,751
345,240
6%
North Dakota
0
0
0
0
17,540
<1%
Ohio
23,397
19,826
2,141
1,430
376,040
5%
Oklahoma
163
0
0
163
124,120
<1%
Oregon
26,878
21,871
3,952
1,055
128,180
17%
Pennsylvania
126,713
119,049
3,636
4,028
469,580
25%
Rhode Island
2,494
873
0
1,621
43,360
2%
South Carolina
68,425
24,364
44,061
0
164,720
15%
South Dakota
0
0
0
0
22,880
<1%
Tennessee
89,215
89,215
0
0
285,100
31%
Texas
181,104
142,846
38,028
230
740,940
19%
Utah
8,159
8,159
0
0
39,620
21%
Vermont
0
0
0
0
30,880
<1%
Virginia
6,076
2,340
3,147
589
204,900
1%
Washington
31,575
29,801
0
1,774
200,040
15%
West Virginia
1,008
581
0
427
93,240
1%
Wisconsin
28,708
24,889
1,786
2,033
180,020
14%
Wyoming
0
0
0
0
12,380
<1%
NOTE: Territories are excluded.SOURCE: Authors’ analysis of CMS Medicare Advantage enrollment and Landscape files, 2017. Number of dual eligibles by state is derived from the CMS Chronic Conditions Data Warehouse standard analytic files for 2014.
G. Jacobson, P. Neuman, and A. Damico. “At Least Half of New Medicare Advantage Enrollees Had Switched From Traditional Medicare During 2006-11,” Health Affairs, vol. 34 no. 1, p. 48-55, January 2015. Also see G. Jacobson, T. Neuman, and A. Damico. “Medigap Enrollment Among New Medicare Beneficiaries: How Many 65-Year Olds Enroll In Plans With First-Dollar Coverage?” Washington DC: Kaiser Family Foundation, April 2015. Available at: https://modern.kff.org/medicare/issue-brief/medigap-enrollment-among-new-medicare-beneficiaries/, last accessed June 5, 2015. ↩︎
For example, General Electric moved its hourly retirees who turn 65 by January 2018 to a health exchange where they can purchase a subsidized Medigap or Medicare Advantage policy (the policy already applied to salaried workers). See James Passeri, “GE Saves $3.3 Billion With Cuts to Retirees’ Life, Health Benefits,” The Street, August 4, 2015, available at: https://www.thestreet.com/story/13239214/1/ge-saves-33-billion-with-cuts-to-retirees-life-health-benefits.html. ↩︎
Limits were required for regional PPOs since they were first authorized in 2006. ↩︎
CMS conducted a demonstration between 2012 and 2014 that provided bonus payments to the vast majority of plans. For more information, see G. Jacobson, T. Neuman, A. Damico and J. Huang, “Medicare Advantage Plan Star Ratings and Bonus Payments in 2012,” Kaiser Family Foundation, November 2011. Available at: https://modern.kff.org/medicare/report/medicare-advantage-2012-star-ratings-and-bonuses/. ↩︎
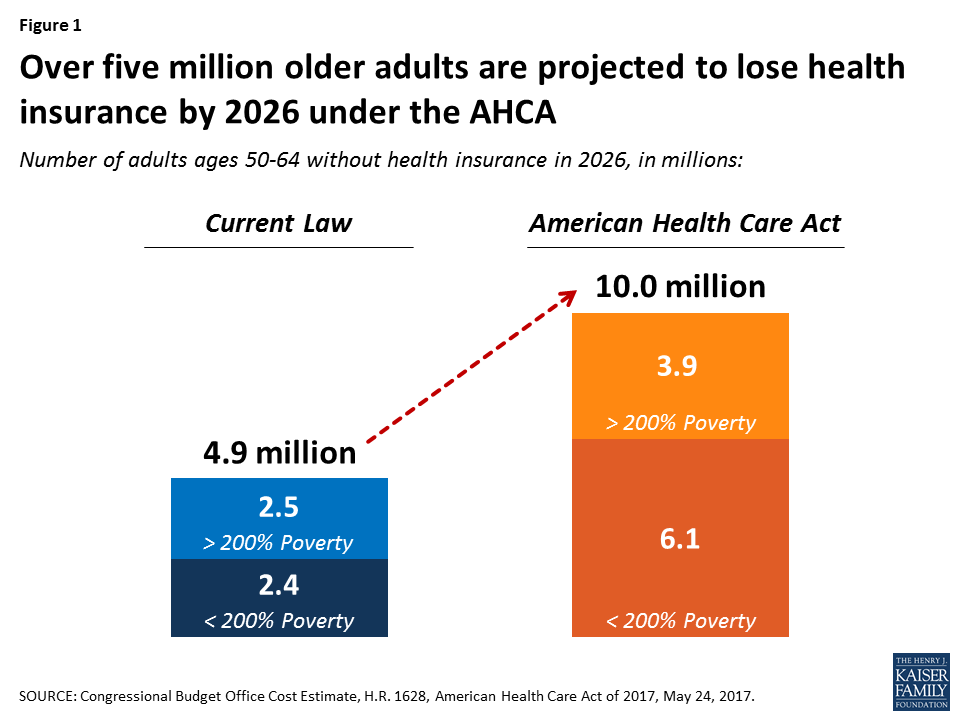
As a group, older Americans are likely to see some of the biggest changes in their health insurance under the House-passed American Health Care Act (AHCA). The Congressional Budget Office projects that the number of 50- to 64-year-olds who are uninsured would rise to 10 million in 2026, about 5.1 million more than the number who would be uninsured under current law. Many of those who do have coverage would see steep increases in premiums well before then.
A new issue brief from the Kaiser Family Foundation explains the key AHCA provisions that would reshape the private market so it more closely resembles the pre-Affordable Care Act period, when adults in their fifties and early sixties — who tend to have more health problems than younger people – were the most at risk of facing unaffordable premiums or being uninsured. The AHCA’s changes include greater latitude for insurers to charge older customers higher premiums, new waivers under which states could opt out of certain ACA insurance market rules and changes in the way tax credits are calculated. Because of the changes, some older adults — especially those with lower incomes — could see out-of-pocket costs for insurance premiums rise by thousands of dollars per year, according to the CBO.
The new brief also notes that the AHCA’s changes to Medicaid could leave some low-income adults age 50 to 64 without coverage. And it explains how an increase in the number of uninsured people in this age group could lead this population to be sicker and more expensive to care for when they become eligible for Medicare at age 65, pushing up costs for that program.
Now that the House has passed its bill to repeal and replace the Affordable Care Act (ACA), Senate negotiators face a number of policy decisions that could be of particular interest to older adults who are not quite old enough for Medicare. Prior to the ACA, adults in their fifties and early 60s were arguably most at risk in the private health insurance market. They were more likely than younger adults to be diagnosed with certain conditions, like cancer and diabetes, for which insurers denied coverage. They were also more likely to face unaffordable premiums because insurers had broad latitude (in nearly all states) to set high premiums for older and sicker enrollees.
The ACA included several provisions that aimed to address problems older adults faced in finding more affordable health insurance coverage, including guaranteed access to insurance, limits on age rating, and a prohibition on premium surcharges for people with pre-existing conditions.
Figure 1: Over five million older adults are projected to lose health insurance by 2026 under the AHCA
These changes would disproportionately affect older adults with incomes below 200% of poverty. Adults age 50-64 with incomes below 200% of the poverty level would see the biggest loss of coverage under the AHCA – a 150% increase in the number of uninsured in 2026 relative to current law, compared to 90% for all adults. CBO projects the share of low-income older adults who are uninsured would rise from 12% under current law to 29% under the AHCA by 2026.
The increase in the number and share of uninsured older adults would be due to the following provisions in the AHCA:
Age Bands. The AHCA broadens the limits on age bands established under the ACA, a change that is likely to lead to higher premiums for older enrollees. The ACA prohibits insurers from charging older adults more than 3-times the premium amount for younger adults. The House bill would allow insurers to charge older adults five times more than younger adults, beginning in 2018. States would have flexibility to establish different age bands (broader or narrower).
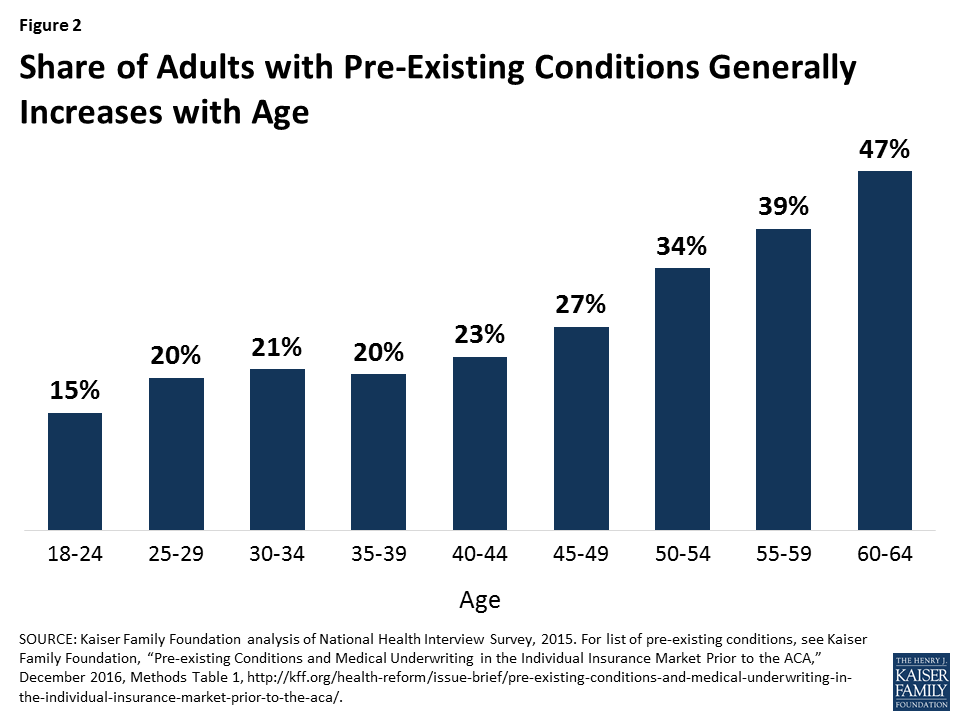
State Waivers. The AHCA allows states to seek waivers that, if approved, would allow insurers to opt out of the ACA’s community rating and benefit requirements. Insurers in these states could charge a higher premium to an applicant with a pre-existing condition who had a lapse in coverage of 63 days or more. Before the ACA, insurers in nearly all states could deny non-group coverage for people with pre-existing conditions or charge them higher premiums. These waivers would lower premiums for people who are healthy, but raise premiums and out-of-pocket costs for people who are sick.Because many health problems and pre-existing conditions tend to increase with age, the opt-out could particularly affect older adults. For example, 47% of adults age 60-64 have a pre-existing condition that would have led to a denial of coverage pre-ACA, compared to 27% of non-elderly adults overall (Figure 2).
Figure 2: Share of Adults with Pre-Existing Conditions Generally Increases with Age
Tax Credits. The AHCA changes the way that premium tax credits are calculated, providing lower premium subsidies for low-income adults, relative to the ACA – a change that would have a particularly pronounced effect for low-income older adults. The combination of higher premiums (due to wider age bands) and lower tax credits (especially for those with lower incomes) will result in higher out-of-pocket premiums for older adults.CBO’s updated analysis illustrates how these proposed changes to the non-group market result in substantially higher premiums for low-income older adults. According to CBO, a 64-year-old adult living on an income of $26,500 would, on average nationwide, pay a premium of $1,700 under current law in 2026, after receiving a tax credit of $13,600. Under the AHCA, the tax credit for that 64-year-old would fall to $4,900, resulting in an average out-of-pocket premium in states not seeking waivers of $16,100. That premium would also be for a plan, according to CBO’s estimates, with a higher deductible than under current law.Even in states that waive federal market regulations for benefits and community rating, the out-of-pocket premium for this low-income 64-year-old would rise to $13,600. The impact on higher income 64-year-olds relative to current law would be more modest, since AHCA tax credits do not phase out by income like the ACA.The effects would vary geographically since AHCA tax credits (unlike ACA credits) do not vary based on actual local premiums. For example, in Mecklenburg County, North Carolina (an area with particularly high premiums), a 60-year-old enrollee with income of $20,000 would pay $960 per year in premiums in 2020 for a mid-range plan under the ACA and would pay $19,060 for equivalent coverage under the AHCA. The increased premiums would be less pronounced in areas with lower premiums. But, given the effects of changes under the AHCA in allowed premium variation due to age, low and middle income older adults would see increases in premiums in almost all areas of the country (as shown here). Older adults with higher incomes would fare better, since they would receive premium tax credits under the AHCA but not the ACA.
Medicaid. Changes to Medicaid could also affect coverage and costs for low-income older adults, depending on how states respond to new financial arrangements in the AHCA. The AHCA would limit federal funds for states that have elected to expand coverage under Medicaid, repealing the ACA’s higher federal match for these expansion states as of January 2020. This provision – along with a cap on the growth in federal Medicaid funding over time on a per capita basis – is expected to result in 14 million people losing Medicaid coverage by 2026, some of whom would no doubt be older adults. In 2013, about 6.5 million 50-64-year-olds relied on Medicaid for their health insurance coverage.1
The loss of coverage for adults in their 50s and early 60s could have ripple effects for Medicare, a possibility that has received little attention. If the AHCA results in a loss of health insurance for a meaningful number of people in their late 50s and early 60s, as CBO projects, there is good reason to believe that people who lose insurance will delay care, if they can, until they turn 65 and go on Medicare, and then use more services once on Medicare. This could cause Medicare to increase, and when Medicare spending rises, premiums and cost-sharing do too.
A 2007 study published in the New England Journal of Medicine that looked at previously uninsured Medicare beneficiaries helps explain this dynamic. It showed a direct relationship between lack of insurance (pre-65) to higher service use and spending (post-65). Previously uninsured adults were more likely than those with insurance to report a decline in health, and a decline in health (pre-65) was associated with 23.4% more doctor visits and 37% more hospitalizations after age 65. Depending on the number of people who lose coverage and how long they remain uninsured, the impact for Medicare may initially be modest, but could compound with time.
In addition, the AHCA would repeal the Medicare payroll tax imposed on high earners, a change that would accelerate the insolvency of the Medicare Hospital Insurance Trust Fund and put the financing of future Medicare benefits at greater risk for current and future generations of older adults – another factor to consider as this debate moves forward.
This issue brief was funded in part by The Retirement Research Foundation.
Endnotes
Kaiser Family Foundation analysis of MSIS data, 2013. ↩︎
A new brief from the Kaiser Family Foundation outlines options for state insurance markets and challenges that states could face under the House’s replacement for the Affordable Care Act (ACA).
Passed by the House on May 4 and now under consideration by the Senate, the American Health Care Act (AHCA) would reduce the federal government’s role and resources in providing health insurance coverage – particularly for people with low or moderate incomes — while expanding authority and financial responsibility of the states.
The new brief describes provisions of the AHCA over which states have discretion, and it discusses challenges that the bill presents states by significantly reducing both federal payments to Medicaid and funding for subsidies in the non-group insurance market, and by repealing the requirement that individuals have health insurance, a move that could drive up premiums.
The House health bill establishes two main ways for states to address these issues. States may use money from a new Patient and State Stability Fund to offset a portion of the federal spending reductions, and they may obtain a waiver to modify important insurance provisions.
Competing demands for reduced federal funding. Resources available through the Patient and State Stability Fund would be less than the spending reductions called for in the House bill.
Funding limitations over time. Annual appropriations to the Patient and State Stability Fund don’t grow over time and end entirely after 2026.
Waiving essential health benefits vs. limiting availability of coverage. States could lower premium rates in the individual market by using an essential health benefits waiver to reduce the benefits that policies are required to cover. However, insurers may then choose to charge higher premiums to cover important benefits that are no longer defined as essential health benefits, or they may choose not to cover those benefits.
Waiving community rating vs. protecting access for people who are sick. A waiver to allow insurers to use health in rating applicants with a coverage gap is another way that states could seek to lower premiums. The bill provides states with options for covering individuals with pre-existing conditions and a gap; however, states would risk some individuals being priced out of the market.
The American Health Care Act, as passed by the House, (HR 1628 or AHCA) would make significant changes to the insurance market provisions established by the Affordable Care Act (ACA) and to the financial assistance provided to people who purchase non-group coverage. The proposal would reduce the federal role in health coverage and devolve authority to states over key market rules and consumer protections affecting access and affordability, albeit with federal back-up provisions if states fail to take action. This brief outlines the provisions in the AHCA providing flexibility for states and addresses some of the issues and tradeoffs they could face.
The AHCA would dramatically reduce federal spending on health coverage between 2018 and 2026, lowering federal contributions to Medicaid by $834 billion and subsidies for non-group health insurance by an additional $290 billion.1 The AHCA also would eliminate the tax penalty for people who do not have health insurance, replacing it with a premium surcharge (30% for up to one year) for non-group enrollees who have a gap of insurance of at least 63 days in the previous year. The tax penalty for employers that do not offer coverage to full-time workers also would be repealed. Overall, CBO estimates that the AHCA changes would result in an additional 23 million people being uninsured in 2026.2
To offset a portion of the federal spending reductions, the AHCA would create a federal fund called the Patient and State Stability Fund (“Fund.”) The bill appropriates up to $123 billion between 2018 and 2026 that states could use for a number of designated purposes related to coverage and the costs of care, plus an additional $15 billion for a federal invisible risk sharing program that states would have the option to administer. States also would have flexibility to modify important insurance provisions: through waivers, they could extend rate variation due to age, modify the essential health benefits, or permit insurers to use an applicant’s health as a rating factor for individuals applying for coverage if they have had a coverage gap in the year prior to their enrollment.
In the next sections, we describe the Fund and the waiver authority in the AHCA. After that, we discuss some of the issues and tradeoffs that states would need to address with the flexibility and funds provided.
Patient and State Stability Fund
The AHCA creates a new grant program that makes up to $123 billion available to states between 2018 and 2026. Of that, $100 billion ($15 billion for each of 2018 and 2019 and $10 billion each year from 2020 to 2026) would be available for a number of purposes described below, although in its estimate, CBO assumed that most of the funds would be used to reduce premiums or increase benefits in the non-group market.3 An additional $15 billion would be available in 2020 for maternity coverage and newborn care and prevention, treatment, or recovery support services for individuals with mental or substance use disorders. An additional $8 billion would be available between 2018 and 2023 to reduce premiums and other out-of-pocket costs for individuals paying higher premiums due to a waiver permitting insurers to use health status in setting premiums (discussed below).
Funds would be allocated among states through a formula that considers the total medical claims incurred by health insurers in the state, the number of uninsured in the state with incomes under poverty, and the number of health insurers serving, for 2018 and 2019, the state’s exchange, and for 2020 to 2026, the state’s insurance market.
States could apply for funding for any of the permitted purposes under an expedited process, with applications automatically approved unless the federal government denies the application within 60 days for cause. Starting in 2020, state matching funds would be required to draw down the allocated federal funds: states would be required to match 7% of the federal funds in 2020, phasing up to 50% in 2026.4 No funds would be appropriated for years after 2026.
States could seek funds for one or more of the specified purposes:
Providing financial assistance to high-risk individuals not eligible for employer-based coverage who enroll in the individual market. The bill language is vague, but this provision appears to permit states to use their allocation to set up a high-risk pool or other mechanisms to provide or subsidize coverage for individuals with preexisting conditions without access to employer-sponsored coverage. By covering high-cost people in a separate pool, their costs are removed from the premium calculations of non-group insurers, lowering the premiums for other enrollees in private insurance. The AHCA does not address how people with preexisting conditions might be encouraged or required to participate in separate high-risk pools in states without waivers, because people with preexisting conditions generally would have access to non-group coverage at a community rate during open and special enrollment periods. A high-risk pool could be an option in states with a waiver to use health as a rating factor, where the pool could provide coverage to people with preexisting conditions who are offered coverage at very high premiums due to their health.
Providing incentives to entities (e.g., insurers) to enter into arrangements with the state to stabilize premiums in the individual market. This provision appears to permit states to use their allocation for a reinsurance program. Reinsurance programs lower premiums in a market because they reimburse health insurers for a portion of the claims for people with high-costs, reducing the premiums they need to collect from enrollees. A reinsurance program operated during the first three years of the ACA; the Congressional Budget Office estimated that the reinsurance program ($10 billion in 2014) reduced non-group premiums by about 10% in 2014.
Reducing the cost of providing non-group or small-group coverage in markets to individuals facing high costs due to high rates of utilization or low population density. Premiums vary significantly across and within states. This provision would allow states to use resources in higher cost or rural areas.
Promoting participation in the non-group and small-group markets and increasing options in these markets. In the past, for example, state based marketplaces that devote resources to outreach and enrollment assistance have been able to help more applicants during open enrollment periods.
Promoting access to preventive, dental and vision care services and to maternity coverage, newborn care, and prevention, treatment and recovery support services for people with mental health or substance disorders. This purpose was added to the bill as the House considered changes to the ACA essential health benefits standard. Fifteen billion dollars in Fund resources are dedicated for spending on maternity, newborn, mental health, and substance abuse services in the year 2020.
Providing direct payments to providers for services identified by the Administrator of the Centers for Medicare and Medicaid Services (CMS). For example, states might use Fund resources to expand services provided by public hospitals, free clinics, and other safety net providers that offer treatment to residents who are uninsured or under-insured.
Providing cost-sharing assistance for people enrolled in health insurance in the state. The AHCA would repeal current law cost sharing subsidies ($97 billion between 2020 and 2026), which pay insurers for the cost of providing reduced cost sharing to low-income marketplace enrollees. States could use their fund allocation to offset some of this reduction or assist others with private health insurance (such as those with employer-based coverage) who have high out-of-pocket costs.
These categories are quite broadly specified, providing states with discretion about what policies they may want to pursue and how to how to design programs to address different health care needs in their state. The options include ways to reduce premiums (through reinsurance, for example), to make direct payments to health care providers, or to help insurance enrollees with high out-of-pocket costs. States could pursue one or more of these approaches, although they are constrained by the amount of funds available and by their need to match the federal funds after 2020.
CBO estimated that $102 billion of the $123 billion provided to states would be claimed by states by 2026. CBO assumed that states would use most of their Fund allocations to reduce premiums or increase benefits in the non-group market; it assumed $14 billion of the available $15 billion available for maternity coverage, newborn care, and mental health and substance abuse care would be used for direct payments for services.5
Federal default program. In states without an approved application for monies from the Fund for a year, the bill would authorize the CMS administrator, in consultation with the insurance commissioner for the state, to operate a reinsurance program in the state for that year. The program would reimburse insurers 75% of the cost of claims between $50,000 and $350,000 for years 2018 and 2019; the CMS Administrator would adjust these parameters for 2020 through 2026. To receive funds through the default program, the state would be required to match the federal funds, with matching rates starting at 10% in 2018 and increasing to 50% by 2024, remaining at 50% through 2026.
Invisible risk sharing program. The AHCA also would create a separate reinsurance program as part of the Fund, called the Federal Invisible Risk Sharing Program (FIRSP). The FIRSP is not a grant program, but would make payments to health insurers in every state to offset a portion of the claims for eligible individuals (e.g., enrollees with high claims or with specified conditions). The CMS Administrator would determine the parameters of the program and would administer the program, although states would be authorized to assume operation of the program beginning in 2020. The bill appropriates $15 billion to the FIRSP for 2018 through 2026. Additionally, at the end of each year, any unallocated monies in the Fund (which could occur if a state did not agree to match the federal funds) would be reallocated to FIRSP as well.
The AHCA does not specify how FIRSP would be coordinated with states that adopt a reinsurance program or for which the CMS Administrator is operating a federal default program. These issues could be addressed as the Administrator specifies the parameters of the FIRSP. CBO assumed that all of the $15 billion in FIRSP funding would be used over the period.6
State Waiver Options
The AHCA would permits states to seek waivers to federal minimum standards for non-group and small-group coverage to (1) modify the limit for age rating,7 (2) modify the essential health benefit package, and (3) permit insurers to consider the health status of applicants for non-group coverage if they have had a coverage gap in the past year.
To obtain a waiver, state must show that the waiver would do one or more of the following: reduce average premiums, increase health insurance enrollment, stabilize the market for health insurance, stabilize premiums for people with preexisting conditions or increase choice of health plans. The waiver permitting health as a rating factor has an additional requirement, discussed below.
Waiver to permit rating based on health
The AHCA generally would require non-group insurers to assess a premium surcharge of 30% to all applicants (regardless of their health) who have had a coverage gap of at least 63 consecutive days in the 12 months preceding enrollment. The surcharge would apply during an enforcement period (which ends at the end of a calendar year).
In lieu of the 30% premium surcharge, the bill also authorizes states to seek a waiver that would permit insurers to consider an applicant’s health in determining premiums. Health status rating could apply for people with a coverage gap in the year preceding enrollment. States could seek a waiver for enrollments during special enrollment periods for 2018 and beyond, and for signups during open enrollment periods for 2019 and beyond. Insurers would not be permitted to deny coverage to an applicant based on their health, but the bill does not limit the additional amount that an applicant can be charged based on their health (the state could limit the amount of the health surcharge but is not required to do so). Similar to the rules regarding the 30% surcharge, insurers would be able to apply the health status rating through December 31 of the plan year for which the individual enrolled.
To be eligible for a community-rating waiver, in addition to the general waiver requirements, the state must have in place a program that either provides financial assistance to high risk individuals (e.g., a high risk pool) or provide incentives to help stabilize premiums in the individual health insurance market (e.g., reinsurance payments to insurers) or it must participate in the FIRSP. Because the FIRSP would operate in all states, with no requirement for state matching funds, it would appear that all states would be eligible for the community-rating waiver without having to set up a separate high-risk pool or reinsurance program. The bill imposes no additional requirements for the state programs. The bill would provide $8 billion to the Fund over five years (2018 through 2022) for states with these waivers to help reduce the premiums out-of-pocket costs for people who have higher premiums due to waiver. State matching funds would seem to be required to draw down funds starting in 2020. CBO estimates that $6 billion of the $8 billion would be used.
Because there is no limit on the amounts by which insurers could vary premiums based on health, a premium surcharge for people with pre-existing conditions who have had gaps in coverage could provide a stronger incentive for people to maintain continuous coverage than the 30% surcharge that would otherwise apply. Before passage of the ACA, insurers declined applicants frequently, even when they could have charged a higher premium instead, suggesting that insurers would likely assess very high health premium surcharges for people with potentially costly preexisting conditions. While not an actual denial, very high surcharges would likely have in practice the same effect for many people subject to surcharges based on their health.
Under the bill, states with a waiver could also permit insurers to use health rating to charge healthy applicants with a coverage gap a lower than standard premium available to people with continuous coverage. Under this approach, healthy applicants would have an incentive to submit to health rating, even if they had continuous coverage. This could have a destabilizing effect on the market because healthy people could have an incentive to switch to new coverage at renewal, without submitting proof of continuous coverage, in hopes of finding a lower premium based on their good health, which would cause the standard rates generally available for people with continuous coverage to increase.
As a condition of receiving a community-rating waiver, the AHCA does not require that a state must assure access to non-group coverage or make an alternative source of coverage available to people subject to health rating if the rate they are offered is very high. For example, a state participating in the FIRSP is eligible for this waiver, and that program reimburses health insurers for people that become enrollees; a person offered a very high health status rate might never become covered. It is unclear how much authority the Secretary of Health and Human Services (HHS) would have to address this issue in the waiver process, given the expedited waiver approval provisions in the bill.
Waiver to Modify the Essential Health Benefits Package
Under current law, insurance policies offered in the non-group and small-group markets must cover a fairly comprehensive list of defined essential health benefits: ambulatory patient services, emergency services, hospitalization, maternity and newborn care, mental health and substance use disorder services, including behavioral health treatment, prescription drugs, rehabilitative and habilitative services and devices, laboratory services, preventive and wellness services and chronic disease management, and pediatric services, including oral and vision care. The essential health benefits are a minimum that must be offered; insurers may offer additional benefits as well.
In addition to the list of essential health benefit categories, a number of constraints and consumer protections apply to their definition by the Secretary of HHS, including:
that the scope of the essential health benefits offered in these markets is equal to the scope of benefits provided under a typical employer plan;
that coverage decisions, determination of reimbursement rates, establishment of incentive programs, and design benefits cannot be made in ways that discriminate against individuals because of their age, disability, or expected length of life;
that essential health benefits take into account the needs of diverse segments of the population, including women, children, and people with disabilities;
that essential health benefits not be subject to denial to individuals against their wishes on the basis of the individuals’ age or expected length of life or of the individuals’ present or predicted disability, degree of medical dependency, or quality of life;
that emergency services provided by out-of-network providers would be provided without prior authorization or other limits on coverage, and would be subject to in-network cost sharing requirements;
Current law also prohibits insurers from applying annual or lifetime dollar limits to essential health benefits.
The AHCA would authorize states, for years 2020 and beyond, to seek a waiver to modify the essential health benefits that insurers would need to offer in the non-group and small group markets. States also could seek to modify the provisions relating to the scope of the benefits and to their definition. There are no limits or parameters in the AHCA regarding the changes a state could make to the essential health benefit list or its definitions, although several provisions of current law could limit their discretion. For example, the current prohibition on applying annual and lifetime maximum dollar limits to essential health benefits may prevent states from using dollar limits in defining the scope of benefits they include as essential health benefits, and the application of mental health parity rules to qualified health plans may prohibit a state that includes mental health or substance abuse services as an essential health benefit from applying limits to the scope of those benefits that are not applicable to other benefits.
The waiver authority gives states wide latitude in defining essential health benefits that would be required in non-group and small group coverage. A state could remove one or more benefits from the list, which would mean that insurers could offer plans without those benefits or could offer them as an option in some policies or with limits. Maternity benefits, for example, were often not included in non-group policies prior to the ACA. A state also could limit the scope of a benefit; for example, determine that only generic drugs were essential health benefits or limit the scope of hospitalization to 60 days per year. Insurers would then be required to offer at least the limited scope of the benefit, with the option to cover a broader scope of the benefit (in our example, hospital coverage without no day limit) in some or all of their policies in the state. A state could also eliminate the standard, defining essential benefits to mean whatever insurers in a competitive market offer. As discussed below, however, adverse selection concerns would make it difficult for insurers to offer coverage that is much more comprehensive than the defined minimum at a reasonable premium.
Waiver to modify the limit on age rating
The AHCA would generally amend current law to expand the permissible premium variation due to age from 3 to 1 to 5 to 1, or any other ratio a State might elect. States also would be authorized to seek a waiver, for years 2018 and beyond, to put in place a higher rate permissible ratio. There are no limits in the AHCA on the ratio that a state could permit insurers to use. The waiver authority here appears to be redundant, as the underlying bill would authorize states to elect different ratios without seeking a waiver.
Issues and Tradeoffs that States May Need to Resolve
The AHCA would reduce the federal role and resources in providing health insurance coverage, particularly for people who are lower and moderate income and are covered though the Medicaid coverage expansion or through the non-group market. States would assume an expanded role, both financially and in making key decisions about the access and scope of benefits available to these people.
States would undertake this role facing some significant challenges.
Competing demands for reduced federal funding
The AHCA, by reducing the overall amount of federal premium tax credits, eliminating cost-sharing subsidies, and reducing federal contributions for the Medicaid expansion population and overall, would significantly reduce federal health care payments received by insurers, providers and people, leaving fewer people covered and more people with higher out-of-pocket costs. CBO estimates that, between 2018 and 2026, the AHCA would reduce federal Medicaid spending by $834 billion and federal spending on subsidies for non-group health insurance by $290 billion (Figure 1).8 By 2026, 23 million fewer people would have health insurance. States would have access to grant money through the Fund to try to address some of the issues, but the resources available through the Fund would be far less than the spending reductions. CBO estimates that states would use $102 billion from the Fund, with an additional $15 billion being spent by the FIRSP.9 States would be faced with a number of competing demands for the federal grant money, including lowering premiums, helping people with high cost sharing, and helping people and providers address access and financial issues resulting from the greater number of people without insurance.
Figure 1: Changes to Federal Contributions for Health Coverage, H.R. 1628
Challenges in reducing premiums and maintaining coverage
A second challenge for states relates to the cost of non-group health insurance premiums. Proponents of the AHCA have identified lowering the cost of non-group health insurance as a significant goal of the proposed law, but the underlying federal portions of the bill do not really do that. In fact, replacing the individual requirement to have health coverage with the continuous coverage provision would initially increase premium rates as compared with current law.10 A few provisions, including the elimination of the health insurance and the medical device taxes, the FIRSP, and the elimination of standard cost-sharing tiers would offset some of the increase from repealing the individual coverage requirement. The most significant tools to potentially lower premiums, however, would be under state discretion: using Fund dollars for reinsurance to offset premiums and seeking waivers to modify the essential health benefits and to permit the insurers to use health as a rate factor for applicants with a coverage gap. Each of these options, however, would involve significant policy and political tradeoffs.
Applying the grant dollars from the Fund could have a significant additional impact on premium rates, particularly because fewer people would likely be covered than under current law. CBO has assumed in its cost estimates of the AHCA that states would use most of their grants from the Fund to reduce non-group premiums or increase benefits.11 Based on a previous CBO cost estimate for the AHCA, researchers at the Brookings Institution estimated that the AHCA increased average premiums by about four percent when age is held constant (see box below). This suggests that states would need to use most of their grant Funds to bring premiums back to current levels. As just discussed, however, applying all or a large percentage of the grant funds to reduce premiums would mean that other potential needs might remain unaddressed.
Measuring Premium Change
Determining how much premiums would change due to changes in law is complicated because a number of factors affect what people pay and who would actually buy coverage. There are a few ways to look at this. One is the change in the average premium; this is the change in the average amount that people are expected to pay under current law and under the change. This is a good measure of how overall costs will change, but not a very good measure of how a particular person might see their premium change. Because premiums vary by things, such as where people live and what age they are, the average can change just because the distribution of enrollees changes; for example, if more young people enroll, the average premium goes down, but the premium that a person at any given age sees might remain the same. Looking at changes for people in certain rating classes, such as by age, comes closer to looking at what particular people may see, although the changes still may vary by location or by health status if insurers can use them in rating. Premiums for a person of a particular age or health also could vary due to changes in benefits or to the cost sharing they face.
Waiving essential benefits could reduce premiums but also limit availability
The waiver options would also pose difficult decisions for states. For example, a state could lower premium rates by using an essential health benefits waiver to reduce the required benefits in non-group or small-group policies. The argument for this approach is that some people could choose policies that cost less because they cover less, and others who want additional benefits could pay more for policies that covered those benefits. There are several difficulties with this, however.
One is that most claims costs fall into the basic insurance categories that would be hard to exclude. A recent report from Milliman based on their commercial claims database, found that claims from hospital care, outpatient care including physician costs, and prescription drugs accounted for around 70% of claims costs; adding emergency care and laboratory services brings that to over 80%. Redefining essential health benefits to meaningfully lower premiums would require either placing meaningful limits on these categories (for example, only including generic drugs as an essential benefit) or eliminating whole other categories. Looking at some of the categories that were sometimes excluded prior to the ACA: maternity coverage accounts for 3.4% of claims, mental health and substance abuse accounts for 4.2% of claims and preventive benefits account for 5.6% of claims.12 To obtain policies with lower premiums, people would need to choose policies with important limitations. CBO also notes that, should such categories be dropped from the definition of essential health benefits, non-group enrollees who need such care could see their out-of-pocket medical care spending increase by thousands of dollars in any given year.
A second difficulty is that this approach would lead to significant adverse selection against plans with benefits that were more comprehensive than the minimum required. Because market rules permit applicants to choose any policy at initial enrollment, and change their level of coverage annually at renewal, people who have or develop higher needs for a benefit that is not a defined essential health benefit can enroll or switch a plan that covers it without any impediment. For example, if a state were to determine that prescription drugs were not an essential health benefit, people without current drug needs would be more likely to take policies that did not provide drug coverage while people with current needs would be more likely to take policies that did. This would increase premiums for policies covering prescriptions to relatively high levels, discouraging people without drug needs from purchasing them, which would lead to even higher premiums. While the risk adjustment program could offset some of the impacts of selection, developing a risk adjustment methodology where there is substantial benefit variation is difficult.13 This dynamic would discourage insurers from offering coverage for important benefits not defined as essential health benefits, or if they were to offer it, they would do so at high premiums. People at average risk would likely not have reasonable options if they wanted to purchase coverage with significant benefits beyond those that were required for all policies. CBO also estimates that insurers generally would not want to sell policies that include benefits that were not required by state law.
The AHCA requires that $15 billion of the money in the Fund be used for maternity coverage, newborn care, and prevention, treatment and recovery support services for mental health and substance abuse disorders. States that chose not to include any of these services as essential health benefits could use these funds to make these services available, for example, by subsidizing optional coverage or providing direct services. The funds would only be available in 2020, although it might be possible for a state to use them over a longer period. The $15 billion was added to the Fund along with the authority to waive essential health benefits, which suggests that the sponsors may be anticipating that these services are at risk of not being defined as essential health benefits by states.
The second significant waiver option for states in the AHCA, allowing insurers to use health as a rating factor for applicants with a coverage gap within the previous year, would put states in the middle of one of the most contentious issues in this debate: how to provide access to coverage for people with preexisting health conditions. There are few specifics in the bill, but generally, as discussed above, a state could seek a waiver to allow insurers to use health in rating applicants with a coverage gap and to apply the health rate until the end of the calendar year (their enforcement period).
Waiving community rating vs. protecting access for people who are sick
This provision has the potential to reduce non-group premiums overall because permitting health-based rates that exceed 30% penalty that otherwise would apply to applicants with a coverage gap rating would make it more expensive for them to buy non-group plans, either generating more premiums from them or, more likely, diverting them from enrolling in the non-group market. If the permitted health surcharges were sufficiently high, the effect would be very close to a denial. As noted above, the AHCA does not require states seeking this waiver to have any alternative method of access for people facing very high premiums based on their health. The state would at least have to participate in the FIRSP (and it appears that the program operates in all states), but that mechanism only assists insurers when high-risk or high-cost people enroll, and people assessed a very high premium might not have an opportunity to enroll.
States electing this waiver would have tools to protect access for people with coverage gaps and preexisting conditions. One option that has been mentioned by supporters would be to create a high-risk pool that could offer coverage to people facing a high health surcharge. The bill would permit states to use monies from the Fund to support a high-risk pool, and the bill would appropriate an additional $8 billion for 2018 through 2023 that could be used to reduce premiums or other out-of-pocket costs for people assessed a higher premium because of the waiver to use health status as a factor. States could use their share of the $8 billion to reduce premiums for high-risk pool coverage as an alternative for people who could not afford the health status surcharge for non-group coverage, and could use their general allocation from the Fund to support the costs of the pool if the $8 billion were to be insufficient or when it ends in 2023.
For states, the tradeoff would be balancing providing reasonable access to people with coverage gaps and preexisting conditions against the goal of lowering premiums for others. A state could have the biggest impact on premiums for non-group coverage by permitting insurers to assess a health surcharge without limits and not providing an alternative means of access. This would result in many people with coverage gaps and preexisting conditions being priced out of the market, which would not only lower claims costs immediately, but would also prevent them from establishing continuous coverage and migrating to non-group plans at regular rates after their enforcement periods end. Possibly more likely is that states would take some steps to assist people subject to health rating from being effectively declined through high premiums. Options could include establishing a high-risk pool with premiums that are more affordable than the health adjusted premiums people would be assessed under the waiver, limiting the health surcharges that insurers could assess, or using a portion of their share of the $8 billion to reduce premium costs to a more affordable level. For states weighing these choices, as they improve access and affordability for people who would be subject to the health adjusted rates, they generally lessen the impact that the waiver would have on premiums overall.
Likely, the high-risk pool option would have the largest impact on non-group premiums of these options, because it would move the claims for some high-risk people outside of the non-group market, at least until the people established continuous coverage and moved to non-group plans with premiums not adjusted for their health. The bill does not establish any parameters for a high-risk pool, such as the premiums that could be charged, what the coverage and cost sharing would be, and whether there would be any limits on coverage. For example, it is not clear if a high-risk pool would need to offer essential health benefits, would be subject to provisions prohibiting dollar limits, or would be considered coverage for which people could receive a premium tax credit. States would need to establish parameters in all of these areas.
CBO estimated that about one-half of people live in states that would seek a waiver to modify the essential health benefits, use health as a rating factor, or both. About two-thirds of these people would live in states that would choose to make moderate changes to market regulations, which would result in a modest reduction in premiums. One-third of these people live in states that CBO assumed would choose to substantially modify the essential health benefits and allow health status rating in their non-group markets.14 In these states, CBO estimated that people in good health would face significantly lower premiums while people less healthy people would be unable to purchase comprehensive coverage at premiums similar to current law and might not be able to purchase coverage at all.15 Although the additional grant funds for states with waivers to use health status rating would lower premiums and out-of-pocket premiums, CBO found that the premium effects would be small because “. . . the funding would not be sufficient to substantially reduce the large increases in premiums for high-cost enrollees”16 . CBO did not produce illustrative premiums for this scenario.
Addressing funding limitations over time
A third challenge for states is that the annual appropriations to the Fund do not grow over time and end entirely after 2026, even though the underlying health care needs continue to grow. For example, the cost of health care would continue to increase over the period, while the number of uninsured would also increase. Adding to the increasing cost burden, the federal premium tax credits would grow more slowly than premium over time, shifting more costs to enrollees and reducing their impact on affordability. The appropriations for the Fund also end in 2023 (for the $8 billion) and 2026 for the rest of the Fund. At the same time, the state matching requirements for money from the Fund grow over time, from 7% in 2020 to 50% in 2026. This means that states would need to invest an increasing amount of resources on policies and programs for which federal funds may end, perhaps abruptly, in the foreseeable future. Unless the federal government would agree to commit to appropriate funds several years in advance, states might be reluctant to make budget or program commits to programs that they may be unable to maintain without significant federal assistance.
Discussion
Overall, the AHCA would present states with a number of difficult problems and choices, and with limited resources with which to address them. The bill would reduce federal contributions for Medicaid and federal payments to subsidize non-group insurance by about $1 trillion dollars, while repealing the federal tax penalty for not having health insurance would increase non-group premiums significantly above current levels. These provisions would disproportionately affect the affordability of coverage and care for lower income and older people, and would cause millions of people to become uninsured.
States would be eligible for $123 billion in grant funds to help offset these impacts, but would face difficult tradeoffs. If states use most of their grant funds to reduce premiums, as CBO has assumed, there would not be funds left to address other needs, such as helping lower income and older people facing higher premium and out-of-pocket costs and health care providers who would be serving a growing number of uninsured people. States also would have the options of reducing covered benefits or allowing insurers to increase premiums for applicants with pre-existing conditions, each of which would lower premiums but would raise out-of-pocket costs for people with health problems.
State also would need to find an increasing amount of matching state funds to be eligible for the federal grant fund, and could face uncertainty if federal funds are not appropriated in advance. States choosing not to participate (by not providing matching funds) would be left without resources to address the higher premiums and affordability issues that would arise.
Endnotes
Congressional Budget Office, cost estimate for the American Health Care Act as passed by the House of Representatives May 4, 2017 (May 24, 2017), (“CBO May 24, 2017 cost estimate”), https://www.cbo.gov/publication/52752. ↩︎
Required matching payments would be required for some states that want to participate in a partially state-funded reinsurance program that CMS would operate on their behalf. ↩︎
CBO May 24, 2017 cost estimate, pp. 13-14; Kaiser Family Foundation staff calculations. ↩︎
State age rating waivers would not appear to be necessary, however, as Section 135 of AHCA establishes new age rating limits of “5 to 1 for adults…or such other ratio for adults…as the State may provide.” ↩︎
Majority of Republicans See Medicaid As Welfare While Democrats and Independents See It As Insurance
As Congress weighs major budget cuts and structural changes to Medicaid as part of its effort to repeal and replace the Affordable Care Act (ACA), majorities of the public are wary of those changes to the program that covers medical and long-term care for millions of low-income Americans, the latest Kaiser Family Foundation tracking poll finds.
The poll gauges the public’s views on major Medicaid changes in the American Health Care Act, which narrowly passed the House May 4 but faces an uncertain future in the Senate.
The House bill would significantly reduce federal funding to states that expanded their Medicaid programs to low-income adults under the ACA. A vast majority (84%) of the public say it is important that states that received federal funds to expand Medicaid continue to receive those funds under any replacement plan.
This includes large majorities of Democrats (93%), independents (83%) and Republicans (71%). Support for continued funding for the Medicaid expansion is also popular among people living in states that have not expanded their Medicaid program.
The poll also finds that the public prefers Medicaid’s current financing structure, with the federal government matching state spending on an open ended basis, to the proposed changes in the House bill, which would limit the federal government’s contributions through per capita caps or block grants while giving states more flexibility to decide who and what to cover under the program.
When asked about this proposed change, seven in 10 (71%) say Medicaid should largely continue as it is today, while fewer (26%) say it should be changed to limit federal funding while letting states decide who and what to cover. Democrats and independents largely favor the status quo (90% and 70%, respectively) while Republicans split, with similar shares supporting the status quo (47%) and the alternative (48%).
Overall six in 10 Americans (58%) say Medicaid is either “very” or “somewhat” important for them and their family, including a majority of Democrats (64%) and independents (57%), and nearly half (46%) of Republicans.
When asked whether Medicaid is more similar to other health insurance programs or to welfare programs, more people see Medicaid as health insurance (60%) than welfare (37%). There is a significant partisan divide in these perceptions, with most Democrats and independents viewing Medicaid as health insurance and a narrow majority of Republicans viewing it as welfare.
Designed and analyzed by public opinion researchers at the Kaiser Family Foundation, the poll was conducted from May 16 – 22 among a nationally representative random digit dial telephone sample of 1,205 adults. Interviews were conducted in English and Spanish by landline (421) and cell phone (784). The margin of sampling error is plus or minus 3 percentage points for the full sample. For results based on subgroups, the margin of sampling error may be higher.