KFF designs, conducts and analyzes original public opinion and survey research on Americans’ attitudes, knowledge, and experiences with the health care system to help amplify the public’s voice in major national debates.
Poll: Public Views the ACA More Favorably Than Congress’ Plan to Replace It, Though Republicans Favor the Replacement
Majority Says the Senate Either Should Make Major Changes or Not Pass The House Bill At All, While About a Third Want the Senate to Pass It As Is or With Only Minor Changes
Public Grows More Pessimistic About How Repeal Will Affect Them Personally
Most (55%) of the public holds an unfavorable view of the Congressional plan that would repeal and replace the Affordable Care Act, and the same share (55%) want the Senate either to make major changes to the House-passed bill or not pass it all, finds the latest Kaiser Health Tracking Poll.
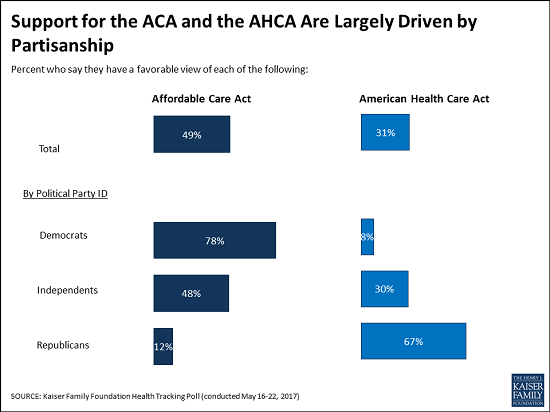
Three in 10 (31%) of the public hold favorable views of the American Health Care Act, which narrowly passed the House on May 4 and is now under consideration in the Senate. In comparison, about half (49%) of the public hold a favorable views of the Affordable Care Act.
There are large partisan divisions on these questions, with far more Republicans holding favorable views of the replacement plan (67%) than of the ACA (12%). The opposite is true for Democrats, and among independents, more also hold favorable views of the ACA (48%) than of the replacement bill (30%).
In spite of these views, a majority of the public (74%) believe it is” likely” that the president and Congress will repeal and replace the ACA. At the same time, relatively few say the Senate should adapt the American Health Care Act as passed by the House (8%) or with only minor changes (24%). Most want the Senate either to make major changes (26%) or not pass it at all (29%).
Public Growing More Pessimistic About How Repeal Would Affect Them Personally
The poll also finds the public more pessimistic about the replacement bill now than they were in December after the elections but before Congress put forward specific legislation. Nearly half (45%) of the public now says the replacement bill would result in higher health care costs for their family, compared to about a quarter (28%) who said so in December. In addition, a third now expect their ability to get and keep health insurance and the quality of their health care to get worse under the pending bill, compared to about one in five that said so in December.
Other findings include:
A majority of the public (63%) continue to say that President Trump and Republicans in Congress are responsible for any problems with the Affordable Care Act moving forward, more than twice the share who say President Obama and Democrats in Congress are responsible. Those considering Republicans responsible includes most Democrats (77%) and independents (63%), and half (49%) of Republicans.
Few (14%) believe that the House-passed bill fulfills all or most of President Trump’s promises on health care, while three quarters (76%) say it fulfills none (35%) or some (40%) of them. Among Republicans, twice as many say it fulfills none or some of the President’s promises (59%) as say it fulfills all or most of them (30%).
The poll also includes additional questions on Medicaid, which will be released separately later this week.
Designed and analyzed by public opinion researchers at the Kaiser Family Foundation, the poll was conducted from May 16 – 22 among a nationally representative random digit dial telephone sample of 1,205 adults. Interviews were conducted in English and Spanish by landline (421) and cell phone (784). The margin of sampling error is plus or minus 3 percentage points for the full sample. For results based on subgroups, the margin of sampling error may be higher.
With Congress currently discussing the American Health Care Act (AHCA), a plan that would repeal and replace the 2010 health care law, this month’s Kaiser Health Tracking Poll finds that more Americans have an unfavorable view of the plan than a favorable one (55 percent vs. 31 percent, respectively). The share with favorable views of the AHCA is about 20 percentage points lower than the share with favorable views (49 percent) of the 2010 Affordable Care Act (ACA). The majority of Republicans (67 percent) have a favorable view of the AHCA.
This month’s survey finds the public has increasingly negative views of how their health care will be affected by proposed changes. In December 2016, after the presidential election but before the release of the Republican plan, less than one-third of the public thought their health care would get worse if the 2010 health care law was repealed. This month’s survey, fielded after House Republicans passed the AHCA, finds larger shares say the cost of health care for them and their family (45 percent), their ability to get and keep health insurance (34 percent), and the quality of their own health care will get worse if Congress passes the AHCA (34 percent).
About one in ten (8 percent) think the Senate should pass the AHCA as is, without making any changes to the plan passed by the House. Similar shares – about one-fourth of the public – think the Senate should make either major changes to the legislation (26 percent) or minor changes to it (24 percent), while about three in ten (29 percent) say they do not think the Senate should pass this bill.
The American Health Care Act
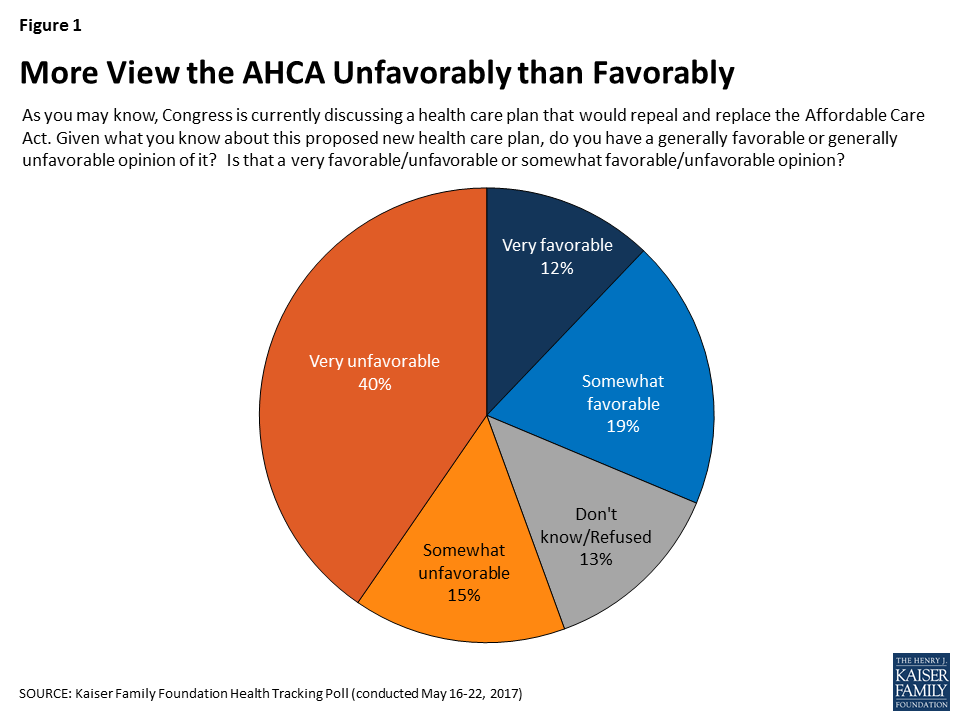
On May 4, 2017, the U.S. House of Representatives passed the American Health Care Act (AHCA), the House Republicans’ plan to repeal and replace the Affordable Care Act (ACA).1 With the Senate currently debating the plan and discussing their own approach, the most recent Kaiser Health Tracking Poll finds more Americans have an unfavorable view of the AHCA than a favorable one (55 percent vs. 31 percent, respectively). There is also a considerable enthusiasm gap with a larger share saying that they have a “very unfavorable” view (40 percent) than saying they have a “very favorable” view (12 percent).
Figure 1: More View the AHCA Unfavorably than Favorably
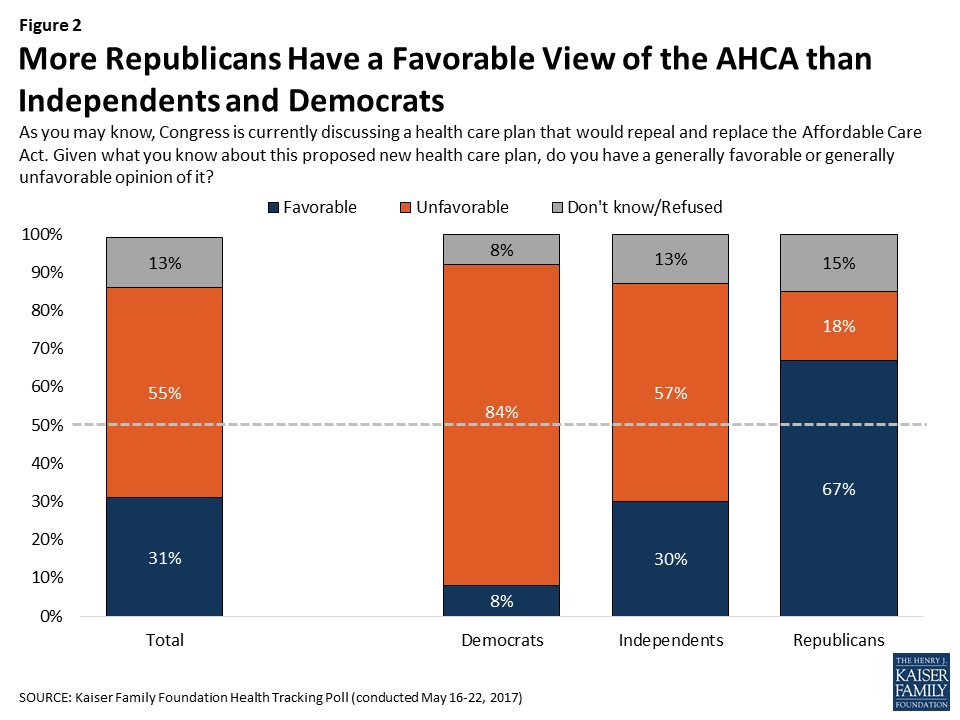
Majority of Republicans Hold A Favorable View of the AHCA
The AHCA has solid support among the Republican base. Two-thirds of Republicans say they have a favorable view of the plan including three in ten (29 percent) who say they have a “very favorable” view.
Figure 2: More Republicans Have a Favorable View of the AHCA than Independents and Democrats
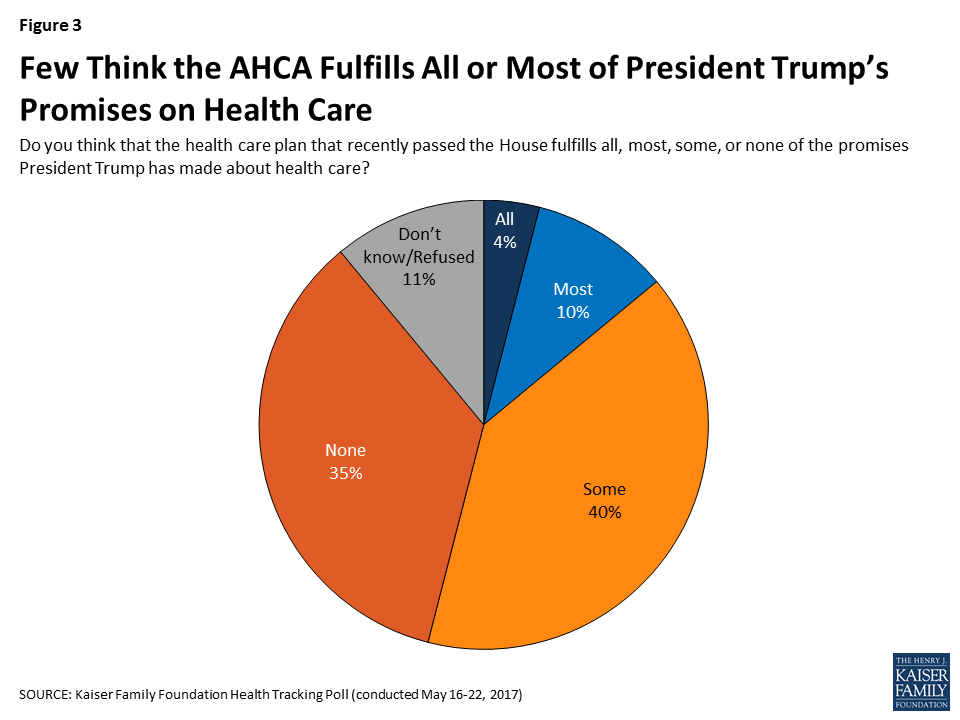
Few See AHCA As Fulfilling President Trump’s Promises About Health Care
Three-fourths (76 percent) of the public thinks the health care plan recently passed by the House does not fulfill most of the promises President Trump has made about health care while 14 percent say it fulfills most or all of his promises.
Figure 3: Few Think the AHCA Fulfills All or Most of President Trump’s Promises on Health Care
This viewpoint is shared regardless of party identification with majorities of Democrats (86 percent), independents (79 percent), and Republicans (59 percent) saying the AHCA fulfills some or none of the promises President Trump has made about health care.
Table 1: Majorities of Democrats, Independents, and RepublicansDo Not Think the AHCA Fulfills Most of President Trump’s Health Care Promises
Do you think that the health care plan that recently passed the House fulfills all, most, some, or none of the promises President Trump has made about health care?
Total
Democrats
Independents
Republicans
All/Most (NET)
14%
8%
11%
30%
All
4
3
4
6
Most
10
4
7
24
Some/None (NET)
76
86
79
59
Some
40
27
46
51
None
35
59
33
8
Don’t know/Refused
11
7
10
12
More Americans View The ACA Favorably Than The AHCA
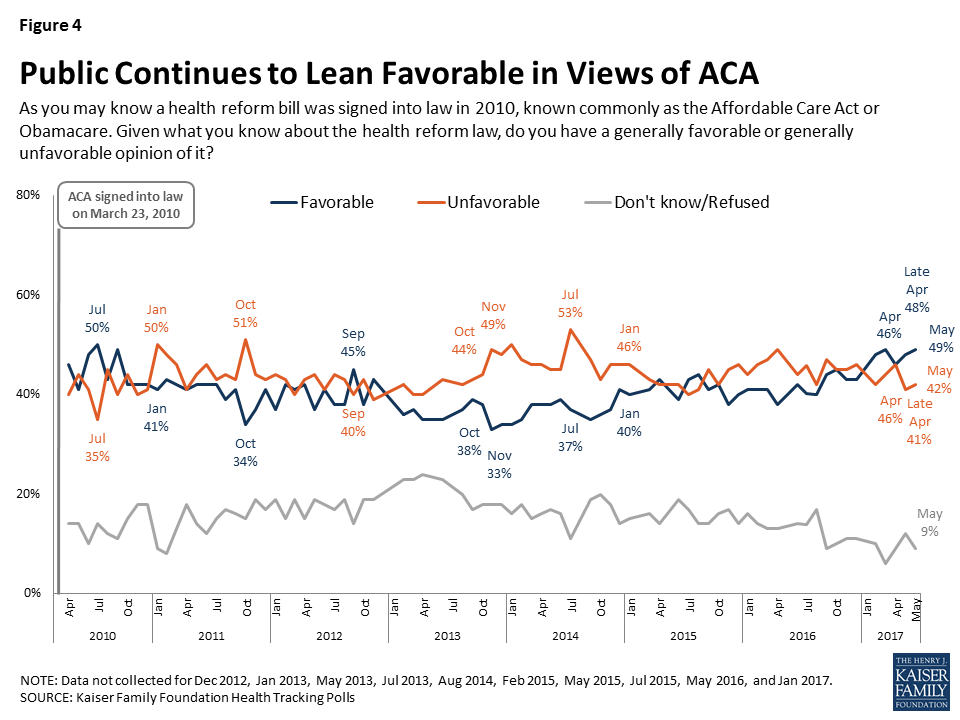
The Kaiser Family Foundation has been tracking public opinion on the ACA since its passage in 2010. This month’s survey continues to find the public leans more favorable than unfavorable in their views of the 2010 health care law, with 49 percent expressing a favorable view of the ACA compared to 42 perecent expressing an unfavorable view.
Figure 4: Public Continues to Lean Favorable in Views of ACA
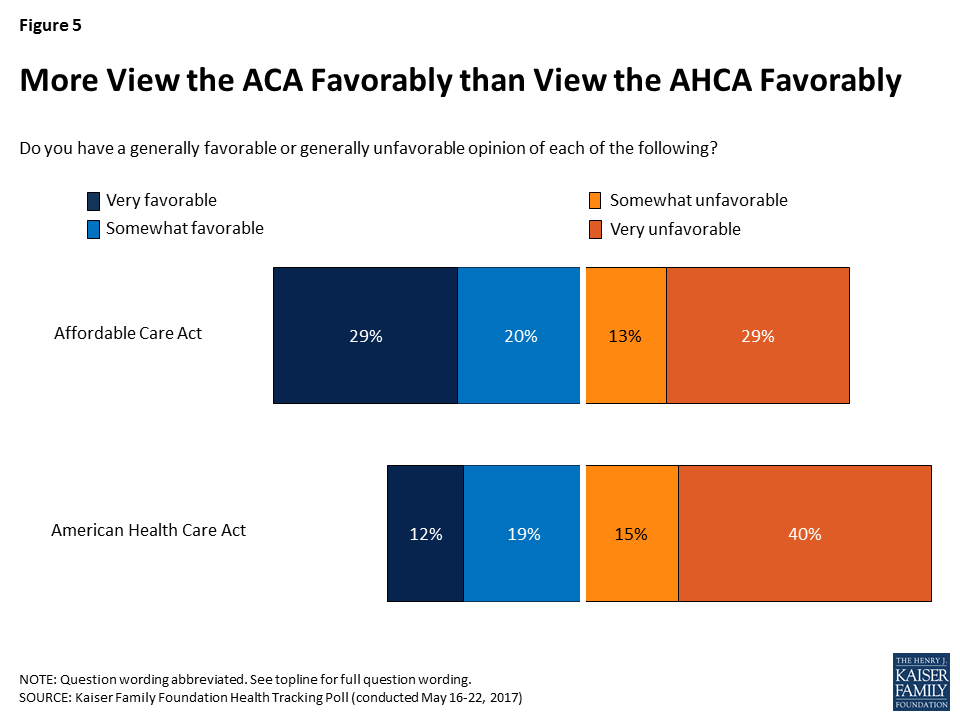
In fact, more of the public is favorable in their overall views of the ACA than in their views of the Republican plan to replace the 2010 health care law. About half of Americans have a favorable view of the ACA compared to about three in ten who have a favorable view of the new Republican plan.
Figure 5: More View the ACA Favorably than View the AHCA Favorably
Partisanship is the main driver behind support for either the ACA or the AHCA, with a majority of Republicans viewing the AHCA favorably (67 percent), while a majority of Democrats view the ACA favorably (78 percent). More independents view the ACA favorably (48 percent) than view the AHCA favorably (30 percent).
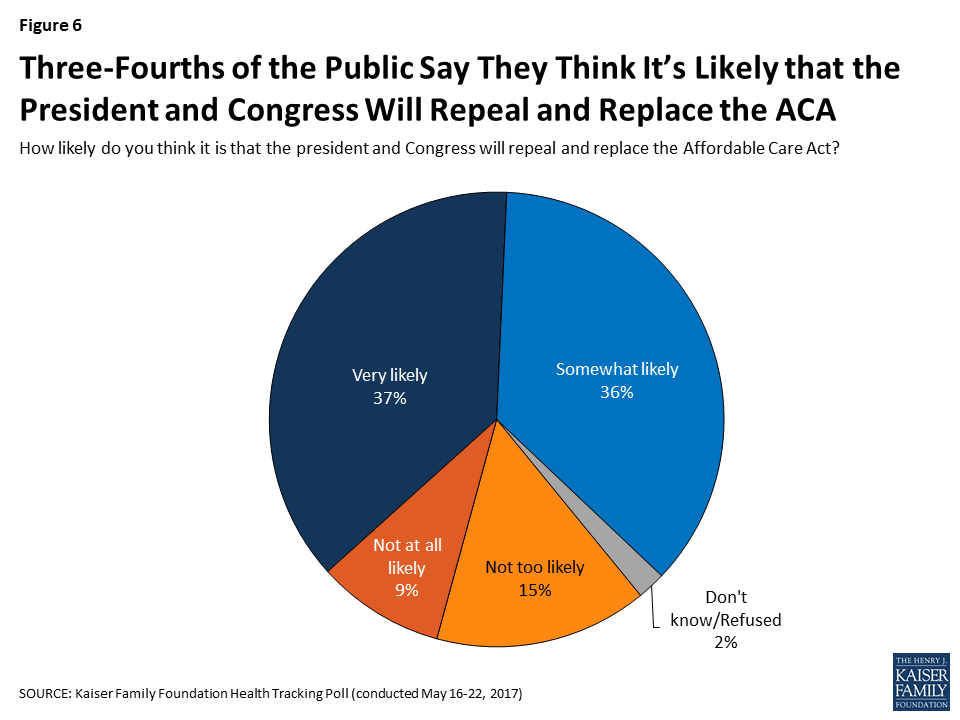
Despite the lack of support for the House Republican plan, a majority of the public (74 percent) say they think it is either “very likely” (37 percent) or “somewhat likely” (36 percent) that the president and Congress will repeal and replace the ACA. About one-fourth of the public say it is either “not too likely” (15 percent) or “not likely at all” (9 percent).
Figure 6: Three-Fourths of the Public Say They Think It’s Likely that the President and Congress Will Repeal and Replace the ACA
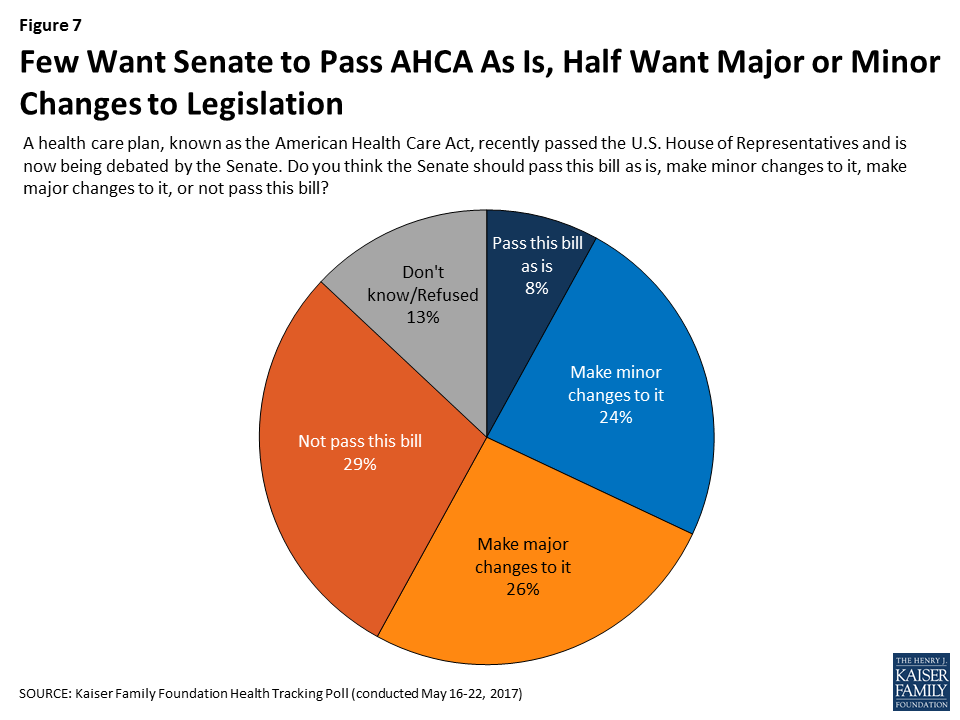
Most Americans Want Changes to the AHCA Before Senate Passes the Bill
About one in ten (8 percent) think the Senate should pass the AHCA as is, without making any changes to the plan passed by the House. Similar shares – about one-fourth of the public – think the Senate should make either major changes to the legislation (26 percent) or minor changes to it (24 percent), while about three in ten say they do not think the Senate should pass this bill.
Figure 7: Few Want Senate to Pass AHCA As Is, Half Want Major or Minor Changes to Legislation
Attitudes toward what the Senate should do when it comes to the AHCA are largely driven by partisanship with most Republicans (60 percent) saying they think it should pass as is (15 percent) or with minor changes (45 percent) while half of Democrats (51 percent) say the Senate should not pass this bill. Independents are more divided but one-third (34 percent) say the Senate should make major changes to the bill.
Table 2: Most Republicans Want the Senate to Pass Bill As Is or Make Minor Changes to It, While Democrats Do Not Want the Senate to Pass It
A health care plan, known as the American Health Care Act, recently passed the U.S. House of Representatives and is now being debated by the Senate. Do you think the Senate should pass this bill as is, make minor changes to it, make major changes to it, or not pass this bill?
Total
Democrats
Independents
Republicans
Pass this bill as is
8%
6%
5%
15%
Make minor changes to it
24
15
22
45
Make major changes to it
26
22
34
17
Not pass this bill
29
51
25
5
Don’t know/Refused
13
7
14
17
Attitudes Towards AHCA Provisions
The AHCA – like other health care plans – includes complex policies that the public may not fully understand or pay attention to. In an effort to examine general attitudes towards several of the more well-known provisions, we ask respondents whether after hearing about the specific provision they are “more likely” or “less likely” to support the plan. Much like overall attitudes towards the AHCA, various provisions of the law asked about in this survey do not garner large levels of support from the public. When asked whether individual elements of the Republican replacement plan would make them “more likely” or “less likely” to support the plan, none of the elements receive a majority of the public saying it would make them “more likely” to support it. The only provision that has a larger share of the public saying it makes them “more likely” than say it makes them “less likely” to support the law is allowing states to implement a Medicaid work requirement (42 percent compared to 28 percent).
There are several provisions currently included in the plan that a majority of the public say makes them “less likely” to support the legislation. These include allowing states to decide if health insurance companies can charge sick people more than healthy people if they haven’t had continuous coverage (65 percent), eliminating the individual mandate and instead allowing insurance companies to charge people 30% higher premiums for a year if they haven’t had continuous coverage (62 percent), allowing states to eliminate the essential health benefit requirement (60 percent), and making changes that would generally decrease what younger people pay for insurance and increase what older people pay (58 percent).
Table 3: Individual Elements of AHCA Affect Likelihood of Support for Plan
I’m going to read you several specific elements included in the health care plan that passed the House. Please tell me if each makes you more or less likely to support the plan, or does not make much difference.
More likely to support
Less likely to support
Does not make much difference
Allows states to require adults without disabilities to be working or looking for work in order to get health insurance through Medicaid
42%
28%
27%
Provides federal funding for states to cover people with pre-existing conditions through separate high-risk pools
36
32
31
Cuts federal funding that was included in the 2010 health care law for states that expanded Medicaid to cover more lower-income people
23
43
34
Changes Medicaid so that instead of matching state spending, the federal government reduces what it pays states and gives states more flexibility to decide who and what services to cover
23
42
32
Stops federal payments to Planned Parenthood clinics for health care services provided to people on Medicaid for one year
22
48
30
Allows states to let health insurance companies cut back on the benefits they cover so they could sell cheaper plans that do not cover benefits like hospitalization, prescription drugs, maternity care, and mental health services
20
60
20
Eliminates the taxes and tax increases on higher-income people imposed by the Affordable Care Act
18
49
30
Decreases the financial help available to lower-income people who buy their own insurance and increases the financial help available to middle- and upper-income people
15
51
32
Makes changes that would generally decrease what younger people pay for insurance and increase what older people pay
14
58
28
Allows states to decide if health insurance companies can charge sick people more than healthy people if they haven’t had continuous coverage
12
65
22
Eliminates the requirement for nearly all Americans to have health insurance but allows insurance companies to charge people 30% higher premiums for a year if they haven’t had continuous coverage
12
62
24
NOTE: Items asked of half samples. Don’t know/Refused responses not shown.
Republican Support for Some Aspects of the AHCA
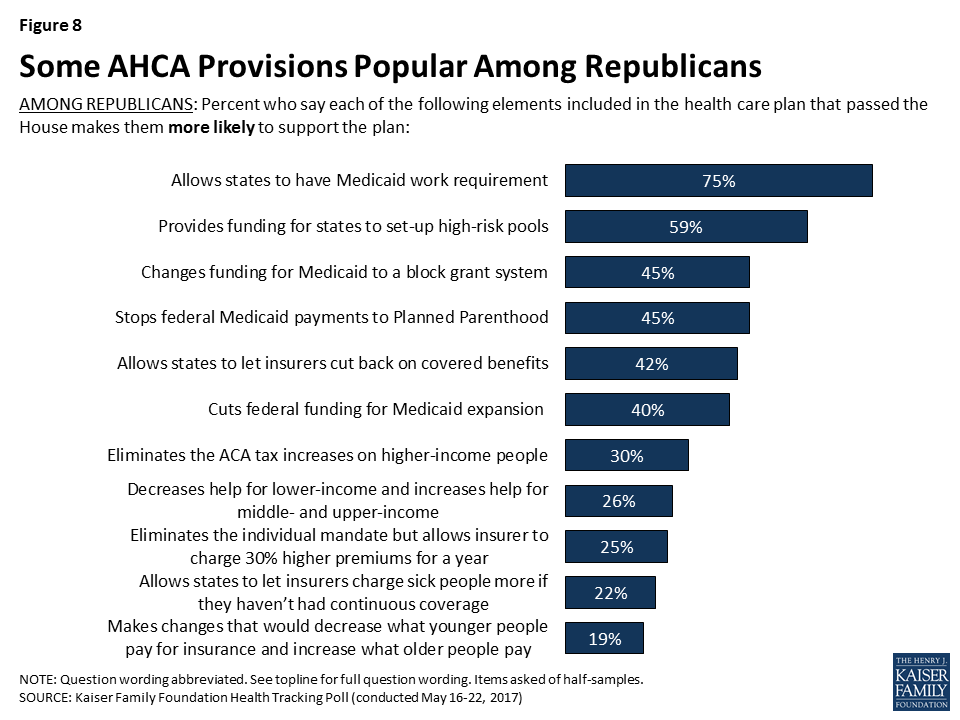
There is some support for aspects of the AHCA among Republicans. For example, a majority of Republicans say that the Medicaid work requirement (75 percent) and federal funding for states to set up high-risk pools (59 percent) makes them more likely to support the plan. In addition, about four in ten Republicans say the same about the provisions which stop federal Medicaid payments to Planned Parenthood (45 percent), change Medicaid funding to a per capita cap or block grant system (45 percent), allow states to change the essential health benefits (42 percent), and end the funding for Medicaid expansion (40 percent).
Figure 8: Some AHCA Provisions Popular Among Republicans
Perceived Effects of the AHCA
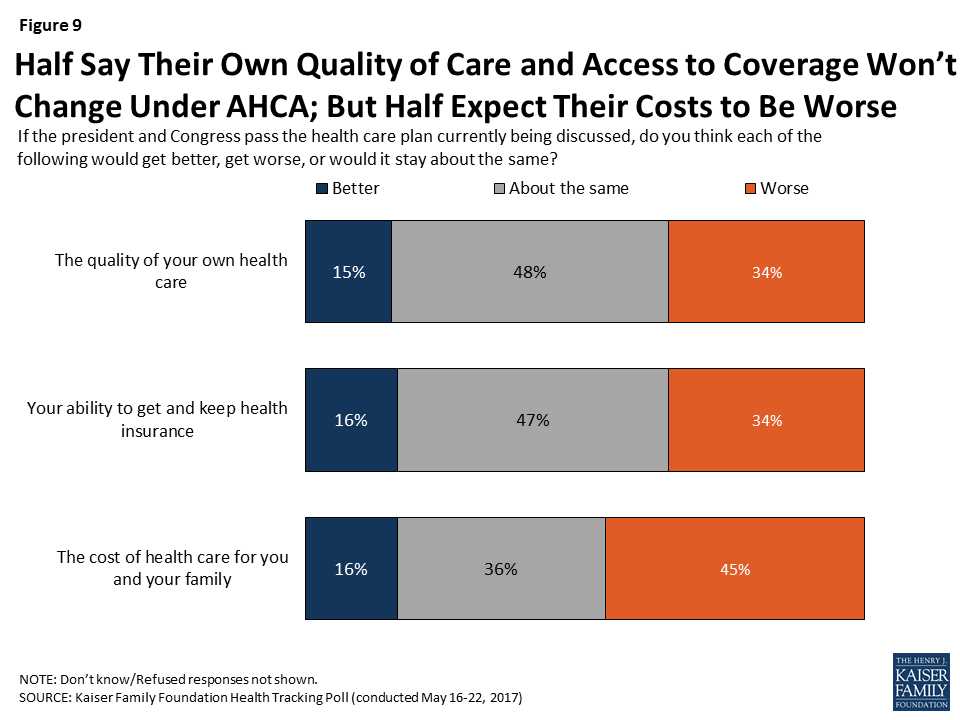
Overall, about half of Americans say the quality of their own health care (48 percent) and their own ability to get and keep health insurance (47 percent) will stay about the same if the president and Congress pass the health care plan currently being discussed. When it comes to the cost of health care for them and their family, almost half say it will get worse (45 percent) while about one-third say it will stay about the same (36 percent) and 16 percent say it will get better.
Figure 9: Half Say Their Own Quality of Care and Access to Coverage Won’t Change Under AHCA; But Half Expect Their Costs to Be Worse
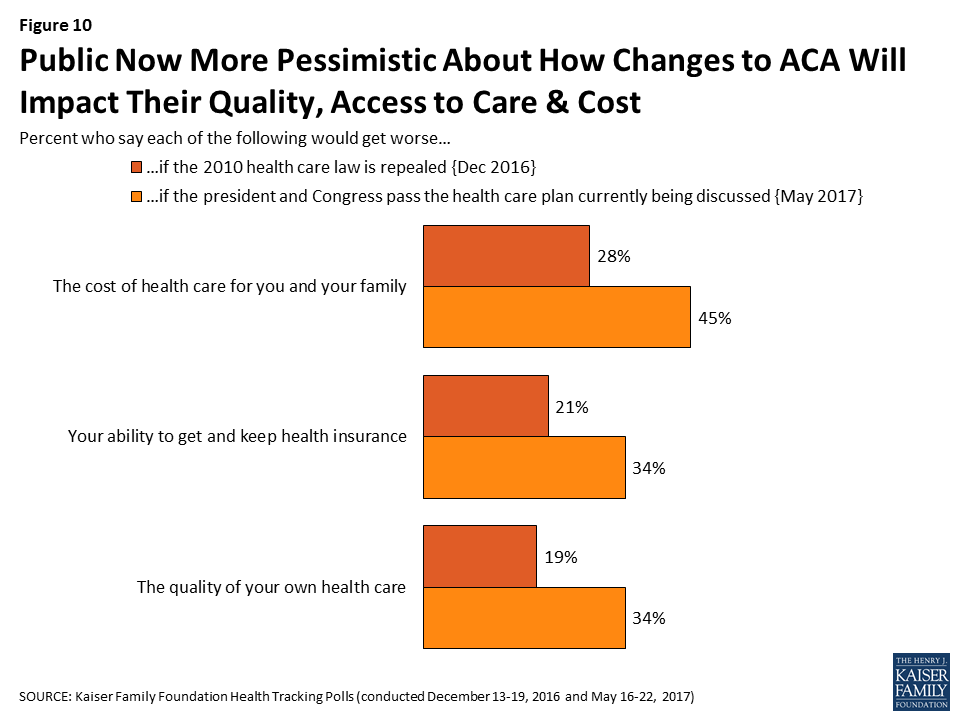
Immediately following the 2016 presidential election and prior to the release of the Republican plan, most Americans thought that their health care would stay about the same if the 2010 health care law was repealed. Yet, in this month’s survey which was fielded after House Republicans passed the AHCA, larger shares say the cost of health care for them and their family, their ability to get and keep health insurance, and the quality of their own health care will get worse if Congress passes the AHCA.
Figure 10: Public Now More Pessimistic About How Changes to ACA Will Impact Their Quality, Access to Care & Cost
Medicaid
KEY FINDINGS:
The American Health Care Act (AHCA) includes substantial changes to Medicaid – the program that provides coverage for medical care and long-term care services to low-income people. Overall, six in ten Americans (58 percent) say Medicaid is either “very” or “somewhat” important for them and their family – including a majority of Democrats (64 percent) and independents (57 percent) and nearly half (46 percent) of Republicans.
The AHCA reduces federal funding for Medicaid expansion in states. The vast majority of the public – including a majority of Democrats (93 percent), independents (83 percent), and Republicans (71 percent) – say it is important that states that received federal funds to expand Medicaid continue to receive those funds.
Currently, Medicaid is jointly financed by federal and state governments, with each state deciding how to structure benefits, eligibility, and care delivery within guidelines set by the federal government. Seven in ten (71 percent) Americans prefer keeping Medicaid largely as it is today while fewer (26 percent) support changing Medicaid to allow states more flexibility in determining which groups of people and what services are covered under the program.
Proposed Changes to Medicaid
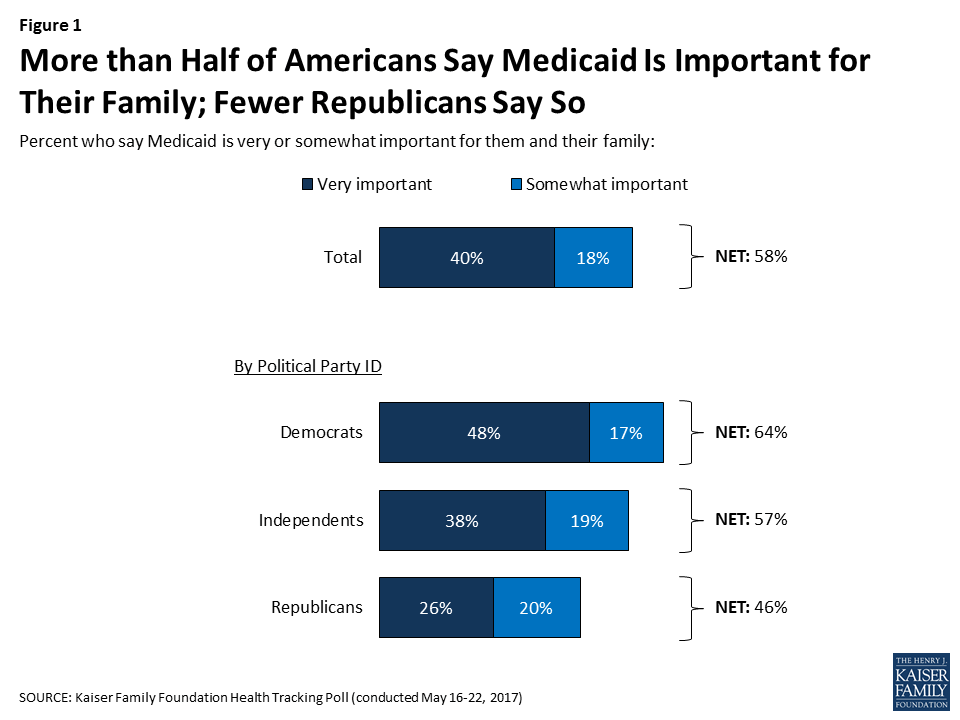
This month’s Kaiser Health Tracking Poll examines attitudes towards the AHCA’s changes to Medicaid2 – the program that provides coverage for medical care and long-term care services to low-income people. Overall, six in ten Americans (58 percent) say Medicaid is either “very” or “somewhat” important for them and their family – including a majority of Democrats (64 percent) and independents (57 percent) and 46 percent of Republicans.
Figure 1: More than Half of Americans Say Medicaid Is Important for Their Family; Fewer Republicans Say So
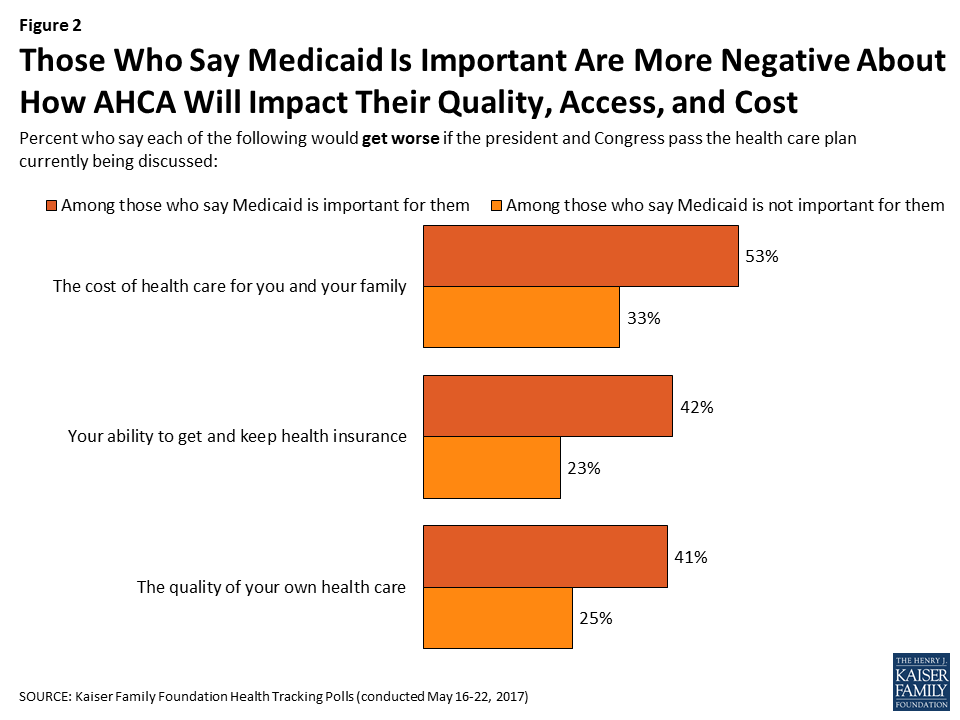
Those who say Medicaid is either “very” or “somewhat” important for them and their family are more pessimistic about how their own health care will be affected if the president and Congress pass the health care plan currently being discussed. About half (53 percent) of those who say Medicaid is important for them and their family say their cost of health care will get worse compared to one-third of those who say Medicaid is not important for them. The shares who say their ability to get and keep health insurance and the overall quality of their own health care would get worse are also larger among those who say Medicaid is important compared to those who say it is not important for them (42 percent vs. 23 percent, 41 percent vs. 25 percent, respectively).
Figure 2: Those Who Say Medicaid Is Important Are More Negative About How AHCA Will Impact Their Quality, Access, and Cost
Public Supports Continued Funding for Medicaid Expansion
The 2010 Affordable Care Act expanded Medicaid coverage to over 11 million low-income, uninsured adults.3 The AHCA reduces federal funding for Medicaid expansion by 2020. The vast majority of the public – including a majority of Democrats, independents, and Republicans – say it is important that states that received federal funds to expand Medicaid continue to receive those funds.
Table 1: Majorities of Democrats, Independents, and Republicans Say Continued Federal Funding for Medicaid Expansion Is Important
If lawmakers decide to repeal and replace the 2010 health care law, how important is it to you that a replacement plan makes sure states that received federal funds to expand Medicaid continue to receive those funds?
Total
Democrats
Independents
Republicans
Important (NET)
84%
93%
83%
71%
Very important
58
78
56
35
Somewhat important
26
16
27
36
Not important (NET)
14
6
15
28
Not too important
7
3
7
15
Not at all important
7
3
8
13
Don’t know/Refused
1
1
2
1
Support for continued funding for Medicaid expansion is even popular among individuals living in states that have not expanded their Medicaid program.
Figure 3: Large Majorities Say Continued Funding for Medicaid Expansion Is Important
Changes to Federal Funding for Medicaid
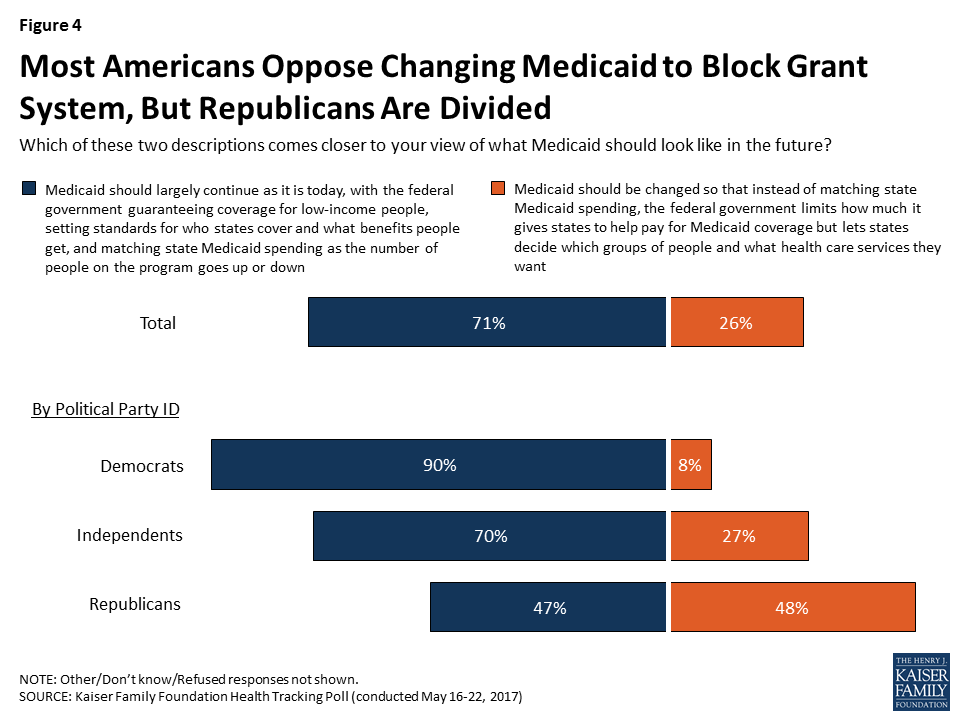
Currently, Medicaid is jointly financed by federal and state governments, with each state deciding how to structure benefits, eligibility, and care delivery within guidelines set by the federal government. The federal government matches state spending on an open-ended basis but the AHCA proposes changing this system so that instead of matching state Medicaid spending, the federal government would limit the amount it gives states to help pay for Medicaid coverage but could allow states more flexibility in determining which groups of people and what services are covered under the program.
When asked about a change to the financing structure, 71 percent say they think Medicaid should largely continue as it is today with the federal government guaranteeing coverage, setting standards and benefits, and matching state spending while fewer (26 percent) say Medicaid should be changed. Democrats and independents largely favor the status quo (90 percent and 70 percent, respectively) while Republicans are more divided, with a similar share supporting the status quo (47 percent) as do the proposal to change the funding structure (48 percent).
Figure 4: Most Americans Oppose Changing Medicaid to Block Grant System, But Republicans Are Divided
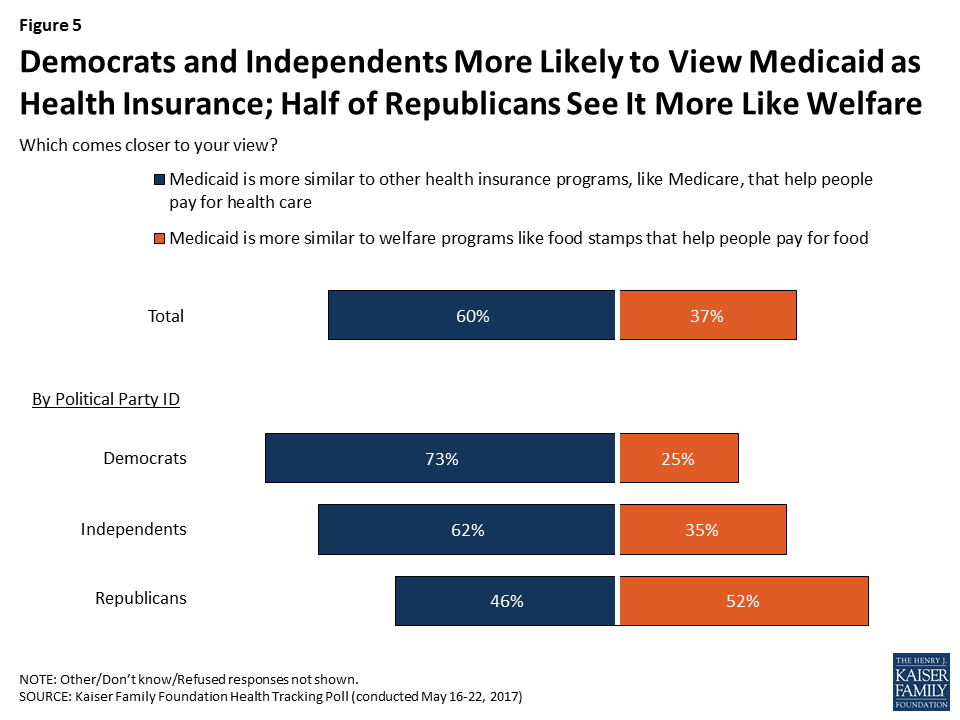
Partisanship Affects Basic Perceptions of Medicaid
Partisanship contributes to the public’s general perceptions of the Medicaid program. When asked whether Medicaid is more similar to other health insurance programs or to welfare programs, more Americans view Medicaid like other health insurance programs (60 percent) that help people pay for health care than view it as a welfare program (37 percent). Yet, these perceptions are largely driven by partisanship with Democrats and independents more likely to view Medicaid as a health insurance program and Republicans more likely to view it as a welfare program.
Figure 5: Democrats and Independents More Likely to View Medicaid as Health Insurance; Half of Republicans See It More Like Welfare
Methodology
This Kaiser Health Tracking Poll was designed and analyzed by public opinion researchers at the Kaiser Family Foundation (KFF). The survey was conducted May 16-22, 2017, among a nationally representative random digit dial telephone sample of 1,205 adults ages 18 and older, living in the United States, including Alaska and Hawaii (note: persons without a telephone could not be included in the random selection process). Computer-assisted telephone interviews conducted by landline (421) and cell phone (784, including 470 who had no landline telephone) were carried out in English and Spanish by Princeton Data Source under the direction of Princeton Survey Research Associates International (PSRAI). Both the random digit dial landline and cell phone samples were provided by Survey Sampling International, LLC. For the landline sample, respondents were selected by asking for the youngest adult male or female currently at home based on a random rotation. If no one of that gender was available, interviewers asked to speak with the youngest adult of the opposite gender. For the cell phone sample, interviews were conducted with the adult who answered the phone. KFF paid for all costs associated with the survey.
The combined landline and cell phone sample was weighted to balance the sample demographics to match estimates for the national population using data from the Census Bureau’s 2015 American Community Survey (ACS) on sex, age, education, race, Hispanic origin, and region along with data from the 2010 Census on population density. The sample was also weighted to match current patterns of telephone use using data from the January-June 2016 National Health Interview Survey. The weight takes into account the fact that respondents with both a landline and cell phone have a higher probability of selection in the combined sample and adjusts for the household size for the landline sample. All statistical tests of significance account for the effect of weighting.
The margin of sampling error including the design effect for the full sample is plus or minus 3 percentage points. Numbers of respondents and margins of sampling error for key subgroups are shown in the table below. For results based on other subgroups, the margin of sampling error may be higher. Sample sizes and margins of sampling error for other subgroups are available by request. Note that sampling error is only one of many potential sources of error in this or any other public opinion poll. Kaiser Family Foundation public opinion and survey research is a charter member of the Transparency Initiative of the American Association for Public Opinion Research.
Repealing and replacing the Affordable Care Act (ACA) is a top priority of the Trump Administration and the Republican leadership, and is a prominent issue on the agenda of the 115th Congress. The ACA includes many provisions affecting the Medicare program, and lawmakers have taken different approaches to the ACA’s Medicare provisions. Some proposals would fully repeal the ACA, including all Medicare provisions. Other proposals, including the “American Health Care Act of 2017” (AHCA) as passed by the House of Representatives on May 4, 2017, would repeal some but not all Medicare provisions in the ACA.
This brief provides a side-by-side comparison of the Medicare-related provisions in seven bills and proposals that would repeal the ACA, excluding proposals that would not directly affect Medicare. Two of these proposals would repeal the ACA in its entirety, including all Medicare provisions. Three of the proposals, including the AHCA, would repeal some but not all Medicare provisions in the ACA, one proposal would retain all Medicare provisions in the ACA, and one does not specify. The first part of the side-by-side describes the Medicare provisions in the ACA that would be retained or repealed in each bill or proposal. The second part of the side-by-side describes the additional ways in which the bills and proposals would change Medicare, such as structural modifications to the Medicare program (e.g., premium support).
The bills and proposals in this comparison include:
“American Health Care Act of 2017,” H.R. 1628, introduced on March 20, 2017 by Rep. Black (R-TN) as chairperson of the House Budget Committee and passed by the House on May 4, 2017.
“American Health Care Reform Act of 2017,” H.R. 277, introduced by Rep. Roe (R-TN), on behalf of the Republican Study Committee, in January 2017.
“A Better Way,” released by Speaker Ryan (R-WI) in June 2016.
“World’s Greatest Healthcare Plan Act of 2016,” H.R. 5284 and S. 2985, introduced by Rep. Sessions (R-TX) and Sen. Cassidy (R-LA) in May 2016.
“A Balanced Budget for a Stronger America,” FY2017 Budget Resolution, released by the House Budget Committee, chaired by former Rep. Price (R-GA) (now HHS Secretary), in March 2016.
“Restoring Americans’ Healthcare Freedom Reconciliation Act of 2015,” H.R. 3762, introduced by former Rep. Price (R-GA) (now HHS Secretary), passed by the House and Senate, and vetoed by the President in February 2016.
“Empowering Patients First Act of 2015,” H.R. 2300, introduced by former Rep. Price (R-GA) (now HHS Secretary) in May 2015.
Each of these bills and proposals make changes to the Medicare program that could have important implications for Medicare beneficiaries, the federal budget, health care providers, or private plans. This brief focuses on the key provisions in each of these bills and proposals that would directly affect Medicare, but is not a comprehensive summary of these bills and proposals.
Table
Comparison of Medicare Provisions in Recent Bills and Proposals to Repeal and Replace the Affordable Care Act (ACA)
“American Health Care Act of 2017,” as passed by the House of Representatives on May 4, 2017
Rep. Roe:”American Health Care Reform Act of 2017″
Speaker Ryan:”A Better Way”(2016)
Rep. Sessions and Sen. Cassidy:”World’s Greatest Healthcare Plan Act of 2016″
House Budget Committee:”A Balanced Budget for a Stronger America”(2016)
Rep. Price:”Restoring Americans’ Healthcare Freedom Reconciliation Act of 2015″
Rep. Price:”Empowering Patients First Act of 2015″
Bill Number
H.R. 1628
H.R. 277
Not applicable
H.R. 5284 / S. 2985
Not applicable
H.R. 3762
H.R. 2300
Medicare-Related Provisions in the ACA
General treatment of Medicare provisions in the ACA
Would repeal some ACA Medicare provisions.
Would repeal all ACA Medicare provisions.
Would repeal some ACA Medicare provisions.
No change to ACA Medicare provisions.
Would repeal all of “Obamacare”; unspecified whether Medicare provisions would be repealed.
Would repeal some ACA Medicare provisions.
Would repeal all ACA Medicare provisions.
Reductions in Medicare Payments to Providers and Plans in the ACA
Hospitals and other health care providers: Reduced payments to providers by lowering market basket updates and productivity adjustments and other changes
No change.
Would repeal.
Would repeal the changes to the hospital wage index system. No other changes specified.
No change.
Unspecified.
No change.
Would repeal.
Disproportionate Share Hospital (DSH) payments: Reduced DSH payments to hospitals for uncompensated care
Would repeal DSH cuts for FY2020 – FY2025; non-expansion states exempt from DSH cuts for FY2018 – FY2019.
Would repeal.
Would repeal the FY2018 & FY2019 cuts in Medicare DSH, and create a national pool of uncompensated care funds for DSH hospitals beginning in FY2021.
No change.
Unspecified.
No change.
Would repeal.
Medicare Advantage: Reduced federal payments to plans and other provisions
No change.
Would repeal.
Would retain ACA reductions in payments to plans.Would repeal the benchmark cap that prevents some plans from receiving full bonus amounts.Would freeze the HHS Secretary’s authority to adjust plan payments for “coding intensity.”
No change.
Unspecified.
No change.
Would repeal.
Other Medicare-Related Provisions in the ACA
Delivery system reforms: Established “Innovation Center” (CMMI), new patient care and payment models (such as ACOs), and penalties for hospital readmissions and hospital-acquired conditions
No change.
Would repeal.
Would repeal CMMI, beginning in 2020.
No change.
Unspecified.
No change.
Would repeal.
Independent Payment Advisory Board (IPAB): Authorized creation of the Board
No change.
Would repeal.
Would repeal.
No change.
Would repeal.
No change.
Would repeal.
Physician-owned hospitals: Established a moratorium on physician-owned hospitals
No change.
Would repeal.
Would repeal.
No change.
Unspecified.
No change.
Would repeal.
Part D: Closed the coverage gap (by 2020)
No change.
Would repeal.
No change.
No change.
Unspecified.
No change.
Would repeal.
Preventive benefits: Eliminates cost-sharing for most preventive services
No change.
Would repeal.
Unspecified; would charge 20% cost-sharing for all covered services under a restructured benefit redesign (see entry below).
No change.
Unspecified.
No change.
Would repeal.
Medicare Premiums and Related Revenue Provisions in the ACA
Income-related premiums: Added income-related Part D premiums and modified income-related Part B premiums
No change.
Would repeal.
No change.
No change.
Unspecified whether provision would be repealed as part of full “Obamacare” repeal.Would require seniors with annual incomes over $1 million to fully cover cost of Part B & D premiums.
No change.
Would repeal.
Fee on manufacturers and importers of branded prescription drugs: Imposed new fee
Would repeal, beginning after December 31, 2016.
Would repeal.
Would repeal.
No change.
Unspecified.
Would repeal.
Would repeal.
Fees on health insurers: Imposed new fees on insurers, including Medicare Advantage and Part D plans
Would repeal.
Would repeal.
Would repeal.
No change.
Unspecified.
Would repeal.
Would repeal.
Part A payroll tax: Imposed Part A payroll tax increase on high-earners
Would repeal, beginning after December 31, 2022.
Would repeal.
Would repeal.
No change.
Unspecified.
Would repeal.
Would repeal.
Tax deduction for retiree drug subsidy: Eliminated employer tax deduction of retiree drug subsidy amount
Would repeal, beginning after December 31, 2016.
Would repeal.
Would repeal.
No change.
Unspecified.
Would repeal.
Would repeal.
Non-ACA Medicare-Related Provisions
Structural Changes to Medicare
Premium support: Transform Medicare into a premium support system
Not included.
Not included.
Would implement a premium support system that would include traditional Medicare and private plans for new beneficiaries beginning in 2024, with support payments adjusted for health status and income; no plan could deny coverage to a beneficiary.Would require MedPAC to develop a prototype competitive bidding system by June 2021 that would adjust beneficiaries’ support payments for plans’ historical bids and performance on quality measures.
Not included.
Would implement a premium support system that would include traditional Medicare and private plans for new beneficiaries, beginning in 2024. Plans would be required to provide the same benefits and services of traditional Medicare, and no plan could deny coverage to a beneficiary.
Not included.
Not included.
Redesign Parts A and B benefits: Change Medicare’s benefits and cost-sharing
Not included.
Not included
Would combine Parts A & B with a single deductible, 20% cost-sharing on all covered services, and annual limit on out-of-pocket expenses, beginning in FY2020.
Not included
Would combine Parts A & B with a single deductible and annual limit on out-of-pocket expenses, beginning in 2024.
Not included
Not included
Raise the age of Medicare eligibility
Not included.
Not included.
Would increase the age of Medicare eligibility (65) to correspond with that of Social Security (67), beginning in FY2020.
Not included.
Not included.
Not included.
Not included.
Medigap and other supplemental coverage: Limit supplemental coverage
Not included.
Not included
Would restrict Medigap plans from providing first-dollar coverage, beginning in FY2020.
Not included.
Would reform supplemental insurance; details not specified.
Not included.
Not included.
Changes Pertaining to Low-Income Beneficiaries (People Dually Eligible for Medicare and Medicaid)
Medicaid block grant for dual eligibles and other Medicaid beneficiaries
Would provide a per capita allotment beginning in FY2020. Would provide states the choice between a per capita allotment or a block grant for Medicaid for certain populations for 10 fiscal years, beginning in FY2020 (block grant option not allowed for elderly or blind/disabled population). In 2021 and beyond, per capita amounts would increase by an inflationary factor, which would be medical CPI plus 1 percentage point for the elderly and blind-disabled groups, and medical CPI for other populations.
Not included.
Would provide states the choice between a per capita allotment or a block grant for Medicaid. States that selected block grants would be required to provide “required services” to dual eligibles. Per capita allotments would begin in 2019.
Would provide a per capita allotment for Medicaid. Would not exempt Medicaid-covered services provided to dual eligibles, such as nursing home care. Would exempt Medicaid cost-sharing for qualified Medicare beneficiaries (QMB) and Medicaid administrative costs for determining Part D Low-Income Subsidy eligibility.
Would implement “State Flexibility Funds”; details not specified.
Not included.
Not included.
Medicare Savings Programs (MSPs)
Not included.
Not included.
Would combine all MSPs into one program and require states to use one (unspecified) asset test for beneficiary qualification, beginning in FY2020.
Not included.
Not included.
Not included.
Not included.
Changes to Provider Payments
Physician private contracting: Ease constraints on physicians to enter into contracts with beneficiaries
Not included.
Not included.
Would create a “personalized care demonstration” that would allow physicians to enter into private contracts with beneficiaries and provide items/services outside of Medicare.
Not included.
Not included.
Not included.
Would allow physicians to enter into contracts with beneficiaries on a patient-by-patient basis and charge prices that are different from Medicare’s physician fee schedule. States would be prohibited from limiting the amount a physician could charge. Would allow patients to seek some reimbursement from Medicare for services received under private contract.
Physician self-referrals
Not included.
Not included.
Not included.
Would allow HHS Secretary to waive the ban on physician self-referrals if the Secretary determines it would increase competition, reduce costs, and increase the quality of health care.
Not included.
Not included.
Not included.
Out-of-network emergency care
Not included.
Not included.
Not included.
Would limit the amount that could be charged to patients, including Medicare beneficiaries, for out-of-network emergency care.
Not included.
Not included.
Not included.
Other Provisions
Health Savings Accounts (HSAs) for Medicare beneficiaries
Would allow persons over age 55 to make catch-up contribution of up to $1,000.
Would allow beneficiaries 65 and older who are only enrolled in Part A to enroll in an HSA.
Not included.
Not included.
Not included.
Not included.
Would allow beneficiaries 65 and older who are only enrolled in Part A to enroll in an HSA.
Medicare Advantage Medical Savings Accounts (MSAs)
Not included.
Would allow beneficiaries enrolled in Medicare Advantage MSAs to contribute their own money to the MSA.
Not included.
Not included.
Not included.
Not included.
Would allow beneficiaries enrolled in Medicare Advantage MSAs to contribute their own money to the MSA.
Medicare Advantage quality relative to traditional Medicare
Not included.
Not included.
Would require HHS Secretary to report on Medicare Compare the performance of Medicare Advantage and traditional Medicare for each MSA on a core set of quality measures, beginning in CY2020.
Not included.
Not included.
Not included.
Not included.
Medicare claims data: Make data more available and transparent
Not included.
Would require HHS Secretary to make Medicare claims data public in a searchable database beginning in FY2016.
States support for “sharing and analyzing health data”; unspecified whether the statement includes Medicare claims data.
Not included.
Not included.
Not included.
Not included.
Budget Instructions and/or Impact
Budget instructions and/or impact as stated in the bill or proposal
CBO/JCT estimate: insurance-covered provisions (mostly from changes in DSH payments) would increase Medicare net spending by $43 billion from 2017 through 2026. This estimate does not include changes to Medicare spending and revenue due to other provisions.
Budgetary effects would not be entered on PAYGO scorecards.Offsets include lowering the discretionary spending limits (in the BBEDC) for FY2018 though 2021.
Not available.
Not available.
Would reduce Medicare spending by $449 billion from FY2017 through 2026, according to the proposal.
Would transfer $379.3 billion to the Federal Hospital Insurance (Part A) Trust Fund, which, according to the bill, represents the amount of on-budget Medicare savings in the bill for FY2016 through 2025.
Not available.
NOTES:Additional Acronyms: PAYGO (pay-as-you-go); BBEDC (Balanced Budget and Emergency Deficit Control Act of 1985)Income-related premiums: Income-related, higher premiums apply for incomes over $85,000/year (single) or $170,000/year (couple).”High-earners” (“Part A payroll tax” row) refers to individuals with incomes over $200,000/year (single) or $250,000 (couple).SOURCES:H.R. 1628, 115th Congress (2017-2018), “American Health Care Act of 2017,” introduced March 2017Republican Study Committee, H.R. 277, 115th Congress (2016-2017), “The American Health Care Reform Act,” January 2017A Better Way: Our Vision for a Confident America, Health Care section, June 2016, http://abetterway.speaker.gov/_assets/pdf/ABetterWay-HealthCare-PolicyPaper.pdfH.R. 5284, 114th Congress (2015-2016), “World’s Greatest Healthcare Plan Act of 2016,” May 2016FY2017 Budget Resolution: A Balanced Budget for a Stronger America, March 2016, http://budget.house.gov/uploadedfiles/fy2017_a_balanced_budget_for_a_stronger_america.pdfH.R. 3762, 114th Congress (2015-2016), “To provide for reconciliation pursuant to section 2002 of the concurrent resolution on the budget for fiscal year 2016,” January 2016H.R. 2300, 114th Congress (2015-2016), “Empowering Patients First Act,” May 2015, http://tomprice.house.gov/sites/tomprice.house.gov/files/HR%202300%20Empowering%20Patients%20First%20Act%202015.pdfCongressional Budget Office (CBO) score of H.R. 3762 as of January 4, 2016 available at: https://www.cbo.gov/publication/51107.
On May 4, 2017, the US House of Representatives approved the American Health Care Act (AHCA), legislation to repeal and replace the Affordable Care Act (ACA). On May 24, the Congressional Budget Office scored the latest version of this bill.
Do you think you’re an expert on the AHCA? Take this quiz to test your knowledge.
In this May 2017 post, the Kaiser Family Foundation’s Karen Pollitz and co-author Kathy L. Hudson of Hudson Works LLC, discuss how H.R. 1313, the Preserving Employee Wellness Programs Act, could substantially change current legal protections for the collection and treatment of genetic information and other personal health information under workplace wellness programs. The post is now available from the New England Journal of Medicine.
The Congress is currently debating the American Health Care Act (AHCA), which would not only repeal and replace the Affordable Care Act (ACA) but also make far-reaching changes to the structure and financing of Medicaid. The AHCA would use a per capita cap policy or block grants to cap federal funds to states for Medicaid. Facing reductions in federal Medicaid funding, states could offset lost federal dollars by raising taxes or reducing other state spending (like K-12 education), or states could reduce spending in Medicaid by finding savings or (more likely) by restricting eligibility, benefits, or payments to providers. However, many efficiencies were adopted by state Medicaid programs during the last two major recessions when revenues dropped and budgets were constrained leaving states with few options for easy ways to trim additional spending in the future. On March 13, 2017 the Congressional Budget Office (CBO) estimated that the AHCA would reduce federal Medicaid spending by $880 billion over the 2017-2026 period. By 2026, Medicaid spending would be about 25% less than what CBO projects under current law.
In this analysis, we examine the fiscal implications of state actions to offset the loss of federal Medicaid funding to maintain rather than cut Medicaid programs. This analysis is intended to be illustrative and not predictive of actual state outcomes. In contrast, the CBO estimate of a 25% reduction in federal Medicaid funding by 2026 reflects projections and accounts for federal changes in policy, state responses to the policy change, and reductions in coverage.
What does this analysis do? In this analysis, we present three scenarios of reductions in federal Medicaid spending and examine fiscal implications if all reductions had been in full effect in FFY 2015 (the most recent year for which Medicaid spending data is available). In these scenarios, we assume states fill the gaps caused by federal funding reductions by increasing state spending for Medicaid. To achieve those increases, we examine potential implications for state taxes and education spending by state and by groups of states including expansion status, political party, region and poverty quartile and highlight the groups that could experience the largest effects. These results are illustrative: each state would likely make different policy choices, and states could implement a combination of approaches, or choose not to completely offset the federal reduction.
What does this analysis not do? Unlike the CBO estimates, this analysis does not make projections or anticipate changes to state Medicaid programs through reducing eligibility levels, benefits, or reimbursement rates. If states do undertake these changes to their Medicaid programs, federal reductions would likely be larger. This analysis of the impact in FFY 2015 does not assume that states will drop coverage and does not account for states that may have adopted the expansion in the future.
What were the estimated reductions in federal spending in three scenarios? This analysis estimated reductions in federal Medicaid spending under three scenarios: (1) repeal of the ACA enhanced match rate for expansion adults ($27 billion), (2) repeal of the ACA plus a 10% reduction in federal Medicaid spending for the non-expansion population ($53 billion), and (3) repeal of the ACA plus a 20% reduction in federal Medicaid spending for the non-expansion population ($79 billion). All estimates assume that the full effect of the reductions are experienced in FFY 2015. Beyond the repeal of the ACA enhanced matching funds, the reductions are not based on specific policy changes but rather are based on illustrative potential federal Medicaid spending reductions. If states were to maintain Medicaid services, these reductions would require increases in state Medicaid funding to fill in the gaps in federal funding. Median state Medicaid spending per resident was $534 in FFY 2015. Under the three scenarios, the reduction in federal Medicaid funds would result in a median increase of state Medicaid spending per resident ranging from 17.2% to 40.3%.
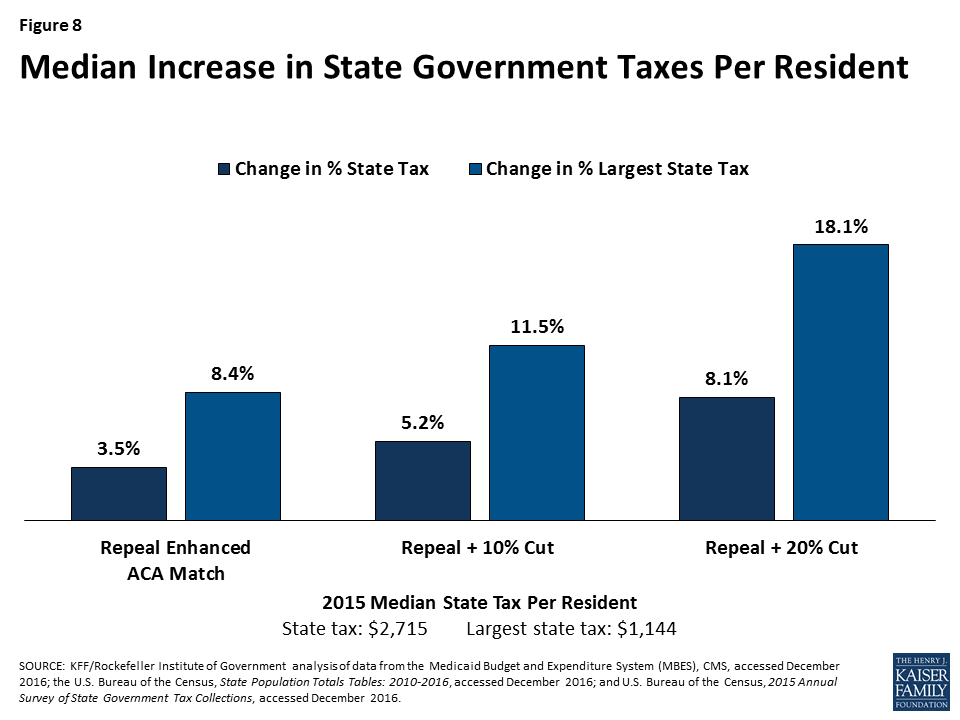
What are the potential implications for state taxes and education? States could choose to respond in many ways. For example, they could raise taxes or reduce education spending to fill in gaps in federal funding for Medicaid. Median state tax per resident was $2,715 in 2015. If states opt to raise taxes, the median increase in state taxes per resident would range from 3.5% to 8.1% under the three scenarios; if states increased the largest state tax, the median would range from 8.4% to 18.1%. For most states (29 states), the income tax is the largest state tax followed by sales tax (15 states). Median total spending per pupil for education was $10,961 in 2015. If states opted to fill the gap by reducing state government spending for education, states could face median reductions in state funding for K-12 education per pupil of 10.9% to 24.1% and total funding for K-12 education spending per pupil of 5.5% to 13.7%.
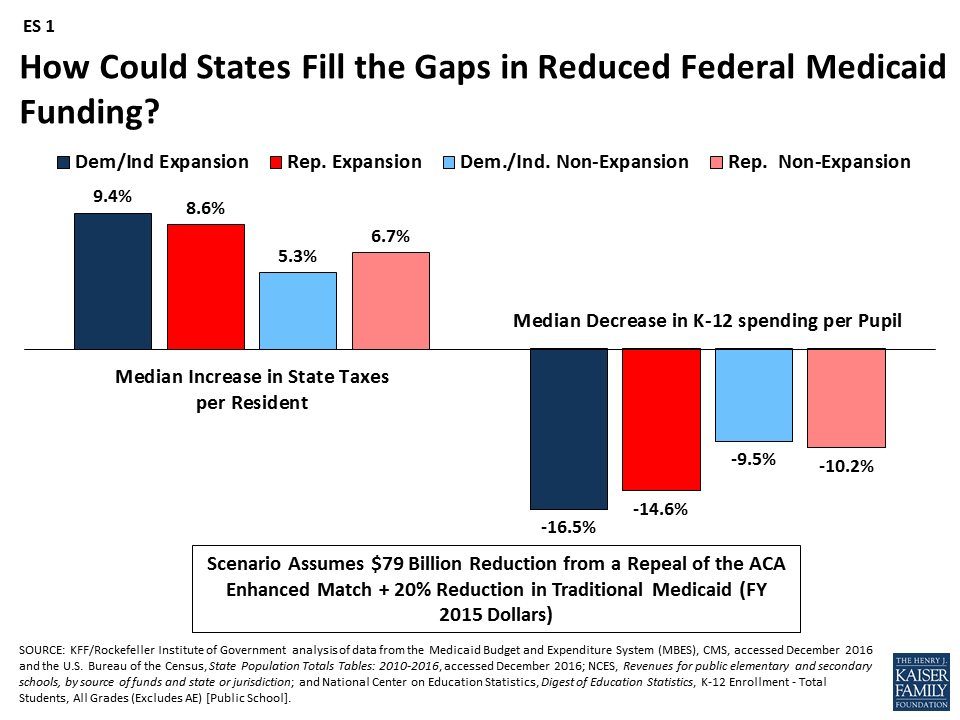
How are different groups of states affected by reductions? Due to the changes in the enhanced match rate, states that have adopted the Medicaid expansion will experience larger federal funding reductions; this outcome is true across states with Republican and Democratic governors. For example, in the scenario that would repeal the ACA enhanced match rate and reduce traditional Medicaid spending by 20%, expansion states would face higher median tax increases and larger reductions in education to fill the federal funding gaps compared to non-expansion states (ES 1). This increased budget pressure could make it difficult for states to maintain the Medicaid expansion. Funding reductions that go beyond eliminating the enhanced match for the ACA Medicaid expansion and entail cuts to the traditional Medicaid program could have a disproportionate effect on states with high poverty. Even though these poorer states spend less per resident on Medicaid, their federal reimbursement rate is relatively high, and so the impact of federal cuts is large.
Figure ES1: How Could States Fill the Gaps in Reduced Federal Medicaid Funding?
Issue Brief
Introduction
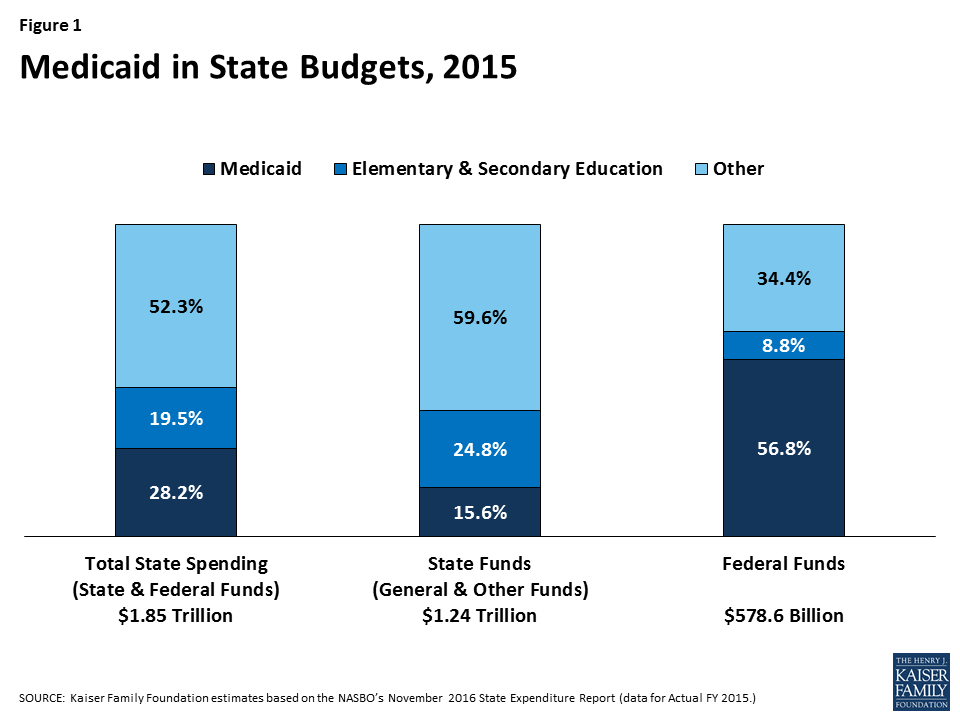
Medicaid has a unique role in state budgets. As a result of the federal matching structure, Medicaid is a spending item but also the largest source of federal revenues for state budgets. In FY 2015, Medicaid accounted for 28.2% (or $523 billion) of total state spending (including state and federal funding) for all items in the state budget, but 15.6% (or $193 billion) of all state spending (from general fund and other state funds), a far second to spending on K-12 education (24.8%, or $307 billion). Medicaid is the largest single source of federal funds for states, accounting for more than half (56.8%, or $329 billion) of all federally supported spending by states in SFY 2015, according to data from the National Association of State Budget Officers (Figure 1). Due to the federal match rate, as state Medicaid spending increases during economic downturns, so does federal funding. The match rate also gives states support and flexibility to address health care emergencies, needs and state health priorities without a pre-set limit on federal funds. States must balance their budgets annually. Since states pay for more than 40% of total Medicaid on average, states have incentives to constrain Medicaid spending by restricting provider payment rates, controlling prescription drug costs and implementing payment and delivery system reforms.
Figure 1: Medicaid in State Budgets, 2015
Congress is debating the AHCA, which includes reductions to federal financing combined with fundamental restructuring of Medicaid financing. On March 13, 2017 the Congressional Budget Office (CBO) estimated that the AHCA would reduce federal Medicaid spending by $880 billion over the 2017-2026 period. By 2026, Medicaid spending would be about 25% less than what CBO projects under current law. The CBO estimate reflects projections and accounts for federal changes in policy, state responses to the policy change, and reductions in coverage.
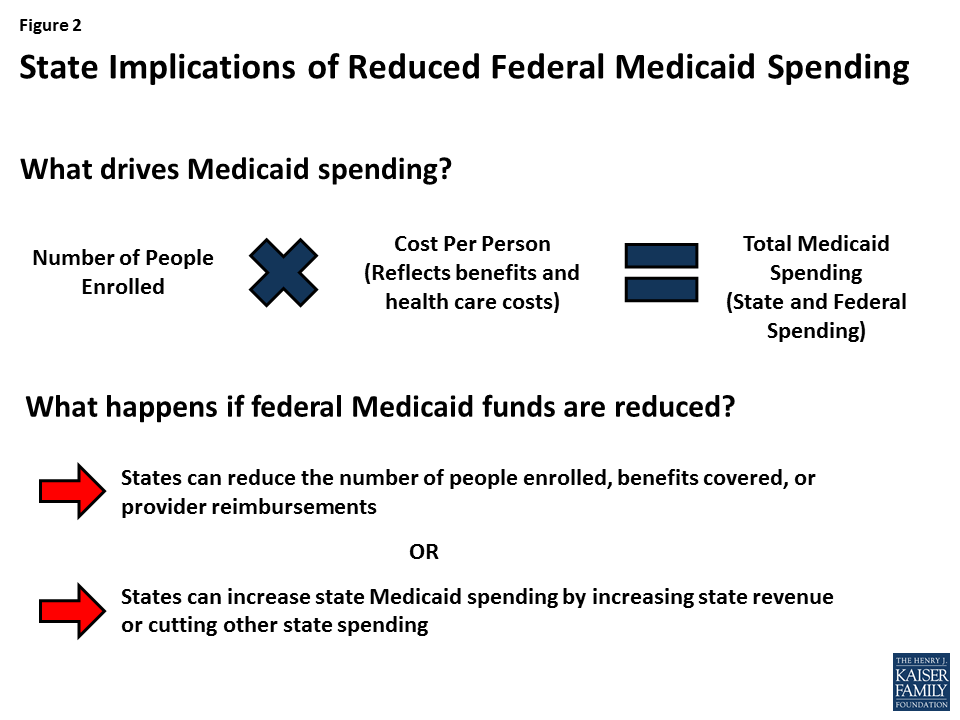
In this analysis, we present three scenarios of reductions in federal Medicaid spending and examine fiscal implications if states fill these financing gaps to maintain their programs and if all reductions are assumed to be in full effect in FFY 2015 (the most recent year for which Medicaid spending data is available). To fill these gaps in financing and maintain current Medicaid programs, we assume states will increase state spending for Medicaid by increasing state taxes or reducing education spending. This analysis is unlike the CBO estimate, which makes projections and accounts for changes in policy, state responses to make changes to Medicaid programs, and reductions in coverage (Figure 2).
Figure 2: State Implications of Reduced Federal Medicaid Spending
Study Design
This brief explores three scenarios of federal Medicaid spending reductions and the potential fiscal implications of different state responses to offset such losses. The analysis was conducted by the Kaiser Program on Medicaid and the Uninsured and the Rockefeller Institute of Government. We assumed that policies were fully effective in FFY 2015 (the most recent year for which Medicaid spending data is available). As noted earlier, unlike the CBO estimate, this analysis does not make projections and does not assume that states make changes to Medicaid programs or reduce coverage.
Scenarios
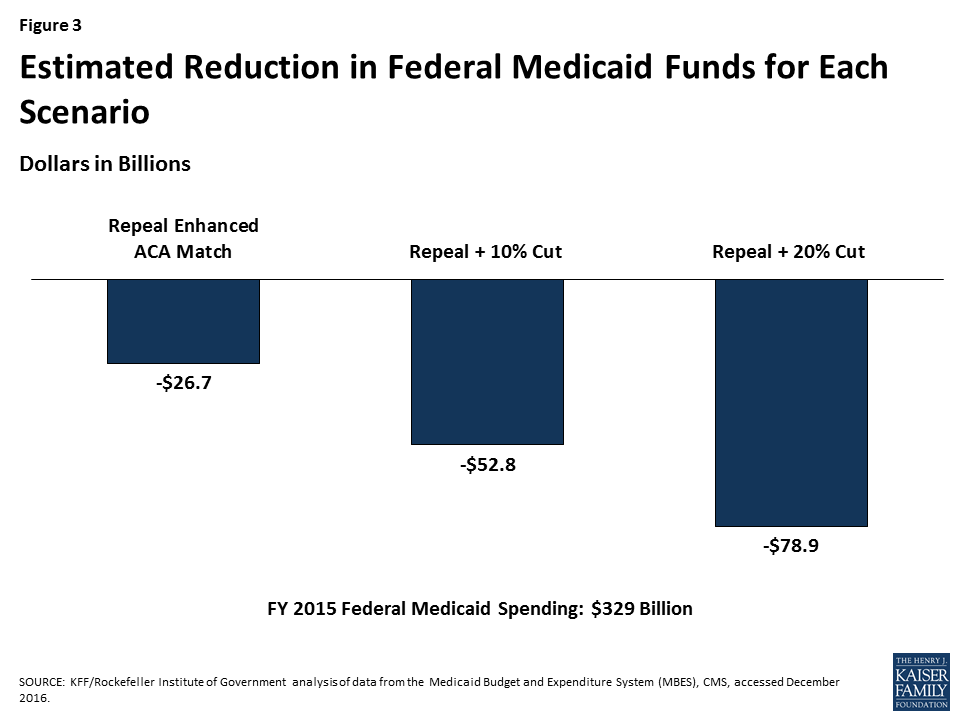
This analysis examined three scenarios of reductions in federal Medicaid spending. The magnitude of the reductions was calculated by adjusting the match rate for the expansion population from an estimated 90% when fully implemented to a state’s traditional match rate. We used estimated spending for the expansion group for FFY 2015 (spending data for states that expanded mid-year in FFY 2015 or in FFY 2016 were adjusted to account for increases in enrollment and spending for the expansion population). Beyond the repeal of the ACA enhanced matching funds, the reductions are not based on specific policy changes but rather based on estimates of potential federal Medicaid spending reductions. The total amount of federal Medicaid reductions in each scenario is displayed in Figure 3 and described below:
Figure 3: Estimated Reduction in Federal Medicaid Funds for Each Scenario
(1) Repeal ACA enhanced matching funds. Assumes states would get the traditional match rate for the expansion population and only includes states that have expanded Medicaid, since there would be no effect on states that did not expand. Total federal cut: $26.7 billion.
(2) Repeal ACA enhanced matching funds + 10% cut in Medicaid for non-expansion populations. Total federal cut: $52.8 billion.
(3) Repeal ACA enhanced matching funds + 20% cut in Medicaid for non-expansion populations. Total federal cut: $78.9 billion.
For each of these scenarios, we examined the outcomes (increased state-financed Medicaid spending per resident) and responses (increased state taxes or decreased K-12 education spending) by state and by groups of states including state expansion status, by political party of the governor (or mayor, for DC), by region and poverty rate. (See Table 1 for more information on state groupings). See Table 1 for median reductions by group and Appendix Table 2 for reductions by state in each of these scenarios. As noted above, the first scenario calculates medians across groups for only expansion states since non-expansion states are not affected.
Outcome and Potential Responses
To fill the gaps created by reductions, states would need to increase state-financed Medicaid spending per resident (outcome). To achieve those increases, states could opt to increase state taxes or reduce education spending (potential responses). These outcomes and responses are illustrative. In reality, faced with reductions in federal Medicaid funding, each state would make different policy choices and states could implement a combination of approaches, or not completely offset the federal reduction. For more details on the methods and data sources, see the Appendix.
Table 1. Median Federal Medicaid Cuts by State Characteristics, FFY 2015
Repeal Enhanced ACA Match
Repeal + 10% Cut
Repeal + 20% Cut
All States
$26,676,000,000
$52,805,000,000
$78,933,000,000
By Expansion Status
Expansion
$26,676,000,000
$43,608,000,000
$60,540,000,000
Non-expansion
N/A
$9,197,000,000
$18,393,000,000
By Political Party of the Governor
Democratic
$17,994,000,000
$29,037,000,000
$40,081,000,000
Republican
$8,589,000,000
$23,583,000,000
$38,576,000,000
Independent
$93,000,000
$185,000,000
$277,000,000
By Region
Northeast
$8,363,000,000
$14,066,000,000
$19,768,000,000
South
$2,296,000,000
$11,674,000,000
$21,052,000,000
Midwest
$4,581,000,000
$9,920,000,000
$15,259,000,000
West
$11,436,000,000
$17,145,000,000
$22,854,000,000
By Poverty Quartile
Low Poverty
$3,801,000,000
$6,700,000,000
$9,600,000,000
Low-Mid Poverty
$5,642,000,000
$10,720,000,000
$15,798,000,000
Mid-Upper Poverty
$15,012,000,000
$28,575,000,000
$42,139,000,000
High Poverty
$2,222,000,000
$6,809,000,000
$11,397,000,000
By Expansion Status and Political Party of the Governor
Expansion – Dem/Ind
$17,994,000,000
$27,788,000,000
$37,581,000,000
Expansion – Rep
$8,589,000,000
$15,636,000,000
$22,682,000,000
Non-expansion – Dem/Ind
N/A
$1,250,000,000
$2,499,000,000
Non-expansion – Rep
N/A
$7,947,000,000
$15,894,000,000
NOTE: Data are rounded to the nearest million.SOURCE: KFF/Rockefeller Institute of Government analysis of data from the Medicaid Budget and Expenditure System (MBES), CMS, accessed December 2016.
Key Findings
Outcome: Implications for State-Financed Medicaid Spending Per Resident
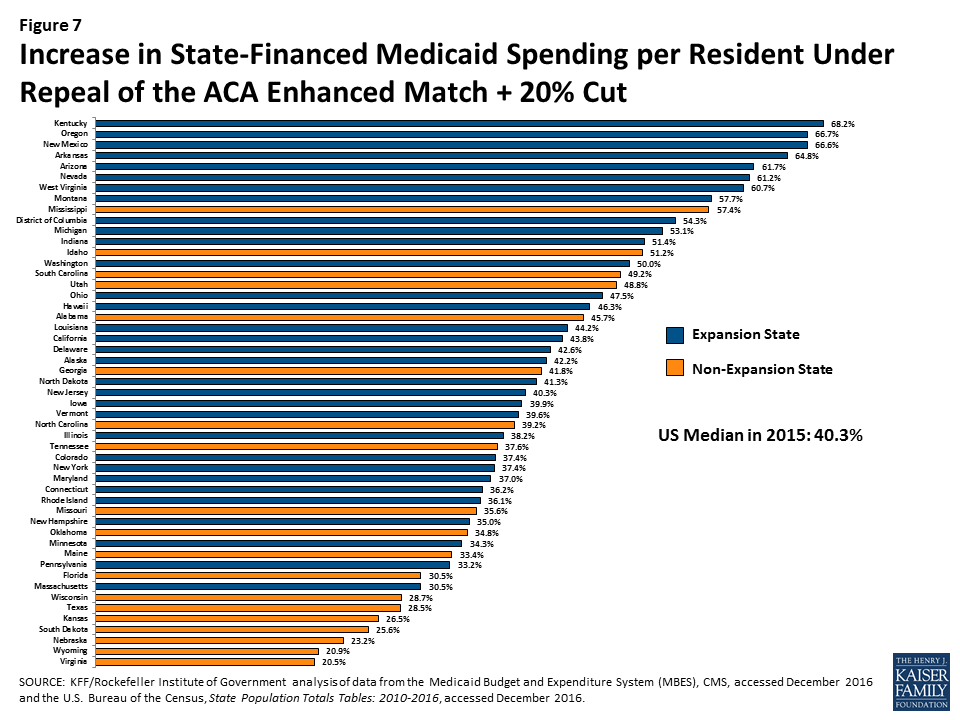
Median state-financed Medicaid spending per resident was $534 in FFY 2015. To fill gaps in federal Medicaid funding assumed in the three scenarios, states would need to increase in state-financed Medicaid spending. Median increases in state-financed spending per resident would range from 17.2% if the enhanced match were repealed up to 40.3% to offset reductions from both the repeal of the matching funds and a 20% reduction of federal funds (Figure 4). These increases for the largest reduction scenario would range from a 20.5% increase in state per resident spending in Virginia to an 68.2% increase in Kentucky.
Figure 4: Median Increase in State-Financed Medicaid Spending Per Resident
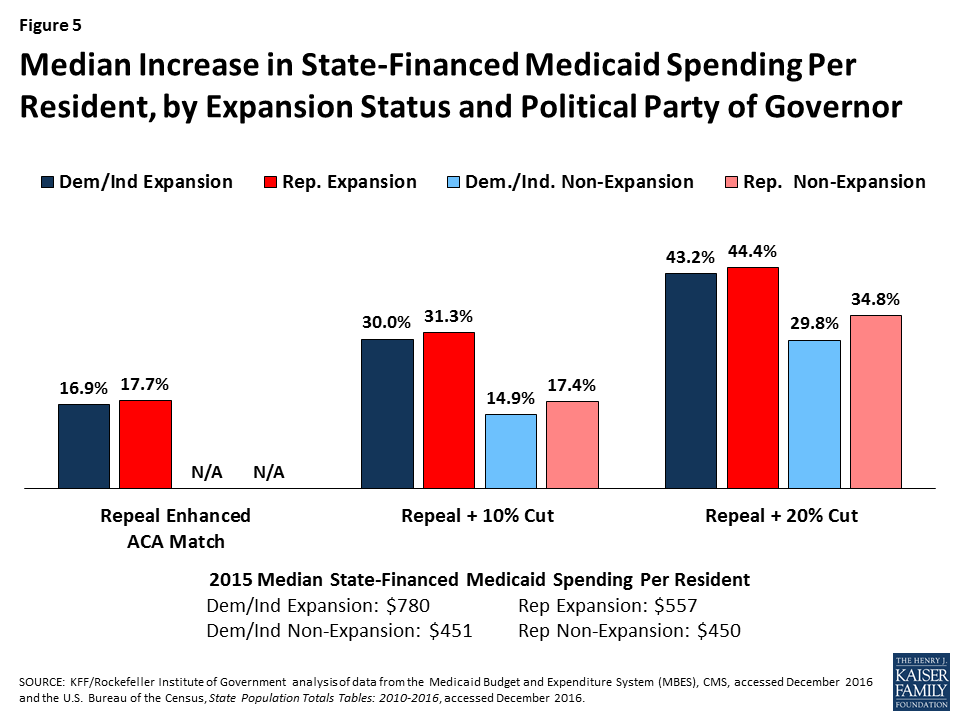
The federal cuts under all of the scenarios would result in larger state spending increases per resident in expansion states compared to non-expansion states (across states with Republican and Democratic governors). High poverty states, where median state Medicaid spending per resident is the lowest ($458) compared to low-poverty states ($655), would experience the largest percent increase, particularly under the largest reduction scenario (Figures 5 and 6).
For median results by group for each scenario, see Table 2. For state-by-state results of changes in state Medicaid spending per resident, see Figure 7 and Appendix Table 3.
Figure 5: Median Increase in State-Financed Medicaid Spending Per Resident, by Expansion Status and Political Party of GovernorFigure 6: Median Increase in State-Financed Medicaid Spending Per Resident, by Poverty Quartile
Table 2. Median Increase in State Medicaid Spending per Resident by State Characteristics, 2015
State Medicaid Spending Per Resident,FFY 2015
Repeal Enhanced ACA Match
Repeal + 10% Cut
Repeal + 20% Cut
Increase in State Medicaid Spending per Resident
Increase in State Medicaid Spending per Resident
Increase in State Medicaid Spending per Resident
All States
$534
17.2%
27.2%
40.3%
By Expansion Status
Expansion
$571
17.2%
31.3%
43.2%
Non-expansion
$450
N/A
17.4%
34.8%
By Political Party of the Governor
Democratic
$656
17.1%
28.3%
42.6%
Republican
$472
17.7%
25.2%
39.9%
Independent
$889
14.2%
28.2%
42.2%
By Region
Northeast
$917
15.9%
26.3%
36.1%
South
$474
17.4%
24.6%
42.6%
Midwest
$554
15.8%
26.0%
36.9%
West
$529
23.9%
36.0%
50.0%
By Poverty Quartile
Low Poverty
$655
16.5%
26.3%
36.2%
Low-Mid Poverty
$569
17.9%
27.4%
38.2%
Mid-Upper Poverty
$478
17.1%
27.2%
39.2%
High Poverty
$458
18.5%
30.4%
55.9%
By Expansion Status and Political Party of the Governor
Expansion – Dem/Ind
$780
16.9%
30.0%
43.2%
Expansion – Rep
$557
17.7%
31.3%
44.4%
Non-expansion – Dem/Ind
$451
N/A
14.9%
29.8%
Non-expansion – Rep
$450
N/A
17.4%
34.8%
SOURCE: KFF/Rockefeller Institute of Government analysis of data from the Medicaid Budget and Expenditure System (MBES), CMS, accessed December 2016 and the U.S. Bureau of the Census, State Population Totals Tables: 2010-2016, accessed December 2016.
Figure 7: Increase in State-Financed Medicaid Spending per Resident Under Repeal of the ACA Enhanced Match + 20% Cut
Potential State Responses
Fill the Funding Gap with Increases in State Government Taxes
One potential state response to offset the loss of federal Medicaid funds is to increase state taxes. We examine the percent increase in state government taxes that would be required if states were to raise taxes to offset the entire federal Medicaid spending reduction—measured by the Medicaid cut as a percentage of state tax revenue. We also examined the percent increase that would be required in a state’s largest state-government tax, if the state raised that tax to offset Medicaid cuts—measured by the Medicaid cut as a percentage of the state’s largest tax revenue.
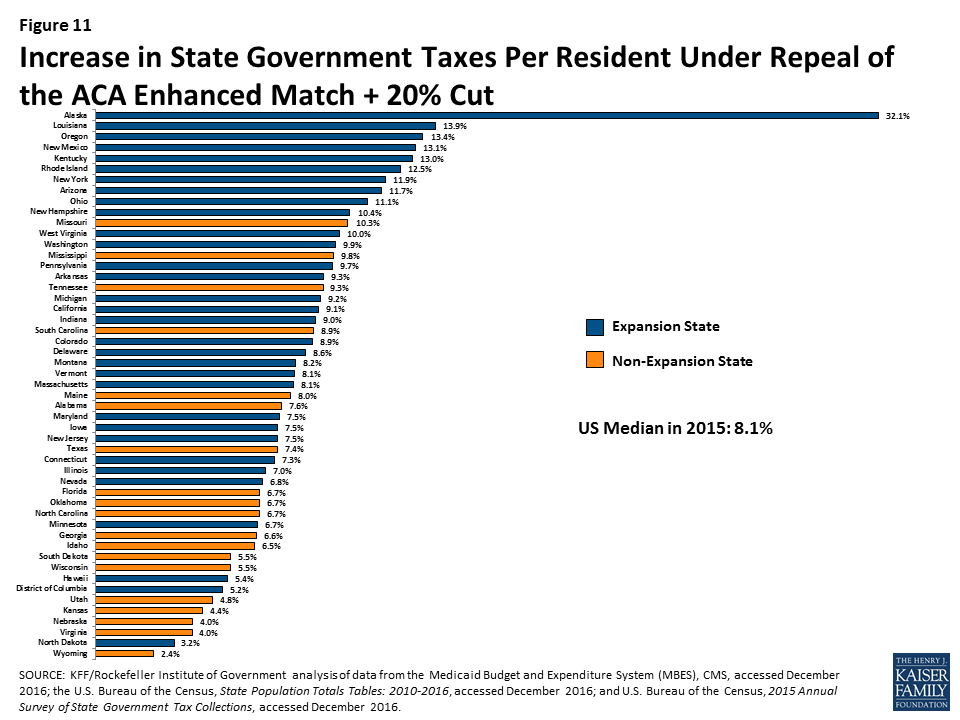
Median state tax per resident was $2,715 in 2015. The analysis shows that the median state would need to increase taxes per resident by 3.5% to 8.1% to offset reductions in federal Medicaid funding under the three scenarios, with increases ranging from 2.4% in Wyoming to 32.1% in Alaska for the largest reduction scenario (Figure 8). When only looking at the largest state tax, the median state tax per resident was $1,144 in 2015 and the median increase would be 8.4% to 18.1%. Under the largest reduction scenario, the increase in the largest state tax would range from 6.3% in Wyoming to 121.6% in Alaska. For most states, the income tax is the largest state tax (29 states), followed by sales tax (15 states), corporate taxes (AK), property taxes (DC and VT), and severance taxes (in ND and WY).
Figure 8: Median Increase in State Government Taxes Per Resident
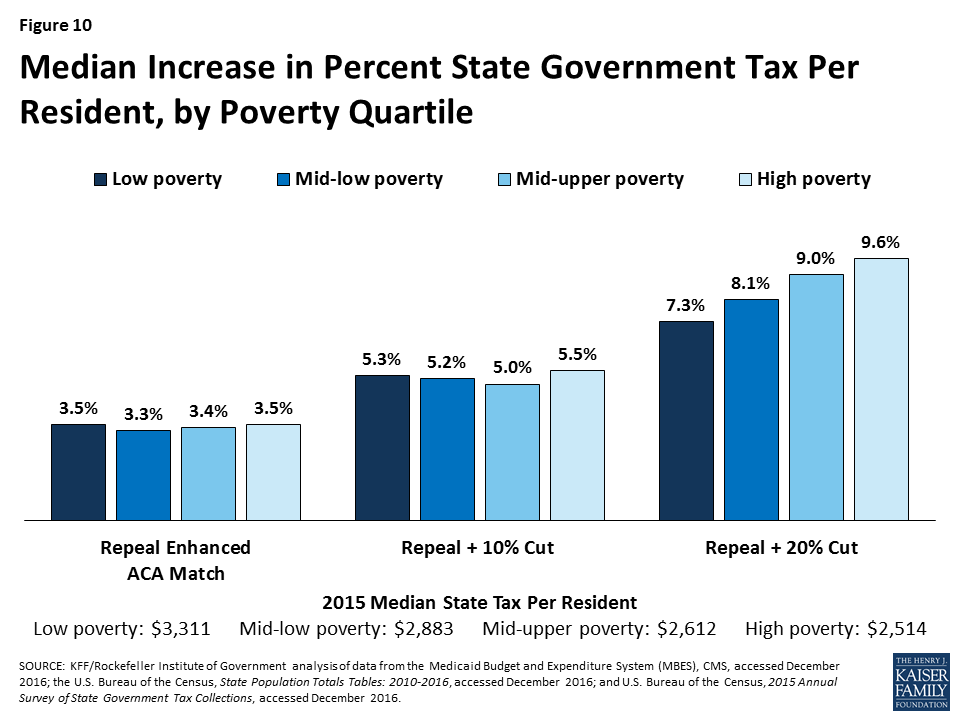
All of the scenarios would result in larger increases in state taxes in expansion states compared to non-expansion states (across states with Republican and Democratic governors). High poverty states could experience the highest median percentage increase in state taxes to offset federal reductions in federal Medicaid funding under the largest reduction scenario (Figures 9 and 10).
For median results by group for each scenario, see Table 3. For state-by-state results of changes in state taxes per resident, see Figure 11 and Appendix Table 4.
Figure 9: Median Increase in Percent State Government Tax Per Resident, by Expansion Status and Political Party of GovernorFigure 10: Median Increase in Percent State Government Tax Per Resident, by Poverty Quartile
Table 3. Median Increase in State Taxes per Resident by State Characteristics, 2015
Total State Tax Revenue per Resident, 2015
Revenue from the Largest Tax per resident, 2015
Repeal Enhanced ACA Match
Repeal + 10% Cut
Repeal + 20% Cut
Increase in Total State Taxes per Resident
Increase in the Largest State Tax per Resident
Increase in Total State Taxes per Resident
Increase in the Largest State Tax per Resident
Increase in Total State Taxes per Resident
Increase in the Largest State Tax per Resident
All States
$2,715
$1,144
3.5%
8.4%
5.2%
11.5%
8.1%
18.1%
By Expansion Status
Expansion
$2,983
$1,205
3.5%
8.4%
6.1%
14.3%
9.1%
20.5%
Non-expansion
$2,405
$1,077
N/A
N/A
3.4%
6.7%
6.7%
13.5%
By Political Party of the Governor
Democratic
$3,023
$1,423
3.9%
9.5%
6.4%
13.2%
8.9%
17.9%
Republican
$2,631
$1,084
3.2%
8.2%
4.9%
10.6%
7.5%
18.1%
Independent
$1,171
$309
10.8%
40.9%
21.4%
81.2%
32.1%
121.6%
By Region
Northeast
$3,533
$1,483
3.6%
9.3%
5.6%
15.5%
8.1%
21.2%
South
$2,454
$1,069
3.5%
8.4%
4.5%
11.2%
7.6%
19.5%
Midwest
$2,715
$1,122
2.9%
7.4%
4.9%
10.9%
6.8%
16.4%
West
$2,628
$1,170
4.4%
8.9%
6.5%
13.1%
8.9%
17.7%
By Poverty Quartile
Low Poverty
$3,311
$1,423
3.5%
8.9%
5.3%
11.2%
7.3%
15.7%
Low-Mid Poverty
$2,883
$1,170
3.3%
8.1%
5.2%
12.6%
8.1%
17.5%
Mid-Upper Poverty
$2,612
$1,132
3.4%
8.6%
5.0%
10.6%
9.0%
18.1%
High Poverty
$2,514
$949
3.5%
8.3%
5.5%
14.0%
9.6%
24.3%
By Expansion Status and Political Party of the Governor
Expansion – Dem/Ind
$3,026
$1,513
4.0%
9.6%
6.5%
14.1%
9.4%
19.6%
Expansion – Rep
$2,916
$1,106
3.2%
8.2%
5.7%
15.3%
8.6%
22.7%
Non-expansion – Dem/Ind
$2,476
$1,269
N/A
N/A
2.7%
5.5%
5.3%
10.9%
Non-expansion – Rep
$2,241
$1,056
N/A
N/A
3.4%
6.7%
6.7%
13.5%
SOURCE: KFF/Rockefeller Institute of Government analysis of data from the Medicaid Budget and Expenditure System (MBES), CMS, accessed December 2016; the U.S. Bureau of the Census, State Population Totals Tables: 2010-2016, accessed December 2016; and U.S. Bureau of the Census, 2015 Annual Survey of State Government Tax Collections, accessed December 2016.
Figure 11: Increase in State Government Taxes Per Resident Under Repeal of the ACA Enhanced Match + 20% Cut
Fill the Funding Gap with Decreases in Education Spending
Another potential state response to decreased federal Medicaid funds is to shift state dollars from other spending, such as education spending. This analysis assesses the percentage cut in state spending for K-12 education per pupil that would be required if state governments were to reduce spending on education (essentially school aid) to offset Medicaid cuts. Median state funding for education per pupil was $5,961 in 2015. The analysis shows that states could experience median decreases in per pupil state funding for K-12 of 10.9% to 24.1% to offset federal Medicaid reductions under the three scenarios (Figure 12).
Total spending for education is primarily from state and local governments, with a small share financed by the federal government. Reductions in state government spending for K-12 education would have a direct impact on total spending per-pupil. Median total spending per pupil was $10,961 in 2015. For total spending on K-12 education per pupil, states could face reductions in spending of 5.4% to 13.7% (Figure 12). Reductions would vary significantly across states.
Figure 12: Median Decrease in K-12 Education Spending Per Pupil
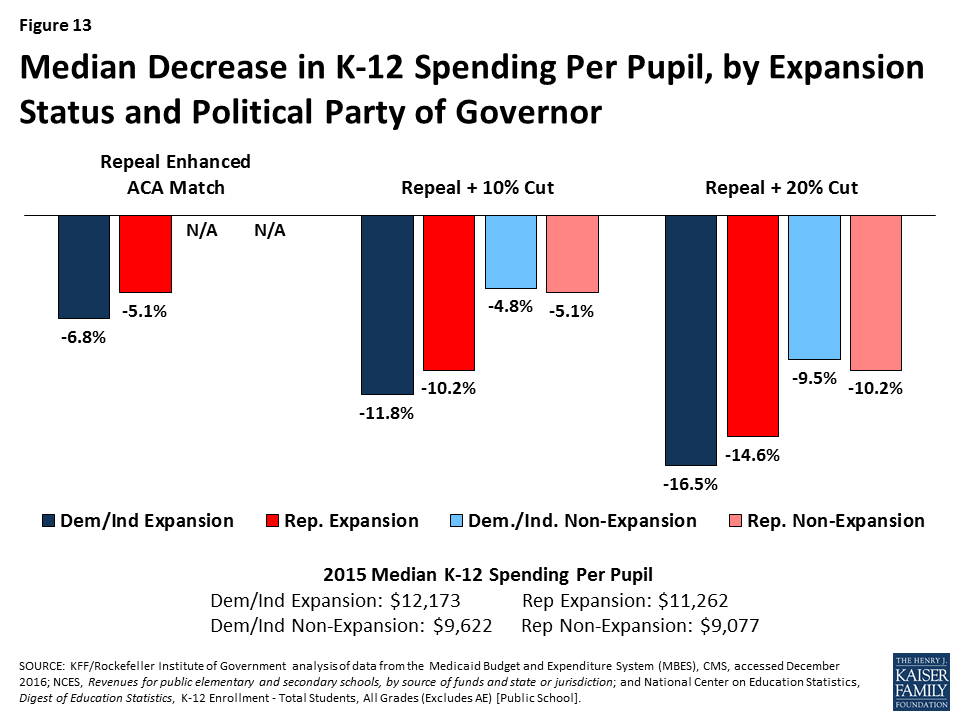
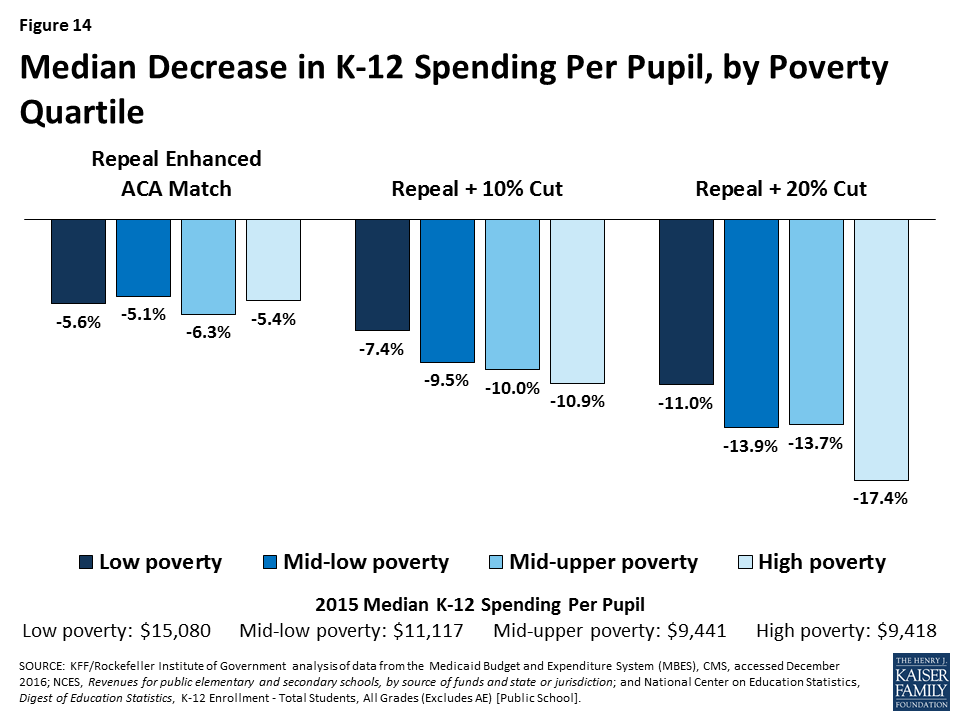
All of the scenarios would result in larger decreases in total K-12 per pupil spending for expansion states compared to non-expansion states (across states with Republican and Democratic governors). Mid- to high poverty states, could experience the largest reductions in per pupil spending to offset federal reductions in Medicaid. Figures 13 and 14 show estimated reductions in total spending for education to fill gaps in federal Medicaid funding.
For median results by group for each scenario, see Table 4. For state-by-state results of changes in K-12 education spending per pupil, see Figure 15 and Appendix Table 5.
Figure 13: Median Decrease in K-12 Spending Per Pupil, by Expansion Status and Political Party of GovernorFigure 14: Median Decrease in K-12 Spending Per Pupil, by Poverty Quartile
Table 4. Median Decrease in Spending for K-12 Education per Pupil by State Characteristics, 2015
State Aid for K-12 per pupil,2015
Total K-12 Spending Per Pupil, 2015
Repeal Enhanced ACA Match
Repeal + 10% Cut
Repeal + 20% Cut
Decrease in State Aid for K-12 Per Pupil
Decrease in Total K-12 Spending Per Pupil
Decrease in State Aid for K-12 Per Pupil
Decrease in Total K-12 Spending Per Pupil
Decrease in State Aid for K-12 Per Pupil
Decrease in Total K-12 Spending Per Pupil
All States
$5,961
$10,961
-10.9%
-5.5%
-15.4%
-9.4%
-24.1%
-13.7%
By Expansion Status
Expansion
$6,987
$11,510
-10.9%
-5.5%
-19.4%
-10.5%
-27.0%
-15.5%
Non-expansion
$4,555
$9,077
N/A
N/A
-9.4%
-5.1%
-18.8%
-10.2%
By Political Party of the Governor
Democratic
$6,948
$11,475
-12.0%
-7.1%
-19.1%
-11.7%
-26.5%
-16.4%
Republican
$5,476
$9,968
-10.6%
-5.1%
-13.8%
-6.7%
-22.0%
-12.5%
Independent
$14,650
$19,132
-4.8%
-3.7%
-9.6%
-7.4%
-14.4%
-11.0%
By Region
Northeast
$7,026
$16,159
-11.6%
-5.2%
-19.1%
-9.5%
-30.7%
-14.1%
South
$5,309
$9,406
-10.1%
-5.4%
-13.2%
-6.7%
-23.3%
-13.3%
Midwest
$6,380
$11,243
-8.4%
-4.9%
-13.9%
-7.9%
-21.0%
-13.0%
West
$6,127
$9,842
-12.4%
-7.4%
-20.2%
-10.3%
-27.6%
-14.5%
By Poverty Quartile
Low Poverty
$8,209
$15,080
-10.5%
-5.6%
-11.5%
-7.4%
-15.8%
-11.0%
Low-Mid Poverty
$6,079
$11,117
-12.0%
-5.1%
-18.4%
-9.5%
-25.5%
-13.9%
Mid-Upper Poverty
$5,961
$9,441
-14.7%
-6.3%
-14.5%
-10.0%
-26.7%
-13.7%
High Poverty
$5,429
$9,418
-10.1%
-5.4%
-16.9%
-10.9%
-28.1%
-17.4%
By Expansion Status and Political Party of the Governor
Expansion – Dem/Ind
$7,467
$12,173
-12.0%
-6.8%
-19.7%
-11.8%
-27.0%
-16.5%
Expansion – Rep
$6,879
$11,262
-10.6%
-5.1%
-19.2%
-10.2%
-27.8%
-14.6%
Non-expansion – Dem/Ind
$4,952
$9,622
N/A
N/A
-8.6%
-4.8%
-17.3%
-9.5%
Non-expansion – Rep
$4,535
$9,077
N/A
N/A
-9.4%
-5.1%
-18.8%
-10.2%
SOURCE: KFF/Rockefeller Institute of Government analysis of data from the Medicaid Budget and Expenditure System (MBES), CMS, accessed December 2016; NCES, Revenues for public elementary and secondary schools, by source of funds and state or jurisdiction; and National Center on Education Statistics, Digest of Education Statistics, K-12 Enrollment – Total Students, All Grades (Excludes AE) [Public School].
Figure 15: Decrease in Total K-12 Spending Per Pupil Under Repeal of the ACA Enhanced Match + 20% Cut
Conclusion
The Congress is currently debating the American Health Care Act (AHCA), which would not only repeal and replace the Affordable Care Act (ACA) but also make far reaching changes to the structure and financing of Medicaid. The AHCA would use a per capita cap policy or block grants to cap federal funds to states for Medicaid. These reductions in federal Medicaid funding, could have implications for other areas of the state budget if states chose to offset the decreases in federal spending with state funds by raising taxes or reducing other state spending (like K-12 education). States could also reduce spending in Medicaid by finding savings but more likely by restricting eligibility or benefits.
This analysis found that under various scenarios of reductions in federal Medicaid funding in FFY 2015, states would have to increase their per resident state Medicaid spending by a median of 17.2% to 40.3% to maintain total Medicaid spending. To pay for these increases, states could increase total state tax revenue per resident by a median of 3.5% to 8.1% or decrease K-12 education funding per pupil by a median of 10.9% to 24.1%. Because states have different starting points for taxes and education spending, the effects could vary by state and by groups of states. However, due to assumptions about changes in the ACA enhanced match rate, states that have adopted the Medicaid expansion will experience larger implications from the federal Medicaid funding reductions; this is true across states with Republican and Democratic governors. This increased budget pressure could make it difficult for states to maintain the Medicaid expansion. Federal funding reductions could have a disproportionate effect on states that spend less per resident on Medicaid and education, and have lower tax revenues, typically high poverty states. The responses presented in the report are illustrative. In reality, each state would make different policy choices and states could implement a combination of approaches, or not completely offset the federal reductions. However, the results show that depending on the size of the gap to fill, the responses could be significant.
Methods
The following details the methods and data used to examine the outcomes for reductions in federal Medicaid spending.
Estimated Reductions in federal Medicaid spending. FY 2015 spending for each state was obtained from the Medicaid Budget and Expenditure System (MBES). Adjustments were made for states that expanded mid-year in FY 2015 or in FY 2016. Since Indiana and Pennsylvania expanded early in FY 2015, spending for the expansion population was adjusted to represent a full year of spending. Enrollment data for Alaska (as of April 2017), Louisiana (as of February 2017), and Montana (as of October 2016) were obtained from state resources. The latest enrollment data for these three states were multiplied by the federal per enrollee spending across all Medicaid enrollees in the state to estimate spending for the expansion population.-Using the adjusted FY 2015 spending for the expansion group, we assumed a 90% match rate (the rate when the ACA is in full effect) and then took the difference between that match rate and spending assuming a state’s traditional match rate. For the other effects, we estimated a 10% and a 20% reduction in federal funding off of FY 2015 spending for the traditional Medicaid population. We did not estimate the specifics of per capita cap or block grant proposals.-(KFF analysis of Centers for Medicare and Medicaid Services, Expenditure Reports from MBES, https://www.medicaid.gov/medicaid/financing-and-reimbursement/state-expenditure-reporting/expenditure-reports/index.html; Centers for Medicare and Medicaid Services, Quarterly Medicaid Enrollment Report, https://www.medicaid.gov/medicaid/program-information/medicaid-and-chip-enrollment-data/enrollment-mbes/index.html; Alaska Department of Health and Social Services, Medicaid in Alaska Dashboard, accessed May 23, 2017, http://dhss.alaska.gov/HealthyAlaska/Pages/dashboard.aspx; Louisiana Department of Health, Medicaid Dashboard, accessed March 3, 2017, http://ldh.la.gov/healthyladashboard/; Montana Department of Public Health and Human Services, Monthly enrollments, accessed March 3, 2017, http://dphhs.mt.gov/StatisticalInformation.)
Change in state government taxes: The percentage increase in state government taxes that would be required if states were to raise taxes to offset Medicaid cuts. The calculation is the Medicaid cut as a percentage of state taxes, based upon state fiscal year 2015 state government tax collections. For the District of Columbia, which does not have a state government, we used District tax collections. (U.S. Bureau of the Census, 2015 Annual Survey of State Government Tax Collections, https://www.census.gov/govs/statetax/.)
Change in largest state government tax: The percentage increase that would be required in a state’s largest state-government tax, if the state raised that tax to offset Medicaid cuts. The calculation is the Medicaid cut as a percentage of the state’s largest tax, where the largest tax is determined based upon detailed item-code data for state fiscal year 2015. For the District of Columbia, which does not have a state government, we used the largest District tax. (U.S. Bureau of the Census, 2015 Annual Survey of State Government Tax Collections, https://www.census.gov/govs/statetax/.)
Change in state aid for K-12 education: The percentage cut in state aid for K-12 education that would be required if states were to cut this aid to offset Medicaid cuts. The calculation is the Medicaid cut as a percentage of state aid for K-12 education. Revenue of public schools from state governments is used as a proxy for state aid because data that explicitly measure state aid and that are both timely and comparable across states are not available. (Revenue from the state government may differ from what states show in their budgets for state aid. For example, Hawaii operates all of its schools, rather than providing aid to school districts. This approach treats revenue from the state of Hawaii as state aid.) For the District of Columbia, which does not have a state government, we used District revenue used to support schools. The latest available data for revenue of public schools is for 2014, from the National Center for Education Statistics NCES. (NCES, Revenues for public elementary and secondary schools, by source of funds and state or jurisdiction, https://nces.ed.gov/programs/digest/d16/tables/dt16_235.20.asp.) We estimated values for 2015 by adding one year of estimated growth to each state’s value for 2014, based on the compound annual growth rate for the prior five years (2009 to 2014).
Change in K-12 education per-pupil spending: The cut that would be required in K-12 education spending per pupil if the entire Medicaid cut were offset by cuts in spending by school districts. The per-pupil cut is calculated as the Medicaid cut divided by the number of public school pupils in the state in the 2014-15 school year, excluding adult education enrollment. (National Center on Education Statistics, Digest of Education Statistics, K-12 Enrollment – Total Students, All Grades (Excludes AE) [Public School], http://nces.ed.gov/ccd/elsi.) To provide context for these numbers, we then compute this cut as a percentage of total public school expenditures per pupil (excluding adult education enrollment). The latest available data for revenue of public schools is for 2014, from the National Center for Education Statistics NCES. We estimated values for 2015 by adding one year of estimated growth to each state’s value for 2014, based on the compound annual growth rate for the prior five years (2009 to 2014).
Appendix Table 1. State Characteristics, as of January 2017
SOURCES: Kaiser Family Foundation’s State Health Facts, Status of State Action on the Medicaid Expansion Decision, as of January 1, 2017. National Governors Association, Governors Roster 2017, as of January 25, 2017. U.S.
Appendix Table 2. Federal Medicaid Cuts by State, FFY 2015
>
NOTE: Adjustments were made for the five states that expanded mid-year in FY15 or in FY16 (AK, IN, LA, MT, PA). Data are rounded to the nearest million and may not sum to the US total. SOURCE: KFF/Rockefeller Institute of Government analysis of data from the Medicaid Budget and Expenditure System (MBES), CMS, accessed December 2016.
Appendix Table 3. Increase in State Medicaid Spending per Resident by State, 2015
>
SOURCE: KFF/Rockefeller Institute of Government analysis of data from the Medicaid Budget and Expenditure System (MBES), CMS, accessed December 2016 and the U.S. Bureau of the Census, State Population Totals Tables: 2010-2016, accessed December 2016.
Appendix Table 4. Increase in State Taxes per Resident by State, 2015
>
SOURCE: KFF/Rockefeller Institute of Government analysis of data from the Medicaid Budget and Expenditure System (MBES), CMS, accessed December 2016; the U.S. Bureau of the Census, State Population Totals Tables: 2010-2016, accessed December 2016; and U.S. Bureau of the Census, 2015 Annual Survey of State Government Tax Collections, accessed December 2016.
Appendix Table 5. Decrease in Spending for K-12 Education per Pupil by State, 2015
>
SOURCE: KFF/Rockefeller Institute of Government analysis of data from the Medicaid Budget and Expenditure System (MBES), CMS, accessed December 2016; NCES, Revenues for public elementary and secondary schools, by source of funds and state or jurisdiction; and National Center on Education Statistics, Digest of Education Statistics, K-12 Enrollment – Total Students, All Grades (Excludes AE) [Public School].
A new feature launched today on the redesigned Peterson-Kaiser Health System Tracker website provides quick and easy access to the latest key data measuring quality, spending, access, and outcomes in the U.S. health system.
Compiled by Kaiser Family Foundation analysts in consultation with other top experts, the Health System Dashboard presents users with both a broad view of the system’s performance compared to similar countries, and a detailed look at specific indicators within the areas of health and wellbeing, quality of care, health spending, and access and affordability.
A new brief on the Tracker, U.S. Health System is Performing Better, Though Still Lagging Behind Other Countries, pulls together the dashboard’s data to illustrate the current status of the U.S. health system’s performance and its progress in relation to countries that are similarly large and wealthy. It finds that the United States has improved on several measures, such as life expectancy, disease burden, and uninsured rate; but that it continues to be outperformed by other countries.
Overall, the new dashboard features more than 50 measures, ranging from life expectancy to spending by diagnosis, from prices and utilization to percent of workers in high deductible health plans. Users can explore trends over time, as well as differences and disparities across demographic groups.
In addition to the Health System Dashboard, the redesigned Tracker includes the interactive Health Spending Explorer, the educational video Health of the Healthcare System, analyses, and dozens of collections of downloadable charts. All of the resources are sharable on Facebook and Twitter.
The Tracker, a partnership between the Peterson Center on Healthcare and the Kaiser Family Foundation, was launched in 2014 to monitor the U.S. health system’s performance on key quality and cost measures.
The White House released its FY 2018 budget request to Congress on May 23, 2017, which includes significant cuts to global health funding. It seeks to shift the U.S. approach to development, stating that, the request “prioritizes and focuses foreign assistance in regions and on programs that advance U.S. national security by helping countries of strategic importance meet near- and long-term political, economic, development, and security needs.” It further states that “While the United States will continue significant funding for global health programs, even while refocusing foreign assistance, other stakeholders must do more to contribute their fair share to global health initiatives.”
Key highlights are as follows (see table for additional detail):
Funding provided to the State Department and USAID (through the Global Health Programs account), which represents the bulk of global health assistance, would decline by more than $2.2 billion (-26%), from $8,725 million in FY 2017 to $6,481 million, which would be the lowest level of funding since FY 2008.
Funding for global health provided to CDC would decline by $85 million (-20%), from $435 million in FY 2017 to $350 million in FY 2018.
Funding for almost all global health programs is reduced or eliminated in the budget request:
PEPFAR funding for bilateral programs would decline overall by $860 million (-18%) including a decrease of $470 million (-11%) at State, $330 million (-100%) at USAID, and $59 million (-46%) at CDC.
The U.S. contribution to the Global Fund to Fight AIDS, Tuberculosis and Malaria would decline by $225 million (-17%).
Funding for the Family Planning and Reproductive Health (FP/RH) and Vulnerable Children (VC) programs under the Global Health Programs account, respectively, would be eliminated.
Funding would decrease for TB (-$63 million or -26%), Neglected Tropical Diseases (-$25 million or -25%), and nutrition (-$47 million or -37%).
Funding for malaria would also decrease (-$331 million or -44%) although a one-time transfer of $250 million in unspent emergency Ebola funding would be used for malaria efforts.
Gavi, the Vaccine Alliance, which is included under maternal and child health (MCH) funding, is the only area to increase – from $275 million in FY 2017 to $290 million in FY 2018.
Aside from Gavi, other MCH funding decreased by $80 million (-15%).
Funding for Global Health Security would be eliminated, although a one-time transfer of $72.5 million would be provided in unspent emergency Ebola funding.
Several international organizations (including UNICEF, UNAIDS, microbicides research, IAVI, and others) that have historically received specified funding amounts in the budget are not allocated any funding in the FY 2018 request. While it is possible that the Administration could provide funding to these organizations, such funding would have to be taken from either bilateral programs or other accounts.
The table (.xls) below compares the FY 2018 request to the FY 2017 enacted funding amounts as outlined in the “Consolidated Appropriations Act, 2017” (P.L. 115-31; KFF summary here). Note that total funding for global health is not currently available as some funding provided through USAID, Health and Human Services (HHS), and the Department of Defense (DoD) is not yet available.
Medicaid and the Children’s Health Insurance Program (CHIP) are key sources of coverage for children, covering nearly four in ten children (39%) nationwide1and 44% of children with special health care needs. Medicaid covered over 37 million children in FY2016.2 CHIP serves as an important complement to Medicaid. In FY2016, it covered about 9 million children in families who earn too much to qualify for Medicaid but often lack access to affordable private coverage.3 States provide CHIP by creating a separate CHIP program, expanding Medicaid, or adopting a combination approach. All states have expanded eligibility for children through Medicaid and CHIP (Figure 1). New legislative authority is needed to continue CHIP funding beyond September 2017. If Congress does not extend CHIP funding, it is estimated that all states will exhaust their federal CHIP funds during FY2018.4
Figure 1: Income Eligibility Levels for Children in Medicaid/CHIP, January 2017
President Trump’s FY2018 proposed budget includes fundamental changes to Medicaid that would transition federal financing to a block grant or per capita cap for children and other groups, with reductions in federal funding of $610 billion. These changes are in addition to eliminating enhanced federal funding for the Affordable Care Act (ACA) Medicaid expansion to low-income adults. While the budget does not include many details, the provisions in the American Health Care Act (AHCA) would allow states to impose a block grant or per capita cap for children in Medicaid with requirements to cover mandatory children (under 100% of the federal poverty level (FPL) for school age children and under 133% FPL for children ages 0-5). Under the block grant option, states could cap enrollment or impose waiting lists for children above minimum levels and would not be required to provide comprehensive benefits.
The proposed budget also would reduce federal funding under CHIP and cap the eligibility level for which states could receive federal funding for children’s coverage at 250% FPL. The budget proposes to extend CHIP funding for two years through FY2019. However, it proposes several changes to CHIP. It would eliminate the 23 percentage point increase in the federal match that was provided to states under the Affordable Care Act (ACA), which would reduce funding for states. It also would cap the eligibility level for which states could receive federal CHIP matching funds at 250% FPL. In addition, it would eliminate the maintenance of effort requirement that the ACA established to protect existing coverage gains for children. This provision requires states to keep Medicaid and CHIP eligibility levels at least as high as those they had in place at the time the ACA was enacted through September 30, 2019. Lastly, it would allow states to move children ages 6 to 18 with incomes between 100% and 133% FPL who were transitioned from CHIP to Medicaid under the ACA back to CHIP. These changes would result in net saving in CHIP of $5.8 billion over ten years.
Under the proposed budget, about half of states would lose federal matching funds for children due to the 250% FPL eligibility cap on federal matching funds, which would likely lead them to reduce eligibility for children. As of January 2017, 24 states, including DC, have Medicaid/CHIP income eligibility limits above 250% FPL, including 19 states that cover children at or above 300% FPL (Table 1). These states would lose access to federal matching funds for coverage of children with incomes above 250% FPL under the proposed changes, which would increase state costs and likely lead to states reducing eligibility for children. In addition, states could further reduce children’s eligibility to the minimum levels (100% FPL for children ages 6 to 18 and 133% FPL for children ages 0-5) since the maintenance of effort provision would no longer apply.
Together, the proposed changes to Medicaid and CHIP would result in significant reductions in federal financing for children’s coverage. In response to these reductions, states will likely need to make program cutbacks, including reductions in eligibility and benefits. Such reductions would likely reverse the recent progress achieved in making affordable coverage available to working families and reducing the children’s uninsured rate to a record low of 5% (Figure 2). Coverage losses among children would lead to reduced access to care and other long-term negative effects for children and increase financial pressure on states and providers.
Figure 2: Uninsured Rates Among Nonelderly Adults and Children, 1997-2016
Table 1: Upper Medicaid/CHIP Income Eligibility Limits for Children as a Percent of the Federal Poverty Level (FPL), January 2017
State
Upper Medicaid/CHIP Income Limit
Without Income Disregard
With Income Disregard1
Median
250%
255%
Alabama
312%
317%
Alaska
203%
208%
Arizona
200%
205%
Arkansas
211%
216%
California
261%
266%
Colorado
260%
265%
Connecticut
318%
323%
Delaware
212%
217%
District of Columbia
319%
324%
Florida
210%
215%
Georgia
247%
252%
Hawaii
308%
313%
Idaho
185%
190%
Illinois
313%
318%
Indiana2
250%
262%
Iowa
302%
307%
Kansas
239%
244%
Kentucky
213%
218%
Louisiana
250%
255%
Maine
208%
213%
Maryland
317%
322%
Massachusetts
300%
305%
Michigan
212%
217%
Minnesota
283%
288%
Mississippi
209%
214%
Missouri
300%
305%
Montana
261%
266%
Nebraska
213%
218%
Nevada
200%
205%
New Hampshire
318%
323%
New Jersey
350%
355%
New Mexico
300%
305%
New York
400%
405%
North Carolina
211%
216%
North Dakota
170%
175%
Ohio
206%
211%
Oklahoma
205%
210%
Oregon
300%
305%
Pennsylvania
314%
319%
Rhode Island
261%
266%
South Carolina
208%
213%
South Dakota
204%
209%
Tennessee
250%
255%
Texas
201%
206%
Utah
200%
205%
Vermont
312%
317%
Virginia
200%
205%
Washington
312%
317%
West Virginia
300%
305%
Wisconsin
301%
306%
Wyoming
200%
205%
SOURCE: Based on a national survey conducted by the Kaiser Commission on Medicaid and the Uninsured with the Georgetown University Center for Children and Families, 2017.1 Modified Adjusted Gross Income rules include an income disregard equal to five percentage points of the federal poverty level applied at the highest income level for Medicaid and separate CHIP coverage.2 Indiana uses a state-specific income disregard equal to five percent of the highest income eligiblity threshold for the group.
Kaiser Family Foundation analysis of the 2016 Annual Social and Economic Supplement to the Current Population Survey. ↩︎