KFF designs, conducts and analyzes original public opinion and survey research on Americans’ attitudes, knowledge, and experiences with the health care system to help amplify the public’s voice in major national debates.
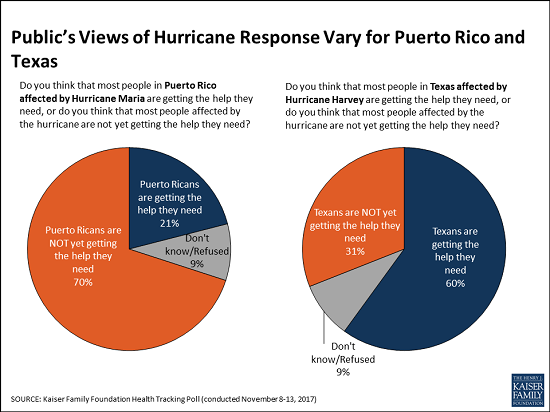
Two months after Hurricane Maria struck Puerto Rico, a growing majority of Americans say that Puerto Ricans affected by the devastating storm are not yet getting the help they need, the November Kaiser Family Foundation Tracking Poll finds.
This month, 70 percent of the public say that people in Puerto Rico are not yet getting the help they need, up from 62 percent in October 2017. These perceptions vary by party, and half of Republicans (52%) now say Puerto Ricans aren’t yet getting needed help, up significantly from October (38%).
When asked whether the federal government is doing enough to restore electricity and access to food and water in Puerto Rico or not, a majority of the public (59%) says the federal government is not doing enough, up from 52 percent in October. Most Democrats (86%) and independents (59%) say the federal government is not doing enough, but most Republicans (63%) say it is doing enough.
In contrast, Americans see the recovery efforts in Texas following Hurricane Harvey in late August progressing more positively. Most (60%) of the public says Texans are getting the help they need, twice the share (31%) who say Texans aren’t yet getting needed help.
The poll finds similar shares of Americans they are closely following news about recovery efforts in Puerto Rico (63%) and in Texas (58%). Democrats are somewhat more likely to report closely following news about the Puerto Rico recovery (75%) than are independents (61%) and Republicans (54%). In contrast, there are no partisan differences for those following news about Texas.
Designed and analyzed by public opinion researchers at the Kaiser Family Foundation, the poll was conducted from November 8 – 13, 2017 among a nationally representative random digit dial telephone sample of 1,201 adults. Interviews were conducted in English and Spanish by landline (415) and cell phone (786). The margin of sampling error is plus or minus 3 percentage points for the full sample. For results based on subgroups, the margin of sampling error may be higher.
On September 20, 2017, Hurricane Maria made landfall in Puerto Rico. A “Category 4” storm when it hit the island,1 Maria was the strongest hurricane to hit Puerto Rico in almost a century, and it caused significant, widespread damage. The total number of people who died due to Hurricane Maria is unknown; as of November 4, officials have confirmed 55 deaths from the storm on the island, but the death toll is feared to be much higher.2
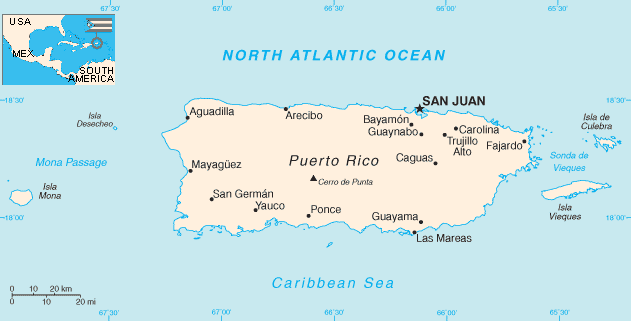
Source: public domain image, contains materials originally from Central Intelligence Agency’s World Factbook.
Hurricanes can have both near and long-term effects on public health (see Box 1). In Puerto Rico, these effects have been compounded by pre-existing fiscal, societal and health challenges. Drawing on federal and Puerto Rican government statistics and official statements, along with media reports, this issue brief provides a snapshot of key public health challenges in Puerto Rico after Hurricane Maria.
The high winds and flooding from hurricanes have direct health impacts during the storm itself and immediately after. Storms can also damage infrastructure and interrupt essential needs and public systems such as shelter, food, water, electrical, transportation, and communication, which have indirect, and longer-term effects on public health.
Immediate/Short-term impacts:
physical injury or death
drowning
Medium- and long-term impacts:
limited access to food and safe water
contamination of water and food sources from waste, debris, and other pollution
disruption of services at hospitals, clinics, and other care facilities
reduced ability to access health care, medicines or other essential health items
increased risk from infectious diseases due to lack of safe water, adequate hygiene, and sanitation
growing burden from unaddressed chronic disease care needs, such as cancer and diabetes
mental health issues including stress, depression and suicide
Status before the Hurricane
The Commonwealth of Puerto Rico is a U.S. territory located in the Caribbean, with a population of approximately 3.41 million residents as of July 2016.4 Puerto Ricans are U.S. citizens by birth. Prior to Hurricane Maria, Puerto Rico faced a number of economic and public health challenges. The island was already in the midst of a debt crisis, following years of economic recession, and in May of this year filed for bankruptcy relief.5 Close to half of Puerto Rico’s residents lived at or below the federal poverty level in 2016 (43.5%), compared to just 12.7% in the U.S. overall.6 The median household income in Puerto Rico over 2011-2015 was $19,350, almost one-third the median household income in the US overall ($53,889).7 The unemployment rate was estimated at 10.1%, a figure more than two times higher than that for US overall (4.1%).8
The health care system also faced challenges. Puerto Ricans were much less likely to have employer sponsored health insurance compared to rest of the U.S. (35% compared to 60%) and more likely to rely on Medicaid (49% compared to 20%), though a smaller proportion were uninsured (6% compared to 9%). Unlike the 50 US states and Washington, DC, Medicaid spending in Puerto Rico has been subject to a statutory cap, which means that under normal circumstances once federal funds are exhausted, the island no longer receives financial support for its Medicaid program for that fiscal year.9 Many residents of Puerto Rico access primary health care services through community health centers (CHCs), which rely heavily on federal Medicaid funding; there were 93 CHCs in Puerto Rico before the storm serving over 350,000 residents on the island, primarily in rural areas.10 In one indicator of basic health care access, the Health Resources and Services Administration (HRSA) estimated that at the end of 2016, there were just over 19,000 people living in primary “healthcare provider shortage areas” (HPSAs) with just 32% of the need for physicians in these areas being met.11
Basic health statistics in Puerto Rico also indicate that the island faced significant health concerns even before the storm. Puerto Ricans were much more likely to report having fair or poor general health compared to the U.S. overall (34% compared to 18%). The percentage of people living with a disability (estimated for 2011-2015) was 15.4% compared to 8.6% in the U.S. overall.12 Puerto Rico had a higher percentage of low-birthweight infants and a higher infant mortality rate compared to the US overall. The prevalence of diabetes was 50% higher in Puerto Rico compared to the rest of the U.S., including a death rate due to diabetes that was more than three times higher.13 The HIV death rate in Puerto Rico was nearly four times higher than that of the U.S. overall, and second highest of any state, territory, or federal district in the country (after Washington D.C.) in 2014. The number of people living with HIV in Puerto Rico in 2014 was estimated at 17,072, which represented one of the highest rates of people living with HIV per 100,000 in the U.S.
Puerto Rico has also seen outbreaks of mosquito-borne viral diseases over the last several years, including dengue, chikungunya, and Zika. Zika was first detected on the island in December 2015, and since that time Puerto Rico has reported the vast majority (84%) of all U.S. Zika cases. In 2016, the island experienced almost 35,000 symptomatic cases of Zika infection, compared with 6,218 cases in the rest of the U.S. and territories.14 So far in 2017 there have been far fewer Zika cases in Puerto Rico; 476 infections were reported through October (433 cases were reported in the rest of the U.S./territories). Some public health experts believe the decline in cases stems from the fact that a large proportion of the population was infected earlier and is now immune, creating a level of “herd immunity.”15 Still, the potential for further Zika outbreaks does exist. Other endemic infectious diseases of concern in Puerto Rico include leptospirosis, a serious, sometimes fatal bacterial infection usually transmitted via exposure to contaminated surface water.
Post-Hurricane Public Health Status
Hurricane Maria has significantly damaged key transportation, communication, and electricity infrastructure across the island which in turn have exacerbated already challenged health conditions. Immediately after the hurricane, there was virtually no electricity, available water, or transportation access on the island. On October 12, three weeks after the hurricane struck, only 392 miles of Puerto Rico’s 5,073 miles of roads were open according to the Federal Emergency Management Agency;16 it is unclear how many of the islands’ roads remain impassible now. Damage to cell towers and antennae, still being repaired, has left a reported 28% of people without telecommunication access as of November 8. While access to electricity has been increasing, it stood at 43% on November 16 (by comparison, the percent of population with access to electricity at the global level is over 80%; the country with the lowest access in the world, Papua New Guinea, has 40%); the remainder rely on generators or go without power. The ongoing power outage on the island has been named the “largest blackout in American history”.17 On November 9 and again on November 14, major power outages following power line failures and technical issues at the main power plant left 80% of the island without power, underscoring systemic weaknesses in the power grid.18,19 The goal of the Puerto Rico government is to be able to restore power to 50 percent of the population by the end of November, and power to all by spring or summer 2018.
With these broader issues in mind, major public health concerns on Puerto Rico post-hurricane include the following:
Mortality
The official death toll on Puerto Rico from Hurricane Maria, as of November 4, stood at 55, primarily from more immediate impacts, but this is widely understood to be an underestimate.20,21,22 Officials have stated that there were 472 additional deaths in September 2017 compared to September 2016, though the cause of many of these excess deaths or their potential link to the hurricane has not been certified.23 Barriers to an accurate and updated accounting of deaths include insufficient resources and challenges in transportation, communication, and organization in confirming and certifying causes of death. The official count of the number of deaths caused by the Hurricane is likely to increase over time as more deaths and their causes are counted and confirmed and longer term health complications set in.
Food, Water and Sanitation
Many island residents have had difficulties accessing groceries and fresh food, relying on meals provided by FEMA, the Red Cross, World Central Kitchen, and other entities. According to Puerto Rico officials, emergency responders are still providing 1 million meals per day on the island as of the first week of November.24 Lack of access to adequate food results in malnutrition, which can cause and exacerbate other health issues.
Right after the storm, access to water was minimal, with water treatment and pumping stations knocked out by the storm. Even by October 1, almost two weeks later, it was still at less than 50%. Since that time, access has increased slowly (see Figure 1). As of November 16, Puerto Rico’s water authority reports that 91% of the population had access to water, leaving about 9% (about 300,000 people) still without access. While the percentage with access in Puerto Rico has been improving over time (see Figure 1), it is still variable across the territory. San Juan metro region has the highest percentage with access to potable water (97%), while the West region has the lowest (86%). While the water authority reports the water is safe to drink, the Puerto Rico health department is still recommending residents boil or otherwise disinfect all water before drinking or cooking.
Some of those without access to safe water have been using natural fresh water sources such as ponds, lakes, and streams. Ingesting or other exposure to untreated fresh surface water is potentially dangerous due to possible contamination with disease-causing microbes. While no official case numbers are available, there are many reports in the media, from health care providers on the island, and from government officials that there has been an increase in conditions related to unclean water, ranging from vomiting and diarrhea to conjunctivitis (pink eye), scabies and asthma.25,26 In addition, by the end of October Puerto Rico had already reported 121 cases and 4 confirmed deaths from leptospirosis since the hurricane (compared to about 60 cases in total in a regular year)2728 One difficulty in diagnosing infectious diseases is that public health laboratory testing on the island has been interrupted due to damage from the storm.29
Figure 1: Percent of Puerto Rico’s Population with Access to Potable Water, October 1 – November 16, 2017
Another concern is the leaching of raw sewage or other contamination into drinking water sources. A reported 20 of the island’s 51 sewage treatment plants were out of service as of October 17, due mainly to lack of power. As a result, sewage has been identified as contaminating sources people are using for drinking water.30 In addition, the water authority briefly distributed water taken from a well at an EPA-designated groundwater contamination (“Superfund”) site,31 but this is no longer the case. Authorities have barred residents from accessing water at other groundwater wells with potentially dangerous levels of chemical or other contamination.
Health Care Infrastructure
Hospitals and other health care infrastructure suffered extensive damage from the storm, and most hospitals were left without electricity and with limited access to generators with fuel. Only three major hospitals were functioning on the island three days after the hurricane, but repair has progressed since then. At this point, while all hospitals tracked by the Puerto Rico government are open and functioning, 26 of the 65 hospitals (40%) with available information were still running on generators rather than regular electric power as of November 8.32 This means power may be available on an intermittent or limited basis (especially when generators fail or run out of fuel), which can result in the need to rely on alternative light sources such as flashlights when conducting surgery or providing other medical care.33,34 Community health Centers (CHCs) have also been affected by the storm, with 10 of the 93 (11%) CHC sites reported closed as of October 20 (four weeks after the hurricane); it is unclear how many remain closed currently.35
Given the high burden of diabetes on Puerto Rico, dialysis centers are an important part of the health care system. Almost all of the island’s 47 dialysis centers lost power after the Hurricane, though most of these centers have now re-opened. Still, many dialysis centers do not have regular electrical power and must rely on generators. Generator power has failed at some dialysis centers, and patients have been transported to other areas (including some to the continental U.S.) for treatment.36
In another indicator of the challenges faced by Puerto Ricans in accessing health care on the island, the latest estimates from HRSA indicate that 1,689,212 people – almost half of the population –lived in HPSAs as of November 7, with less than 2% of the need for physicians being met.37
Other Infectious Diseases
As mentioned above, Puerto Rico faces a number of endemic mosquito-borne diseases such as Zika, dengue, and chikungunya. Although it is common for mosquito populations to increase in the weeks after major rain events, raising the potential risk for mosquito-borne disease outbreaks, at this time there is no evidence that the island is experiencing any large-scale outbreaks of these diseases. Likewise, Puerto Rico faced a significant public health challenge from HIV prior to the hurricane, so there is increased concern about people living with HIV, and their access to medicines and other support services. While HIV program authorities on the island continue to face intermittent communication and power challenges, thus far no major interruptions in services have been reported or are evident and all Ryan White HIV/AIDS Program funded clinics are open.38
Mental Health
Media reports and statements from public health officials on the island indicate that many Puerto Ricans are struggling with mental health issues in the wake of the hurricane. Thirty-two suicides have been reported and demand for mental health services has increased sharply in the nearly two months since the storm struck.39 Anxiety and depression are frequently reported, even by those who never experienced these issues before. An ongoing concern is lack of access to drug treatment and and mental health services for those who need them. Mental health concerns may even increase over the coming months and years as people move beyond the immediate crisis and attempt to return to a normal life. Studies of those affected by Hurricane Katrina, for example, found that rates of mental illness remained elevated for more than a year after that disaster.40,41
Conclusion
Given the state of emergency on the island and the fact that many basic services are still not fully functioning, the full impact of the Hurricane on public health is difficult to assess. What is clear is that even before Hurricane Maria struck Puerto Rico, the island faced a host of economic and public health concerns, and that the storm exacerbated many of these challenges while introducing new ones. Concerns may change over time as the immediate crisis response transitions to recovery, and additional health issues may manifest over the longer-term. Ultimately, the public health toll from the storm on the people of Puerto Rico will depend on a number of factors including the level and effectiveness of external support, and continued attention to and funding for response and recovery from policymakers now and going forward.
Endnotes
Signifying that catastrophic damage will occur which, among other things, means that power outages will last weeks to possibly months and most of the area will be uninhabitable for weeks or months. See, http://www.nhc.noaa.gov/aboutsshws.php. ↩︎
Information summarized from: See: Institute of Medicine (2015). Healthy, Resilient, and Sustainable Communities After Disasters: Strategies, Opportunities, and Planning for Recovery. The National Academies Press. https://doi.org/10.17226/18996; Chandra A, et al (2011). Building Community Resilience to Disasters: A Way Forward to Enhance National Health Security. RAND Technical Report. https://www.rand.org/content/dam/rand/pubs/technical_reports/2011/RAND_TR915.pdf; Institute of Medicine (2007). Environmental Public Health Impacts of Disasters: Hurricane Katrina Workshop Summary. National Academies Press. https://doi.org/10.17226/11840; Morbidity and Mortality Weekly Report (2006). January 20, 2006 / 55(02);29-30; Malilay J (1997). Tropical cyclones. In: Noji EK, ed. The public health consequences of disasters. Oxford University Press, 1997:207–27; Kleinpeter MA, Norman LD, Krane NK (2006). Dialysis services in the hurricane-affected areas in 2005: lessons learned. American Journal of Medical Science 332(5):259-63. ↩︎
CDC. Advice for Providers Treating Patients in or Recently Returned from Hurricane-Affected Areas, Including Puerto Rico and US Virgin Islands. October 24, 2017. https://emergency.cdc.gov/han/han00408.asp. ↩︎
Rhodes J, et al (2010). The Impact of Hurricane Katrina on the Mental and Physical Health of Low-Income Parents in New Orleans. American Journal of Orthopsychiatry. 80(2): 237–247. ↩︎
This month marks the start of the ACA’s fifth open enrollment period for individuals who purchase health plans on their own. The November Kaiser Health Tracking Poll finds three in ten of the public saying they haven’t heard anything at all about the current open enrollment period. Three in ten Americans say they have heard “a little” while four in ten say they have heard either “some” (21 percent) or “a lot” (18 percent). About half of the public (45 percent) say they have heard less about open enrollment this year compared to previous years while four in ten (38 percent) say they have heard “about the same amount.”
Half think that if fewer people sign up for health insurance this year it is mainly because of the actions taken by the Trump administration, while four in ten (37 percent) say it is mainly because the Obama administration and Democrats in Congress designed a flawed program. These attitudes are largely driven by party identification with eight in ten Democrats (78 percent) saying fewer sign-ups would mainly result from actions of the Trump administration and three-fourths of Republicans placing blame on the flawed program designed by the Obama administration and Democrats.
Poll: 61% of public says President Trump and Republicans in Congress are responsible for the ACA going forward
The public are divided in their view of the ACA with similar shares of the public holding favorable views (50 percent) as unfavorable views (46 percent). These attitudes are largely partisan with eight in ten Republicans (81 percent) reporting an unfavorable opinion of the law and eight in ten Democrats (80 percent) reporting a favorable opinion. Despite their overall views of the ACA, the majority of the public (61 percent) – including most Democrats (71 percent), independents (58 percent), and half of Republicans (52 percent) – say that because President Trump and Republicans in Congress are now in control of the government, they are responsible for any problems with the health care law moving forward.
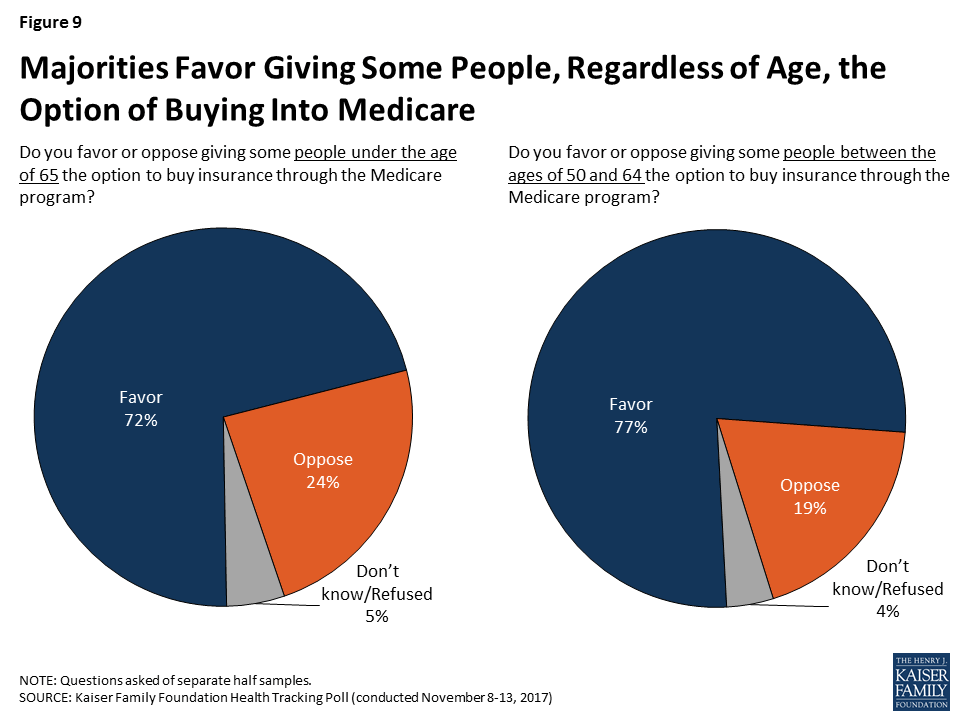
This month’s tracking poll also examines public support for two variations of a Medicare buy-in proposal. More than seven in ten of the public favors both proposals with a slightly larger share favoring a proposal that would limit the Medicare buy-in option to those between the ages of 50 and 64 years old (77 percent compared to 72 percent who support a buy-in for people of all ages). While there has not yet been a large-scale public debate on a Medicare buy-in proposal, these results provide some indication of where opinions would land if either of these proposals gains prominence.
President Trump and the Affordable Care Act
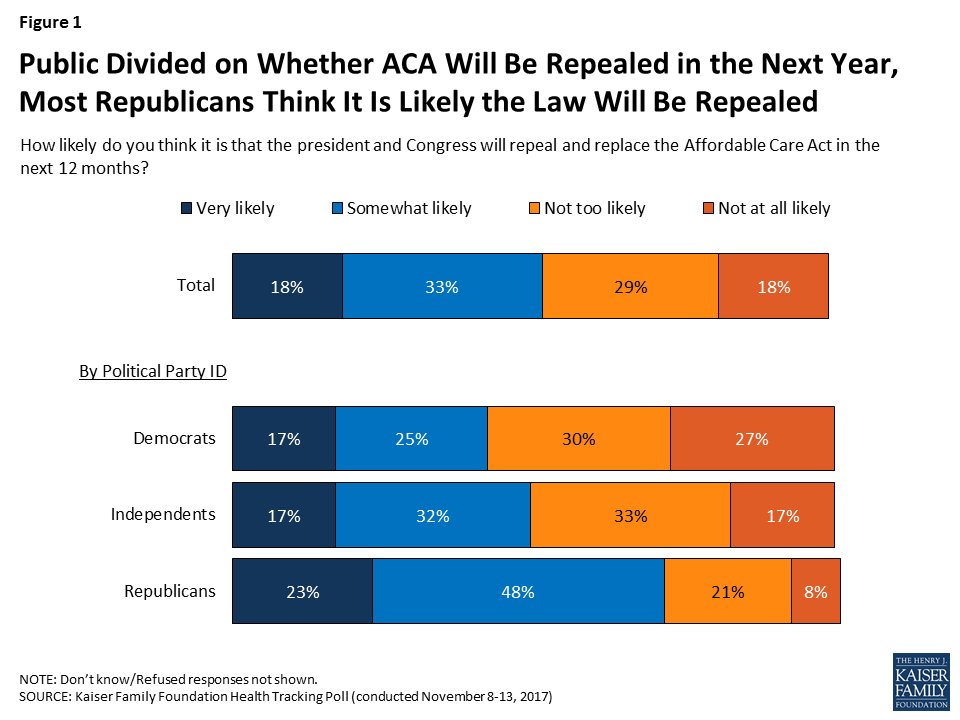
The November Kaiser Health Tracking Poll finds that while repealing the 2010 Affordable Care Act (ACA) is viewed as a lesser priority among the overall public, it is still seen as a top priority for President Trump and Congress by half of Republicans but falls behind other priorities such as strengthening immigration controls (69 percent) and providing funding for places in the U.S. affected by hurricanes (52 percent). Half of the public (51 percent) – including seven in ten Republicans – think it is either “very likely” or “somewhat likely” that the president and Congress will repeal the ACA in the next 12 months.
Figure 1: Public Divided on Whether ACA Will Be Repealed in the Next Year, Most Republicans Think It Is Likely the Law Will Be Repealed
Majority of Republicans Trust President Trump to do What’s Best When it Comes to Health Care
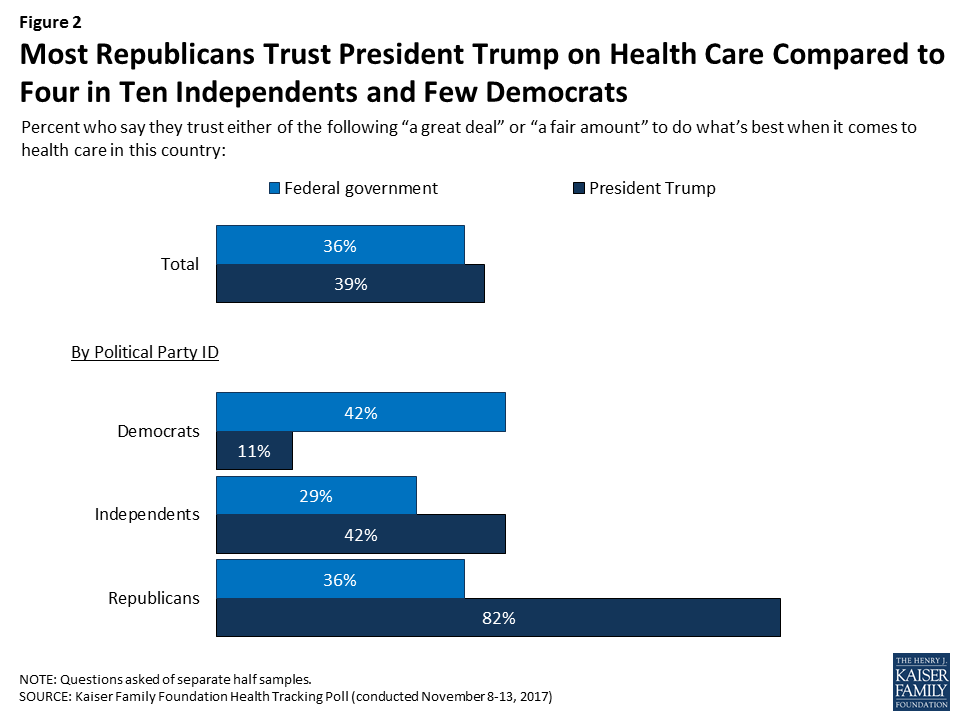
This month’s tracking poll examines who the public trust to do what’s best for the country when it comes to health care. When comparing trust in President Trump to the overall federal government when it comes to health care, larger shares of Republicans and independents trust President Trump at least a fair amount (82 percent and 42 percent) compared to the federal government (36 percent and 29 percent). On the other hand, four in ten Democrats (42 percent) say they trust the federal government while a much smaller share (11 percent) say they trust President Trump to do what’s best when it comes to health care in this country.
Figure 2: Most Republicans Trust President Trump on Health Care Compared to Four in Ten Independents and Few Democrats
The majority of the public (60 percent) – including majorities of Democrats (89 percent) and independents (57 percent) – do not trust President Trump to do what’s best when it comes to health care in this country. When it comes to the federal government more generally, majorities across parties do not trust the federal government to do what’s best (58 percent of Democrats, 64 percent of Republicans, and 70 percent of independents).
Table 1: Trust in President Trump and Federal Government in Health Care by Party Identification
How much do you trust …to do what’s best when it comes to health care in this country?
Total
Party ID
Democrats
Independents
Republicans
…President Trump…
A great deal
18%
8%
15%
43%
A fair amount
20
3
27
39
Not very much
21
26
26
9
Not at all
39
63
31
8
…the federal government…
A great deal
9
12
9
7
A fair amount
27
30
20
28
Not very much
33
34
32
38
Not at all
30
24
38
26
NOTE: Don’t know/Refused responses not shown.
Views of the ACA And Who Is Responsible for the Law Continue to be Driven by Party Identification
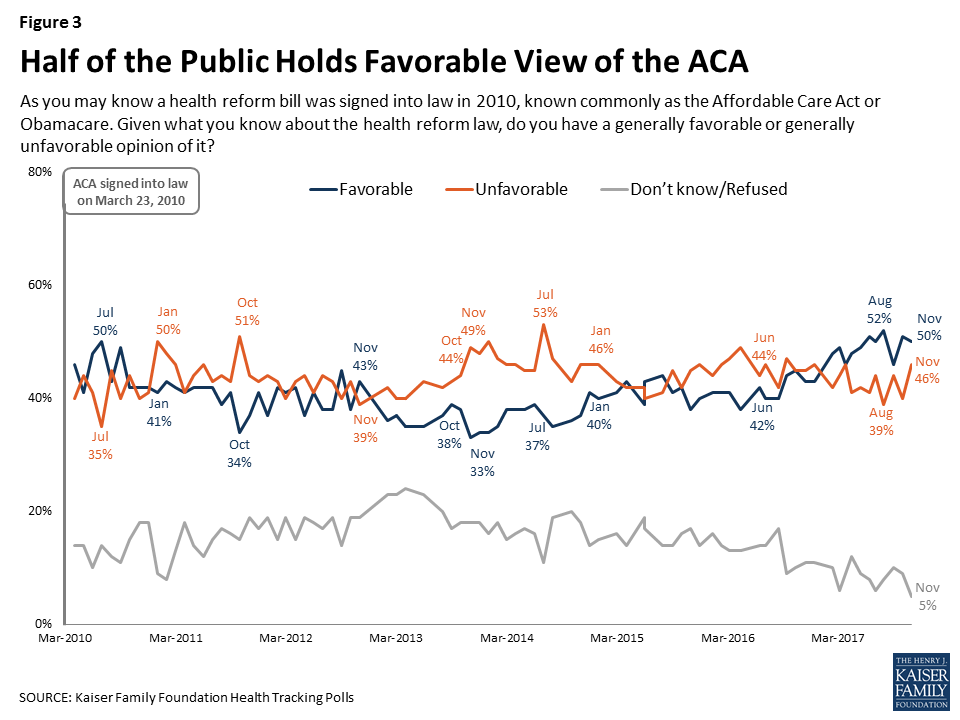
This month’s tracking poll finds the public divided in its view of the ACA, with similar shares of the public holding favorable views (50 percent) as unfavorable views (46 percent). These attitudes are highly partisan with eight in ten Republicans (81 percent) reporting an unfavorable opinion of the law and eight in ten Democrats (80 percent) reporting a favorable opinion. Independents remain divided in their views towards the law (50 percent hold an unfavorable view while 43 percent hold a favorable view).
Figure 3: Half of the Public Holds Favorable View of the ACA
Most Know ACA Is Still in Effect
With recent talk of ACA repeal and President Trump making statements declaring the law to be “dead” and “finished,”1 some of the public may be confused about whether the law remains in effect. The November poll finds about eight in ten (78 percent) of the public are aware that the ACA is still in effect while one in ten (12 percent) incorrectly say the law has been repealed and is no longer in effect and 10 percent are not sure. The share who are aware the law is still in effect has decreased somewhat from August 2017 (five percentage points).
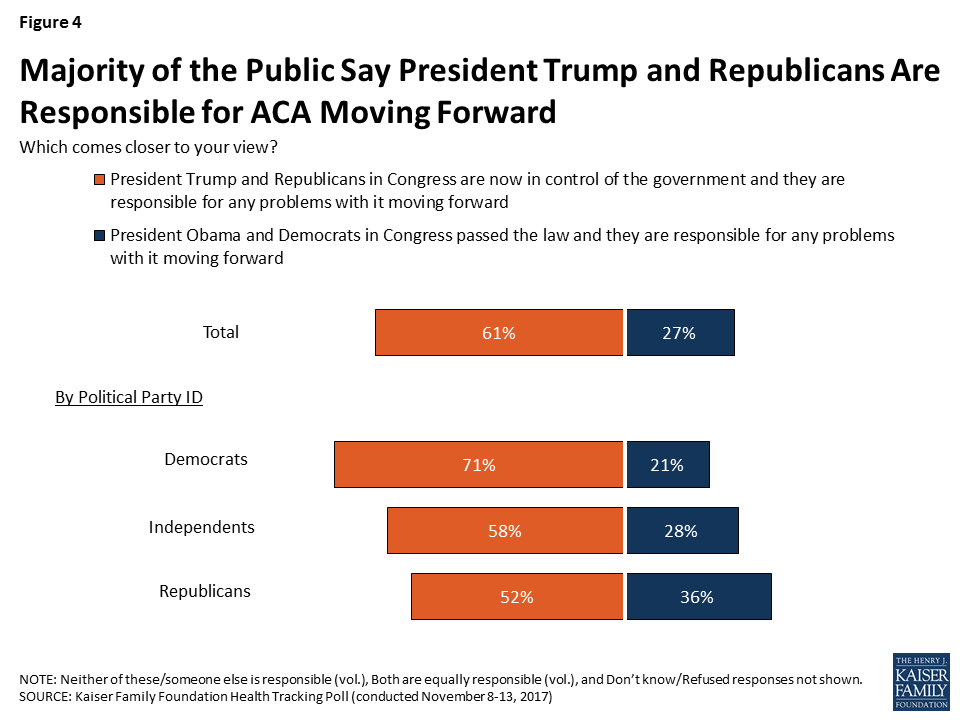
Despite their overall views of the ACA, the majority of the public (61 percent) – including most Democrats (71 percent), independents (58 percent), and half of Republicans (52 percent) – say that because President Trump and Republicans in Congress are now in control of the government, they are responsible for any problems with the health care law moving forward. Fewer (27 percent) say that because President Obama and Democrats in Congress passed the law, they are responsible for any problems with it.
Figure 4: Majority of the Public Say President Trump and Republicans Are Responsible for ACA Moving Forward
The Affordable Care Act’s 2018 Open Enrollment
This month marks the start of the ACA’s fifth open enrollment period for individuals who purchase health plans on their own. According to the Centers for Medicare and Medicaid Services, 876,788 people signed up for insurance through the federal marketplace through the second week, which is slightly more than in previous years.2
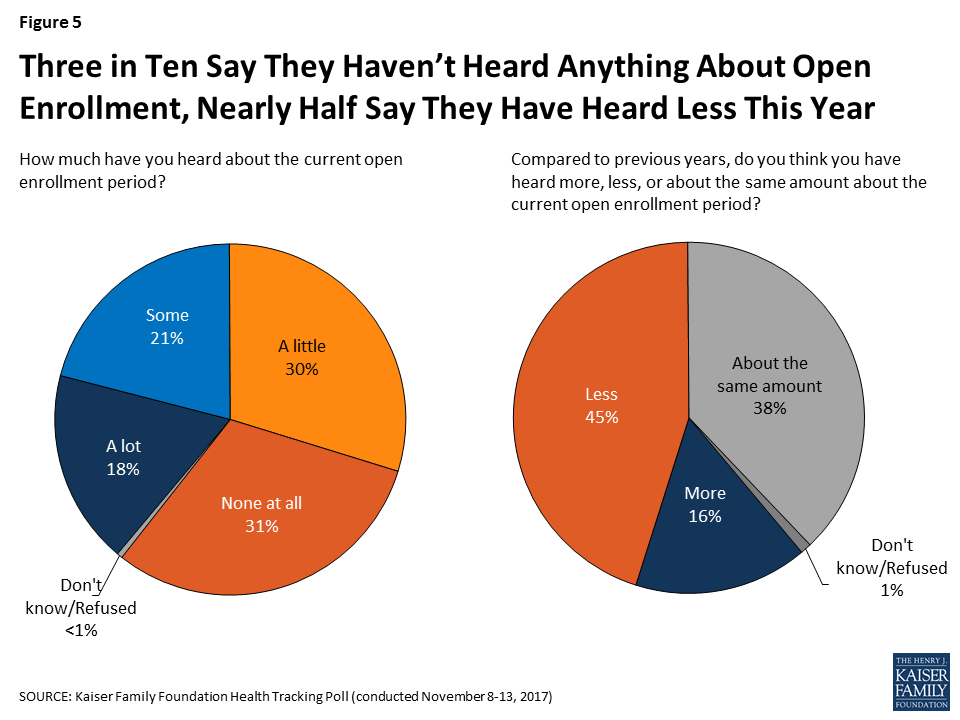
Three in ten (31 percent) of the public say they haven’t heard anything at all about the current open enrollment period – including three in ten uninsured Americans. Three in ten Americans say they have heard “a little” while four in ten say they have heard either “some” (21 percent) or “a lot” (18 percent). Half of the public (45 percent) and the uninsured (52 percent) say they have heard less about open enrollment this year compared to previous years, while four in ten of the public (38 percent) and one-third of the uninsured (34 percent) say they have heard “about the same amount.” There are no differences across Democrats, independents, and Republicans, with pluralities of all partisans saying they have heard less this year compared to previous years.
Figure 5: Three in Ten Say They Haven’t Heard Anything About Open Enrollment, Nearly Half Say They Have Heard Less This Year
Compared to last month’s Kaiser Health Tracking Poll, a larger share of the public now say they have heard or seen advertisements either from an insurance company or that provided information about how to get health insurance. Between October and November, the share who say they saw ads in the past 30 days from an insurance company attempting to sell health insurance increased slightly from from 34 percent to 41 percent, while the share who say they saw ads that provided information about how to get health insurance under the ACA increased from 20 percent to 32 percent.
Figure 6: Larger Share of the Public, But Still Not a Majority, Report Seeing Ads Related to Health Insurance in the Past Month
Who Is To Blame if Fewer People Enroll in Health Insurance?
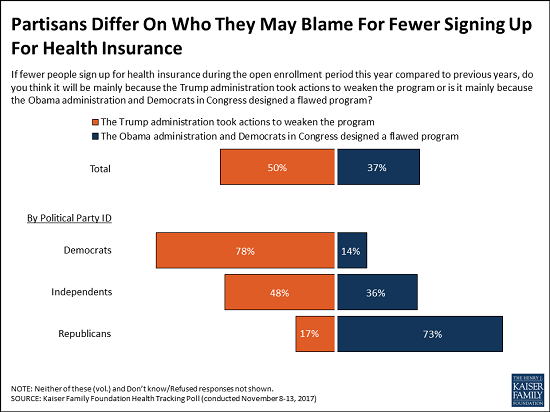
Some experts are concerned that fewer people may sign up for health insurance from the ACA marketplaces this year because of a shorter enrollment period and decreased outreach from the Trump administration. Half of the public think that if fewer people sign up for health insurance this year, it will mainly be because of the actions taken by the Trump administration, while nearly four in ten (37 percent) say it will mainly be because the Obama administration and Democrats in Congress designed a flawed program. These attitudes are largely driven by party identification with eight in ten Democrats (78 percent) blaming actions taken by the Trump administration and while three-fourths of Republicans (73 percent) blaming flaws in the program designed by the Obama administration and Democrats in Congress. A larger share of independents think that if fewer people sign up this year, it will be mainly because of the actions of the Trump administration (48 percent) rather than because Democrats designed a flawed program (36 percent).
Figure 7: Partisans Differ On Who They May Blame For Fewer Signing Up For Health Insurance
Medicare
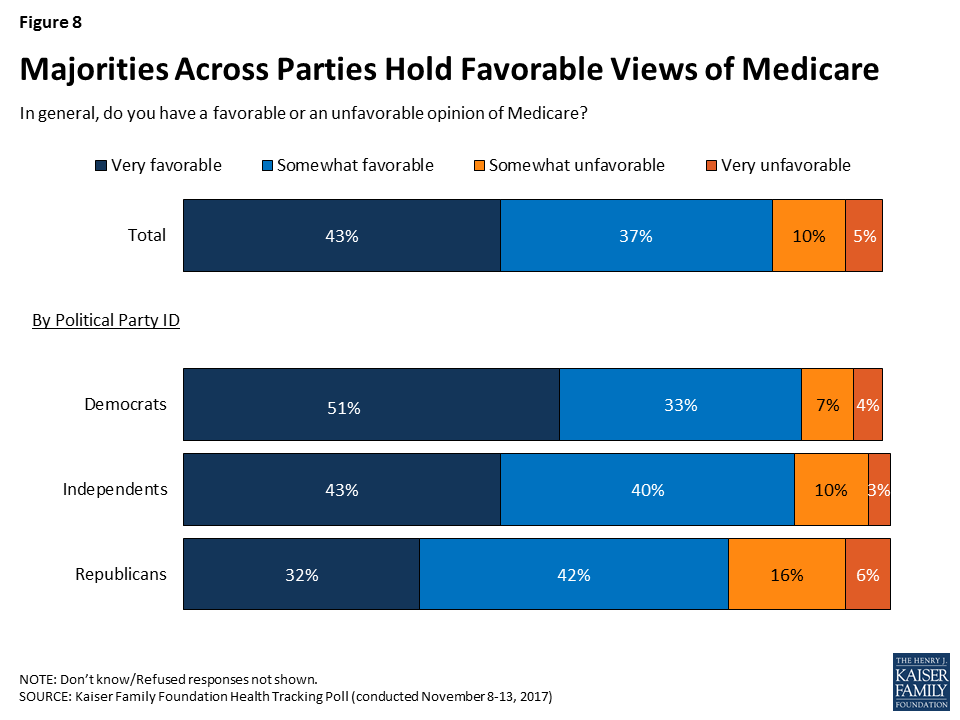
While attitudes towards the ACA are largely driven by party identification, opinions towards Medicare, the government health insurance program for adults 65 or older and for younger adults with long-term disabilities, are positive across partisans. Overall, a majority of the public (80 percent) and most Democrats (85 percent), independents (83 percent), and Republicans (74 percent) hold favorable views towards Medicare.
Figure 8: Majorities Across Parties Hold Favorable Views of Medicare
Medicare Buy-In Proposal
One proposal being put forth by Democratic lawmakers is to allow individuals under the age of 65 to buy health insurance through Medicare. This month’s tracking poll examined public support for two variations of this proposal: allowing some individuals under the age of 65 to buy into the Medicare program and allowing individuals between the ages of 50 and 64 to buy into the Medicare program. More than seven in ten of the public favors both proposals, with a slightly larger share favoring the proposal that limits a Medicare buy-in option to those between the ages of 50 and 64 years old (77 percent compared to 72 percent).
Figure 9: Majorities Favor Giving Some People, Regardless of Age, the Option of Buying Into Medicare
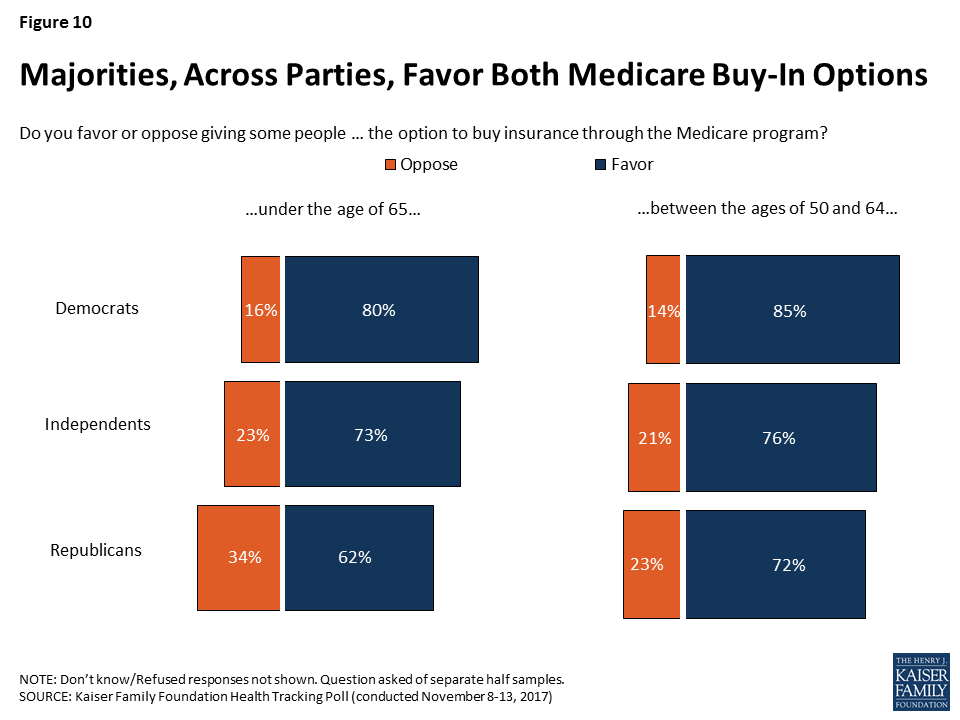
Among Republicans, a majority also favor both proposals, with a larger share saying they favor the option of allowing individuals between the ages of 50 and 64 years old to buy into Medicare (72 percent) than the option without an age restriction (62 percent).
Figure 10: Majorities, Across Parties, Favor Both Medicare Buy-In Options
The Malleability of Attitudes Towards Medicare Buy-In Proposal
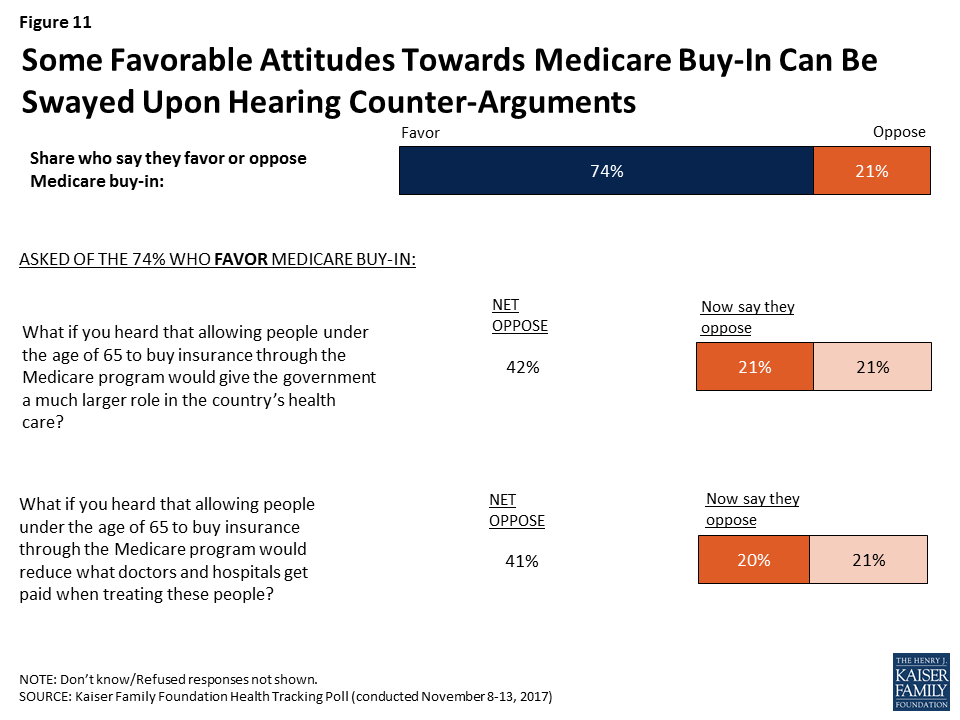
While there has not yet been a large-scale public debate on a Medicare buy-in proposal, there is some indication of where these opinions would land if either of these proposals becomes part of the public debate. Among the three-fourths of the public who favor a Medicare buy-in proposal (either one with an age restriction or not), about a quarter change their minds after hearing that allowing people to buy into Medicare could give the government a much larger role in the country’s health care system (21 percent of the public, overall) or hearing that it could reduce what doctors and hospitals get paid when treating these people (20 percent of the public, overall). Majorities of the public continue supporting a Medicare buy-in even after hearing counter-arguments.
Figure 11: Some Favorable Attitudes Towards Medicare Buy-In Can Be Swayed Upon Hearing Counter-Arguments
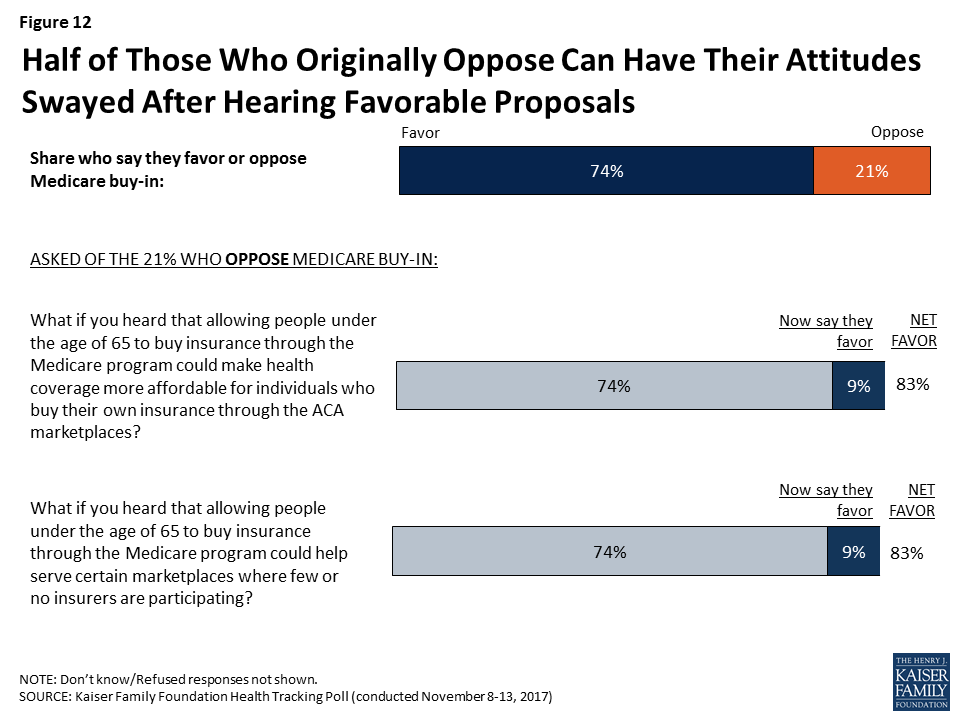
On the other hand, among the share of the public who initially opposed a Medicare buy-in proposal, about four in ten change their minds after hearing that allowing people to buy into Medicare could make health coverage more affordable for individuals who buy their own insurance through the ACA marketplaces (9 percent of the public, overall) or that this could help serve certain marketplaces where few or no insurers are participating (9 percent of the public, overall).
Figure 12: Half of Those Who Originally Oppose Can Have Their Attitudes Swayed After Hearing Favorable Proposals
The Impact of Labels on Support for Health Care Policies
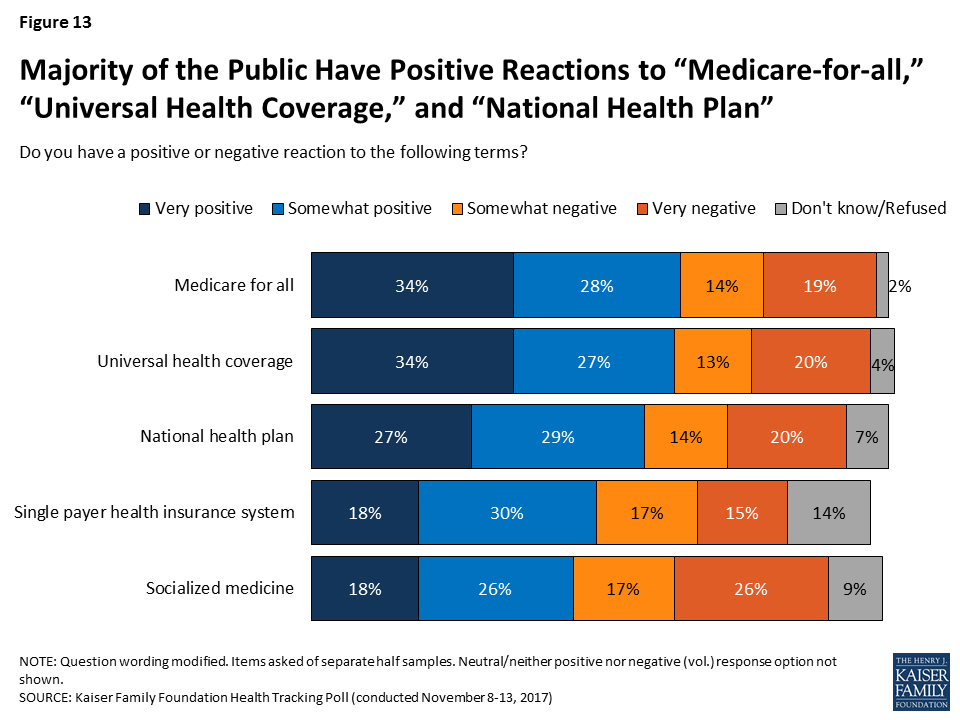
Politicians have long been using a variety of terms to describe the idea of expanding health insurance coverage to all Americans including recent discussion of “Medicare-for-all” during the 2016 presidential election. This month’s tracking poll explores the public’s reaction to a few of these terms and finds six in ten of the public say they have a positive reaction to the term “Medicare-for-all” (62 percent), “universal health coverage” (61 percent), and “national health plan” (57 percent). Fewer report a positive association to “single payer health insurance system” (48 percent) or “socialized medicine” (44 percent).
Figure 13: Majority of the Public Have Positive Reactions to “Medicare-for-all,” “Universal Health Coverage,” and “National Health Plan”
Similar to the overall public, a larger share of Democrats and independents report positive reactions to“Medicare-for-all,” “universal health coverage,” than the other terms provided. Still, a majority of Democrats say they have a positive reaction to the terms “national health plan,” “socialized medicine,” and “single payer health insurance system.” Majorities of Republicans have a negative reaction to most of these terms, with the highest share (80 percent) reacting negatively to “socialized medicine.”
Table 2: In Health Care, Reactions Vary Depending on Labeling
Do you have a positive or negative reaction to the following terms?
Party ID
Democrats
Independents
Republicans
Medicare-for-all
Positive
83%
63%
33%
Negative
13
32
64
Universal health coverage
Positive
86
59
34
Negative
9
36
61
National health plan
Positive
71
60
34
Negative
18
31
62
Single payer health insurance system
Positive
59
47
37
Negative
23
30
45
Socialized medicine
Positive
67
46
14
Negative
17
44
80
Methodology
This Kaiser Health Tracking Poll was designed and analyzed by public opinion researchers at the Kaiser Family Foundation (KFF). The survey was conducted November 8th-13th 2017, among a nationally representative random digit dial telephone sample of 1,201 adults ages 18 and older, living in the United States, including Alaska and Hawaii (note: persons without a telephone could not be included in the random selection process). Computer-assisted telephone interviews conducted by landline (415) and cell phone (786, including 482 who had no landline telephone) were carried out in English and Spanish by SSRS of Media, PA. Both the random digit dial landline and cell phone samples were provided by Marketing Systems Group (MSG). For the landline sample, respondents were selected by asking for the youngest adult male or female currently at home based on a random rotation. If no one of that gender was available, interviewers asked to speak with the youngest adult of the opposite gender. For the cell phone sample, interviews were conducted with the adult who answered the phone. KFF paid for all costs associated with the survey.
The combined landline and cell phone sample was weighted to balance the sample demographics to match estimates for the national population using data from the Census Bureau’s 2016 American Community Survey (ACS) on sex, age, education, race, Hispanic origin, and region along with data from the 2010 Census on population density. The sample was also weighted to match current patterns of telephone use using data from the July-December 2016 National Health Interview Survey. The weight takes into account the fact that respondents with both a landline and cell phone have a higher probability of selection in the combined sample and also adjusts for the household size for the landline sample. All statistical tests of significance account for the effect of weighting.
The margin of sampling error including the design effect for the full sample is plus or minus 3 percentage points. Numbers of respondents and margins of sampling error for key subgroups are shown in the table below. For results based on other subgroups, the margin of sampling error may be higher. Sample sizes and margins of sampling error for other subgroups are available by request. Note that sampling error is only one of many potential sources of error in this or any other public opinion poll. Kaiser Family Foundation public opinion and survey research is a charter member of the Transparency Initiative of the American Association for Public Opinion Research.
Poll: Half of the Public Would Blame the Trump Administration if Fewer People Enroll in Marketplace Plans This Year, and Most See President Trump and Republicans As Responsible for the ACA‘s Future
Most Republicans Trust President Trump to Do What’s Best on Health Care; Most Democrats and Independents Lack Trust in Either the President or the Federal Government
Majorities of Democrats, Independents and Republicans Would Support Allowing People Younger Than Age 65 to Buy into Medicare
Half (50%) of the public would say that if fewer people sign up for marketplace plans during this year’s open enrollment, it is mainly due to the Trump Administration, and most Americans (61%) see President Trump and Republicans as responsible for the Affordable Care Act’s future, the latest Kaiser Family Foundation poll finds.
While the public generally sees Republicans as responsible for the nation’s health care system now, there are significant partisan differences in these perceptions.
For example, most Democrats (78%) say that if fewer people enroll in marketplace plans this year, it would be because the Trump Administration took actions to weaken the marketplaces, while a similar majority of Republicans (73%) says that it would be because the Obama Administration and Democrats in Congress designed a flawed program. Independents are more likely to blame the Trump Administration’s actions (48%) than the Democrats’ flawed design (36%).
Looking toward the future, a majority of the public (61%) – including most Democrats (71%) and independents (58%), and half of Republicans (52%) – say that because President Trump and Republicans in Congress are now in control of the government, they are responsible for any problems with the health care law moving forward. Fewer (27%), including nearly four in 10 Republicans (36%), say that President Obama and Democrats in Congress are responsible because they enacted the law.
The public remains divided on its overall view of the Affordable Care Act, with similar shares holding favorable (50%) and unfavorable (46%) views. As in the past, these views largely fall along party lines.
The poll also finds a huge partisan divide in how much people trust President Trump to do what’s best for health care in this country. Eight in 10 Republicans (82%) say they trust President Trump at least a fair amount. Fewer (42%) independents and a small share of Democrats (11%) say they trust President Trump.
Large Majorities across Party Lines View Medicare Favorably; Most Would Support a Buy-in Option
While attitudes towards the Affordable Care Act and trust in President Trump are largely shaped by party identification, opinions towards Medicare, the government health insurance program for adults 65 or older and for younger adults with long-term disabilities, are positive across partisan lines. Overall, a majority of the public (80%) – including most Democrats (85%), independents (83%), and Republicans (74%) hold favorable views towards Medicare.
This month’s tracking poll also tests public support for two variations of a Medicare buy-in proposal put forward by some Democratic lawmakers: allowing some individuals under the age of 65 to buy into the Medicare program and allowing individuals between the ages of 50 and 64 to buy into the Medicare program.
Seven in 10 of the public favors both proposals with a slightly larger share of the public favoring the proposal which limited a Medicare buy-in option to those between the ages of 50 and 64 years old (77% compared to 72%). This includes majorities of Democrats, independent and Republicans (72% who favor the buy-in for people between the ages of 50-65, 62% favoring a broader buy-in). Arguments for and against a Medicare buy-in proposal changes some minds, though no single argument pushes support below a majority.
Designed and analyzed by public opinion researchers at the Kaiser Family Foundation, the poll was conducted from November 8 – 13, 2017 among a nationally representative random digit dial telephone sample of 1,201 adults. Interviews were conducted in English and Spanish by landline (415) and cell phone (786). The margin of sampling error is plus or minus 3 percentage points for the full sample. For results based on subgroups, the margin of sampling error may be higher.
Poll: Ahead of House Tax Reform Vote, Americans are More Likely to Rank Children’s Health Care, Hurricane Relief and Other Issues as Top Priorities for Washington
Controlling Immigration Tops Republicans’ Priority List, With Tax Reform among a Number of Second-Tier Issues Including Hurricane Relief and ACA Repeal
Most of the Public Initially Favors Getting Rid of the ACA’s Individual Mandate As Part of Tax Reform, But Some Become Opponents When Presented with Facts and Arguments for Keeping the Mandate
As the House prepares to vote Thursday on its tax reform bill, a new Kaiser Family Foundation poll finds almost three in 10 Americans (28%) view tax reform as a top priority for President Trump and Congress.
That’s significantly fewer than the share that say the same about reauthorizing funding for the Children’s Health Insurance
Poll: Public more likely to rank CHIP & hurricane relief than #TaxReform as top priorities for Congress
Program (62%), hurricane recovery funding (61%), stabilizing the Affordable Care Act’s insurance marketplaces (48%) and addressing the prescription painkiller epidemic (43%). Two immigration-related issues – strengthening controls to limit who enters the country (35%) and passing legislation to allow the Dreamers to legally stay (34%) – also rank higher, while a similar share (29%) say repealing the Affordable Care Act is a top priority.
Among Republicans, half (51%) say reforming the tax code is a top Washington priority, behind strengthening immigration controls (69%) but similar to the share who consider hurricane recovery funding (52%), repealing the Affordable Care Act (50%), stabilizing the insurance marketplaces (46%) and reauthorizing CHIP funding (46%) to be top priorities.
In a tweet Monday, President Trump called on Congress to end the Affordable Care Act’s individual mandate, which requires most Americans to have health insurance or pay a tax penalty and has long been the least popular provision in the law. While the House tax reform bill does not currently address the mandate, key Republican senators said Tuesday that they will include such a provision in their version of the bill.
The new poll finds that most Americans (55%) initially support eliminating the mandate as part of tax reform, while four in 10 (42%) oppose it. Most Republicans (73%) and independents (58%) support ending the mandate, while most Democrats (59%) oppose it.
Poll: Some who favor eliminating individual mandate via #TaxReform switch to oppose it after hearing facts/arguments
These views are malleable, with about a third of supporters (representing a fifth of the public overall) switching to oppose the mandate’s repeal when presented with facts and arguments about who is impacted and potential consequences of its repeal.
For example, the share who oppose eliminating the mandate can rise as high as 62 percent when initial supporters hear that most Americans get coverage through their employers or government programs that meets the mandate’s requirements. Similar majorities ultimately oppose eliminating the mandate when presented with other arguments against it, including that premiums for people who buy their own health insurance would go up, that people are exempted from the mandate if the cost of coverage takes up too much of their income and that getting rid of the mandate would result in 13 million more people being uninsured over the next 10 years, as the Congressional Budget Office has estimated.
One provision in the House bill would eliminate a tax deduction that allows people with high medical costs to deduct any medical and dental expenses that exceed 10 percent of their income. A majority (68%) of the public – including majorities of Democrats (77%), independents (66%), and Republicans (61%) oppose eliminating the tax deduction for individuals who have high health care costs.
More than four in 10 (44%) of the public think eliminating the deduction for high medical costs will affect them and their families, though in reality a much smaller share of the public uses that deduction in any given tax year. According to the Internal Revenue Service, about 17 percent of taxpayers who file itemized deductions use this deduction (approximately 6% of all taxpayers and 3% of the public).
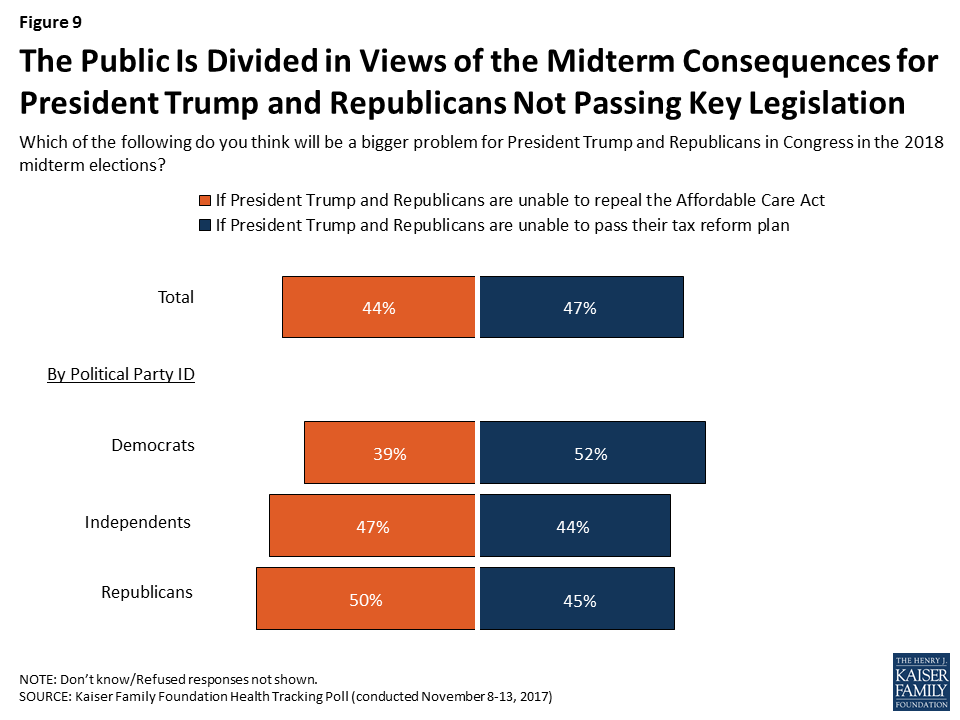
Looking ahead to the 2018 midterm elections, the public is divided over whether not passing a tax reform plan or not repealing the ACA would be a bigger deal for President Trump and Republicans. Nearly half of the public say it will be a bigger problem if the president and Republicans are unable to pass their tax reform plan (47%), similar to the share who say it will be a bigger problem if they are unable to revive a repeal of the ACA (44%). Republicans are also divided, with similar shares saying it would be a bigger deal if President Trump and Republicans are unable to repeal the ACA (50%) and if they are unable to pass tax reform (45%).
METHODOLOGY
Designed and analyzed by public opinion researchers at the Kaiser Family Foundation, the poll was conducted from November 8 – 13, 2017 among a nationally representative random digit dial telephone sample of 1,201 adults. Interviews were conducted in English and Spanish by landline (415) and cell phone (786). The margin of sampling error is plus or minus 3 percentage points for the full sample. For results based on subgroups, the margin of sampling error may be higher.
Poll: Public more likely to rank CHIP & hurricane relief than #TaxReform as top priorities for Congress
As Republicans in Congress continue efforts to pass tax reform, the November Kaiser Health Tracking Poll examines views of the plans and how they relate to health care issues. Overall, reforming the tax code is seen as a “top priority” for President Trump and Congress by about three in ten (28 percent), falling well-behind several health care issues such as reauthorizing funding for the State Children’s Health Insurance Program (CHIP) (62 percent) and stabilizing the ACA marketplaces (48 percent). Among Republicans, about half (51 percent) say reforming the tax code is a “top priority” which is similar to the share who say the same about providing funding for places in the U.S. affected by hurricanes (52 percent), repealing the ACA (50 percent), reauthorizing CHIP (46 percent), stabilizing the ACA marketplaces (46 percent), and addressing the prescription painkiller epidemic (46 percent).
One possible change in a Republican tax plan is eliminating the deduction allowed for high medical costs. The majority of the public (68 percent) – including majorities of Democrats (77 percent), independents (66 percent), and Republicans (61 percent) – oppose eliminating the tax deduction for individuals who have high health care costs. One reason why the majority of the public may oppose eliminating the tax deduction for high medical expenses is because more than four in ten (44 percent) think eliminating this tax deduction would affect them and their families.
The majority of the public (55 percent) support the idea of eliminating the requirement for all Americans to have health insurance or else pay a fine as part of the Republican tax plan. Views are largely driven by party with three-fourths of Republicans (73 percent) and six in ten independents (58 percent) supporting eliminating the individual mandate, while the majority of Democrats (59 percent) oppose eliminating the requirement as part of the Republican tax plan. Attitudes towards this idea are malleable with the share of the public who oppose eliminating the individual mandate growing to 62 percent when hearing that most people get their coverage through their employer or a public insurance program and therefore are not affected by the requirement.
Looking to the political landscape and the 2018 midterm elections, the public is divided in their views of which could prove to be a bigger deal for President Trump and Republicans in Congress: not passing a tax reform plan or not repealing the ACA. Nearly half of the public say it will be a bigger problem if the president and Republicans are unable to pass their tax reform plan (47 percent), which is similar to the share who say it will be a bigger problem if they have not repealed the ACA (44 percent). Republicans are also divided with half saying it will be a bigger problem if President Trump and Republicans are unable to repeal the ACA compared to a similar share who say it will be a bigger problem if they are unable to pass their tax reform plan (45 percent).
Current Priorities for President Trump and Congress
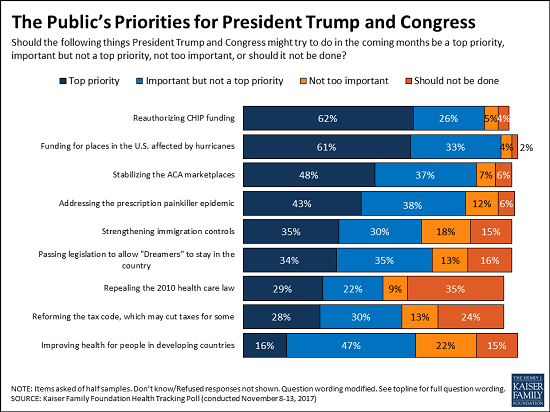
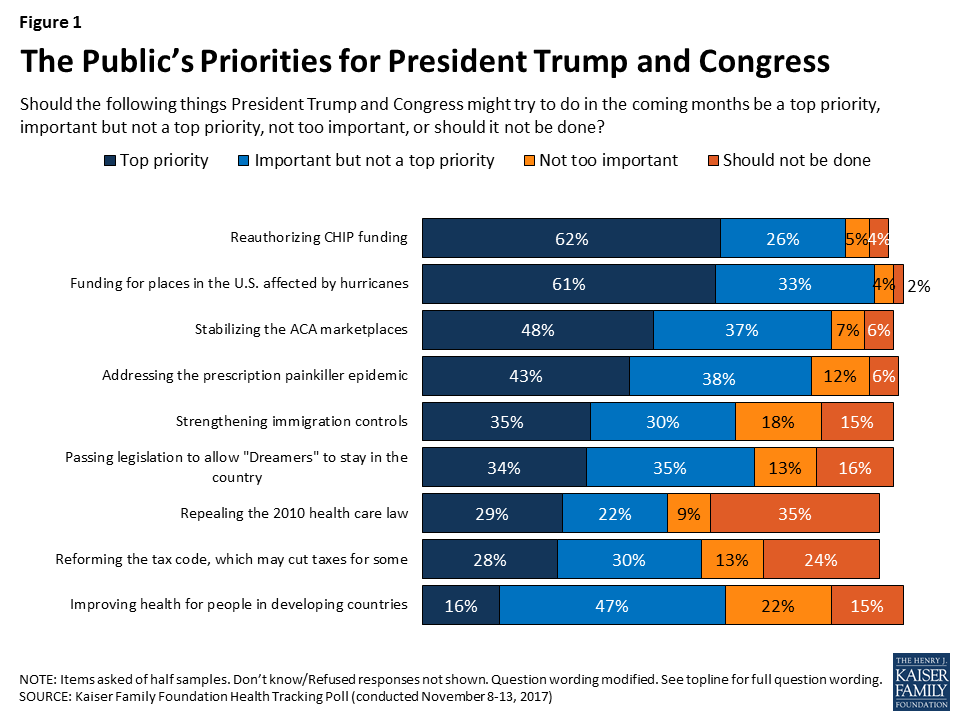
When asked about a series of things that President Trump and Congress might try to do in the coming months, about six in ten of the public say reauthorizing funding for the State Children’s Health Insurance Program (CHIP) (62 percent) and providing funding for places in the U.S. affected by hurricanes (61 percent) should each be a “top priority.” This is followed by half (48 percent) who say stabilizing the ACA marketplaces where people who don’t get health insurance through their employer can buy coverage should be a “top priority” and four in ten (43 percent) who say addressing the prescription painkiller addiction epidemic should be a “top priority” for President Trump and Congress. Other issues, like strengthening immigration controls (35 percent) and passing legislation to allow Dreamers to stay in the U.S. (34 percent) have about a third of the public reporting each should be a “top priority.”
Despite the recent attention given to the Republican tax reform plan, it falls lower on the list of the public’s priorities, with about three in ten (28 percent) saying it should be a “top priority.” It ranks similar to repealing the 2010 Affordable Care Act (ACA) with about three in ten (29 percent) saying it should be a “top priority.” The share who say repealing the 2010 health care law should be a “top priority” for President Trump and Congress has decreased over the past year (down from 37 percent in December 2016). Among Republicans, the share who say repealing the ACA is a top priority has decreased 13 percentage points over the past year, from 63 percent in December 2016 to 50 percent this month.
Figure 1: The Public’s Priorities for President Trump and Congress
Partisans Hold Differing Views on Top Priorities
Views of what should be the top priorities for the President and Congress vary across party. A majority of Democrats and independents say reauthorizing CHIP (72 percent and 65 percent) and providing funding for places in the U.S. affected by hurricanes (72 percent and 61 percent) are top priorities for the president and Congress. For Republicans, seven in ten (69 percent) say strengthening immigration controls should be a “top priority.”
Table 1: Views of Top Priorities by Party Identification
Percent who say the following should be a top priority for President Trump and Congress:
Total
Party ID
Democrats
Independents
Republicans
Reauthorizing funding for the State Children’s Health Insurance Program (CHIP)
62%
72%
65%
46%
Providing funding for places in the U.S. affected by hurricanes
61
72
61
52
Stabilizing the ACA marketplaces
48
54
45
46
Addressing the prescription painkiller addiction epidemic
43
43
42
46
Strengthening immigration controls to limit who enters the country
35
13
32
69
Passing legislation to allow “Dreamers” to legally stay in this country
34
48
36
15
Repealing the 2010 health care law
29
15
28
50
Reforming the tax code, which may cut taxes for some individuals and corporations
28
12
30
51
Improving health for people in developing countries
16
19
21
4
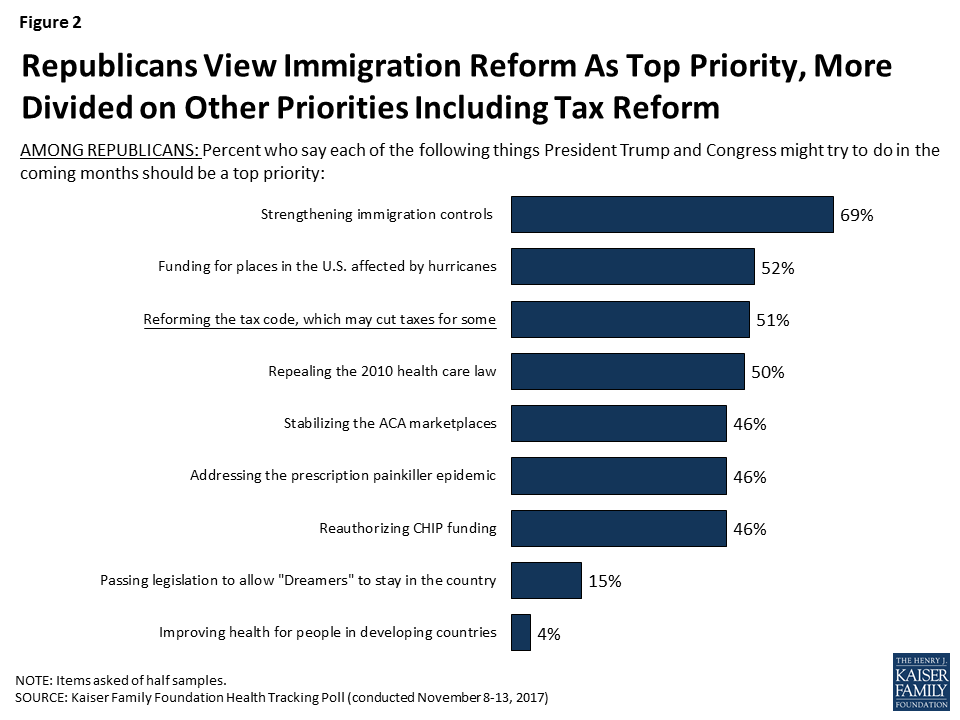
There is not another issue besides strengthening immigration controls in which a clear majority of Republicans say it should be a “top priority” for President Trump and Congress to work on in the coming months. Roughly half of Republicans say providing funding for places in the U.S. affected by hurricanes (52 percent), reforming the tax code (51 percent), repealing the ACA (50 percent), stabilizing the ACA marketplaces (46 percent), addressing the prescription painkiller epidemic (46 percent), and reauthorizing CHIP (46 percent) should each be a “top priority” for the president and Congress.
Figure 2: Republicans View Immigration Reform As Top Priority, More Divided on Other Priorities Including Tax Reform
The Republican Tax Reform Plan
In addition to overall attitudes towards the Republicans’ plan to reform the tax code, which may reduce taxes for some individuals and corporations, this month’s Kaiser Health Tracking Poll also examines attitudes towards some proposed aspects of the plan pertaining to health care.
Tax Deductions for Major Medical Costs
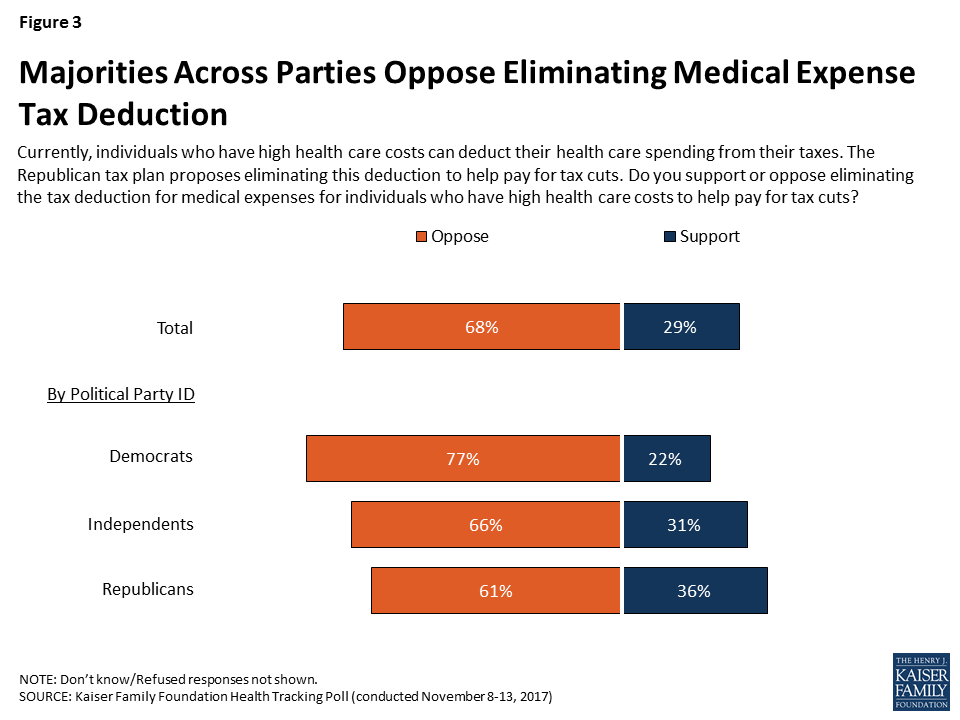
One possible change in the tax reform proposals is an elimination of the deduction allowed for high medical costs. Currently, individuals who have health care expenses exceeding 10 percent of their income are allowed to deduct their unreimbursed medical and dental expenses from their taxes. The U.S. House Republican tax plan proposes cutting this tax deduction. The majority of the public (68 percent) – including majorities of Democrats (77 percent), independents (66 percent), and Republicans (61 percent) – oppose eliminating the tax deduction for individuals who have high health care costs.
Figure 3: Majorities Across Parties Oppose Eliminating Medical Expense Tax Deduction
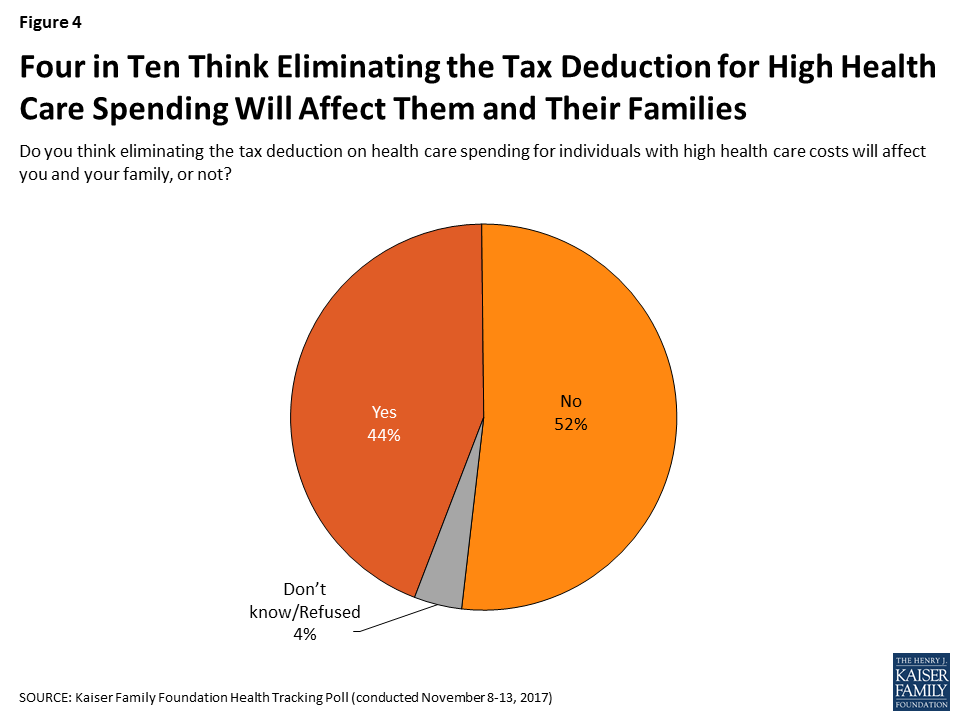
One reason why the majority of the public may oppose eliminating the tax deduction for high medical expense is because more than four in ten (44 percent) think eliminating this tax deduction will affect them and their families. According to the Tax Policy Center, about 9 million households out of 150 million (roughly six percent) claim medical expenses.1
Figure 4: Four in Ten Think Eliminating the Tax Deduction for High Health Care Spending Will Affect Them and Their Families
The Individual Mandate
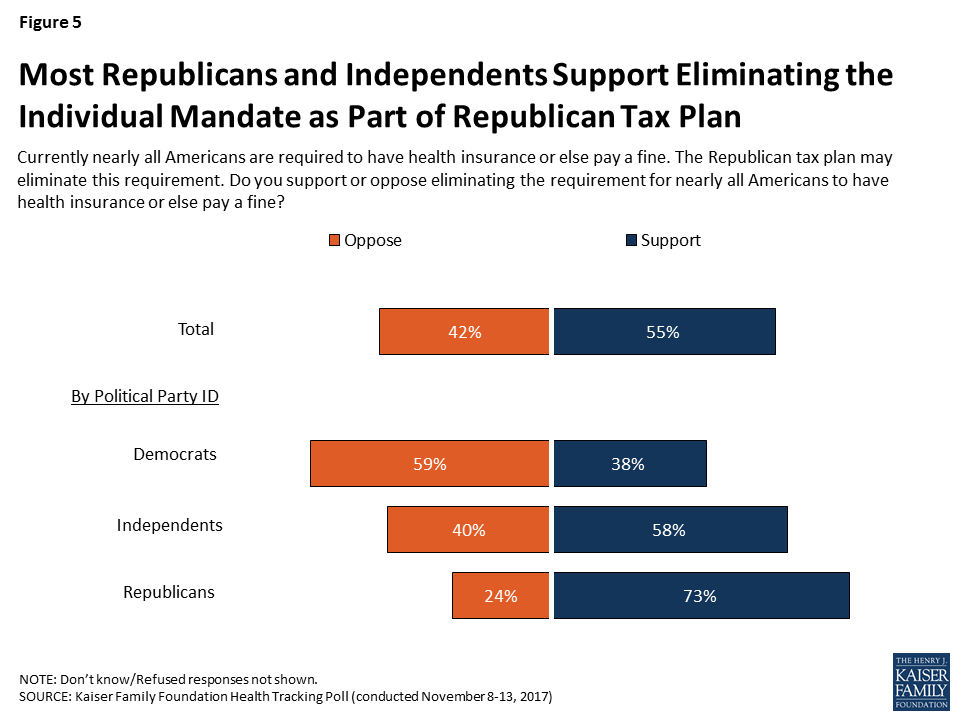
The majority of the public (55 percent) support the idea of eliminating the requirement for all Americans to have health insurance or else pay a fine as part of the Republican tax plan. Attitudes are largely driven by party with three-fourths of Republicans (73 percent) and six in ten independents (58 percent) supporting eliminating the individual mandate, while the majority of Democrats (59 percent) oppose eliminating the requirement.
Figure 5: Most Republicans and Independents Support Eliminating the Individual Mandate as Part of Republican Tax Plan
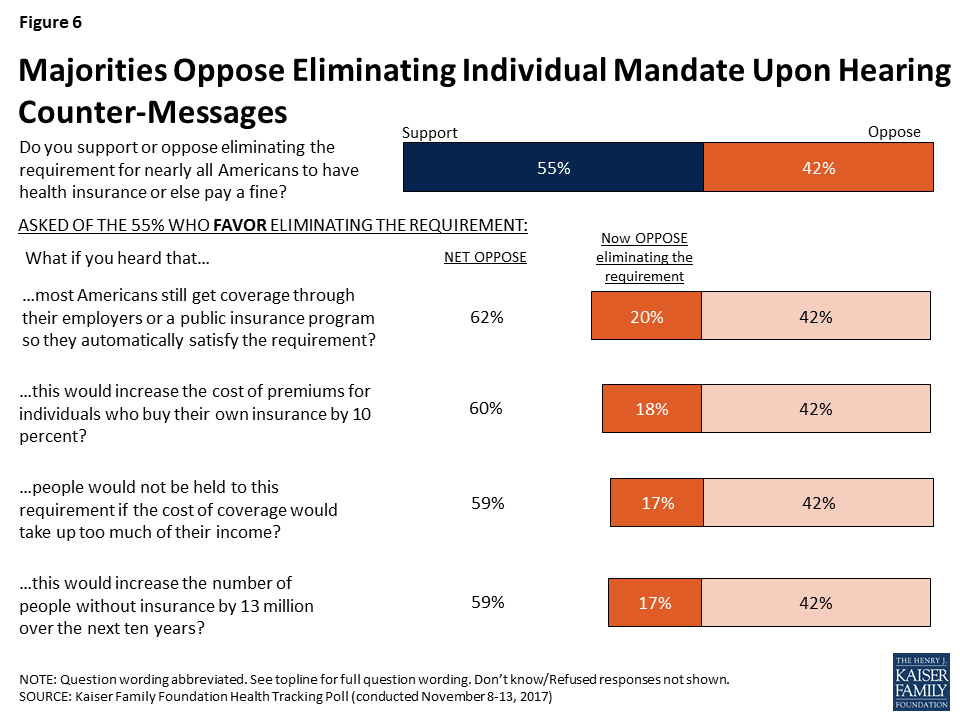
However, some of these attitudes can be swayed upon hearing counter-messages. About one-third of those who initially support eliminating the individual mandate as part of the Republican tax plan (about one in five public overall), change their view upon hearing messages about who is impacted by the mandate and the possible consequences of no longer enforcing this requirement as reported by the Congressional Budget Office.2
Poll: Some who favor eliminating individual mandate via #TaxReform switch to oppose it after hearing facts/arguments
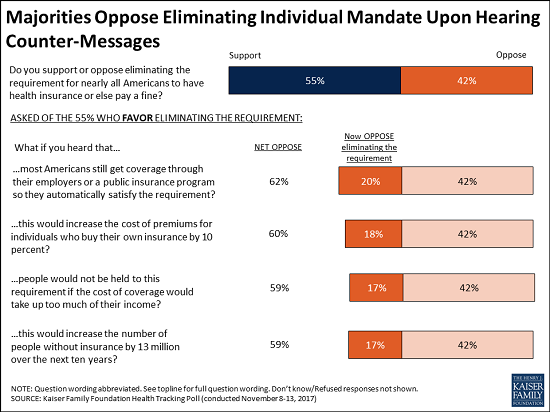
The share of the public who oppose eliminating the individual mandate can increase up to 62 percent after hearing that most people get their coverage through their employer or a public insurance program and therefore are not affected by the requirement. This is similar to the share who change their views once they hear it could increase the cost of premiums for people who by their own insurance by about 10 percent (60 percent), that people could not be held to the requirement if the cost would take up too much of their income (59 percent), or that it would increase the number of the uninsured by 13 million people over the next ten years (59 percent).
Figure 6: Majorities Oppose Eliminating Individual Mandate Upon Hearing Counter-Messages
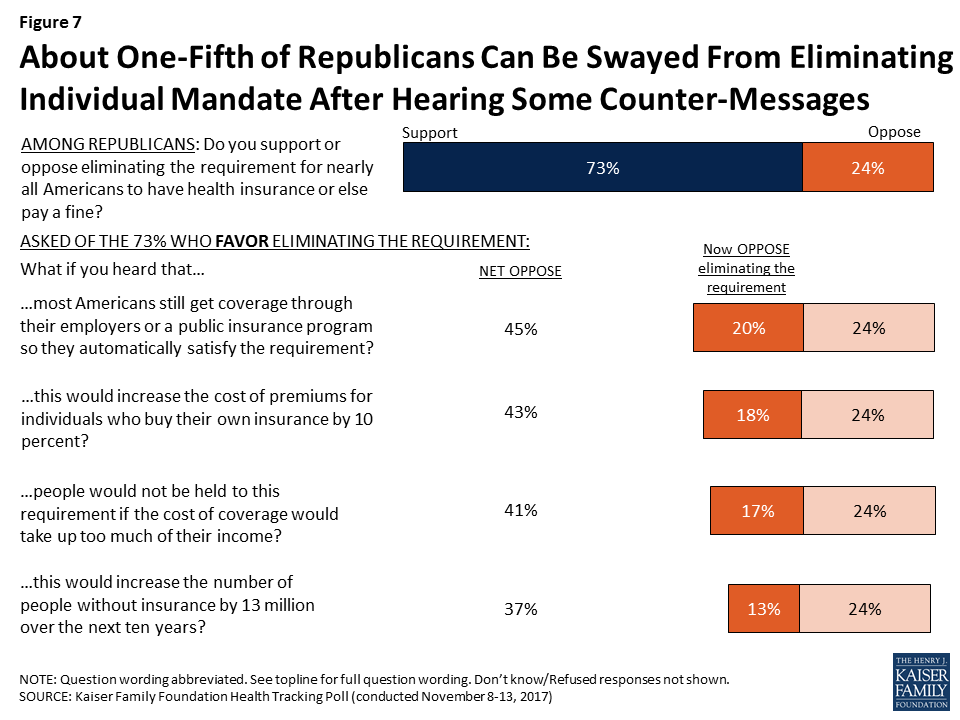
Initially, about a quarter of Republicans (24 percent) oppose eliminating the individual mandate as part of the Republican tax plan, but this increases up to nearly half (45 percent) after hearing most people are not impacted. Four in ten Republicans oppose eliminating the individual mandate after hearing that getting rid of the requirement would increase the cost of premiums for people who buy their own insurance by about 10 percent (43 percent) or that it doesn’t affect people who would be adversely affected by the cost of coverage (41 percent). Slighly fewer Republicans change their minds after hearing that getting rid of the individual mandate would increase the number of uninsured individuals (resulting in 37 percent of Republicans opposing the individual mandate).
Figure 7: About One-Fifth of Republicans Can Be Swayed From Eliminating Individual Mandate After Hearing Some Counter-Messages
Few Support Reducing Spending on Government Programs to Pay For Tax Plan
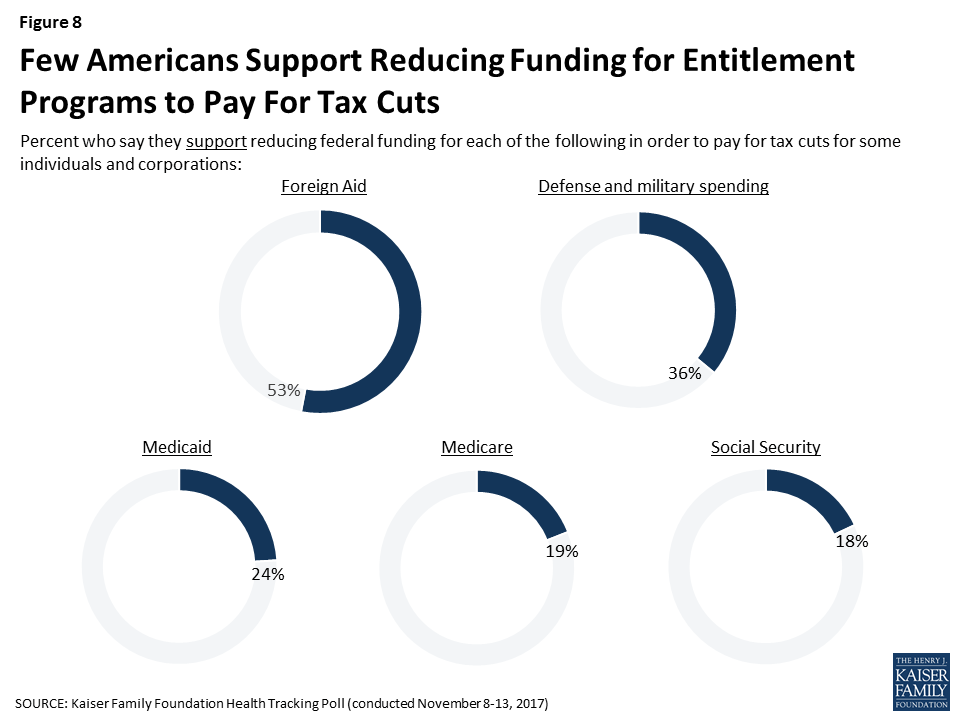
As lawmakers debate how to pay for the proposed tax plan, few Americans want to see the president and Congress decrease funding for most government programs. About half of the public (53 percent) say they support reducing federal funding for foreign aid in order to pay for the Republican tax plan. In addition, about one-third of the public (36 percent) support reducing federal funding for defense and the military to pay for the tax plan. Across Medicaid, Medicare, and Social Security – relatively few Americans, regardless of party identification, support reducing funding for these programs in order to pay for the tax cut (24 percent, 19 percent, and 18 percent, respectively).
Figure 8: Few Americans Support Reducing Funding for Entitlement Programs to Pay For Tax Cuts
Consequences of Not Passing a Tax Reform Plan or Health Care Plan before the 2018 Midterm Elections
Looking to the political landscape and the 2018 midterm elections, the public is divided in their views of which could prove to be a bigger deal for President Trump and Republicans in Congress: not passing a tax reform plan or not repealing the ACA. Nearly half of the public say it will be a bigger problem if the president and Republicans are unable to pass their tax reform plan (47 percent), which is similar to the share who say it will be a bigger problem if they are unable to repeal the ACA (44 percent). Republicans are also divided with half saying it will be a bigger problem if President Trump and Republicans are unable to revive a repeal of the ACA compared to a similar share who say it will be a bigger problem if they are unable to pass their tax reform plan (45 percent).
Figure 9: The Public Is Divided in Views of the Midterm Consequences for President Trump and Republicans Not Passing Key Legislation
Methodology
This Kaiser Health Tracking Poll was designed and analyzed by public opinion researchers at the Kaiser Family Foundation (KFF). The survey was conducted November 8th-13th 2017, among a nationally representative random digit dial telephone sample of 1,201 adults ages 18 and older, living in the United States, including Alaska and Hawaii (note: persons without a telephone could not be included in the random selection process). Computer-assisted telephone interviews conducted by landline (415) and cell phone (786, including 482 who had no landline telephone) were carried out in English and Spanish by SSRS of Media, PA. Both the random digit dial landline and cell phone samples were provided by Marketing Systems Group (MSG). For the landline sample, respondents were selected by asking for the youngest adult male or female currently at home based on a random rotation. If no one of that gender was available, interviewers asked to speak with the youngest adult of the opposite gender. For the cell phone sample, interviews were conducted with the adult who answered the phone. KFF paid for all costs associated with the survey.
The combined landline and cell phone sample was weighted to balance the sample demographics to match estimates for the national population using data from the Census Bureau’s 2016 American Community Survey (ACS) on sex, age, education, race, Hispanic origin, and region along with data from the 2010 Census on population density. The sample was also weighted to match current patterns of telephone use using data from the July-December 2016 National Health Interview Survey. The weight takes into account the fact that respondents with both a landline and cell phone have a higher probability of selection in the combined sample and also adjusts for the household size for the landline sample. All statistical tests of significance account for the effect of weighting.
The margin of sampling error including the design effect for the full sample is plus or minus 3 percentage points. Numbers of respondents and margins of sampling error for key subgroups are shown in the table below. For results based on other subgroups, the margin of sampling error may be higher. Sample sizes and margins of sampling error for other subgroups are available by request. Note that sampling error is only one of many potential sources of error in this or any other public opinion poll. Kaiser Family Foundation public opinion and survey research is a charter member of the Transparency Initiative of the American Association for Public Opinion Research.
As Open Enrollment for 2018 coverage gets underway, consumers who have health coverage through the Affordable Care Act (ACA) Marketplace are again receiving renewal notices from their health insurers. Though the insurer renewal notices are based on the same model notice required in the past, this year for many consumers, it may be causing significant – and misleading – sticker shock.
That is because renewal notices sent by insurers are required to inform consumers what their 2018 monthly premium will be, assuming they receive the same amount of advanced premium tax credit (APTC) next year that they did in 2017. Insurer renewal notices have been required to present information this way since 2014.
However, for the vast majority of consumers in the marketplace, premium tax credit amounts will increase significantly in 2018. Tax credit amounts are tied to the cost of the benchmark silver marketplace plan, which is increasing significantly in 2018 in most areas due to the termination by the federal government of cost-sharing payments to insurers. As a result, if a consumer buys a silver plan in both 2017 and 2018, assuming no change in income, her net monthly premium cost should stay about the same. But if the renewal notice estimates her 2018 monthly premium using the 2017 premium tax credit amount, in most areas the notice will mistakenly show a significant increase in what that consumer will pay for coverage.
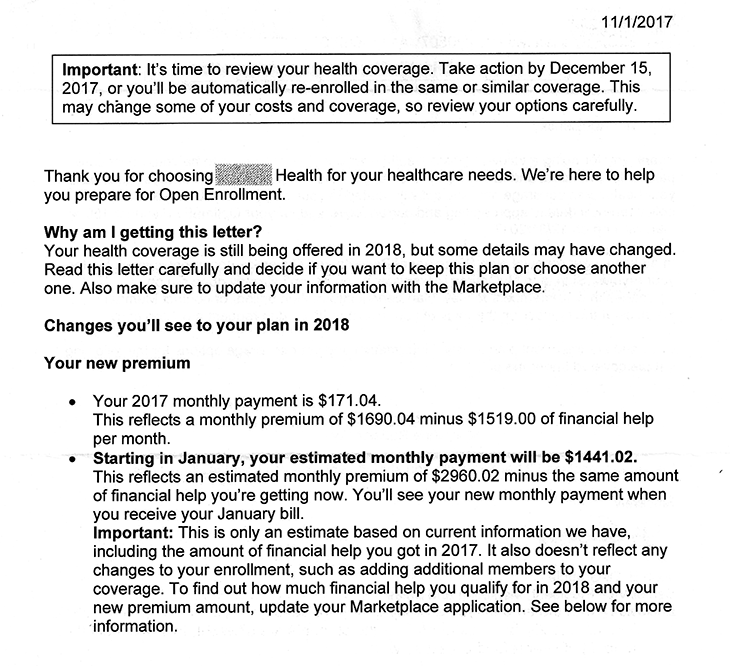
Below is an excerpt from a renewal notice to a family (husband and wife in their early 60’s) who buy Marketplace coverage in Virginia. With APTC this year, they pay about $171 per month for a policy that costs more than $1,500 per month. Their income is steady, so they will only be required to pay about the same amount next year, even though the unsubsidized premium for this policy will nearly double. The renewal notice, though, estimates their monthly costs will increase to more than $1,400 – a 743% increase — because it reflects their 2017 premium tax credit amount rather than their 2018 subsidy.
Renewal letter example
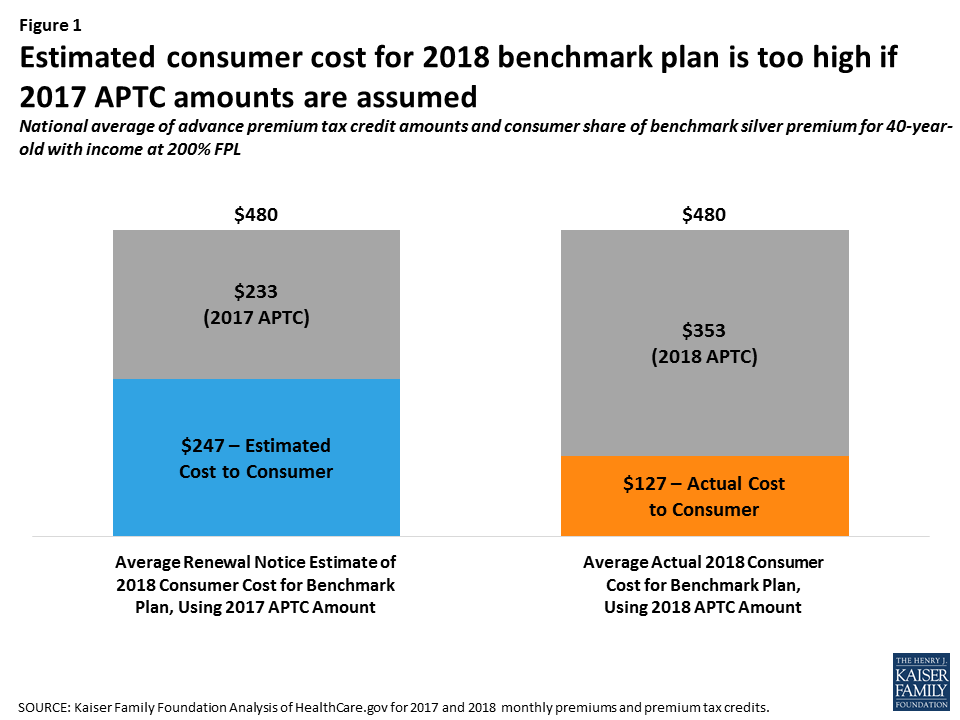
A 40-year-old single person with income at 200% of the federal poverty level will pay the same amount for the benchmark silver plan in 2017 and in 2018. The average unsubsidized monthly premium amount for the benchmark silver marketplace plan in 2018 will increase $119 in 2018 compared to 2017 ($480 vs. $361), and the APTC amounts will also increase by $120 ($353 in 2018 vs $233 in 2017), leaving the consumer to pay $127 per month for the benchmark plan in both years. However, renewal notices that estimate a consumer’s net premium for the 2018 benchmark plan using the 2017 APTC amount, on average, will show this consumer paying $247 per month – $120 (95%) more than will actually be the case. (Figure 1)
Figure 1: Estimated consumer cost for 2018 benchmark plan is too high if 2017 APTC amounts are assumed
The amount of increase in the 2018 benchmark plan premium varies by state. As a result, renewal notices may misestimate consumers renewal rate costs by varying amounts. In some areas, such as Phoenix, AZ, where the benchmark plan cost is changing very little in 2018, the estimated costs consumers see in renewal notices will be roughly accurate. By contrast, in Omaha, NE, where benchmark premiums are increasing significantly, renewal notices that estimate consumer costs using the 2017 APTC amounts will be off by a much greater amount.
Table 1: Difference in Actual vs. Estimated Consumer Cost of 2018 Benchmark Silver Plan for a 40-year-old at 200% FPL
State
Major City
Subsidized Monthly Benchmark Silver Plan Premium
Difference in Estimated vs Actual Monthly Consumer Cost for 2018
Actual 2017 Consumer Cost Net of 2017 APTC
Actual 2018 Consumer Cost Net of 2018 APTC
Estimated 2018 Premium Using 2017 APTC
US Average
$127
$127
$247
$120
Alabama
Birmingham
$127
$127
$181
$53
Alaska
Anchorage
$159
$159
$0
-$159
Arizona
Phoenix
$127
$127
$131
$4
Arkansas
Little Rock
$127
$127
$191
$64
California
Los Angeles
$127
$127
$194
$67
Colorado
Denver
$127
$127
$228
$101
Connecticut
Hartford
$127
$127
$208
$81
Delaware
Wilmington
$127
$127
$293
$166
DC
Washington
$127
$127
$153
$25
Florida
Miami
$127
$127
$263
$136
Georgia
Atlanta
$127
$127
$272
$145
Hawaii
Honolulu
$146
$146
$238
$91
Idaho
Boise
$127
$127
$242
$114
Illinois
Chicago
$127
$127
$247
$119
Indiana
Indianapolis
$127
$127
$206
$78
Iowa
Cedar Rapids
$127
$127
$528
$401
Kansas
Wichita
$127
$127
$250
$123
Kentucky
Louisville
$127
$127
$277
$149
Louisiana
New Orleans
$127
$127
$163
$35
Maine
Portland
$127
$127
$298
$171
Maryland
Baltimore
$127
$127
$274
$147
Massachusetts
Boston
$127
$127
$187
$60
Michigan
Detroit
$127
$127
$223
$95
Minnesota
Minneapolis
$127
$127
$89
-$38
Mississippi
Jackson
$127
$127
$326
$198
Missouri
St Louis
$127
$127
$282
$154
Montana
Billings
$127
$127
$205
$78
Nebraska
Omaha
$127
$127
$511
$384
Nevada
Las Vegas
$127
$127
$230
$102
New Hampshire
Manchester
$127
$127
$335
$207
New Jersey
Newark
$127
$127
$185
$58
New Mexico
Albuquerque
$127
$127
$270
$143
New York
New York City
$127
$127
$181
$54
North Carolina
Charlotte
$127
$127
$223
$95
North Dakota
Fargo
$127
$127
$94
-$33
Ohio
Cleveland
$127
$127
$216
$88
Oklahoma
Oklahoma City
$127
$127
$319
$192
Oregon
Portland
$127
$127
$190
$63
Pennsylvania
Philadelphia
$127
$127
$345
$217
Rhode Island
Providence
$127
$127
$177
$50
South Carolina
Columbia
$127
$127
$284
$157
South Dakota
Sioux Falls
$127
$127
$133
$6
Tennessee
Nashville
$127
$127
$291
$163
Texas
Houston
$127
$127
$238
$111
Utah
Salt Lake City
$127
$127
$350
$222
Vermont
Burlington
$127
$127
$141
$14
Virginia
Richmond
$127
$127
$313
$186
Washington
Seattle
$127
$127
$228
$100
West Virginia
Huntington
$127
$127
$172
$45
Wisconsin
Milwaukee
$127
$127
$317
$189
Wyoming
Cheyenne
$127
$127
$459
$332
SOURCE: Kaiser Family Foundation analysis of insurer rate filings to state regulators and data published by HHS.
What Consumers Need to Know
Consumers need to know that the renewal notice they receive from their insurer likely will estimate a much higher monthly premium for 2018 than they would actually pay after taking into account their tax credit. This is not the insurer’s fault. Insurers were directed to estimate 2018 renewal costs taking into account the tax credit amount consumers were receiving in 2017; but in most cases, this will result in an inaccurate estimate.
Consumers should watch for a second renewal notice, this one from the marketplace, that will likely estimate a different and higher APTC amount for 2018 that does take into account the increase in benchmark silver plan premiums.
For the most accurate estimate of their likely 2018 subsidy and monthly plan costs, consumers should log into their marketplace account, update their application information, and view the cost of all plan options after the 2018 APTC is applied. Consumers can also estimate their 2018 costs using the subsidy calculator, below.