Medicaid Retroactive Coverage Waivers: Implications for Beneficiaries, Providers, and States

Authors: MaryBeth Musumeci and Robin Rudowitz
Published: Nov 10, 2017

Issue Brief

On October 26, 2017, the Centers for Medicare and Medicaid Services (CMS) approved an amendment to Iowa’s Section 1115 demonstration waiver eliminating 3-month retroactive coverage for nearly all new Medicaid applicants as of November 1, 2017.1  Populations affected by Iowa’s waiver include low-income parents, children over age 1, Affordable Care Act (ACA) expansion adults, seniors, and people with disabilities. Retroactive coverage waivers have been approved in a limited number of other states with certain conditions.  This issue brief answers key questions about Medicaid retroactive coverage, describes Iowa’s recent waiver amendment, considers the policy implications of retroactive coverage waivers, and identifies issues to watch.

What is Medicaid retroactive coverage and why is it part of Medicaid?

Unlike private insurance, Medicaid covers vulnerable populations, such as seniors, people with disabilities, low-income children and their parents, and other low-income adults.  Medicaid is a safety net program that provides services that private insurance typically does not, such as long-term care, and protects enrollees from unpaid medical bills that they cannot afford.  It also ensures that providers are paid for services they offer to Medicaid-eligible people and helps encourage providers to participate in the program.  Retroactive coverage is one of the long-standing safeguards built into the program for low-income Medicaid beneficiaries and their healthcare providers.  Federal law directs state Medicaid programs to cover (and provides federal matching funds for) medical bills incurred up to 3 months prior to a beneficiary’s application date.2   To qualify for retroactive coverage, a Medicaid beneficiary must have been eligible for coverage during the 3 months prior to application when the bill was incurred, and the services must be those that Medicaid covers.

Some people may not become eligible for Medicaid until after they experience a traumatic event, such as a stroke that requires hospitalization and ongoing long-term care needs or a motorcycle accident resulting in a traumatic brain injury.  In addition, many people mistakenly think that Medicare covers long-term care and often do not learn about Medicaid until their health deteriorates to the point that they seek a nursing home placement or other long-term care services; these events often are precipitated by a crisis, such as a fall, that cause seniors and their families to seek out services and supports. When sudden health care needs arise, the initial focus often is on stabilizing the person’s medical condition.  If a traumatic event occurs toward the end of a calendar month, it may take several days or weeks for the patient and their family and providers to navigate complex medical issues before they turn to considering payment, including Medicaid eligibility.  During this time, sizeable medical bills can accrue.  Retroactive coverage protects patients and providers by ensuring that medical bills are paid even if a Medicaid application is not filed until the calendar month following a traumatic event.

Federal Medicaid law allows some providers, like hospitals, to determine certain people “presumptively eligible” for Medicaid.  Presumptive eligibility allows providers to offer (and get reimbursed for) needed health services right away to adults and children who appear to be eligible for Medicaid based on their low incomes, while a full Medicaid application is pending.  However, presumptive eligibility is not available for seniors and people with disabilities who may have long-term care needs.

What was approved in Iowa’s Retroactive Coverage Waiver?

Section 1115 of the Social Security Act authorizes the Health and Human Services (HHS) Secretary to waive state compliance with certain provisions of federal Medicaid law to allow states to engage in experimental, pilot, or demonstration projects that, in the Secretary’s judgment, further Medicaid program objectives.  Iowa’s Section 1115 demonstration waiver, known as the “Iowa Health and Wellness Plan,” initially was limited to adults newly eligible under the ACA and did not apply to traditional Medicaid populations.3   However, on October 26, 2017, CMS approved an amendment to Iowa’s eliminating 3-month retroactive coverage for nearly all new Medicaid applicants as of November 1, 2017.4   While pregnant women and infants under age 1 still qualify for retroactive coverage in Iowa, the new retroactive coverage waiver applies to all other state plan populations, including low-income parents, children over age 1, ACA expansion adults, seniors, and people with disabilities.  Coverage for people affected by Iowa’s waiver will now begin no earlier than the first day of the application month.

What are the expected implications for beneficiaries in Iowa?

In approving Iowa’s retroactive coverage waiver, CMS concluded that Medicaid program objectives are furthered “by encouraging beneficiaries to obtain and maintain health coverage, even when healthy.”5   For seniors and people with disabilities seeking long-term care coverage, CMS states that “this waiver will encourage beneficiaries to apply for Medicaid expeditiously when they believe they meet the criteria for eligibility to ensure primary or secondary coverage through Medicaid to receive these services if the need arises.”6  Eligibility criteria for long-term care services include both financial criteria (people must have low incomes and limited assets) and functional criteria (people must qualify for an “institutional level of care” or meet other disability-related criteria).  These rules are often complicated and only available in state policy manuals.  Even if people know about the rules, it can be challenging for a lay person to determine whether their situation qualifies.  In Iowa’s waiver, the state “assures [CMS] that it will provide outreach and education about how to apply for and receive Medicaid coverage to the public and to Medicaid providers, particularly those who serve vulnerable populations that may be impacted by this change.”7   The terms and conditions do not provide additional detail about these efforts, although the waiver went into effect less than a week after approval.

Iowa’s waiver amendment submission to CMS acknowledged that the “majority of the [public] comments received were opposed to the elimination” of 3-month retroactive coverage.”8   For example, “[c]ommenters felt that the proposed change will place unnecessary financial burdens on patients/family members. . .  , particularly those who seek services during the last few days of a month and may not apply until the following month. . . , those in rural locations. . . , or those who seek facility placement.”9  In addition, “commenters noted concerns with the potential health impacts of the amendment, indicating that future enrollees may either delay or forego needed care or be placed in inappropriate or unsafe environments.”10   However, the state indicated that it was unable to make any changes to its request in response to public comments as the waiver application was submitted pursuant to state legislation that directed the state to seek the waiver.11 

What is the fiscal impact of eliminating retroactive coverage in Iowa?

Iowa’s waiver amendment submission to CMS indicated that “this change is being made to reduce program costs” and estimated that the “[e]limination of retroactive coverage is expected to reduce monthly enrollment by 3,344 enrollees and reduce annual [federal and state] Medicaid spending by $36.8 million [$9.7 million state share].”12   Specifically, the state estimated that average monthly Medicaid enrollment will decrease by 1,384 expansion adults, 1,129 children, 668 low-income parents, 157 people with disabilities, 6 seniors, and 1 breast/cervical cancer treatment enrollee as a result of the elimination of retroactive coverage.13 

Have other waivers of retroactive coverage been approved?

Prior to Iowa’s waiver, CMS (under the Obama Administration) waived retroactive eligibility for certain populations as part of 3 other ACA expansion waivers provided that certain conditions to safeguard beneficiaries were met.  Unlike Iowa, these waivers do not apply to seniors and people with disabilities:

  • New Hampshire’s retroactive coverage waiver for ACA expansion adults was to be implemented only after CMS determined that retroactive coverage is unnecessary, based on state data showing no gaps in coverage for newly eligible adults prior to their Medicaid application date and upon renewal.14 
  • Arkansas’s retroactive coverage waiver for ACA expansion adults was conditioned on the state meeting 3 criteria: completing an eligibility determination mitigation plan and timely eligibility determinations, providing benefits during a reasonable opportunity period for otherwise eligible individuals who attest to immigration status, and implementing a hospital presumptive eligibility program. (Arkansas has a pending waiver amending seeking to eliminate the 3 conditional criteria.)15 
  • Indiana’s ACA expansion waiver eliminates 3-month retroactive coverage for adults newly eligible under the ACA as well as some traditional populations, such as low-income parents, 19- and 20-year olds, and people moving from TANF to work and receiving Transitional Medical Assistance.16 

A handful of other states have retroactive coverage waivers that pre-date the ACA and may have been associated with achieving the budgetary savings necessary to expand coverage before federal law authorized the use of Medicaid funds for childless adults.  Some of these waivers apply to limited populations, and most have exceptions for seniors and people with disabilities:

  • Delaware, which had a pre-ACA waiver expanding coverage to nearly all adults up to 100% of the federal poverty level, waives retroactive eligibility for most populations, except for people in institutions and the buy-in for working people with disabilities.17 
  • Massachusetts’ waiver, which also had a pre-ACA coverage expansion, limits retroactive coverage to 10 days prior to the application date for most populations, with exceptions for Katie Beckett children with significant disabilities, people with disabilities eligible under home and community-based services waivers, seniors, and people with long-term hospital or nursing home stays.18 
  • Maryland has a retroactive coverage waiver for certain optional targeted low-income children.19 
  • Tennessee has a retroactive coverage waiver that applies to state plan populations.20 
  • Utah waives retroactive coverage for its limited coverage expansion to parents and childless adults with income above Medicaid state plan limits up to 100% FPL.21 

What do we know about the effects of retroactive coverage waivers?

Despite requirements that Section 1115 waivers serve an experimental, pilot, or demonstration purpose and have an evaluation component, little is known about the impact of retroactive coverage waivers on beneficiaries and providers.  In Iowa’s submission to CMS, the “State [did] not propose any modifications to the current evaluation plan as a result of [the retroactive coverage waiver] amendment,”22  and CMS did not require any changes to the waiver terms and conditions regarding evaluation when approving the amendment.  As a result, it is unclear whether Iowa’s waiver evaluation will encompass the effects of the retroactive coverage waiver.  Some data is available from Indiana’s prior claims payment program that CMS required as a safeguard against unpaid medical bills for traditional populations subject to its retroactive coverage waiver.  The prior claims payment program requires Indiana to reimburse providers for services received up to 90 days prior to the effective Medicaid coverage date for low-income parents who were not determined presumptively eligible.  When denying Indiana’s request to discontinue the program in July, 2016, CMS noted that 13.9% of beneficiaries were eligible for the program and had incurred costs averaging $1,561 per person.23 

What are the issues to Watch in the future?

Key issues to watch in retroactive coverage waivers include the following:

  • Will Other States Seek Retroactive Coverage Waivers? CMS’s recent approval of Iowa’s retroactive coverage waiver may lead other states to consider similar proposals. Kentucky’s pending waiver application includes a retroactive coverage waiver for most populations (except pregnant women and children under age 1).  The ACA’s waiver transparency rules, including public notice and comment periods at the state and federal levels, help stakeholders learn about state proposals and provide input.
  • What Beneficiary Safeguards Will be Included in Retroactive Coverage Waivers? The steps that states take to encourage eligible people to enroll in Medicaid and prevent delays in effectuating coverage that can lead to unpaid medical bills will be an important area to watch, as will the impact of potential decisions to remove conditions on existing retroactive coverage waivers that sought to protect beneficiaries from incurring unpaid medical bills.  Navigating the Medicaid application process can be confusing, particularly for seniors and people with disabilities who are seeking long-term care coverage, and eliminating retroactive coverage means that the ability to apply as quickly as possible takes on new importance to minimize unpaid bills.  People who enter nursing homes initially paying out-of-pocket before they “spend down” to Medicaid eligibility might have staff familiar with the program rules to help them apply as soon as they are eligible.  (Applying for coverage too soon, before eligibility criteria are met, will result in a denial.)  Other people, such as those who seek long-term care services in the community or those who only become eligible after a traumatic event may not know about Medicaid eligibility until after some time has passed or may not have the bandwidth to devote to the complex long-term care application while in the midst of a health crisis.
  • How Do Retroactive Coverage Waivers Affect Access to Care? Evaluations can provide information about the impact of retroactive coverage waivers on beneficiaries and providers and whether these waivers help promote or hinder access to coverage and care.  Before formal waiver evaluations are completed, stakeholders also will be interested in data that states can make available sooner, through quarterly or annual waiver reports, including the impact of retroactive coverage waivers on different populations, such as seniors, people with disabilities, those with long-term care needs, children, and adults, and on providers’ uncompensated care costs.

Endnotes

  1. CMS, Special Terms and Conditions, Iowa Wellness Plan, #11-W-00289/5 (Jan. 1, 2017-Dec. 31, 2019, amended Oct. 26, 2017), https://www.medicaid.gov/Medicaid-CHIP-Program-Information/By-Topics/Waivers/1115/downloads/ia/ia-wellness-plan-ca.pdf. ↩︎
  2. 42 U.S.C. § 1396a (a) (34) (“A State plan for medical assistance must provide that in the case of any individual who has been determined to be eligible for medical assistance under the plan, such assistance will be made available to him for care and services included under the plan and furnished in or after the third month before the month in which he made application (or application was made on his behalf in the case of a deceased individual) for such assistance if such individual was (or upon application would have been) eligible for such assistance at the time such care and services were furnished.”) ↩︎
  3. The original waiver was approved in December, 2013 to implement Iowa’s ACA expansion.  The waiver provisions for ACA expansion adults have been amended several times, and in July 2017, the waiver’s dental program (including tiered benefits, premiums, and healthy behavior incentives) was expanded to include all Medicaid adults. ↩︎
  4. CMS Special Terms and Conditions, Iowa Wellness Plan, #11-W-00289/5 (Jan. 1, 2017-Dec. 31, 2019, amended Oct. 26, 2017), https://www.medicaid.gov/Medicaid-CHIP-Program-Information/By-Topics/Waivers/1115/downloads/ia/ia-wellness-plan-ca.pdf. ↩︎
  5. CMS Letter from Brian Neale, Director, Center for Medicaid and CHIP Services to Mikki Stier, Medicaid Director, Iowa Dep’t of Human Services (Oct. 27, 2017), https://www.medicaid.gov/Medicaid-CHIP-Program-Information/By-Topics/Waivers/1115/downloads/ia/ia-wellness-plan-ca.pdf. ↩︎
  6. Id.  ↩︎
  7. CMS Special Terms and Conditions, Iowa Wellness Plan, #11-W-00289/5 (Jan. 1, 2017-Dec. 31, 2019, amended Oct. 26, 2017), https://www.medicaid.gov/Medicaid-CHIP-Program-Information/By-Topics/Waivers/1115/downloads/ia/ia-wellness-plan-ca.pdf. ↩︎
  8. State of Iowa, Dep’t of Human Services, Iowa Wellness Plan, Project #11-W-00289/5, Section 1115 Demonstration at 5 (Aug. 2, 2017), https://www.medicaid.gov/Medicaid-CHIP-Program-Information/By-Topics/Waivers/1115/downloads/ia/ia-wellness-plan-pa4.pdf. ↩︎
  9. Id. at 7. ↩︎
  10. Id.  ↩︎
  11. Id. at 6; see also Iowa House File 653, https://www.legis.iowa.gov/docs/publications/LGE/87/HF653.pdf. ↩︎
  12. State of Iowa, Dep’t of Human Services, Iowa Wellness Plan, Project #11-W-00289/5, Section 1115 Demonstration Amendment, Attachment A – Public Notice at 2 (Aug. 2, 2017), https://www.medicaid.gov/Medicaid-CHIP-Program-Information/By-Topics/Waivers/1115/downloads/ia/ia-wellness-plan-pa4.pdf. ↩︎
  13. Id. ↩︎
  14. Kaiser Family Foundation, Section 1115 Medicaid Expansion Waivers:  A Look at Key Themes and State Specific Waiver Provisions (Aug. 16, 2017), https://modern.kff.org/medicaid/issue-brief/section-1115-medicaid-expansion-waivers-a-look-at-key-themes-and-state-specific-waiver-provisions/. ↩︎
  15. Id.  ↩︎
  16. Kaiser Family Foundation, An Early Look at Medicaid Expansion Waiver Implementation in Michigan and Indiana (Jan. 2017), https://modern.kff.org/medicaid/issue-brief/an-early-look-at-medicaid-expansion-waiver-implementation-in-michigan-and-indiana/. ↩︎
  17. CMS Special Terms and Conditions, Delaware Diamond State Health Plan, #11-W-00036/4 (Sept. 30, 2013-Dec. 31, 2018), https://www.medicaid.gov/Medicaid-CHIP-Program-Information/By-Topics/Waivers/1115/downloads/de/de-dshp-ca.pdf. ↩︎
  18. CMS Special Terms and Conditions, MassHealth Medicaid Section 1115 Demonstration, #11-W-00030/1 (July 1, 2017-June 30, 2022), https://www.medicaid.gov/Medicaid-CHIP-Program-Information/By-Topics/Waivers/1115/downloads/ma/ma-masshealth-ca.pdf; see also M.G.L. ch. 118E, § 9A (6), https://malegislature.gov/Laws/GeneralLaws/PartI/TitleXVII/Chapter118E/Section9A. ↩︎
  19. CMS Special Terms and Conditions, Maryland HealthChoice Medicaid Section 1115 Demonstration, #11-W-00099/3 (Jan. 1, 2017-Dec. 31, 2021), https://www.medicaid.gov/Medicaid-CHIP-Program-Information/By-Topics/Waivers/1115/downloads/md/md-healthchoice-ca.pdf. ↩︎
  20. CMS Special Terms and Conditions, TennCare II, #11-W-00151/4 (Nov. 16, 2016-June 30, 2021), https://www.medicaid.gov/Medicaid-CHIP-Program-Information/By-Topics/Waivers/1115/downloads/tn/tn-tenncare-ii-ca.pdf. ↩︎
  21. CMS Special Terms and Conditions, Utah Primary Care Network #11-W-00145/8 (Nov. 1, 2017-June 30, 2022), https://www.medicaid.gov/Medicaid-CHIP-Program-Information/By-Topics/Waivers/1115/downloads/ut/ut-primary-care-network-ca.pdf. ↩︎
  22. State of Iowa, Dep’t of Human Services, Iowa Wellness Plan, Project #11-W-00289/5, Section 1115 Demonstration Amendment (Aug. 2, 2017), https://www.medicaid.gov/Medicaid-CHIP-Program-Information/By-Topics/Waivers/1115/downloads/ia/ia-wellness-plan-pa4.pdf. ↩︎
  23. CMS letter from Vikki Wachino, Director, Center for Medicaid and CHIP Services to Tyler Ann McGuffee, Insurance and Healthcare Policy Director, Office of Governor Michael R. Pence (July 29, 2016), https://www.medicaid.gov/Medicaid-CHIP-Program-Information/By-Topics/Waivers/1115/downloads/in/Healthy-Indiana-Plan-2/in-healthy-indiana-plan-support-20-lockouts-redetermination-07292016.pdf. ↩︎
Key Themes in Medicaid Section 1115 Behavioral Health Waivers

Author: MaryBeth Musumeci
Published: Nov 10, 2017

Executive Summary

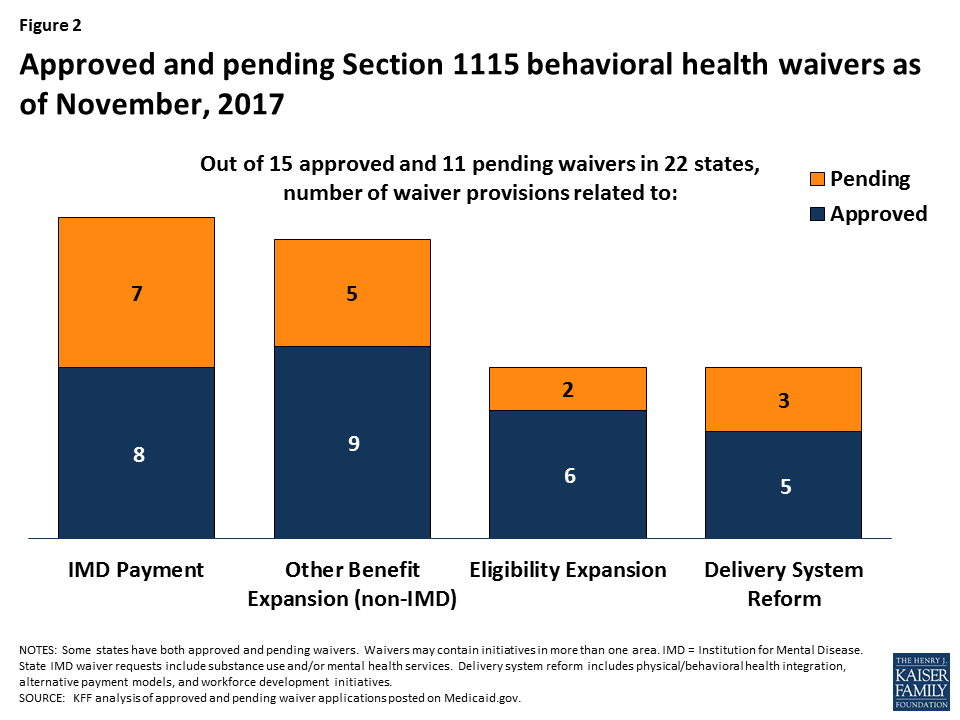
State interest in Medicaid Section 1115 behavioral health waivers, including mental health and substance use disorders, remains high.  As of November, 2017, there are 15 approved and 11 pending behavioral health waivers in 22 states.  This issue brief describes recent waiver activity in four areas:  using Medicaid funds to pay for substance use and/or mental health services in “institutions for mental disease” (IMDs), expanding community-based behavioral health benefits, expanding Medicaid eligibility to cover additional people with behavioral health needs, and financing delivery system reforms (Executive Summary Table).

Executive Summary Table:  Key Themes in Section 1115 Behavioral Health Waivers as of Nov. 2017
Waiver Provision# of States with Approved Waiver# of States with Pending Waiver
IMD Payment Exclusion7 approved for substance use treatment,

1 approved for mental health services

7 pending for substance use treatment,

2 pending for mental health services

Community-Based Benefit Expansions9 approved5 pending
Eligibility Expansions6 approved2 pending
Delivery System Reforms5 approved3 pending

States’ Section 1115 waiver requests reflect Medicaid’s important role in financing behavioral health coverage.  Pending waiver requests raise several key issues to watch, including:

  • How IMD payment waivers for substance use services will evolve, including how CMS and states will balance expanding institutional services while also ensuring access to community-based services and what utilization controls, performance measures, and/or delivery system reforms are put in place to prevent unnecessary institutionalizations, and how CMS will respond to pending IMD mental health payment waivers and their potential impact on community integration issues;
  • What impact community-based benefit expansions, such as supportive housing, supported employment, and peer recovery coaching, will have on health outcomes, access to care and costs and how to identify best practices in supporting people with behavioral health needs in the community;
  • What impact waivers that expand Medicaid eligibility to cover additional populations with behavioral health needs and any associated enrollment caps will have on outcomes, access to care, and costs; and
  • How CMS and states will continue to use waivers to prioritize, finance, and implement delivery system reforms, such as physical and behavioral health integration, alternative payment models, and workforce development initiatives.

Issue Brief

Introduction

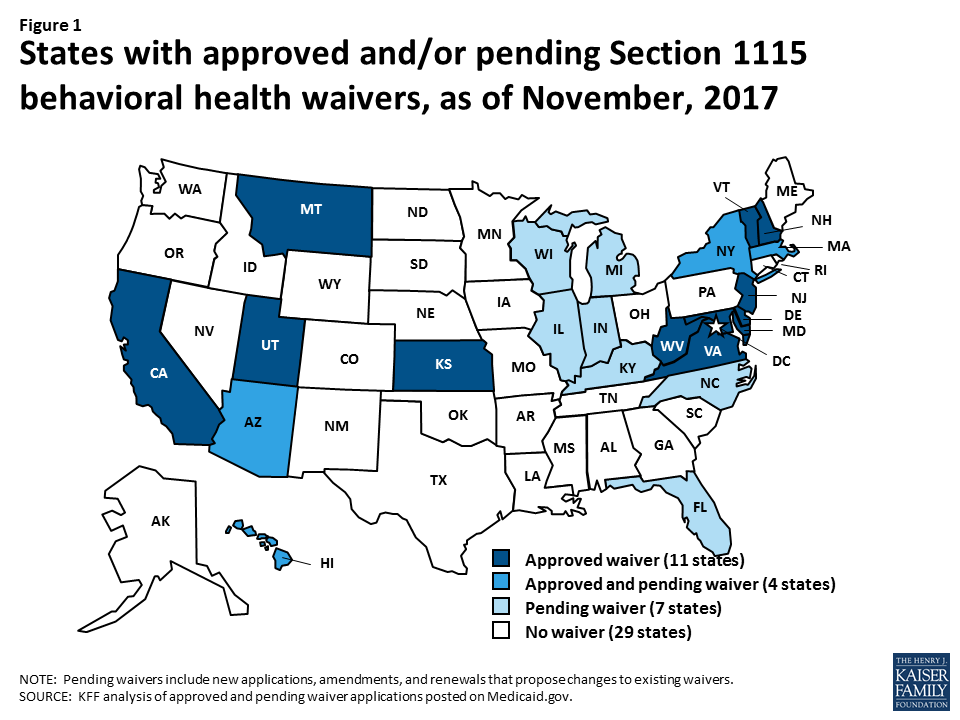
Nearly half the states (22) have an approved and/or pending Section 1115 Medicaid demonstration waiver that involves one or more behavioral health initiatives as of November, 2017 (Figure 1).  Behavioral health includes mental health and/or substance use disorders.  Section 1115 of the Social Security Act allows the Health and Human Services Secretary to waive certain provisions of federal Medicaid law for an “experimental, pilot, or demonstration project” that “is likely to assist in promoting the objectives of” the program.  State interest in Section 1115 Medicaid waivers related to behavioral health is high, driven in part by state efforts to address the opioid epidemic.

Figure 1: States with approved and/or pending Section 1115 behavioral health waivers, as of November, 2017

Current and pending Section 1115 behavioral health waivers address four main areas (Figure 2).  These include using Medicaid funds to pay for substance use and/or mental health services in “institutions for mental disease” (IMDs), expanding community-based behavioral health benefits, expanding Medicaid eligibility to cover additional people with behavioral health needs, and financing delivery system reforms, such as physical and behavioral health integration or alternative payment models.  This issue brief describes recent Section 1115 behavioral health waiver activity and highlights state examples and issues to watch in these four areas.  The Appendix contains detailed tables about the 15 approved and 11 pending Section 1115 waivers related to behavioral health in 22 states as of November, 2017.

Figure 2: Approved and pending Section 1115 behavioral health waivers as of November, 2017

Using Federal Medicaid Funds for IMD Services

Since the creation of the Medicaid program, federal law has prohibited states from using Medicaid funds to pay for IMD services for non-elderly adults.  The IMD payment exclusion generally applies to inpatient behavioral health facilities with more than 16 beds and was aimed at preserving the state financing of these services that pre-dated the Medicaid program.  CMS’s 2016 revision of the Medicaid managed care regulations provides an exception to the IMD payment exclusion; the regulations now codify long-standing federal policy and permit states to use federal Medicaid funds for capitation payments to managed care plans that cover IMD inpatient or crisis residential behavioral health services for non-elderly adults “in lieu of” other services covered under the state plan.1  Under the regulation, which took effect in July, 2016, IMD services must be determined to be medically appropriate and cost-effective and are limited to 15 days per month,2  and enrollees cannot be required to accept IMD services instead of those that are covered under the Medicaid state plan.

Section 1115 IMD payment waivers distinguish between substance use disorder services and mental health services.  Of the eight states with approved IMD payment waivers, seven have authority for substance use services and one has authority for mental health services.  Of the seven states with pending IMD payment waivers, all seven are seeking new or expanded authority for substance use services, and two also are seeking authority for mental health services.

IMD Substance Use Disorder Services

Seven states (California, Maryland, Massachusetts, New Jersey, Utah, Virginia, and West Virginia) have waiver authority to use federal Medicaid funds to pay for IMD substance use treatment services (Table 1).  The day limits authorized under these waivers vary by state.  Maryland’s waiver allows two 30-day stays, while California has approval for two 90-day stays for adults and two 30-day stays for adolescents.3   New Jersey, Utah, Virginia and West Virginia were approved without an explicit day limit.  (California, Virginia, and West Virginia’s waivers all note that the average length of stay is 30 days.)  Massachusetts has waiver authority for specified diversionary behavioral health services in IMDs provided by managed care plans, expanded substance use treatment services in IMDs provided to all full benefit enrollees regardless of delivery system, and payments to IMDs through the waiver’s safety net care pool.4   Most of these waivers were approved pursuant to CMS’s July, 2015 guidance that allows states to use Section 1115 waivers to test using federal Medicaid funds to provide a full continuum of substance use disorder treatment services, including short-term inpatient and residential IMD services.5   On November 1, 2017, the Trump Administration issued a state Medicaid director letter revising the July, 2015 guidance.6   For more details on the CMS guidance, see Box 1 below.

Box 1:  CMS Guidance on Section 1115 IMD Substance Use Disorder Payment Waivers

On July 27, 2015, CMS issued a state Medicaid director letter allowing states to obtain Section 1115 waivers of the federal IMD payment exclusion for substance use treatment services.  The IMD waiver authority was contingent on states covering community-based services7  along with short-term institutional services that “supplement and coordinate with, but do not supplant, community-based services.”8   States also were expected to implement delivery system and practice reforms that integrated physical and behavioral health care and used evidence-based industry standards.9 

On November 1, 2017, CMS issued a state Medicaid director letter revising the July, 2015 guidance.10  The revised guidance continues to allow states to use Section 1115 waivers to pay for IMD substance use treatment services and affirms many components of the earlier guidance.  For example, it notes that “states should indicate how inpatient and residential care will supplement and coordinate with community-based care in a robust continuum of care in the state” and directs states to “demonstrate how they are implementing evidence-based treatment guidelines.”11   The revised guidance requires certain demonstration components, such as residential treatment provider qualifications and capacity, opioid prescribing guidelines, access to naloxone, prescription drug monitoring programs, and care coordination between residential and community settings.  States must report on core and state-specific quality measures, perform waiver evaluations, and are subject to a $5 million deferral per item for failure to comply with evaluation and reporting requirements.

Table 1:  Section 1115 IMD Payment Waivers as of November, 2017
# of StatesStates
Approved Waiver Provisions (8 states)
IMD Substance Use Treatment Services7CA, MD, MA, NJ, UT, VA, WV
IMD Mental Health Services1VT
Pending Waiver Requests (7 states)
IMD Substance Use Treatment Services7AZ, IL, IN, KY, MA, MI, WI
IMD Mental Health Services2IL, MA
SOURCE:  KFF analysis of Section 1115 waivers posted on Medicaid.gov.

IMD Mental Health Services

One state (Vermont) has waiver authority to use federal Medicaid funds to pay for IMD mental health treatment services, although those payments must be phased out (Table 1).12   Vermont’s waiver requires it to submit a schedule by the end of 2018 to begin reducing federal Medicaid IMD spending in January, 2021, and completely end this spending by the end of 2025.  Vermont’s waiver also requires the state to evaluate the impact of federal IMD spending on people with serious mental illness and those in need of acute behavioral health services who reside in IMDs in the context of system-wide service, payment, and delivery system reform.

What to Watch

IMD payment waivers are currently the most frequently sought type of Section 1115 behavioral health waiver request. Seven states are seeking IMD substance use treatment waivers, including new waiver requests in six states (Arizona, Illinois, Indiana, Kentucky, Michigan, and Wisconsin) and a request to expand existing waiver authority in one state (Massachusetts).  Two states (Illinois and Massachusetts) also have pending requests for IMD mental health waivers (Table 1).  State proposals for the length of IMD stay vary.  Among states seeking IMD substance use waivers, Illinois, Indiana, and Kentucky propose 30-day stays, Wisconsin proposes a 90-day stay, and Arizona and Michigan do not specify a day limit.  (Arizona notes that it previously covered IMD stays without a day limit under managed care “in lieu of” authority before the Medicaid managed care rule was revised in 2016.)  Massachusetts’ pending waiver amendment seeks to remove all federal IMD payment restrictions on both substance use and mental health services, including the 15-day limit for managed care plans and the cap on safety net care pool payments.  In addition to 30-day substance use treatment stays, Illinois also proposes a 30-day IMD stay for mental health services.

A key issue to watch in IMD payment waivers is how CMS and states will balance expanding institutional services while also ensuring access to community-based services and preventing unnecessary institutionalization.  Stakeholders may look to trends around day limits, community-based service expansions, and delivery system reforms that may be included in CMS’s approval of pending and future IMD payment waivers as well as performance measure and waiver evaluation results from approved waivers.  Stakeholders particularly may want to watch CMS’s response to state requests for IMD mental health payment waivers, as the IMD payment waiver guidance does not address mental health services.  Waiving the IMD payment exclusion and expanding institutional services without adequate access to community-based services could have implications for states’ community integration obligations under the Supreme Court’s Olmstead decision if people with disabilities are inappropriately institutionalized.13 

Expanding Community-Based Behavioral Health Benefits

Although many community-based behavioral health benefits can be covered under Medicaid state plan authority, some states seek waiver authority to cover certain community-based behavioral health benefits.  States may not need waiver authority to provide these benefits; for example, West Virginia’s recent waiver approval notes that the state has opted to cover peer recovery coaching and methadone under waiver expenditure authority, even though those services could be covered under state plan authority.  Other services, such as certain home and community-based services (HCBS) for people who would otherwise qualify for an institutional level of care, may require waiver authority.  Historically, states have used Section 1915 (c) waivers to provide HCBS, although CMS also has authorized HCBS under Section 1115 waivers.

Nine states have Section 1115 waivers that expand community-based Medicaid behavioral health benefits beyond those available in the state plan benefit package (Table 2).  These states include Delaware, Hawaii, Kansas, Maryland, Massachusetts, New Jersey, New York, Vermont, and West Virginia.  Three states (Delaware, Hawaii, and Maryland) offer supportive housing services, such as community transition services for people leaving institutional placements, tenancy supports, household activity skill building and chore services, and/or case management.14   Three states (Delaware, Hawaii, and Vermont) offer supported employment services, such as job coaching.  Two states (Massachusetts and West Virginia) offer peer recovery coaching services.  Eight states offer other community-based behavioral health services (Table 2).  For example, Massachusetts offers community-based services intended to divert individuals with behavioral health needs from institutional stays, such as community crisis stabilization, community support program, psychiatric day treatment, intensive outpatient, and assertive community treatment services.

Table 2:  Section 1115 Behavioral Health Benefit Expansion Waivers as of November, 2017
# of StatesStates
Approved Waiver Provisions (9 states)
Supportive Housing3*DE, HI, MD
Supported Employment3DE, HI, VT
Peer Recovery Coaching2MA, WV
Other Community-Based Behavioral Health Services8DE, HI, KS, MA, NJ, NY, VT, WV
Specialized Behavioral Health Benefit Package4DE, NJ, NY, VT
Pending Waiver Requests (5 states)
Supportive Housing4FL, HI, IL, MI
Supported Employment1IL
Peer Recovery Coaching2IL, MI
Other Community-Based Behavioral Health Services3IL, MI, NY
NOTES:  *CA’s Whole Person Care pilot also includes waiver funding for services not otherwise covered under Medicaid, such as supportive housing.SOURCE:  KFF analysis of Section 1115 waivers posted on Medicaid.gov.

Four states with approved waivers (Delaware, New Jersey, New York, and Vermont) have designed specialized benefit packages that provide expanded behavioral health services (Table 2).  These services are targeted to individuals who need supportive services to live in the community and meet certain diagnosis and/or risk criteria.  Delaware and New York target adults, while New Jersey and Vermont target children and youth under age 21 and their families.  Delaware’s benefit package is provided fee-for-service and includes a case manager from the state’s mental health and substance abuse agency, while New York’s benefit package is offered through a specialized managed care plan.

What to Watch

Five states (Florida, Hawaii, Illinois, Michigan, and New York) have pending waiver requests to expand community-based behavioral health benefits (Table 2).  The most frequently sought type of benefit is supportive housing; four states (Florida, Hawaii, Illinois, and Michigan) are proposing waivers to provide or expand supportive housing services for people with behavioral health diagnoses who are homeless or at risk of homelessness.  One state (Illinois) is seeking waiver authority to offer supported employment services.  Two states (Illinois and Michigan) have pending requests to offer peer recovery coaching services.  Three states have pending proposals for other community-based behavioral health benefits (Table 2).  For example, Illinois proposes to cover certain behavioral health services for people who are incarcerated within 30 days of their release to smooth the transition to the community.  These services would include screening and assessment, identification of a post-release provider, one outpatient visit, and extended release naltrexone.

The impact of behavioral health benefit expansions on enrollees’ access to community-based care, health outcomes, and costs will be an important area to watch.  States continue to rely on federal Medicaid funds to meet their Olmstead community integration obligations and rebalance long-term care spending in favor of community-based services instead of institutional care.  Historically, fewer states have offered community-based long-term care services to people with behavioral health needs compared to other populations, such as seniors, people with physical disabilities, and people with intellectual or developmental disabilities.15  In recent years, states have increasingly taken advantage of benefits and federal financing incentives made available under the ACA to serve people with behavioral health needs in the community.16   Section 1115 waiver evaluations and other reports and data from waiver implementation can help CMS, states, health plans, and providers better understand how to design and deliver these benefits.

Expanding Eligibility for People with Behavioral Health Needs

States use waiver authority to cover people with behavioral health needs who are not otherwise eligible for Medicaid and to place enrollment caps on eligibility expansions targeted to people with behavioral health needs.  States do not need waiver authority to expand Medicaid eligibility for many people with behavioral health needs.  Instead, states can use Section 1915 (i) state plan authority to expand Medicaid eligibility to targeted groups of people who are at risk of an institutional level of care (including those with behavioral health needs) up to 150% FPL or up to 300% SSI for those who would be eligible under an existing home and community-based services waiver.17   Section 1115 waiver authority allows states to cap enrollment, while Section 1915 (i) allows states to control enrollment by expanding or restricting functional eligibility criteria.18 

Six states (Arizona, Montana, New Jersey, Utah, Vermont, and Virginia) have Section 1115 waivers that expand Medicaid eligibility to cover people with behavioral health needs (Table 3).  Four of these states (Arizona, Montana, New Jersey, and Vermont) have adopted the ACA expansion to cover nearly all adults up to 138% FPL and are using waiver authority to further expand Medicaid eligibility to targeted groups of people with behavioral health needs.  Arizona’s waiver expands its long-term care eligibility criteria to cover non-elderly adults up to 300% of SSI who do not currently require an nursing home level of care but are at risk of nursing home care due to mental illness.19   Montana’s waiver expands its financial eligibility criteria to cover non-elderly adults with “severe disabling mental illness”20  who do not qualify for the ACA expansion (139-150% FPL for Medicaid-only enrollees and up to 138% FPL for those dually eligible for Medicare and Medicaid).21  New Jersey’s waiver expands financial and functional eligibility criteria to cover two targeted groups of children ages 0-21 with behavioral health needs:  children with serious emotional disturbance (up to 300% SSI if otherwise state plan eligible22  and up to 150% FPL for those not otherwise eligible23 ) and children with qualifying intellectual and developmental disabilities (I/DD) and co-occurring mental illness up to 300% FPL.24   Vermont’s waiver funds coverage for mental health community rehabilitation and treatment services provided under a state program for people with serious and persistent mental illness from 133-185% FPL.25   The other two states (Virginia and Utah) have not adopted the ACA expansion but use waiver authority to expand coverage to adults with behavioral health needs.  Virginia offers a limited physical and behavioral health benefit package to uninsured adults with serious mental illness up to 100% FPL, and Utah covers childless adults up to 5% FPL who are (in order of priority) chronically homeless, involved in the criminal justice system and in need of behavioral health treatment, or in need of behavioral health treatment.

Table 3:  Section 1115 Behavioral Health Eligibility Expansion Waivers as of November, 2017
# of StatesStates
Approved Waiver Provisions (6 states)
Behavioral Health Eligibility Expansion6AZ, MT, NJ, UT, VT, VA
Pending Waiver Requests (4 states)
Behavioral Health Eligibility Expansion2NJ, NY*
Enrollment and Renewal Modification1IL
NOTE: *New York’s pending waiver amendment also would move its existing financial eligibility expansion for children with behavioral health and HCBS needs who currently meet an institutional level of care from Section 1915 (c) to Section 1115 authority.SOURCE:  KFF analysis of Section 1115 waivers posted on Medicaid.gov.

Some states are using waiver authority to limit enrollment in their behavioral health eligibility expansions.  Three states (Montana, New Jersey, and Vermont) have Section 1115 waiver authority to cap the number of people covered under their behavioral health eligibility expansions that cover additional populations beyond the ACA expansion to all adults up to 138% FPL (there is no enrollment cap on the ACA expansion population).  Another state (Virginia) does not impose a numerical cap on its targeted behavioral health eligibility expansion but has periodically amended the financial eligibility limit under the waiver to control the number of people who qualify for coverage.

What to Watch

Two states (New Jersey and New York) have pending waivers that would provide Medicaid eligibility for people with behavioral health needs (Table 3).  New Jersey and New York have adopted the ACA’s Medicaid expansion and are seeking to further expand eligibility to people with behavioral health needs.  New Jersey and CMS are working to finalize approval for a waiver pilot program to provide HCBS to adults with I/DD and acute behavioral health needs.  New York is seeking to expand financial and functional eligibility to provide HCBS for children with behavioral health needs who are at risk of institutional care without regard to parental income.26 

Additionally, one state (Illinois) is seeking waiver authority that would not authorize a new coverage pathway but instead would modify enrollment and renewal rules to facilitate coverage for Medicaid-eligible people being released from prison or jail (Table 3).  Specifically, Illinois proposes to auto-assign incarcerated individuals to managed care plans as early as possible within 30 days of their release and defer eligibility renewals until 180 days post-release.  While most state waiver activity related to eligibility is related to eligibility expansions, one state (Wisconsin) has a pending waiver that could restrict the enrollment of eligible people into coverage.  Box 2 provides more information about Wisconsin’s proposal.

Box 2:  Wisconsin’s Proposed Section 1115 Waiver Provision on Drug Screening and Testing

Wisconsin has a pending waiver request to condition Medicaid eligibility for childless adults on completing drug screening and testing, and if indicated, entering treatment. Specifically, childless adults (who are covered up to 100% FPL under Wisconsin’s waiver) would have to complete a screening questionnaire about their current and prior substance use, and if indicated, a drug test, at application and renewal.  Those who indicate on the questionnaire that they are ready to enter treatment could forgo the drug test and enter treatment.  Those who test positive for a controlled substance without evidence of a valid prescription would have eligibility conditioned on completing treatment, although eligibility would continue if treatment was not immediately available.  Those who refuse to participate in treatment would lose eligibility but could re-apply at any time.  CMS has never before conditioned Medicaid eligibility on drug screening, testing, or treatment.

Key issues to watch regarding eligibility expansion waivers include the effect of coverage on enrollees’ access to needed physical and behavioral health care, health outcomes, and costs.  An evaluation of the first year of Virginia’s behavioral health eligibility expansion (January to December 2015) found that providing coverage is cost-effective, as the average monthly cost of coverage was $200 less than a single emergency room visit for a “very minor” condition ($418 vs. $687).27   About ¾ of waiver enrollees had a claim for behavioral health services, and just over half had a claim for physical health services.28   Virginia is going to further explore enrollees who were identified as being prescribed medication but did not have a prescription drug claim.29   Virginia also noted some of the challenges associated with providing only a limited benefit package to its behavioral health expansion enrollees, including the unmet need for transportation, particularly to access substance use disorder treatment services.30   The Virginia waiver evaluation also discusses the success of offering peer supports to waiver enrollees, describing their impact as “influential,” and the state’s decision to expand those services to all Medicaid enrollees as a result of the demonstration.31 

Financing Behavioral Health Delivery System Reforms

States primarily seek waiver expenditure authority to provide federal funding for behavioral health delivery system reforms.  Under federal law, states have flexibility to design their Medicaid delivery systems and typically can do so without seeking a waiver.  However, states may seek waivers if they want to access federal Medicaid funds to support delivery system reforms.

Four states (Arizona, California, Massachusetts, and New Hampshire) have approved waivers to finance behavioral health delivery system reforms (Table 4).  All include initiatives to better integrate physical and behavioral health care, and three (California, Massachusetts, and New Hampshire) including funding to help states transition to alternative payment models.  Arizona offers specialized health plans that include both acute and behavioral health services for children with certain behavioral health conditions and adults with serious mental illness.  California’s Whole Person Care pilots include funding to support infrastructure development focused on integrating services, improving health outcomes, and reducing unnecessary service use for high-cost, high-risk enrollees. California’s waiver also includes funding to support the state’s transition to risk-based alternative payment models.  Massachusetts’ waiver funds the state’s transition to accountable care organizations that will integrate physical, behavioral health, long-term care, and health-related social services.  New Hampshire’s waiver authorizes performance-based incentive payments to providers who integrate physical and behavioral health services, increase workforce capacity, develop information technology infrastructure, and better coordinate care.

Table 4:  Section 1115 Behavioral Health Delivery System Reform Waivers as of November, 2017
# of StatesStates
Approved Waiver Provisions (4 states)*
Physical/Behavioral Health Integration4AZ, CA, MA, NH
Transition to Alternative Payment Model3CA, MA, NH
Pending Waiver Requests (3 states)
Physical/Behavioral Health Integration3IL, MI**, NC
Transition to Alternative Payment Model2MI, NC
Workforce Development Initiatives2IL, NC
NOTES: *While no specific waiver authority is granted, Maryland’s waiver commits the state to developing and implementing a physical/behavioral health integration model for individuals with substance use disorders by January 1, 2019 as part of its IMD payment waiver.  **Michigan’s integration model currently exists under Section 1915 (b)/(c) authority that the state is seeking to convert to Section 1115.SOURCE:  KFF analysis of Section 1115 waivers posted on Medicaid.gov.

What to Watch

Three states (Illinois, Michigan, and North Carolina) have pending waivers seeking funding to support behavioral health delivery system reform initiatives (Table 4).  All include provisions related to behavioral and physical health integration, two (Michigan and North Carolina) seek funding for alternative payment models, and two (Illinois and North Carolina) seek funding for workforce development initiatives.  Specifically, Illinois seeks funding to support the development of technology and training to implement health homes and workforce development programs, including loan forgiveness and telemedicine infrastructure and training.  Michigan is seeking waiver funding for alternative payment methodologies based on quality outcomes, shared savings/shared risk models, and incentives for care coordination for high utilizers.  North Carolina’s waiver application mentions initiatives related to integrating behavioral health care into primary care settings, value and performance-based payments, a pilot special needs health plan targeted to people with serious and persistent mental illness, and funding for workforce training.32 

CMS’s response to waiver requests to fund delivery system reform initiatives will be an important area for states to watch.  CMS’s November, 2017 IMD payment waiver guidance confirms that the Medicaid Innovation Accelerator Program will continue to be available to help states improve their substance use treatment delivery systems.  It not yet clear how CMS will respond to state requests to obtain federal funding for state-funded programs (“designated state health programs”) through waivers.

Looking Ahead

States’ Section 1115 waiver requests continue to reflect Medicaid’s important role in financing behavioral health coverage and can help CMS and states identify best practices, particularly related to state efforts to address the opioid epidemic. While different administrations may implement different policy priorities through waivers, CMS is continuing to allow states to use waivers to fund short-term IMD substance use treatment services.  Key issues to watch related to Medicaid Section 1115 behavioral health waivers include how CMS and states will balance expanding institutional services while also ensuring access to community-based services and preventing unnecessary institutionalization; what impact benefit and eligibility expansions will have on health outcomes, access to care, and costs; and how CMS and states will use Section 1115 waivers to prioritize and implement delivery system reforms.  As the Trump Administration issues more waiver decisions, other trends may become apparent which in turn could influence future state waiver requests related to behavioral health services, eligibility, and delivery system initiatives.

Appendix

Appendix Table 1:  Approved Medicaid Section 1115 Behavioral Health Waivers, as of November, 2017
StateWaiver NameWaiver Expiration DateIMD PaymentOther Behavioral Health Services ExpansionEligibility ExpansionDelivery System Reform
Total approved waivers: 15 states 8 states*9 states6 states5 states
AZArizona Health Care Cost Containment System9/30/2021XX
CACalifornia Medi-Cal 202012/30/2020XX
DEDelaware Diamond State Health Plan12/31/2018X
HIHawaii QUEST Integration12/31/2018X
KSKanCare12/31/2018X
MAMassHealth6/30/2022XXX
MDMaryland Health Choice12/31/2021XXX
MTMontana Additional Services and Populations12/31/2017X
NHBuilding Capacity for Transformation12/31/2020X
NJNew Jersey Comprehensive Waiver6/30/2022XXX
NYNew York Medicaid Redesign Team3/31/2021X
UTPrimary Care Network6/30/22XX
VAVirginia Governor’s Access Plan (GAP) and Addiction and Recovery Treatment Services (ARTS) Demonstration12/31/2019XX
VTVermont Global Commitment to Health12/31/2021XXX
WVWV Creating a Continuum of Care for Medicaid Enrollees with SUD12/31/22XX
NOTE: *Includes 7 states with IMD substance use waiver (CA, MA, MD, NJ, UT, VA, and WV)  and 1 state (VT) with IMD mental health waiver.SOURCE:  KFF analysis of Section 1115 waivers posted on Medicaid.gov.
Appendix Table 2: Pending Medicaid Section 1115 Behavioral Health Waivers, as of November, 2017
StateWaiver NameNew, Amendment, ExtensionIMD PaymentOther Behavioral Health Services ExpansionEligibility ExpansionDelivery System Reform
Total pending waivers: 11 states 7 states5 states2 states3 states
AZArizona Health Care Cost Containment SystemAmendmentX
FLFlorida Managed Medical AssistanceAmendmentX
HIHawaii QUEST IntegrationAmendmentX
ILIllinois Behavioral Health TransformationNewXXXX
INHealthy Indiana Plan (HIP) 2.0ExtensionX
KYKentucky HEALTHNewX
MAMassHealthAmendmentX
MIMichigan Pathway to IntegrationNewXXX
NCNorth Carolina’s Medicaid Reform DemonstrationNewX
NYNew York Medicaid Redesign TeamAmendmentsXX
WIBadger Care ReformAmendmentX
NOTES: State waiver renewals that do not propose changes and amendments that are technical in nature are excluded from this table.SOURCE:  KFF analysis of Section 1115 waivers posted on Medicaid.gov.


Endnotes

  1. Kaiser Family Foundation, CMS’s Final Rule on Medicaid Managed Care:  A Summary of Major Provisions (June, 2016), https://modern.kff.org/medicaid/issue-brief/cmss-final-rule-on-medicaid-managed-care-a-summary-of-major-provisions/. ↩︎
  2. States can effectively receive federal matching funds for capitation payments made for enrollees with IMD stays up to 30 days if the stay does not exceed 15 days in a single month.  Id.  Prior to the revised managed care rule, some states were using “in lieu of” authority to cover IMD services without day limits. ↩︎
  3. California allows a one-time 30-day extension if medically necessary, and peri-natal patients may stay for the duration of pregnancy and 60 days post-partum. ↩︎
  4. Without waiver authority, federal law allows states to use a portion of their Medicaid disproportionate share hospital funds to offset IMDs’ uncompensated care costs.  See, e.g., GAO, States Fund Services for Adults in Institutions for Mental Disease Using a Variety of Strategies, GAO-17-652,  at 34 (Aug. 2017), http://www.gao.gov/assets/690/687212.pdf. ↩︎
  5. CMS, SMD #15-003, New Service Delivery Opportunities for Individuals with a Substance Use Disorder (July 27, 2015), https://www.medicaid.gov/federal-policy-guidance/downloads/SMD15003.pdf. ↩︎
  6. CMS, SMD #17-003, Strategies to Address the Opioid Epidemic (Nov. 1, 2017), https://www.medicaid.gov/federal-policy-guidance/downloads/smd17003.pdf. ↩︎
  7. Medicaid community-based behavioral health services can be covered under state plan or waiver authority. ↩︎
  8. CMS, SMD #15-003, New Service Delivery Opportunities for Individuals with a Substance Use Disorder (July 27, 2015), https://www.medicaid.gov/federal-policy-guidance/downloads/SMD15003.pdf. ↩︎
  9. Id.  ↩︎
  10. CMS, SMD #17-003, Strategies to Address the Opioid Epidemic (Nov. 1, 2017), https://www.medicaid.gov/federal-policy-guidance/downloads/smd17003.pdf. ↩︎
  11. For example, states must include an “independent process for reviewing placement in residential treatment settings.”  Id. ↩︎
  12. Another state (Maryland) indicated that CMS denied its request for IMD mental health payment waiver authority, while approving its request for IMD substance use payment authority.  GAO, States Fund Services for Adults in Institutions for Mental Disease Using a Variety of Strategies, GAO-17-652,  at 30 (Aug. 2017), http://www.gao.gov/assets/690/687212.pdf. ↩︎
  13. In Olmstead, the Supreme Court found that the unjustified institutionalization of people with disabilities violates the Americans with Disabilities Act. Kaiser Family Foundation, Olmstead’s Role in Community Integration for People with Disabilities Under Medicaid:  15 Years After the Supreme Court’s Olmstead Decision (June, 2014), https://modern.kff.org/medicaid/issue-brief/olmsteads-role-in-community-integration-for-people-with-disabilities-under-medicaid-15-years-after-the-supreme-courts-olmstead-decision/.  Although the ADA’s anti-discrimination provisions do not apply to individuals who are currently using illegal drugs, the ADA does protect people who previously used illegal drugs and people with mental health disabilities.  ADA Title II Technical Assistance Manual, § II-2.3000, https://www.ada.gov/taman2.html. ↩︎
  14. While federal Medicaid funds cannot be used to pay for rent, states can use Medicaid to cover housing transition and tenancy-sustaining services.  CMS Informational Bulletin, Coverage of Housing-Related Activities and Services for Individuals with Disabilities (June, 2015), https://www.medicaid.gov/federal-policy-guidance/downloads/CIB-06-26-2015.pdf. ↩︎
  15. Kaiser Family Foundation, Medicaid Home and Community-Based Services Programs:  2013 Data Update (Oct., 2016), https://modern.kff.org/medicaid/report/medicaid-home-and-community-based-services-programs-2013-data-update/. ↩︎
  16. Kaiser Family Foundation, Money Follows the Person:  A 2015 State Survey of Transitions, Services, and Costs (Oct. 2015), https://modern.kff.org/medicaid/report/money-follows-the-person-a-2015-state-survey-of-transitions-services-and-costs/; Kaiser Family Foundation, Medicaid Balancing Incentive Program:  A Survey of Participating States (June, 2015), https://modern.kff.org/medicaid/report/medicaid-balancing-incentive-program-a-survey-of-participating-states/. ↩︎
  17. Kaiser Family Foundation, Medicaid Financial Eligibility for Seniors and People with Disabilities in 2015 (March, 2016), https://modern.kff.org/medicaid/report/medicaid-financial-eligibility-for-seniors-and-people-with-disabilities-in-2015/. ↩︎
  18. Id.  ↩︎
  19. Enrollees receive state plan physical and behavioral health benefits and home and community-based services. ↩︎
  20. Enrollees must qualify for state-funded limited mental health benefit program. ↩︎
  21. Enrollees receive state plan services. ↩︎
  22. Enrollees receive all state plan services and targeted home and community-based services. ↩︎
  23. Enrollees receive state plan behavioral health services and targeted home and community-based services only. ↩︎
  24. Enrollees receive state plan and home and community-based services. ↩︎
  25. Enrollees receive service coordination, community supports, flexible supports including day recovery and psychoeducation (including support for families and significant others), skilled therapy, residential treatment (excluding IMD services), housing and home supports, crisis support, environmental safety devices, counseling, respite, and supported employment. ↩︎
  26. New York’s pending waiver amendment also would move its existing financial eligibility expansion for children with behavioral health and HCBS needs who currently meet an institutional level of care from Section 1915 (c) to Section 1115 authority. ↩︎
  27. Virginia’s Governor’s Access Plan for the Seriously Mentally Ill Evaluation Report, Year 1 at 2, 21 (June 27, 2016), ↩︎
  28. Id. at 12. ↩︎
  29. Id. at 10, 11. ↩︎
  30. Id. at 14, 23. ↩︎
  31. Id. at 22, 23. ↩︎
  32. This summary is based on the state’s June, 2016 waiver application that is pending with CMS and does not reflect any changes in the August, 2017 proposed managed care program design that has not yet been submitted to CMS.  North Carolina’s Proposed Medicaid Managed Care Program Design (August, 2017), https://files.nc.gov/ncdhhs/documents/files/MedicaidManagedCare_ProposedProgramDesign_REVFINAL_20170808.pdf. ↩︎
News Release

ANALYSIS: More than Half of Uninsured People Eligible for Marketplace Insurance Could Pay Less for Health Plan than Individual Mandate Penalty

About 4 in 10 Could Obtain Bronze Plan at No Cost

Published: Nov 9, 2017

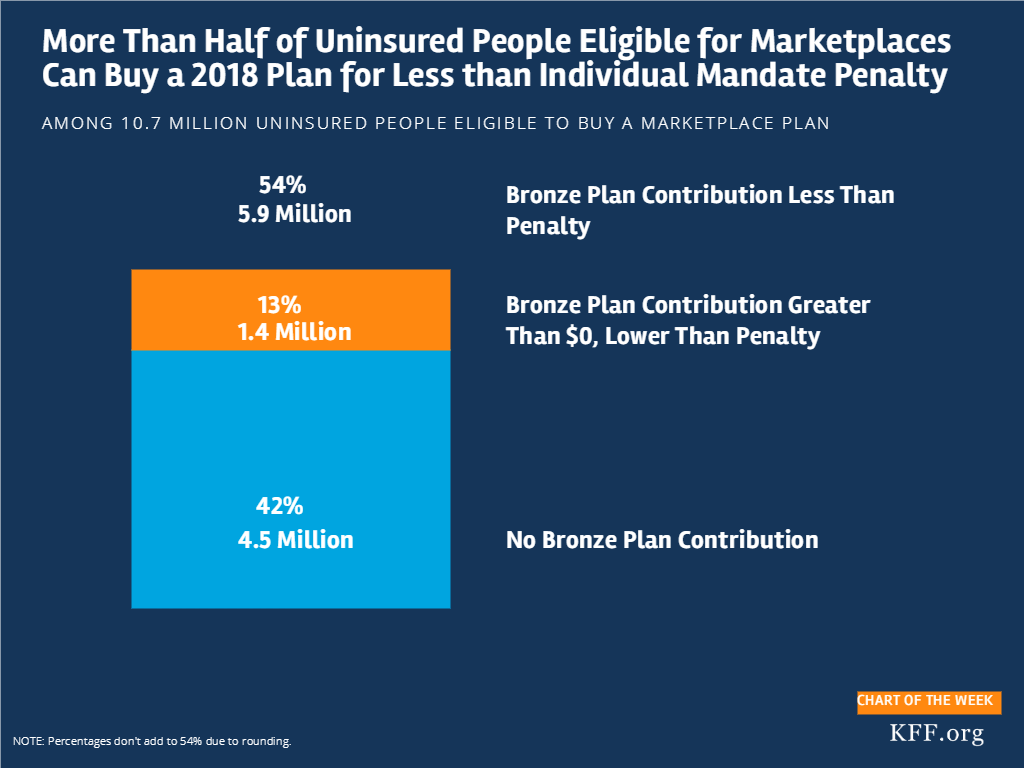
new Kaiser Family Foundation analysis finds that more than half (54% or 5.9 million) of the 10.7 million people who are uninsured and eligible to purchase an Affordable Care Act marketplace plan in 2018 could pay less in premiums for health insurance than they would owe as an individual mandate tax penalty for lacking coverage.

Within that 5.8 million, about 4.5 million (42% of the total) could obtain a bronze-level plan at no cost in 2018, after taking income-related premium tax credits into account, the analysis finds.

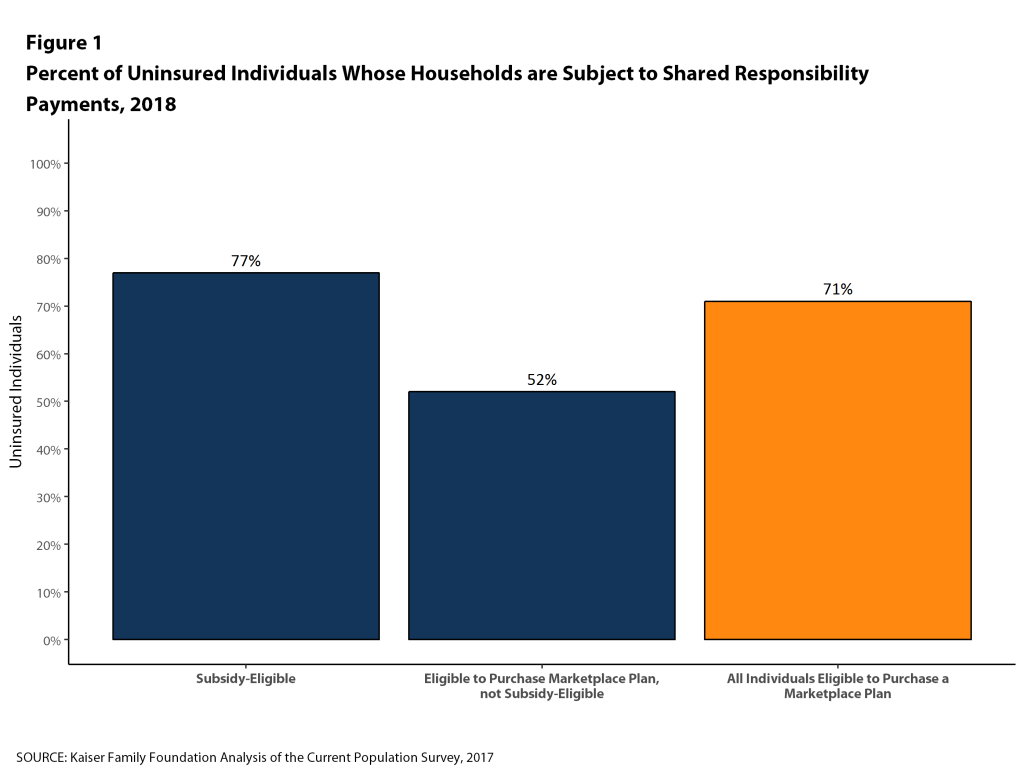
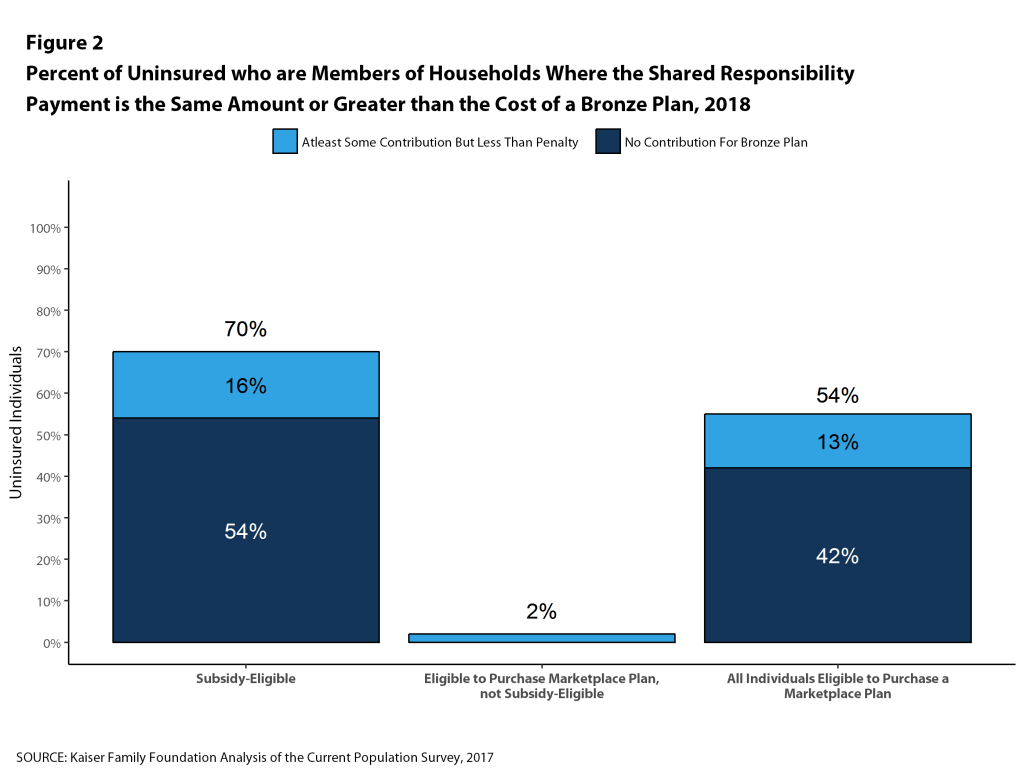
Most people without insurance who are eligible to buy marketplace coverage qualify for subsidies in the form of tax credits to help pay premiums for marketplace plans (8.3 million out of 10.7 million). Among those eligible for premium subsidies, the analysis finds that 70 percent could pay less in premiums than what they’d owe as a tax penalty for lacking coverage, with 54 percent able to purchase a bronze plan at no cost and 16 percent contributing less to their health insurance premium than the tax penalty they owe.

Among the 2.4 million uninsured, marketplace-eligible people who do not qualify for a premium subsidy, 2 percent would be able to pay less for marketplace insurance than they’d owe for their 2018 penalty, the analysis finds.

The Affordable Care Act’s individual mandate requires that most people have health coverage or be subject to a tax penalty unless they qualify for certain exemptions. The individual mandate is still in effect, though Congress may consider repealing it as part of tax legislation.

Consumers can compare their estimated 2018 individual mandate penalty with the cost of marketplace insurance in their area with KFF’s new Individual Mandate Penalty Calculator.

The deadline for ACA open enrollment in most states is Dec. 15, 2017.

How do Health Care Costs fit into Family Budgets? Snapshots from Medicaid Enrollees

Authors: Samantha Artiga, Jennifer Tolbert, and Petry Ubri
Published: Nov 9, 2017

Key Takeaways

As the health care debate continues at the federal level and states pursue changes to their Medicaid programs through waivers, it is important to consider how health care costs fit into family budgets and how changes to Medicaid could affect family finances and access to care. Based on 21 interviews with Medicaid enrollees in five cities, this brief examines their family budgets, how health care costs fit into these budgets, and their views on how potential changes to health care could affect them. It finds:

  • Most participants with Medicaid coverage are in a working family but live on very strained budgets with costs for basic needs taking up the majority of their monthly income. Participants are in low-wage jobs that often have fluctuating incomes, such as customer service representatives, retail workers, food service workers, daycare workers, home care attendants and warehouse employees. Those who are not working are caring for children or other family members, have a disability or serious health problem, are recently unemployed and seeking work, or are full-time students. Costs for basic needs such as housing, food, and transportation take up nearly all of their monthly income, and they often come up short on their monthly bills. Financial pressures cause them significant stress and anxiety, keeping them up at night and exacerbating health problems like depression and anxiety.
  • Given their limited budgets, Medicaid is key for enabling participants to afford coverage and needed care. Most participants do not have access to or cannot afford employer-based coverage and were uninsured before they gained Medicaid. Some became eligible under the Affordable Care Act (ACA) Medicaid expansion; others qualify through eligibility pathways that existed before the ACA. Given their limited budgets, participants have little ability to pay for health care. They noted that they would not be able to afford coverage or care without Medicaid’s limited out of pocket costs. Participants reported getting needed care and generally were satisfied with their Medicaid coverage. Some pointed to challenges finding some specialists, such as psychiatrists, and some wished for broader vision and dental coverage for adults. 
  • Participants were concerned they would need to make trade-offs between paying for basic needs and going without care if their costs for health coverage and/or care increased. Participants noted that they do not have room in their budgets for increased health expenses. They pointed out that even small premiums or copayments could add up across family members or for multiple services or prescription drugs. Moreover, if they lost Medicaid, they do not think they would be able to afford other coverage. As such, increases in premiums or copays in Medicaid would likely lead to access barriers for these individuals and create further strain on their budgets. Similarly, these individuals would face higher costs in the form of premiums and cost sharing in Marketplace or other private plans. 

Introduction

Low-income families face significant financial pressures and often struggle to cover expenses for basic needs each month. Health coverage is key for enabling individuals to access needed care and provides families with financial protection from the high cost of medical bills. Medicaid provides health coverage to over 74 million low-income parents, pregnant women, children, elderly individuals, and individuals with disabilities. As debate over health care continues at the federal level and states pursue changes to their Medicaid programs through Section 1115 waivers, insights into how health care costs fit into the family budgets of Medicaid enrollees are important to assess how changes to the program would affect family finances and access health care.

Most participants with Medicaid coverage are in a working family but live on very strained budgets.

This brief examines the family budgets of 21 Medicaid enrollees and explores how health care costs fit into their budgets. It also provides insight into enrollees’ views on how potential changes to health care could affect them. It builds upon a previous brief profiling Medicaid and Marketplace enrollees: How Would Proposed Changes to Medicaid and Marketplace Coverage Affect Real People? The findings are based on in-depth, in-person interviews conducted by the Kaiser Family Foundation and NORC at the University of Chicago during Summer 2017 with Medicaid enrollees in five cities (Richmond, Virginia; Kansas City, Kansas; Nashville, Tennessee; Portland, Oregon; and Albuquerque, New Mexico) and self-reported household income and expenses from interviewees. Interviews also were conducted with six uninsured individuals in these cities to understand how experiences vary between low-income individuals with Medicaid and those who are uninsured.

Medicaid enrollees were selected to provide for gender and racial/ethnic diversity and to represent enrollees eligible through a variety of eligibility pathways, including parents, pregnant women, adults with disabilities, and expansion adults in states that implemented the expansion. The locations provided geographic diversity and differing state decisions to implement the Affordable Care Act (ACA) Medicaid expansion to adults. Two cities were in Medicaid expansion states (New Mexico and Oregon), and three cities in states that have not implemented the expansion (Kansas, Tennessee, and Virginia).

Key Findings

Family Budgets

Most participants with Medicaid coverage are working or have a spouse or partner in the family that is working (Table 1). However, most of these jobs are low-wage positions that do not offer benefits or insurance, and many have fluctuating or seasonal hours that lead to varying income from month to month. Examples of these positions include customer service representatives, retail workers, food service workers, daycare workers, home care attendants, and warehouse employees. Many participants who are working part-time indicated that they would like to pick up more hours. Some participants said that their work schedule options are limited because they have to arrange work around when other family members can care for their children. They noted that this is an even larger challenge in the summer when children are out of school. Several participants indicated plans to go back to school to improve their job opportunities.

Table 1: Profiles of Medicaid Enrollee Participants*
Expansion States
Kristina, 36, Albuquerque, NMGross Household Monthly Income:$2,605 (127% FPL)Household Size: 4Kristina lives with her boyfriend and two sons in a home that they rent from her parents. She works part-time in merchandising. After her son was diagnosed with autism, she left her full-time job to have more time to care for him. Her boyfriend works full-time as a pizza delivery driver.Suzanne, 32, Albuquerque, NMGross Household Monthly Income:$2,663 (97% FPL)Household Size: 6Suzanne lives with her five children in a small home that she recently downsized to in order to save money. She is currently working as a brand ambassador, but her work options are limited because of a knee injury. Her goal is to go back to school to pursue a nursing degree.Cheryl, 38, Albuquerque, NMGross Household Monthly Income:$1,815 (76% FPL)Household Size: 5Cheryl lives with her four children. Their primary source of income is social security survivor benefits received by her children. Her ability to work is limited because she is caring for one her sons who is facing behavioral health problems.
Cynthia, 29, Albuquerque, NMGross Household Monthly Income: $1,250 (40% FPL)Household Size: 7Cynthia lives with her boyfriend and their five children in a house that was given to her boyfriend by his grandfather. She is a self-employed party planner and her boyfriend is a self-employed mechanic.Joy, 56, Portland, ORGross Household Monthly Income: $0 (0% FPL)Household Size: 1Joy lives by herself and has one grown daughter. She is recovering from shoulder surgery. She hopes to return to her job as a caregiver once she recovers.Ruthkeysha, 28, Portland, ORGross Household Monthly Income: $421 (18% FPL)Household Size: 5Ruthkeysha lives with her twin 9-year-olds, and their 7-year-old younger brother. She works as a caregiver for her grandmother who also lives in the home with them.
Barbara, 23, Portland, ORGross Household Monthly Income:$1,100 (109% FPL)Household Size: 1Barbara lives with roommates. She works part-time as a caregiver for adults with developmental disabilities and hopes to go back to school to study industrial design.Diana, 36, Portland, ORGross Household Monthly Income:$1,321 (78% FPL)Household Size: 3Diana lives with her two sons ages 3 to 16. She works part time as a home care aide. She is hoping to pick up more clients for additional hours of work.Jeannie, 42, Portland, ORGross Household Monthly Income:$506 (25% FPL)Household Size: 4Jeannie lives with her boyfriend and two daughters. She is unable to work due to health problems and is applying for Social Security disability benefits.
Non-Expansion States
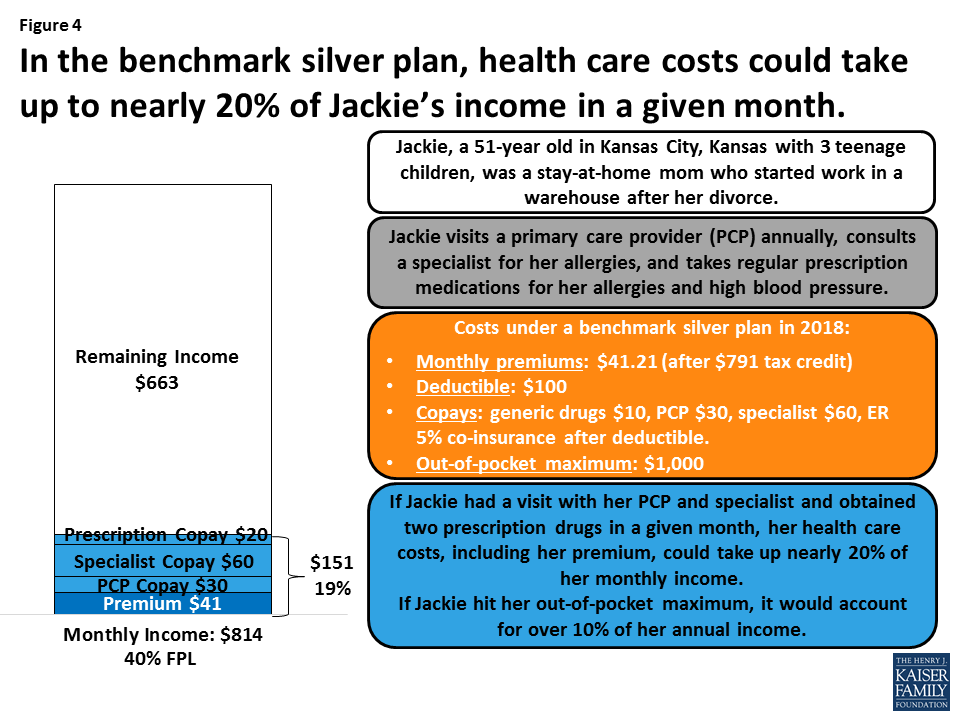
Kimberly, 45, Kansas City, KSGross Household Monthly Income:$2,000 (98% FPL)Household Size: 4Kimberly lives with her boyfriend and two children ages 6 and 8. She is a stay at home mom but is looking into part-time options now that her youngest started school. Her boyfriend is a self-employed handyman.Megan, 27, Kansas City, KSGross Household Monthly Income:$1,350 (66% FPL)Household Size: 4Megan lives with her 3-year-old son and twin 9-month-old girls. She was a stay at home mom but, after separating from the children’s father, began working part-time as a restaurant server.Jackie, 51, Kansas City, KSGross Household Monthly Income:$814 (40% FPL)Household Size: 4Jackie lives with her three teenage children. She was a stay-at-home mom for 16 years but began working as a warehouse employee after her divorce.
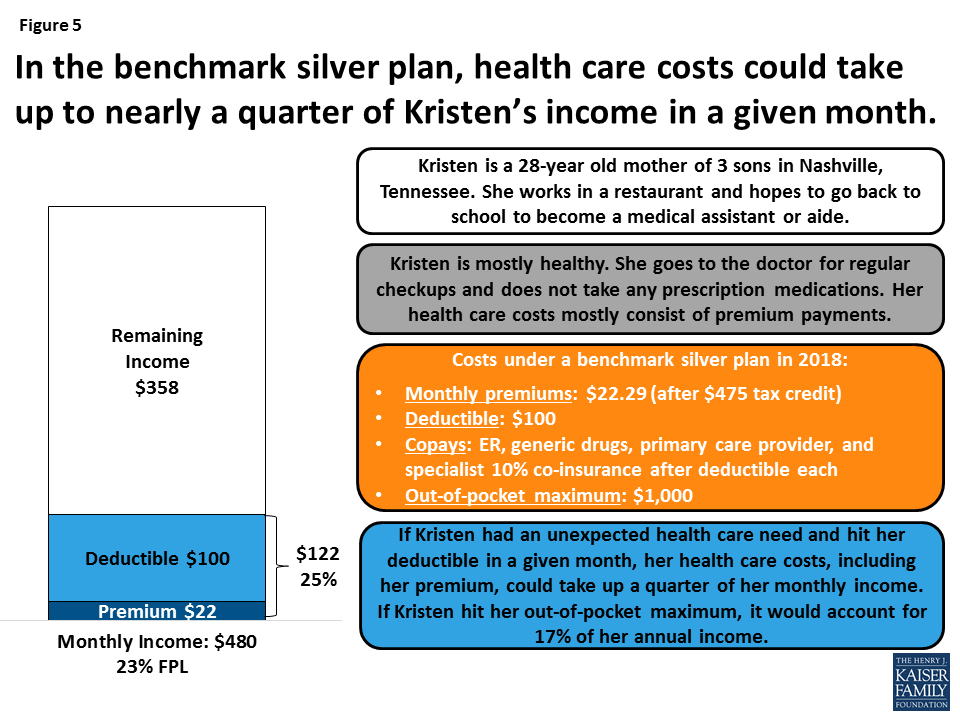
Kristen, 28, Nashville, TNGross Household Monthly Income:$480 (23% FPL)Household Size: 4Kristen lives with three sons in her aunt’s home. She works in a restaurant but has difficulty finding hours in the summer with the children out of school. She hopes to go to school to be a medical assistant.George, 44, Nashville, TNGross Household Monthly Income:$733 (73%FPL)Household Size: 1George lives on his own in a rented apartment. He became disabled in 2011 and currently lives on his fixed SSI disability payments each month.Kristen, 27, Nashville, TNGross Household Monthly Income:$250 (10% FPL)Household Size: 5Kristen lives with her four children in the mobile home in which she was raised. She provides childcare in her home for several children.
Nikki, 37, Richmond, VAGross Household Monthly Income:$900 (67% FPL)Household Size: 2Nikki lives with her 9-year-old son who has autism. She has been unable to work since 2011 due to serious health problems, including stomach cancer and a heart attack. Her son receives monthly SSI disability payments.Amy, 33, Richmond, VAGross Household Monthly Income:$2,000 (98% FPL)Household Size: 4Amy lives with her three children, including her new baby. For the past 13 years, she has been working supervising a cleaning crew. She hopes to one day to go back to school to become a nurse.Lydia, 48, Richmond, VAGross Household Monthly Income:$557 (27% FPL)Household Size: 4Lydia lives with her three daughters. She recently became unemployed and is searching for a new job.
Note: *Some enrollees in expansion states are enrolled through traditional eligibility pathways (e.g., for parents and individuals with disabilities). Household income may be different from income calculated for Medicaid eligibility because it is gross income, includes income from all members of the household, and includes cash and food assistance.

Participants who are not working are caring for children or other family members, have a disability or serious health problem, are recently unemployed and seeking work, or are full-time students. Individuals who are not able to work due to physical or mental health problems reported a variety of conditions, including congestive heart failure, post-traumatic stress disorder, bipolar disorder, arthritis, knee injuries, among others. Other individuals are caregivers for other family members who have extensive physical or behavioral health issues. Several individuals are going through difficult transitions in life, such as recent unemployment or separation from a spouse or partner. Those who are recently unemployed are in the process of looking for jobs.

“So a lot of times I will go without things like my phone… With the cost of food right now, sometimes it can get extremely high… So sometimes we have to cut back… we just can’t afford it anymore.”
– Lydia, Richmond

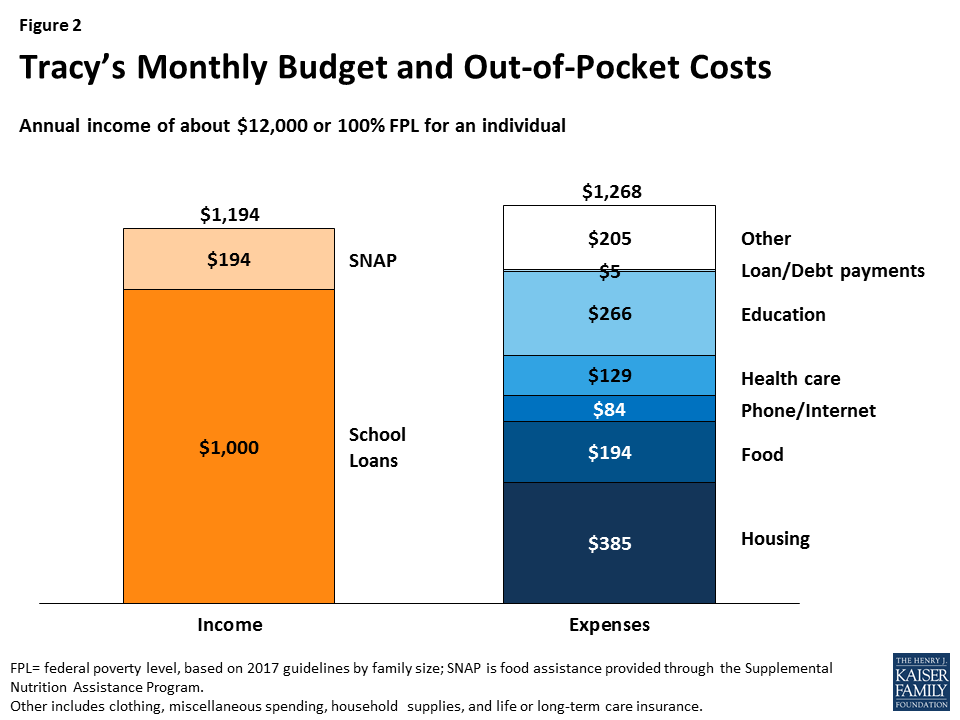
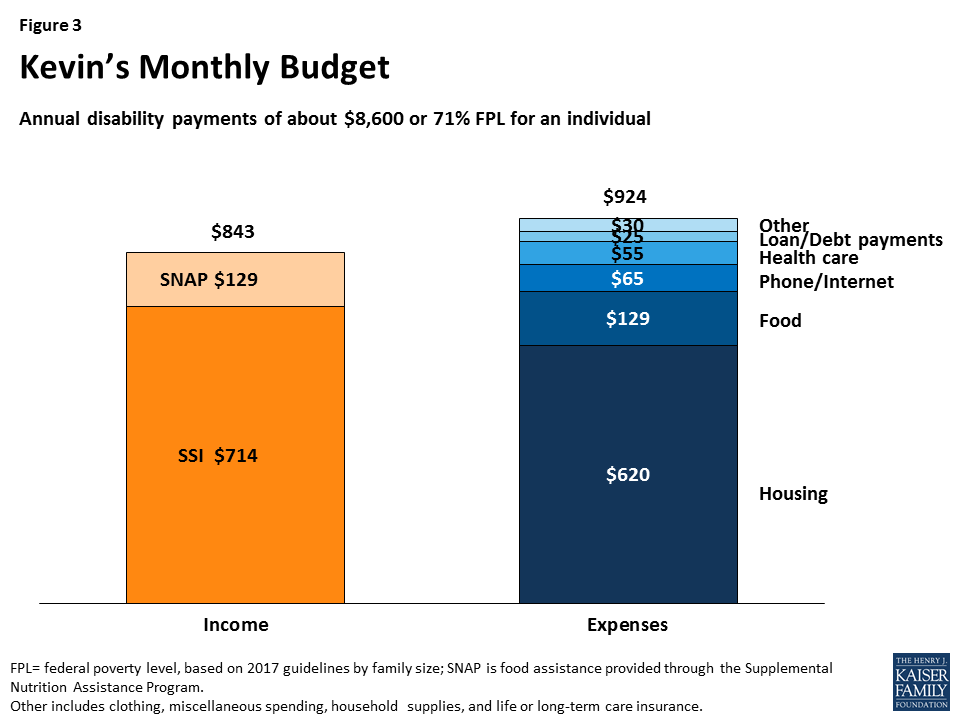
Participants reported facing major financial pressures and difficulty paying their monthly bills. Expenses for basic needs such as housing, food, and transportation take up nearly all of participants’ monthly income, and they often come up short on their bills and have to juggle and put off expenses. Several participants indicated that they sometimes turn to food pantries or charities. Participants noted that they live frugally to try to stay within their limited budgets, looking for savings and discounts and only buying what they need. They often go without things like cable, cell phones, or eating out and sometimes activities for their children. Despite the significant financial pressures these individuals face, a number said that they try to limit the help and resources they rely on because there are others with greater needs.

Participants reported no or limited savings to rely on when faced with unexpected costs. Without savings available, many noted that they sometimes turn to family for financial help when unexpected costs like car or home repairs arise. Those who do not have family available to help or whose families cannot always help sometimes use credit cards or short-term loans to pay for these expenses but then are left with debts that are difficult to repay.

Many participants reported having medical debt in collections, primarily acquired from a time when they were uninsured. Reported medical debts ranged from $300 to $30,000. In most cases, this debt was from when the individual or a family member received hospital care or surgery during a time when that person was uninsured. Most participants said they cannot afford to pay the debt and that it is in collections, negatively affecting their credit and limiting their ability to open bank accounts or make certain purchases, like a car. Some noted that their inability to pay these medical bills prompted them to prioritize obtaining health insurance in order to avoid large medical bills in the future.

“[The financial pressure] is just stressful because I already have PTSD and that always makes it worse.”
– Kevin, Nashville

Participants said that financial pressures cause them significant stress and anxiety, often keeping them up at night. Some participants noted that financial pressures exacerbate existing health problems such as depression or anxiety. Others said that their financial situation negatively affects their self-esteem and makes them feel like a failure or bad parent because they are unable to provide their children with the things they want or pay for their activities.

MEDICAID COVERAGE SNAPSHOT: MELODIE, 23, RICHMOND, VIRGINIA

Melodie is a 23-year old mother who lives in Richmond with her three-year-old daughter. Melodie works full-time as a customer service representative. She works overnight hours so that her mother can watch her daughter since she cannot afford other childcare. Melodie reported that her household monthly income for April 2017 was about $600, which is about 43% of the poverty level for a family of two.

Even with full-time work, Melodie struggles to pay her bills every month as her expenses exceed her monthly income. Housing, food, and transportation take up nearly two-thirds of her income and she sometimes comes up short on her bills (Figure 1). Melodie also has $4,000 in medical debt, an amount nearly seven times her monthly income, from when she needed emergency care and surgery while previously uninsured. Her medical debt is in collections, which has damaged her credit and prevented her from being able to open a bank account.

After a period of being uninsured and not accessing care unless it was an emergency, Melodie enrolled in Medicaid. Her daughter also has Medicaid coverage. Melodie says Medicaid enables her and her daughter to get needed physical and mental health services. Melodie, who is expecting her second child, is receiving prenatal care as well as treatment for depression and anxiety. Her daughter receives behavioral health services for attention-deficit/hyperactivity disorder (ADHD) in addition to well-child checkups and other physical care. With Medicaid coverage, Melodie has few out-of-pocket health care expenses, although she does pay for some uncovered and over-the-counter medications.

Melodie says that she would not be able to afford the premium for a private plan given her limited budget and would be uninsured without Medicaid. Without coverage, she says she would have to put off care and rely on the emergency room because she would not be able to afford to pay for doctor’s visits. She is concerned that if her out-of-pocket costs for care increased and/or she lost access to Medicaid that she would no longer get all the care she needs and her depression may worsen.

Figure 1: Melodie’s Monthly Budget

Health Care Costs

“[Getting Medicaid was] very relieving. It felt like a weight lifted off my shoulders… Because you don’t have the money to pay out of pocket or go to the ER and get a thousand dollar bill later…. So when I finally got it, it was a big relief.”
– Kristen, Nashville

Most participants were uninsured before they obtained Medicaid and said they delayed and went without needed care due to cost when they were uninsured. While uninsured, they relied on emergency rooms for care that they could not put off, often resulting in large bills they could not pay. Some participants became eligible for Medicaid under the ACA Medicaid expansion to low-income adults and noted they would be uninsured without the expansion. Others qualify through eligibility pathways that existed before the ACA. Participants noted that they no longer had to delay care or rely on emergency rooms after gaining Medicaid. They also said that having Medicaid gives them peace of mind knowing they are protected from high costs if an emergency or unexpected health need arises. Some participants had private coverage prior to Medicaid but lost this coverage when they changed or lost jobs or aged out of their parent’s policy. Some noted that, when they had private insurance, they often had difficulty accessing care because of its higher out of pocket costs.Given their limited budgets, Medicaid is key for enabling participants to afford coverage and needed care for themselves and their children. Participants noted that they have limited room in their already strained budgets for health care. Reflecting the Medicaid program’s limits on premium and cost sharing amounts, participants with Medicaid reported limited out of pocket costs for health care with no premiums and relatively low cost sharing levels. Some participants did report paying out of pocket for uncovered or over the counter drugs and/or items or services such as eyeglasses. However, others said they are foregoing uncovered services, such as glasses or dental care, because of costs. In addition, participants noted that they often confirm coverage of services before seeking them because of concerns about costs.

“I don’t know what I would have done if my kids hadn’t had health insurance. Like, with how much care they’ve needed and how often they’ve been sick? I just can’t imagine them not having health insurance.”
Megan, Kansas City

Participants with Medicaid reported getting needed care and were generally satisfied with their coverage. Most participants said they have a regular primary care provider and receive regular check-ups and screenings for themselves and their children. A number also said they see specialists to address mental and/or physical health issues. Some individuals have multiple and, in some cases, complex physical and mental health needs, including anxiety and depression, post-traumatic stress disorder, bipolar disorder, heart disease, high blood pressure, asthma, and cancer. In addition, some with substance and/or alcohol use disorders described how Medicaid provides them access to services they need to support their recovery. Despite being generally satisfied with their coverage, some wished they had broader dental and vision coverage, although those with children noted their children are able to get the dental and vision services they need with Medicaid. Some individuals pointed to challenges finding certain specialists, such as a psychiatrist and pain specialist; others said they do not have difficulty finding conveniently located providers who accept their insurance.

MEDICAID COVERAGE SNAPSHOT: TRACY, 38, ALBUQUERQUE, NEW MEXICO

Tracy is a 38-year-old full-time student pursuing a teaching degree in Albuquerque, New Mexico. Prior to going back to school, Tracy was a janitor, but he now is pursuing his goal of teaching science to early elementary school children. Tracy receives $1,000 per month in student loans, which is about 100% of poverty for an individual. He has a part time job at the campus bookstore but does not currently have many hours due to the slower summer season. Tracy lives on a very tight budget, with housing and food constituting over half of his monthly income (Figure 2). He cuts back on expenses where he can, sometimes going without a phone to save money. While he tries to live within his limited budget, he sometimes comes up short on his bills.Tracy is eligible for Medicaid because New Mexico implemented the ACA Medicaid expansion, which expanded eligibility to adults with incomes up to 138% of poverty. Tracy enrolled in Medicaid in 2015 when completing a recovery program for substance use disorder. Before he had Medicaid, Tracy was uninsured. With Medicaid, Tracy is accessing services to support his substance use recovery, which has allowed him to pursue his goal of becoming a teacher. Because of his limited budget, Tracy does not think he would be able to afford very much in premium or cost sharing expenses. He currently pays out of pocket for some over the counter medications and his eyeglasses.

Though he hopes to have access to employer-sponsored insurance when he becomes a teacher, Tracy is grateful that Medicaid is available for him right now. Without the Medicaid expansion, Tracy would lose his Medicaid coverage. Tracy does not think he could afford a private plan and says he would not be able to access the services he needs to support his recovery without Medicaid coverage.

Figure 2: Tracy’s Monthly Budget and Out-of-Pocket Costs

Views on Potential Changes to Coverage

“I wouldn’t have…the money to afford the copays and the medication…. It would affect my whole life, my son’s life, my family members’ lives, because that means they’re gonna have to help me and they’re already struggling as well.”
Nikki, Richmond

“I think [losing Medicaid would affect my health]. I definitely would be second guessing going [to the doctor]. I would second-guess even going…Yeah, it would definitely take a toll on my health.”
Suzanne, Albuquerque

Most participants with Medicaid coverage had limited knowledge of potential changes to health care being discussed at the federal level but were fearful about facing increased costs or losing access to Medicaid. Participants said they would have difficulty paying higher costs for coverage or care. When asked about potential changes that could result in monthly premiums and/or higher cost sharing amounts, most indicated a willingness to pay but had concerns about being able to make consistent payments, especially since their incomes vary from month to month and they often come up short on their existing expenses. Similarly, some noted that cost sharing could quickly add up for multiple family members and/or when they need multiple services or prescription drugs. Some felt they would probably need to cut back on other expenses and/or go without needed care or medications if their cost sharing increased. Some said that their anxiety and depression would likely worsen if they could no longer afford care or their medications. When asked what would happen if changes made them and/or their children ineligible for Medicaid, participants said that they would not have another affordable coverage option and would likely become uninsured and be unable to access needed care.

How Experiences of Medicaid Participants compare to those who are Uninsured

Uninsured participants also are living on very tight budgets but, in contrast to those with Medicaid, are going without health care. Uninsured participants are working in low wage jobs without benefits that are similar to those in which Medicaid participants are employed. As a result, they face financial pressures that are similar to Medicaid participants, they often have difficulty paying their monthly expenses, and many report medical debt. Uninsured participants said they do not have affordable health coverage options available. Some were not aware of Marketplace or Medicaid coverage and had not explored those options. Others had looked at Marketplace options but felt the premiums and deductibles were unaffordable. However, in some cases, they were unaware of the tax credits available to help reduce costs. Without coverage, uninsured participants said they are going without care, including preventive screenings and primary care, and relying on home remedies and self-care options. A few reported using retail clinics or community health clinics when they could no longer put off care or had an injury and paid out of pocket for this care. Uninsured participants had very limited knowledge of potential changes to health care being discussed at the federal level and few thought that changes would affect their situation.

MEDICAID COVERAGE SNAPSHOT: KEVIN, 61, NASHVILLE, TENNESSEE

Kevin, 61, is an early retiree residing alone in Nashville. He has two older children ages 28 and 26. After 31 years in the business, he retired from working at a car dealership in 2010 due to health problems. After sustaining a traumatic injury, Kevin suffers from post-traumatic stress disorder (PTSD) and is unable to work. He also suffers from chronic obstructive pulmonary disease and has high blood pressure.Kevin lives on a fixed monthly Supplemental Security Income (SSI) disability payment of $714, which is about 71% of poverty for an individual. Kevin lives in a boarding house to reduce costs and prioritizes paying rent, which alone takes up nearly all of his monthly disability payment (Figure 3). He often comes up short on his bills and says he forgoes eating out and some basic items, pointing to instances where he could not afford a razor for himself or a Mother’s Day card for his mother. Kevin has medical debt from cost sharing amounts he could not afford when he previously had coverage through his private employer plan. Kevin says his financial pressures exacerbate his PTSD.

Kevin has had Medicaid coverage since 2012. He was uninsured for two years after retiring from his job before he enrolled in Medicaid and noted that he did not access care while he was uninsured due to cost. Kevin says, with Medicaid, he now accesses primary care and sees specialists to address his physical and behavioral health needs, although he wishes for broader coverage to address his dental needs. Medicaid covers five of his six prescription medications; he pays for the remaining medication out of pocket. Kevin says that if he had to pay more for health care, he would have to go without some medications since he would not be able to afford to pay for them all. 

Figure 3: Kevin’s Monthly Budget

How Medicaid Enrollees Would be Affected by Increased Health Care Costs

Under Medicaid, enrollees have limited out of pocket costs for health care with no premiums and relatively low cost sharing levels. Given the limited incomes and financial pressures currently facing these Medicaid enrollees, increases in premiums or copays in Medicaid would likely lead to access barriers for these individuals and create further strain on their family budgets. Similarly, these findings suggest that these individuals would face challenges paying premiums and out of pocket costs for Marketplace or other private coverage. For example, if Medicaid enrollees like Jackie and Kristen moved to a Marketplace plan in 2018 and had health care needs, in a given month, health care costs could take up a significant share of their income.

Figure 4: In the benchmark silver plan, health care costs could take up to nearly 20% of Jackie’s income in a given month.
Figure 5: In the benchmark silver plan, health care costs could take up to nearly a quarter of Kristen’s income in a given month.

Conclusion

Despite primarily living in working families, these Medicaid enrollees are facing major financial pressures and many struggle to pay their bills each month. Expenses for basic needs take up nearly all of their monthly income, most have little to no savings, and many have medical debt from times they were uninsured. Given their already strained family budgets, these Medicaid enrollees have little ability to pay for health care. As such, Medicaid coverage is key for enabling them to afford coverage and care for themselves and their children.

Most of these enrollees have limited knowledge of the potential changes to health care being discussed at the federal level, but many are fearful about losing access to Medicaid or facing increased costs for their coverage and care. Enrollees do not think they would be able to afford coverage without Medicaid, including those who became eligible through the ACA Medicaid expansion. Moreover, they indicate it would be challenging to pay premiums or higher cost sharing, and they would likely have to make difficult trade-offs between health care and other basic needs if costs increased. As such, these individuals would likely face significant challenges if they faced increased costs in Medicaid or were moved to Marketplace plans where they faced higher premium and out-of-pocket costs.

How Many of the Uninsured Can Purchase a Marketplace Plan for Less Than Their Shared Responsibility Penalty?

Authors: Matthew Rae, Larry Levitt, and Ashley Semanskee
Published: Nov 9, 2017

Issue Brief

The Affordable Care Act (ACA) has expanded health insurance coverage by offering both penalties and incentives. The ACA expanded eligibility for Medicaid, and low and middle-income households who earn too much to qualify can purchase subsidized coverage on the health insurance marketplaces using premium assistance tax credits. Individuals, who do not obtain coverage, are subject to a tax penalty under the law’s individual mandate unless they meet certain exemptions. While the percent of the population without health coverage has decreased substantially since the major coverage expansion in the ACA, about 10% of the population is still uninsured. Some of those who remain uninsured are eligible for premium subsidies large enough to cover the entire cost of a bronze plan, which is the minimum level of coverage people can buy to satisfy the individual mandate. Others could obtain coverage, after taking into account premium subsidies, for less than the penalty they would have to pay under the individual mandate. This analysis looks at the non-elderly uninsured eligible to enroll in a marketplace plan to determine how many of them would be financially better off enrolling in coverage than paying the penalty.

Who Is Subject to the Individual Mandate

The ACA included the shared responsibility payment, commonly known as the individual mandate, to encourage healthier individuals to purchase coverage offered by the Marketplaces. Since 2014, most people are required to be covered by a health insurance policy which meets minimum standards or pay a tax penalty. Some individuals are exempt from the penalty, including undocumented immigrants, those whose incomes are so low that they are not required to file taxes, people in the “Medicaid Coverage gap,” people who have to pay more than 8.05% of household income for insurance (taking into account any employer contributions or subsidies), members of certain groups, such as religious minorities or those facing a specified hardship such as foreclosure or bankruptcy. In 2018, we estimate that 71% of the marketplace-eligible uninsured will be subject to a penalty if they do not buy insurance, including 77% of those eligible for premium subsidies and 52% of those who are not.

Figure 1: Percent of Uninsured Individuals Whose Households are Subject to Shared Responsibility Payments, 2018

The penalty is assessed as 2.5% percent of family income in excess of tax filing thresholds with both a minimum and maximum. The penalty can be no less than a flat dollar amount equal to $695 per adult plus $347.50 per child, up to $2,085 for the family. The penalty can also be no more than the national average premium for a bronze plan. In 2017, the national average bronze plan was $272 for single coverage and $1,360 for a family of five or more. The penalty is pro-rated for people who are uninsured for a portion of the year and waived for people who have a period of insurance of less than three months.

For How Many of the Remaining Uninsured is Coverage Cheaper than the Penalty

The premium tax credits that subsidize Marketplace coverage are calculated using the second-lowest cost silver plan in each rating area as a benchmark. Since the Federal Government elected recently not to reimburse insurers for the cost sharing reductions they are required to make to reduce cost sharing for some low income enrollees, many insurers passed the increased cost on through higher premiums for silver plans. With higher silver premium costs, many people eligible for Marketplace subsidies will receive a larger tax credit. In many cases, consumers will be able to purchase a bronze plan for no additional cost, and in some cases a gold plan will be free or relatively inexpensive.

We estimate that over half (54%) of the subsidy eligible-uninsured could purchase a bronze plan for 2018 for no premium contribution, after accounting for the premium subsidy. An additional 16% of this group could purchase a bronze plan for less than the cost of the tax penalty if they do not secure minimum essential coverage. Altogether 70% of subsidy eligible-uninsured (5.8 million people) are able to purchase a Bronze plan for nothing or less than the cost of the individual mandate penalty.

Figure 2: Percent of Uninsured who are Members of Households Where the Shared Responsibility Payment is the Same Amount or Greater than the Cost of a Bronze Plan, 2018

Just over half (54%) of uninsured individuals who are eligible to purchase a marketplace plan with or without a subsidy would better off financially if they purchased a bronze plan rather than remaining uninsured. Of the 10.7 million people who are currently uninsured and eligible to purchase marketplace coverage, around 7.7 million people will be subject to the shared responsibility penalty. Most of these people will have access to at least some subsidies (6.3 million) to purchase a Marketplace plan.

Generally, consumer must enroll in a marketplace plan before the end of the open enrollment period (December 15), but do not bear the cost of the penalty until they complete their 2018 income taxes by April of 2019. Significant numbers of the remaining uninsured risk paying more in tax assessments than the cost of enrolling in coverage.

Methods

This analysis uses data from the 2017 Current Population Survey (CPS) Annual Social and Economic Supplement (ASEC). The CPS ASEC provides socioeconomic and demographic information for the United Sates population and specific subpopulations. Importantly, the CPS ASEC provides detailed data on families and households, which we use to determine income and household composition for ACA eligibility purposes.

Medicaid and Marketplaces have different rules about household composition and income for eligibility. For this analysis, we calculate household membership and income for both Medicaid and Marketplace premium tax credits for each person individually, using the rules for each program. For more detail on how we construct Medicaid and Marketplace households and count income, see the detailed technical Appendix A available here.

Undocumented immigrants are ineligible for federally-funded Medicaid and Marketplace coverage. Since CPS data do not directly indicate whether an immigrant is lawfully present, we draw on the methods underlying the 2013 analysis by the State Health Access Data Assistance Center (SHADAC) and the recommendations made by Van Hook et. al.15,16 This approach uses the Survey of Income and Program Participation (SIPP) to develop a model that predicts immigration status; it then applies the model to CPS, controlling to state-level estimates of total undocumented population from Pew Research Center. For more detail on the immigration imputation used in this analysis, see the technical Appendix B available here.

Individuals in tax-filing units with access to an affordable offer of Employer-Sponsored Insurance are still potentially MAGI-eligible for Medicaid coverage, but they are ineligible for advance premium tax credits in the Health Insurance Exchanges. Since CPS data indicate whether a worker held an offer of ESI at the time of interview (for the 2017 CPS, February, March, or April 2017) but not during the prior year (which serves as our basis for type of insurance coverage), we developed a model that predicts offer of ESI for any individuals with a change in employment status across the period. Additionally, for families with a Marketplace eligibility level below 250% FPL, we assume any reported worker offer does not meet affordability requirements and therefore does not disqualify the family from Tax Credit eligibility on the Exchanges. For more detail on the offer imputation used in this analysis, see the technical Appendix C available here.

The CPS asks respondents about coverage at the time of the interview as well as throughout the preceding calendar year. People who report any type of coverage throughout the preceding calendar year are counted as “insured.” Thus, the calendar year measure of the uninsured population captures people who lacked coverage for the entirety of 2016 (and thus were uninsured at the start of 2017). We use this measure of insurance coverage in 2016, rather than the measure of coverage at the time of interview, because the latter lacks detail about coverage type that is used in our model.

As of January 2014, Medicaid financial eligibility for most nonelderly adults is based on modified adjusted gross income (MAGI). To determine whether each individual is eligible for Medicaid, we use each state’s reported eligibility levels as of January 1, 2017, updated to reflect state Medicaid expansion decisions as of October 2017 and 2016 Federal Poverty Levels.17 Some nonelderly adults with incomes above MAGI levels may be eligible for Medicaid through other pathways; however, we only assess eligibility through the MAGI pathway.18

The household contribution for a marketplace plan includes the cost of covering all subsidy-eligible individuals in the tax filing unit, including those who might currently be purchasing non-group coverage outside of the exchange. Individuals who are eligible for a Basic Health Plan in New York or Minnesota are included as subsidy-eligibles in this analysis. The penalty for each uninsured non-elderly individual is based on the number of uninsured people in the household. In this analysis, households with incomes below the relevant tax filing threshold, in the Medicaid gap, or where the cost of the cheapest available (subsidized) bronze plan exceeds the affordability standard are considered to not have a penalty. Individuals ineligible to purchase marketplace coverage, such as undocumented immigrants, are excluded from the analysis. There may be additional exemptions which individuals are eligible for, including particular hardships such as medical debt or domestic violence and membership in groups such as a health care sharing ministry or a recognized Indian tribe. Individuals 65 or above are excluded from the analysis.

News Release

New Individual Mandate Penalty Calculator Helps Consumers Estimate Their Penalty for Being Uninsured in 2018

Published: Nov 7, 2017

A new individual mandate penalty calculator from the Kaiser Family Foundation allows consumers to estimate how much they would owe as a tax penalty for lacking health coverage in 2018, and to compare that amount to the cost of the least expensive 2018 Affordable Care Act marketplace plan in their local area.

Using household income, family size, ages of family members, and zip code data, the tool provides a projection of an individual’s penalty for not being covered, along with information about possible eligibility for financial assistance and premiums for the lowest-cost ACA marketplace plan in their local area. The calculator also helps consumers determine whether they could be eligible for the Medicaid expansion under the ACA.

For example, two 60-year-olds with no children and a household income of $50,000 living in the Arizona zip code 85543 would owe an estimated individual mandate penalty of $1,390 if they go without coverage in 2018. However, they likely qualify for financial assistance that would cover the full cost of a premium for the lowest-cost plan offered by the marketplace in their area.By contrast, a 40-year-old in the Washington state zip code of 98026 who has an income of $100,000 would owe an estimated individual mandate penalty of $2,234, an amount that is less than the $3,536 yearly premium for the lowest-cost marketplace plan in that area.

The Affordable Care Act’s individual mandate requires that most people have health coverage or be subject to a tax penalty unless they qualify for certain exemptions. The new calculator tests for exemptions related to insurance affordability, tax filing status, and if a state has not expanded Medicaid, but does not test for all exemptions from the individual mandate penalty.

The individual mandate is still in effect, though Congress is may consider repealing it as part of tax legislation.

The Individual Mandate Penalty Calculator is among a stable of resources that KFF has produced to help inform consumers about their options for 2018 health plans in the individual market. For most states, the deadline for open enrollment in ACA marketplaces is Dec. 15, 2017.

The updated Health Insurance Marketplace Calculator helps consumers estimate their health insurance premiums and government subsidies for 2018 ACA marketplace plans.

The updated Health Reform Frequently Asked Questions offers a searchable collection of more than 300 questions and answers, covering a wide range of topics including eligibility for financial assistance, coverage options, plan renewal, and enrollment periods. Some questions are also available in Spanish.

Two short explainers provide the basics of ACA open enrollment for people who are low income and people who buy coverage in the individual market.

News Release

One Million Medicare Part D Enrollees Had Out-of-Pocket Drug Costs above the Catastrophic Threshold in 2015

Published: Nov 7, 2017

One million Medicare beneficiaries had out-of-pocket drug spending above the Part D catastrophic threshold in 2015, and the number with such high spending has risen sharply in recent years, according to a new analysis by the Kaiser Family Foundation.

While the Part D drug benefit has helped make drugs more affordable for people with Medicare, the lack of a hard cap on annual out-of-pocket spending under Part D exposes enrollees to significant costs, unless they qualify for low-income subsidies. The standard Part D benefit includes a catastrophic coverage threshold above which enrollees pay up to 5 percent of their total drug costs out-of-pocket.

In 2015, 3.6 million Medicare Part D enrollees had total drug spending above the catastrophic threshold. The 2.6 million who qualified for federal low-income subsidies were shielded from high out-of-pocket spending on their medications, but 1 million enrollees faced significant costs.

The 1 million enrollees who did not receive low-income subsidies comprised just 2 percent of the Medicare Part D population, but their spending accounted for 20 percent ($3 billion) of the total $15 billion in out-of-pocket drug spending by Part D enrollees in 2015. Together, these 1 million enrollees spent an average of more than $3,000 per person out-of-pocket on their prescriptions, $1,215 of which was above the catastrophic threshold.

The study, No Limit: Medicare Part D Enrollees Exposed to High Out-of-Pocket Drug Costs Without a Hard Cap on Spending, also found that, among Part D enrollees in stand-alone drug plans with high out-of-pocket costs, those with the highest average annual spending tended to have certain conditions, including viral hepatitis, multiple sclerosis, leukemia and lymphoma, liver diseases other than hepatitis, cystic fibrosis and cancer.

The study findings come at a time when the rising cost of prescription drugs has emerged as a pressing issue for policymakers, federal and state health programs, private insurers and consumers. With the prospect of new high-cost drugs in the pipeline, alleviating the out-of-pocket burden of prescription drug costs for a rising number of people on Medicare remains an issue for federal policymakers to address.

No Limit: Medicare Part D Enrollees Exposed to High Out-of-Pocket Drug Costs Without a Hard Cap on Spending

Authors: Juliette Cubanski, Tricia Neuman, Kendal Orgera, and Anthony Damico
Published: Nov 7, 2017

Key Findings

Note: A newer version of this analysis with 2017 data is available here.

Since 2006, the Medicare Part D prescription drug benefit has helped improve the affordability of medications for people with Medicare. Yet even with Part D, enrollees can face relatively high out-of-pocket costs because there is no hard cap on out-of-pocket spending under Part D. Enrollees are required to pay up to 5 percent of their drug costs above the catastrophic coverage threshold, unless they receive low-income subsidies that help pay Part D premiums and cost sharing. For high-priced medications, this relatively small coinsurance rate can translate into significant out-of-pocket costs. This analysis examines out-of-pocket prescription drug spending among Medicare Part D enrollees with costs above the catastrophic coverage threshold.

1 million #Medicare #PartD enrollees had high out-of-pocket #prescriptiondrug costs in 2015.

Key Findings

  • In 2015, 3.6 million Medicare Part D enrollees had total drug spending above the catastrophic coverage threshold. Of this total, 2.6 million enrollees received low-income subsidies, but 1 million enrollees did not, and incurred out-of-pocket drug spending above the catastrophic threshold.
  • Between 2007 and 2015, the number of Part D enrollees without low-income subsidies who had spending above the catastrophic threshold more than doubled (Figure 1).
Figure 1: In 2015, 1 million Medicare Part D enrollees without low-income subsidies had high out-of-pocket drug costs—above the catastrophic coverage threshold—more than twice the number in 2007
  • Part D enrollees with out-of-pocket costs above the catastrophic threshold comprised just 2 percent of all enrollees but 20 percent ($3 billion) of enrollees’ total out-of-pocket drug spending ($15 billion) in 2015.
  • The one million Part D enrollees with out-of-pocket costs above the catastrophic threshold spent more than $3,000 out of pocket on their prescriptions in 2015, on average; 1 in 10 of them spent at least $5,200. In total, they spent $1.2 billion out of pocket above the catastrophic threshold, or $1,215 per person.
  • Harvoni and Sovaldi, treatments for hepatitis C, topped the list of the 10 most costly drugs used by Part D enrollees with high out-of-pocket drug costs in 2015.
  • Among Part D enrollees in stand-alone Medicare drug plans without low-income subsidies, those with HIV/AIDS, multiple sclerosis, viral hepatitis, leukemia/lymphoma, and schizophrenia were more likely than those with other conditions to have out-of-pocket spending above the catastrophic threshold in 2015.
  • Average out-of-pocket costs by Part D enrollees with spending above the catastrophic threshold declined substantially between 2010 and 2011, due to the Affordable Care Act provisions that took effect in 2011 to close the coverage gap and provide a 50 percent manufacturer discount for brand drugs, the value of which counts as out-of-pocket spending. Since 2013, however, average out-of-pocket spending among this group has increased due in part to the growing availability and use of high-priced drugs.

Issue Brief

Introduction

Prescription drugs play an important role in medical care for 59 million seniors and people with disabilities.  Medicare beneficiaries have access to outpatient prescription drug coverage through the Part D prescription drug benefit, which is administered by private stand-alone prescription drug plans (PDPs) and Medicare Advantage drug plans (MA-PDs). Since the start of the Medicare Part D program in 2006, the drug benefit has helped to lower out-of-pocket drug spending for all enrollees. Beneficiaries in Part D plans with low incomes and modest assets are eligible for additional assistance with plan premiums and cost sharing through the Low-Income Subsidy (LIS) program, reducing out-of-pocket costs even further for this population.

The Centers for Medicare & Medicaid Services (CMS) establishes guidelines that all Part D plans must follow for the design of the drug benefit and the value of coverage that must be offered. Plans are allowed to vary, however, along dimensions that affect beneficiaries’ access to and costs for medications, including which drugs are covered and cost-sharing requirements. The standard Part D benefit in 2017 includes a deductible ($400), followed by 25 percent coinsurance for prescriptions up to an initial coverage limit ($3,700 in total costs), and then a coverage gap where enrollees without low-income subsidies pay a larger share of their drug costs until their out-of-pocket drug spending exceeds a catastrophic coverage threshold ($4,950). The Affordable Care Act (ACA) included a provision to phase out the Part D coverage gap by requiring plans to cover a growing share of total drug costs and providing a manufacturer price discount of 50 percent for brand-name drugs filled in the gap, with the amount of the manufacturer discount counting towards the out-of-pocket threshold that triggers catastrophic coverage. Once enrollees’ drug spending reaches the catastrophic threshold, those without the LIS pay up to 5 percent of their total drug costs; those who qualify for the full low-income subsidy pay nothing for their drugs in this phase of the benefit. Plans typically place drugs that cost over $670 per month on a specialty drug tier, with coinsurance that ranges from 25 percent to 33 percent.

Concern has been rising in recent years about the growing cost burden on Medicare and beneficiaries posed by new, unique, and expensive specialty drugs used to treat a range of diseases. The Medicare Boards of Trustees and the Medicare Payment Advisory Commission have documented this rising cost burden on the Medicare program, which is reflected in higher Part D program spending overall, as well as higher spending for reinsurance of high-cost Part D enrollees who reach the catastrophic coverage phase of the benefit, where Medicare pays for 80 percent of drug costs. Although Part D provides coverage of catastrophic drug expenses, enrollees who do not receive the LIS are still responsible for up to 5 percent of their drug costs in this phase of the benefit. For very high-priced medications, this relatively small coinsurance rate can translate to a significant amount of out-of-pocket costs for beneficiaries who do not receive low-income subsidies.

This analysis examines the out-of-pocket prescription drug cost burden for Medicare beneficiaries in Part D plans who do not receive low-income subsidies, focusing on those enrollees who have drug costs that exceed the catastrophic coverage threshold. We refer to this group as Part D enrollees with high out-of-pocket drug costs. Although these enrollees do not comprise the entire group of enrollees who have high total drug spending that exceeds the catastrophic coverage threshold, they are exposed to a potentially large cost burden because they do not receive the financial protection of the low-income subsidies. We analyze Medicare prescription drug event claims data for 2015, the most recent year of publicly available Medicare claims data, and trends since 2007, the first full year of the Part D drug benefit. For detail on the data and methods, see the Methodology.

Findings

Who Are Medicare Part D Enrollees with High Out-of-Pocket Drug Costs?

  • In 2015, 3.6 million Medicare Part D enrollees had total drug spending above the catastrophic coverage threshold, which equaled $7,062 in total drug costs that year. This equals 9 percent of the 41.3 million Medicare beneficiaries enrolled in Part D plans in 2015. Of this total, 2.6 million enrollees (72 percent) received low-income subsidies (LIS) to help pay their Part D plan premiums and cost sharing, but 1 million enrollees (28 percent) did not receive these additional subsidies and were therefore not protected against having high out-of-pocket drug costs (Figure 2).
Figure 2: Nearly 1 in 10 Medicare Part D enrollees had drug spending above the catastrophic coverage threshold in 2015, most of whom received low-income subsidies—but 1 million did not
  • The characteristics of Medicare Part D enrollees with high out-of-pocket drug costs—defined here as enrollees without low-income subsidies who had out-of-pocket drug spending above the catastrophic coverage threshold—are somewhat similar to the overall population of Part D enrollees: predominantly white non-Hispanic, and age 65 and older (Table 1). (Although not a focus of this analysis, the characteristics of Part D enrollees with low-income subsidies who had spending above the catastrophic threshold vary from those of beneficiaries without the LIS.)

Out-of-Pocket Spending by Medicare Part D Enrollees with High Out-of-Pocket Drug Costs

  • On average, Part D enrollees with high out-of-pocket drug costs spent $3,041 for prescriptions in 2015 (Figure 3). This is six times more than average out-of-pocket spending by enrollees without the LIS overall ($498) and nearly three times more than out-of-pocket spending by enrollees without the LIS who had spending in the coverage gap but not above the catastrophic threshold ($1,123). Enrollees without the LIS who did not have spending high enough to reach the coverage gap in 2015 spent $258 out of pocket.
Figure 3: Medicare Part D enrollees with high out-of-pocket drug costs spent 6 times more out of pocket than the average enrollee without low-income subsidies in 2015
  • Of their total out-of-pocket costs, Part D enrollees with high out-of-pocket costs spent $1,826, on average, below the catastrophic coverage threshold (60 percent) and $1,215 (40 percent) above the catastrophic coverage threshold in 2015 (Figure 4). In the aggregate, Part D enrollees with high out-of-pocket costs spent $1.2 billion on their prescription drug costs above the catastrophic coverage threshold in 2015.
Figure 4: Medicare Part D enrollees with high out-of-pocket drug costs incurred 40 percent of their total out-of-pocket costs above the catastrophic coverage threshold in 2015
  • Some Part D enrollees with high out-of-pocket drug costs spent significantly more than the average. One in 10 of these beneficiaries spent at least $5,200 out of pocket on their prescription drugs in 2015 (Figure 5).
Figure 5: One in 10 Part D enrollees with high out-of-pocket drug costs spent at least $5,200 out of pocket on their prescription drugs in 2015
  • Part D enrollees who received low-income subsidies in 2015 spent significantly less out of pocket than those without the subsidies. Those with the LIS who reached the catastrophic coverage threshold (incurring total drug spending above $7,062 in 2015) spent $113 out of pocket in 2015, while average out-of-pocket drug spending was $73 among low-income subsidy enrollees overall (Figure 6).
Figure 6: The Low-Income Subsidy program provides significant protection against high out-of-pocket drug costs, especially for Part D enrollees with drug spending above the catastrophic coverage threshold
  • A disproportionate share of aggregate out-of-pocket drug spending by all Medicare beneficiaries enrolled in Part D is accounted for by enrollees without low-income subsidies who face high out-of-pocket costs (above the catastrophic coverage threshold). In 2015, beneficiaries in Part D plans spent a total of $15 billion out of pocket on prescription drugs. Part D enrollees with high out-of-pocket drug costs accounted for 20 percent of aggregate out-of-pocket drug spending by all enrollees ($3 billion), even though they comprised just 2 percent of all Part D enrollees (Figure 7).
Figure 7: Medicare Part D enrollees with high out-of-pocket costs accounted for only 2% of all Part D enrollees in 2015, but their out-of-pocket costs represented 20% of total out-of-pocket spending

Chronic Conditions among Medicare Part D PDP Enrollees with High Out-of-pocket Drug Costs

  • The chronic conditions that were most prevalent among stand-alone PDP enrollees with high out-of-pocket drug costs in 2015 were similar to the conditions most prevalent among PDP enrollees without low-income subsidies overall, although the prevalence rates were higher among those with high out-of-pocket costs. In 2015, the top 3 most common chronic conditions among PDP enrollees with high out-of-pocket drug costs (and PDP enrollees overall without the LIS) were hypertension, hyperlipidemia, and diabetes. The prevalence of these conditions among PDP enrollees with high out-of-pocket drug costs was 70 percent, 60 percent, and 48 percent, respectively (Table 2).
  • PDP enrollees without low-income subsidies who had certain conditions were more likely than others to have high out-of-pocket drug costs in 2015, including 79 percent of those with HIV/AIDS, 35 percent of those with multiple sclerosis, 24 percent of those with viral hepatitis, 11 percent of those with leukemia and lymphoma, and 11 percent of those with schizophrenia (Table 3). For PDP enrollees with other conditions, the share of those with high out-of-pocket drug costs was 10 percent or less.
  • Among PDP enrollees with high out-of-pocket drug costs, those with viral hepatitis incurred the highest average out-of-pocket drug spending in 2015 ($5,200), followed by those with multiple sclerosis ($4,389), and those with leukemia and lymphoma ($4,269) (Figure 8).
Figure 8: In 2015, Part D enrollees in stand-alone PDPs with viral hepatitis who had high out-of-pocket drug costs spent more out of pocket on their drugs than those with other conditions—$5,200, on average
  • One in 10 PDP enrollees with high out-of-pocket drug costs who had viral hepatitis or leukemia and lymphoma spent more than $8,000 out of pocket on prescription drugs in 2015, while 10 percent of those with liver disease spent more than $7,000, and 10 percent of those with multiple sclerosis or cancer spent more than $6,000 out of pocket, on average (Figure 9).
Figure 9: In 2015, 1 in 10 Part D enrollees in PDPs with viral hepatitis or leukemia/lymphoma who had high out-of-pocket drug costs spent more than $8,000 out of pocket on prescription drugs, on average

Use of Specific Expensive Drugs by Medicare Part D Enrollees with High Out-of-pocket Drug costs

  • Ten brand-name drugs accounted for more than 20 percent of the $3 billion in aggregate out-of-pocket spending by Part D enrollees with high out-of-pocket drug costs in 2015 (Figure 10). One drug alone—Harvoni, a treatment for hepatitis C—accounted for nearly 5 percent of total costs among the high-spending population without the LIS in 2015, while the top three drugs—Harvoni, Revlimid (a treatment for multiple sclerosis), and Lantus Solostar (a diabetes drug)—accounted for 10 percent.
Figure 9: 10 brand-name drugs accounted for one-fourth of aggregate out-of-pocket spending by Medicare Part D enrollees with high out-of-pocket costs in 2015
  • Sovaldi and Harvoni, breakthrough hepatitis C treatments first available in 2013 and 2014, respectively, were the two most expensive drugs, in terms of average per capita out-of-pocket spending, for Part D enrollees with high out-of-pocket costs, and those who used one or the other drug also incurred the highest total out-of-pocket drug costs in 2015, including their out-of-pocket costs for the hepatitis C drug plus their out-of-pocket costs for all the other drugs they used in 2015.
    • For the individual drugs taken by Part D enrollees with high out-of-pocket costs in 2015, the highest average per capita out-of-pocket costs were for Harvoni and Sovaldi, (Figure 11). On average, enrollees who faced high out-of-pocket drug costs in 2015 spent $6,291 for Harvoni and $5,392 for Sovaldi. Rounding out the top five were three drugs to treat different types of cancer: Jakavi ($4,997), Gleevec ($4,925), and Tasigna ($4,805).
    • Including their out-of-pocket costs for all of the drugs they used in 2015, Part D enrollees with high out-of-pocket costs who used Harvoni spent a total of $6,736 out of pocket, on average, including $6,291 for Harvoni alone plus an additional $445 on other drugs they used in 2015 (Figure 12). Those who used Sovaldi spent a total of $6,722 on average, including $5,392 for Sovaldi plus $1,330 for other drugs they used.
Figure 11: Harvoni and Sovaldi, treatments for hepatitis C, topped the list of the 10 most costly drugs used by Medicare Part D enrollees with high out-of-pocket drug costs in 2015
Figure 12: In 2015, Part D enrollees with high out-of-pocket drug costs who used Harvoni and Sovaldi spent more than $6,700, on average, factoring in costs for the other drugs they used
  • The number of Part D enrollees who face high out-of-pocket drug costs more than doubled between 2007 and 2015, from 0.4 million to 1.0 million; their share of all non-LIS enrollees increased somewhat from 2.7 percent in 2007 (0.4 million out of 15.3 million) to 3.6 percent in 2015 (1.0 million out of 28.1 million) (Figure 13). This increase is due in part to the ACA coverage gap changes that took effect in 2011, including counting the value of the manufacturer discount as out-of-pocket spending, as well as to the increased availability and use of higher-priced drugs.
Figure 13: The number of Medicare Part D enrollees without low-income subsidies who had drug spending above the catastrophic coverage threshold more than doubled between 2007 and 2015
  • The share of Part D enrollees with high out-of-pocket drug costs who used expensive drugs—those costing $600 or more per month—more than doubled between 2007 and 2015, from 23 percent to 60 percent (Figure 14).
Figure 14: In 2015, 6 in 10 Medicare Part D enrollees with high out-of-pocket drug costs used expensive drugs—those costing $600 or more per month; this share has more than doubled since 2007
  • The trend of greater use of more expensive drugs is reflected in an increase in the average total cost per prescription for Part D enrollees with high out-of-pocket drug costs, which increased from $99 per prescription in 2007 to $277 in 2015 (Figure 15). Between 2007 and 2015, the average annual per capita number of prescriptions filled by this group decreased slightly from 103 to 99.
Figure 15: Among Medicare Part D enrollees with high out-of-pocket drug costs, the average number of prescriptions used has dropped slightly while the average cost of each prescription has increased over time
  • With the ACA provisions to phase out the coverage gap taking effect in 2011, average out-of-pocket spending by Part D enrollees who incur high out-of-pocket costs is lower in 2015 than it was in 2010, before the gap coverage phase-out began (Figure 16). The first-year effect of the ACA changes was a substantial reduction in spending by Part D enrollees who incurred high out-of-pocket drug costs, after increasing every year between 2007 and 2010. But this trend has reversed in recent years.
    • Between 2007 and 2010, average spending by Part D enrollees with high out-of-pocket drug costs increased each year, in keeping with the annual increases in the out-of-pocket threshold that triggered catastrophic coverage. Enrollees who incurred high out-of-pocket costs spent 16 percent more out of pocket, on average, in 2010 ($4,465) than in 2007 ($3,854). But between 2010 and 2011, the average declined 33 percent to $3,004 as the ACA coverage gap phase-out began.
    • Between 2013 and 2015, average out-of-pocket spending by Part D enrollees with high out-of-pocket drug costs increased by 9 percent, from $2,789 to $3,041, in conjunction with the introduction of new high-costs drugs, including breakthrough treatments for hepatitis C.
Figure 16: Average out-of-pocket spending by Medicare Part D enrollees with high-out-of-pocket costs dropped substantially in 2011, due to the Affordable Care Act provision to phase out the coverage gap by 2020
  • Over time, the share of out-of-pocket spending in the catastrophic coverage phase among Part D enrollees facing high out-of-pocket costs has increased: it was 13 percent in 2007, 30 percent in 2013, and 40 percent in 2015 (Figure 17).
Figure 17: Over time, Medicare Part D enrollees with high out-of-pocket drug costs have spent more of their out-of-pocket costs in the catastrophic coverage phase, from 13% in 2007 to 40% in 2015

Discussion

In recent years, the high and rising cost of prescription drugs has emerged as a pressing issue for consumers, public programs, and private insurers. As our analysis shows, Medicare beneficiaries who do not receive the additional financial protection provided by low-income subsidies are not insulated from this cost burden and can incur substantial out-of-pocket costs for their medications. We find that one million Medicare beneficiaries in Part D plans who were not receiving low-income subsidies had high out-of-pocket costs in 2015—that is, drug spending above the catastrophic coverage threshold—and their annual out-of-pocket spending averaged over $3,000 in 2015.

Our analysis indicates that out-of-pocket costs above the catastrophic threshold represent a growing concern for people with Medicare, and both MedPAC and Medicare’s actuaries have shown that rising spending for catastrophic coverage has placed greater fiscal pressure on Medicare. Our analysis also shows that the number of Part D enrollees who did not receive low-income subsidies and had out-of-pocket spending above the catastrophic threshold has increased over time. Looking to the future, we would expect to see continued increases in the number of enrollees reaching the catastrophic coverage threshold in 2016 and later years, due in part to the ACA changes to the coverage gap as well as the greater availability and use of high-priced drugs. These trends have cost implications both for beneficiaries and, as the Medicare actuaries have projected, for Medicare.

Part D enrollees with high out-of-pocket costs in 2015 spent an average of $1,215 out of pocket on their prescriptions filled above the catastrophic threshold, or $1.2 billion in the aggregate. In other words, Part D enrollees would have collectively saved $1.2 billion if Part D had a hard cap on out-of-pocket spending, rather than requiring enrollees to pay up to 5 percent coinsurance in the catastrophic coverage phase. Placing a hard cap on out-of-pocket spending under Part D would save money for enrollees, but would increase costs to Medicare and would not address underlying concerns related to high-priced drugs.

While Part D has helped make drugs more affordable for people with Medicare, and the ACA has provided additional relief to enrollees with high drug costs by gradually closing the coverage gap, the absence of an annual out-of-pocket spending limit under Part D exposes enrollees to significant costs—unless their incomes and assets are low enough to qualify for low-income subsidies. Various proposals to reduce drug costs—including allowing the federal government to negotiate prices for Medicare beneficiaries, and allowing Americans to import drugs from Canada and other countries—enjoy broad, bipartisan public support. With a growing number of people on Medicare facing high out-of-pocket drug costs, alleviating this burden remains an issue for federal policymakers to address.

Juliette Cubanski, Tricia Neuman, and Kendal Orgera are with the Kaiser Family Foundation. Anthony Damico is an independent consultant.This work was funded in part by the Retirement Research Foundation.

Tables

Table 1: Characteristics of Medicare Part D Enrollees with Spending Above the Catastrophic Coverage Threshold, by Low-Income Subsidy Enrollment, 2015
All Part D enrolleesEnrollees with spending above the catastrophic coverage threshold
TotalEnrollees with the low-income subsidyEnrollees without the low-income subsidy
NumberPercent of totalNumberPercent of totalNumberPercent of totalNumberPercent of total
Total41,278,580100%3,619,640100%2,616,940100%1,002,700100%
Gender
    Female23,652,44057%2,109,32058%1,596,30061%513,02051%
    Male17,626,14043%1,510,32042%1,020,64039%489,68049%
Age
    <657,090,98017%1,463,68040%1,331,62051%132,06013%
    65-6910,162,92025%606,88017%365,34014%241,54024%
    70-748,461,24020%545,88015%304,44012%241,44024%
    75-796,192,70015%415,12011%242,4609%172,66017%
    80-844,393,76011%295,0008%181,0407%113,96011%
    85+4,976,98012%293,0808%192,0407%101,04010%
Race/ethnicity
    White non-Hispanic30,932,84075%2,450,24068%1,581,74060%868,50087%
    Black non-Hispanic4,593,30011%558,44015%495,86019%62,5806%
    Hispanic3,463,6408%385,82011%353,04013%32,7803%
    Asian/Pacific Islander1,362,3403%146,8404%131,3805%15,4602%
    Other/unknown926,4602%78,3002%54,9202%23,3802%
Residence
    Nursing home/ facility resident2,567,8806%578,42016%516,94020%61,4806%
    Non-facility resident38,710,70094%3,041,22084%2,100,00080%941,22094%
NOTE: Analysis includes enrollees in stand-alone prescription drug plans and Medicare Advantage drug plans. Out-of-pocket costs include Part D drug costs, but not Part D premiums or costs for Part B-covered drugs. Numbers may not sum to totals due to rounding.SOURCE: Kaiser Family Foundation analysis of a five percent sample of 2015 Medicare prescription drug event claims from the CMS Chronic Conditions Data Warehouse.
Table 2: Top 20 Most Prevalent Chronic Conditions among Medicare Part D Enrollees in Stand-alone Prescription Drug Plans with High Out-of-Pocket Drug Costs, 2015
All Medicare Part D enrollees in PDPs without the low-income subsidyPart D enrollees in PDPs with high out-of-pocket drug costs
NumberPercent of totalNumberAmong PDP enrollees with high out-of-pocket drug costs, % with this diseaseAmong PDP enrollees with this disease, % with high out-of-pocket drug costsAverage out-of-pocket spending
Total PDP enrollees16,710,620100.0%708,680100.0%4.2%$2,995
Hypertension9,163,44054.8%498,12070.3%5.4%$2,991
Hyperlipidemia7,900,80047.3%428,66060.5%5.4%$2,925
Diabetes4,014,70024.0%341,70048.2%8.5%$2,827
Ischemic heart disease4,364,12026.1%298,08042.1%6.8%$2,940
Rheumatoid arthritis/osteoarthritis4,979,74029.8%286,58040.4%5.8%$3,017
Anemia3,281,36019.6%255,80036.1%7.8%$3,158
Chronic kidney disease2,714,38016.2%244,50034.5%9.0%$2,989
Alzheimer’s disease, related disorders, or senile dementia & depression3,012,98018.0%216,48030.5%7.2%$3,067
Heart failure1,963,40011.7%171,22024.2%8.7%$2,971
Depression2,218,10013.3%168,50023.8%7.6%$3,127
Depressive disorders2,077,90012.4%164,90023.3%7.9%$3,116
Acquired hypothyroidism2,540,92015.2%156,58022.1%6.2%$3,036
Obesity1,742,78010.4%152,58021.5%8.8%$2,849
Fibromyalgia, chronic pain & chronic fatigue1,727,70010.3%144,90020.4%8.4%$3,160
Chronic obstructive pulmonary disease & bronchiectasis1,560,8609.3%144,40020.4%9.3%$2,935
Cataract3,305,42019.8%143,14020.2%4.3%$3,100
Peripheral vascular disease1,647,8809.9%130,08018.4%7.9%$2,887
Anxiety disorders1,831,88011.0%127,54018.0%7.0%$3,108
Asthma1,139,8206.8%115,14016.2%10.1%$2,933
Cancer: Colorectal; endometrial; female or male breast; lung; prostate1,485,3808.9%95,78013.5%6.4%$3,413
NOTE: PDP is stand-alone prescription drug plan. Analysis by chronic conditions excludes Medicare Advantage enrollees. Analysis includes the top 20 conditions among those chronic conditions included in the Chronic Conditions and Other Chronic or Potentially Disabling Conditions segments of the Medicare Master Beneficiary Summary file. “High out-of-pocket drug costs” refers to Part D enrollees without low-income subsidies who incurred drug spending above the catastrophic coverage threshold. Analysis includes enrollees in stand-alone prescription drug plans. Out-of-pocket costs include Part D drug costs, but not Part D premiums or costs for Part B-covered drugs. Numbers may not sum to totals due to rounding.SOURCE: Kaiser Family Foundation analysis of a five percent sample of 2015 Medicare prescription drug event claims from the CMS Chronic Conditions Data Warehouse.
Table 3: Top 20 Chronic Conditions with the Largest Percent of Medicare Part D Enrollees in Stand-alone Prescription Drug Plans (PDPs) with High Out-of-Pocket Drug Costs, 2015
All Medicare Part D enrollees in PDPs without the low-income subsidyPart D enrollees in PDPs with high out-of-pocket drug costs
NumberPercent of totalNumberAmong PDP enrollees with high out-of-pocket drug costs, % with this diseaseAmong PDP enrollees with this disease, % with high out-of-pocket drug costsAverage out-of-pocket spending
Total PDP enrollees16,710,620100.0%708,680100.0%4.2%$2,995
HIV/AIDS20,5800.1%16,2402.3%78.9%$2,354
Multiple sclerosis & transverse myelitis64,4800.4%22,3203.1%34.6%$4,389
Viral hepatitis90,6200.5%21,6603.1%23.9%$5,200
Leukemia & lymphoma269,4401.6%30,0004.2%11.1%$4,269
Schizophrenia55,9800.3%5,9800.8%10.7%$2,827
Liver disease, cirrhosis, & other liver conditions (excluding hepatitis)516,1003.1%54,0407.6%10.5%$3,651
Pressure ulcers & chronic ulcer596,6803.6%61,4008.7%10.3%$2,991
Asthma1,139,8206.8%115,14016.2%10.1%$2,933
Cystic fibrosis & other metabolic developmental disorders88,9800.5%8,4601.2%9.5%$3,635
Bipolar disorder248,7401.5%23,4803.3%9.4%$3,020
Epilepsy219,5601.3%20,4802.9%9.3%$3,152
Traumatic brain injury & nonpsychotic mental disorders due to brain damage51,0800.3%4,7600.7%9.3%$3,125
Chronic obstructive pulmonary disease & bronchiectasis1,560,8609.3%144,40020.4%9.3%$2,935
Conduct disorders & hyperkinetic syndrome63,6200.4%5,8200.8%9.1%$3,164
Chronic kidney disease2,714,38016.2%244,50034.5%9.0%$2,989
Schizophrenia & other psychotic disorders277,8801.7%24,4403.4%8.8%$3,078
Obesity1,742,78010.4%152,58021.5%8.8%$2,849
Heart failure1,963,40011.7%171,22024.2%8.7%$2,971
Spinal cord injury43,9200.3%3,8200.5%8.7%$3,134
Personality disorders58,6200.4%5,0000.7%8.5%$3,088
NOTE: PDP is stand-alone prescription drug plan. Analysis by chronic conditions excludes Medicare Advantage enrollees. Analysis includes the top 20 conditions among those chronic conditions included in the Chronic Conditions and Other Chronic or Potentially Disabling Conditions segments of the Medicare Master Beneficiary Summary file. “High out-of-pocket drug costs” refers to Part D enrollees without low-income subsidies who incurred drug spending above the catastrophic coverage threshold. Analysis includes enrollees in stand-alone prescription drug plans. Out-of-pocket costs include Part D drug costs, but not Part D premiums or costs for Part B-covered drugs. Numbers may not sum to totals due to rounding.

SOURCE: Kaiser Family Foundation analysis of a five percent sample of 2015 Medicare prescription drug event claims from the CMS Chronic Conditions Data Warehouse.


Methodology

This analysis uses data from a five percent sample of Medicare Part D prescription drug event (PDE) claims from the Centers for Medicare & Medicaid Services (CMS) Chronic Conditions Data Warehouse (CCW) for Part D enrollees between 2007 and 2015. The PDE claims data includes all prescription drug events reported by Part D plans for their enrollees in a given calendar year, and includes detailed data on spending for each event, corresponding to a single prescription drug fill, including how much was paid by plans, low-income subsidy amounts, and beneficiary out-of-pocket payments. The claims data includes spending for Part D covered drugs, but does not include spending on Part D plan premiums, Part B covered drugs (which are typically administered in providers’ offices or hospital outpatient settings), or the cost of drugs purchased outside the Part D plan. The CCW data also includes a limited number of demographic variables (gender, age, race/ethnicity) and flags for several chronic conditions (27 common chronic conditions and 35 other chronic or potentially disabling conditions).

We calculated average out-of-pocket spending and percentiles for enrollees overall and by three benefit phases: enrollees with total drug spending below the coverage gap, those with spending in the coverage gap but not above the catastrophic coverage threshold, and those with spending above the catastrophic coverage threshold. Our analysis focuses on beneficiaries enrolled in both stand-alone prescription drug plans (PDPs) and Medicare Advantage prescription drug plans who have high out-of-pocket drug costs, which we define as enrollees who have drug spending that exceeds the catastrophic coverage threshold in a given year who do not receive low-income subsidies (LIS). The catastrophic threshold is updated annually by the annual percentage increase in average expenditures for Part D drugs per eligible beneficiary; in 2015, the threshold amount was $7,062. The 2015 PDE sample includes 2.1 million Part D enrollees (41.3 million weighted), of whom 180,982 (3.6 million weighted) had spending above the catastrophic coverage threshold, including 50,135 (1.0 million weighted) who had high out-of-pocket drug costs and did not receive the LIS. Our analysis of spending by chronic condition includes only those Part D enrollees in stand-alone PDPs because the CCW variables that identify chronic conditions are derived from information in medical claims, which are not reported by Medicare Advantage plans for their enrollees.

Our analysis of specific drugs associated with high out-of-pocket spending was limited to drugs with 100 (2,000 weighted) or more users in 2015 to avoid reporting estimates based on small sample size. There are a small number of drugs that had higher average out-of-pocket costs among Part D enrollees with high out-of-pocket spending than the top drug we report (Harvoni), but the number of users of each of those drugs in the CCW PDE for 2015 was less than 100. Because we cannot report data for these drugs, our analysis of the most expensive drugs among those with high out-of-pocket costs is conservative to the extent that it does not include those drugs with higher out-of-pocket costs but smaller (unreliable) sample sizes. For example, based on the publicly-available CMS 2015 Medicare drug spending data, the drug with the highest out-of-pocket costs among non-LIS enrollees was Cinryze, a C1 esterase inhibitor, with 104 non-LIS users and average out-of-pocket spending of $24,274 in 2015, followed by Berinert, also a C1 esterase inhibitor, with 43 non-LIS users and average out-of-pocket costs of $14,258.

Do Health Plan Enrollees have Enough Money to Pay Cost Sharing?

Published: Nov 3, 2017

Issue Brief

This brief looks at the extent to which people have enough savings to meet the cost sharing requirements under private health insurance policies, which have risen substantially in recent years.

The amount of cost sharing in private and public insurance arrangements has been a key area of discussion in recent years and particularly during the recent debate over repealing and replacing the Affordable Care Act (ACA).  The group market has seen meaningful increases in deductibles over the past few years, and worker payments for cost sharing have increased steadily.  In the nongroup market, where cost sharing has always been relatively high, the substantial deductibles and other cost sharing have raised concerns about affordability.  Cost sharing in nongroup plans was a major point of emphasis during the repeal and replace debate this summer and fall, where several leading proposals would have ended the cost sharing subsidies currently available to lower income enrollees while permitting states to use a portion of new market stability funds to reduce enrollee out of pocket costs.  Other proposals would have expanded the use of health savings accounts, which permit individuals with high-deductible health plans to pay out-of-pocket costs with tax-preferred funds.

Deductibles and other cost sharing play a significant role in health insurance plans.  Deductibles and copayments, by shifting a portion of the cost of care to those using services, reduce premiums by reducing the share of costs funded by insurance.  More importantly, requiring consumers to directly pay out-of-pocket for a portion of the cost of services encourages them to more carefully consider the need for services and, depending on how the cost sharing is structured, can encourage consumers to use lower cost providers and service options.  These dynamics lower the amount of health care that people get, reducing premiums but also in some cases discouraging people from needed and beneficial care.

As cost sharing levels have risen, consideration of the affordability of health insurance has necessarily broadened beyond looking at premiums to include the financial burden placed on enrollees by high cost- sharing requirements. Particularly for those in low and moderate income families, the cost sharing in private plans may make it difficult for them to have access to the services covered under their plans.  Recent coverage expansions under the ACA, which has expanded private insurance coverage to millions of lower and moderate income people, incorporated significant public subsidies to reduce cost sharing for enrollees with incomes below two and a half times the poverty level.

While people might expect to pay premiums and small copayments from their current income, cost sharing for costly medical events may need to be funded from savings or through borrowing.  Deductibles for employer plans with deductibles averaged over $2,000 in small firms and almost $1,300 in large firms in 2016 and 2017.  In the nongroup market, deductibles in silver plans (not including reductions through cost-sharing subsidies) averaged over $3,000 in both 2016 and 2017 with many silver and bronze plans having deductibles exceeding $5,000 or $6,000.  Coinsurance and other cost sharing can increase out-of-pocket liabilities considerably: the maximum out-of-pocket limits for in-network services in most private plans was $7,150 for single plans and $14,300 for family coverage in 2017.  Some households may incur higher spending on out-of-network services or those not included as an essential health benefit.

These amounts can stress the finances of many families.  In order to evaluate the affordability of different cost-sharing levels for different types of households we used information from the 2016 Survey of Consumer Finances to look at the asset of households and their potential ability to meet different levels of cost sharing.  The Figures below show the percentage of singe-person and multi-person households that could meet an array of cost sharing amounts ($1,000 through $15,000) with their liquid or net financial assets.  In the text, we focus on two levels: $2,000 for single-person households and $4,000 for multi-person households, amounts that are now not uncommon in employer-based plans; and a higher level of $6,000 for single persons households and $12,000 for multi-person households.  These upper level amounts were a little less than the maximum out-of-pocket limits for private insurance in 2016 of $6,850 for single coverage and $13,700 for family coverage.  We use 2016 levels because the data on assets is for that year.

As discussed below, we find that less than half of non-elderly, one-person households could pay $2,000 toward cost sharing from current liquid assets, while only about a third could pay $6,000.  These percentages vary considerably by income and are much higher for households with incomes 400% of poverty or more and much lower for households with incomes below 150% of poverty.

Defining Assets

The Survey of Consumer Finances (SCF) is a triennial, nationally representative household survey conducted by the Federal Reserve Board.  The 2016 SCF provides a snapshot of household finances, including detailed information on households’ debts, assets, income and other characteristics, including the types of health insurance present in the household.1   Using this information, we developed two measures of resources that households may have to meet health insurance cost sharing2 .  The measures used here could be considered conservative because they assume that a household can bring a large share of its saved resources to bear to pay one-year’s cost sharing.

  • The first category is liquid financial assets, which are those most easily converted to cash. The category includes checking and saving accounts, money market accounts, certificates of deposit, savings bonds, non-retirement mutual funds, stocks and bonds, but excludes the value of dedicated retirement accounts (such as 401k accounts) and the cash value of life insurance.
  • The second category is net financial assets, which is a broader measure of the household’s total resources. This category includes all financial assets, including assets dedicated to retirement, reduced by the household’s unsecured debts. For this measure, the value of assets is reduced by credit-card debt and other unsecured loans, but debts secured by real property (such as mortgage debt) and loans for vehicles and education are not counted against assets. This category measures how much money a household has to pay medical expenses after meeting debt obligations, although the money may not in all cases be easily accessible.

Generally, liquid financial assets are a few percentage points higher than net financial assets at any given level of income.  For simplicity, we present the analysis using liquid financial assets; we include comparable charts with net financial assets in Appendix 2.

We assume that households pay premiums out of current income, but that they may need to use savings or other assets if they become seriously ill in order to meet the deductible.  For more information see the Methods Section. The SCF defines a family as a “primary economic unit (PEU),” or all of the individuals living in a household who are financially interdependent with the dominant individual or couple.3   Income and assets are measured for the PEU in the household.  The definitions of the different types of assets and debts are available [here] and [here].

Cost-sharing in private insurance may take several forms; enrollees are often required to meet a deductible or an annual spending amount before the plan covers most services.  In most cases enrollees must pay a portion of the cost of care at the point of service, either as a set amount (copayment) or a percent of the cost (coinsurance).  Private insurance plans, under requirements included in the ACA, include an out-of-pocket limit, or a maximum amount that a household must pay out of pocket for in-network care each year.  Deductibles and out-of-pocket limits are lower in single plans than in family plans.

In this analysis, we first look at the median levels of assets of non-elderly families.  We look at median assets because the averages are significantly affected by the much larger levels of assets in a small number of higher income families (see Appendix 1).  We next look at the percentage of households with sufficient assets to meet different levels of out-of-pocket costs. Because cost-sharing requirements are higher in family plans than in single plans, we show results separately for one-person households and households with more than one person.

Our approach here is actually a conservative look at affordability because it assumes that all of a household’s assets are available to meet cost-sharing obligations in the current year.  This assumption leaves households with no additional assets for savings or to meet other emergencies, and does not account for the fact that high out-of-pocket medical costs may continue for more than one year.

Household Asset Levels and Cost-Sharing Requirements

Among nonelderly households, the median level of liquid assets in 2016 was about $2,500 for single-person households and $5,000 for households with more than one person (Figure 1).  This means that one-half of single-person households could only contribute $2,500 from their liquid assets to pay for cost sharing, and that one-half of multi-person households could contribute $5,000.  These amounts were below the cost sharing requirements in many plans significantly below the maximum out-of-pocket limits allowed for private insurance in 2016 ($6,850 for single coverage and $13,700 for family coverage).

Figure 1: Median Liquid Assets of Households, 2016

Median asset levels vary tremendously with household income.  Among single-person households, the median amount of liquid assets in households with incomes below 150% of poverty was less than $500 in 2016, compared to $1,902 for households with incomes between 150% and 400% of poverty, and $14,361 for families with incomes of 400% of poverty or more (Figure 2).  Among multi-person households, the median amount of liquid assets in households with incomes below 150% of poverty was still less than $500 in 2016, compared to $2,811 for households with incomes between 150% and 400% of poverty, and $21,838 for families with incomes of 400% of poverty or more.

Figure 2: Median Liquid Assets of Non-Elderly Households, By Poverty, 2016

Figure 3 shows the distributions of households with sufficient liquid assets to meet different cost sharing amounts. About half (53%) of single-person nonelderly households could pay the $2,000 from their liquid assets towards cost sharing, and only 37% could pay $6,000, which as noted above was less than the maximum out-of-pocket limit for single coverage  in 2016.  For multi-person families, 47% could pay $4,000 from their liquid assets for cost sharing, while only 35% could pay $12,000.

Figure 3: Percent of Households with Liquid Assets in Excess of Certain Thresholds by Household Size, 2016

These percentages vary significantly with family income.  Among single-person households, only 23% of households with incomes below 150% of poverty could pay $2,000 from their liquid assets for cost sharing, compared with 47% of households with incomes between 150% and 400% of poverty and 87% of households with incomes of 400% of poverty or more (Figure 4).  At the higher level, only 12% of households with incomes below 150% of poverty could pay $6,000 from their liquid assets for cost sharing, compared with 29% of households with incomes between 150% and 400% of poverty and 69% of households with incomes of 400% of poverty or more.

Figure 4: Percent of One Person Households with Liquid Assets in Excess of Certain Thresholds by Household Poverty, 2016

The picture is similar for multi-person families, where only 10% of households with incomes below 150% of poverty could pay $4,000 from their liquid assets for cost sharing, compared with 41% of households with incomes between 150% and 400% of poverty and 84% of households with incomes of 400% of poverty or more (Figure 5).  At the higher level, only 4% of households with incomes below 150% of poverty could pay $12,000 from their liquid assets for cost sharing, compared with only 18% of households with incomes between 150% and 400% of poverty and 63% of households with incomes of 400% of poverty or more.

Figure 5: Percent of Multi-Person Households with Liquid Assets in Excess of Certain Thresholds by Household Poverty, 2016

Households with someone who is uninsured have particularly low levels of assets: among single-person households, 28% could pay $2,000 from liquid assets for cost sharing while only 14% could pay $6,000. Among multi-person families, 21% could pay $4,000 from liquid assets for cost sharing while only 9% could pay $12,000 (Figure 6).

Figure 6: Among Households Where Someone is Uninsured, Percent of Households with Liquid Assets in Excess of Certain Thresholds by Household Size, 2016

Discussion

Many families lack the financial resources to meet the levels of cost sharing they may face in private health insurance policies.  Not surprisingly, there are significant differences across the income spectrum, where, for example, 63% of multi-person households with incomes of 400% of poverty or more could pay $12,000 from liquid assets for cost sharing, compared with only 18% of households with incomes between 150% and 400% of poverty, and 4% of households with incomes below 150% of poverty.

Much of the discussion around affordability has centered on premium costs. A broader notion of affordability will have to focus on the ability of families, particularly low and moderate income families, to meet potentially high out-of-pocket expenses associated with a chronic or acute illness.  One-half of multi-person households with incomes between 150% and 400% of poverty had less than $3,000 in liquid assets in 2016, which means that any significant illness could wipe out all their savings just to meet deductibles and other cost sharing. To adequately address the issue of affordability of health insurance, reform proposals should be evaluated on the affordability of out-of-pocket costs, especially for low and moderate income families, and be sensitive to the financial impacts that high cost sharing will have on financial wellbeing.

Methods

The 2016 Survey of Consumer Finances (SCF) is a triennial, nationally representative household survey conducted by the Federal Reserve Board.  The survey has a dual frame, with respondents selected both from a national area probability design and a sample of households with high income tax returns.4   The 2016 SCF is the most current survey available and is based on 6,254 households.5  Weights were applied to ensure that percentages were representative of the population.

The SCF provides information about the types of insurance present in each household, and also about whether each member had coverage or not.  Unlike financial characteristics, insurance questions are asked of all members of a household, including members that are not part of the PEU, which could be a relative who is financially independent or a financially independent nonrelative living in the household.  This creates some potential ambiguity when we look at households in which someone has private coverage because it is possible that the only people with private coverage are not part of the PEU.  Because we have information about whether or not each person in the household has some coverage or not, we were better able to target the members of the PEU in identifying households where someone was uninsured.  We selected only households where the financially dominant individual, his or her spouse or partner, or his or her financially dependent children (regardless of the child’s age) were uninsured.

Appendix

Appendix 1

Appendix 1 – Figure 1: Liquid Assets of Households, 2016
Appendix 1 – Figure 2: Average Liquid Assets, By Poverty, 2016

Appendix 2

Appendix 2 – Figure 1: Median Net Financial Assets of Households, 2016
Appendix 2 – Figure 2: Median Net Financial Assets of Non-Elderly Households, By Poverty, 2016
Appendix 2 – Figure 3: Percent of Households with Net Financial Assets in Excess of Certain Thresholds by Household Size, 2016
Appendix 2 – Figure 4: Percent of One Person Households with Net Financial Assets in Excess of Certain Thresholds by Household Poverty, 2016
Appendix 2 – Figure 5: Percent of Multi-Person Households with Net Financial Assets in Excess of Certain Thresholds by Household Poverty, 2016
Appendix 2 – Figure 6: Among Households Where Someone is Uninsured, Percent of Households with Net Financial Assets in Excess of Certain Thresholds by Household Size, 2016

Endnotes

  1.   The survey asks whether anyone in the household has health insurance and if so, what types of insurance people have.  The survey also ascertains whether everyone in the household is covered by the same type of health insurance, whether everyone is uninsured, and who in the household is uninsured. ↩︎
  2. Jacobs, Paul, and Gary Claxton. “Comparing the Assets of Uninsured Households to Cost Sharing Under High-Deductible Health Plans.” Health Affairs 27.3 (2008): W214-221. Web. 14 Jan. 2013. http://content.healthaffairs.org/content/27/3/w214.full.pdf html.  and Gary Claxton, Matthew Rae and Nirmita Panchal.  “Consumer Assets and Consumer Assets and Patient Cost Sharing”  Kaiser Family Foundation.  March 11 2015. https://modern.kff.org/health-costs/issue-brief/consumer-assets-and-patient-cost-sharing/ ↩︎
  3. Bricker , Jesse; Dettling, Lisa; Henriques , Alice;  Hsu , Joanne; Jacobs, Lindsay; Moore, Kevin; Pack, Sarah; Sabelhaus, John; Thompson, Jeff and Windle, Richard.  “Changes in U.S. Family Finances from 2013 to 2016: Evidence from the Survey of Consumer Finances.”  Federal Reserve Bulletin, vol. 103 (September 2017),. ↩︎
  4. Kennickell, Arthur B. “Wealth Measurement in the Survey of Consumer Finances: Methodology and Directions for Future Research”.   May 2000. Web. 26 Oct. 2017. http://www.federalreserve.gov/econresdata/scf/files/measurement.pdf ↩︎
  5. “Codebook for the 2016 Survey of Consumer Finances.”  Division of Research and Statistics Board of Governors of the Federal Reserve System. Web. 26 Oct. 2017 https://www.federalreserve.gov/econres/files/codebk2016.txt ↩︎