KFF designs, conducts and analyzes original public opinion and survey research on Americans’ attitudes, knowledge, and experiences with the health care system to help amplify the public’s voice in major national debates.
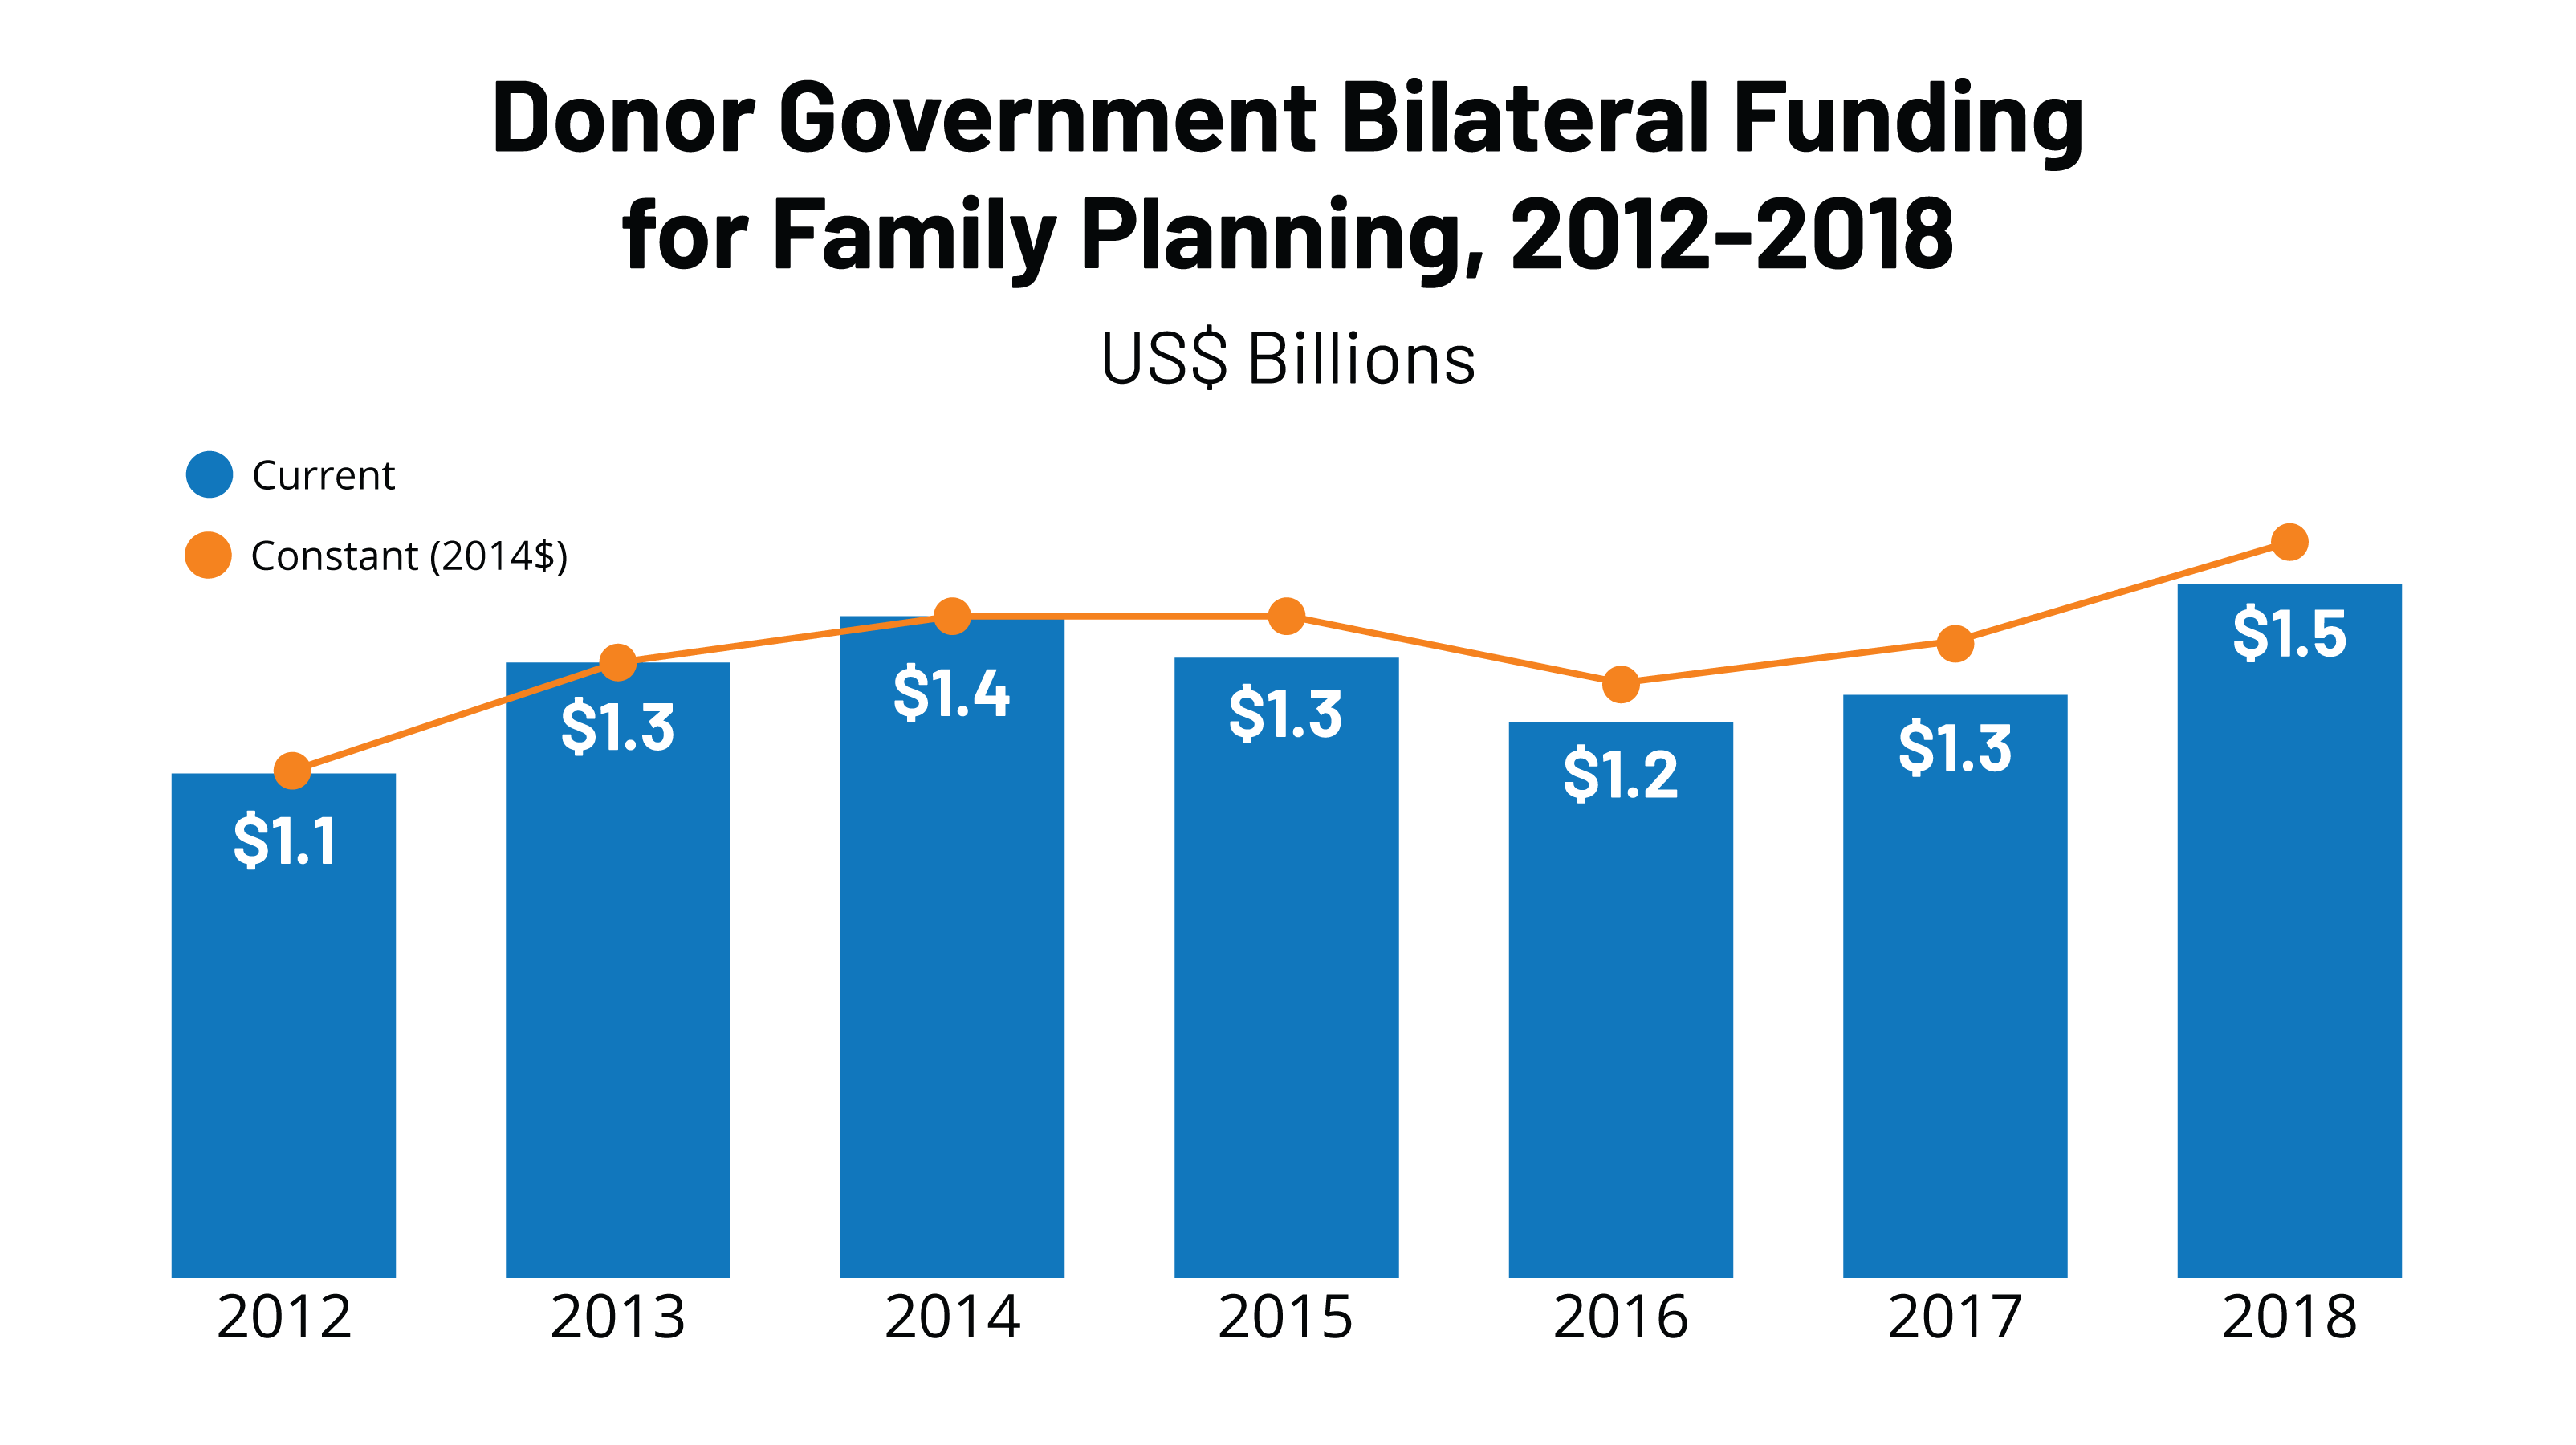
A new KFF analysis finds donor government support for global family planning efforts totaled US$1.50 billion in 2018, up 19 percent from 2017 (US$1.26 billion) – and the highest level since tracking efforts began following the London Summit on Family Planning in 2012. Since 2012, total donor government funding for family planning has risen by more than US$400 million. Funding for family planning supports a range of activities including contraceptives, information, education and communication activities; and capacity building and training.
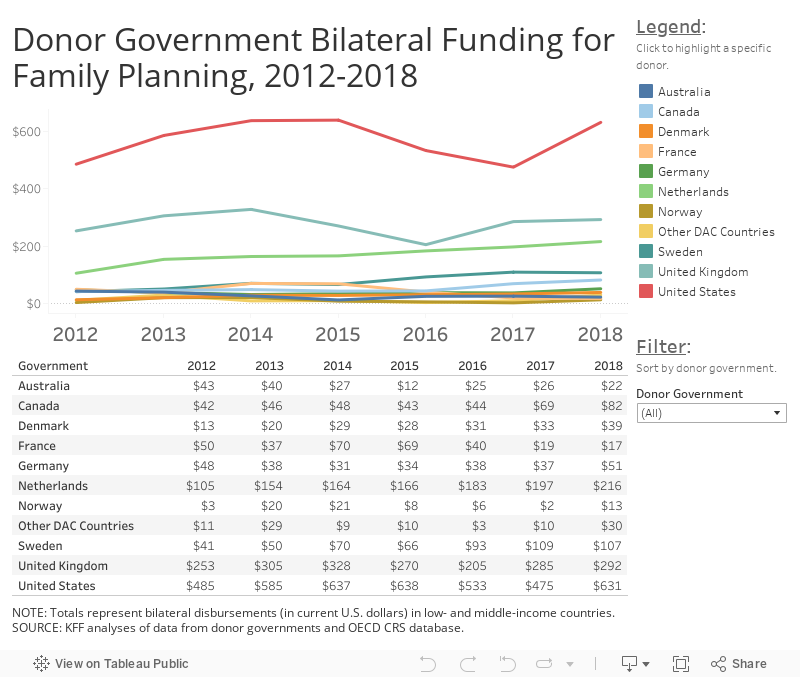
Funding from the United States, the world’s largest donor, rose from US$488.7 million in 2017 to $630.6 million in 2018, although this increase is largely due to the timing of disbursements and does not reflect an actual increase in U.S. appropriations by Congress, which have been flat for several years.
Among the 10 largest donor governments, seven increased funding in 2018 (Canada, Denmark, Germany, the Netherlands, Norway, the UK, and the US) and three decreased (Australia, France, and Sweden).
While the majority of donor government assistance for family planning is provided bilaterally, donors also provide support for family planning activities through contributions to the United Nations Population Fund (UNFPA). The analysis finds that donor governments provided US$373.9 million in core contributions to UNFPA, an increase of US$29.5 million (9%) compared to 2017 (US$347.8 million). In 2018, the U.S. administration invoked the Kemp-Kasten amendment to withhold funding from UNFPA for the second year in a row.
Results of this analysis are also included in the annual progress report from FP2020, a global partnership to monitor progress toward the 2012 London Summit on Family Planning goals to expand contraceptive access to an additional 120 million women and girls in low- and middle income countries by 2020.
This report provides an analysis of donor government funding to address family planning in low- and middle-income countries in 2018, the latest year available, as well as trends over time. It is part of an effort by the Kaiser Family Foundation to track such funding that began after the London Summit on Family Planning in 2012. Key findings include the following:
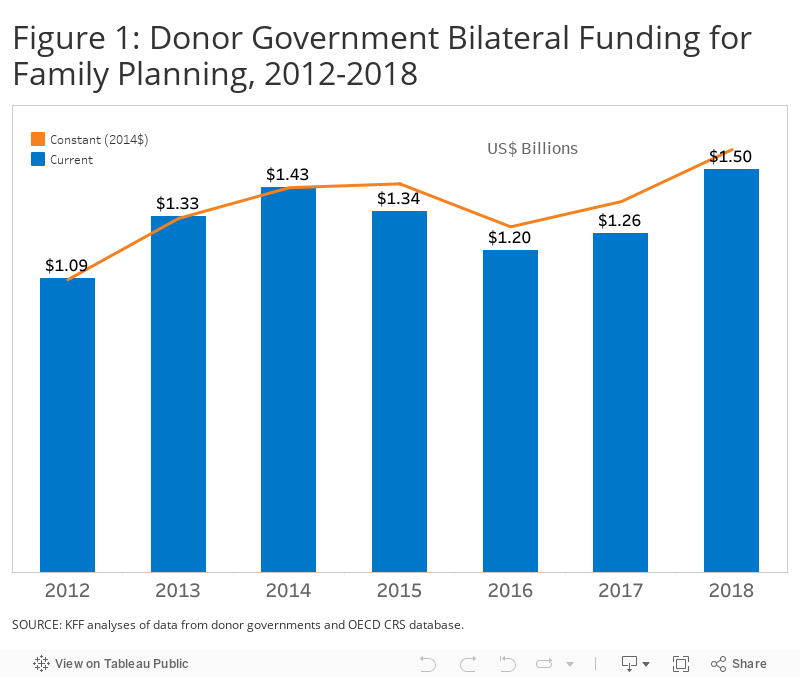
DONOR GOVERNMENT FUNDING FOR FAMILY PLANNING REACHED ITS HIGHEST LEVEL IN 2018. In 2018, donor government funding rose from $1.26 billion in 2017 to $1.50 billion (an increase of $237.3 million or 19%, as measured in current terms); funding increased even after accounting for inflation and currency fluctuations.1 This was the second year of increases after two years of declines, and the highest level of funding since the 2012 Summit.
MOST DONORS INCREASED BILATERAL FUNDING FOR FAMILY PLANNING IN 2018. Among the 10 donor governments profiled, seven provided increased bilateral funding (Canada, Denmark, Germany, the Netherlands, Norway, the U.K., and the U.S.) and three decreased (Australia, France, and Sweden); these trends were the same in currency of origin. The U.S. increase in 2018 was largely due to the timing of disbursements and does not reflect an actual increase in U.S. appropriations by Congress, which have been flat for several years.
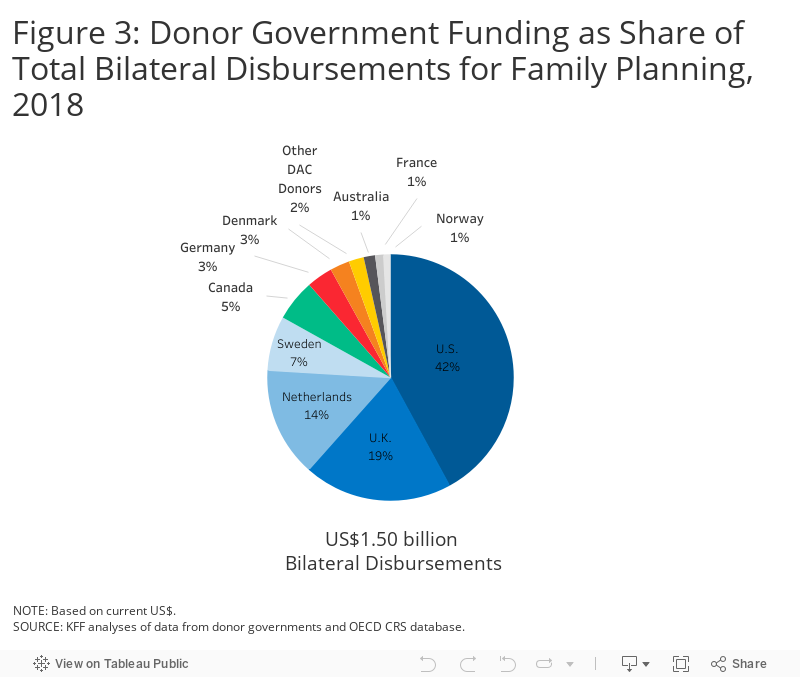
THE U.S. CONTINUES TO BE THE LARGEST DONOR TO FAMILY PLANNING. The U.S. was the largest bilateral donor to family planning in 2018, providing $630.6 million or 42% of total bilateral funding from governments. The U.K. (US$292.2 million, 19%) was the second largest donor, followed by the Netherlands (US$215.6 million, 14%), Sweden (US$107.0 million, 7%), and Canada (US$81.8 million, 5%).
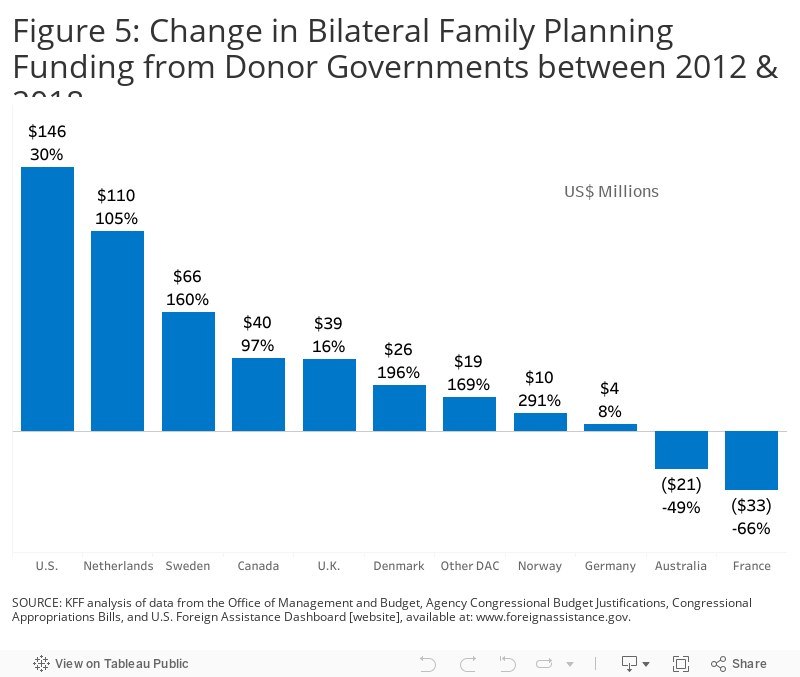
SINCE THE LONDON SUMMIT IN 2012, MOST DONOR GOVERNMENTS HAVE INCREASED FUNDING AND OVERALL FUNDING HAS RISEN BY MORE THAN US$400 MILLION. Among the 10 donor governments profiled, eight have increased bilateral funding since the London Summit in 2012 (Canada, Denmark, Germany, the Netherlands, Norway, Sweden, the U.K., and the U.S.). The U.S. increase was the largest over the period (US$145.6 million), followed by the Netherlands (US$110.2 million), Sweden (US$65.8 million), Canada (US$40.3 million), and the U.K. (US$39.4 million).
DONORS ALSO INCREASED FUNDING TO UNFPA. In addition to bilateral disbursements for family planning, donor governments profiled also provided US$373.9 million in core contributions to UNFPA in 2018, an increase of US$29.5 million compared to the 2017 level (US$344.4 million).2 Sweden provided the largest core contribution to UNFPA in 2018 (US$83.0 million), followed by Norway (US$63.8 million), the Netherlands (US$37.5 million), and Denmark (US$37.1 million).For the second year in a row, the U.S. administration invoked the Kemp-Kasten amendment to withhold funding from UNFPA.
var divElement = document.getElementById(‘viz1573152676142’); var vizElement = divElement.getElementsByTagName(‘object’)[0]; vizElement.style.width=’800px’;vizElement.style.height=’677px’; var scriptElement = document.createElement(‘script’); scriptElement.src = ‘https://public.tableau.com/javascripts/api/viz_v1.js’; vizElement.parentNode.insertBefore(scriptElement, vizElement);
Report
Introduction
This report provides the latest data on donor government resources available for family planning activities in low- and middle-income countries. It is part of an effort by the Kaiser Family Foundation that began after the London Summit on Family Planning in 2012 at which the global community pledged to expand contraceptive access to an additional 120 million women and girls by 2020.3 Stakeholders reconvened at The Family Planning Summit for Safer, Healthier and Empowered Futures in 2017 and made new and renewed commitments to global family planning goals.4
This current report provides data on donor government disbursements in 2018, the most recent year available. It includes data from all 30 members of the Organisation for Economic Co-operation and Development (OECD)’s Development Assistance Committee (DAC), as well as non-DAC members where data are available.5 Data are collected directly from donors and supplemented with data from the DAC. Ten donor governments that account for 98% of total disbursements for family planning are profiled in this analysis. Both bilateral assistance and core contributions to UNFPA are included. For more detail, see the below methodology. For information on family planning funding from other sources (e.g. multilateral organizations, foundations, etc.) see Appendix 1.
Findings
Bilateral Disbursements
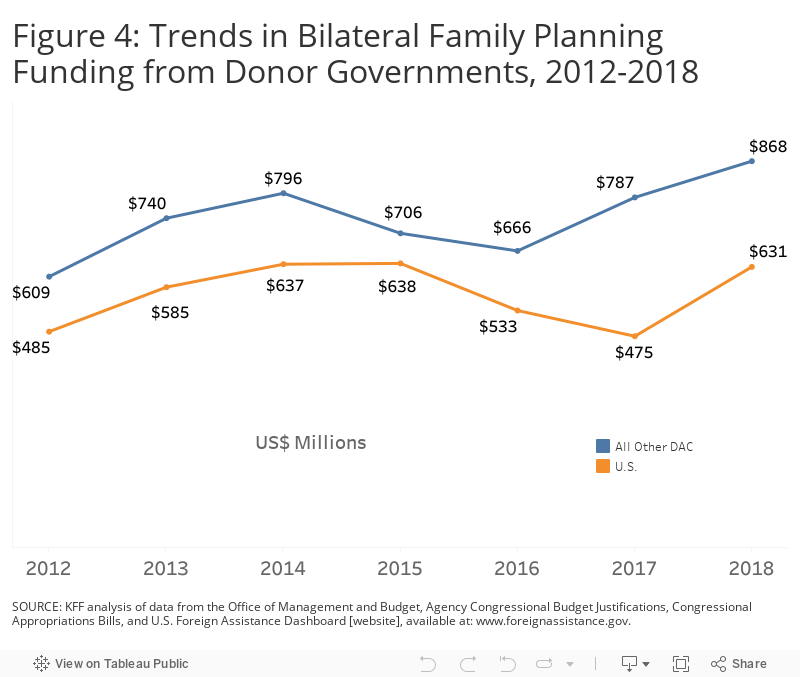
In 2018, donor governments disbursed US$1.50 billion in bilateral funding for family planning activities (see Figure 1, Table 1 & Appendix 2), an increase of US$237.3 million (19%) compared to the 2017 level (US$1.26 billion) and the highest level of funding since tracking efforts began following the 2012 London Summit (even after adjusting for inflation and currency fluctuation). This was the second year of increases after two years of declines.
var divElement = document.getElementById(‘viz1573154746489’); var vizElement = divElement.getElementsByTagName(‘object’)[0]; vizElement.style.width=’800px’;vizElement.style.height=’677px’; var scriptElement = document.createElement(‘script’); scriptElement.src = ‘https://public.tableau.com/javascripts/api/viz_v1.js’; vizElement.parentNode.insertBefore(scriptElement, vizElement);
.
Table 1: Donor Government Bilateral Disbursements for Family Planning, 2012-2018 (in current US$, millions)
Government
2012
2013
2014
2015
2016
2017
2018
Difference
2017 – 2018
2012 – 2018
Australia
$43.2
$39.5
$26.6
$12.4
$24.9
$25.6
$22.2
$-3.4(-13.3%)
$-21(-48.6%)
Canada
$41.5
$45.6
$48.3
$43.0
$43.8
$69.0
$81.8
$12.8(18.6%)
$40.3(97.1%)
Denmark
$13.0
$20.3
$28.8
$28.1
$30.7
$33.1
$38.5
$5.4(16.3%)
$25.5(196.2%)
France
$49.6
$37.2
$69.8
$68.6
$39.9
$19.2
$17.0
$-2.2(-11.5%)
$-32.6(-65.7%)
Germany
$47.6
$38.2
$31.3
$34.0
$37.8
$36.8
$51.3
$14.5(39.3%)
$3.7(7.8%)
Netherlands
$105.4
$153.7
$163.6
$165.8
$183.1
$197.0
$215.6
$18.7(9.5%)
$110.2(104.6%)
Norway
$3.3
$20.4
$20.8
$8.1
$5.7
$2.2
$12.9
$10.7(490.9%)
$9.6(290.9%)
Sweden
$41.2
$50.4
$70.2
$66.0
$92.5
$109.2
$107.0
$-2.2(-2%)
$65.8(159.7%)
United Kingdom
$252.8
$305.2
$327.6
$269.9
$204.8
$285.1
$292.2
$7.1(2.5%)
$39.4(15.6%)
United States
$485.0
$585.0
$636.6
$638.4
$532.5
$474.7
$630.6
$155.9(32.8%)
$145.6(30%)
Other DAC Countries*
$11.0
$29.5
$9.0
$10.1
$3.3
$9.6
$29.6
$20.1(210.1%)
$18.6(169.5%)
Total
$1,093.6
$1,325.0
$1,432.7
$1,344.5
$1,199.0
$1,261.4
$1,498.7
$237.3(18.8%)
$405.1(37%)
*Austria, Belgium, Czech Republic, European Union, Finland, Greece, Hungary, Iceland, Ireland, Italy, Japan, Korea, Luxembourg, New Zealand, Poland, Portugal, the Slovak Republic, Slovenia, Spain, and Switzerland.
Among the ten donors profiled, seven increased funding in 2018 (Canada, Denmark, Germany, the Netherlands, Norway, the UK, and the US) and three decreased (Australia, France, and Sweden); these trends were the same in currency of origin.
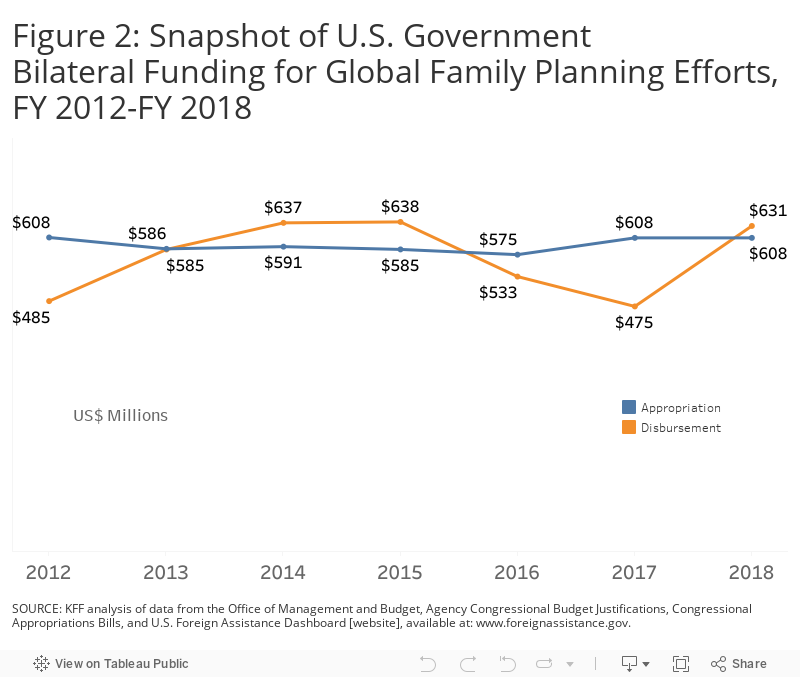
Approximately two-thirds of the overall increase in 2018 was due to an increase in funding from the U.S., the world’s largest donor. In 2018, U.S. disbursements totaled US$630.6 million, an increase of US$155.9 million (33%) compared to 2017 (US$474.7 million). The U.S. increase in 2018 was largely due to the timing of disbursements and does not reflect an actual increase in U.S. appropriations by Congress, which have been flat for several years (see Figure 2 and Box 1). The remaining increase reflects actual increased disbursements from Canada, Denmark, Germany, the Netherlands, Norway, and the U.K.
var divElement = document.getElementById(‘viz1573154815337’); var vizElement = divElement.getElementsByTagName(‘object’)[0]; vizElement.style.width=’800px’;vizElement.style.height=’677px’; var scriptElement = document.createElement(‘script’); scriptElement.src = ‘https://public.tableau.com/javascripts/api/viz_v1.js’; vizElement.parentNode.insertBefore(scriptElement, vizElement);
.
Box 1: U.S. Government Family Planning Appropriations & Disbursements
The U.S. President’s budget request to Congress starts the budget process each year. Congress considers this request and then specifies funding levels in annual appropriations bills. Funding amounts specified by Congress are for a given fiscal year (the U.S. fiscal year is from October 1 to September 30), but may be spent over a multiyear period.
Key highlights of recent trends in U.S. funding for FP are as follows:
Flat Funding Since 2011: Congressional appropriations for family planning activities have been essentially flat at approximately $600 million since 2011.
Trump Administration Proposes to Eliminate Funding (2018): In 2018, the administration proposed to eliminate family planning funding, the first time a request to eliminate the program had been made. Despite this request, Congress maintained funding at the prior year level.
Trump Administration Proposes to Cut Funding by 50% (2019): In 2019, the administration proposed to cut family planning funding by nearly 50%. Similar to 2018, Congress maintained funding at the prior year level.
Trump Administration Proposes to Cut Funding by 55% (2020): In 2020, the administration proposed to cut family planning funding by 55%. While Congress has yet to finalize 2020 appropriations, bills submitted by both the House and the Senate have included family planning funding at levels higher than the prior fiscal year.
Disbursement Patterns: Because funding may be spent over a multi-year period, disbursements may lag or vary from appropriations due to a variety of factors including a realignment of the program or the timing of reimbursement requests from an implementing partner, but will eventually be spent.
The U.S. was the largest donor to family planning, accounting for 42% of donor government disbursements (see Figure 3). The U.K. (19%) was the second largest donor followed by the Netherlands (14%), Sweden (7%), and Canada (5%).
var divElement = document.getElementById(‘viz1573154883075’); var vizElement = divElement.getElementsByTagName(‘object’)[0]; vizElement.style.width=’800px’;vizElement.style.height=’677px’; var scriptElement = document.createElement(‘script’); scriptElement.src = ‘https://public.tableau.com/javascripts/api/viz_v1.js’; vizElement.parentNode.insertBefore(scriptElement, vizElement);
.
Since the London Summit in 2012, most donor governments have increased funding for family planning and overall funding has risen by US$405.1 million (37%) (see Figure 4 & Table 1). Eight of the ten donor governments profiled (Canada, Denmark, Germany, the Netherlands, Norway, Sweden, the U.K., and the U.S.) increased funding over the period (see Figure 5). The U.S. was the largest cumulative increase over the period (US$145.6 million), though largely due to fluctuations in disbursement rates. The Netherlands (US$110.2 million) was the second largest cumulative increase, followed by Sweden (US$65.8 million), Canada (US$40.3 million), and the U.K. (US$39.4 million). Five of the donors profiled (Canada, Denmark, the Netherlands, Norway, and Sweden) doubled or more than doubled bilateral family planning funding over the period. It should be noted that the dip in funding in 2015 and 2016 was primarily due to an increase in the value of the U.S. dollar against all other currencies as well as disbursement delays by the U.S.
var divElement = document.getElementById(‘viz1573154946057’); var vizElement = divElement.getElementsByTagName(‘object’)[0]; vizElement.style.width=’800px’;vizElement.style.height=’677px’; var scriptElement = document.createElement(‘script’); scriptElement.src = ‘https://public.tableau.com/javascripts/api/viz_v1.js’; vizElement.parentNode.insertBefore(scriptElement, vizElement);
var divElement = document.getElementById(‘viz1573154989256’); var vizElement = divElement.getElementsByTagName(‘object’)[0]; vizElement.style.width=’800px’;vizElement.style.height=’677px’; var scriptElement = document.createElement(‘script’); scriptElement.src = ‘https://public.tableau.com/javascripts/api/viz_v1.js’; vizElement.parentNode.insertBefore(scriptElement, vizElement);
.
Donor Contributions to UNFPA
While the majority of donor government assistance for family planning is provided bilaterally, donors also provide support for family planning activities through contributions to the United Nations Population Fund (UNFPA). Most of UNFPA’s funding is from donor governments, which provide funding in two ways: 1) donor directed or earmarked contributions for specific activities (e.g. donor contributions to the UNFPA Supplies), which are included as part of bilateral funding above; and 2) general contributions to “core” activities that are untied and meant to be used for both programmatic activities (e.g. family planning, population and development, HIV/AIDS, gender, and sexual and reproductive health and rights) and operational support as determined by UNFPA.
In 2018, donor governments profiled provided US$373.9 million in core contributions to UNFPA, an increase of US$29.5 million (9%) compared to the 2017 level (US$344.4 million). Among the donors profiled, two increased funding (Norway and Sweden), five remained flat (Australia, Canada, France, Germany, and the U.K.), and two declined (Denmark and the Netherlands). The U.S. did not provide any funding to UNFPA in 2018 (see Box 2).6
Box 2: U.S. funding for UNFPA
Created in 1969, UNFPA is a United Nations agency that supports sexual and reproductive health activities in many low- and middle-income countries and was a key partner in both the 2012 and 2017 family planning summits. The U.S. played a key role in the founding of UNFPA and has historically provided both core and non-core funding to the organization. However, this funding has been subject to the “Kemp-Kasten amendment”, first enacted by Congress in 1985 and included in annual appropriations language, which states that no U.S. funds may be made available to “any organization or program which, as determined by the president of the United States, supports or participates in the management of a program of coercive abortion or involuntary sterilization.” Since 1985, the Kemp-Kasten amendment has been invoked 17 times – as determined by presidents along party lines – to withhold funding (both core and non-core) from UNFPA (see KFF “UNFPA Funding & Kemp-Kasten: An Explainer”). This has resulted in significant fluctuations in funding over time.
Recent highlights of U.S. funding for UNFPA are as follows:
Total Funding in 2016: U.S. contributions to UNFPA totaled $69 million in 2016, including $30.7 million in core resources (9% of total core contributions) and an additional $38.3 million in non-core resources for other project activities (8% of total non-core contributions).
Funding Withheld in 2017 through 2019: The current administration has invoked the Kemp-Kasten amendment in each of the past three fiscal years (2017-2019) to withhold all funding (both core and non-core) from UNFPA.
Sweden provided the largest core contribution to UNFPA in 2018 (US$83.0 million), followed by Norway (US$63.8 million), the Netherlands (US$37.5), and Denmark (US$37.1 million) (see Figure 6 and Table 2). Among the ten donors profiled, one donor – Norway – provided a larger contribution to UNFPA’s core resources than their total bilateral disbursement for family planning.
var divElement = document.getElementById(‘viz1573155074165’); var vizElement = divElement.getElementsByTagName(‘object’)[0]; vizElement.style.width=’800px’;vizElement.style.height=’677px’; var scriptElement = document.createElement(‘script’); scriptElement.src = ‘https://public.tableau.com/javascripts/api/viz_v1.js’; vizElement.parentNode.insertBefore(scriptElement, vizElement);
.
Table 2: Donor Government Contributions to UNFPA (Core Resources), 2012-2018 (in current US$, millions)
Government
2012
2013
2014
2015
2016
2017
2018
Difference
2017 – 2018
2012 – 2018
Australia
$14.9
$15.6
$13.9
$11.7
$7.0
$6.9
$7.4
$0.5(6.7%)
$-7.5(-50.6%)
Canada
$17.4
$16.0
$14.0
$12.4
$11.7
$12.1
$11.8
$-0.4(-3.1%)
$-5.6(-32.4%)
Denmark
$44.0
$40.4
$41.9
$35.7
$28.1
$43.2
$37.1
$-6.1(-14.1%)
$-6.9(-15.8%)
France
$0.5
$-
$-
$0.6
$0.8
$0.6
$0.7
$0.1(13%)
$0.2(35%)
Germany
$20.7
$24.0
$24.7
$21.3
$24.4
$25.1
$25.2
$0.1(0.5%)
$4.5(21.7%)
Netherlands
$49.0
$52.4
$48.4
$39.7
$39.1
$37.4
$37.5
$0.1(0.4%)
$-11.5(-23.5%)
Norway
$59.4
$70.6
$69.1
$55.6
$46.8
$50.8
$63.8
$13(25.6%)
$4.4(7.4%)
Sweden
$66.3
$65.8
$70.3
$57.4
$59.0
$63.8
$83.0
$19.2(30.1%)
$16.7(25.2%)
United Kingdom
$31.8
$31.5
$33.1
$30.8
$25.0
$25.9
$25.5
$-0.4(-1.4%)
$-6.3(-19.8%)
United States
$30.2
$28.9
$31.1
$30.8
$30.7
$-
$-
–
$-30.2(-100%)
Other DAC Donors
$98.0
$108.8
$125.0
$96.6
$75.1
$78.8
$82.1
$3.3(4.2%)
$-15.9(-16.2%)
Total
$432.2
$454.0
$471.5
$392.6
$347.8
$344.4
$373.9
$29.5(8.6%)
$-58.3(-13.5%)
Looking Ahead
While donor government funding for family planning reached the highest level since this tracking effort began, a significant share of that increase was due to the timing of disbursements by the U.S. The U.S. increase may be temporary as annual appropriations have been relatively flat in recent years. Family planning funding from most of the remaining nine donors, all of which made new or renewed commitments at the Family Planning Summit in 2017, increased in both 2017 and 2018. These years have also seen funding growth in broader Sexual and Reproductive Health and Rights (SRHR) among a subset of donor governments. Ongoing tracking of whether these trends continue will be important for assessing the post-2020 agenda.
Methodology
Bilateral and multilateral data on donor government assistance for family planning (FP) in low- and middle-income countries were collected from multiple sources. The research team collected the latest bilateral assistance data directly for 10 governments: Australia, Canada, Denmark, Germany, France, the Netherlands, Norway, Sweden, the United Kingdom, and the United States during the first half of 2019. Data represent the fiscal year 2017 period for all governments. Direct data collection from these donors was desirable because they represent the preponderance of donor government assistance for family planning and the latest official statistics – from the Organisation for Economic Co-operation and Development (OECD) Creditor Reporting System (CRS) (see: http://www.oecd.org/dac/stats/data) – which are from 2017 and do not include all forms of international assistance (e.g., funding to countries such as Russia and the Baltic States that are no longer included in the CRS database). In addition, the CRS data may not include certain funding streams provided by donors, such as FP components of mixed-purpose grants to non-governmental organizations. Data for all other OECD DAC member governments – Austria, Belgium, Czech Republic, the European Union, Finland, Greece, Hungary, Iceland, Ireland, Italy, Japan, Korea, Luxembourg, New Zealand, Poland, Portugal, the Slovak Republic, Slovenia, Spain, and Switzerland – which collectively accounted for approximately 2 percent of bilateral family planning disbursements, were obtained from the OECD CRS and are from calendar year 2017.
For purposes of this analysis, funding was counted as family planning if it met the OECD CRS purpose code definition: “Family planning services including counseling; information, education and communication (IEC) activities; delivery of contraceptives; capacity building and training.”7 Where it was possible to identify funding amounts, family-planning-related activities funded in the context of other official development assistance sectors (e.g. education, civil society) are included in this analysis. Project-level data were reviewed for Canada, Denmark, France, Germany, the Netherlands, Norway, and Sweden to determine whether all or a portion of the funding could be counted as family planning. Family-planning-specific funding totals for the United States were obtained through direct data downloads and communications with government representatives. Funding attributed to Australia and the United Kingdom is based on a revised Muskoka methodology as agreed upon by donors at the London Summit on Family Planning in 2012. Funding totals presented in this analysis should be considered preliminary estimates based on data provided by representatives of the donor governments who were contacted directly.
It was difficult in some cases to disaggregate bilateral family planning funding from broader population, reproductive and maternal health totals, as the two are sometimes represented as integrated totals. In addition, family-planning-related activities funded in the context of other official development assistance sectors (e.g. education, civil society) have in the past remained largely unidentified. For purposes of this analysis, we worked closely with the largest donors to family planning to identify such family-planning-specific funding where possible. In some cases (e.g. Canada), specific FP percentages were recorded for mixed-purpose projects. In other cases, it was possible to identify FP-specific activities by project titles in languages of origin, notwithstanding less-specific financial coding. In still other cases, detailed project descriptions were analyzed (see Appendix 2 for detailed data table).
Bilateral funding is defined as any earmarked (FP-designated) amount and includes family planning-specific contributions to multilateral organizations (e.g. non-core contributions to UNFPA Supplies). U.S. bilateral data correspond to amounts disbursed for the 2018 fiscal year. UNFPA contributions from all governments correspond to amounts received during the 2018 calendar year, regardless of which contributor’s fiscal year such disbursements pertain to.
With some exceptions, bilateral assistance data were collected for disbursements. A disbursement is the actual release of funds to, or the purchase of goods or services for, a recipient. Disbursements in any given year may include disbursements of funds committed in prior years and in some cases, not all funds committed during a government fiscal year are disbursed in that year. In addition, a disbursement by a government does not necessarily mean that the funds were provided to a country or other intended end-user. Enacted amounts represent budgetary decisions that funding will be provided, regardless of the time at which actual outlays, or disbursements, occur. In recent years, most governments have converted to cash accounting frameworks, and present budgets for legislative approval accordingly; in such cases, disbursements were used as a proxy for enacted amounts.
UNFPA core contributions were obtained from United Nations Executive Board documents. UNFPA estimates of total family planning funding provided from both core and non-core resources were obtained through direct communications with UNFPA representatives. Other than core contributions provided by governments to UNFPA, un-earmarked core contributions to United Nations entities, most of which are membership contributions set by treaty or other formal agreement (e.g., United Nations country membership assessments), are not identified as part of a donor government’s FP assistance even if the multilateral organization in turn directs some of these funds to FP. Rather, these would be considered as FP funding provided by the multilateral organization, and are not considered for purposes of this report.
The fiscal year period varies by country. The U.S. fiscal year runs from October 1-September 30. The Australian fiscal year runs from July 1-June 30. The fiscal years for Canada and the U.K. are April 1-March 31. Denmark, France, Germany, the Netherlands, Norway, and Sweden use the calendar year. The OECD uses the calendar year, so data collected from the CRS for other donor governments reflect January 1-December 31. Most UN agencies use the calendar year and their budgets are biennial.
All data are expressed in US dollars (USD). Where data were provided by governments in their currencies, they were adjusted by average daily exchange rates to obtain a USD equivalent, based on foreign exchange rate historical data available from the U.S. Federal Reserve (see: http://www.federalreserve.gov/) or in some cases from the OECD. Data obtained from UNFPA were already adjusted by UNFPA to represent a USD equivalent based on date of receipts.
Appendices
Appendix 1: Other Sources of Funding for FP in Low- & Middle-Income Countries
In addition to donor governments, there are three other major funding sources for family planning assistance: multilateral organizations, the private sector, and domestic resources.
Multilateral Organizations: Multilateral organizations are international organizations made up of member governments (and in some cases private sector and civil society representatives), who provide both core contributions as well as donor-directed funding for specific projects. Core support from donors is pooled by the multilateral organization, which in turn directs its use, such as for family planning. Donor-directed or earmarked funding, even when provided through a multilateral organization, is considered part of a donor’s bilateral assistance.
The primary multilateral organization focused on family planning is the United Nations Population Fund (UNFPA), which estimates that it spent US$356.2 million (40.8% of its total program expenses) on family planning activities in 2018 (US$62.5 million from core resources and US$293.7 million from non-core resources).8 Another important source of multilateral assistance for family planning is the World Bank, which provides such funding under broader population and reproductive health activities and hosts the Secretariat for the Global Financing Facility (GFF).
Private Sector: Foundations (charitable and corporate philanthropic organizations), corporations, faith-based organizations, and international non-governmental organizations (NGOs) provide support for FP activities in low- and middle-income countries not only in terms of funding, but through in-kind support; commodity donations; and co-investment strategies with government and other sectors. For instance, the Bill & Melinda Gates Foundation has become a major funder of global health efforts, including family planning activities, and is a core partner of FP2020. In 2018, the Gates Foundation provided US$296 million for family planning.9
Domestic Resources: Domestic resources include spending by country governments that also receive international assistance for FP and spending by households/individuals within these countries for FP services. Such resources represent a significant and critical part of the response. Since the London Summit, a total of 46 low- and middle-income countries have made specific commitments to increase their family planning spending.
Donor Government Bilateral Disbursements for Family Planning, 2012-2018* (in current US$, millions)
Country
2012
2013
2014
2015
2016
2017
2018
Notes
Australia
$43.2
$39.5
$26.6
$12.4
$24.9
$25.6
$22.2
Australia has now identified A$31.5 million in bilateral FP funding for the 2017-18 fiscal year using the FP2020-agreed methodology, which includes funding from non-FP-specific activities (e.g. HIV, RH, maternal health and other sectors) and a percentage of the donor’s core contributions to several multilateral organizations (e.g. UNFPA). For this analysis, Australian bilateral FP funding did not include contributions to multilateral institutions. However, it was not possible to identify and adjust for funding to other non-FP-specific activities in most cases.
Canada
$41.5
$45.6
$48.3
$43.0
$43.8
$69.0
$81.8
Bilateral funding is for family planning and reproductive health components of combined projects/activities in FY18-19. Reproductive health activities without family planning components are not reflected. This is a preliminary estimate. In support of its feminist international agenda, Canada committed to double its funding to sexual and reproductive health and rights (SRHR) from 2017-2020 with an additional CAD 650 million. Canada is taking a comprehensive approach to SRHR. Efforts focus on providing comprehensive sexuality education, strengthening reproductive health services, and investing in family planning and contraceptives. Programs will also help prevent and respond to sexual and gender-based violence, including child early and forced marriage and female genital mutilation and cutting, and support the right to choose safe and legal abortion, as well as access to post-abortion care.
Denmark
$13.0
$20.3
$28.8
$28.1
$30.7
$33.1
$38.5
Bilateral funding is for family planning-specific activities and reproductive health-coded activities with a family planning focus.
France
$49.6
$37.2
$69.8
$68.6
$39.9
$19.2
$17.0
Bilateral funding is for a mix of family planning, reproductive health and maternal & child health activities in 2012-2018; family planning-specific activities cannot be further disaggregated. 2018 data is preliminary.
Germany
$47.6
$38.2
$31.3
$34.0
$37.8
$36.8
$51.3
Bilateral funding is for family planning-specific activities, as well as elements of multipurpose projects.
Netherlands
$105.4
$153.7
$163.6
$165.8
$183.1
$197.0
$215.6
The Netherlands budget provided a total of EUR445 million in 2018 for “Sexual and Reproductive Health & Rights, including HIV/AIDS” of which an estimated EUR182.7 million was disbursed for bilateral family planning and reproductive health activities (not including HIV).
Norway
$3.3
$20.4
$20.8
$8.1
$5.7
$2.2
$12.9
Bilateral funding is for family planning-specific activities, narrowly-defined under the corresponding DAC subsector 13030. Additional Norwegian bilateral family planning activities are for the most part not standalone, but rather are integrated as elements of other activities. In line with Norway’s methodology for SRHR monitoring of its FP Summit 2017 pledge, Norwegian SRHR support comprises all projects using DAC Sector 130, 100% of UNFPA and UNAIDS core contributions, 50% of contributions to the Global Fund to Fight Aids, Tuberculosis and Malaria and 28% of contributions to the Global Financing Facility. Using these parameters, Norwegian SRHR funding totalled NOK1.3347 billion in 2017 and NOK1.5804 billion in 2018.
Sweden
$41.2
$50.4
$70.2
$66.0
$92.5
$109.2
$107.0
Bilateral funding is for combined family planning and reproductive health activities. None of Sweden’s top-magnitude health activities appears to reflect an exclusive family-planning-specific subsector focus, indicative of the integration of FP activities into broader health initiatives in ways similar to those employed by some other governments. It thus may not be possible to identify exact amounts of Swedish bilateral or multi-bi FP financing. More broadly, total Swedish bilateral SRHR activities appear to have accounted for at least SEK1.3 billion in 2018. Of this, at least SEK246 million is estimated to have been related to family planning.
United Kingdom
$252.8
$305.2
$327.6
$269.9
$204.8
$285.1
$292.2
In the financial year 2018/19, total UK spending on family planning was £260.7 million. This is a provisional estimate, based upon the “revised Muskoka Methodology*, which includes funding from non-FP-specific activities (e.g., HIV, RH, maternal health and other sectors) and a percentage of the donor’s core contributions to several multilateral organizations. For this analysis, UK bilateral FP funding of £222.3 million was calculated by removing unrestricted core contributions to multilateral organizations. However, it was not possible to identify and adjust for funding for other non-FP-specific activities in most cases. Bilateral funding is for combined family planning and reproductive health, consistent with the agreed-on methodology. A final estimate will be available after DFID publishes its annual report for 2018/19 in 2020.
United States
$485.0
$585.0
$636.6
$638.4
$532.5
$474.7
$630.6
Bilateral funding is for combined family planning and reproductive health activities; while USAID estimates that most funding is for family planning-specific activities only, these cannot be further disaggregated.
Other DAC Countries**
$11.0
$29.5
$9.0
$10.1
$3.3
$9.6
$29.6
Bilateral funding was obtained from the Organisation for Economic Co-operation and Development (OECD) Credit Reporting System (CRS) database and represents funding provided in the prior year (e.g. data presented for 2018 are the 2017 totals, the most recent year available; 2017 presents 2016 totals; etc.).
TOTAL
$1,093.6
$1,325.0
$1,432.7
$1,344.5
$1,199.0
$1,261.4
$1,498.7
*For purposes of this analysis, family planning bilateral expenditures represent funding specifically designated by donor governments for family planning as defined by the OECD DAC (see methodology), and include: stand-alone family planning projects; family planning-specific contributions to multilateral organizations (e.g. contributions to UNFPA Supplies); and, in some cases, projects that include family planning within broader reproductive health activities. During the FP2020 Summit, donors agreed to a revised Muskoka methodology to determine their FP disbursements totals. This methodology includes some funding designated for other health sectors including, HIV, reproductive health (RH), maternal health, and other areas, as well as a percentage of a donor’s core contributions to several multilateral organizations including UNFPA, the World Bank, WHO, and the Global Fund to Fight AIDS, Tuberculosis and Malaria. Among the donors profiled, Australia and the U.K. reported FP funding using this revised methodology.
**Austria, Belgium, Czech Republic, European Union, Finland, Greece, Hungary Iceland, Ireland, Italy, Japan, Korea, Luxembourg, New Zealand, Poland, Portugal, the Slovak Republic, Slovenia, Spain, and Switzerland.
Endnotes
Totals represent disbursements specifically designated by donor governments for family planning as defined by the OECD DAC (see methodology), and include: standalone family planning projects; family planning-specific contributions to multilateral organizations (e.g., contributions to UNFPA Supplies); and, in some cases, projects that include family planning within broader reproductive health activities. ↩︎
Includes core-contributions from members of the OECD DAC only; core contributions from non-DAC donors are not included in this total. ↩︎
Includes funding from 29 DAC member countries and the European Union (EU). ↩︎
In FY17 and FY18, the U.S. administration invoked the Kemp-Kasten amendment to withhold funding – both core and non-core contributions – to UNFPA. In FY16, U.S. contributions to UNFPA had totaled $69 million, including $30.7 million in core resources and an additional $38.3 million in non-core resources for other project activities (see KFF “UNFPA Funding & Kemp-Kasten: An Explainer”). ↩︎
OECD, The List of CRS Purpose Codes and Voluntary Budget Identifier Codes, June 2018. ↩︎
Affordable Care Act Premiums Are Falling in Many Areas of the U.S. in 2020, But Changes Vary Widely By County and Type of Plan, County-Level Analysis Shows
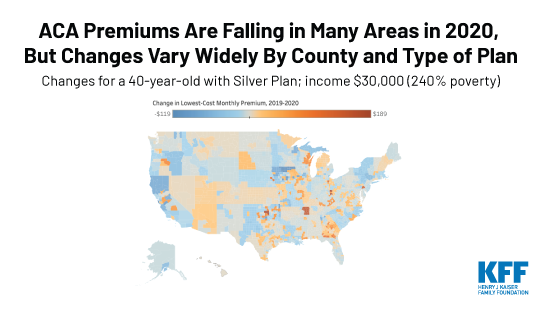
Although premiums for Affordable Care Act Marketplace benchmark silver plans are decreasing on average across the U.S. in 2020, changes vary widely by geographic location and plan type, including premium increases in a number of counties and plans, according to a new KFF analysis of county-level data.
The analysis of premium data from insurer rate filings to state regulators, state exchange websites and healthcare.gov shows how premiums are changing next year at the county level, both before and after accounting for the federal subsidies that are available to some consumers depending on their income. An interactive map illustrates changes in premiums for the lowest-cost bronze, silver and gold plans by county.
The analysis finds that unsubsidized premiums for benchmark silver plans – which are the basis for determining federal financial help – are dropping by 3.5 percent, on average, and by just under 3 percent for the lowest-cost bronze, silver and gold plans. However, whether consumers will see their premium payments rise or fall will depend on their income, preferred metal level plan and how specific plan premiums are changing at the county level.
In 2020, the ACA’s premium tax credits would cover the full premium of the lowest-cost bronze marketplace plan for a 40-year-old with an annual income of $20,000 in 2,661 of the nation’s 3,142 counties, or 85 percent of counties. The figure is 1,736 counties (55%) for a 40-year-old making $25,000; 608 counties (19%) for a person the same age who makes $30,000; 287 counties (9%) for someone making $35,000; and 135 counties (4%) for a 40-year-old making $40,000.
As in the previous two years, insurers generally loaded the cost from the termination of federal cost-sharing reduction payments entirely onto the silver tier of plans, a practice known as “silver loading”. That means subsidy-eligible enrollees will continue to receive relatively large ACA premium tax credits, although the amount may be smaller than in past years based on decreases in the underlying benchmark silver premiums.
For subsidized enrollees, even a gold plan may be available at no cost after tax credits are applied. For instance, the tax credit for a 40-year-old with an annual income of $20,000 covers the full premium of the lowest-cost gold plan in 240 counties in the U.S. (or 8 percent of counties).
The ACA open enrollment period for the federal marketplace and most state marketplaces began Nov. 1 and ends on Dec. 15.
With KFF’s updated Health Insurance Marketplace Calculator, consumers can generate estimates of their health insurance premiums and the federal subsidies they may be eligible for when purchasing insurance on their own in the ACA marketplaces. Consumers also can search our collection of more than 300 Frequently Asked Questions about open enrollment, the health insurance marketplaces and the ACA.
Premiums for ACA Marketplace benchmark silver plans are decreasing on average across the U.S. in 2020. However, premium changes vary widely by location and by metal level, including premium increases in a number of counties and plans. Additionally, the amount an exchange enrollee actually pays in premiums depends largely on their income – as most enrollees receive significant premium subsidies – and the difference in cost between the benchmark (second-lowest silver plan) and the premium for the plan they choose.
ACA premiums are falling in many areas of the U.S in 2020. This analysis has interactive maps with county-level data illustrating changes for the lowest-cost bronze, silver & gold plans across the country.
We analyzed premium data from insurer rate filings to state regulators, state exchange websites, and healthcare.gov to see how premiums are changing at the county level both before and after subsidies in 2020. The map below illustrates changes in premiums for the lowest-cost bronze, silver, and gold plans by county. Results are shown for a 40-year-old paying the full premium and for a 40-year old with an income of $20,000 (160% of poverty), $25,000 (200% of poverty), $30,000 (240% of poverty), $35,000 (280% of poverty), and $40,000 (320% of poverty), who would be eligible for a premium tax credit.
Nationally, the average unsubsidized premium for the lowest-cost bronze, silver, and gold plans are decreasing by just under 3% from 2019 to 2020, and the average benchmark silver premium – on which subsidies are calculated – is dropping by somewhat more, about 3.5%. (Table 1).
Table 1: Change in the Average Lowest-Cost Premium by Metal Level Before Tax Credit, 2019-2020 for a 40-year-old
2019
2020
% Change
Lowest Cost Bronze Premium
$340
$331
-2.6%
Lowest Cost Silver Premium
$454
$442
-2.7%
Lowest Cost Gold Premium
$516
$501
-2.9%
Benchmark Premium
$478
$462
-3.5%
SOURCE: Kaiser Family Foundation analysis of premium data from Healthcare.gov and review of state rate filings.
In general, this could mean the tax credit covers somewhat less of the premium for subsidized enrollees who enroll in the lowest-cost plans. However, premium changes vary by geography, so whether enrollees will see their premium payments increase or decrease for 2020 will depend on how benchmark premiums are changing and how premiums for plans at their preferred metal level are changing in their county:
In Canadian County, Oklahoma, for example, unsubsidized premiums for benchmark silver plans are decreasing by 28%, while unsubsidized premiums for low-cost bronze plans are increasing 3%. This means that premium tax credits will cover less of the total premium for a low-cost bronze plan in 2020, and that bronze premium payments (after tax credits) will go up for subsidized enrollees.
Conversely, in Allamakee County, Iowa, unsubsidized benchmark silver premiums are increasing by 6% on average, while low-cost bronze plans are decreasing by 17%. In areas like this, where the gap between the benchmark plan and the lowest-cost bronze premium is growing, premium tax credits will cover more of the total premium for a low-cost bronze plan in 2020 and bronze premium payments (after tax credits) will go down for subsidized enrollees.
Premium changes for people eligible for subsidies will also be affected by changes in the amount they are expected to pay for a benchmark plan at any given income level, which is decreasing slightly in 2020.
Table 2: Change in the Average Lowest-Cost Premium by Metal Level After Tax Credit, 2019-2020
40-year-old with $20,000 income (160% of poverty)
2019
2020
% Change
Lowest Cost Bronze Premium
$3
$2
-43.1%
Lowest Cost Silver Premium
$60
$60
+0.1%
Lowest Cost Gold Premium
$121
$118
-2.2%
40-year-old with $25,000 income (200% of poverty)
Lowest Cost Bronze Premium
$26
$25
-5.3%
Lowest Cost Silver Premium
$118
$117
-0.8%
Lowest Cost Gold Premium
$180
$177
-1.8%
40-year-old with $30,000 income (240% of poverty)
Lowest Cost Bronze Premium
$76
$75
-1.4%
Lowest Cost Silver Premium
$183
$180
-1.7%
Lowest Cost Gold Premium
$245
$239
-2.3%
40-year-old with $35,000 income (280% of poverty)
Lowest Cost Bronze Premium
$142
$140
-1.2%
Lowest Cost Silver Premium
$253
$249
-1.7%
Lowest Cost Gold Premium
$315
$308
-2.2%
40-year-old with $40,000 income (320% of poverty)
Lowest Cost Bronze Premium
$191
$197
+2.8%
Lowest Cost Silver Premium
$304
$307
+0.8%
Lowest Cost Gold Premium
$366
$366
0.0%
SOURCE: Kaiser Family Foundation analysis of premium data from Healthcare.gov and review of state rate filings.
As was the case in 2018 and 2019, insurers generally loaded the cost from the termination of federal cost-sharing reduction payments entirely onto the silver tier (a practice sometimes called “silver loading”). The relatively higher price for silver plans due to silver loading means subsidy-eligible Marketplace enrollees will continue to receive relatively large premium tax credits, although the dollar amount may be somewhat smaller than in past years based on decreases in the underlying benchmark silver premiums. These subsidies continue to make gold plans more easily attainable and make bronze plans cheaper (or even more likely to be available for $0) than before cost-sharing reduction payments were terminated. Subsidized premiums for bronze plans may be particularly attractive to many people eligible for premium tax credits (Table 3). For example, the tax credit for a 40-year-old individual making $20,000 covers the full cost of the premium for the lowest-cost bronze plan in 85% of counties (2,661 out of 3,142 counties in the U.S.). This is similar to 2019, when the tax credit has covered the full cost of the lowest-cost bronze plan for a low-income enrollee in 81% of counties (2,547 counties).
Table 3: Number of Counties Where an Individual’s Tax Credit Covers the Full Premium of the Lowest-Cost Bronze Plan,for a 40-year-old
Example Age and Income
2019
2020
40-year-old with $20,000 income (160% of poverty)
2,547 (81% of counties)
2,661 (85% of counties)
40-year-old with $25,000 income (200% of poverty)
2,028 (65%)
1,736 (55%)
40-year-old with $30,000 income (240% of poverty)
661 (21%)
608 (19%)
40-year-old with $35,000 income (280% of poverty)
410 (13%)
287 (9%)
40-year old with $40,000 income (320% of poverty)
120 (4%)
135 (4%)
SOURCE: Kaiser Family Foundation analysis of premium data from Healthcare.gov and review of state rate filings.
However, even if subsidized silver premiums are higher than bronze premiums it is still important for low-income enrollees to consider the significant cost-sharing assistance that is only available if they enroll in a silver plan. In order to qualify for a plan with a cost-sharing reduction (CSR), low-income enrollees must sign up for a silver plan. CSR plans lower the amount an enrollee spends out-of-pocket by setting a lower out-of-pocket maximum, which also translates to lower deductibles, copayments, and coinsurance. For example, a single individual making between 100-200% of the poverty level can qualify for a silver plan with an out-of-pocket maximum of no more than $2,700, and the deductible would be significantly lower than that. If the same individual instead signs up for a bronze plan, the out-of-pocket maximum and deductible could be upwards to $8,150. If this person is sick or expects to have high health spending, it may be better to pay a relatively higher premium for a silver plan even if a bronze plan is available for a $0 premium.
The map below shows where an individual’s tax credit covers the full premium of the lowest-cost bronze plan for a 40-year-old with an income of $20,000 (160% of poverty), $25,000 (200% of poverty), $30,000 (240% of poverty), $35,000 (280% of poverty), and $40,000 (320% of poverty).
Figure 2
For subsidized enrollees, a gold plan may actually be available at no cost after tax credits are applied as well (Table 4). For example, the tax credit for a 40-year-old individual making $20,000 covers the full cost of the premium for the lowest-cost gold plan in 240 counties (out of 3,142 counties in the U.S.). This is a decrease from 2019, when the tax credit covered the full cost of the lowest-cost gold plan in 392 counties.
Table 4: Number of Counties Where an Individual’s Tax Credit Covers the Full Premium of the Lowest-Cost Gold Plan, for a 40-year-old
Example Age and Income
2019
2020
40-year-old with $20,000 income (160% of poverty)
392 (12% of counties)
240 (8% of counties)
40-year-old with $25,000 income (200% of poverty)
153 (5%)
207 (7%)
40-year-old with $30,000 income (240% of poverty)
39 (1%)
87 (3%)
40-year-old with $35,000 income (280% of poverty)
12 (0.4%)
35 (1%)
40-year old with $40,000 income (320% of poverty)
12 (0.4%)
12 (0.4%)
SOURCE: Kaiser Family Foundation analysis of premium data from Healthcare.gov and review of state rate filings.
The map below shows counties where the unsubsidized premium for the lowest-cost gold plan has a lower or comparable premium to the lowest-cost silver plan in 2020, before tax credits are applied.
Figure 3
Discussion
With news of average benchmark premiums dropping a bit on average in 2020, consumers may expect to pay less for any plan on the ACA Marketplaces. In reality, there is wide variation in premium changes, including premium increases for some consumers. What a given consumer actually pays depends on income, location, and differences in pricing between their plan and the benchmark silver plan. For consumers to know how much they will pay, they must return to Healthcare.gov or their state’s exchange each year and carefully consider their options.
As benchmark silver plans in 2020 continue to have relatively higher costs compared to bronze plans, low-income enrollees in many parts of the country will qualify for “free” (zero-premium) bronze plans. Most insurers are continuing to load the cost of offering reduced cost sharing plans onto silver premiums. The benchmark (second-lowest cost) silver plan is the basis for determining the amount of financial assistance consumers receive. When silver premiums are high in comparison to bronze plans, the large tax credit may cover all or most of the cost of a bronze plan. While “free” bronze or gold plans will be available to subsidized enrollees in many counties in 2020 it is still important for low-income enrollees, particularly those in need of more medical care, to consider the significant cost-sharing assistance that is only available if they enroll in a silver plan.
Although the federal government discontinued payments to insurers for reducing cost sharing for lower-income enrollees, insurers remain obliged to provide reduced cost sharing policies to eligible Marketplace enrollees. Silver plans with reduced cost sharing generally have higher actuarial values than gold plans and much higher value than bronze plans for enrollees with incomes below 200% of poverty. Low-income consumers will need to consider whether it makes sense to purchase a metal level other than silver, as a lower premium plan may come with significantly higher deductibles, copays, or coinsurance.
Methods
We analyzed data from the 2019 and 2020 Individual Market Medical files to determine premiums and the benchmark amounts to calculate premium tax credits for the scenarios presented. These files are available at data.healthcare.gov. Premiums for the 13 state-based marketplaces are from a review of insurer rate filings and state plan finders. For most states running their own exchange, premiums presented in this analysis are at the rating area level. Premiums for California and Massachusetts were collected at the zip code level, and premiums for Washington and Nevada were collected at the county level. All premiums are displayed as the full price, rather than just the portion that covers essential health benefits.
The average changes in plan costs were weighted by county using 2019 plan selections obtained from the 2019 Marketplace Open Enrollment Period County-Level Public Use file provided by CMS, available here. In states running their own exchanges, we gathered county-level plan selection data where possible and otherwise estimated county plan selections based on the county population in the 2010 Census and total state plan selections in the 2019 OEP State-Level Public Use File provided by CMS, available here.
Endnotes
[1] The map legend shows premium changes in dollars rather than the percent change because, at the county level, percent changes may appear to overstate premium increases and understate decreases, particularly for those who qualify for relatively large premium subsidies. For example, a change from $60 to $2 is a -97% change but a change from $2 to $60 is a +2900% change. This issue is less prevalent when calculating the percent change in national average premiums, since outlier premiums are not given as much weight. The percent change in premiums by county can be viewed by hovering over the map.
A Collaboration Between KFF and The Cook POlitical Report
The Kaiser Family Foundation and Cook Political Report have embarked on a new project examining the attitudes and experiences of voters in several key battleground states leading up the 2020 presidential election. The Blue Wall Voices Project is a unique state-based polling project that relies on an innovative probability-based approach to conducting public opinion polls using a combination of telephone and online methodologies. Drawing from voter registration lists, KFF and Cook Political Report have conducted interviews with 3,222 voters in the four states constituting the “Democratic Blue Wall” – the area in the Upper Midwest that was previously considered a Democratic stronghold, and where state polls performed poorly in 2016 and underestimated support for President Trump. The data analyzed is from 767 voters in Michigan, 958 voters in Minnesota, 752 voters in Pennsylvania, and 745 voters in Wisconsin. For more details, please see the methodology section of this report.
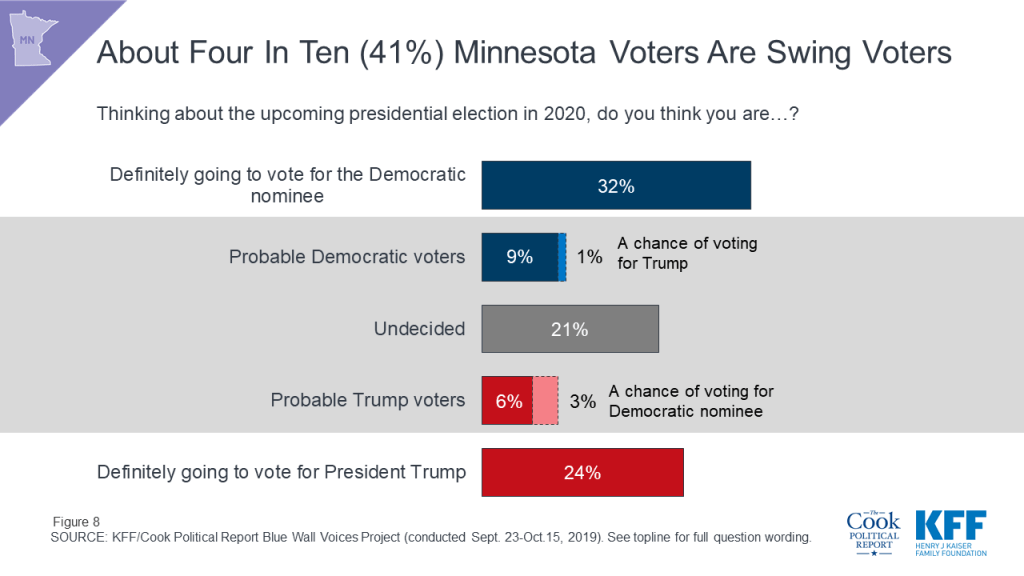
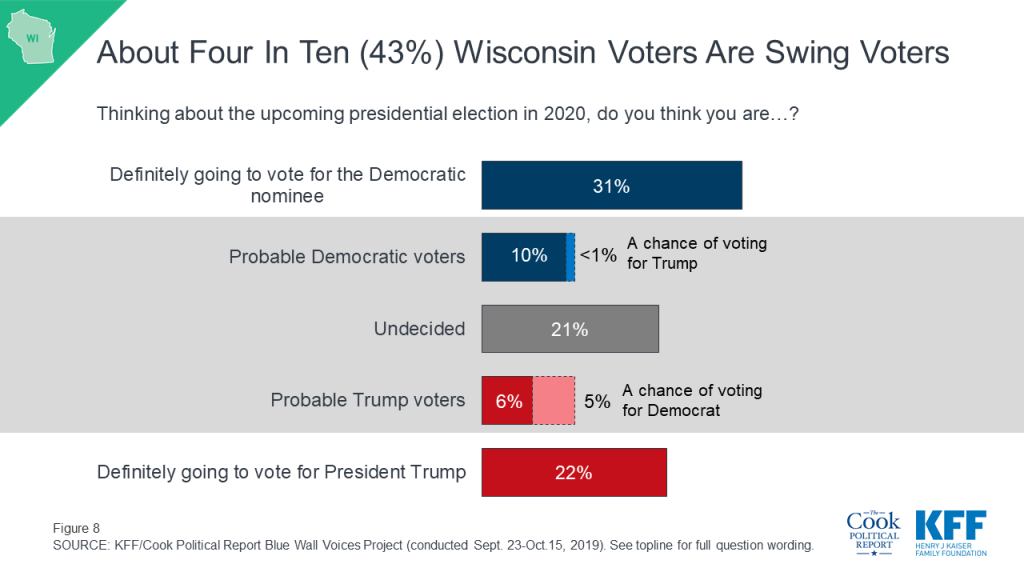
There are many undecided voters and a few persuadable swing voters. One year out from the 2020 presidential election and without a clear frontrunner in the Democratic primaries, a large share of voters – about four in ten (41%) – say they have not yet made up their minds about who they plan to vote for in November 2020. These “swing voters” either report being undecided about their vote in 2020 or are leaning towards a candidate but haven’t made up their minds yet. With a substantial number of votes still up for grabs, this analysis looks in-depth at this group of voters to explore the policy issues that could swing these voters to vote for either President Trump or the Democratic nominee.
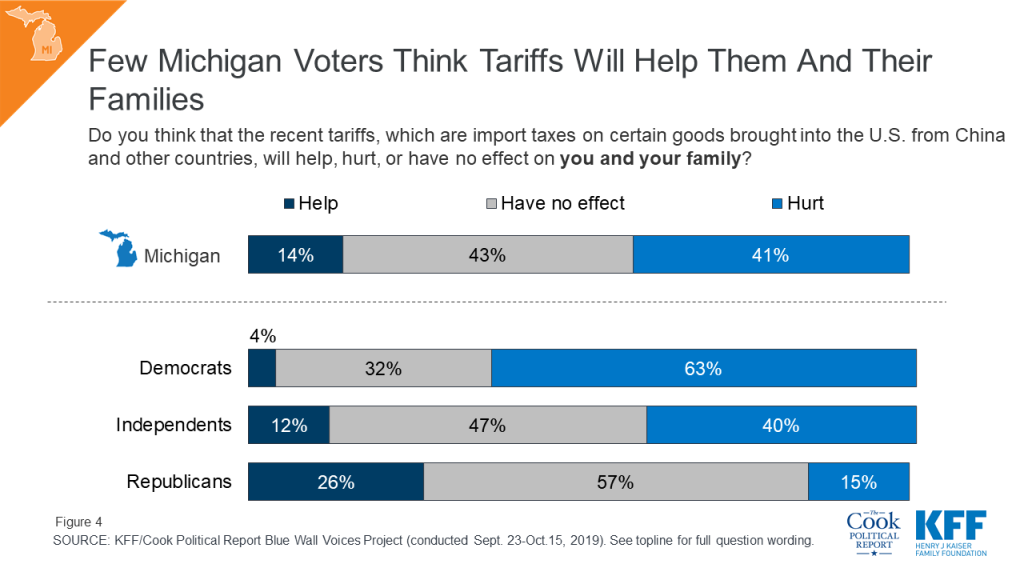
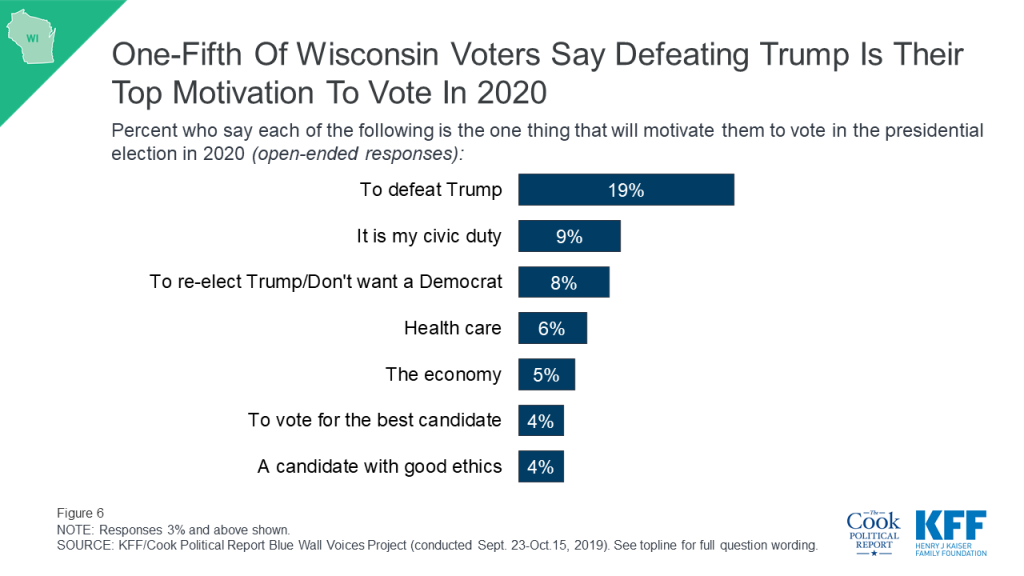
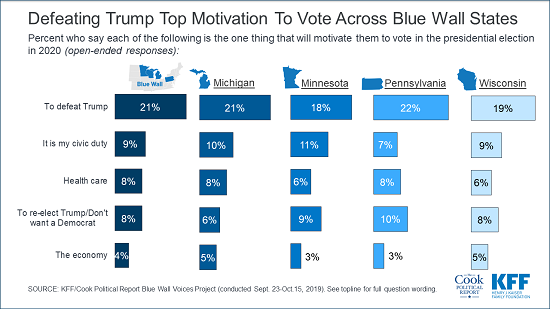
President Trump himself is the defining factor for voters – both positive and negative. When asked to offer in their own words what one thing will motivate them to vote in the 2020 presidential election, nearly three times as many voters offer responses related to defeating President Trump (21%) as offer responses related to re-electing him or not wanting a Democrat to be elected (8%). Defeating President Trump was offered as the top motivation to vote in 2020 by four in ten Democratic voters (39%) while responses related to re-electing President Trump/not wanting a Democrat were offered by 21% of Republican voters. One-fifth of independent voters offered responses related to defeating President Trump while fewer (7%) of independent voters offered responses related to re-electing President Trump. Overall, one-fourth (23%) of voters offer issues such as health care, the economy, and immigration, as their motivation for voting in the 2020 presidential election.
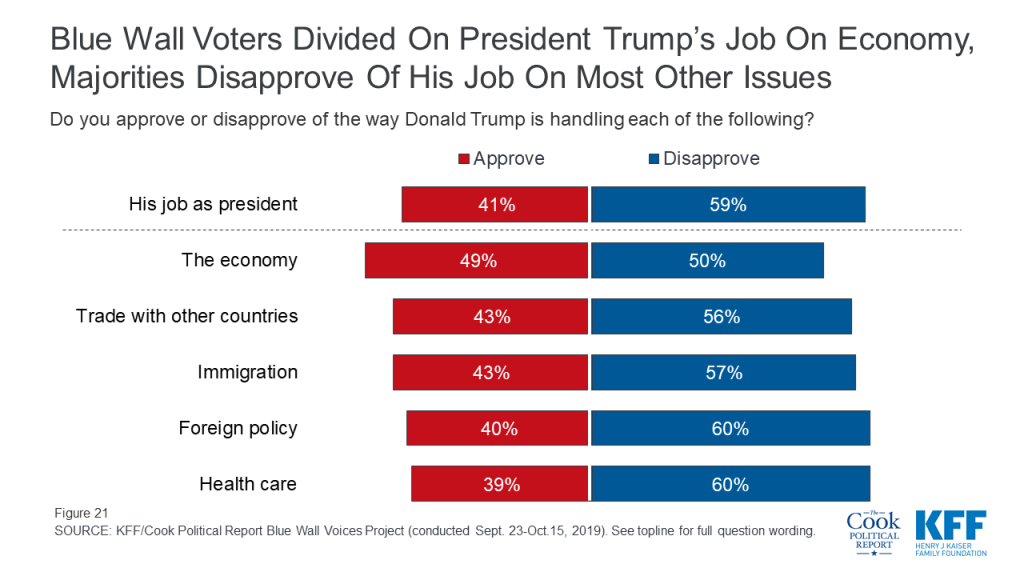
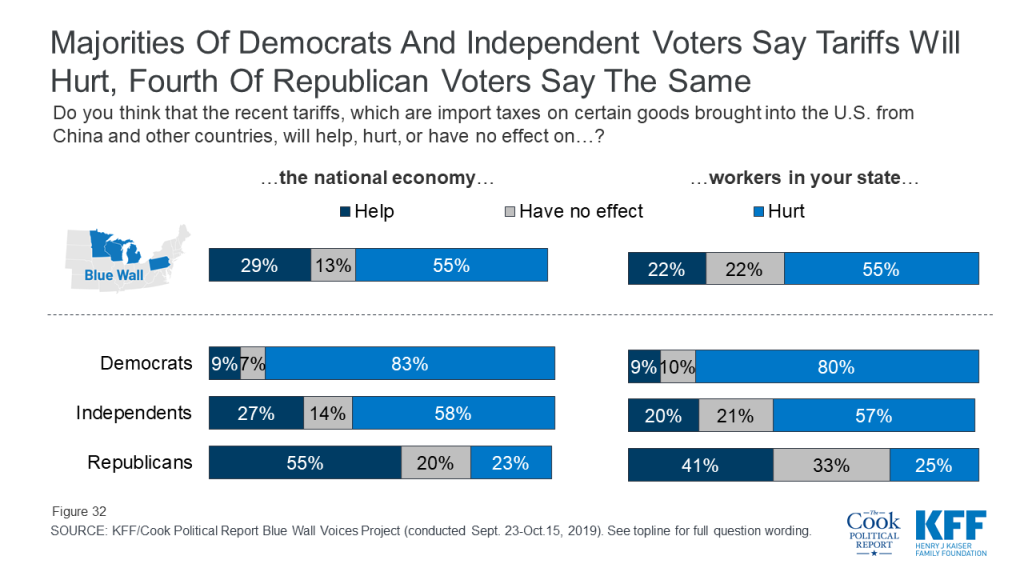
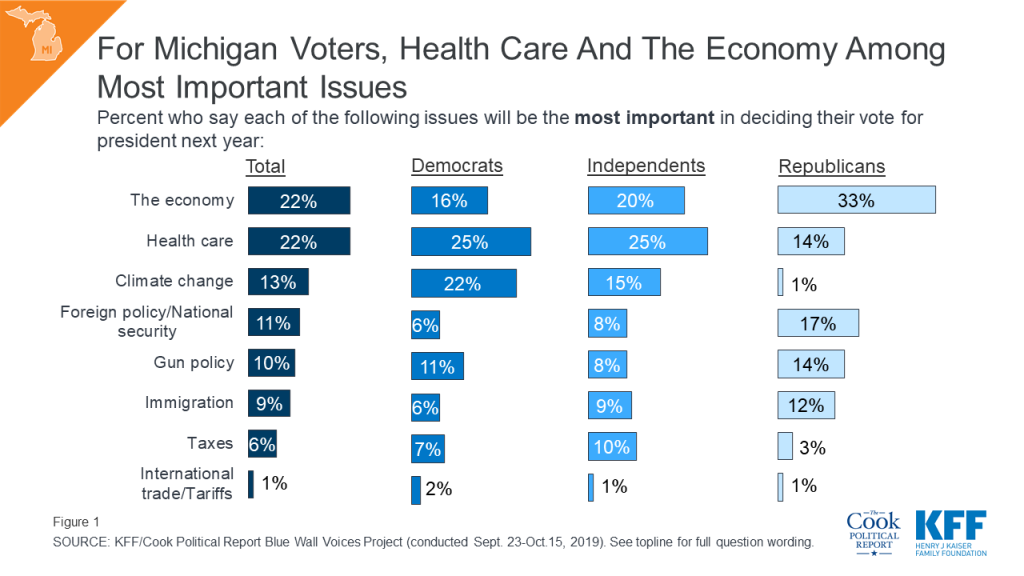
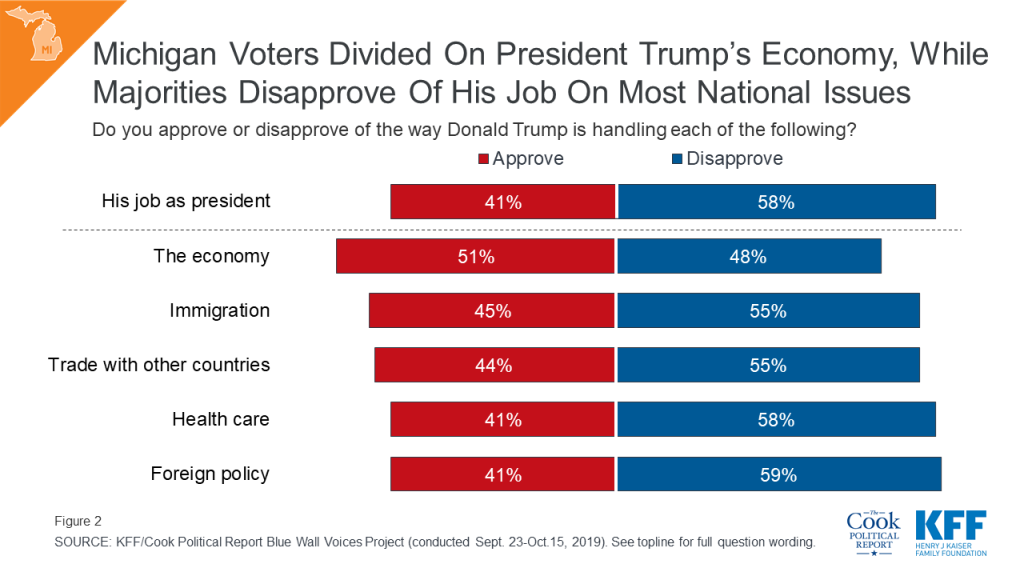
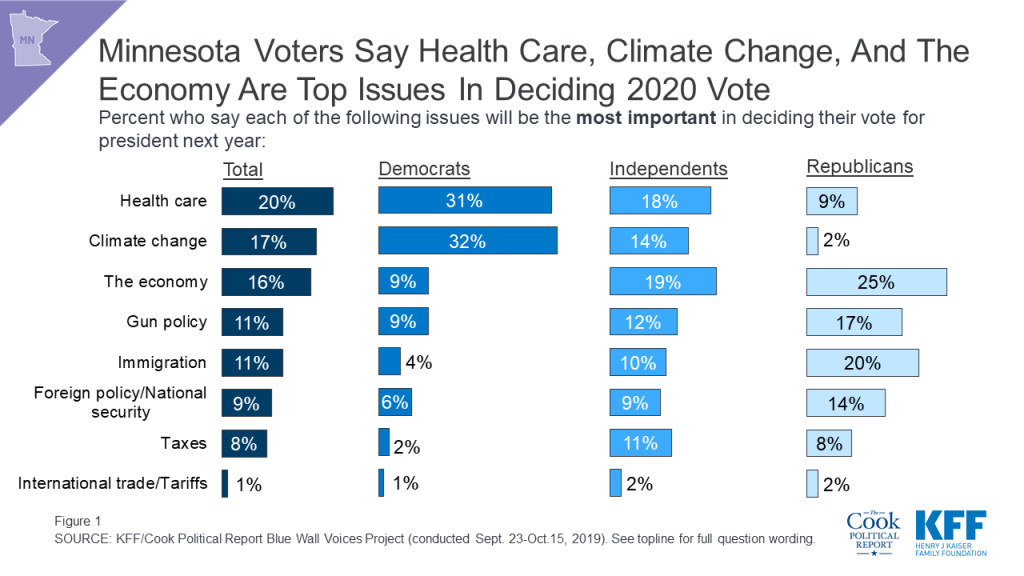
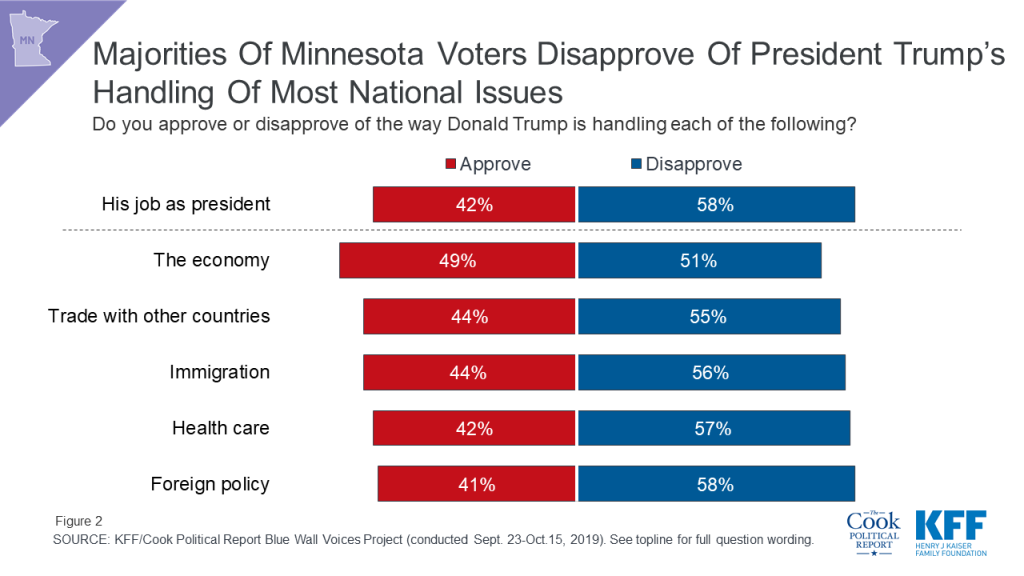
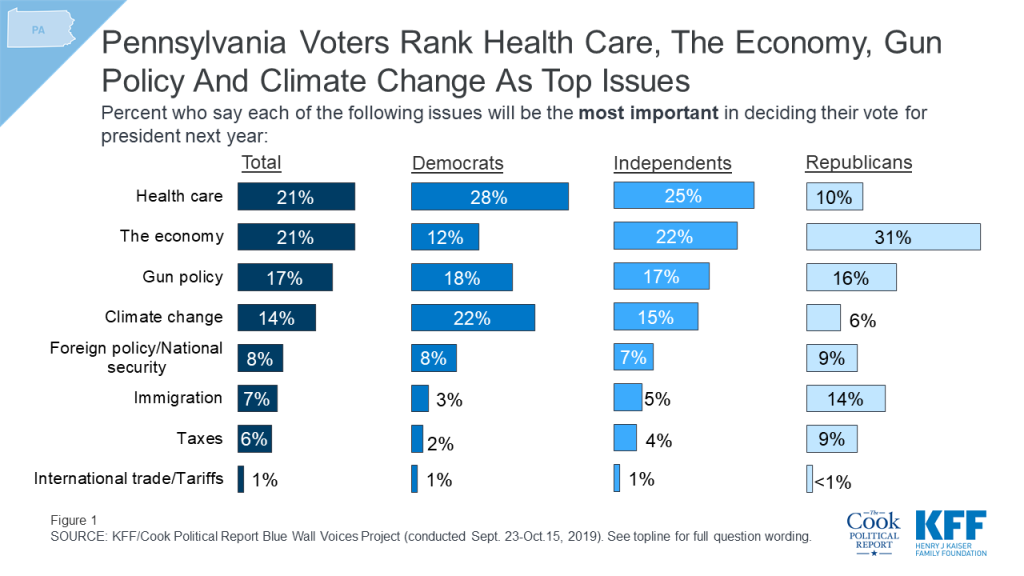
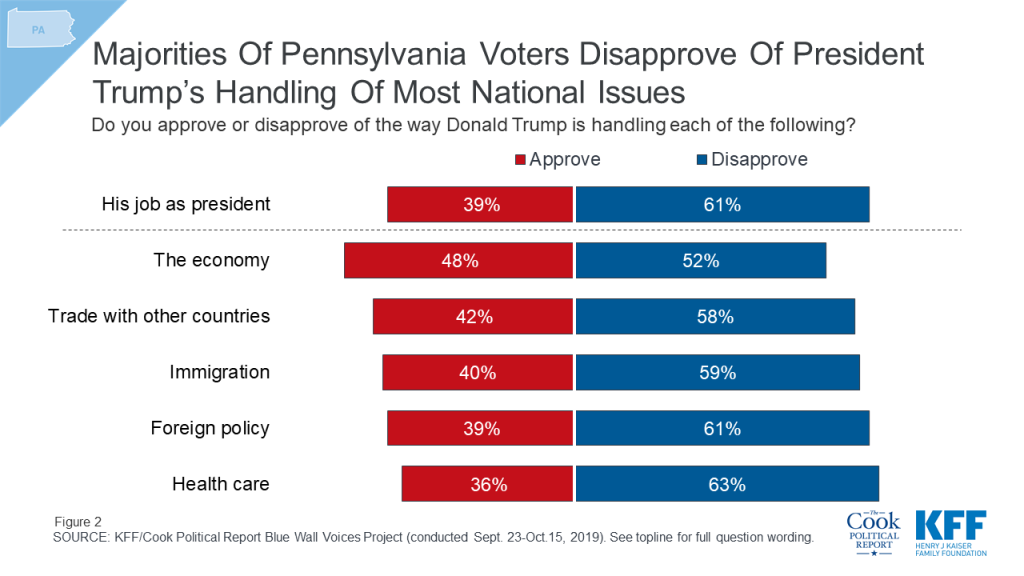
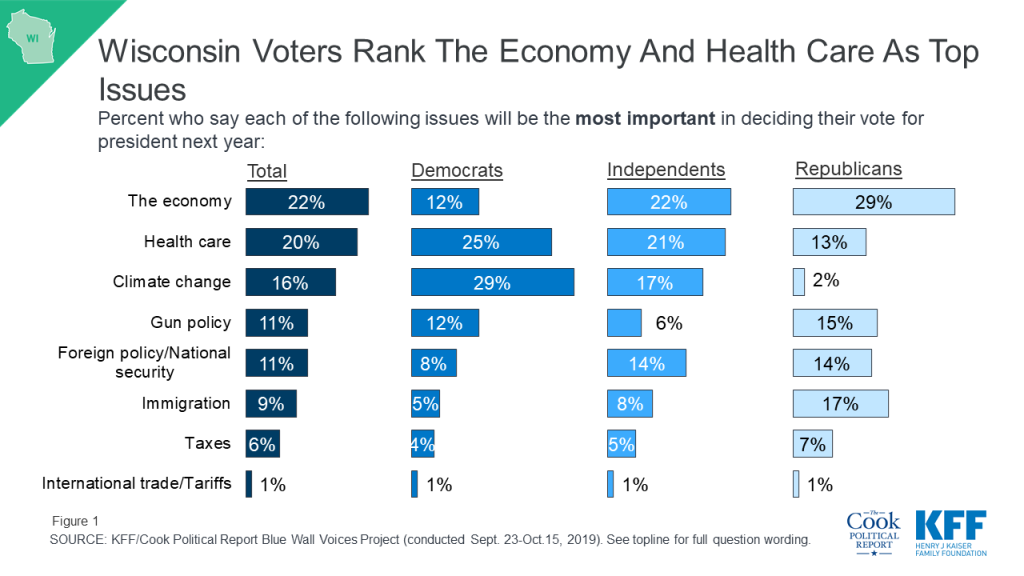
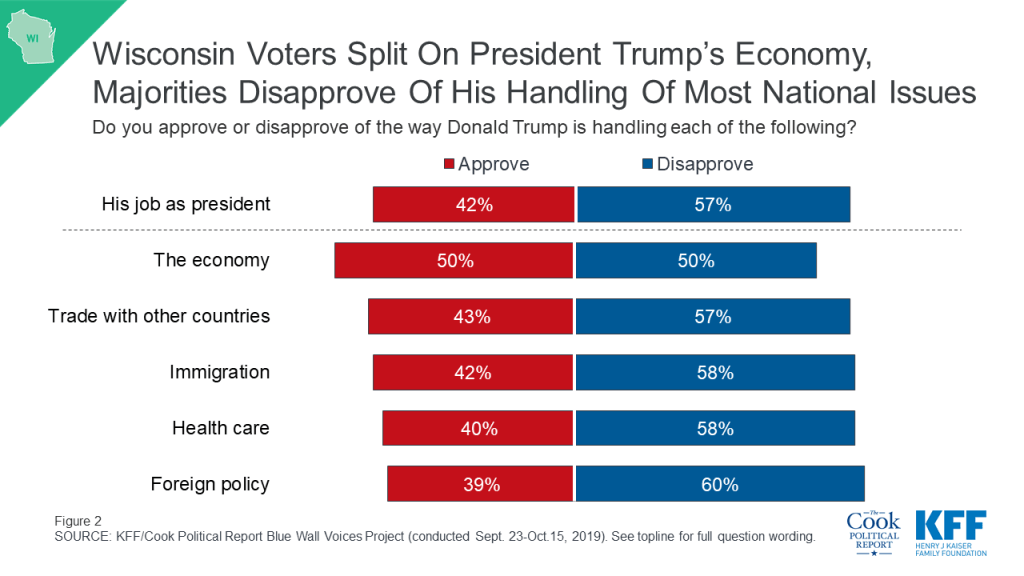
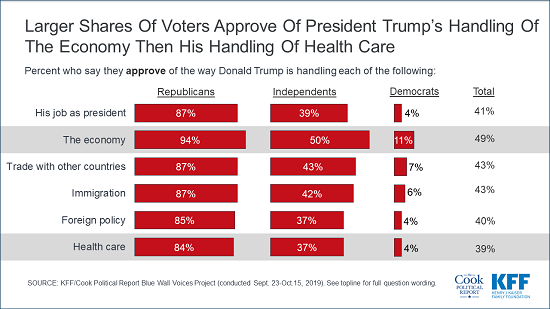
The 2020 election may be a lot about health care and the economy, two issues that voters judge President Trump’s actions on very differently. Health care and the economy are the top issues for voters leading up to the 2020 presidential election but they are also two issues on which voters give President Trump very different marks. Overall, voters are somewhat positive in their views of how President Trump is handling the economy (-1 percentage points net approval) while a larger share of voters “disapprove” than “approve” of the way President Trump is handling health care (-21 percentage points net approval). Health care is one of the only issues in which President Trump’s approval is lower than his overall job approval (-18 percentage points). President Trump also has low approval ratings (-20 percentage points) on the way he is handling foreign policy– an issue of increasing importance among voters in these states.
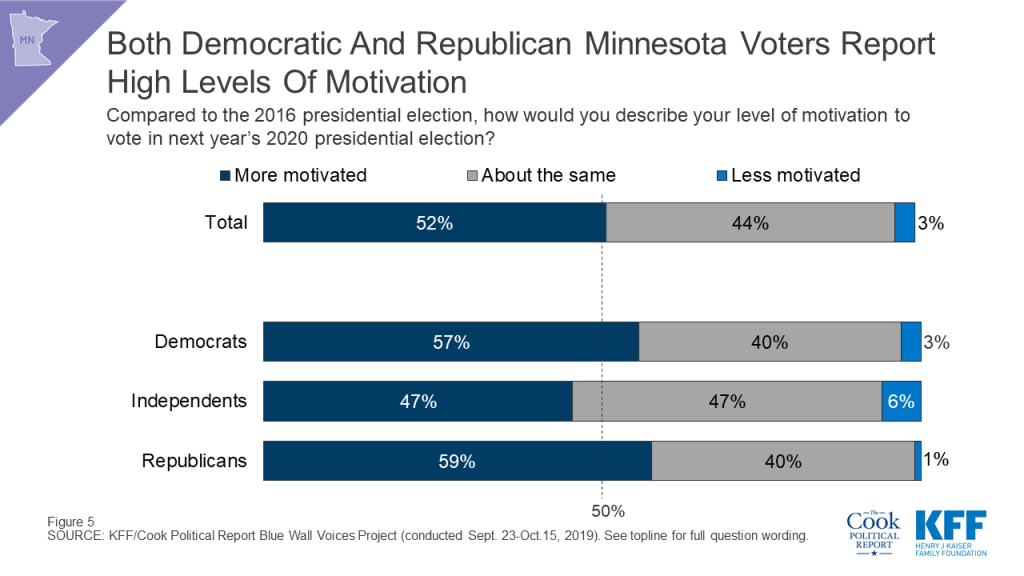
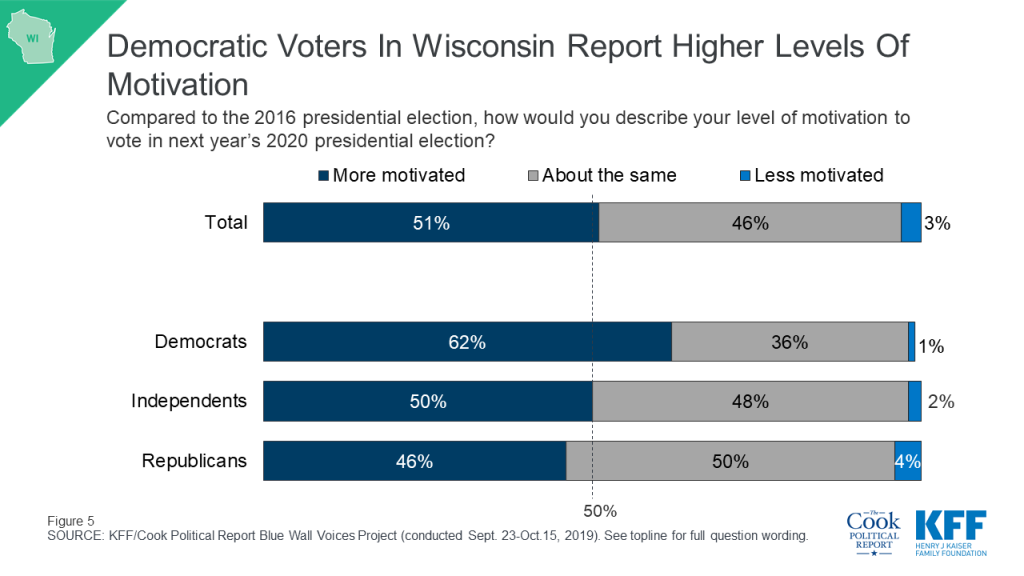
Democrats have a slight edge in enthusiasm in three of the four states heading into the 2020 presidential election. Over six in ten Democratic voters in Pennsylvania (66%), Michigan (65%), and Wisconsin (62%) say they are more motivated to vote in next year’s 2020 presidential election than they were in 2016. This is at least 10 percentage points higher than the share of Republican voters in each state saying the same (54% in Pennsylvania, 53% in Michigan, and 46% in Wisconsin). Republican voters in Minnesota are as motivated as their Democratic counterparts. To see more on Republican voters in Minnesota, check out the Minnesota-specific report.
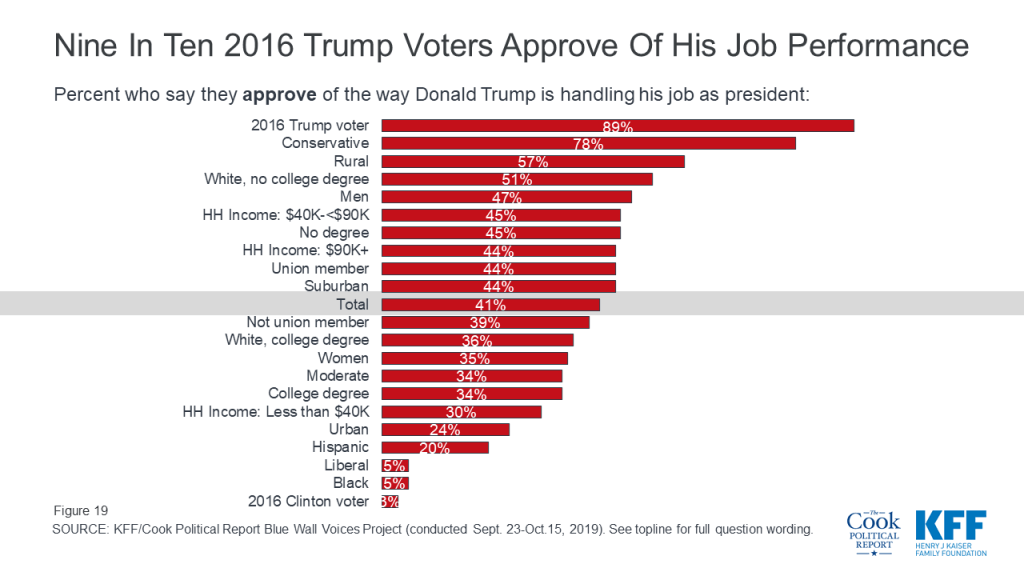
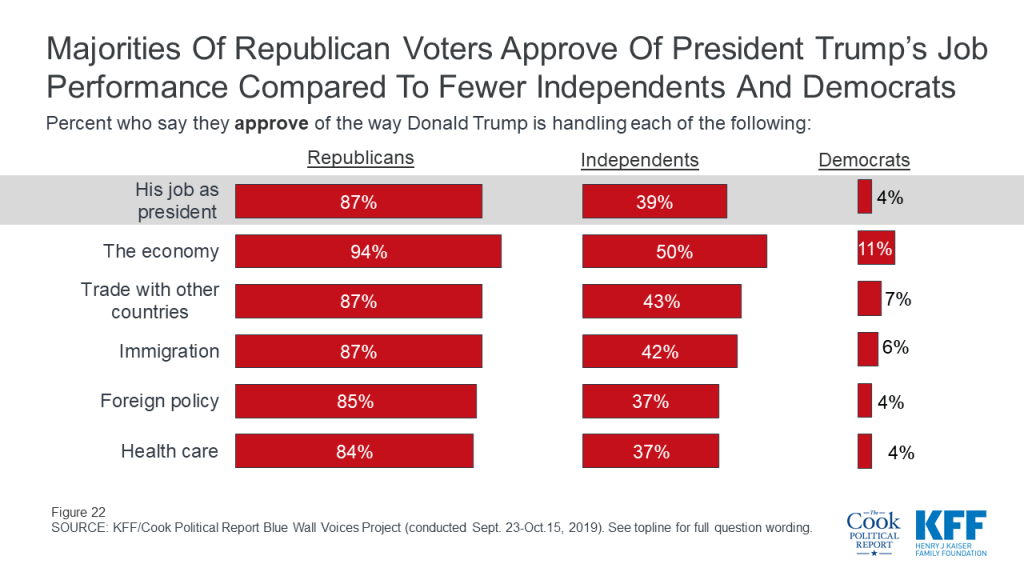
President Trump still has solid support among his base in this region. Most Republican voters approve of the way Donald Trump is handling his job as president and large majorities approve of his approach on key national issues including more than nine in ten who approve of the way he is handling the nation’s economy. Most Republican and Republican-leaning voters (73%) also say they want President Trump to be the Republican Party’s nominee for the 2020 election while small shares of Trump voters (28%) can imagine a scenario in which he enacts a policy, or fails to enact a policy, that would result in them changing their vote choice.
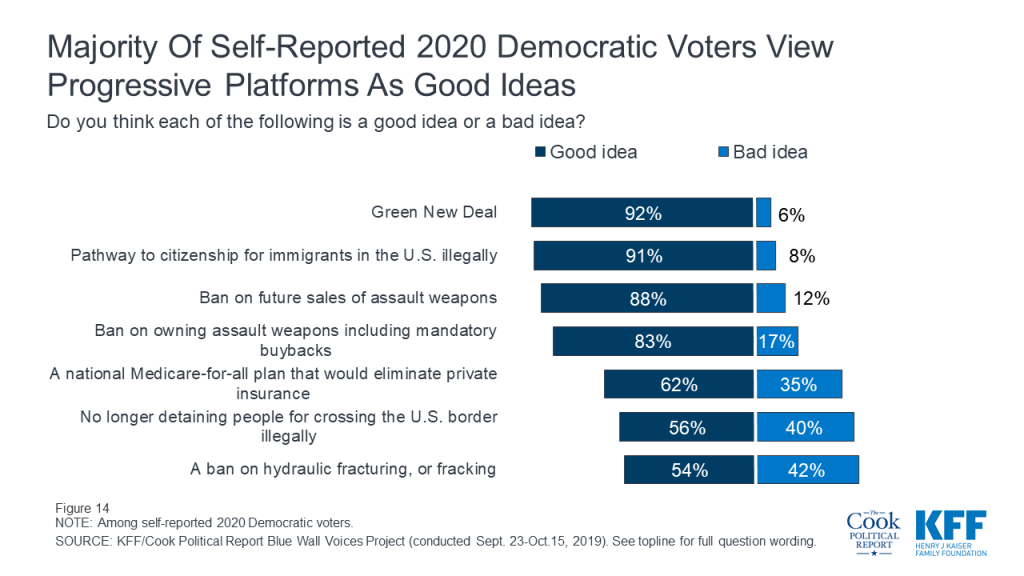
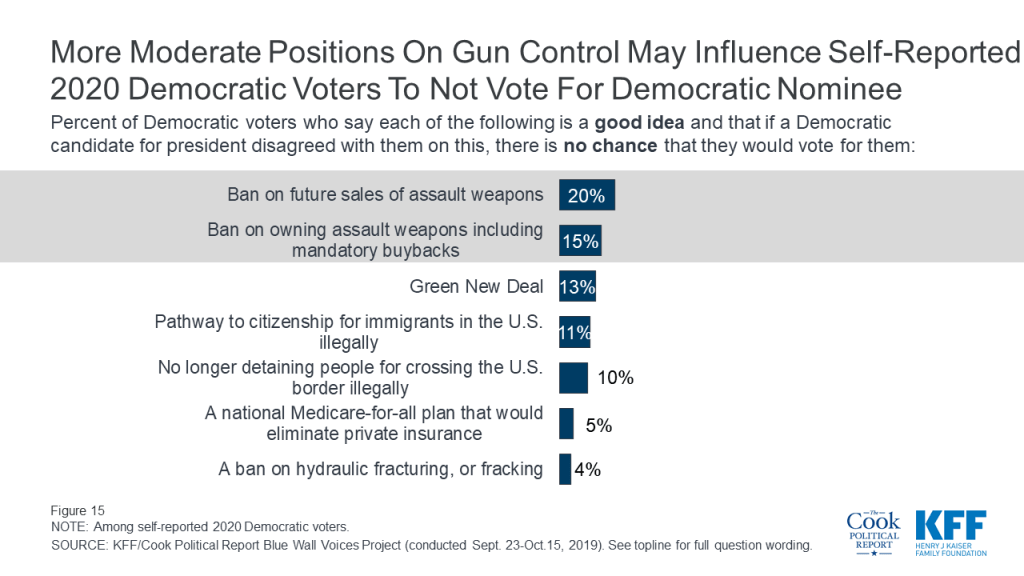
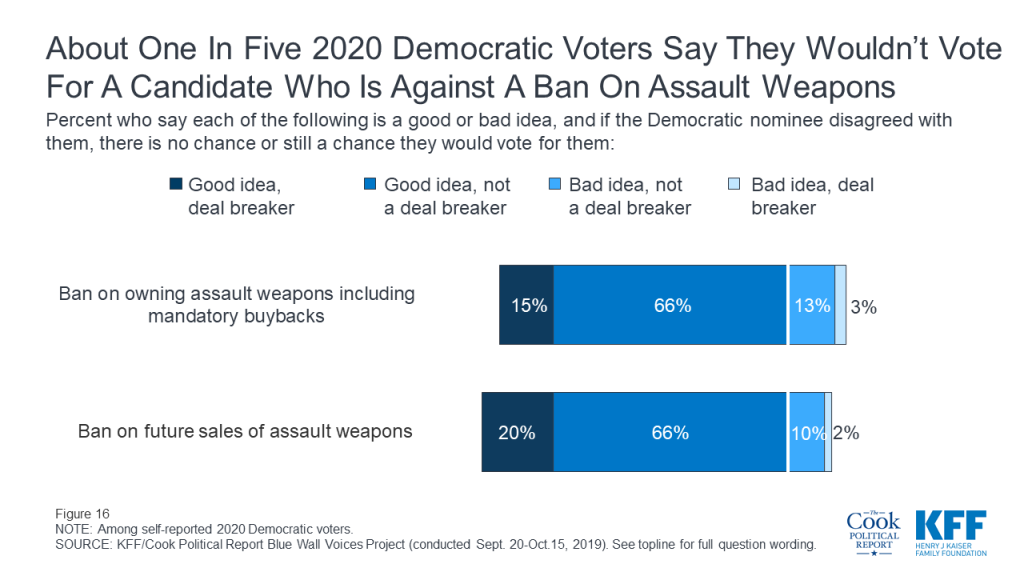
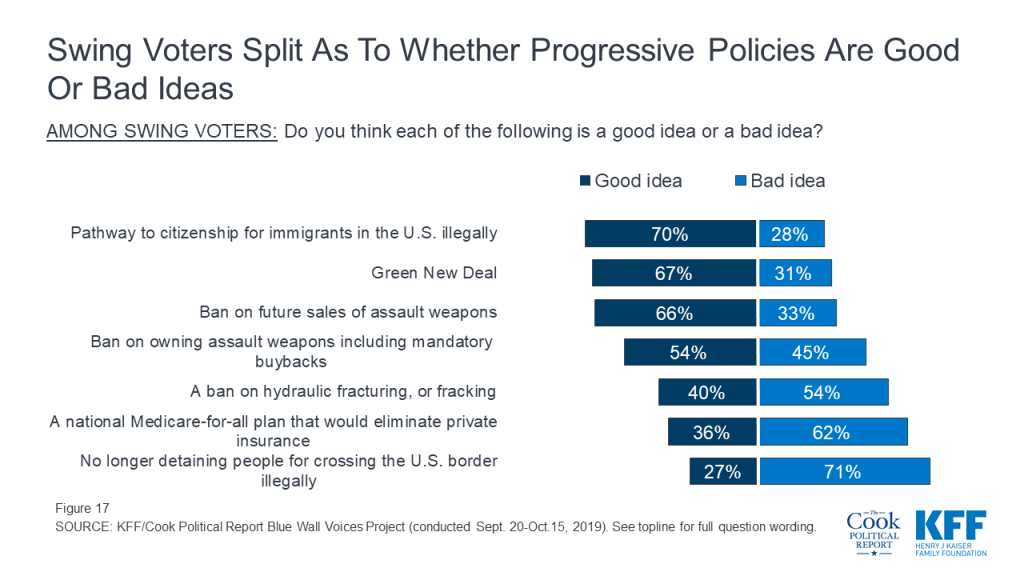
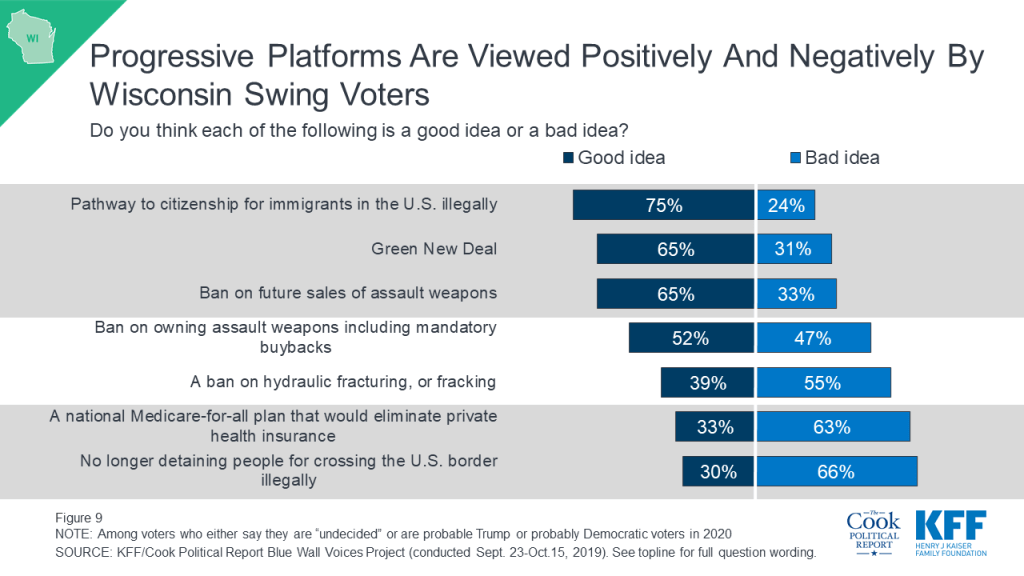
Few Democratic voters see progressive positions as deal breakers in their 2020 vote. The Blue Wall Voices Project also sought to find out whether the progressive positions being discussed by the Democratic nominees for president on the campaign trail are deal breaker issues for voters. Overall, a majority of voters in the Blue Wall who plan to vote for the Democratic nominee view the progressive platforms asked about in this survey as “good ideas,” including majorities of voters in each of the four states. None of these issues are deal breakers, with most voters saying that if a candidate disagrees with them on this issue then there would still be a chance that they would vote for them.
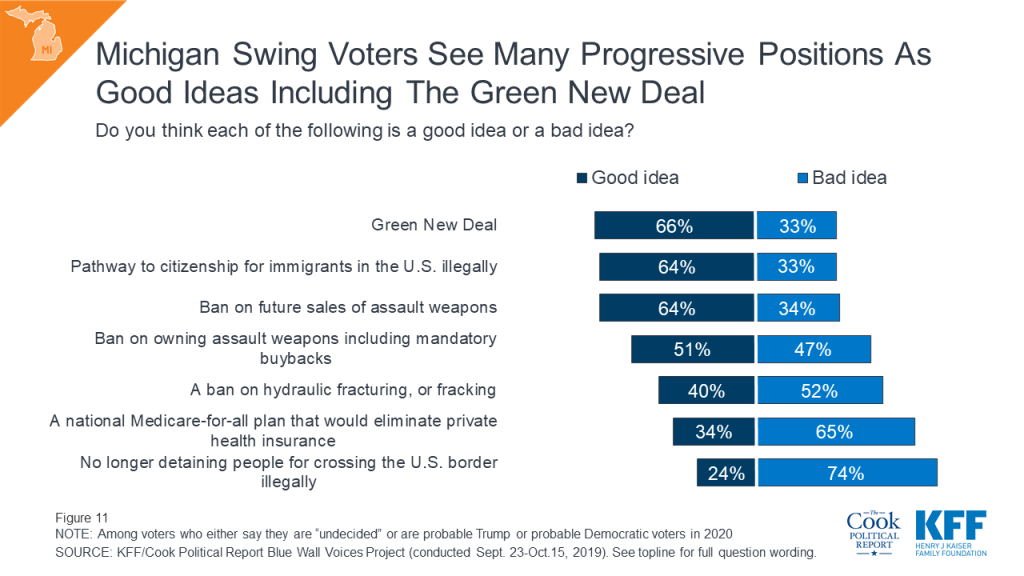
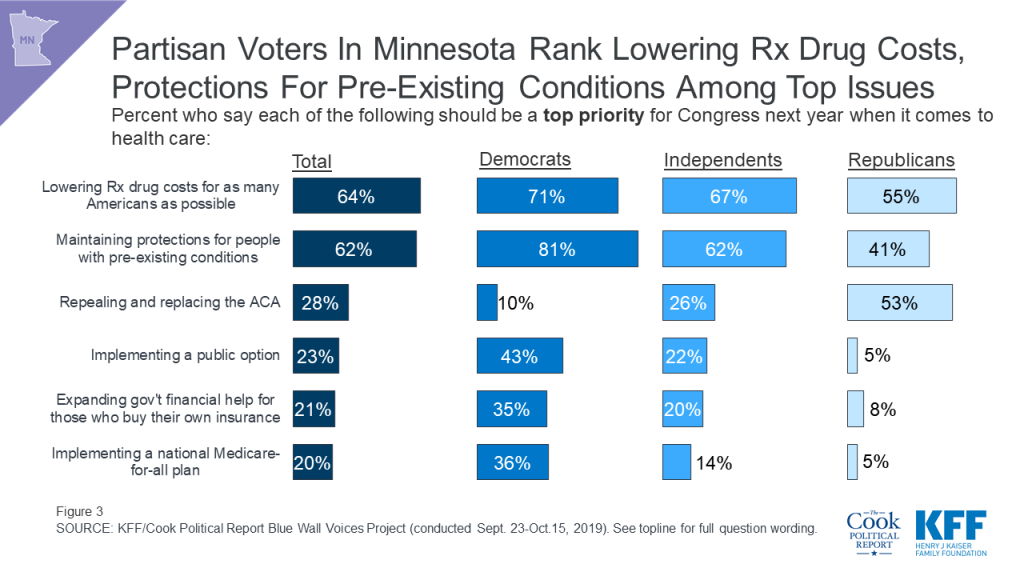
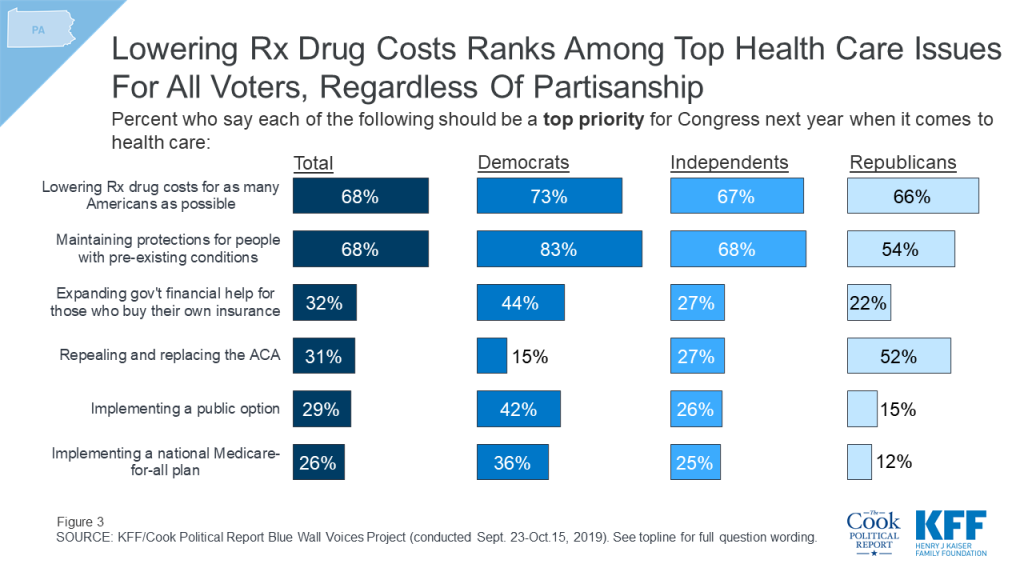
Most swing voters in these states see bans on fracking, stopping detainments at the U.S. border, and Medicare-for-all as bad ideas. The poll also consistently finds that while Medicare-for-all has played a significant role in the 2020 Democratic primary debates, it is not the top health care issue for Democratic voters. Large shares of swing voters in Michigan, Minnesota, Pennsylvania, and Wisconsin say stopping detainments at the U.S. border for people cross into the country illegally and a national Medicare-for-all plan are “bad ideas.” Swing voters are slightly more divided in their views of a ban on fracking with large shares of Pennsylvania and Wisconsin swing voters saying such a ban is a “bad idea” as do a slim majority in Michigan and half of Minnesota swing voters.
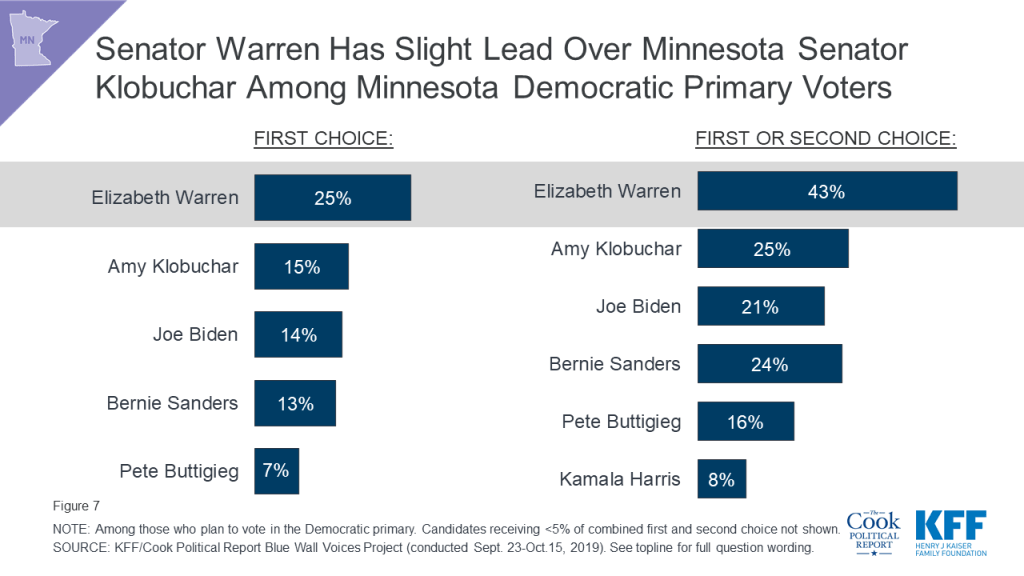
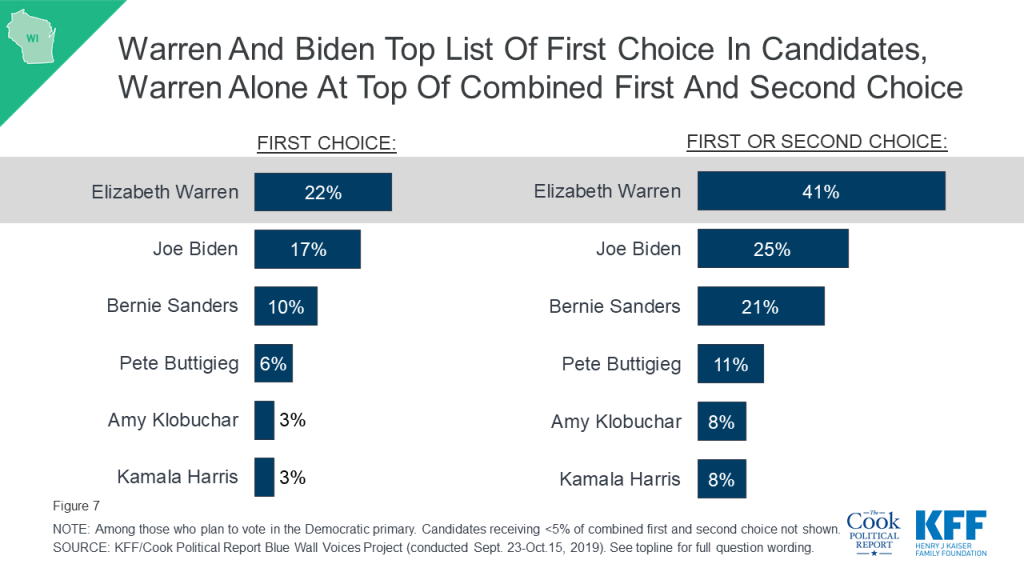
As the Democratic presidential primary heats up, this poll finds Senator Elizabeth Warren and Vice President Joe Biden as the front-runners among Democratic primary voters in the Blue Wall region. One-fourth of Democratic primary voters in Michigan and Minnesota say they plan to support Sen. Warren during the Democratic primary as do 22% of Wisconsin Democratic primary voters. Former Vice President Joe Biden garners 27% of support from Pennsylvania Democratic primary voters. Minnesota Senator Amy Klobuchar also garners support from 15% of Minnesota Democratic primary voters.
The Role Of Swing Voters In The Blue Wall
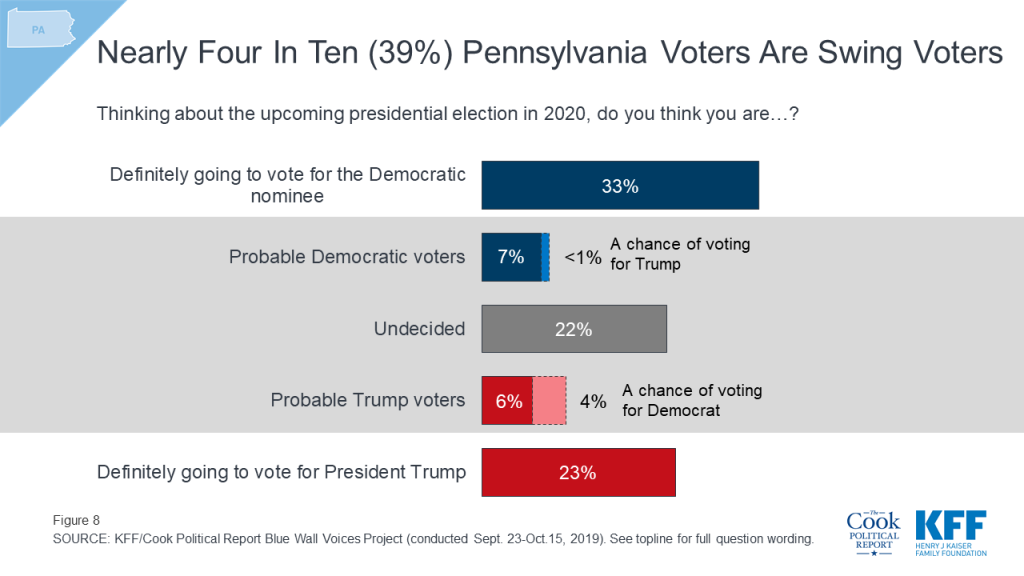
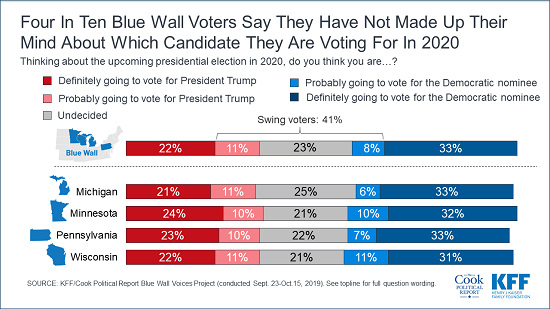
More than half of voters in Michigan, Minnesota, Pennsylvania, and Wisconsin say they have already made up their minds about which candidate they plan to vote for. One-third of voters say they are “definitely going to vote for the Democratic nominee” while one-fifth (22%) say they are “definitely going to vote for President Trump.” The share who say they are “definitely going to vote for President Trump” in these states is slightly lower than the share of voters nationally who reported the same in our national KFF Health Tracking Poll analysis earlier this year. It is important to note that while there are currently a larger share of voters in each state who say they are “definitely going to vote for the Democratic nominee” than “definitely going to vote for President Trump,” it is unclear how this could change once the Democrats choose a nominee and President Trump and other Republicans start attacking a single candidate rather than the entire field of candidates.
This leaves four in ten voters (41%) as the crucial voting block known throughout this report as “swing voters.” This group of voters either say they are “probably going to vote for President Trump” (11%), “probably going to vote for the Democratic nominee” (8%), or say they are “undecided” about how they will vote (23%).
Figure 1: Four In Ten Blue Wall Voters Say They Have Not Made Up Their Mind About Which Candidate They Are Voting For In 2020
There are not significant differences across the states, with similar shares of voters in Michigan (43%), Minnesota (41%), Pennsylvania (39%), and Wisconsin (43%) saying they are either “probably” going to vote for a candidate or are “undecided.”
It is important to note that not all “swing voters” could potentially change their vote to support the other party’s candidate. While nearly half of those who say they are probably going to vote for President Trump say there is “a chance” they will vote for the Democratic nominee (4% of all voters), on the other side of the ballot almost none of those who say they are probably going to vote for the Democratic nominee say that there is “a chance” they will vote for President Trump (less than 1%).
Figure 2: Four In Ten Blue Wall Voters Say They Have Not Made Up Their Mind About Which Candidate They Are Voting For In 2020
This is similar to what we found in our national analysis earlier this year, with few voters who say they are probably going to vote for either President Trump or the Democratic nominee saying there is “a chance” they will vote for the other party’s candidate. This is also similar across the four states included in this analysis with few voters saying there is “a chance” they would vote for the other party’s candidate.
A majority of Democratic voters and Republican voters in each state say they aren’t going to cast a vote for the other party’s candidate. About seven in ten (72%) Democratic and Democratic-leaning independent voters in Michigan say they are definitely going to vote for the Democratic nominee as do two-thirds of Democratic voters in Minnesota (68%), Wisconsin (66%), and Pennsylvania (65%).
Figure 3: Majorities Of Democratic Voters Report That They Will Be Faithful To Party In 2020 Vote Choice
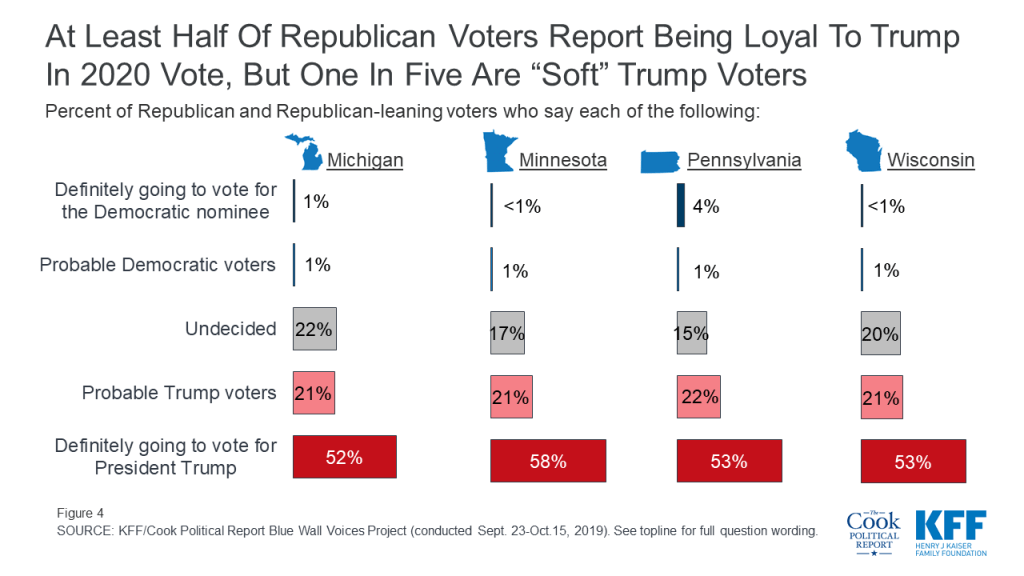
A smaller share, but still a majority, of Republican and Republican-leaning independent voters say they are definitely going to vote for President Trump (58% in Minnesota, 53% in Wisconsin and Pennsylvania, and 52% in Michigan). Nearly twice as many Republican and Republican-leaning voters in Michigan and Wisconsin are undecided about their 2020 presidential vote choice as the Democratic counterparts in the states.1
Figure 4: At Least Half Of Republican Voters Report Being Loyal To Trump In 2020 Vote, But One In Five Are “Soft” Trump Voters
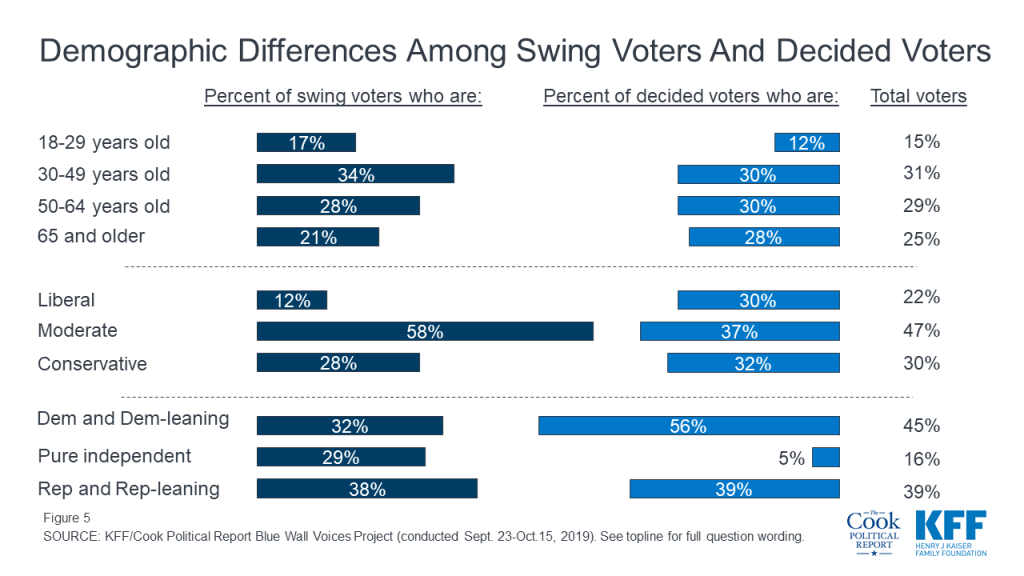
On most demographics, swing voters look very similar to their counterparts (voters who say they have already decided who they are going to vote for in the 2020 election), but they differ on three key variables: age, party identification, and ideology. Swing voters generally are more likely to say they are moderate in terms of their ideology (58%) and a larger share identify as political independents (29%) than their decided counterparts (5%). In addition, swing voters are slightly younger as a whole with about half (51%) under the age of 50 compared to 42% of decided voters.
Figure 5: Demographic Differences Among Swing Voters And Decided Voters
What Is Driving Voters?
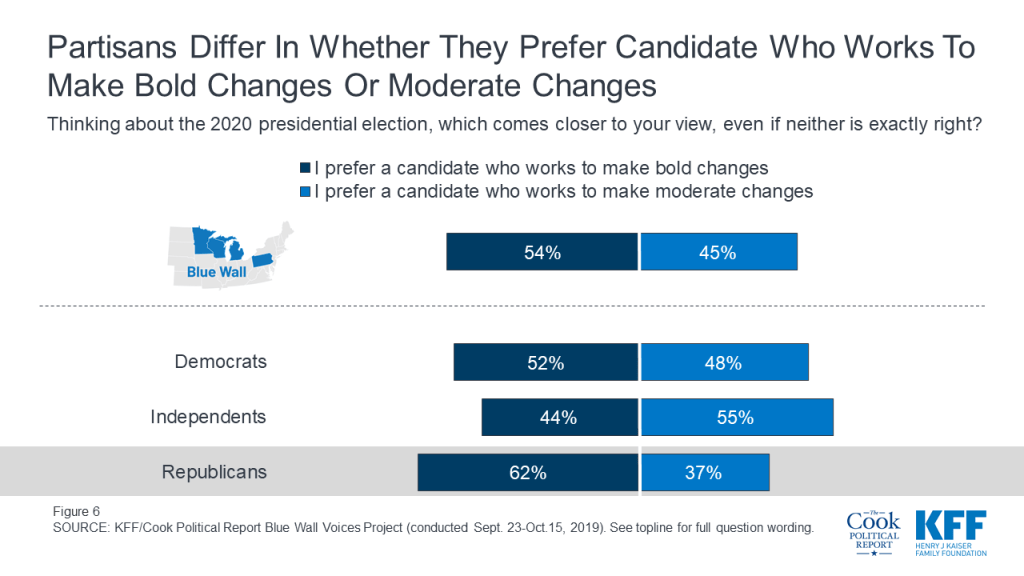
During the 2016 election, President Trump ran as an unconventional candidate who was going to work to implement bold changes in this country and deliver a shock to business as usual in Washington, D.C. One year out from the 2020 election, a slightly larger share of voters – including a majority of Republican voters – still prefer to vote for a candidate who wants to make bold changes rather than moderate changes. A slightly larger share of voters in Michigan, Minnesota, Pennsylvania, and Wisconsin say they prefer to vote for a candidate in 2020 who wants to make bold changes (54%) rather than a candidate who works to make moderate changes (45%).
Six in ten Republican voters (62%) say they prefer a candidate who works to make bold changes rather than a candidate who works to make moderate changes (37%). Democratic voters are more divided on their preference with half (52%) preferring a candidate who works to make bold changes and a similar share preferring a candidate who works to make moderate changes (48%). A majority of independent voters (55%) prefer a candidate who works to make moderate changes.
Figure 6: Partisans Differ In Whether They Prefer Candidate Who Works To Make Bold Changes Or Moderate Changes
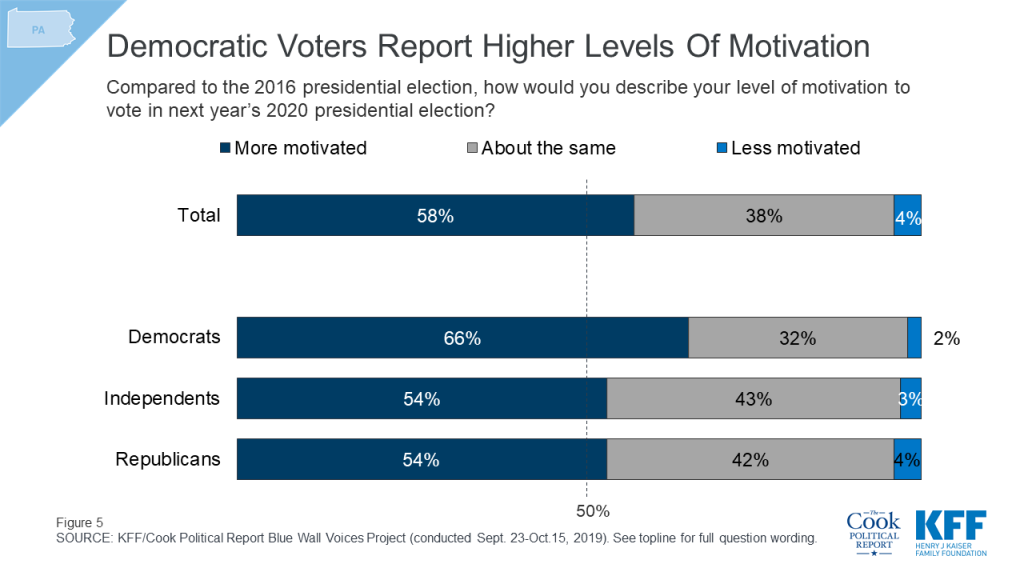
Democratic voters appear to have the edge in motivation one year out from the 2020 general election with a larger share of Democratic voters (64%) saying they are “more motivated” about voting in next year’s presidential election than either independent voters (55%) and Republican voters (53%).
Figure 7: Democratic Voters Report Higher Levels Of Motivation
About two-thirds of Democratic voters in Pennsylvania (66%) and Michigan (65%) and six in ten Democratic voters in Wisconsin (62%) say they are “more motivated” to vote in next year’s election. This is compared to less than half of Republican voters in Wisconsin (46%) and slightly more than half of Republican voters in Pennsylvania (54%) Michigan (53%) who say they are more motivated to vote than in the previous presidential election. Partisan voters in Minnesota are both “more motivated” to vote in next year’s election. To see more on this, check out the individual state reports.
Table 1: The Democratic Party has the Enthusiasm Edge in Michigan, Pennsylvania, and Wisconsin
Percent who say they are more motivated to vote in next year’s election than in the 2016 election:
Michigan
Minnesota
Pennsylvania
Wisconsin
Total
55%
52%
58%
51%
Democratic voters
65
57
66
62
Independent voters
61
47
54
50
Republican voters
53
59
54
46
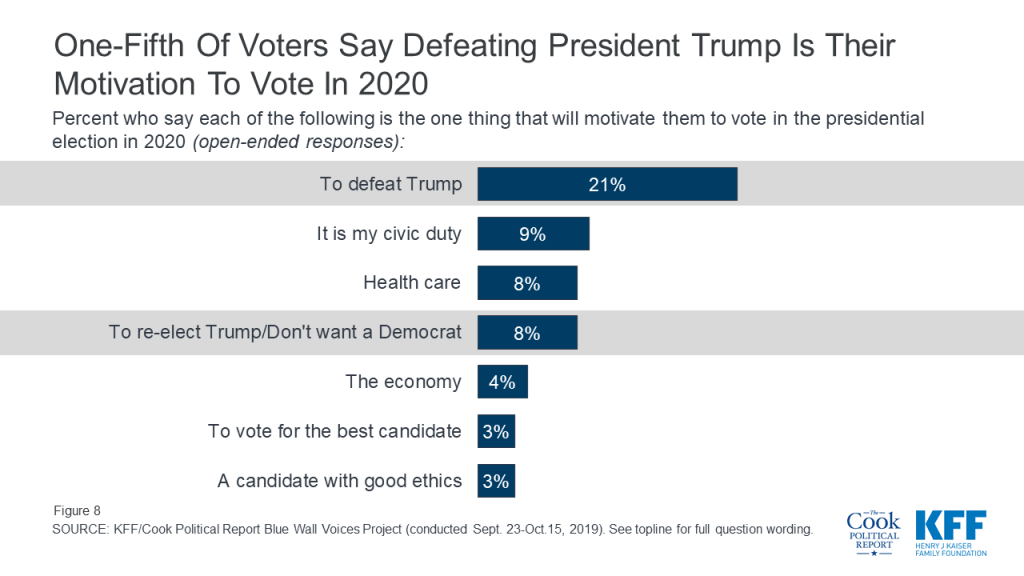
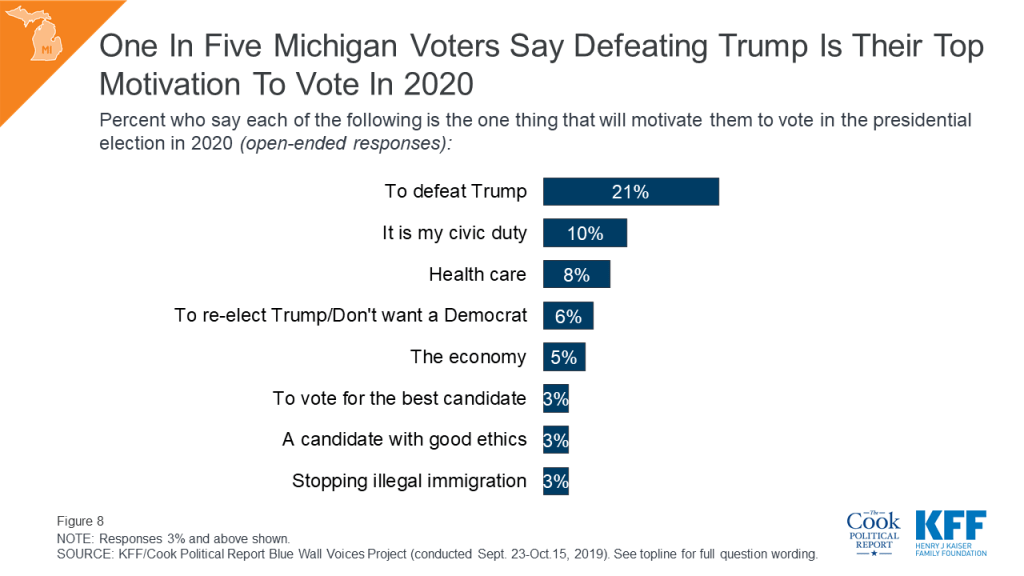
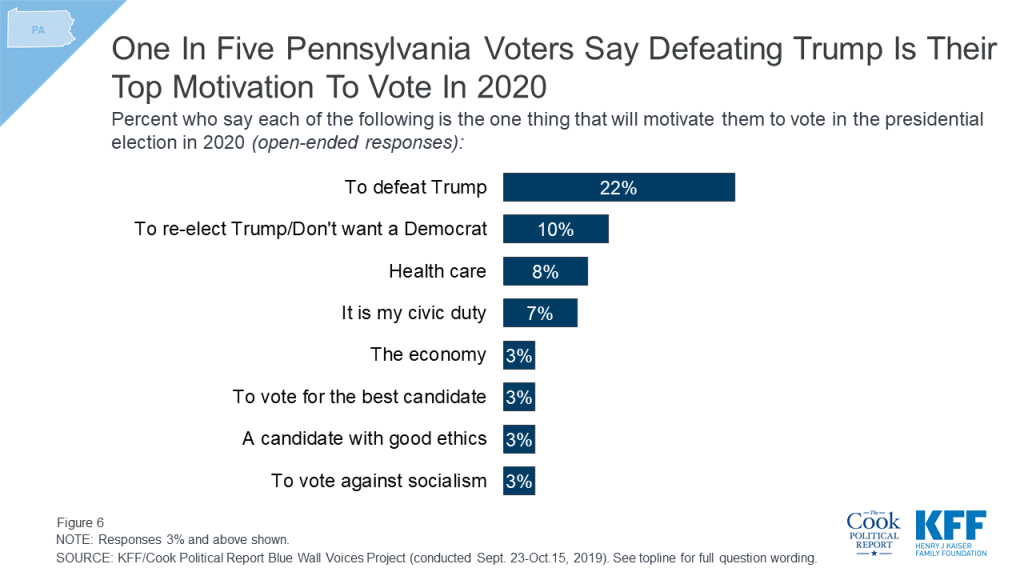
When asked to offer in their own words what one thing will motivate them to vote in the 2020 presidential election, one-fifth of all Blue Wall voters offer responses related to defeating President Trump (21%). This is followed by those who say voting is their civic duty (9%), health care (8%), re-electing President Trump or not wanting to elect a Democrat (8%), and the economy (4%) is their top motivation. Overall, one-fourth (23%) of voters offer issues such as health care, the economy, and immigration, as their motivation for voting in the 2020 presidential election.
Figure 8: One-Fifth Of Voters Say Defeating President Trump Is Their Motivation To Vote In 2020
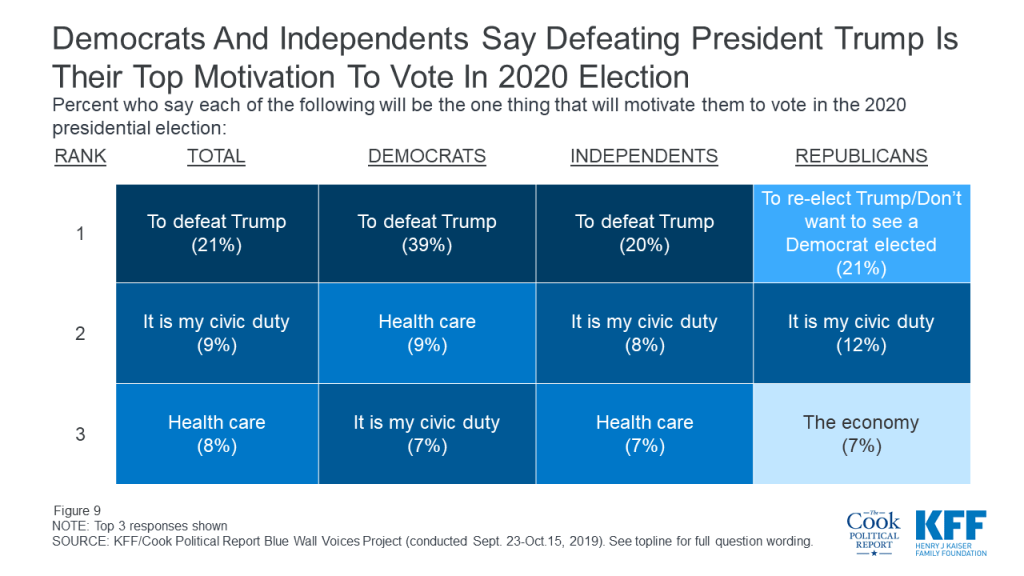
Defeating President Trump is offered as the top motivation to vote in 2020 by four in ten Democratic voters (39%) and one-fifth of independent voters, while responses related to re-electing President Trump or not wanting to elect a Democrat was offered by 21% of Republican voters – followed by those who say that their civic duty is their top motivation to vote in 2020 (12%).
Figure 9: Democrats And Independents Say Defeating President Trump Is Their Top Motivation To Vote In 2020 Election
Republican Voters And President Trump
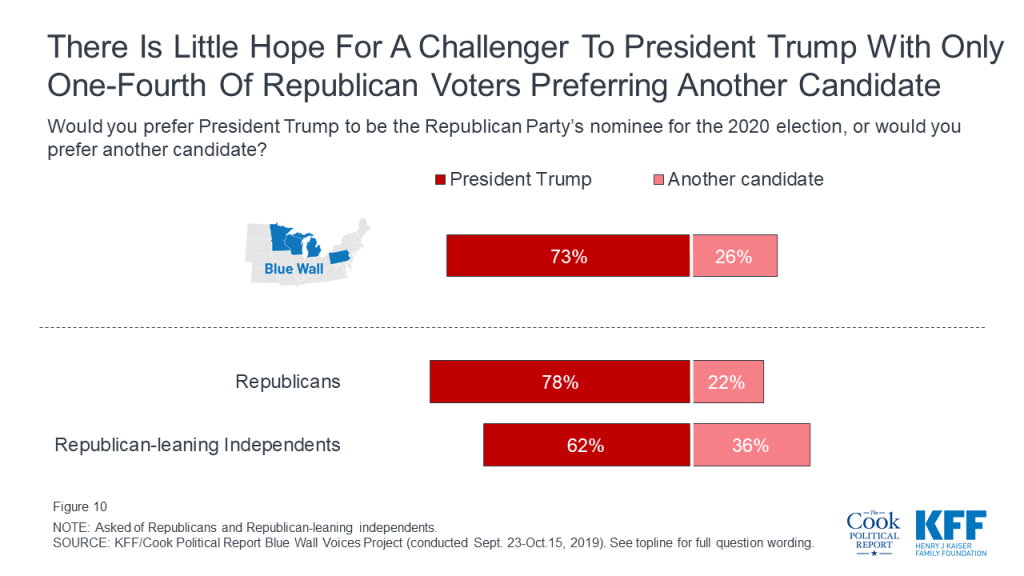
Most Republican and Republican-leaning independent voters (73%) also say they prefer President Trump to be the Republican Party’s nominee for the 2020 election with about one-fourth (26%) saying they prefer another candidate to be the Republican Party’s nominee. Those who self-identify as Republicans are more tied to President Trump with nearly eight in ten (78%) saying they prefer President Trump be the nominee compared to about six in ten (62%) independents who lean Republican in their views.
Figure 10: There Is Little Hope For A Challenger To President Trump With Only One-Fourth Of Republican Voters Preferring Another Candidate
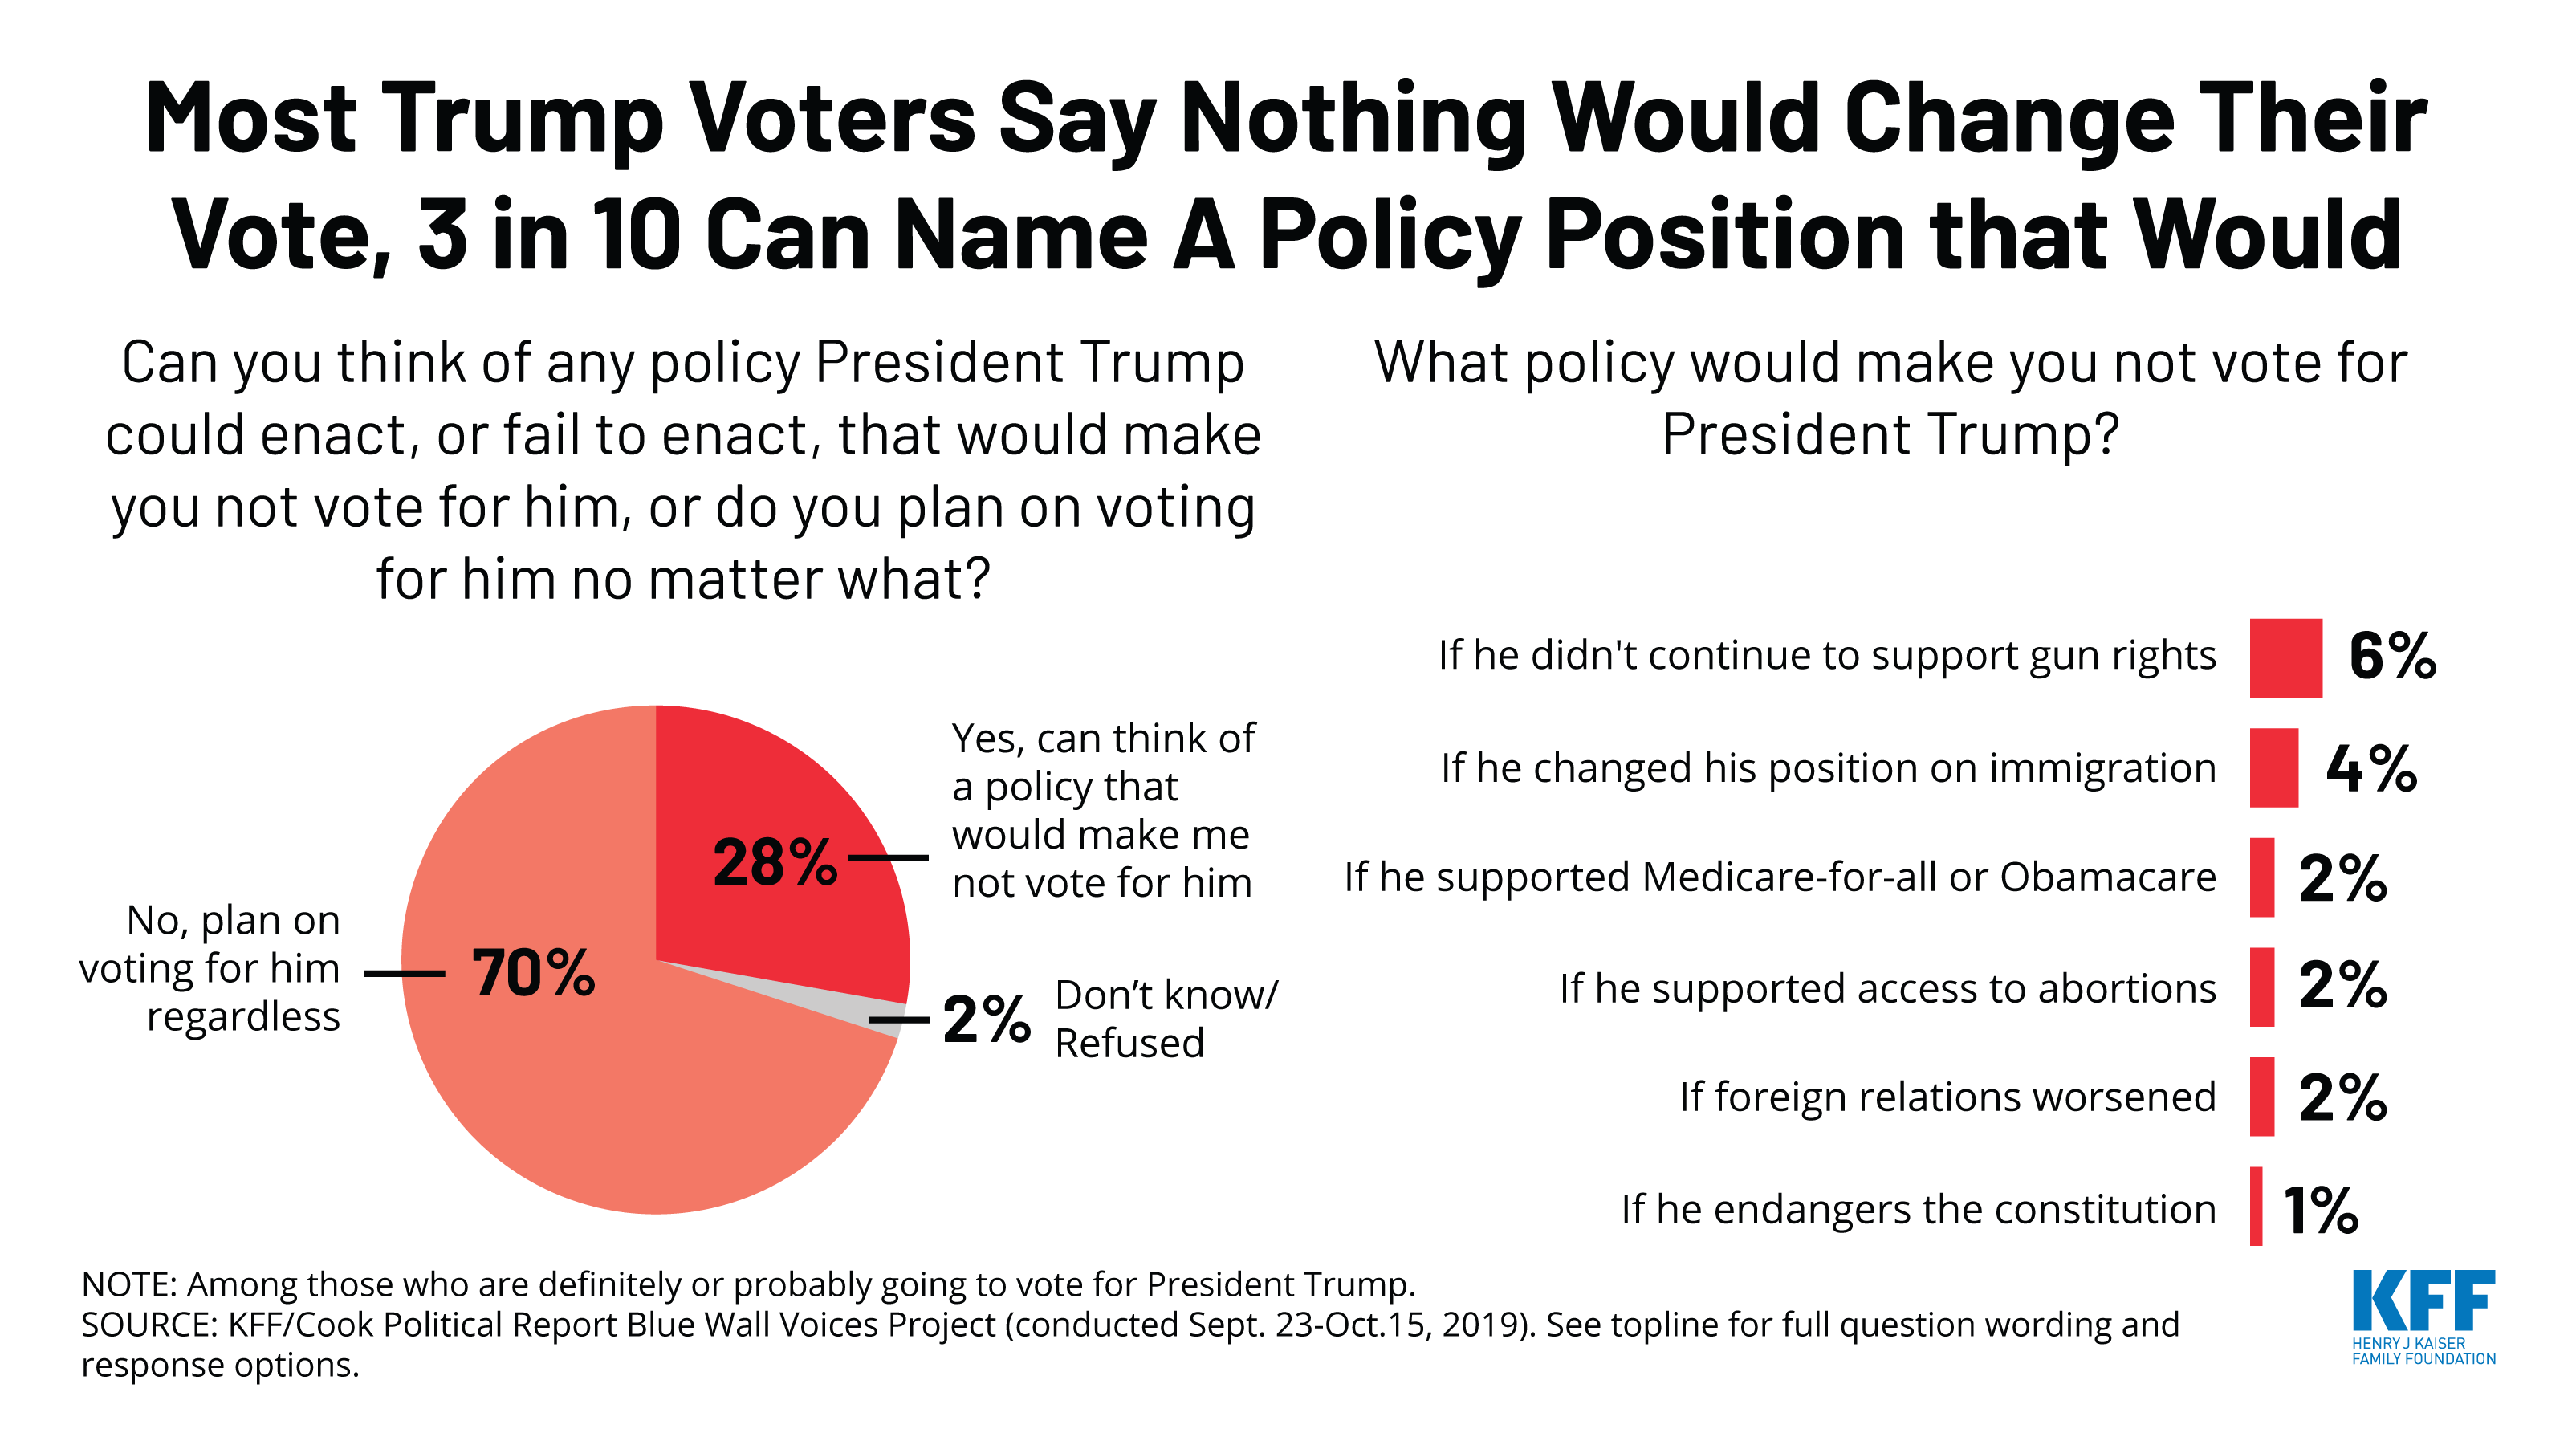
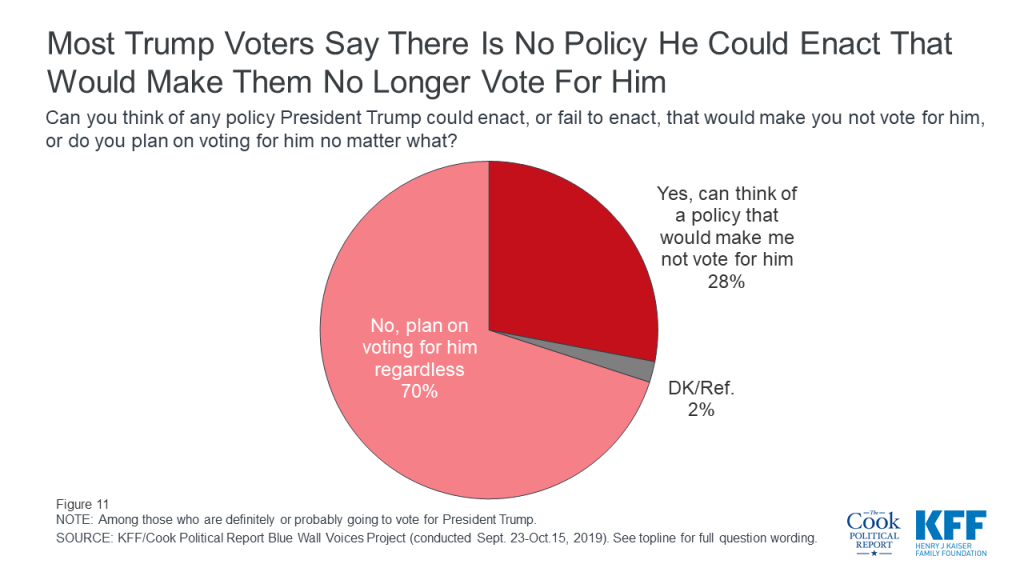
Most voters who say they are going to vote for President Trump in 2020 do not see a scenario in which he would no longer have their vote. Seven in ten Trump voters say there is not a policy he could enact or fail to enact that would make them no longer vote for him while three in ten (28%) say they can think of a scenario that would make them no longer vote for President Trump.
Figure 11: Most Trump Voters Say There Is No Policy He Could Enact That Would Make Them No Longer Vote For Him
When asked to offer in their own words what policy President Trump could enact, or fail to enact, that would make them no longer vote for him, one-fifth (6% of all 2020 Trump voters) say that if he no longer continued to support gun rights they would no longer vote for him. This is followed by one in six (4% of all 2020 Trump voters) who offered that if he changed his position on immigration, they would no longer vote for him. Other issues that were offered include supporting Medicare-for-all (2%), supporting access to abortions (2%), or if foreign relations worsened (2%). Few Trump voters said they would not vote for President Trump if he endangered the constitution (1%).2
Democratic Voters And The 2020 Democratic Primary
Democratic voters in the Blue Wall are divided in what is most important to them when selecting a candidate for president. Four in ten voters (42%) say it is more important that the Democrats select a candidate who “has the best chance to defeat President Trump” while a similar share (40%) say it is more important to select a candidate who “comes closest to their views on the issues.” Fewer (13%) voters say it is more important to select a candidate who “is the most authentic” and even fewer (4%) say it is most important to select a candidate who “can most disrupt the current system.”
Figure 12: Democratic Voters Evenly Divided On If It Is More Important For Nominee To Share Their Views Or Be Able To Defeat President Trump
A larger share of Democratic and Democratic-leaning independent voters in Minnesota say it is more important that the eventual nominee be able to defeat President Trump (48%) than come closest to their views on the issues (33%).
Table 2: Minnesota Democratic Voters Prioritize Defeating President Trump
In selecting a presidential nominee for the Democratic Party, which of the following is most important to you?
Total
Michigan
Minnesota
Pennsylvania
Wisconsin
Has the best chance to defeat President Trump
42%
42%
48%
40%
39%
Comes closest to your views on the issues
40
45
33
38
42
Is the most authentic
13
11
16
13
17
Can most disrupt the current system
4
2
3
7
2
NOTE: Among Democratic and Democratic-leaning independents.
Yet, despite this, significant shares of Democratic voters in each of the states say they do not plan to vote in the Democratic primary in their state and instead plan to wait to vote until the 2020 general election. One-third of Democratic and Democratic-leaning voters in Minnesota say they plan to wait to vote until the 2020 general election as do one-fourth of Democratic voters in Michigan, one-fifth of Democratic voters in Wisconsin, and 17% of Democratic voters in Pennsylvania.
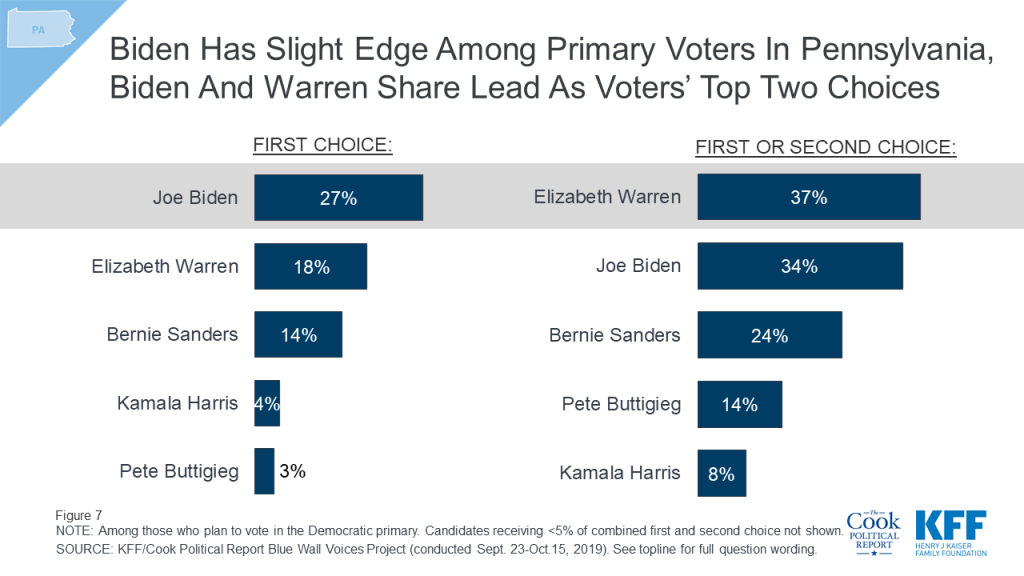
Senator Warren and Vice President Biden Top List Of Democratic Primary Candidates
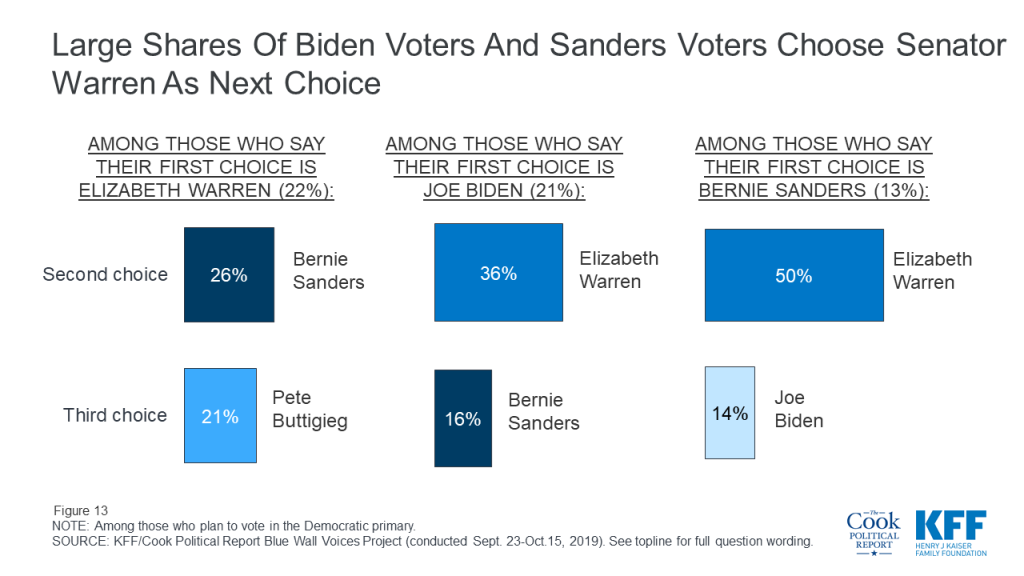
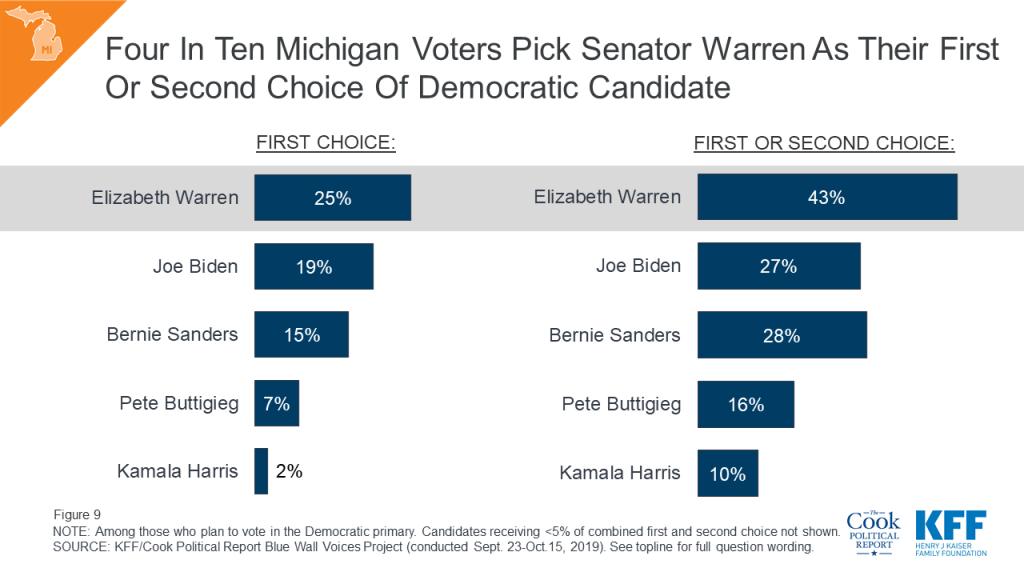
Among those primary election voters, Senator Elizabeth Warren and former Vice President Joe Biden have the edge over the other major Democratic presidential candidates. One-fifth of Democratic primary voters say Sen. Warren (22%) is the candidate they plan to support which is similar to the share who say Vice President Biden is the candidate they plan to support (21%). While Senator Warren and Vice President Biden garner similar shares of top choice votes among Democratic primary voters across the Blue Wall, four in ten Democratic primary voters choose Sen. Warren as either their first or second choice in the Democratic primary. This is followed by 29% who choose Vice President Biden, one-fourth who choose Sen. Sanders, and 14% who choose Mayor Pete Buttigieg. Most of the shift over to Sen. Warren is from Sen. Sanders supporters with half of Sen. Sanders supporters choosing Sen. Warren as their second choice of candidates. For more information about how voters in each of the states rank the candidates, check out the individual state reports.
Figure 13: Large Shares Of Biden Voters And Sanders Voters Choose Senator Warren As Next Choice
The 2020 Democratic candidates are garnering support from slightly different voting groups throughout Michigan, Minnesota, Pennsylvania, and Wisconsin. Across the four states, a larger share of voters who chose Senator Sanders as their first choice are men (50%) compared to those who chose Senator Warren (35%) or Vice President Biden (43%) as their first choice candidate. Sen. Sanders also has an edge among younger voters with eight in ten of his supporters under the age of 50. Sen. Warren’s supporters, on the other hand, are more likely to be women (65%), and have at least a college degree (65%) compared to less than half of Sen. Sanders’ supporters or Vice President Biden’s supporters. About one in five of Vice President Biden’s supporters are African-American compared to smaller shares of Sanders’ supporters (9%) or Warren’s (7%).
Are Progressive Platforms Deal Breakers For Voters?
The Blue Wall Voices Project also seeks to find out how voters view many of the progressive positions being discussed by some of the Democratic nominees for president. Overall, a majority of voters in the Blue Wall who say they are either “definitely” or “probably” going to vote for the Democratic nominee view the progressive platforms asked about in this survey as “good ideas.” This includes majorities of these self-reported likely 2020 Democratic voters in each of the four states.
Nine in ten self-reported 2020 Democratic voters (92%) say the Green New Deal, the plan to address climate change through new regulations and increases in government spending on green jobs and energy-efficient infrastructure is a “good idea.” This is closely followed by large majorities who say a pathway to citizenship for immigrants in the U.S. illegally (91%), a ban on the future sale of assault weapons (88%), and a ban on the ownership of assault weapons and military-style rifles like the AR-15 including a mandatory buyback program for current owners (83%) are “good ideas.” Fewer, but still a majority (62%), say a national health plan in which all Americans would get their health coverage through a single government plan, Medicare-for-all, is a “good idea.” Slightly more than half of self-reported 2020 Democratic voters say stopping U.S. detainments for people crossing the border illegally or a ban on fracking are “good ideas” (56% and 54%, respectively). These three issues rank at the bottom of progressive platforms for self-reported 2020 Democratic voters in each of the four states.
Figure 14: Majority Of Self-Reported 2020 Democratic Voters View Progressive Platforms As Good Ideas
Yet, none of these issues are “deal breakers” with small shares of voters saying there is no chance they would vote for a candidate who disagreed with them on the issue. The positions that solicit that largest share of voters saying there is “no chance” they would vote for them are if a candidate was against a ban on future sales of assault weapons (20%), against a ban on ownership of assault weapons (15%), or against the Green New Deal (13%).
Figure 15: More Moderate Positions On Gun Control May Influence Self-Reported 2020 Democratic Voters To Not Vote For Democratic Nominee
Few self-reported 2020 Democratic voters view any of the progressive ideas as deal breakers with less than 10% of Democratic voters saying the platforms are “bad ideas” and if a Democratic candidate disagreed with them on this, there is no chance they would vote for them.
Some 2020 Democratic voters see Conservative gun Control Stance As A Possible Deal breaker
Many likely 2020 Democratic voters see more moderate positions on assault weapon bans as possible deal breakers. One-fifth of self-reported 2020 Democratic voters say there is “no chance” they would vote for a candidate who was against a ban on the future sales of assault weapons and about one in eight (15%) 2020 Democratic voters say there is “no chance” they would vote for a Democratic nominee who was against a ban on owning assault weapons, including a mandatory buyback program.
Figure 16: About One In Five 2020 Democratic Voters Say They Wouldn’t Vote For A Candidate Who Is Against A Ban On Assault Weapons
Swing Voters And Progressive Platforms
Majorities of swing voters, a crucial voting block in 2020, view a pathway to citizenship for immigrants in this country illegally (70%), the Green New Deal (67%), a ban on the future sale of assault weapons (66%), and a ban on the ownership of assault weapons including a mandatory buyback program (54%) as good ideas. Yet, many of these voters see three progressive platforms as “bad ideas.” Majorities of these voters view a ban on fracking (54%), a national Medicare-for-all plan (62%), and stopping border detainments of people coming into the country illegally (71%) as bad ideas.
Figure 17: Swing Voters Split As To Whether Progressive Policies Are Good Or Bad Ideas
How National Issues May Influence 2020
Health care and the economy are the top issues for voters in these states leading up to the 2020 presidential election but they are also two issues on which voters give President Trump very different marks. Voters give President Trump a somewhat positive rating (-1 percentage points) on the way he is handling the economy while a larger share of voters disapprove than approve of the way President Trump is handling health care (-21 percentage points net approval). Health care is one of the only issues in which President Trump’s approval is lower than his overall job approval (-18 percentage points). This report also examines the role of other key issues in the 2020 election such as immigration and international trade.
President Trump Job Approval
President Trump’s approval in each of the states as well as the Blue Wall overall is similar to what we see in national polls with about four in ten voters (41%) in the Blue Wall saying they either “strongly approve” or “somewhat approve” of the way Donald Trump is handling his job as president, while six in ten (59%) disapprove. If we look at the strongest opinions, twice as many voters “strongly disapprove” of the job President Trump is doing than “strongly approve” (50% v. 25%). About half of voters in each of the four states strongly disapprove of the way Donald Trump is handling his job as president.
Figure 18: Half Of Blue Wall Voters Strongly Disapprove Of President Trump
Support for President Trump runs highest among his base including voters who voted for him in 2016 (89%), conservative voters (78%), and rural voters (57%).
Figure 19: Nine In Ten 2016 Trump Voters Approve Of His Job Performance
On the other hand, vast majorities of 2016 Clinton voters (97%) and liberal voters (95%) disapprove of his job performance. As do non-white voters across education groups, urban voters, voters earning less than $40,000 annually, moderate voters, and many more.
Figure 20: President Trump Has High Disapproval Among Many Key Voting Groups
Voters in the Blue Wall states rank President Trump’s job performance most positively on the economy with about half of voters (49%) approving of the way Donald Trump is handling the economy. About four in ten voters approve of the job he is doing on the other issues including trade with other countries (43%), immigration (43%), foreign policy (40%), and health care (39%). There are no differences across the four states with similar shares of voters in Michigan, Minnesota, Pennsylvania, and Wisconsin approving of President Trump’s job on each of these key issues.
Figure 21: Blue Wall Voters Divided On President Trump’s Job On Economy, Majorities Disapprove Of His Job On Most Other Issues
There are, however, unsurprisingly strong partisan differences. Large majorities of Republican voters approve of the job President Trump is doing on all of the issues while independent voters lean more negative in their assessments of President Trump’s job performance. Few Democratic voters approve of his job performance on any of the national issues included in the survey. Across the issues, President Trump ranks best in his handling of the economy with 94% of Republicans approving of the way he is handling the nation’s economy, as do half of independent voters and 11% of Democratic voters.
Figure 22: Majorities Of Republican Voters Approve Of President Trump’s Job Performance Compared To Fewer Independents And Democrats
Voters Say Health Care and Economy Are Top Issues
One year out from the 2020 general election, health care and the economy are the top two issues for voters. About one-fifth of voters say health care (21%) or the economy (21%) will be the most important issue in deciding their vote for president next year. These are followed by climate change (14%), gun policy (13%), foreign policy (9%), immigration (9%), taxes (6%), and international trade and tariffs (1%).
An Increased Interest in Foreign Policy?
The Blue Wall Voices Project was conducted September 23rd – October 15th, 2019. Two major foreign policy news stories happened during the field period including the U.S. House of Representatives’ impeachment inquiry and the Turkish invasion into Syria. While news regarding President Trump’s phone call with the Ukrainian President was released prior to the field period, House Speaker Nancy Pelosi announced a formal impeachment inquiry into Trump on September 24th. The news regarding his interactions with foreign leaders remained the top news for the weeks following as testimonies began before House committees. In addition, on October 12th President Trump’s administration announced that U.S. troops would be pulling back from northern Syria, subsequently allowing for Turkey forces to move into a region controlled by the Kurdish forces. Almost immediately, Turkey began assaults against Kurdish fighters and civilians in Syria. This lead to the U.S. to call on Turkey to stop the invasion and announce sanctions aimed at restraining the Turks’ assault. All of these events have led to an increase in the importance of foreign policy among voters in Michigan, Minnesota, Pennsylvania, and Wisconsin. Foreign policy and national security now rank alongside gun policy and immigration as the issues voters say will be the most important in deciding their vote for president next year.
Health care and the economy are the top issues across the Blue Wall states with Minnesota voters also selecting climate change as one of their top issues (17%). To see more about how partisans rank these issues in each state, check out the individual state reports.
Figure 23: Health Care And The Economy Among Top Issues Across Blue Wall States
The ranking of issues is largely driven by partisanship. Twice as many Republican voters say the economy will be the most important issue in deciding their vote for President next year than any other issue. Republicans rank the economy (30%), gun policy (15%), and immigration (15%) as the top issues in the presidential election. Democrats rank health care (27%) and climate change (25%) as the top issues. Independent voters choose health care (23%) and the economy (21%) as their top two issues.
Figure 24: Health Care And The Economy Are Top Issues For Blue Wall Voters; Other Priorities Differ By Partisans
Voters who are still undecided about their 2020 vote choice or haven’t made up their minds yet, our swing voters, rank the issues very similarly with health care and the economy as the top issues they say will be the most important in deciding their vote for president next year. In addition, health care and the economy are the top issues among swing voters in Michigan (23% and 25%), Minnesota (19% and 20%), Pennsylvania (19% and 24%), and Wisconsin (21% and 23%).
Health Care
Lowering prescription drug costs and making sure the ACA’s protections for people with pre-existing health conditions continue are the top health care priorities that voters want to see Congress take on next year. About two-thirds of voters (across states) say lowering prescription drug costs for as many Americans as possible should be a top priority for Congress which is similar to the share who say making sure the ACA’s protections for people with pre-existing conditions should be a top priority. These are the top health care priorities across voters in Michigan, Minnesota, Pennsylvania, and Wisconsin.
Figure 25: Lowering Prescription Drug Costs And Maintaining ACA’s Pre-Existing Condition Protections Top Health Care Priorities
Lowering prescription drug costs ranks at the top of the list of health care priorities among all partisans (74% of Democratic voters, 69% of independent voters, and 62% of Republican voters). Making sure the ACA’s protections for people with pre-existing conditions continue is a top priority for both Democrats (83%) and independent voters (65%) while more than half of Republican voters (54%) say repealing and replacing the ACA is a top priority for Congress.
Figure 26: Maintaining Protections For Pre-Existing Conditions And Lowering Prescription Drug Costs Among Top Issues Across Partisans
Immigration
Overall, majorities of voters in each of the four states have positive views of immigrants in this country. Most say it is generally true that “immigrants strengthen our country because of their hard work and talents” (72%) and that it is generally not true that “immigrants are a burden on our country because they take their jobs” (81%) or “increase rates of violent crimes in this country” (75%).
Figure 27: Seven In Ten Blue Wall Voters Say Immigrants Strengthen The U.S. Because Of Their Hard Work And Talents
While most Republican voters in Michigan, Minnesota, Pennsylvania, and Wisconsin say that it is generally not true that “immigrants are a burden because they take our jobs,” they are more divided on whether they think “immigrants increase rates of violent crime in this country.” Half of Republican voters say this is generally not true which is similar to the share who say it is generally true (47%).
Figure 28: Many Blue Wall Voters Across Partisans Say Immigrants Do Not Increase Rates Of Violent Crime Or Are A Burden On U.S.
The U.S. Economy
While the economies of each of the states included in the Blue Wall Voices Project are distinct, the views of the economic outlook for the next year as well as views towards the fairness of the economic system are largely similar. The major differences in voters’ perceptions of the U.S. economy are mostly driven by party identification.
Voters are divided along party lines in their economic outlook for the next year with three-fourths (77%) of Democratic voters (across states) saying they expect that during the next 12 months the U.S. will have “bad times” while eight in ten Republicans (81%) say they expect the U.S. will have “good times.” Independent voters are split with similar shares saying they expect that during the next 12 months the U.S. will have good times financially (47%) as bad times (51%).
Figure 29: Economic Outlook Differs Across Blue Wall Demographic Groups, Especially Among Partisans
Views of the fairness current economic system are also largely partisan with larger shares of Democratic voters saying it is more often that “needy people go without government help in American today” (68%) than say it is more often that “irresponsible people get government help they don’t deserve” (30%). Republican voters view the system differently with the vast majority saying it is more often that “irresponsible people get government help they don’t deserve” (84%). A larger share of independent voters also say “irresponsible people getting government help they don’t deserve” happens more often in America today (55%).
Figure 30: Over Half Of Blue Wall Voters Say Irresponsible People Getting Government Help Is More Common In U.S., But Partisans Differ
Six in ten voters (62%) say that “unfairness in the economy that favors the wealthy” is a bigger problem in this country while one-third of voters (36%) say “over-regulation that interferes with growth and prosperity” is a bigger problem. Nine in ten Democratic voters (93%) say unfairness in the economy is a bigger problem while seven in ten Republican voters (72%) say over-regulation is a bigger problem. Six in ten (63%) independent voters say unfairness in the economy is a bigger problem while 36% say over-regulation is a bigger problem.
Figure 31: Six In Ten Blue Wall Voters Say Unfairness In The Economy That Favors The Wealthy Is Bigger Problem Than Over-Regulation
International Trade and Tariffs
With the U.S. engaged in a trade dispute with China and other countries, the Blue Wall Voices project sought to examine voters’ opinions of the possible impacts of the tariffs in Michigan, Minnesota, Pennsylvania, and Wisconsin.
More than half of voters in the Blue Wall say the recent import taxes on certain goods brought into the U.S. from China and other countries will hurt both the national economy (55%) and workers in their state (55%). While these views are largely partisan, about one-fourth of Republican voters say the recent tariffs will hurt both the national economy (23%) and workers in their state (25%).
Figure 32: Majorities Of Democrats And Independent Voters Say Tariffs Will Hurt, Fourth Of Republican Voters Say The Same
Overall, a larger share of voters in the Blue Wall say the recent tariffs will hurt rather than help them and their families, but a considerable share also say they expect the import taxes to have no effect. More than four in ten voters say the recent tariffs will hurt them and their family including roughly half of voters in Pennsylvania and Wisconsin.
Figure 33: Few Blue Wall Voters Across States Say Tariffs Will Help Them And Their Family
Partisanship plays a large role in views of recent tariffs with seven in ten Democrats (69%) saying the tariffs will hurt them and their families compared to 46% of independent voters and 21% of Republican voters.
Figure 34: Nearly Half Of Blue Wall Voters Say Tariffs Will Hurt Them And Their Family; Republicans More Likely To Say Tariffs Will Help
President Trump Currently Has Support Among Rural Voters, But The Economy Matters A Lot To This Group And Many Worry About The Effect Of Recent Tariffs
One key group that President Trump needs to retain support from in 2020 are rural voters. The poll indicates that currently President Trump has the support of rural voters in Michigan, Minnesota, Pennsylvania, and Wisconsin with larger shares of rural voters in each of the states saying they are either “definitely” or “probably” going to vote for President Trump than the Democratic nominee.
Table 3: President Trump Currently Has Support Among Rural Voters In Upper Midwest
TotalRural Voters
MichiganRural Voters
MinnesotaRural Voters
PennsylvaniaRural Voters
WisconsinRural Voters
Definitely voting for President Trump
32%
29%
38%
35%
28%
Probably going to vote for President Trump
12
13
10
11
13
Undecided
27
29
24
27
27
Probably going to vote for Democratic nominee
6
4
7
4
10
Definitely voting for Democratic nominee
18
18
20
15
20
A key issue for this group is the economy with large shares of rural voters in each of the states saying the economy is among the most important issues when deciding their vote next year. And most rural voters approve of the way President Trump is handling the economy with about two-thirds of rural voters in Michigan (66%), Minnesota (65%), Pennsylvania (66%), and Wisconsin (61%) saying they either “strongly approve” or “somewhat approve.” In addition, majorities of rural voters in each state say they expect the U.S. will have good times financially during the next 12 months.
Rural voters are currently less negative in their assessment of how the recent tariffs will hurt workers in their state, the national economy, or their family than suburban and urban voters. But still about half of rural voters say the recent tariffs will hurt workers in their state (47%) and the national economy (45%), while about four in ten (39%) say the recent tariffs will hurt them and their families.
Michigan
The Blue Wall Voices Project examines voters in the state of Michigan to get their perspectives on key issues and aspects of the 2020 election, including the role that health care and the economy may play in voters’ decisions. In addition, it gauges enthusiasm and vote choice leading up to the 2020 presidential election.
Overall, a larger share of Michigan voters say health care and the economy are the most important issues in deciding their vote for president in 2020. About one in five Michigan voters say health care (22%) and the economy (22%) are the most important issues to their vote, with smaller shares saying issues like climate change (13%), foreign policy and national security (11%), gun policy (10%), immigration (9%), taxes (6%), and international trade and tariffs (1%). Partisans are divided in their priorities, with one in four Democrats and independents choosing health care as their top issue, and one-third of Republicans choosing the economy as the most important issue.
Figure 1: For Michigan Voters, Health Care And The Economy Among Most Important Issues
With health care and the economy ranking above all other issues for Michigan voters, it is important to note that Michigan voters give President Trump very different marks on both of these issues. Half (51%) of Michigan voters approve of the way President Trump is handling the economy compared to four in ten (41%) who approve of the way he is handling health care.
Figure 2: Michigan Voters Divided On President Trump’s Economy, While Majorities Disapprove Of His Job On Most National Issues
International Trade and Recent Tariffs
While voters do not rank international trade as one of the most important issues in deciding their vote next year, Michigan is a state expected to be most affected by the ongoing trade disputes with China and other countries. Overall, about half of voters – including majorities of Democrats and independents – say they think the recent tariffs will hurt both the national economy (54%) and workers in Michigan (53%). However, this opinion is only shared by about one-fourth of Republican voters (21% and 26%, respectively) compared to majorities of Democrats (80% and 78%, respectively) and independent voters (58% and 57%, respectively). Six in ten Republican voters in Michigan (61%) say the recent tariffs will “help” the national economy and about four in ten (41%) say the tariffs will “help” Michigan workers.
Figure 3: Most Michigan Voters Say Tariffs Will Hurt, Fewer Republican Voters Say The Same
Partisans also differ in how they perceive the recent tariffs will impact them and their families. More than six in ten Democratic voters in Michigan (63%) say the recent tariffs will hurt them and their families while about half of independent voters (47%) and a majority of Republican voters (57%) in the state say they will “have no effect.” Overall, few voters (14%) say the recent tariffs will help them and their families.
Figure 4: Few Michigan Voters Think Tariffs Will Help Them And Their Families
Health Care Priorities among Michigan Voters
When asked specifically about health care priorities that Congress should work on next year, over six in ten say that lowering prescription drug costs (69%) and maintaining protections for people with pre-existing conditions (64%) should be the top priority for Congress. These priorities substantially outrank other policy proposals such as repealing and replacing the ACA, expanding government aid for people who buy their own health insurance, and implementing a public option or national Medicare-for-all plan. These top two priorities persist across partisans, with large shares of Democratic voters, independent voters, and Republican voters naming lowering prescription drug costs and maintaining pre-existing condition protections as top priorities. However, over half of Republican voters (56%) also say that repealing and replacing the ACA should be a top priority. Implementing a national Medicare-for-all plan, a topic that has dominated health care discussions in the 2020 Democratic primary, is not a top issue for all voters or for Democratic voters, specifically.
Figure 5: Partisan Voters In Michigan Rank Lowering Rx Drug Costs, Protections For Pre-Existing Conditions Among Top Issues
Michigan Voters’ Economic Outlook
Turning to the economy, the other top issue for voters during the 2020 election, voters in Michigan are split about what they think the economic forecast will be like for the next 12 months. Similar shares of Michigan voters say that during the next 12 months, the U.S. will have bad times (50%) and good times (48%). Views on the economic outlook are largely partisan with roughly eight in ten Democrats (78%) saying bad times are ahead and roughly eight in ten Republicans saying good times are ahead (83%). Independent voters are more divided, with four in ten saying the U.S. will experience “good times” while 54% say they expect “bad times” ahead.
Figure 6: Michigan Voters Split About Whether Good Times Or Bad Times Are Ahead For The U.S. Economy
The Democratic Primary in Michigan and Preview of the General Election
More than half of Michigan voters say they are more motivated (55%) to vote in next year’s election than in the previous presidential election. This includes a majority of Democrats (65%), independents (61%) and Republicans (53%) saying they feel more motivated than they did in 2016. Yet, similar to other states included in this analysis, a larger share of Democratic voters say they are “more motivated” than the share of Republican voters who said the same.
Figure 7: Democratic Voters In Michigan Report Higher Levels Of Motivation
Given the high levels of motivation as the next presidential election approaches, the Blue Wall Voices survey explored what could be motivating voters. When asked specifically what the one thing is that will motivate them to vote in the 2020 election, voters offer an array of open-ended responses, with the most frequently volunteered response relating to defeating President Trump (21%), followed by those who offered responses related to civic duty (10%) and health care (8%). Small shares of voters cited reasons such as wanting to re-elect Trump and not wanting to elect a Democrat (6%), or the economy (5%).
Figure 8: One In Five Michigan Voters Say Defeating Trump Is Their Top Motivation To Vote In 2020
With more than four months before the 2020 Michigan Democratic primary, Senator Elizabeth Warren garners the most support among likely Democratic primary voters followed by Vice President Joe Biden and Senator Bernie Sanders. One-fourth of Michigan Democratic primary voters say Senator Warren is their first choice for the 2020 Democratic ticket and a combined 43% of voters say she is their first choice or second choice.
Figure 9: Four In Ten Michigan Voters Pick Senator Warren As Their First Or Second Choice Of Democratic Candidate
Overall, many voters (43%) in the state remain uncertain about who they will support in the 2020 election. One-third of Michigan voters say they are definitely voting for the Democratic nominee and about one-fifth (21%) say they are definitely voting for President Trump. In contrast, one-fourth of voters say they are undecided, and few voters say they are either probably voting for the Democratic nominee (6%) or for President Trump (11%). This poll finds there are few persuadable Michigan voters meaning that, while they currently support one candidate, they could be convinced to support the other party’s candidate.
Figure 10: About Four In Ten (43%) Michigan Voters Are Swing Voters
Michigan swing voters (those who are either undecided voters or say they are probable but not definite Trump or Democratic voters) are supportive of three progressive platforms: the Green New Deal, a pathway to citizenship for immigrants, and a ban on future sales of assault weapons. But, on the other progressive platforms included in this project, Michigan voters are either split or a majority say they are a bad idea. This includes two-thirds of Michigan swing voters (65%) who say a national Medicare-for-all plan is a “bad idea.”
Figure 11: Michigan Swing Voters See Many Progressive Positions As Good Ideas Including The Green New Deal
Minnesota
The Blue Wall Voices Project examines voters in the state of Minnesota to get their perspectives on key issues and aspects of the 2020 election, including the role that health care and the economy may play in voters’ decisions. In addition, it gauges enthusiasm and vote choice leading up to the 2020 presidential election.
Overall, Minnesota voters say that a number of issues will be the most important in deciding their vote for president in 2020, with health care, the economy, and climate change emerging as the top issues. About one in five Minnesota voters say health care (20%), climate change (17%), and the economy (16%), are the most important issues to their vote, with smaller shares naming issues like gun policy (11%), immigration (11%), foreign policy and national security (9%), taxes (8%), and international trade and tariffs (1%). Partisans are divided in their priorities with three in ten Democrats ranking health care and climate change as their top issues, about two in ten independents ranking health care and the economy as their top issues, and one-fourth of Republicans ranking the economy as the most important issue and one in five saying immigration will be the most important issue in deciding their 2020 vote choice.
Figure 1: Minnesota Voters Say Health Care, Climate Change, And The Economy Are Top Issues In Deciding 2020 Vote
Overall, a majority of Minnesota voters disapprove of President Trump’s job performance (58%) while four in ten voters approve (42%). In addition, most Minnesota voters also disapprove of the way he is handling foreign policy (58%), health care (57%), immigration (56%), and trade with other countries (55%). Minnesota voters are more divided in their views of how President Trump is handling the economy with 49% of voters saying they approve compared to 51% who disapprove.
Figure 2: Majorities Of Minnesota Voters Disapprove Of President Trump’s Handling Of Most National Issues
Minnesota Voters on Health Care Priorities
When asked specifically about health care priorities that Congress could work on next year, over six in ten say lowering prescription drug costs (64%) and maintaining protections for people with pre-existing conditions (62%) should be the top priority for Congress. These priorities substantially outrank other policy proposals such as repealing and replacing the Affordable Care Act (28%), expanding government financial help for people who buy their own health insurance coverage on the ACA marketplace to include more people (21%), and implementing a public option (23%) or national Medicare-for-all plan (20%). These top two priorities persist across partisans, with large shares of Democratic, independent, and Republican voters naming lowering prescription drug costs and maintaining pre-existing condition protections as top priorities. However, over half of Republican voters (53%) also say that repealing and replacing the ACA should be a top priority. Implementing a national Medicare-for-all plan, a topic that has dominated health care discussions in the 2020 Democratic primary, is not a top priority for a majority of voters or for Democratic voters, specifically.
Figure 3: Partisan Voters In Minnesota Rank Lowering Rx Drug Costs, Protections For Pre-Existing Conditions Among Top Issues
Minnesota Voters’ Views of the U.S. Economy
Turning to the economy, the other top issue for voters during the 2020 election, Minnesota voters are optimistic about the U.S. economic forecast over the next 12 months. About half of Minnesota voters say that during the next 12 months, the U.S. will have “good times” (53%), compared to a slightly smaller share who say the U.S. will experience “bad times” (44%). Views towards the U.S. economy are largely partisan with two-thirds of Democrats (68%) saying bad times are ahead, while over eight in ten Republicans (84%) say the U.S. will experience “good times” financially. Independent voters are more divided, but lean positive with 54% saying they expect “good times,” while 44% say the U.S. economy will experience “bad times” over the next year.
Figure 4: Slight Majority Of Minnesota Voters Say Good Times Are Ahead For The U.S. Economy In The Next Year
The Democratic Primary in Minnesota and Preview of the General Election
Slightly over half of Minnesota voters say they are more motivated (52%) to vote in next year’s election than in the previous presidential election. This includes majorities of Democrats (57%) and Republicans (59%) and nearly half of independents (47%) saying they feel more motivated than they did in 2016.
Figure 5: Both Democratic And Republican Minnesota Voters Report High Levels Of Motivation
Given the high levels of motivation as the next presidential election approaches, the Blue Wall Voices survey explored what could be motivating voters. When asked specifically what the one thing is that will motivate them to vote in the 2020 election, voters offer an array of responses, with the most frequently volunteered response related to defeating Trump (18%), followed by those who offered responses related to civic duty (11%). Smaller shares cite reasons such as to re-elect Trump or not wanting a Democrat (9%), health care (6%), a candidate with good ethics (4%), and the environment or climate change (4%).
Figure 6: Nearly One In Five Minnesota Voters Say Defeating Trump Is Their Top Motivation To Vote In 2020 Election
With more than four months left before the 2020 Minnesota Democratic primary, Senator Elizabeth Warren garners the most support among likely Democratic primary voters followed by Minnesota Senator Amy Klobuchar, Vice President Joe Biden, and Senator Bernie Sanders. One-fourth of Minnesota Democratic primary voters say Senator Warren is their first choice for the 2020 Democratic ticket and a combined 43% of voters say she is their first choice or second choice.
Figure 7: Senator Warren Has Slight Lead Over Minnesota Senator Klobuchar Among Minnesota Democratic Primary Voters
About one-third of Minnesota voters say they are “definitely voting for the Democratic nominee” (32%) and about one-fourth (24%) say they are “definitely voting for President Trump.” Many voters (41%) in the state remain uncertain about who they will support in the 2020 general election. Of that 41%, two in ten voters say they are “undecided” (21%), and about one in ten say they are either “probably voting for the Democratic nominee” (10%) or “probably voting for President Trump” (10%). This poll finds few persuadable Minnesota voters, meaning that, while they currently support one candidate, they could be convinced to support the other party’s candidate. Three percent of all Minnesota voters say that they are probably going to vote for President Trump, but there is “a chance” they will vote for the Democratic nominee. On the other side, 1% of Minnesota voters say that they are probably voting for the Democratic nominee, but there is “a chance” they will vote for President Trump.
Figure 8: About Four In Ten (41%) Minnesota Voters Are Swing Voters
Minnesota swing voters (those who are undecided or say they are probably going to vote for either President Trump or the Democratic nominee) have very different views on two key immigration issues. While three-fourths of Minnesota swing voters (76%) think a pathway to citizenship for immigrants who are in the country illegally is a “good idea,” two-thirds think stopping detainments at the U.S. border for people who are coming into the country illegally is a “bad idea.”
On other progressive platforms, Minnesota swing voters have positive views towards a ban on future sales of assault weapons (68%) and a Green New Deal that would address climate change through new regulations and increases in government spending on green jobs and energy-efficient infrastructure (64%), but say a national Medicare-for all plan is a “bad idea” (63%). Minnesota swing voters are more divided in their views towards a ban on owning assault weapons including a mandatory buyback program (54% say it is a “good idea,” while 46% say it is a “bad idea”) and a ban on fracking (42% say it is a “good idea,” while 50% say it is a “bad idea”).
Figure 9: Minnesota Swing Voters Support Pathway To Citizenship But Many Think Stopping U.S. Border Detainments Is A Bad Idea
Pennsylvania
The Blue Wall Voices Project examines voters in Pennsylvania, a state that President Trump won by less than one percentage point (approximately 44,000 votes) over Democratic candidate Hillary Clinton in 2016. This poll finds that health care is among the top issues for voters more than one year out from the general election and examines enthusiasm and vote choice leading up to the 2020 presidential election.
Health care ranks among the top issues for voters leading up to the 2020 presidential election along with the economy, gun policy, and climate change. Health care is the top issue for Democratic voters (28%) and ranks among the top issue for independent voters (25%), but ranks lower among Republican voters. In fact, among Republican voters, health care ranks below the economy (31%), gun policy (16%), and immigration (14%), and alongside foreign policy or national security (9%) and taxes (9%), with one in ten Republican voters saying health care will be the most important issue in deciding their vote next year.
Figure 1: Pennsylvania Voters Rank Health Care, The Economy, Gun Policy And Climate Change As Top Issues
Similar to the overall Blue Wall, Pennsylvania voters are most positive in their views of the way President Trump has handled the economy with nearly half (48%) of Pennsylvania voters saying they approve of his job performance on this issue. On the other hand, more than six in ten Pennsylvania voters (63%) say they disapprove of the way he has handled health care. Both of these issues appear to be key issues leading up to the 2020 presidential race.
Figure 2: Majorities Of Pennsylvania Voters Disapprove Of President Trump’s Handling Of Most National Issues
Pennsylvania Voters on Health Care
While Medicare-for-all has dominated most of the health care discussions on the 2020 Democratic campaign trail, it ranks low among the priorities that the public has for Congress next year. One-fourth (26%) of Pennsylvania voters say implementing a national Medicare-for-all plan is a “top priority” for Congress compared to nearly seven in ten who say the same about lowering prescription drug costs for as many Americans as possible (68%) as well as maintaining the Affordable Care Act’s protections for people with pre-existing medical conditions (68%). Implementing a national Medicare-for-all plan is not even a top priority among Democratic voters (36%).
Figure 3: Lowering Rx Drug Costs Ranks Among Top Health Care Issues For All Voters, Regardless Of Partisanship
The Economy
The economy is another top issue for Pennsylvania voters but views of how the economy will fare over the next 12 months are largely driven by partisanship. Overall, voters in Pennsylvania are divided with similar shares saying they think that the U.S. will experience “good times” (47%) and “bad times” (51%) over the next 12 months. Eight in ten (78%) Democratic voters say the U.S. will have bad times financially over the next year while 80% of Republicans say the U.S. will have good times. Independents are evenly divided (49% v. 49%).
Figure 4: Pennsylvania Voters Are Split As To Whether Good Times Or Bad Times Are Ahead For The U.S. Economy
The Democratic Primary in Pennsylvania and Preview of the General Election
Two-thirds of Democratic voters say they are more motivated to vote in next year’s 2020 presidential election than they were in 2016 compared to slightly more than half of independent voters (54%) and Republican voters (54%). This is similar to the overall Blue Wall findings, which finds the Democratic Party has a slight enthusiasm edge over their Republican counterparts.
Figure 5: Democratic Voters Report Higher Levels Of Motivation
When asked to say in their own words what will be the one thing that will motivate them to vote in the 2020 presidential election, a larger share of voters offer responses related to defeating President Trump than any other thing. One-fifth of voters say defeating President Trump (22%) is the one thing that will motivate them to vote next year, followed by those who say they are motivated by re-electing President Trump or not wanting to elect a Democrat (10%), the issue of health care (8%), or their civic duty (7%).
Figure 6: One In Five Pennsylvania Voters Say Defeating Trump Is Their Top Motivation To Vote In 2020
With more than six months before the Pennsylvania Democratic primary, Vice President Joe Biden, a Pennsylvania native, is the first choice among Democratic primary voters. One-fourth (27%) of Democratic primary voters chose Vice President Biden as their first choice of 2020 Democratic candidates followed by 18% of Democratic primary voters who chose Senator Elizabeth Warren and 14% who chose Senator Bernie Sanders. Senator Warren and Vice President Biden have a relatively similar share of first choice and second choice votes with more than one-third of voters selecting either candidate as their first or second choice.
Figure 7: Biden Has Slight Edge Among Primary Voters In Pennsylvania, Biden And Warren Share Lead As Voters’ Top Two Choices
Nearly four in ten (39%) Pennsylvania voters are still either undecided (22%) about their 2020 vote choice, or say they are “probably” voting for either President Trump (10%) or the Democratic nominee (7%) but have not made up their minds yet. This is compared to one-third of voters who say they are “definitely voting” for the Democratic nominee and one-fourth who are “definitely voting” for President Trump (23%).
Figure 8: Nearly Four In Ten (39%) Pennsylvania Voters Are Swing Voters
With four in ten Pennsylvania votes still up for grabs, the poll finds that majorities of Pennsylvania swing voters (those who either say are still undecided or are either probable but not definite Trump or Democratic voters) say many of the progressive platforms currently being discussed in the Democratic primary are good ideas, but these voters are less positive in their views of three important policy positions, including Medicare-for-all. More than half of Pennsylvania swing voters say a pathway to citizenship for immigrants in the country illegally (72%), the Green New Deal (69%), a ban on future sales of assault weapons (67%), and a ban on owning assault weapons (57%) are good ideas. On the other hand, Pennsylvania swing voters are more negative in views of a national Medicare-for-all plan, fracking, and no longer detaining people for crossing the U.S. border illegally. Majorities of Pennsylvania swing voters say all three of these progressive platforms, a national Medicare-for-all plan (56%), a ban on fracking (57%), and stopping U.S. border detainments (72%), are “bad ideas.”
Figure 9: Pennsylvania Swing Voters Have Negative Views Of Medicare-for-all, Fracking Ban, And Stopping U.S. Border Detainments
Wisconsin
The Blue Wall Voices Project examines voters in Wisconsin, a state that President Trump won by less than one percentage point over Democratic candidate Hillary Clinton in 2016. This poll finds the economy and health care are among the top issues for voters more than one year out from the general election and examines enthusiasm and vote choice leading up to the 2020 presidential election.
With approximately one year before the 2020 presidential election, the economy (22%) and health care (20%) emerge as the top issues for Wisconsin voters. Smaller shares name climate change (16%), gun policy (11%), foreign policy or national security (11%) and immigration (9%) as the issue which will be most important in deciding their vote. However, there are notable partisan differences on which issues are most important in deciding their vote. Among Democrats, climate change emerges as a top issue with nearly three in ten (29%) saying it will be the most important issue in deciding their vote, while among Republicans, only 2% say climate change is the most important issue. Nearly three in ten Republicans (29%) say the economy is the most important issue, compared to 22% of independents and 12% of Democrats. Larger shares of Democratic voters and independent voters say health care is the most important issue in deciding their vote (25% and 21%, respectively) than Republican voters (13%).
Figure 1: Wisconsin Voters Rank The Economy And Health Care As Top Issues
While Wisconsin voters are evenly divided in their views of how President Trump is handling the economy (50% v. 50%), a larger share of Wisconsin voters give President Trump negative marks on all other issues included in this poll including foreign policy (60%), health care (58%), immigration (58%), and international trade (57%).
Figure 2: Wisconsin Voters Split On President Trump’s Economy, Majorities Disapprove Of His Handling Of Most National Issues
Wisconsin Voters’ Views of Health Care Priorities
When asked about specific health care priorities for Congress to work on next year, nearly seven in ten Wisconsin voters say lowering prescription drug costs (69%) and maintaining protections for people with pre-existing conditions (66%) should be “a top priority.” Majorities of Democrats (79%), independents (70%), and Republicans (59%) say lowering prescription drug costs should be a top priority for Congress. A majority of Republicans (57%) say repealing and replacing the ACA should be a top priority while a smaller share (46%) say maintaining protections for people with pre-existing conditions should be a top priority for Congress. With discussions about Medicare-for-all dominating the health care conversation in the recent Democratic primary debates, equal shares of Wisconsin Democratic voters say implementing a national Medicare-for-all plan and implementing a public option should be a top priority for Congress next year (43% each), mirroring the policy divide on this issue among the leading Democratic candidates.
Figure 3: Wisconsin Voters Rank Lowering Rx Drug Costs, Protections For Pre-Existing Conditions Among Top Health Care Priorities
The Economy
Wisconsin voters are divided in their economic outlook for the country in the next 12 months. About half (51%) think the U.S. will have “bad times” financially in the next year while 47% expect “good times.” There is a stark partisan divide with eight in ten Democrats expecting bad economic times in the next year, whereas three in four Republicans (77%) expect good times financially for the country. Similar shares of independent voters expect bad economic times (52%) and good times financially (46%).
Figure 4: Wisconsin Voters Are Split As To Whether Good Times Or Bad Times Are Ahead For The U.S. Economy
The Democratic Primary in Wisconsin and Preview of the General Election
About half of Wisconsin voters (51%) say they are more motivated to vote in 2020 than they were in the 2016 presidential election. Democrats seem to have the edge when it comes to motivation with more than six in ten Democrats (62%) saying they are “more motivated” to vote in 2020 than they were last election compared to less than half of Republicans (46%) who say they are more motivated.
Figure 5: Democratic Voters In Wisconsin Report Higher Levels Of Motivation
When asked specifically what one thing will motivate them to vote in the 2020 election, the most frequently volunteered response was defeating President Trump (19%). Smaller shares cited reasons such as a sense of civic duty (9%), re-electing President Trump or not wanting to elect a Democrat (8%), health care (6%), the economy (5%), and to vote for the best candidate (4%) or a candidate with good ethics (4%).
Figure 6: One-Fifth Of Wisconsin Voters Say Defeating Trump Is Their Top Motivation To Vote In 2020
With about five months before Wisconsin’s 2020 primary election, about one in five Democratic voters say Senator Warren (22%) and Vice President Biden (17%) are who they plan to support during the Democratic primary. Vermont Senator Bernie Sanders, who won the Wisconsin primary in 2016 when he challenged former Senator Hillary Clinton for the nomination, is currently garnering 10%. Notably, about four in ten (41%) Wisconsin Democratic primary voters select Senator Warren as their first or second choice compared to one in four Democratic primary voters who select Vice President Joe Biden as their first or second choice while one in five (21%) say Senator Sanders is their first or second choice.
Figure 7: Warren And Biden Top List Of First Choice In Candidates, Warren Alone At Top Of Combined First And Second Choice
About four in ten (43%) Wisconsin voters are either undecided (21%) about their 2020 vote choice or say they are “probably” voting for either President Trump (11%) or the Democratic nominee (10%) but have not made up their minds yet. About three in ten voters say they are “definitely voting” for the Democratic nominee (31%) and about one in five say they are “definitely voting” for President Trump (22%).
Figure 8: About Four In Ten (43%) Wisconsin Voters Are Swing Voters
Majorities of Wisconsin swing voters (those who are either undecided or say they are probably going to vote for either president Trump or the Democratic nominee) say many of the progressive platforms are “good ideas” including a pathway to citizenship for immigrants in the U.S. illegally (75%), a Green New Deal (65%), and a ban on future sales of assault weapons (65%). But most Wisconsin swing voters say a ban on fracking (55%), a national Medicare-for-all plan (63%), and stopping detainments at the U.S. border (66%) are bad ideas.
Figure 9: Progressive Platforms Are Viewed Positively And Negatively By Wisconsin Swing Voters
Methodology
The Blue Wall Voices Project was designed and analyzed by public opinion researchers at the Kaiser Family Foundation (KFF) in collaboration with the Cook Political Report. The survey was conducted September 23rd – October 15th, 2019, among a representative random sample of 3,222 registered voters in four states (767 in Michigan, 958 in Minnesota, 752 in Pennsylvania, and 745 in Wisconsin) constituting the “Democratic Blue Wall” – the area in the Upper Midwest that were previously considered Democratic strongholds, and where state polls performed poorly in 2016 and underestimated support for President Trump. All registered voters included in the sample were sent an invitation letter including a link to complete the survey online, a toll-free number that respondents could call to complete the survey with a telephone interviewer, and $2 pre-incentive. Respondents who were living in Census block-groups identified as low-education and respondents identified as likely Hispanic were offered $10 post-incentive if they completed the survey. A random half of respondents received a QR code on their invitation letters. All respondents were then sent a reminder postcard, which included a QR code for all respondents. Respondents who were flagged in the voter file as both a) speaking Spanish and b) speaking either primarily or only their native language, received bilingual mailings, including text in both English and Spanish.
The sample was designed to reach respondents less likely to complete surveys online, by oversampling areas with a relatively low percentage of college graduates. Sample that could be matched to telephone numbers and that had not yet completed the survey online or by inbound computer-assisted telephone interview (CATI) were called by CATI interviewers to attempt to convert this sample to completed interviews. A total of 2,763 respondents completed the questionnaire online, 255 by calling in to complete, and 204 were completed as outbound CATI interviews. Data collection was carried out in English and Spanish by SSRS of Glen Mills, PA. The registered voter sample was provided by Aristotle. KFF paid for all costs associated with the survey.
A series of data quality checks were run on the final data, which resulted in 40 completes being removed from the data. Weighting involved multiple stages: First, each state sample was weighted to account for the sampling methodology including the oversampling of low-educational attainment areas and to the proportions of the voter file reachable or unreachable by outbound phone-call. Second, each state’s sample was weighted to match the voter file distribution of 2016 voter status, party identification, gender, race/ethnicity, home-ownership, Metropolitan status, state region, as well as the 2018 CPS Voter Supplement for age-by-gender, educational attainment and race. To address non-response among partisans not accounted for by demographics, the weight was adjusted so that the self-reported 2016 vote in each state matched the actual state outcome. The final weight combined each state’s weight and balanced the combined total sample to state distributions. All statistical tests of significance account for the effect of weighting.
The margin of sampling error including the design effect for the full sample is plus or minus 2 percentage points. Numbers of respondents and margins of sampling error for each state are shown in the table below. For results based on other subgroups, the margin of sampling error may be higher. Sample sizes and margins of sampling error for other subgroups are available by request. Note that sampling error is only one of many potential sources of error in this or any other public opinion poll. Kaiser Family Foundation public opinion and survey research is a charter member of the Transparency Initiative of the American Association for Public Opinion Research.
Endnotes
In the wake of the 2016 election there was some speculation that voters who were planning to support President Trump were reluctant to express this to interviewers during public opinion polls. This “shy Trump voter” hypothesis was not found to be a meaningful contribution to the polling errors in 2016. By examining whether voters were less willing to express support for President Trump during a live interview compared to an online response, we found no evidence of any voters, regardless of party identification, being less willing to express support for President Trump during live interview surveys. It is also important to note that while we did not find evidence of shy Trump voters, this may be a result of respondents being able to self-select into their various modes. ↩︎
The Blue Wall Voices Project began on September 23rd, 2019, one day before House Speaker Nancy Pelosi announced a formal impeachment inquiry into Trump on September 24th as a result of President Trump’s phone call with the Ukrainian President. As the field period continued into October, we did see an increase in the share of voters who mentioned President Trump’s commitment to constitution in their responses to this question. ↩︎
A Year from 2020 Election, Polling in Four Former “Blue Wall” States – Michigan, Minnesota, Pennsylvania, and Wisconsin – Finds President Trump Is Voters’ Biggest Motivator
New KFF/Cook Political Report Partnership Poll in Key States Finds Solid Support for President Trump among his Base but Democrats Have an Edge in Enthusiasm, Especially in Michigan and Wisconsin
Progressive Stances on Fracking, Medicare-for-all and Border Detainments May Turn Off Swing Voters
A year ahead of the 2020 presidential election, President Trump is the biggest defining factor for voters in Michigan, Minnesota, Pennsylvania, and Wisconsin – more often in a negative than a positive direction, finds a new partnership survey from KFF and The Cook Political Report of more than 3,000 voters across the four previously considered “Blue Wall” states, including at least 745 in each state.
More than twice as many voters in these states mention defeating President Trump (21%) as the one thing that will motivate them to vote in 2020 than offer responses related to re-electing him (8%).
Voters across the “Blue Wall” states – the area in the Upper Midwest that were previously considered Democratic strongholds and where 2016 state polls underestimated President Trump’s support – are more likely to mention President Trump as their main motivation than any issue including health care (8%) and the economy (4%), which top voters’ list of key national issues for the 2020 campaign. Overall, one-fourth (23%) of voters name any issue as their main motivation for voting in 2020.
As the 2020 race heats up, health care and the economy are the top issues for voters but these issues may pull voters, especially independents, in opposite directions. President Trump garners a higher approval rating on the economy (49% approve, 50% disapprove) than on any other issue, while he garners his lowest marks on health care (39% approve, 60% disapprove). And while half of independent voters approve of the way President Trump is handling the economy, most (61%) disapprove of the way he is handling health care.
Most voters (59%) in the four states also disapprove of his job performance overall, compared to 41% who approve. Yet, the poll isn’t all bad news for President Trump, as he retains solid support among his base across the Blue Wall states. Large majorities of Republican voters approve of his job performance overall (87%) and on every specific issue tested, including the economy (94%) and health care (84%).
At this stage, nearly two thirds (64%) of Democratic voters across the four states say they are more motivated to vote in 2020 than they were in 2016, compared over half of independents (55%) and Republicans (53%). On a state-by-state basis, Democrats have a clear enthusiasm advantage over Republicans in Michigan, Pennsylvania and Wisconsin, while in Minnesota voters in both parties are about equally enthusiastic.
Republicans’ loyalty to President Trump runs high. Most Republican and Republican-leaning voters (73%) say they want President Trump to be the Republican nominee in 2020, but small shares (28%) of his supporters can imagine a scenario in which he enacts a policy, or fails to enact a policy, that would result in them changing their vote.
A Year Out, President Trump Trails the Democratic Nominee, But 4 in 10 Say Their Mind Isn’t Made Up
Nearly one-fourth of voters in each of the states say they are “definitely” going to vote for President Trump in 2020, and an additional one in ten saying they are “probably” going to vote for him. However, more voters overall say they definitely or probably will vote for the Democratic nominee (40%) than say they definitely or probably will vote for President Trump (33%).
While many voters across the Blue Wall states say they have made up their mind about who they will vote for in the 2020 general election, about four in 10 say they either are undecided (23%) or are probably going to vote for either President Trump or the Democratic nominee but haven’t completely made up their minds yet. This crucial group of “swing voters” make up both those voters who may choose to stay home next year and a small share of voters who may still be persuadable to vote for the other party’s candidate (5%).
While Democrats Support Progressive Platforms, Some May Turn Off Crucial Swing Voters
Voters who say they are going to vote for the Democratic nominee in 2020 overwhelmingly think the progressive policy positions included in this survey are good ideas, including the Green New Deal (92%), a pathway to citizenship for immigrants in the country illegally (91%), a ban of future assault weapon sales (88%) and a ban and mandatory buyback of assault weapons (83%). Fewer, but still a majority, also say a ban on fracking (54%), stopping U.S. border detainments (56%), and a national Medicare-for-all plan (62%) – a hot-button issue in the Democratic primary race – are good ideas.
While few self-reported 2020 Democratic voters say they wouldn’t vote for a candidate who disagreed with them on any of these issue in the general election, there is some evidence that some of these progressive stances are not popular among swing voters.
Majorities of swing voters across the four states view three as bad ideas: not detaining border crossers (71%), Medicare-for-all (62%) and a fracking ban (54%). In Pennsylvania, 57% of swing voters say a fracking ban is a bad idea.
The Blue Wall poll also explores voters’ views on other issues, including tariffs and trade. Most voters across the four states say recent tariffs imposed on goods from China and other countries are hurting the national economy (55%) and workers in their state (55%). In addition, voters are about three times more likely to say the tariffs are hurting their families (46%) than are helping their families (14%). These shares are similar in each of the four states.
Voter Preferences in the Democratic Primaries
The four state polls also test Democratic voters’ primary preferences and finds former Vice President Joe Biden and Sen. Elizabeth Warren are voters’ top choices. Specifically:
Michigan: Warren (25%), VP Biden (19%) and Sen. Bernie Sanders (15%).
Minnesota: Warren (25%), Sen. Amy Klobuchar (15%), VP Biden (14%) and Sen. Sanders (13%).
Pennsylvania: VP Biden (27%), Sen. Warren (18%) and Sen. Sanders (14%).
Wisconsin: Warren (22%), VP Biden (17%), and Sen. Sanders (10%).
METHODOLOGY
Designed and analyzed by public opinion researchers at KFF in collaboration with Cook Political Report, the poll was conducted September 23rd – October 15th, 2019, among a representative random sample of 3,222 registered voters in four states (767 in Michigan, 958 in Minnesota, 752 in Pennsylvania, and 745 in Wisconsin) constituting the Democratic “Blue Wall.” The poll relies on an innovative probability-based methodology designed to address shortcomings with telephone-only surveys based on either voter-registration rolls or random-digit dialing. Voters were contacted via mailing address using registration-based sampling and encouraged to participate in the survey either online or by telephone and follow-up contacts were made using outbound telephone calls. Interviews were conducted in English and Spanish either online (2763), by calling in to complete (255), or throughout outbound telephone interviews (204). The margin of sampling error is plus or minus 2 percentage points for the full sample. For results based on subgroups, the margin of sampling error may be higher.
Since Medicaid’s inception, federal law has generally prohibited states from using Medicaid funds for services provided to nonelderly adults in “institutions for mental disease” (IMDs).1 The IMD payment exclusion was intended to leave states with the primary responsibility for financing inpatient behavioral health services.2 However, the lack of federal funding may limit access to needed inpatient services and contribute to high levels of unmet need. In recent years, the federal government has provided new mechanisms for states to finance IMD services for nonelderly adults through Medicaid in certain situations. There are now four options for states to cover these services: Section 1115 demonstration waivers, managed care “in lieu of” authority, disproportionate share hospital payments, and the SUPPORT Act state plan option.
This report provides new data to understand current patterns of Medicaid enrollees’ use of inpatient and outpatient substance use disorder (SUD) and mental health treatment services; explains the options for states to access federal Medicaid funds for enrollees receiving IMD services; analyzes current waiver activity; and draws on interviews with policymakers in two states and one county using IMD waivers to examine successes and challenges. Appendix Tables contain state-level data. Key findings include:
Many nonelderly Medicaid adults with a behavioral health condition report unmet treatment needs. Though Medicaid adults with behavioral health needs are more likely than those privately insured to have used services in the past year, treatment rates are low across all payers, including payers not subject to the IMD payment exclusion. Most Medicaid adults who receive behavioral health treatment do so as outpatients.
Twenty-six states have a Section 1115 waiver to use Medicaid funds for IMD SUD services, as of November 2019. Vermont is the only state with an IMD mental health waiver to date.
Interviews with policymakers in two states and one county using IMD waivers reveal that all devoted substantial time and resources to expanding and strengthening available community-based SUD treatment services in addition to IMD services. All three report overall positive experiences with their waivers, along with some implementation challenges that had to be resolved.
Early waiver evaluation results in the case study areas show more Medicaid enrollees using SUD services and increased provider participation since allowing IMD payment. Policymakers also described some constraints of the IMD waivers, particularly around the length of stay limits.
As states continue to seek Medicaid IMD payments, key issues to watch include capacity and utilization of treatment services across the care continuum, IMD day limits, discharge planning and care transitions, and the continued evolution of evidence-based best practices for SUD and mental health treatment.
Report
What Behavioral Health Services Does Medicaid Cover?
Medicaid covers many behavioral health services, though there is not a specifically defined category of Medicaid benefits dedicated to behavioral health. Some behavioral health services fall under mandatory Medicaid benefit categories that all states must cover. For example, psychiatrist services are covered under the required “physician services” category. States also cover behavioral health services through optional benefit categories that states may choose to include in their Medicaid programs, such as case management or prescription drugs (which all states do). One important benefit category for behavioral health is the rehabilitative services option, through which states commonly cover non-clinical behavioral health services such as peer support and community residential services. In addition, under waiver or state plan authority, states can provide home and community-based long-term care behavioral health services that support independent community living, such as day treatment and psychosocial rehabilitation services. While all states that participate in Medicaid must cover inpatient services, federal law prohibits payment for services provided in IMDs, as further described below. Box 1 provides examples of behavioral health services that may be covered by Medicaid. A glossary defining key Medicaid behavioral terms is included in the Appendix.
Box 1: Examples of Medicaid Behavioral Health Services
Institutional care and intensive services for some populations, such as psychiatric hospital visits, 23-hour psychiatric observation, psychiatric residential, inpatient detoxification, and SUD residential rehabilitation, except for services provided in IMDs.
Outpatient services, such as case management, psychiatric evaluation, psychiatric testing, psychological testing, individual therapy, group therapy, family therapy, intensive outpatient, outpatient detoxification, methadone maintenance, Suboxone treatment, and medication evaluation, prescription, and management.
Home and community-based long-term services and supports, such as adult group homes, day treatment, partial hospitalization, psychosocial rehabilitation, supported housing, and supportive employment.
What Are the Patterns of Behavioral Health Treatment Among Nonelderly Medicaid Adults?
Most nonelderly Medicaid adults receiving behavioral health treatment do so in an outpatient setting, without any inpatient services. In 2017, inpatient services were used by just under half (46%) of nonelderly Medicaid adults with SUD who received drug or alcohol treatment in the past year (Figure 1). A smaller share (17%) of Medicaid enrollees with mental illness who received treatment used inpatient services. The data do not distinguish services provided in IMDs from those provided in other inpatient settings such as a general inpatient hospital.
Figure 1: Nonelderly Adults with Medicaid and Behavioral Health Diagnoses that Received Treatment in Past Year, by Service Type, 2017
Though nonelderly Medicaid adults with behavioral health needs are significantly more likely than those who are privately insured to have used inpatient and outpatient treatment services in the past year, treatment rates are low across all payers. Among nonelderly adults with SUD, those with Medicaid are more likely have used inpatient treatment services compared to those with private insurance (8% vs. 3%, Figure 2). Similarly, among nonelderly adults with any mental illness, those with Medicaid are more likely to have used inpatient treatment, compared to those with private insurance (6% vs. 2%). Nevertheless, treatment utilization rates (use of treatment services in past year by those with a behavioral health diagnosis), particularly for inpatient treatment, remain low across payers. Inpatient treatment rates are low even for private insurers who, unlike Medicaid, are not subject to the IMD payment exclusion.
Figure 2: Past-Year Treatment Utilization among Nonelderly Adults with Behavioral Health Diagnoses, by Insurance Status, 2017
Many people with behavioral health diagnoses report unmet treatment needs. Substantial shares of nonelderly adults with SUD and any mental illness report an unmet need for drug or alcohol treatment, with those with private insurance significantly more likely to have an unmet SUD treatment need compared to those with Medicaid (91% vs. 80%, Figure 3). The share of nonelderly Medicaid adults with SUD and any mental illness reporting an unmet need for mental health treatment is similar to those with private insurance (36% vs. 34%).
Figure 3: Perceived Unmet Treatment Need among Nonelderly Adults with Behavioral Health Diagnoses, By Insurance Coverage, 2017
Administrative data shows wide state variation in use of inpatient services among nonelderly Medicaid adults who receive mental health or substance use disorder services. In FY 2013, the share of nonelderly Medicaid adults receiving any behavioral health treatment who received any inpatient SUD services ranged from 10% in Alaska to 57% in West Virginia. The share of those receiving any inpatient mental health services ranged from 9% in Alaska to 31% in Alabama and New York (Appendix Table 1). Like the national data discussed above, the state-level data do not separately identify IMD services from other inpatient services. In addition, this data – which is the most recently publicly available – predates the Affordable Care Act’s Medicaid expansion and the opioid epidemic’s impact over the last six years, and consequently may understate the number of enrollees now utilizing these services in states that have implemented the expansion since 2014.3
What is the IMD Payment Exclusion and Its Exceptions?
Federal law generally bars states from receiving “any [Medicaid] payments with respect to care or services for any individual who has not attained 65 years of age and who is a patient in an [IMD].”4 The payment exclusion applies to services provided within an IMD as well as to services provided outside an IMD to nonelderly adult IMD patients. An IMD is a “hospital, nursing facility, or other institution of more than 16 beds, that is primarily engaged in providing diagnosis, treatment, or care of persons with mental diseases [sic], including medical attention, nursing care, and related services” (Figure 4).5 Whether a particular facility is an IMD is determined by the state. Figure 4 lists factors considered in this determination. While all states that choose to participate in the Medicaid program must cover inpatient hospital services, those services specifically exclude care provided in IMDs.6 The IMD payment exclusion applies to Medicaid enrollees ages 21 through 64. States have the option to cover inpatient psychiatric hospital services for those under age 217 and IMD inpatient hospital and nursing facility services for those age 65 and older.8
Figure 4: General availability of Medicaid-funded IMD services under federal law
There are four ways that states can receive federal Medicaid funds for IMD services for nonelderly adults. These include Section 1115 demonstration waivers, Medicaid managed care “in lieu of” authority, disproportionate share hospital (DSH) payments, and the SUPPORT Act9 state plan option (beginning in October 2019) (Figure 5). Box 2 discusses considerations for providing institutional services under the Americans with Disabilities Act, separate from Medicaid.
Figure 5: Avenues for states to access Medicaid funds for nonelderly adult IMD patients under federal law.
Box 2: Institutional Services and Community Integration
Waiving the IMD payment exclusion and expanding institutional services without also ensuring adequate access to community-based services could have implications for states’ community integration obligations under the Americans with Disabilities Act (ADA) if people with disabilities are inappropriately institutionalized.10 The Supreme Court’s Olmstead decision found that the unjustified institutionalization of people with disabilities violates the ADA. The ADA’s community integration mandate is separate from federal Medicaid law. However, states rely on Medicaid funding to help meet their ADA obligations, because Medicaid is the primary payer for long-term services and supports, including home and community-based services.11 Medicaid also is an important source of financing for behavioral health services, paying for 21% of SUD services and 25% of mental health services as of 2014.12 Consequently, even when providing IMD services to the extent permitted under federal Medicaid law or a waiver, states still separately must meet their independent community integration obligations under the ADA.
Section 1115 waivers
With the opioid epidemic increasing, CMS has been inviting states to apply for Section 1115 IMD SUD waivers,13with guidance released in 2015,14and revised in 2017.15 These waivers allow states to test using federal Medicaid funds to provide short-term inpatient and residential SUD treatment services in IMDs. Some of the requirements for these waivers have evolved over time (Figure 6). For example, unlike waivers approved under the 2015 guidance,16 waivers approved under the 2017 guidance do not explicitly limit the length of individual IMD stay.17 In addition, waivers under the 2015 guidance were contingent on states covering community-based SUD treatment services at the time of approval,18 while the 2017 guidance allows states up to two years after waiver approval to cover “critical levels of care.”19 As discussed in more detail below, more than half of states have an approved or pending IMD SUD payment waiver as of November 2019.
Figure 6: CMS’s Section 1115 IMD waiver guidance has evolved over time.
In addition to covering certain levels of care, the 2017 guidance incorporates other milestones that states must achieve during the term of an IMD SUD waiver (Figure 7).20 These include using evidence-based patient placement criteria; applying nationally recognized provider qualification standards; implementing prescribing guidelines and other strategies to address opioid abuse; and improving care coordination and transitions between levels of care.21 CMS’s 2019 IMD SUD waiver evaluation design guidance identifies SUD treatment access and utilization,22 health outcomes,23 and opioid-related overdose deaths as three key areas to assess.24
Figure 7: CMS’s Nov. 2017 IMD SUD waiver guidance specifies state milestones.
CMS also reversed long-standing policy and issued new guidance inviting states to apply for Section 1115 IMD payment waivers for mental health services in November 2018 (Figure 6).25 Until this point, CMS had not approved IMD mental health waiver requests in Illinois,26 Massachusetts,27 or North Carolina,28 citing its former policy not to allow Medicaid payments for individuals who receive only mental health treatment in IMDs.29 Under the new guidance, states will have to achieve a set of milestones over the term of these waivers, including ensuring institutional care quality, improving coordination and community transitions, increasing access to crisis stabilization, and earlier identification and engagement in treatment. States that previously had IMD mental health waiver requests that were not approved, as well as states with new requests, can apply for waivers under the 2018 guidance. As of November 2019, only one state (Vermont) has an approved Section 1115 IMD mental health waiver.
Managed care “in lieu of” authority
States with capitated managed care delivery systems can use “in lieu of” authority to cover IMD SUD and mental health services for up to 15 days per month.30 Specifically, states can use federal Medicaid funds for capitation payments to managed care plans that cover IMD inpatient or crisis residential services for nonelderly adults instead of providing other services, such as non-IMD inpatient or outpatient services, that are covered in the state plan benefit package.31 The IMD services must be medically appropriate and cost-effective, and enrollees cannot be required to accept IMD services instead of state plan services. This regulation took effect in July 2016,32 although it codified pre-existing long-standing federal sub-regulatory guidance that allowed federal Medicaid payments for IMD services. However, unlike the regulation, the former guidance did not subject IMD services covered under “in lieu of” authority to a day limit. Of the 41 states using comprehensive risk-based managed care organizations, 31 use Medicaid managed care “in lieu of” authority to cover IMD SUD and/or mental health services in both FY 2019 and FY 2020, and two (MS and NC) report plans to begin doing so in FY 2020.33 Two states reported using the authority in FY 2019 only (Appendix Table 3).34
Disproportionate Share Hospital payments
States can spend a portion of their Medicaid DSH funds on IMD services.35 States must make these payments to offset uncompensated care costs incurred by hospitals that serve a disproportionate number of low-income patients. In FY 2018, 33 states made DSH payments totaling $2.9 billion to mental health treatment facilities including IMDs. These payments ranged from 0.0003% of total DSH payments to mental health facilities in Minnesota to 18% in New York (Appendix Table 4).
Support Act state plan option
The SUPPORT Act partially lifts the IMD payment exclusion by allowing states to use federal Medicaid funds for nonelderly adults receiving IMD SUD services up to 30 days a year,36 from October 2019 through September 2023.37 IMD coverage under the SUPPORT Act option is in addition to IMD services covered under managed care in lieu of authority38 and Section 1115 waivers.39 To receive Medicaid payments under the SUPPORT Act option, IMDs must follow “reliable, evidence-based practices” and offer at least two forms of medication-assisted treatment (MAT) on-site40 for opioid use disorder. Separately, the SUPPORT Act also authorizes Medicaid payments for services provided outside IMDs for pregnant and post-partum women receiving IMD SUD services, as of October 2018.41
States must satisfy five criteria to qualify for Medicaid funds under the SUPPORT Act option (Figure 8). First, states have to maintain annual state and local funding levels42 for both IMD services and a specific list of community-based outpatient services43 provided to nonelderly adults who become eligible for Medicaid-funded IMD services under the new option. Additionally, states must ensure that nonelderly adults receive “appropriate evidence-based clinical screening” prior to receiving IMD SUD services.44 States also must confirm that IMDs receiving Medicaid payments can provide outpatient services, either themselves or through an established relationship with another facility or provider accepting Medicaid patients, to allow for successful community transitions.45 Finally, states electing the SUPPORT Act option must cover Medicaid SUD treatment services at four outpatient levels of care46 and at least two of five inpatient levels of care47 (Figure 9).
Figure 8: Federal requirements for states electing SUPPORT Act IMD option.Figure 9: Required substance use disorder treatment levels of care under SUPPORT Act IMD option.
According to a KFF survey, five states report plans to pursue the SUPPORT Act option in FY 2020.48 These states include Idaho, Indiana, New Hampshire, South Dakota, and Tennessee.49 Twenty-one states report that they have not yet determined if they will pursue the SUPPORT Act option,50 and 24 states indicate that they do not plan to pursue this option.51 In explaining the rationale for not pursuing this option, many states noted that they already had a Section 1115 waiver in place or were pursuing such a waiver to allow IMD funding.52 Several states also felt that their Section 1115 waiver would provide more flexible limits on length of IMD stays compared to the 30-day cap on IMD services under the SUPPORT Act option.53 Table 1 compares key elements of Section 1115 IMD waivers with the SUPPORT Act.
Table 1: Key Elements of Section 1115 Waivers vs. SUPPORT Act Option for IMD Payment
Program Element
Section 1115 Waiver
SUPPORT Act
Type of authority
Waiver
State plan option
Length of authority
Initial waivers usually granted for 5 years. States can apply for renewals, usually for 3 years.
Available from October 2019 through September 2023.
Type of IMD services allowed
SUD and/or mental health
SUD only
Length of stay
Varies by waiver: some numeric day limits, some unspecified, some require 30-day statewide average.
30 days per year
Covered inpatient levels of care
Must cover intensive residential/inpatient and medically supervised withdrawal management within 24 months of waiver approval.
Must cover at least 2 of 5 inpatient levels of care.
Covered outpatient levels of care
Must cover outpatient and intensive outpatient services within 24 months of waiver approval.
Must cover all 4 outpatient levels of care.
Institutional to community transitions
Must develop policies to link residential patients to community-based services.
Must ensure that IMD placement will allow for successful community transition.
Evidence-based practices
Must use evidence-based patient assessment and placement criteria and provide access to MAT.
Must follow evidence-based practices, including clinical screening and MAT.
Maintenance of effort
For SUD waivers, CMS encourages states to maintain current funding levels for a continuum of services; waivers should not reduce or divert state spending on behavioral health services. For mental health waivers, CMS will consider a state’s commitment to on-going maintenance of effort on funding outpatient community-based services when approving waivers.
Must maintain state and local funding levels for IMD and outpatient services.
How Are States Using Medicaid IMD Waivers?
The number of Section 1115 IMD SUD waiver approvals has markedly increased since January 2017. Four states had IMD SUD waivers approved by CMS as of December 31, 2016, and another 22 states have had IMD SUD payment waivers approved since then. Three more states have these waiver requests pending with CMS as of November 2019 (Figure 10 and Appendix Table 2).54 To date, Vermont remains the only state with an existing IMD mental health waiver, the current terms of which require those payments to phase out between 2021 and 2025.55 Vermont recently submitted a request to transition its existing mental health authority to the terms of the new guidance. Additionally, DC and Indiana have submitted pending waiver requests for IMD mental health services under the new guidance, with more states expected to follow. Idaho, Massachusetts, New Hampshire, New Jersey, North Carolina, and Rhode Island report plans to pursue an IMD mental health waiver in FY 2020, while Alaska, Connecticut, Virginia, and Washington report plans to do so after FY 2020.56
Figure 10: Approved and pending Section 1115 Medicaid IMD payment waivers, as of October 30th, 2019
While waiver evaluations are still underway, news reports, interim evaluations, and feedback directly from states can inform the ongoing implementation of IMD waivers. While some waiver evaluation results are emerging, most are not expected until 2024 or 2025 (Appendix Table 2).57 Given the attention to state efforts to combat the opioid epidemic and emerging focus on mental health, states are moving forward with waiver implementation. State experience with these initiatives can help inform policy choices and design as other states consider similar waivers. To make some of this information available in advance of formal waiver evaluations, we conducted case studies in two states and one county. Table 2 summarizes the waivers in the three case study areas, and Box 3 describes the case study methodology.
Table 2: Key Components of Approved 1115 Waivers for California, Virginia, and Vermont
State
California
Virginia
Vermont
Waiver/Program Name
Drug Medi-Cal Organized Delivery System (DMC-ODS)
The Virginia GAP and ARTS Delivery System Transformation
12/31/2021 for SUD; mental health to phase-out by 2025 (pending mental health waiver submitted to CMS)
SUD Authority
✓
✓
✓
Mental Health Authority
✓
Day Limit
30-day statewide average; 90 day max.
30-day statewide average
30-day statewide average
SOURCE: KFF analysis of Section 1115 waivers for the IMD Payment Exclusion
Box 3: Overview of Case Study Areas
Because waiver evaluations are ongoing and there is limited information about states’ experiences and outcomes with IMD waivers to date, we conducted case studies in Vermont; San Diego County, California; and Virginia, to provide a snapshot of how these three areas are using IMD waivers and identify common themes and lessons learned. In July 2019, we interviewed state and county officials by phone. We also reviewed publicly available waiver approval, reporting, and evaluation documents. Because San Diego County’s program is part of the California waiver, we also include relevant findings from the overall California waiver evaluation and other California waiver documents as relevant. In addition to considering geographic and political diversity, we chose case study regions to enable us to examine state experiences based on the type of IMD waiver authority (SUD and/or mental health), whether the waiver was approved under the 2015 or 2017 CMS guidance, and duration of implementation (Table 2).
Vermont has long-standing experience with using federal Medicaid funds for both IMD SUD and mental health services, through a Section 1115 waiver dating back to 1996. Vermont’s SUD authority is currently authorized under CMS’s 2017 guidance. Although the current waiver requires Vermont to phase-out IMD mental health funding between 2021 and 2025,60 the state has applied for IMD mental health waiver authority under the 2018 guidance. San Diego County began offering IMD SUD services in July 2018, and is one of the 40 counties participating in California’s Section 1115 waiver Drug Medi-Cal Organized Delivery System pilot program, which was approved under the 2015 guidance.61 Virginia added the Addiction and Recovery Treatment Services (ARTS) Delivery System Transformation Demonstration program, which includes IMD SUD services, to its Section 1115 waiver effective April 2017. Virginia’s waiver initially was approved under the 2015 CMS guidance, although the state subsequently came into compliance with the 2017 guidance.62
Role of Community-Based Services
Interviews with case study areas implementing IMD waivers reveal that some expanded community-based treatment services in addition to IMD services. Notably, Virginia used state funds that previously went to IMD services to finance additional community-based SUD services to complement the IMD SUD services authorized by its waiver. Specifically, Virginia used state plan authority to add recovery supports and expanded medication-assisted treatment to the intensive outpatient, partial hospitalization, and residential levels of care. In addition to IMD residential services, California’s waiver adds enhanced SUD community-based services in the participating counties, including case management, withdrawal management, recovery services, physician consultation, and at county option, additional MAT drugs and partial hospitalization. Without the waiver, the California Medicaid state plan benefit package is limited to outpatient, intensive outpatient, perinatal residential (non-IMD), and opioid treatment program services. Other states not included as case studies for this report similarly expanded community-based services either under or in conjunction with their waivers authorizing payment for IMD services, such as West Virginia,63 Kansas,64 Illinois,65 Alaska,66 Indiana,67 and Wisconsin.68 However, at least one state (Kentucky) has restricted access to some community-based services (methadone) while funding IMD services under its waiver.69
While states believe that newly added community-based services are essential to achieving their waiver goals, utilization of some of the new services during initial implementation has not been as high as expected. Respondents noted that use of recovery supports (Virginia and California)70 and case management (California)71 has been low. As waiver implementation continues, these states are focused on additional provider training to increase new service utilization and improve treatment continuity as enrollees transition among care settings.
States are making efforts to address transitions between inpatient and outpatient care settings. California’s managed care external quality review report recommends that SUD providers at both residential and outpatient levels of care be allowed to bill for services provided to an individual on the same day to align with evidence-based best practices that call for introducing a patient to new treatment staff at least twice before residential discharge.72 This practice is intended to smooth care transitions and increase the rate of community-based treatment engagement after residential discharge. Having implemented bundled payments for episodes of care in 2019, Vermont is transitioning to value-based payments for IMD SUD services by January 2021, seeking to eliminate incentives for longer residential stays resulting in higher provider payments. The model is designed to encourage providers to engage in effective discharge planning, with payment disincentives for rapid readmissions. Virginia requires providers to include comprehensive transition plans and coordination of current care and post-discharge plans related to community services in their treatment plan to ensure continuity of care upon discharge with the individual’s family, school and community.
Provider Networks and Service Delivery Changes
In addition to covering new services, states took steps to expand or maintain IMD residential provider networks for SUD services. San Diego County has worked to develop its residential provider network, while Vermont is focused on maintaining its long-standing network. One challenge in San Diego and other California counties has been helping residential providers establish the record keeping and quality improvement initiatives needed to successfully bill for Medicaid services.73 San Diego’s initiatives in this area include “gentle” reimbursement withholding incentives, in which a portion of provider payment is delayed until certain performance standards are met. San Diego also has spent substantial county staff time offering technical assistance to providers and introduced advance payments so that providers had funding available upfront to establish the needed administrative infrastructure.
States also worked to expand their community-based provider networks and increase payment rates. Virginia has been able to use state funds to fund “significant” provider rate increases for intensive outpatient and partial hospitalization services intended to build the Medicaid provider network. California’s waiver broadens the range of approved SUD treatment providers and allows counties to pay providers at higher than state plan rates to account for geographic differences and encourage providers to add capacity.74
All three areas also have initiatives to improve care coordination across providers to help ensure that enrollees remain connected to care as required under waiver guidance and milestones. For example, Virginia added a new office-based treatment program benefit, which co-locates a buprenorphine waivered provider and a licensed mental health provider, and includes reimbursement for care coordination. Virginia also changed its policy to allow both medical and SUD providers to bill for services for the same patient on the same day. This change was identified as a lesson learned to incentivize engaging patients in SUD treatment when they come in for other needed care. For example, a pregnant woman may see both an obstetrician and an MAT provider on the same day. San Diego County is including peer advocates and social work staff alongside doctors in emergency departments to help connect patients to community-based treatment after discharge.
Utilization and Participation
Evaluation results in all three areas show increased treatment service utilization and provider participation. Results from the first year (April 2017 to March 2018) of waiver implementation in Virginia found that the number of outpatient providers billing for ARTS services increased by 173%;75 the number of Medicaid enrollees who used SUD treatment services increased by 57%;76 and more than 40% of enrollees with SUD received treatment, up from 24% in the prior year.77 In the seven counties that began service delivery in 2017, California’s waiver evaluation found that the number of people accessing treatment increased by about 7%.78 In the three counties included in the California waiver’s managed care external quality review report, the number of enrollees receiving SUD services nearly tripled in the first year of waiver implementation, compared to pre-waiver baseline claims data.79 While not yet included in California’s waiver evaluation findings, San Diego County anecdotally reports a 40 to 50% increase in the number of patients receiving SUD treatment services on both an inpatient and outpatient basis since waiver implementation in July 2018, compared to the corresponding month in the prior year. Vermont’s evaluation for 2013 to 2016 found that rates of initiation and engagement in community-based treatment post inpatient discharge for enrollees who had received IMD services exceeded both the general Vermont Medicaid rate and the national rate for both SUD and psychiatric services.80
California’s waiver evaluation found notable gains in access to residential treatment that could not have been financed by Medicaid without the waiver.81 Additionally, the California waiver’s managed care external quality review report notes that without the IMD payment authority, “[a]pproximately 80 percent of the residential facilities in California would not have qualified for [Medicaid] reimbursement, thus severely limiting treatment options.”82 As of March 2019, San Diego County reported adding 67 IMD beds, which has reduced the number of patients waiting for services.83
Evaluation results also have found decreases in emergency room visits and inpatient hospitalizations. From 2013 through 2016, Vermont’s interim waiver evaluation found that emergency room use within 30-days post-IMD discharge declined compared to emergency room use prior to the IMD admission for both mental health services (with declines ranging from 23 to 44%)84 and SUD services (with declines ranging from 39 to 56%).85 Psychiatric IMD readmission rates averaged 8% after 30 days over the four years, while SUD readmission rates were under 15% across settings (general hospital detox, IMD detox, and IMD residential) during this period.86 During the first 10 months of waiver implementation in Virginia, the number of emergency department visits related to SUD decreased by 14%, and the number of Medicaid enrollees with an acute inpatient admission related to SUD decreased by 4%.87
Implementation Limitations and Challenges
States report that existing IMD authority and policy may limit their efforts to address unique needs of special populations, such as pregnant women and individuals in the criminal justice system. With Vermont’s transition from its older waiver authority to waivers under the more recent CMS guidance, the state will no longer be able to use federal Medicaid funds for a specialized residential treatment facility that serves pregnant women and new mothers and infants. That care delivery model is based on a length of stay of 12 to 18 months, with an average length of stay of six months from 2013 through 2016.88 As a result, including this one program would cause the statewide average length of stay to exceed the 30 days approved in Vermont’s waiver. San Diego County and Virginia both reported unexpected challenges where the courts were ordering defendants to residential SUD treatment instead of incarceration, without regard to the evidence-based placement criteria adopted under the waiver that instead called for outpatient treatment.89 In both cases, Medicaid staff had to educate the courts about the need to order a medical evaluation to determine the appropriate level of care instead mandating residential care in all circumstances.
States report that waiver terms about IMD lengths of stay may not align with current evidence-based or state practices. California’s external quality review report found that the waiver’s limit of two IMD stays per year may be too restrictive because patients often do not complete their initial residential treatment visits, instead leaving in the first week to 10 days, but then later return when they are ready to commit to treatment.90 The report notes that current clinical criteria call for residential treatment to stabilize SUD issues, followed by partial hospitalization or intensive outpatient services, but do not limit residential treatment to two stays per year. In contrast, Virginia’s waiver initially included a 90-day maximum IMD stay, but CMS subsequently removed that provision, recognizing that stays tend to be longer at the lower levels of residential care where the focus is more on supportive services and less on clinical care. While Vermont finds that a 30-day average statewide length of stay is appropriate for SUD treatment, it believes that this limit will be too limiting for mental health treatment, especially with CMS’s newly cited position that federal Medicaid funds will be limited to individual IMD stays that do not exceed 60 days. Vermont’s state hospital serves patients with the most severe needs that can take “substantially longer to stabilize;” the average length of stay there is 120 days. Vermont will be able to meet CMS’s 30-day statewide average requirement by averaging that facility’s stays with another IMD that has more beds and serves patients with less acute needs. However, Vermont is concerned that its ability to use federal Medicaid funds for most of its state hospital patients will be limited because CMS has newly proposed that Medicaid cannot fund individual IMD stays that exceed than 60 days.
States are considering non-waiver exemptions to the IMD waivers, in part due to the time limited nature of waivers. For example, while Vermont reports that its IMD SUD waiver is working well, it also is considering pursuing the SUPPORT Act state plan option. While “largely redundant” of its existing waiver, the state sees the state plan option as more of a “long-term assurance” to have IMD payment authority in place. Virginia noted that it decided to add SUD community-based services using state plan rather than waiver authority as a way of “securing” those services as waivers are not permanent.
States are drawing on their experience with IMD SUD waivers to inform their consideration of whether to pursue and how to design an IMD mental health waiver. Before applying for an IMD SUD waiver, Virginia reviewed its existing Medicaid SUD benefits to determine what was working well and whether there were other evidence-based services that could be added to the benefit package to establish a robust community-based continuum of care. Now, Virginia is similarly assessing its Medicaid-covered mental health services. The state plans to establish a solid community-based services foundation first and then pursue a future IMD mental health waiver. After largely deinstitutionalizing its mental health services over the past 30 years,91 Vermont is working to retain a minimum capacity for patients with the most acute needs.92 The state is concerned that losing its current IMD mental health capacity under the existing federal funding phase-out plan will strain its community-based providers, who would be challenged by having to serve patients with more severe needs and as a result have less capacity to serve those with less severe needs. In Vermont’s experience, providing institutional care for the most acute patients reserves community-based services for those who do not need institutional care.
Looking Ahead
Many people with behavioral health diagnoses report unmet treatment needs, with substantial shares of nonelderly adults with SUD and any mental illness reporting an unmet need for drug or alcohol treatment. Though treatment utilization among nonelderly Medicaid adults with behavioral health needs is greater than the privately insured, treatment rates are low across all payers. Enabling states to access federal Medicaid funds for inpatient SUD and mental health treatment could help to address some of this unmet need and help states to cover services that reflect current evidence-based treatment standards. Additionally, providing federal matching funds for IMD services can free up state dollars previously spent on inpatient treatment to instead fund corresponding expansions in community-based services across the behavioral health care continuum. By law, state initiatives to expand behavioral health services cannot solely focus on inpatient services and instead also must consider community-based services, given states’ community integration obligations under the Americans with Disabilities Act. Thus, state expansion of behavioral health services under efforts to fund IMDs may also address demonstrated unmet treatment needs for outpatient behavioral health services.
The number of states with Section 1115 IMD SUD payment waivers has increased dramatically since 2017, now comprising over half the states. DC, Indiana, and Vermont have submitted applications seeking an IMD mental health payment waiver under the new guidance to date, other states have expressed interest, and more applications are likely to follow. In addition, the SUPPORT Act option for IMD SUD services is newly available to states in October 2019, with a few states expressing interest to date. All three case study areas in this report reported overall positive experiences with their waivers, supported by early evaluation findings, along with some implementation challenges that had to be resolved. Notably, all three areas had devoted substantial time and resources to expanding and strengthening a robust network of community-based SUD treatment services in addition to IMD services. Policymakers reported that receiving federal Medicaid funds for IMD services under the waivers can allow state and local funds to be used to expand community-based service options, increase provider payment rates, and develop other necessary program features that Medicaid does not fund, such as housing.
Given the widespread use of SUD waivers, and the notable policy change now allowing mental health waivers, states, health plans, providers, and enrollees will be interested in evaluation results assessing the waivers’ impact. Key questions include how allowing states to use federal Medicaid funds for IMD services affects access to and utilization of inpatient and outpatient care, health outcomes, care quality, costs, IMD day limits, discharge planning and care transitions, and the continued evolution of evidence-based best practices for SUD and mental health treatment. States may draw on their IMD SUD waiver experience to inform their design and implementation of IMD mental health waivers, and many enrollees have co-occurring SUD and mental health conditions. Still, it is not entirely clear how states’ IMD SUD experience will translate to IMD mental health waivers, given differences in providers and different requirements in CMS guidance. CMS and states may implement policy changes that represent lessons learned based on states’ mid-point assessments toward their waiver milestones. While some waiver evaluation results are emerging, most are not expected until 2024 or 2025. In the meantime, states’ quarterly and annual waiver reports to CMS and interim evaluation findings can provide important information about the waivers’ impact to inform whether CMS makes further Medicaid IMD policy changes and/or whether Congress acts to amend the statute.
This work was supported in part by the Milbank Memorial Fund. We value our funders. KFF maintains full editorial control over all of its policy analysis, polling, and journalism activities. The authors appreciate the time that public officials in Vermont; San Diego County, California; and Virginia, as well as members of the Fund’s Reforming States Group Inpatient Mental Health Financing Workgroup (Nick Macchione, San Diego County; Becky Pasternik-Ikard, Oklahoma; Sue Birch, Washington; Duane Mayes, Alaska; Judy Lee, North Dakota; Kate McEvoy, Connecticut; and Tom Alexander, South Carolina), spent sharing their experience and expertise.
Medicaid Behavioral Health Glossary: Key Terms and Concepts
Care Continuum: An integrated system of care that guides and tracks patients over time through a comprehensive array of health services spanning all levels of care.93
Community-based care: Healthcare provided in the home or another community setting and that typically allows the person to stay in their home rather than moving them to a facility to receive care. Examples include home health aides, case management services, and personal care services.94
Disproportionate Share Hospital (DSH) payments: Payments required by federal law from state Medicaid programs to qualifying hospitals that serve a large number of Medicaid and uninsured individuals.95
Inpatient Treatment: Healthcare provided upon admission to a facility, such as a hospital. Typically treats more severe diagnoses, provides 24-hour medical and emotional support, and involves the patient staying in the facility for an extended period of time.
Institution of Mental Disease: Hospital, nursing facility, or other institution of more than 16 beds, that is primarily engaged in providing diagnosis, treatment, or care of persons with mental diseases, including medical attention, nursing care, and related services.96
Institutional Care: Healthcare provided in an institutional setting such as a nursing facility, mental health institution, or an intermediate care facility for individuals with intellectual disability.
Medicaid Managed Care: Delivery system for Medicaid covered services by health plans that accept a set capitated payment for these services through a contract with the state Medicaid agency.97
Olmstead case: 1999 Supreme Court decision that found that the unjustified institutionalization of people with disabilities is illegal discrimination. Requires states to eliminate unnecessary segregation and ensure that persons with disabilities receive services in the most integrated setting appropriate to their needs.98
Outpatient Treatment: Healthcare provided in a part-time setting that allows the patient to continue their day-to-day activities outside of treatment. Typically allows the patient to maintain a more normal daily routine and relies more heavily on social circle support.
Section 1115 Demonstration Waiver: Authority by which HHS Secretary can allow states to test new approaches in Medicaid that differ from what is required by federal statute.99
Serious Emotional Disturbance: Someone under the age of 18 with a diagnosable mental, behavioral, or emotional disorder in the past year, which resulted in functional impairment that substantially interferes with or limits their role or functioning in family, school, or community activities.100
Serious Mental Illness: Someone over the age of 18 with a diagnosable mental, behavior, or emotional disorder that causes serious functional impairment that substantially interferes with or limits one or more major life activities.101
Substance Use Disorder: Recurring use of alcohol or drugs that causes significant clinical and functional impairment.102
SUPPORT Act: Federal law partially lifting the IMD payment exclusion by allowing states to use federal Medicaid funds for nonelderly adults receiving IMD SUD services up to 30 days a year, from October 2019 through September 2023.103
Appendix Table 1: Medicaid Beneficiaries Aged 21-64 Receiving SUD and/or Mental Health Services – Inpatient vs. Outpatient Care, FY2013
State
Enrollees Receiving Only SUD Services:
Enrollees Receiving Only Mental Health Services
Enrollees Receiving Both SUD and Mental Health Services:
Total Enrollees Receiving Mental Health or SUD Services
Total
Only Inpatient Care
Only Outpatient Care
Both Inpatient and Outpatient Care
Total
Only Inpatient Care
Only Outpatient Care
Both Inpatient and Outpatient Care
Total
Only Inpatient Care
Only Outpatient Care
Both Inpatient and Outpatient Care
National
989,200
17%
76%
7%
4,687,300
4%
86%
10%
1,134,900
5%
53%
43%
6,839,800
Alabama
19,300
16%
73%
11%
48,500
8%
79%
13%
21,500
6%
45%
49%
89,300
Alaska
3,100
3%
94%
3%
9,300
2%
92%
5%
2,700
0%
85%
15%
15,000
Arizona
25,100
16%
76%
8%
113,000
3%
88%
9%
25,600
3%
55%
41%
163,800
Arkansas
6,200
2%
95%
3%
41,700
1%
90%
9%
6,600
0%
80%
20%
54,500
California
52,300
5%
92%
3%
473,200
1%
94%
5%
42,500
0%
82%
18%
568,100
Colorado
FY2013 data not available
Connecticut
16,700
17%
77%
6%
87,600
3%
86%
11%
21,500
4%
53%
43%
125,700
Delaware
5,700
16%
79%
5%
22,100
5%
86%
9%
5,700
7%
44%
49%
33,400
District of Columbia
9,000
12%
82%
6%
21,100
2%
90%
8%
6,800
1%
62%
37%
36,900
Florida
50,000
22%
69%
9%
203,900
9%
79%
12%
51,900
10%
39%
51%
305,800
Georgia
19,300
28%
63%
9%
102,200
6%
84%
10%
21,300
8%
41%
51%
142,700
Hawaii
5,600
13%
82%
5%
24,600
1%
93%
6%
4,400
2%
61%
36%
34,700
Idaho
3,800
13%
82%
5%
20,900
5%
85%
10%
6,100
5%
51%
44%
30,900
Illinois
44,200
18%
73%
9%
197,900
4%
83%
13%
45,300
4%
43%
53%
287,300
Indiana
21,100
18%
73%
9%
100,400
4%
84%
12%
32,600
4%
52%
45%
154,200
Iowa
6,000
22%
72%
7%
50,500
4%
84%
12%
8,800
5%
49%
47%
65,200
Kansas
1,900
21%
74%
5%
15,300
5%
90%
6%
1,600
6%
56%
38%
18,900
Kentucky
28,400
10%
82%
8%
75,600
5%
86%
9%
34,200
5%
58%
37%
138,200
Louisiana
17,800
13%
81%
6%
77,600
3%
84%
13%
16,400
2%
59%
40%
111,800
Maine
12,000
4%
91%
5%
51,800
2%
91%
8%
23,000
1%
70%
28%
86,900
Maryland
15,600
19%
76%
6%
108,000
3%
87%
10%
17,200
4%
49%
47%
140,900
Massachusetts
26,100
13%
80%
7%
217,900
2%
88%
10%
50,400
2%
51%
47%
294,500
Michigan
49,600
13%
82%
6%
190,700
3%
87%
10%
50,200
3%
64%
33%
290,500
Minnesota
27,400
8%
85%
7%
148,400
1%
90%
8%
47,500
1%
64%
35%
223,400
Mississippi
9,100
29%
63%
9%
50,200
4%
84%
12%
9,600
5%
38%
57%
69,000
Missouri
18,300
8%
86%
5%
102,200
2%
88%
10%
24,600
1%
66%
33%
145,200
Montana
2,000
15%
75%
10%
12,600
4%
86%
10%
3,400
3%
56%
41%
17,800
Nebraska
3,000
20%
73%
7%
22,200
4%
84%
13%
4,300
5%
47%
49%
29,600
Nevada
2,900
28%
66%
7%
15,700
4%
87%
9%
3,600
6%
42%
53%
22,200
New Hampshire
1,800
11%
83%
6%
19,300
3%
90%
8%
4,300
2%
63%
35%
25,500
New Jersey
10,700
17%
78%
6%
82,100
3%
88%
9%
12,700
3%
49%
48%
105,500
New Mexico
5,700
18%
74%
9%
44,500
3%
90%
7%
7,500
3%
55%
43%
57,700
New York
133,300
27%
64%
9%
514,400
6%
80%
14%
162,700
7%
37%
56%
810,400
North Carolina
29,800
17%
76%
7%
115,600
5%
88%
8%
24,500
5%
59%
36%
169,900
North Dakota
1,000
20%
70%
10%
8,100
4%
85%
11%
1,500
7%
47%
47%
10,500
Ohio
82,000
9%
85%
6%
243,000
3%
86%
11%
87,000
2%
59%
38%
412,100
Oklahoma
13,300
18%
75%
7%
68,900
4%
87%
9%
18,400
4%
53%
43%
100,700
Oregon
17,100
7%
87%
6%
67,900
3%
90%
7%
20,500
1%
72%
27%
105,500
Pennsylvania
41,900
22%
73%
5%
133,700
10%
83%
7%
30,900
17%
49%
34%
206,400
Rhode Island
2,200
23%
68%
9%
22,400
3%
86%
12%
3,900
3%
51%
46%
28,500
South Carolina
16,200
20%
73%
7%
53,800
5%
87%
8%
12,500
6%
54%
39%
82,400
South Dakota
1,000
20%
70%
10%
9,800
4%
85%
11%
1,400
0%
50%
50%
12,300
Tennessee
33,200
17%
78%
5%
113,200
6%
86%
8%
35,400
7%
53%
40%
181,600
Texas
27,800
29%
62%
9%
196,400
5%
82%
12%
33,100
7%
40%
53%
257,200
Utah
2,900
17%
76%
7%
31,900
4%
86%
10%
4,100
2%
56%
41%
39,000
Vermont
3,500
17%
80%
3%
24,200
3%
91%
6%
4,400
7%
52%
41%
32,100
Virginia
17,200
34%
58%
8%
81,200
6%
80%
13%
22,800
8%
39%
52%
121,100
Washington
19,000
13%
81%
7%
104,800
3%
91%
6%
25,100
3%
67%
30%
148,900
West Virginia
5,000
34%
56%
10%
48,100
3%
87%
10%
8,700
6%
36%
59%
61,900
Wisconsin
23,700
10%
85%
5%
115,900
3%
90%
8%
26,900
3%
62%
35%
166,500
Wyoming
1,100
18%
73%
9%
5,400
6%
85%
9%
1,200
8%
50%
42%
7,700
NOTES: FY 2013 data for Colorado and Rhode Island are unavailable. RI data is FY 2012. Kansas has only 1 quarter of FY 2013 data available. North Carolina has only 3 quarters of FY 2013 data available. Totals may not sum due to rounding.SOURCE: KFF analysis of FY2013 Medicaid Statistical Information System.
Appendix Table 3: States Using Medicaid Managed Care “in lieu of” Authority to Fund IMD Services in FY2019 and/or FY2020
Managed Care States (41 states)
Using “in lieu of” Authority?
TOTAL
35
Arizona
✓
Arkansas
✓
California
Colorado
✓
Delaware
✓
District of Columbia
✓
Florida
✓
Georgia
Hawaii
✓
Illinois
✓
Indiana
✓
Iowa
✓
Kansas
Kentucky
✓
Louisiana
✓
Maryland
Massachusetts
✓
Michigan
✓
Minnesota
✓
Mississippi^
✓
Missouri
✓
Nebraska
✓
Nevada
✓
New Hampshire
✓
New Jersey
✓
New Mexico
✓*
New York
✓
North Carolina^
✓
North Dakota
Ohio
✓
Oregon
✓
Pennsylvania
Rhode Island
✓
South Carolina
✓
Tennessee
✓
Texas
✓
Utah
✓
Virginia
✓
Washington
✓
West Virginia
✓*
Wisconsin
✓
Non Managed Care States (10 states)
Alabama
Alaska
Connecticut
Idaho
Maine
Montana
Oklahoma
South Dakota
Vermont
Wyoming
NOTES: *NM and WV in FY 2019 only. ^MS and NC in FY 2020 only. NC did not have managed care in FY 2019.SOURCE: KFF 50-state Budget Survey for SFY 2019 and 2020.
Nonelderly adults are ages 21-64. “Mental disease” is an antiquated term used in the statute. It comprises “diseases listed as mental disorders in the International Classification of Diseases with the exception of mental retardation [sic], senility, and organic brain syndrome,” including the Diagnostic and Statistical Manual of Mental Disorders, and encompasses alcoholism and other chemical dependency syndromes. CMS State Medicaid Manual § 4309 (D), (E), https://www.cms.gov/Regulations-and-Guidance/guidance/Manuals/Paper-Based-Manuals-Items/CMS021927.html. ↩︎
42 U.S.C. § 1396d (i). “Whether an institution is an [IMD] is determined by its overall character as that of a facility established and maintained primarily for the care and treatment of individuals with mental diseases [sic], whether or not it is licensed as such.” 42 C.F.R. § 435.1010. IMDs do not include institutions for people with intellectual disabilities. Id. Whether a particular facility is considered an IMD is based on an assessment of various factors, such as licensure or accreditation as a psychiatric facility; falling under the state’s mental health authority jurisdiction if the facility serves people with mental illness; specializing in providing psychiatric or psychological care and treatment (based on “thorough review” of patient records, an “unusually large” proportion of staff with specialized psychiatric/psychological training, or a large proportion of patients receiving psychopharmacological drugs); and the need for institutionalization resulting from “mental diseases [sic]” for more than 50% of the facility’s patients. CMS State Medicaid Manual § 4309 (C), https://www.cms.gov/Regulations-and-Guidance/guidance/Manuals/Paper-Based-Manuals-Items/CMS021927.html. Other relevant factors also may be considered, such as whether the average age of patients in a nursing facility is significantly lower than a typical nursing facility. Id. Components of entities that are certified as different provider types, such as nursing facilities and hospitals, are considered independent from each other and assessed separately. Id. § 4309 (B). ↩︎
Section 1115 of the Social Security Act allows the Health and Human Services Secretary to waive certain provisions of federal Medicaid law for an “experimental, pilot, or demonstration project” that “is likely to assist in promoting the objectives of” the program. 42 U.S.C. § 1315 (a). Section 1115 waiver authority is limited to provisions contained in 42 U.S.C. § 1396a, while the IMD payment exclusion is contained in 42 U.S.C. § 1396d. However, the Secretary has approved IMD payment waivers under Section 1115 expenditure authority, which has been interpreted to independently permit the “costs of such [demonstration] project[s] which would not otherwise be included as [federal Medicaid] expenditures. . . [to] be regarded as expenditures under the State [Medicaid] plan. . . .” 42 U.S.C. § 1315 (a)(2). ↩︎
Waivers issued under the 2015 guidance included specific day limits on IMD stays eligible for federal Medicaid funds: Maryland’s waiver allows two 30-day stays, while California has approval for two 90-day stays for adults and two 30-day stays for adolescents. California allows a one-time 30-day extension if medically necessary, and peri-natal patients may stay for the duration of pregnancy and 60 days post-partum. California’s waiver notes that the average length of stay is 30 days. ↩︎
Medicaid community-based behavioral health services can be covered under state plan or waiver authority. The 2015 guidance required states to cover community-based services along with short-term institutional services that “supplement and coordinate with, but do not supplant, community-based services. CMS, New Service Delivery Opportunities for Individuals with a Substance Use Disorder, SMD #15-003, (July 27, 2015), https://www.medicaid.gov/federal-policy-guidance/downloads/smd15003.pdf. ↩︎
These include increased referrals to and engagement in treatment, increased adherence to treatment, and reduced preventable or medically inappropriate emergency department and inpatient treatment. ↩︎
These include improved access to care for physical health conditions and fewer preventable or medically inappropriate SUD readmissions. ↩︎
Letter from CMS CMCS Acting Director Tim Hill to MassHealth Assistance [sic] Secretary Daniel Tsai at 3 (June 27, 2018), https://www.medicaid.gov/Medicaid-CHIP-Program-Information/By-Topics/Waivers/1115/downloads/ma/ma-masshealth-ca.pdf. Massachusetts’ approved waiver includes IMD payments as part of the safety net care pool (authorizing payments according to the waiver’s uncompensated cost limit protocol for otherwise covered services for IMD patients at inpatient psychiatric hospitals and community-based detoxification centers as part of the DSH-like Pool) (¶ ¶ 21, 54(a)(i)(3); see also Attachment E, Charts A and B and Attachment H Safety Net Care Pool Uncompensated Care Cost Limit Protocol); for diversionary behavioral health services including those provided by IMDs as part of the managed care benefit package (including acute substance abuse treatment services and substance abuse clinical support services in 24-hour facilities for nonelderly adults) (¶ 40, Table C); and for additional IMD SUD services (clinically managed population-specific high-intensity residential services (specialized treatment services to meet more complex needs) and clinically managed low-intensity residential services (24-hour transitional support services and 24-hour residential rehabilitation services and community-based family SUD treatment services) in 24-hour facilities) (¶ 41, Table D). CMS, MassHealth Medicaid Section 1115 Demonstration Special Terms and Conditions, No. 11-W-00030/1 (approved July 1, 2017-June 30, 2022, amended June 27, 2018), https://www.medicaid.gov/Medicaid-CHIP-Program-Information/By-Topics/Waivers/1115/downloads/ma/ma-masshealth-ca.pdf. In September, 2017, Massachusetts sought an amendment that would have waived all federal payment restrictions on IMD mental health and SUD services for nonelderly adults, including the 15-day managed care limit and the safety net care pool expenditure caps. Commonwealth of Mass. Exec. Office of Health and Human Servs., Office of Medicaid. MassHealth Section 1115 Demonstration Amendment Request (Sept. 8, 2017), https://www.medicaid.gov/Medicaid-CHIP-Program-Information/By-Topics/Waivers/1115/downloads/ma/ma-masshealth-pa3.pdf. In June, 2018, CMS denied the state’s request to expand the IMD payment waiver beyond the terms already approved. ↩︎
Another state (Maryland) indicated that CMS denied its request for IMD mental health payment waiver authority, while approving its request for IMD SUD payment authority. GAO, States Fund Services for Adults in Institutions for Mental Disease Using a Variety of Strategies, GAO-17-652 at 34 (Aug. 2017), https://www.gao.gov/assets/690/686456.pdf. ↩︎
DSH payments to IMDs are limited to the lesser of the state’s FY 1995 DSH payment to IMDs and other mental health facilities or one-third of the state’s FY 1995 DSH allotment. 42 U.S.C. § 1396r-4 (h); GAO, States Fund Services for Adults in Institutions for Mental Disease Using a Variety of Strategies, GAO-17-652 at 34 (Aug. 2017), https://www.gao.gov/assets/690/686456.pdf. ↩︎
The 30 days do not need to be consecutive. H.R. 6, § 5052 (a)(2) (creating new Social Security Act § 1915 (l)(2)). ↩︎
H.R. 6, § § 5051-5052; see also Kaiser Family Foundation, Federal Legislation to Address the Opioid Crisis: Medicaid Provisions in the SUPPORT Act (Oct. 2018), https://modern.kff.org/medicaid/issue-brief/federal-legislation-to-address-the-opioid-crisis-medicaid-provisions-in-the-support-act/. The new state plan option authorizes Medicaid funding for 30 days of services provided in IMDs as well as for other medically necessary services provided outside IMDs to IMD patients. H.R. 6, § 5052 (a)(2) (creating new Social Security Act § 1915 (l)(6)). ↩︎
H.R. 6, § 5052 (a)(2) (creating new Social Security Act § 1915 (l)(5)). ↩︎
H.R. 6, § 5052 (b) (noting that the new state plan option is not be to be construed as preventing states from conducting Section 1115 demonstration waivers to improve access to and quality of SUD treatment for nonelderly adults). ↩︎
H.R. 6, § 5052 (a)(2) (creating new Social Security Act § 1915 (l)(7)(C)). MAT must include at least one antagonist (e.g., naltrexone) and one partial agonist (e.g., buprenorphine). Methadone is a full agonist. SAMHSA, Medications for Opioid Use Disorder for Healthcare and Addiction Professionals, Policymakers, Patients, and Families Treatment Improvement Protocol 63 at Exhibit 1-1 (2018), https://store.samhsa.gov/shin/content/SMA18-5063FULLDOC/SMA18-5063FULLDOC.pdf. ↩︎
H.R. 6, § 1012; see also CMCS Informational Bulletin, State Guidance for the New Limited Exception to the IMD Exclusion for Certain Pregnant and Postpartum Women included in Section 1012 of the Substance Use-Disorder Prevention that Promotes Opioid Recovery and Treatment (SUPPORT) for Patients and Communities Act (Pub. L. 115-271), entitled Help for Moms and Babies (July 26, 2019), https://www.medicaid.gov/federal-policy-guidance/downloads/cib072619-1012.pdf. ↩︎
State and local funding must remain at the level for the most recent fiscal year prior to SUPPORT Act enactment or the most recently ended fiscal year as of the date the state submits a state plan amendment to elect the new option, if higher. H.R. 6, § 5052 (a)(2) (creating new Social Security Act § 1915 (l)(3)(A)). States must verify compliance with the maintenance of effort requirement before a SUPPORT Act SPA can be approved. Id. The Secretary is to establish a process for state reporting within 8 months of enactment. Id. ↩︎
The maintenance of effort provision applies to outpatient and community-based SUD treatment services; evidence-based recovery and support services; clinically directed therapeutic treatment to facilitate recovery skills, relapse prevention, and emotional coping strategies; outpatient MAT, related therapies, and pharmacology; counseling and clinical monitoring; outpatient withdrawal management and related treatment designed to alleviate acute emotional, behavioral, cognitive, or biomedical distress resulting from or occurring with alcohol or drug use; routine monitoring of medication adherence; and other outpatient and community-based SUD treatment services designated by the HHS Secretary. Id. ↩︎
The screening must include “initial and periodic assessment to determine the appropriate level of care, length of stay, and setting of care for each individual.” H.R. 6, § 5052 (a)(2) (creating new Social Security Act § 1915 (l)(4)(B)). Additionally, the SUPPORT Act IMD option shall not be construed as encouraging states to place individuals in inpatient or residential settings when home or community-based services would be more appropriate. H.R. 6, § 5052 (b). ↩︎
H.R. 6, § 5052 (a)(2) (creating new Social Security Act § 1915 (l)(4)(D)(ii)). The state must consider the proximity to an individual’s support network, such as family members, employment, counseling, and other services near an individual’s residence. H.R. 6, § 5052 (a)(2) (creating new Social Security Act § 1915 (l)(4)(D)(i)). ↩︎
These include (1) early intervention for those who are at known risk of developing substance-related problems and those for whom there is not yet sufficient information to document a diagnosable SUD; (2) outpatient recovery or motivational enhancement therapies and strategies at less than 9 hours per week for adults and less than 6 hours per week for adolescents; (3) intensive outpatient to treat multidimensional instability at 9 hours or more per week for adults and 6 hours or more per week for adolescents; and (4) partial hospitalization to treat multidimensional instability that does not require 24-hour care at 20 hours or more per week for adults and adolescents. H.R. 6, § 5052 (a)(2) (creating new Social Security Act § 1915 (l)(4)(C)). ↩︎
These include: (1) clinically managed low-intensity residential services for adults and adolescents, including 24-hour living support with trained personnel and at least 5 hours of clinical services per week per individual; (2) clinically managed population-specific high intensity residential services to stabilize multidimensional imminent danger and provide less intense milieu and group treatment for those with cognitive or other impairments unable to use full active milieu or therapeutic community for adults, including 24-hour care with trained counselors and less intensive treatment for those with cognitive or other impairments; (3) clinically managed high intensity residential services intended to stabilize multi-dimensional imminent danger and prepare for outpatient treatment for adults and clinically managed medium-intensity residential services for adolescents, including 24-hour care with trained counselors; (4) medically monitored intensive inpatient withdrawal management for adults and medically monitored high-intensity inpatient services for adolescents, including 24-hour nursing care, physician availability for significant problems, and 16 hours per day of counseling services; and (5) medically managed intensive inpatient services targeted to individuals with severe unstable problems in acute intoxication and/or withdrawal potential, biomedical conditions and complications, and emotional, behavioral or cognitive conditions and complications for adults and adolescents, including 24-hour nursing care and daily physician care. H.R. 6, § 5052 (a)(2) (creating new Social Security Act § 1915 (l)(4)(C)(ii) and (7)(A)). The SUPPORT Act requires physician availability for significant problems in ASAM Dimensions 1, 2, and 3. Id. These include significant problems in acute intoxication and/or withdrawal potential, biomedical conditions and complications, and emotional, behavioral or cognitive conditions and complications. Amer. Soc’y of Addiction Med., At A Glance: The Six Dimensions of Multidimensional Assessment, last accessed Oct. 24, 2019, https://www.asam.org/resources/the-asam-criteria/about. ↩︎
These states include AL, AK, AZ, AR, FL, GA, HI, KS, KY, MA, MN, MT, NV, NM, NY, OK, UT, VT, WV, WI, and WY. Id. ↩︎
These states include CA, CO, CT, DE, DC, IL, IA, LA, ME, MI, MS, MO, NE, NJ, NC, ND, OH, OR, PA, RI, SC, TX, UT, and WA. In addition, MD did not respond to this survey question. Id. ↩︎
Additionally, the SUPPORT Act directs MACPAC to study Medicaid payments to IMDs in a representative sample of at least two states by January 2020. The study must include the number of IMDs, facility type, and any coverage limits; services provided and clinical assessment, reassessment, and discharge processes; any federal waivers and other Medicaid funding sources such as supplemental payments; state certification, licensure, and accreditation requirements; state quality, clinical, and facility standards; and recommendations for Congress and CMS to improve care, standards, and data collection. H.R. 6, § 5011-5012. ↩︎
“As part of its original 1115 Demonstration for the Vermont Health Access Plan (VHAP) Medicaid Expansion, Vermont received a waiver of the IMD exclusion. This waiver, effective January 1, 1996, permitted Vermont to reimburse IMDs for individuals enrolled under the 1115 Demonstration. At that time, the rationale behind this waiver was to permit the use of IMDs as alternatives to potentially more costly, general acute hospital services. . . The IMD waiver was completely phased out January 1, 2006. . . Since 2005 Vermont has used its “in lieu of” authority under [the] Global Commitment [to Health Section 1115 Demonstration to fund IMD services.]” The Pacific Health Policy Group, Vermont Global Commitment to Health Section 1115 (a) Medicaid Demonstration 11-W-00194/1, Interim Evaluation Report #1, including Evaluation of IMD Expenditures at 39-40 (March 30, 2018), https://dvha.vermont.gov/administration/vt-gc-1115-demo-interim-eval-report-final-apr2-18.pdf. ↩︎
Kansas’ waiver added SUD rehabilitation services intended to avoid preventable inpatient hospitalizations and also includes a pilot program to provide supported employment services to 500 enrollees with a behavioral health diagnosis, including those with co-occurring SUD, who receive SSI or SSDI benefits. CMS Special Terms and Conditions, KanCare, No. 11-W-00238/7 (Jan. 1, 2019-Dec. 31, 2023), https://www.medicaid.gov/Medicaid-CHIP-Program-Information/By-Topics/Waivers/1115/downloads/ks/ks-kancare-ca.pdf. ↩︎
KY added methadone using state plan authority contingent on waiver authority that eliminates the requirement for the state to provide non-emergency medical transportation for enrollees to access those services. CMS Special Terms and Conditions, KY HEALTH 1115 Demonstration, #11-W-00306/4 and 21-W-00067/4 (approved Jan. 12, 2018-Sept. 30, 2018, amended Nov. 20, 2018), https://www.medicaid.gov/Medicaid-CHIP-Program-Information/By-Topics/Waivers/1115/downloads/ky/ky-health-ca.pdf. ↩︎
Behavioral Health Concepts, Drug Medi-Cal Organized Delivery System External Quality Review Report FY 2017-2018 at v (Nov. 19, 2018), LINK. ↩︎
Dr. Luke Bergmann, Director Behavioral Health Services and Christian Jones, Public Consulting Group, Update on Advancing the Behavioral Health Continuum of Care Through Regional Collaboration and Innovation, Board Conference First Quarterly Update at 9 (March 26, 2019), on file with authors. ↩︎
VCU Health Behavior and Pol’y School of Medicine, An Evaluation Report Prepared for the Va. Dep’t of Med’l Assist. Servs., Addiction and Recovery Treatment Servs. Access and Utilization during the First Year (April 2017-March 2018) at 19-21 (Aug. 2018), https://hbp.vcu.edu/media/hbp/policybriefs/pdfs/ARTSone-yearreport_8.9.18_Final.pdf. The evaluation notes “[a]lthough the report did not specifically identify ARTS as the casual mechanism for the decrease in emergency department visits and inpatient admissions, it is consistent with the expectation that increased access to treatment should result in fewer overdoses and other addiction-related health emergencies and hospitalization.” Id. at 24. ↩︎
The Pacific Health Policy Group, Vermont Global Commitment to Health Section 1115 (a) Medicaid Demonstration 11-W-00194/1, Interim Evaluation Report #1, including Evaluation of IMD Expenditures at 71 (March 30, 2018), https://dvha.vermont.gov/administration/vt-gc-1115-demo-interim-eval-report-final-apr2-18.pdf. Vermont may be able to achieve an average statewide 30-day length of state looking across all IMD SUD and mental health facilities, but CMS policy requires that length of stay be determined separately for SUD vs. mental health services. ↩︎
Vermont’s existing inpatient mental health capacity may be inadequate to meet patient needs, given reports of psychiatric boarding in emergency rooms due to high occupancy rates and based on nationally recognized level of care placement criteria. Id. at 84. ↩︎
The average person with traditional Medicare coverage paid $5,460 out of their own pocket for health care in 2016, according to a new KFF analysis and interactive tool.
This $5,460 includes about $1,000 in out-of-pocket spending for long-term care facility services, averaged across all traditional Medicare beneficiaries. Such services are used by only 5 percent of beneficiaries in traditional Medicare. For the 95 percent of beneficiaries living in the community, average out-of-pocket spending on health care was $4,519 in 2016. But some groups of beneficiaries spent substantially more than others.
According to the analysis – based on the most current public data — beneficiaries who were likely to spend more out of pocket include women, people in older age groups, those who had been hospitalized, people in poorer self-reported health, and those with multiple chronic conditions.
The analysis comes at a time when some policymakers and presidential candidates are discussing proposals to expand coverage through programs modeled in some respects on Medicare, and improve financial protections and lower out-of-pocket costs for people currently covered by Medicare. Current Medicare-for-all proposals would largely eliminate premiums and out-of-pocket costs, including for those now covered by Medicare.
The analysis includes three interactive graphics that allow users to explore out-of-pocket spending data for different subgroups of Medicare beneficiaries, such as age, gender, and income, to see:
The analysis is based on the most current year of out-of-pocket spending data available from the Medicare Current Beneficiary Survey, a nationally representative survey of Medicare beneficiaries. It does not include spending by beneficiaries in Medicare Advantage plans, due to a lack of publicly available data for beneficiaries enrolled in the private Medicare plans.
Many policymakers and presidential candidates are discussing proposals to build on Medicare in order to expand insurance coverage and reduce health care costs, and improve financial protections and lower out-of-pocket costs for people currently covered by Medicare. More than 60 million people ages 65 and older and younger people with long-term disabilities currently rely on Medicare to help cover their costs for health care services, including hospitalizations, physician visits, prescription drugs, and post-acute care. However, Medicare beneficiaries face out-of-pocket costs for their insurance premiums, cost sharing for Medicare-covered services, and costs for services that are not covered by Medicare, such as dental care and long-term services and supports.
In 2016, the average person with Medicare coverage spent $5,460 out of their own pocket for health care (Figure 1). This average includes spending by community residents and beneficiaries residing in long-term care facilities (5% of all beneficiaries in traditional Medicare). Among community residents alone, average out-of-pocket spending on premiums and health care services was $4,519 in 2016. But some groups of beneficiaries spent substantially more than others. Current Medicare-for-all proposals in Congress and from presidential candidates would largely eliminate out-of-pocket costs for premiums and patient cost sharing, including for people now covered under Medicare.
Figure 1: Average Out-of-Pocket Spending on Services and Premiums Among Traditional Medicare Beneficiaries in 2016
This analysis presents the most current data on out-of-pocket health care spending by Medicare beneficiaries, both overall and among different groups of beneficiaries. The analysis addresses three main questions:
The analysis is based on the most current year of out-of-pocket spending data available (2016) from the Medicare Current Beneficiary Survey (MCBS), a nationally representative survey of Medicare beneficiaries. The analysis includes beneficiaries living in the community and long-term care facility residents, and excludes beneficiaries enrolled in Medicare Advantage due to unverified reporting of events and spending for these beneficiaries in the MCBS. (See Methodology for details). All results presented in the text are statistically significant (see Appendix to access a downloadable table of results).
How much do Medicare beneficiaries spend out of pocket in total on premiums and services?
The graphic below shows how much the average person with traditional Medicare spent out of pocket for health care in 2016. Total out-of-pocket spending includes spending on medical and long-term care facility services and insurance premiums, with comparisons across different groups of beneficiaries.
Average Out-of-Pocket Health Care Spending by Traditional Medicare Beneficiaries in 2016
Our analysis shows that Medicare beneficiaries spent $5,460 out of their own pockets for health care in 2016, on average, with more than half (58%) spent on medical and long-term care services ($3,166), and the remainder (42%) spent on premiums for Medicare and other types of supplemental insurance ($2,294). This average includes spending by community residents and beneficiaries residing in long-term care facilities (5% of all beneficiaries in traditional Medicare). Among community residents alone, average out-of-pocket spending on premiums and health care services was $4,519 in 2016.
Average total out-of-pocket spending varies considerably across different groups of beneficiaries.
The oldest beneficiaries in traditional Medicare, people ages 85 and older, spent more than twice as much out of pocket as beneficiaries between the ages of 65 and 74 ($10,307 versus $5,021). This difference was primarily due to significantly higher spending on long-term care facility services among beneficiaries in the oldest age group.
Out-of-pocket spending by women in traditional Medicare was higher than out-of-pocket spending by men ($5,748 versus $5,104).
Beneficiaries in poorer self-reported health, those with multiple chronic conditions, and those with any inpatient hospital utilization faced higher out-of-pocket costs than the average traditional Medicare beneficiary. For instance, beneficiaries with at least one inpatient stay in 2016 spent $7,613 out of pocket, on average, compared to $5,044 among those without an inpatient stay.
Beneficiaries with no supplemental insurance spent more out of pocket than beneficiaries with some type of supplemental coverage. In 2016, nearly one in five (6.1 million) Medicare beneficiaries did not have any source of supplemental coverage, which placed them at greater risk of incurring high medical expenses. People without any source of supplemental coverage were also more likely to have modest incomes and be ages 85 or older. Out-of-pocket spending averaged $7,473 among beneficiaries with no supplemental coverage in 2016, compared to $5,202 among beneficiaries with employer-sponsored coverage, who also tend to have higher incomes, higher education levels, and are disproportionately white. Beneficiaries with Medicaid, however, incurred the lowest average out-of-pocket costs in 2016 ($2,665) compared to those with other coverage types or none whatsoever. Higher out-of-pocket spending among those with no supplemental coverage is due to higher spending on health-related services, because supplemental coverage helps Medicare beneficiaries pay their out-of-pocket costs for Medicare-covered services. For example, beneficiaries with employer-sponsored coverage spent $2,476 on health-related services in 2016, on average, while those with no supplemental coverage spent $5,776.
How much do Medicare beneficiaries spend out of pocket on different types of health-related services?
The graphic below shows average out-of-pocket spending for specific health and long-term care services by traditional Medicare beneficiaries in 2016, with comparisons across different groups of beneficiaries.
Average Out-of-Pocket Health Care Spending by Traditional Medicare Beneficiaries in 2016, by Type of Service
Of the total average per capita spending on health and long-term care services in 2016 ($3,166), Medicare beneficiaries spent the most on long-term care (LTC) facility services, which are not covered by Medicare ($1,014, or 32% of average out-of-pocket spending on services), followed by medical providers and supplies ($712; 22%), prescription drugs ($651; 21%), and dental services ($449; 14%). These estimates are averaged across all traditional Medicare beneficiaries including users and non-users of each service; average spending among users would be higher than the averages presented here.
Average out-of-pocket spending by service varies across different groups of beneficiaries. For example:
Not surprisingly, beneficiaries living in long-term care facilities (5% of traditional Medicare beneficiaries overall) spent significantly more on LTC services than the average beneficiary in traditional Medicare in 2016 ($19,632 versus $1,014). Out-of-pocket spending was much higher among LTC facility residents who did not have Medicaid ($41,782), which is the primary source of public support for long-term care. Out-of-pocket spending on long-term care facility services was also higher among beneficiaries with certain types of chronic conditions, in particular, Alzheimer’s disease or other dementia ($9,565 on average; $27,308 among LTC residents only) and Parkinson’s disease ($4,120 on average; $28,165 among LTC residents only)—as these beneficiaries are more likely to reside in a long-term care facility than those with other conditions. Notably, these estimates of out-of-pocket spending on long-term care facility services are lower than the median estimated annual cost of a private room in a long-term care facility, which was $92,000 in 2016. One reason for the discrepancy is that the average out-of-pocket spending estimates from the MCBS include beneficiaries who resided in a LTC facility for less than a full year.
Average spending on prescription drugs was higher for beneficiaries with multiple chronic conditions and those in relatively poor self-reported health status. In 2016, traditional Medicare beneficiaries with five or more chronic conditions spent $1,065 on prescription drugs, on average, compared to $416 among those with one or two chronic conditions; those in poor self-reported health spent $1,018 on drugs compared to $410 among those in excellent self-reported health. In a separate analysis of the out-of-pocket cost burden for specialty drugs, we found that out-of-pocket drug costs for Part D enrollees taking medications for selected conditions, including cancer, hepatitis C, multiple sclerosis, and rheumatoid arthritis, can exceed thousands of dollars annually on a single medication.
In 2016, traditional Medicare beneficiaries spent an average of $449 out of pocket on dental services, which are typically not covered by Medicare. Out-of-pocket spending on dental care increased with income, likely because higher-income beneficiaries are better able to afford dental services, while those with lower incomes are more likely to go without needed dental care due to costs.
What share of income do Medicare beneficiaries spend on out-of-pocket health care costs?
The graphic below shows out-of-pocket spending on health-related services as a share of total per capita income, at the median, with comparisons across different subgroups of beneficiaries.
Median Out-of-Pocket Spending as a Share of Income for Traditional Medicare Beneficiaries in 2016
Our analysis shows that half of all beneficiaries in traditional Medicare spent at least 12% of their income on out-of-pocket health care costs in 2016. One quarter of all beneficiaries spent at least 23% of their incomes on health-related services in 2016, while 10% spent nearly half of their income (data not shown).
The median out-of-pocket health care spending burden varies by beneficiary subgroups. For example:
The financial burden of health care as a share of income falls disproportionately on lower-income Medicare beneficiaries. Half of traditional Medicare beneficiaries with incomes below $10,000 spent at least 18% of their total per capita income on health care costs in 2016, compared to 7% for those with incomes of $40,000 or more. Having Medicaid coverage, however, significantly reduces the out-of-pocket spending burden among low-income beneficiaries. Beneficiaries with Medicaid spent just 5% of their total income on out-of-pocket health care costs in 2016.
Medicare beneficiaries in older age groups face a higher out-of-pocket spending burden than younger beneficiaries. Half of traditional Medicare beneficiaries ages 85 and older spent at least 16% of their total income on out-of-pocket health care costs in 2016, compared to 12% among those ages 65 to 74.
People with multiple chronic conditions or in poorer health spend more on health care out-of-pocket than those in better health. For example, beneficiaries with five or more chronic conditions spent 14% of their income on out-of-pocket health care costs in 2016, compared to 8% among those with zero conditions. Those with any inpatient hospital stay in 2016 spent 17% of their income on out-of-pocket health care costs, compared to 11% among those without a hospital stay that year.
Discussion
In 2016, people with traditional Medicare spent an average of $5,460 out of pocket for health care expenses, including premiums, cost sharing, and costs for services not covered by Medicare. Half of all traditional Medicare beneficiaries spent at least 12% of their total per capita income on health care. Although Medicare has helped make health care more affordable for people with Medicare, many beneficiaries face high out-of-pocket costs for care they receive, including costs for services that are not covered by Medicare—in particular, long-term care services. Some groups of beneficiaries face substantially higher out-of-pocket costs than others, including women, those ages 85 and over, those who are in poorer self-reported health and who have multiple chronic conditions, and those with no supplemental coverage.
The fact that traditional Medicare does not have an annual out-of-pocket limit and does not cover certain services that older adults are more likely to need may undermine the financial security that Medicare provides, especially for people with significant needs and limited incomes. Addressing these gaps would help to alleviate the financial burden of health care for people with Medicare, although doing so would also increase federal spending and taxes.
Juliette Cubanski, Wyatt Koma, and Tricia Neuman are with KFF.Anthony Damico is an independent consultant.
Methodology
Data Overview
This interactive analysis is based on data from the Centers for Medicare & Medicaid Services (CMS) Medicare Current Beneficiary Survey (MCBS) Cost Supplement for 2016, the most recent year available. The MCBS is a survey of a nationally-representative sample of the Medicare population, including both aged and disabled enrollees who are living in the community as well as facility residents. The dataset integrates survey information reported directly by beneficiaries with Medicare administrative data. Survey-reported data includes the demographics of respondents, such as sex, age, race, living arrangements, income, health status, and physical functioning, the use and costs of health care services, and supplementary health insurance arrangements.
The survey also collects information on inpatient and outpatient hospital care, physician and other medical provider services, home health services, durable medical equipment, long-term and skilled nursing facility services, hospice services, dental services, and prescription drugs. Survey-reported information is matched to and supplemented by administrative records and billing and claims-level data when possible. Extensive efforts are made to verify the accuracy of survey reports and to reconcile discrepancies using administrative bill data to produce a more complete and reliable dataset.
Beneficiary Population
Our analysis includes beneficiaries in traditional Medicare for most of their enrollment in 2016, and excludes beneficiaries enrolled in Part A or Part B only, those with Medicare as a Secondary Payer, and those enrolled in Medicare Advantage plans for most of their enrollment in 2016. For Medicare Advantage enrollees, it is not possible to verify survey-reported events in the MCBS with administrative claims data, as is done for beneficiaries in traditional Medicare. This has the effect of biasing downward survey-reported out-of-pocket spending amounts for Medicare Advantage enrollees compared to beneficiaries with traditional Medicare. It is not possible to determine whether observed differences are real or due to underlying differences in the data collection, verification, and imputation process for out-of-pocket spending by beneficiaries in traditional Medicare and Medicare Advantage. Therefore, we exclude Medicare Advantage enrollees (unweighted n=2,726) to avoid introducing bias associated with underreporting of events and spending for this population.
We also excluded beneficiaries who were enrolled in only Part A or Part B (unweighted n=298) and those with Medicare as a Secondary Payer (unweighted n=231) for most of their Medicare enrollment in 2016 Because Medicare is typically not the primary payer for those who are enrolled in only Part A or Part B but not both programs, beneficiaries with only Part A or Part B also have significantly lower average total out-of-pocket spending relative to those enrolled in both Part A and B, which is the rationale for excluding them from the analysis of out-of-pocket spending.
After excluding these groups of enrollees, our sample for the analysis of spending as a share of total income included 5,369 respondents in traditional Medicare (32.7 million weighted) in 2016. We analyze out-of-pocket spending among all traditional Medicare beneficiaries and by specific beneficiary subgroups, including age (under 65, 65-74, 75-84, 85 and over), gender (female, male), age by gender, race (white non-Hispanic, black non-Hispanic, Hispanic), race by gender, race by age, marital status (married, divorced/separated, widowed, single (never married)), education level (less than high school, high school graduate, some college, college graduate), per capita income categories (increments of $10,000), self-reported health status (excellent, very good, good, fair, poor), number of chronic conditions (none, 1-2, 3-4, 5 or more), Census region (Northeast, Midwest, South, West), metropolitan area (metropolitan, rural micropolitan, rural adjacent or nonadjacent), type of residence (community, facility), supplemental coverage (employer-sponsored insurance (ESI), Medicaid, Medigap, none), hospital use (no inpatient stay, any inpatient stay, one inpatient stay, two or more inpatient stays), and specific chronic conditions.
Out-of-Pocket Health Care Spending
Out-of-pocket spending for medical and long-term care services reported in the MCBS is not the same as beneficiary liability or the Medicare cost-sharing amount for services used. Instead, out-of-pocket spending amounts are net of payments by any third-party payers, such as payments by Medicaid, Medigap, or employer-sponsored insurance. Survey-reported out-of-pocket payments are those payments made by the beneficiary or their family, including direct cash payments or in the form of Social Security or Supplemental Security Income (SSI) checks to a nursing home.
Out-of-pocket spending on premiums is derived from administrative data on Medicare Part A, Part B, and Part D premiums for each sample person along with survey-reported estimates of premium spending for other types of health insurance beneficiaries may have (including Medigap, employer-sponsored insurance, and other public and private sources). Part B premium amounts reported in the MCBS include income-related premiums paid by beneficiaries with higher incomes (more than $85,000 per individual/$170,000 per married couple). The administrative data reflect liability, not the actual payments made by beneficiaries for their premiums, which overstates actual premiums paid for certain groups of beneficiaries who are not responsible for paying their Medicare premiums. People who are dually-eligible for Medicaid are generally not liable for their Part A, Part B, or Part D premiums; those who receive the Part D low-income subsidy are eligible for full or partial coverage of their Part D premium. For these groups of beneficiaries, we adjusted the premium estimates reported in the MCBS to reflect the premium subsidies they receive. For beneficiaries reported as receiving the Part D low-income subsidy but who were not enrolled in benchmark plans (based on Part D contract IDs in the MCBS), we assigned premiums based on plan-specific data from the 2016 Part D landscape file.
The medical and long-term care services included in this analysis are:
Dental services: Includes cleaning, x-rays, repair, purchase or repair of dentures, and orthodontic procedures. The basic unit measuring use of these services is a single visit to the dentist, where a variety of services might be rendered.
Inpatient hospital services: Includes inpatient hospital stays, including emergency room visits which result in an inpatient admission. The basic unit measuring use of inpatient hospital services is a single admission.
Long-term care facility services: Includes individual long-term care facility events; a long-term care facility is defined as having three or more beds and providing long-term care services throughout the facility or in a separately identifiable unit. The basic unit measuring use of long-term care facility services is a “stay” in a nursing home or other long-term care facility. Stays are measured in terms of days of residence in that facility.
Medical providers/supplies: Includes medical doctor and practitioner visits; diagnostic laboratory and radiology; medical and surgical services; and durable medical equipment and non-durable supplies, such as eyeglasses or contact lenses and hearing aids, orthopedic items such as canes, walkers, wheelchairs and corrective shoes, diabetic supplies, oxygen supplies and equipment. The basic unit measuring use of these services is a separate visit, procedure, service, or a supplied item for a survey reported event.
Outpatient hospital services: Includes outpatient visits to the outpatient department or outpatient clinic of a hospital, as well as emergency room visits that do not result in a hospital admission. The basic unit measuring use of outpatient services is a separate visit to any part of the outpatient department for a survey-reported event.
Prescription drugs: Includes individual outpatient prescribed medicine events, including drugs provided to enrollees in Medicare Part D drug plans; excludes prescription medicines provided by the doctor or practitioner as samples and those provided in an inpatient setting. A small number of Part B drugs (physician-administered) are collected as survey-reported data in the MCBS prescription medicines data file. However, the data added from claims is only from Part D. There are no survey-reported drugs administered by a physician matched from the Part B administrative claims data. The basic unit measuring use of prescription drugs is a single purchase of a single drug in a single container.
Skilled nursing facility services: Includes short-term institutional stays, such as skilled nursing home stays or rehabilitation hospital stays; excludes inpatient hospital admissions and long-term care facility stays. The basic unit measuring use of these services is an admission.
Income
The MCBS includes a measure of total income for individual respondents and their spouses, if applicable. However, the MCBS does not report all sources of income that some beneficiaries may have. As in many other surveys, income is self-reported, with beneficiaries asked to report total annual income for themselves and their spouses (where applicable) from all sources, including earnings, Social Security, pensions, and asset income. However, beneficiaries are not asked to report specific income amounts by source, and some types of income may go unreported or may be underestimated. Therefore, this measure results in an overall underreporting of income, particularly for those with relatively high incomes. This conclusion is based on a comparison of MCBS income estimates to income estimates from DYNASIM3, in which we measured the divergence of MCBS and DYNASIM income estimates at each percentile of per capita income.
We used the results of this comparison to derive adjustment factors for each percentile with which to rescale each MCBS respondent’s income. In general, this produced estimates of MCBS respondents’ income that are higher than self-reported values and that we believe are a more accurate representation of income among people on Medicare. We then combined this adjusted income estimate with per capita out-of-pocket spending estimates in the MCBS to derive a more reliable estimate of Medicare beneficiaries’ per capita out-of-pocket health care spending as a share of total income than one based on MCBS self-reported income data alone.
Overview of Methods
To estimate total out-of-pocket spending per beneficiary in traditional Medicare, we calculate for each sample person aggregate estimates of out-of-pocket spending on both insurance premiums for Medicare Parts A, B, and D and supplemental insurance coverage, and medical and long-term care services reported in the MCBS. These amounts are averaged across the entire sample of traditional Medicare beneficiaries and weighted to be representative of the traditional Medicare beneficiary population or specific subgroups of beneficiaries. Analysis of spending by type of service includes beneficiaries who did and did not use each type of service. References to “total out-of-pocket spending” in this analysis always include both premiums and service spending. We also often refer to the separate components of total spending (either out-of-pocket spending on services or premiums) in presenting results. For some beneficiary subgroups, estimates of out-of-pocket spending by service type may not add up to the total for all services due to missing data related to small sample size.
To measure per capita out-of-pocket health care spending as a share of per capita total income, we computed for each individual a ratio of out-of-pocket spending to total per capita income, arrayed the individual ratios of annual out-of-pocket spending to annual income from low to high and computed the median for the entire group of traditional Medicare beneficiaries, and by beneficiary subgroups.
Due to missing data related to small sample size, we are unable to show the median out-of-pocket spending as a share of income for beneficiaries who had Medicaid for part of the year and lived in the community. Similarly, we are unable to show the median out-of-pocket spending as a share of income for Medicare beneficiaries who are black and under the age of 65.