Understanding the Intersection of Medicaid and Work: An Update
Issue Brief
Editorial note: This brief was updated on February 20, 2026 to correct references to employer firm size and firm size labels.
Work requirements in Medicaid have resurfaced as part of a broader legislative package of potential changes to Medicaid designed to significantly reduce federal Medicaid spending. A draft budget outline from Congressional Republicans includes requiring Medicaid enrollees to work or look for work as a condition of receiving coverage. While the details of the current proposal are not yet available, an analysis of an earlier proposal by the Congressional Budget Office shows that Medicaid enrollment would drop and that federal spending on Medicaid would be reduced substantially, but that the policy would not increase employment.
Data show the majority of Medicaid enrollees are working. The first Trump administration encouraged states to apply for Section 1115 waivers that included work and reporting requirements as a condition of Medicaid eligibility. For the first time in the history of the program, the administration approved waivers in 13 states. Arkansas was the only state to implement the policy with consequences for noncompliance, resulting in 18,000 losing coverage for failure to meet work or reporting requirements. Courts struck down many of the waiver approvals, including in Arkansas, and the Biden administration rescinded the remaining waivers, or they were withdrawn by the states. Currently, Georgia is the only state with a work requirement waiver in place (following a legal challenge to the Biden administration’s move to rescind it); however, several other states are pursuing work requirement waivers, anticipating a change in policy by the incoming Trump administration.
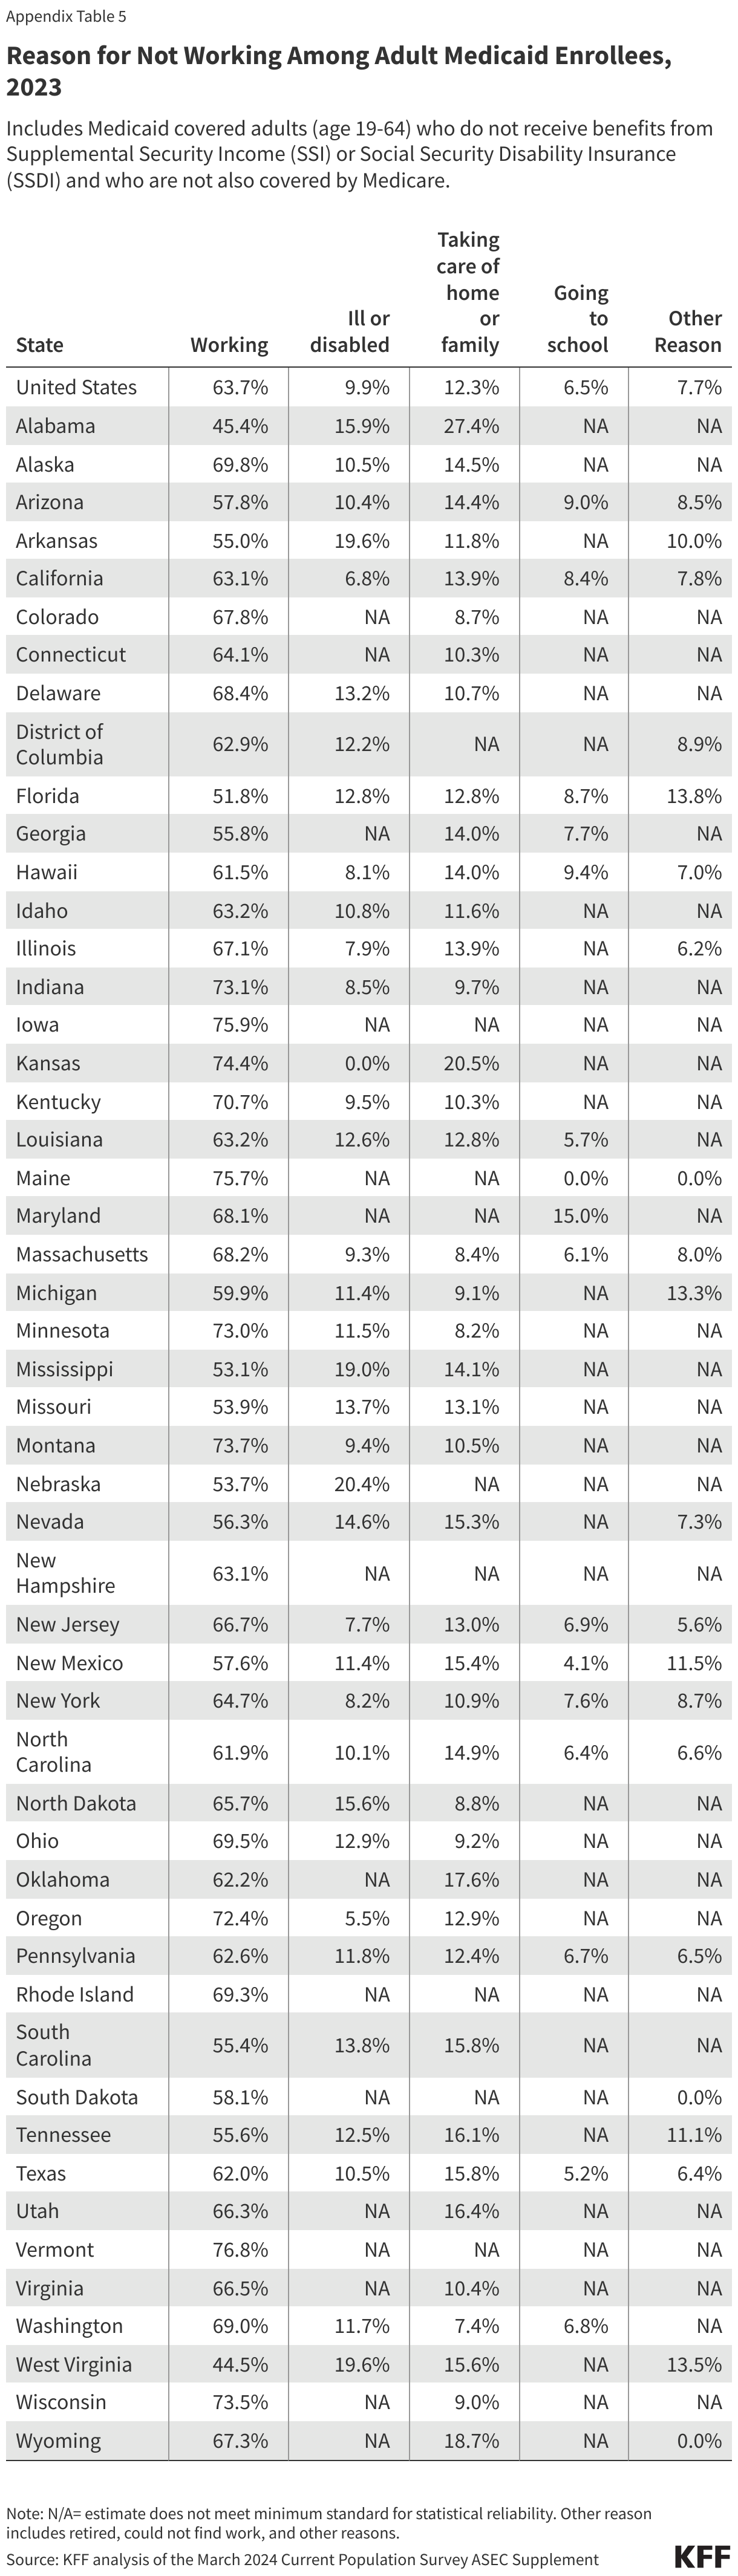
This brief updates an earlier analysis of work status and characteristics of Medicaid enrollees to show that in 2023, nearly two-thirds of adults ages 19-64 covered by Medicaid were working and nearly three in ten were not working because of caregiving responsibilities, illness or disability, or due to school attendance, reasons that counted as qualifying exemptions from the work requirements under previous policies. Based on the data, only a small share of Medicaid adults were not meeting work requirements or would not have qualified for an exemption qualifying exemptions: however, many more Medicaid enrollees who would remain eligible would be at risk of losing coverage because of the administrative burden and red tape related to reporting requirements.
What is the work status of Medicaid adults?
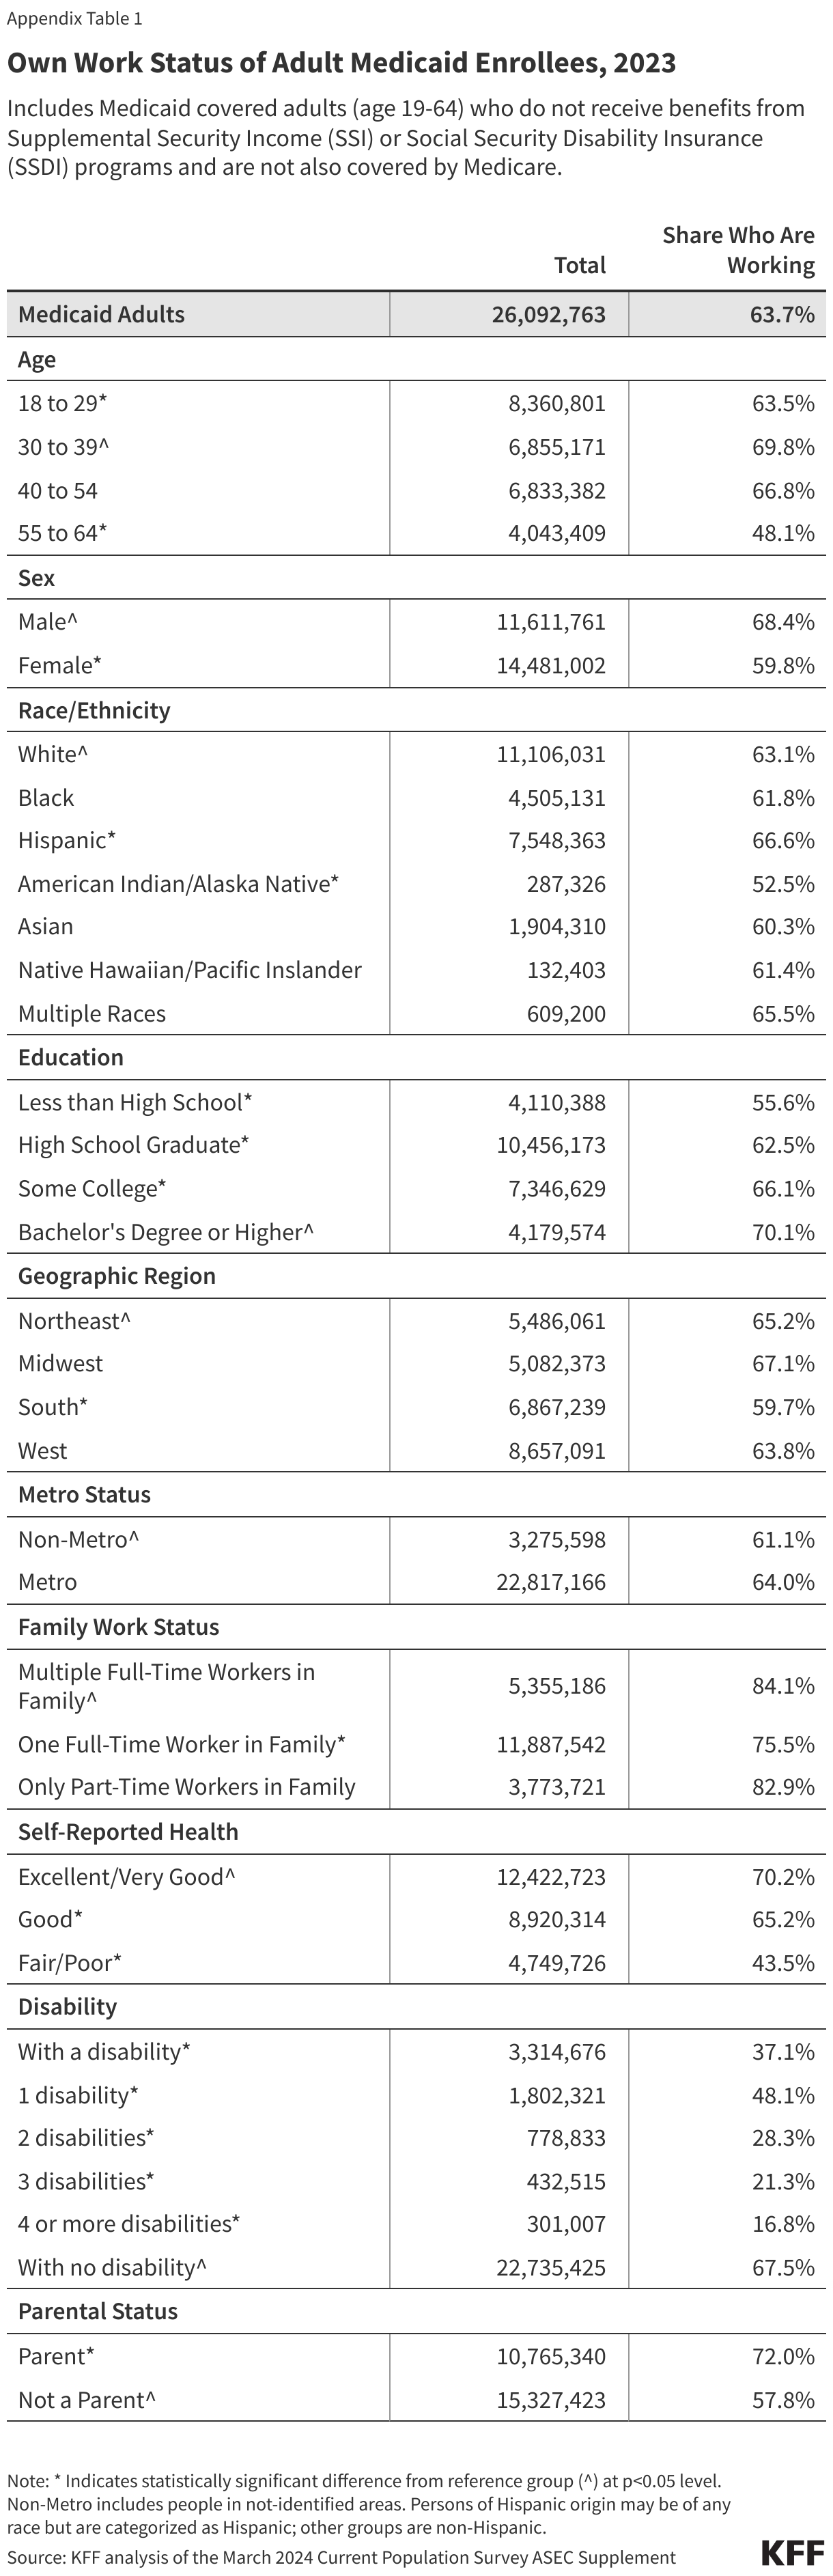
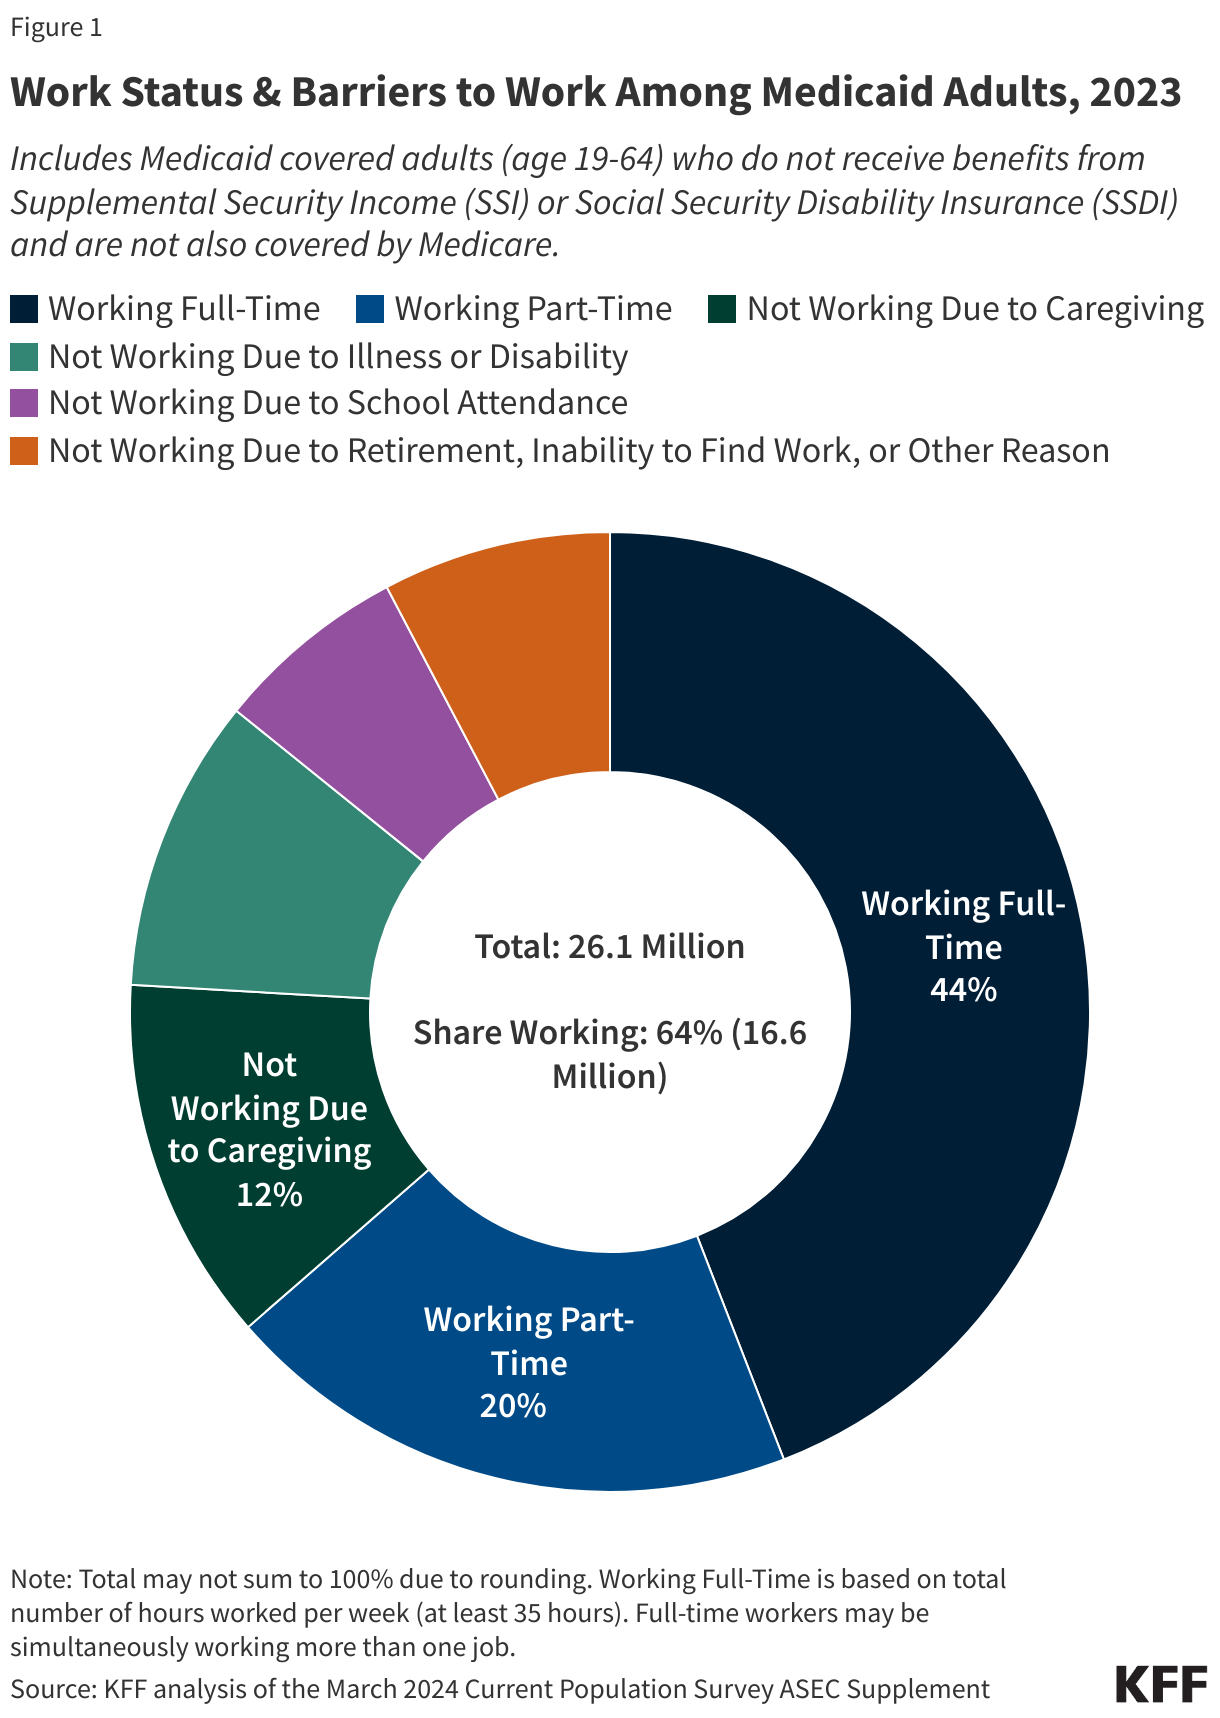
In 2023, most Medicaid adults under age 65 were working (Figure 1). Among adults under age 65 with Medicaid who do not receive benefits from the Social Security disability programs, Supplemental Security Income (SSI) and Social Security Disability Insurance (SSDI), and who are not also covered by Medicare (referred to hereafter as “Medicaid adults”), 92% were working full or part-time (64%), or not working due to caregiving responsibilities, illness or disability, or school attendance. The remaining 8% of Medicaid adults reported that they are retired, unable to find work, or were not working for another reason.
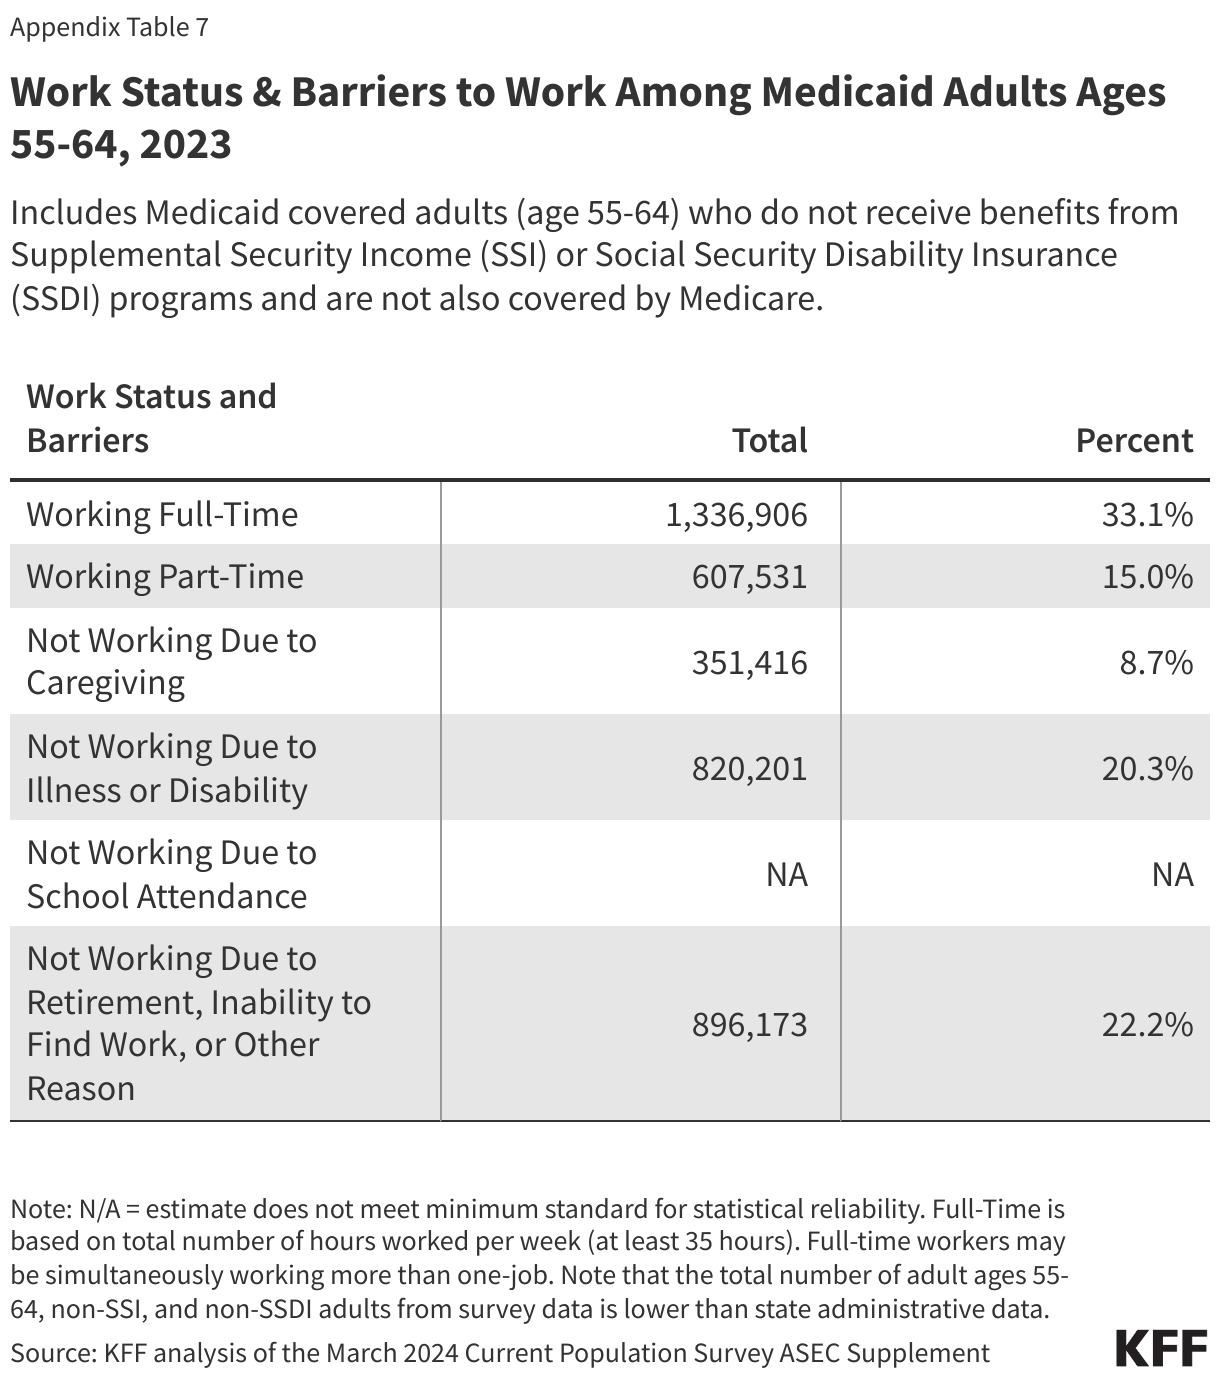
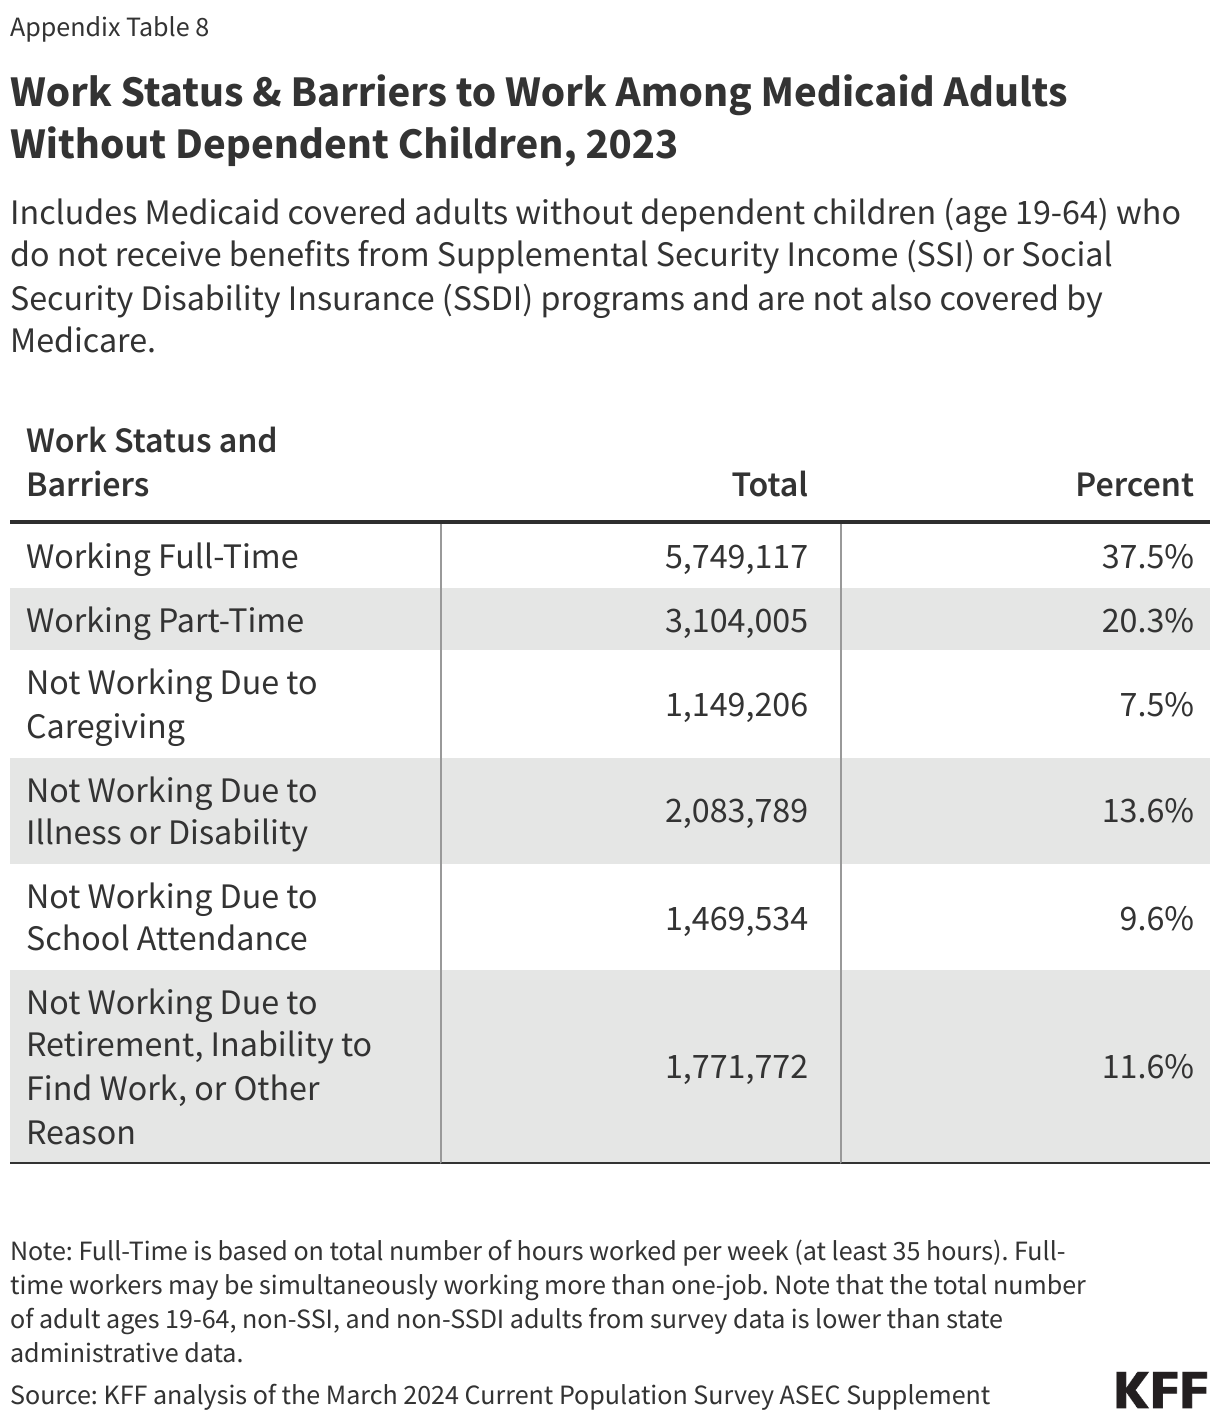
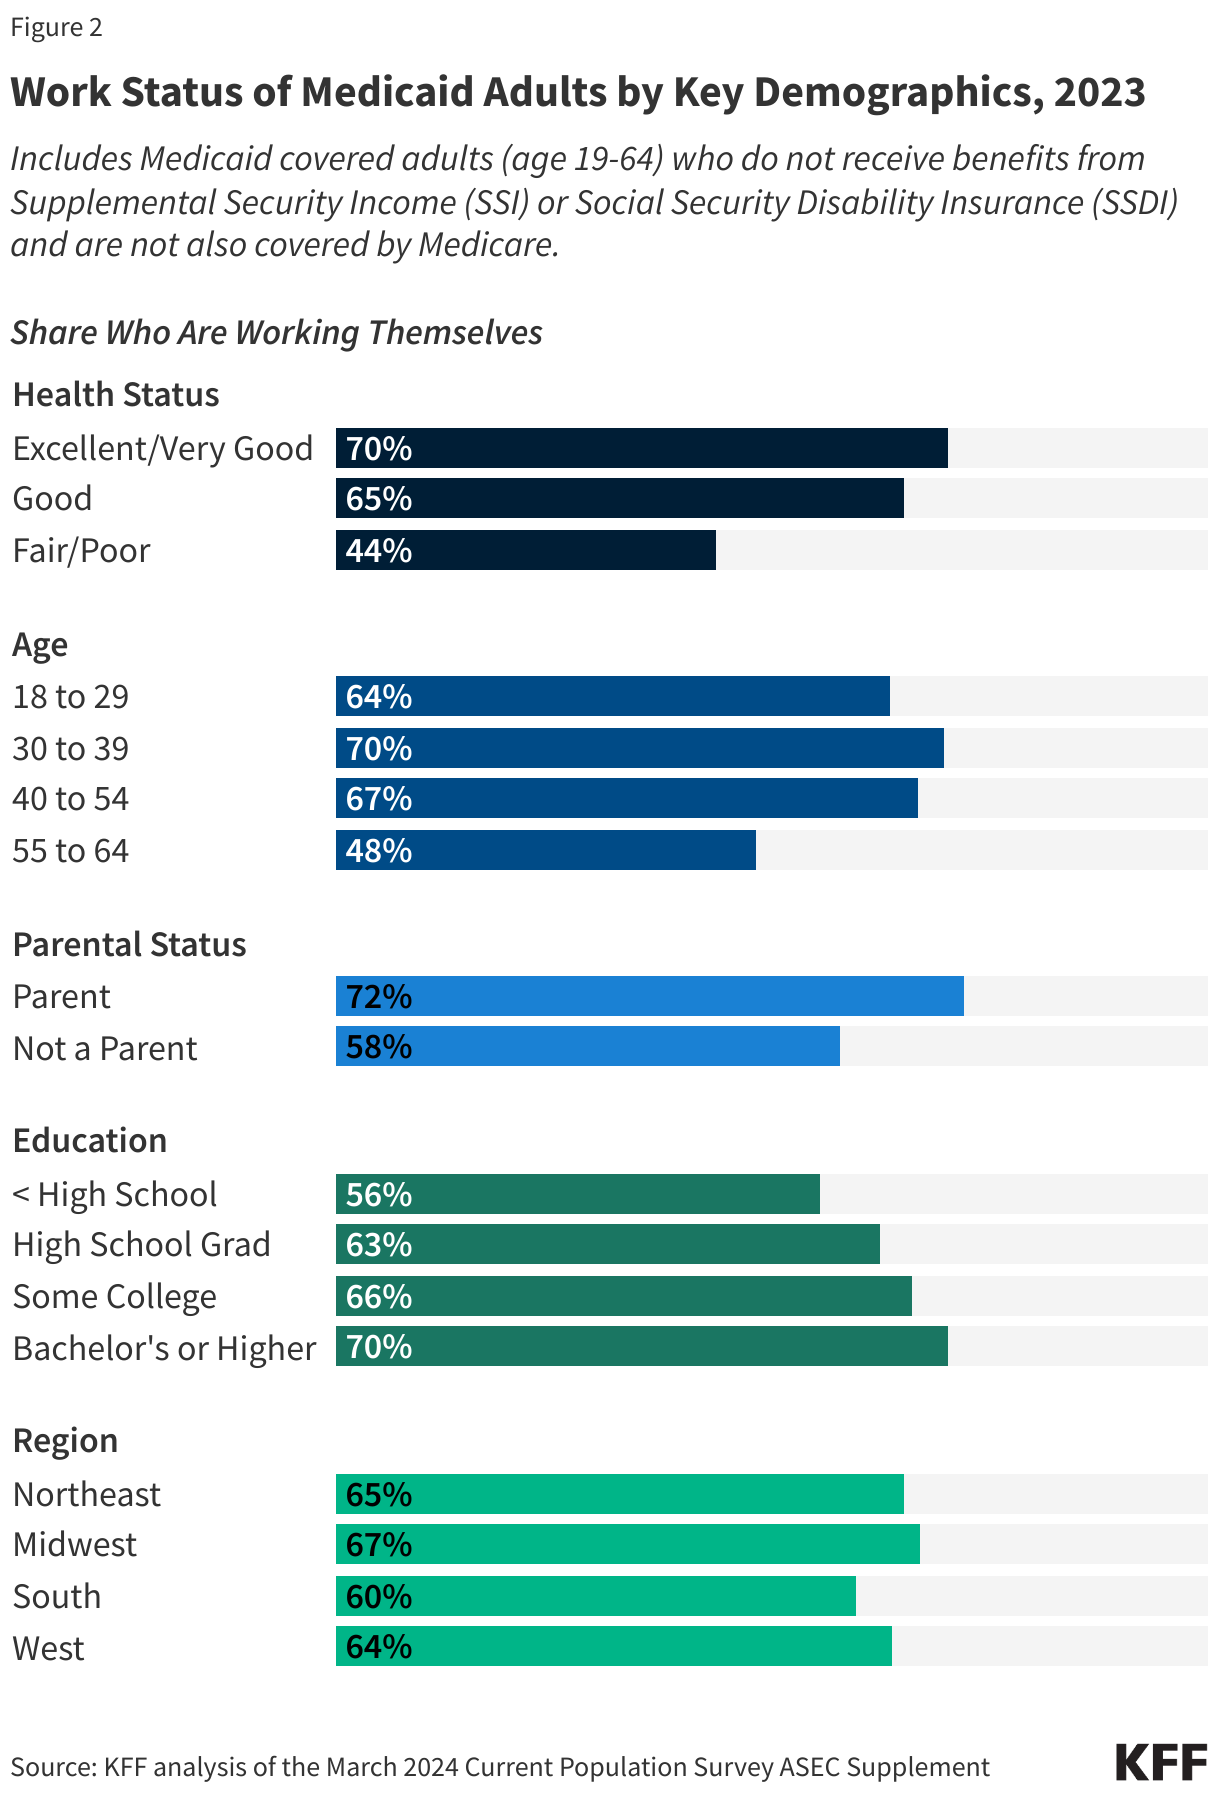
Those in better health and with more education are more likely to be working (Figure 2). Health status, age, and education level were all strong predictors of work. Seven in ten people in excellent health, ages 30-39, and who have a college degree were working compared to just four in ten (44%) people in fair health, less than half of older adults ages 55-64 (48%), and 56% of those who did not complete high school. In addition, parents were more likely to be working than adults without a dependent child in the home (72% vs. 58%), in part, because parents are younger and less likely to have a disability. Rates of work additionally vary by geographic region, metro status, and race/ethnicity but not all variation is statistically significant (Appendix Table 1).
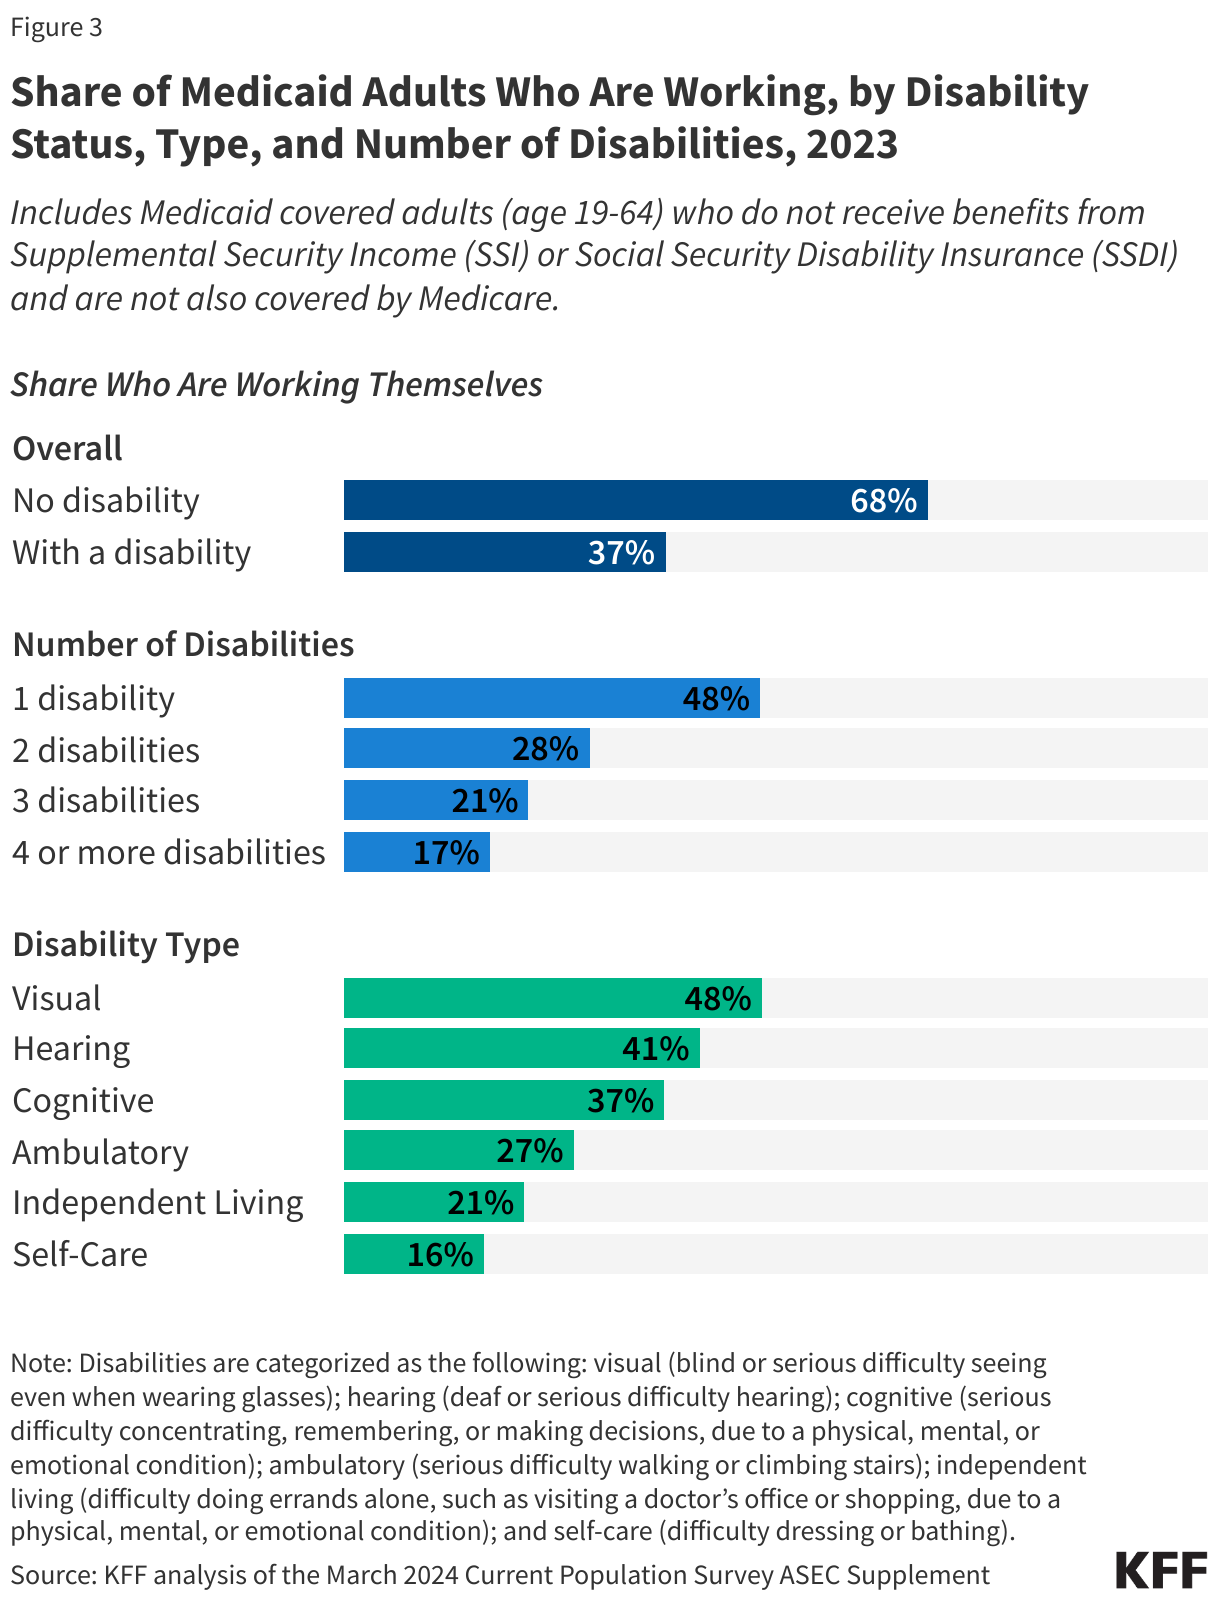
Medicaid adults with disabilities face greater barriers to participating in employment. Disability is defined as having at least one serious difficulty with hearing, vision, cognitive functioning (concentrating, remembering, or making decisions), mobility (walking or climbing stairs), independent living (doing errands, such as visiting a doctor’s office or shopping, alone), or self-care (dressing or bathing). Of Medicaid enrollees ages 19-64 with a disability, about one third (32%) receive disability income (SSI or SSDI) leaving nearly seven in ten (68%) adults on Medicaid with a disability who do not receive disability income. Medicaid adults with a disability are less likely to work than Medicaid adults with no disability (37% vs. 68%) (Figure 3).
Both the number of functional limitations as well as the type of limitation affect workforce participation. While nearly half (48%) of Medicaid adults with one disability were working, fewer than one in five (17%) Medicaid adults with four or more disabilities were working (Figure 3). Similarly, over four in ten Medicaid adults with visual or hearing disabilities were working while those with disabilities related to independent living and self-care, difficulties that often result in the need for long-term care services, had the lowest rates of employment (21% and 16%, respectively). Medicaid offers a variety of services designed to help people with these needs work, so losing Medicaid could make employment harder or impossible for these adults.
What do we know about Medicaid adults who are working?
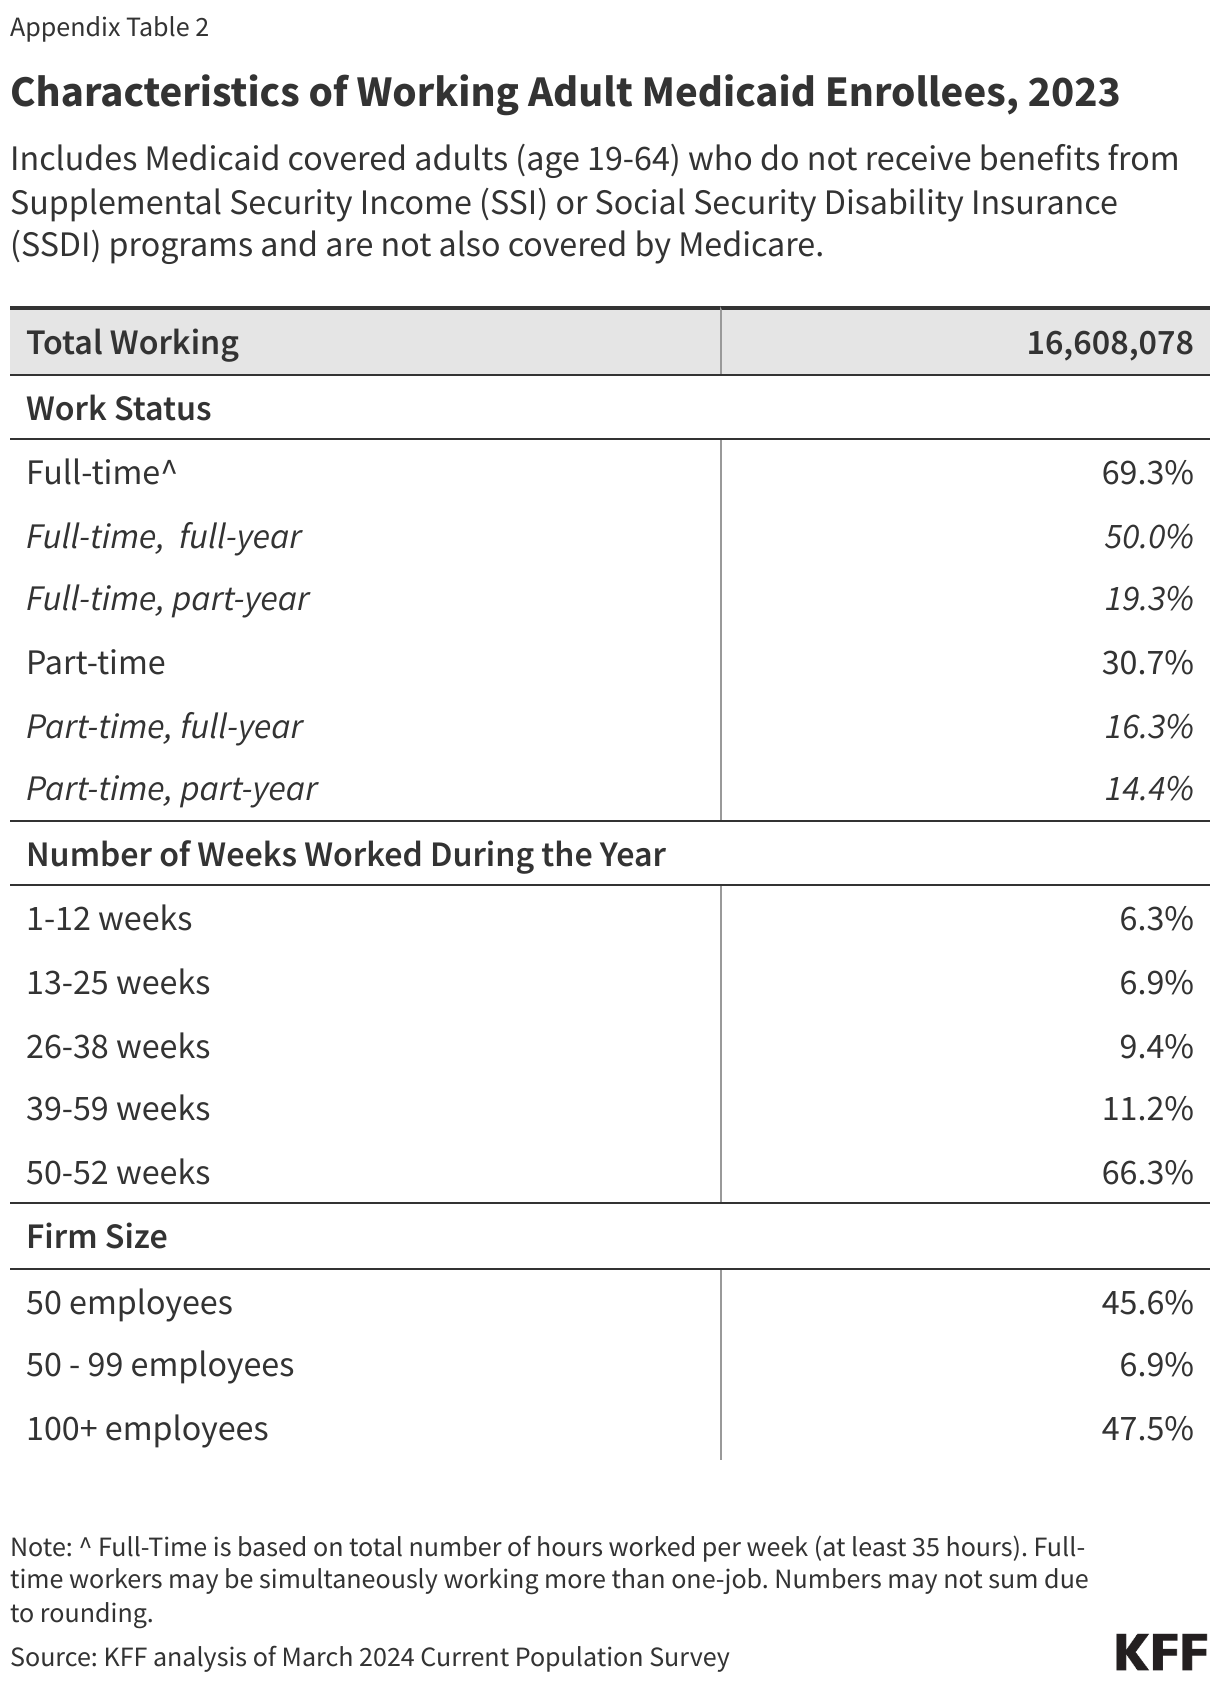
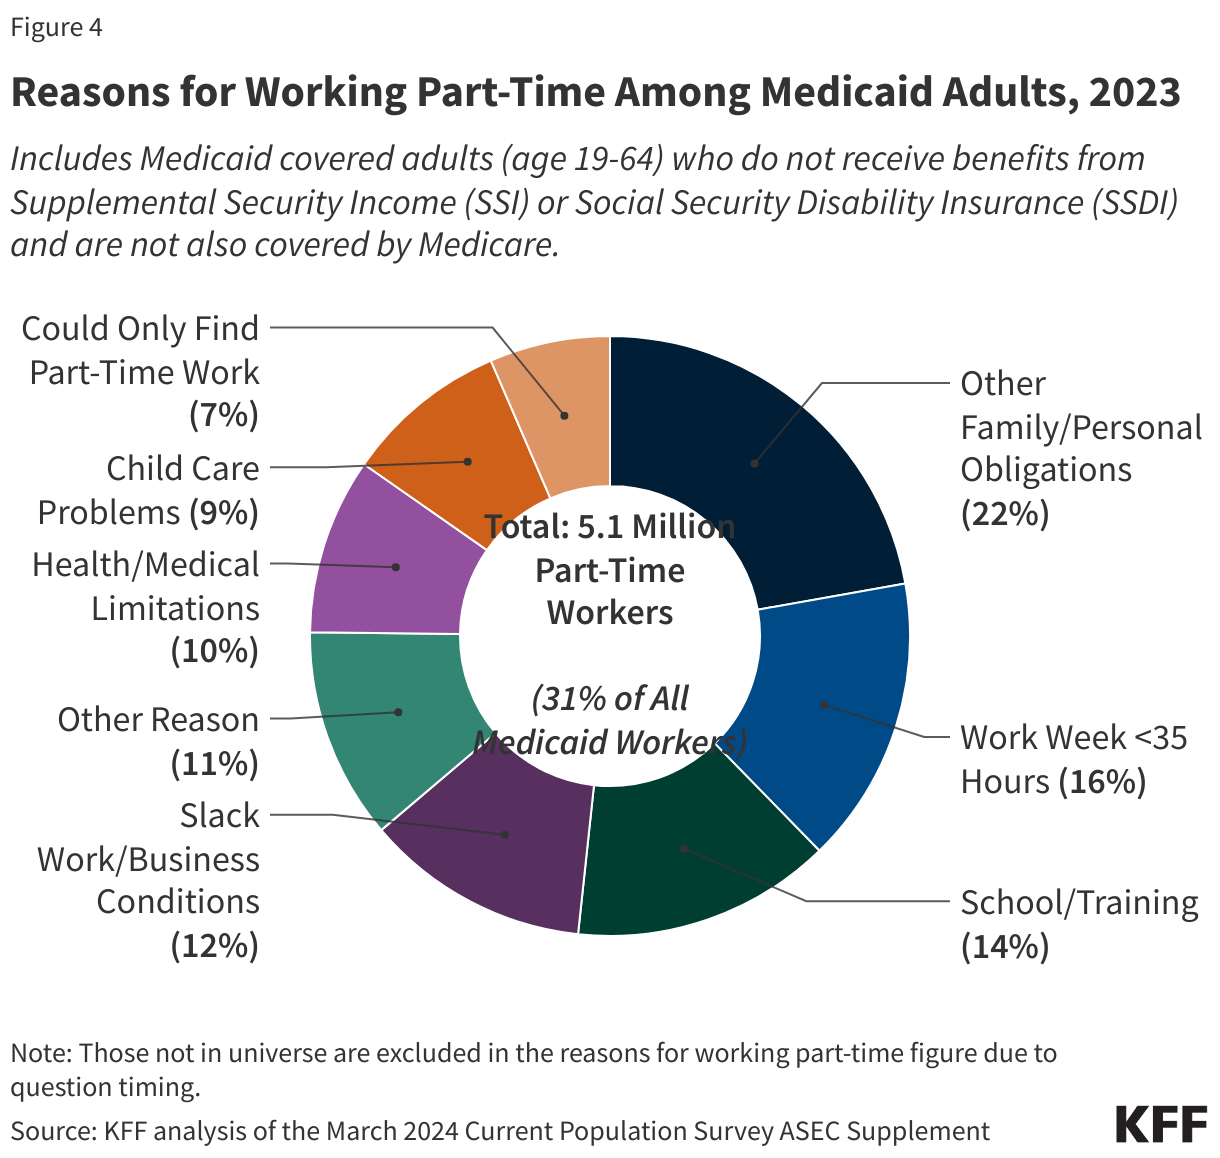
Most Medicaid adults who work are working full-time (at least 35 hours per week), but those who work part-time face challenges to full-time employment (Figure 4). Among Medicaid adults who work, nearly seven in ten (69%) worked full-time and half worked full-time for the entire year (at least 50 weeks) (Appendix Table 2). Many Medicaid adults who work part-time (31% of all workers) cited that reasons for working part-time include work limits like shorter work weeks (less than 35 hours per week) (16%), slack work/business conditions (12%), or inability to find full-time work (7%) (Figure 4). Part-time workers also pointed to childcare problems (9%) and other family or personal obligations (22%).
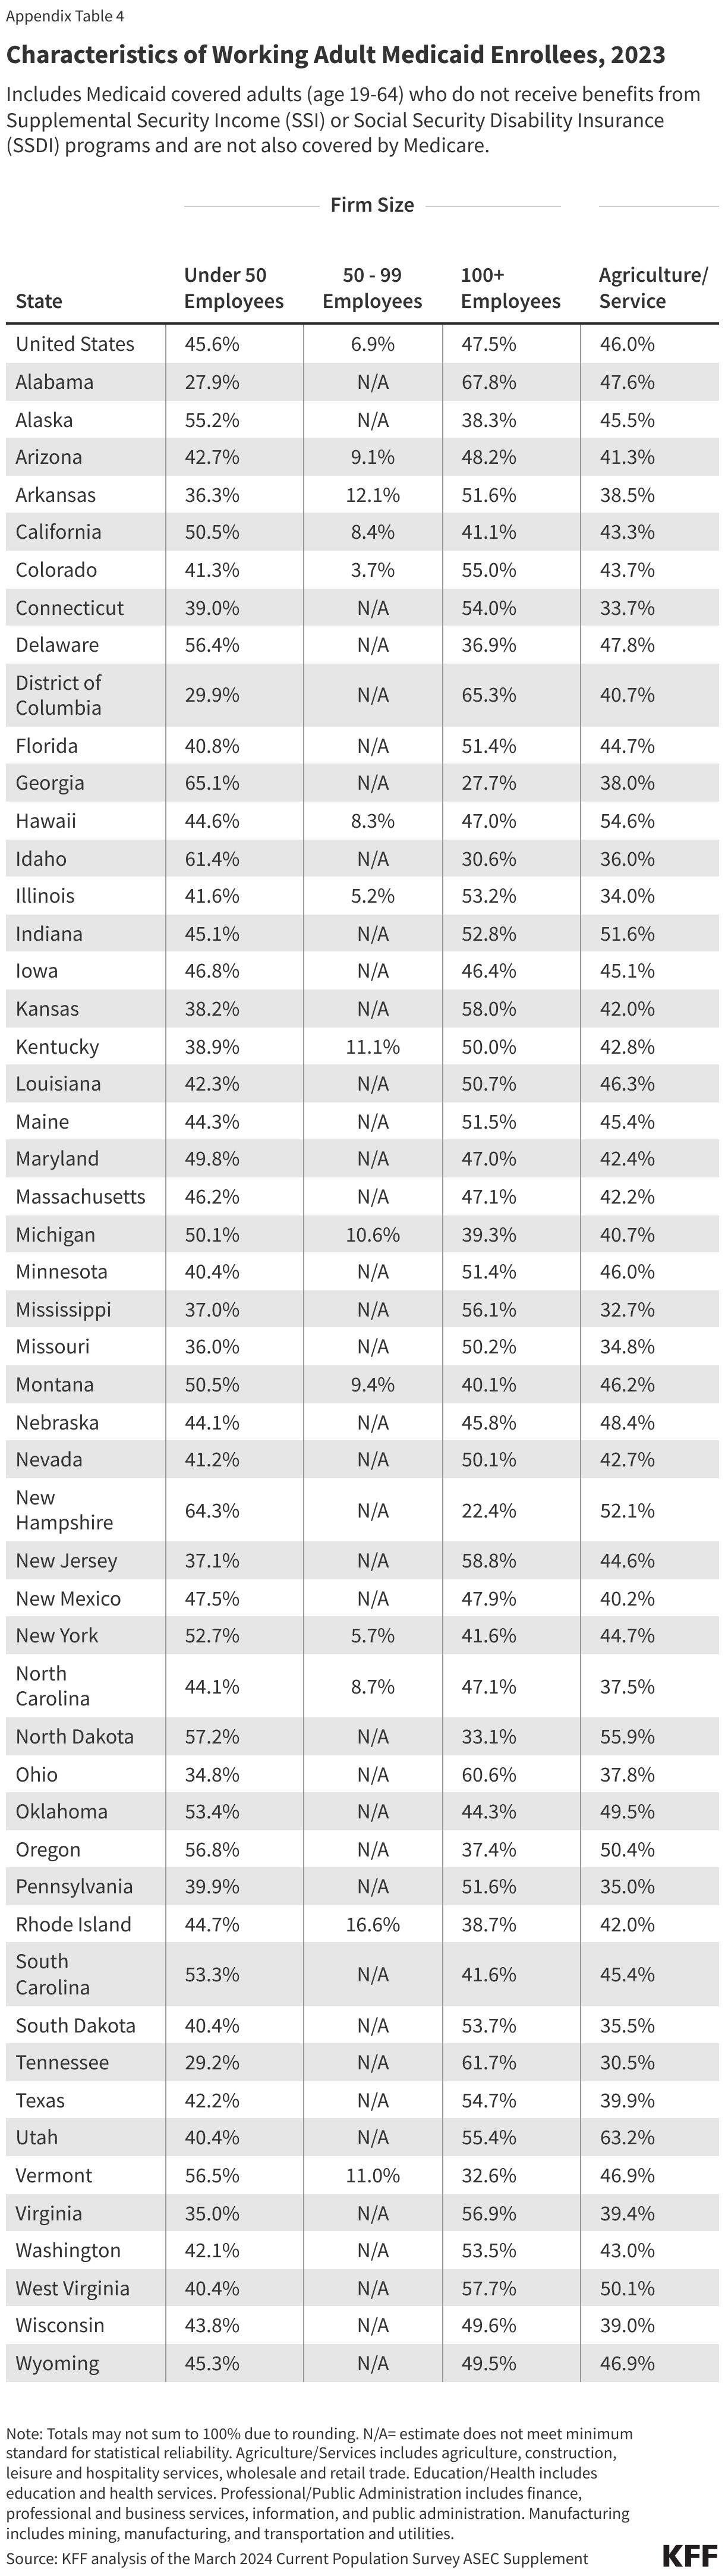
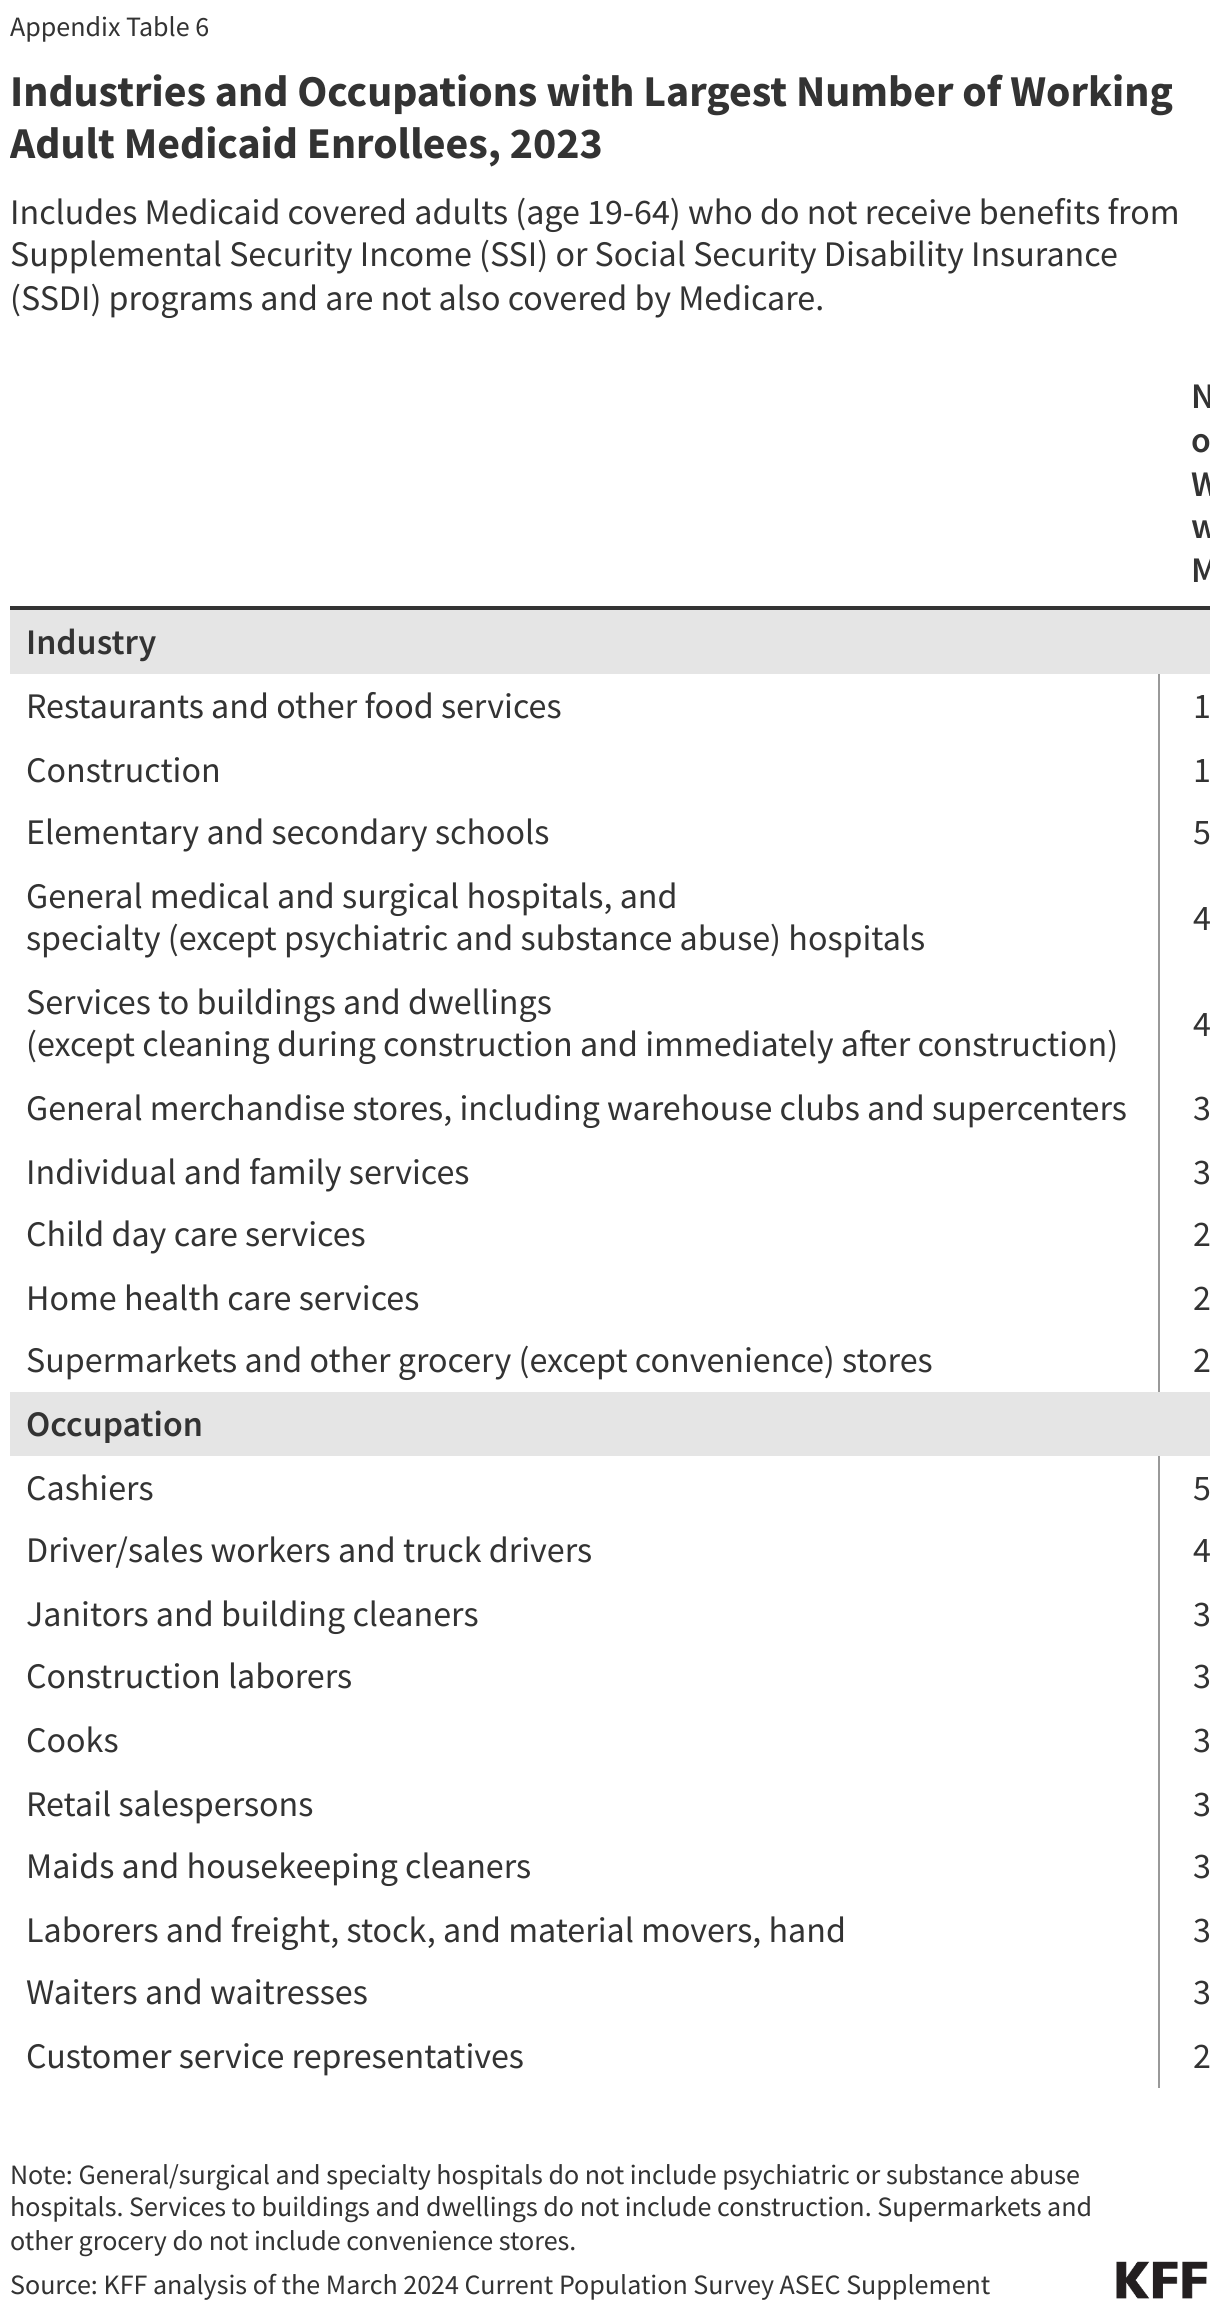
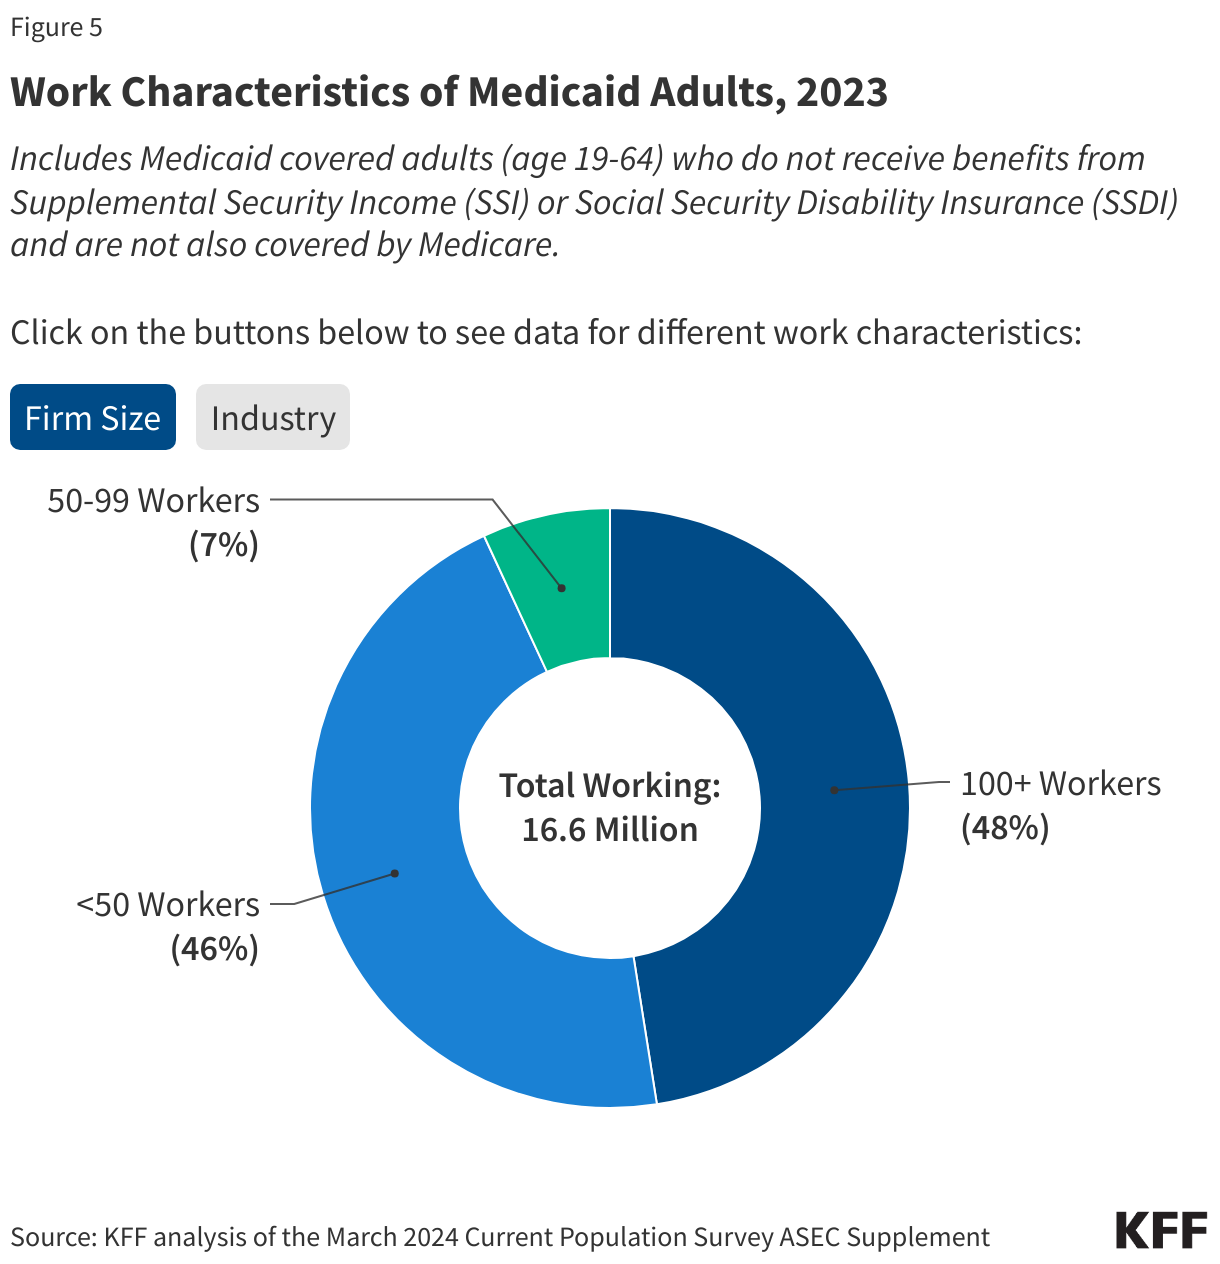
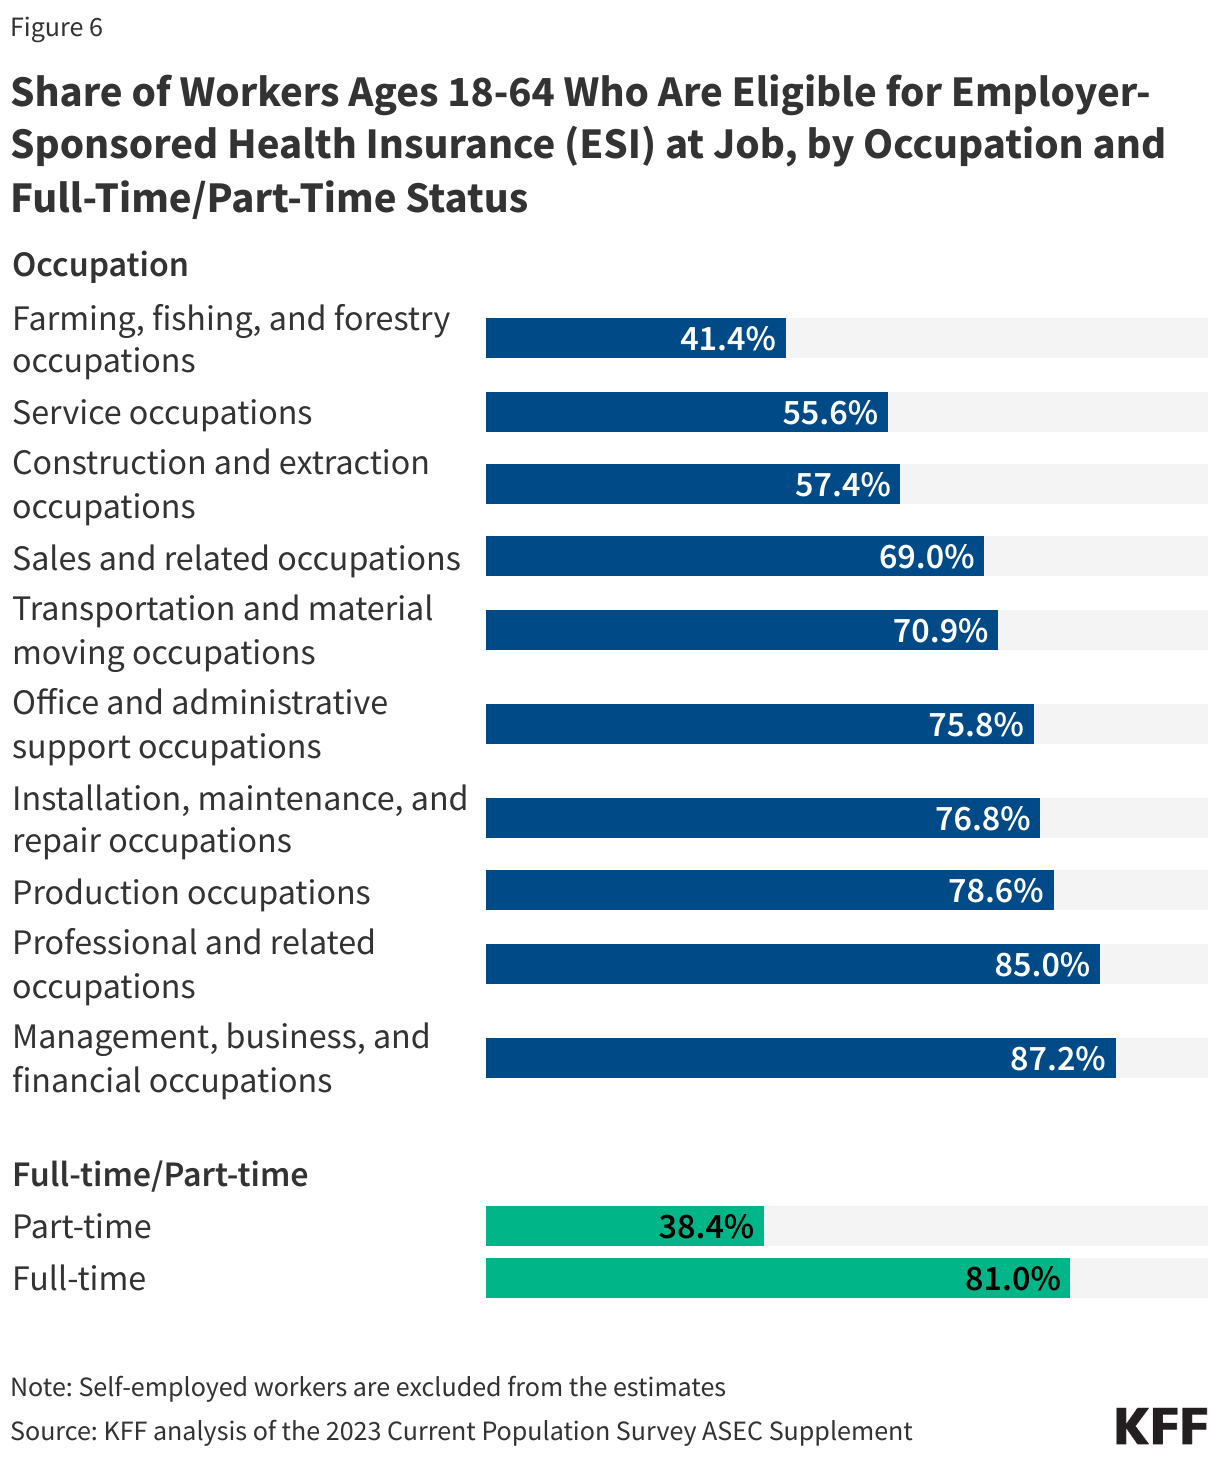
Many Medicaid adults who work are employed by small firms and are not eligible for employer-sponsored health insurance at their job. In 2023, nearly five in ten (46%) Medicaid workers were employed in firms with fewer than 25 employees, which are not subject to ACA penalties for not offering affordable health coverage and are less likely to offer health insurance to their workers than larger firms (Figure 5). In 2022, just over half (53%) of firms with fewer than 50 employees offered health insurance to their workers compared to 98.7% of firms with 100 or more employees. In addition, many Medicaid workers are employed in industries with historically low ESI offer rates, such as the agriculture and service industries (46%). Among all workers employed in farming, fishing, and forestry occupations, only about four in ten (41.4%) were eligible for insurance at their job in 2023, and among those in service occupations, just over half (55.6%) were eligible (Figure 6). Access to job-based insurance for part-time workers is even more limited. Fewer than four in ten (38.4%) of all part-time workers were eligible for insurance through their job in 2023. But, even if eligible for job-based insurance, some workers, especially low-wage and part-time workers, may not take up the offer because it is not affordable to them.
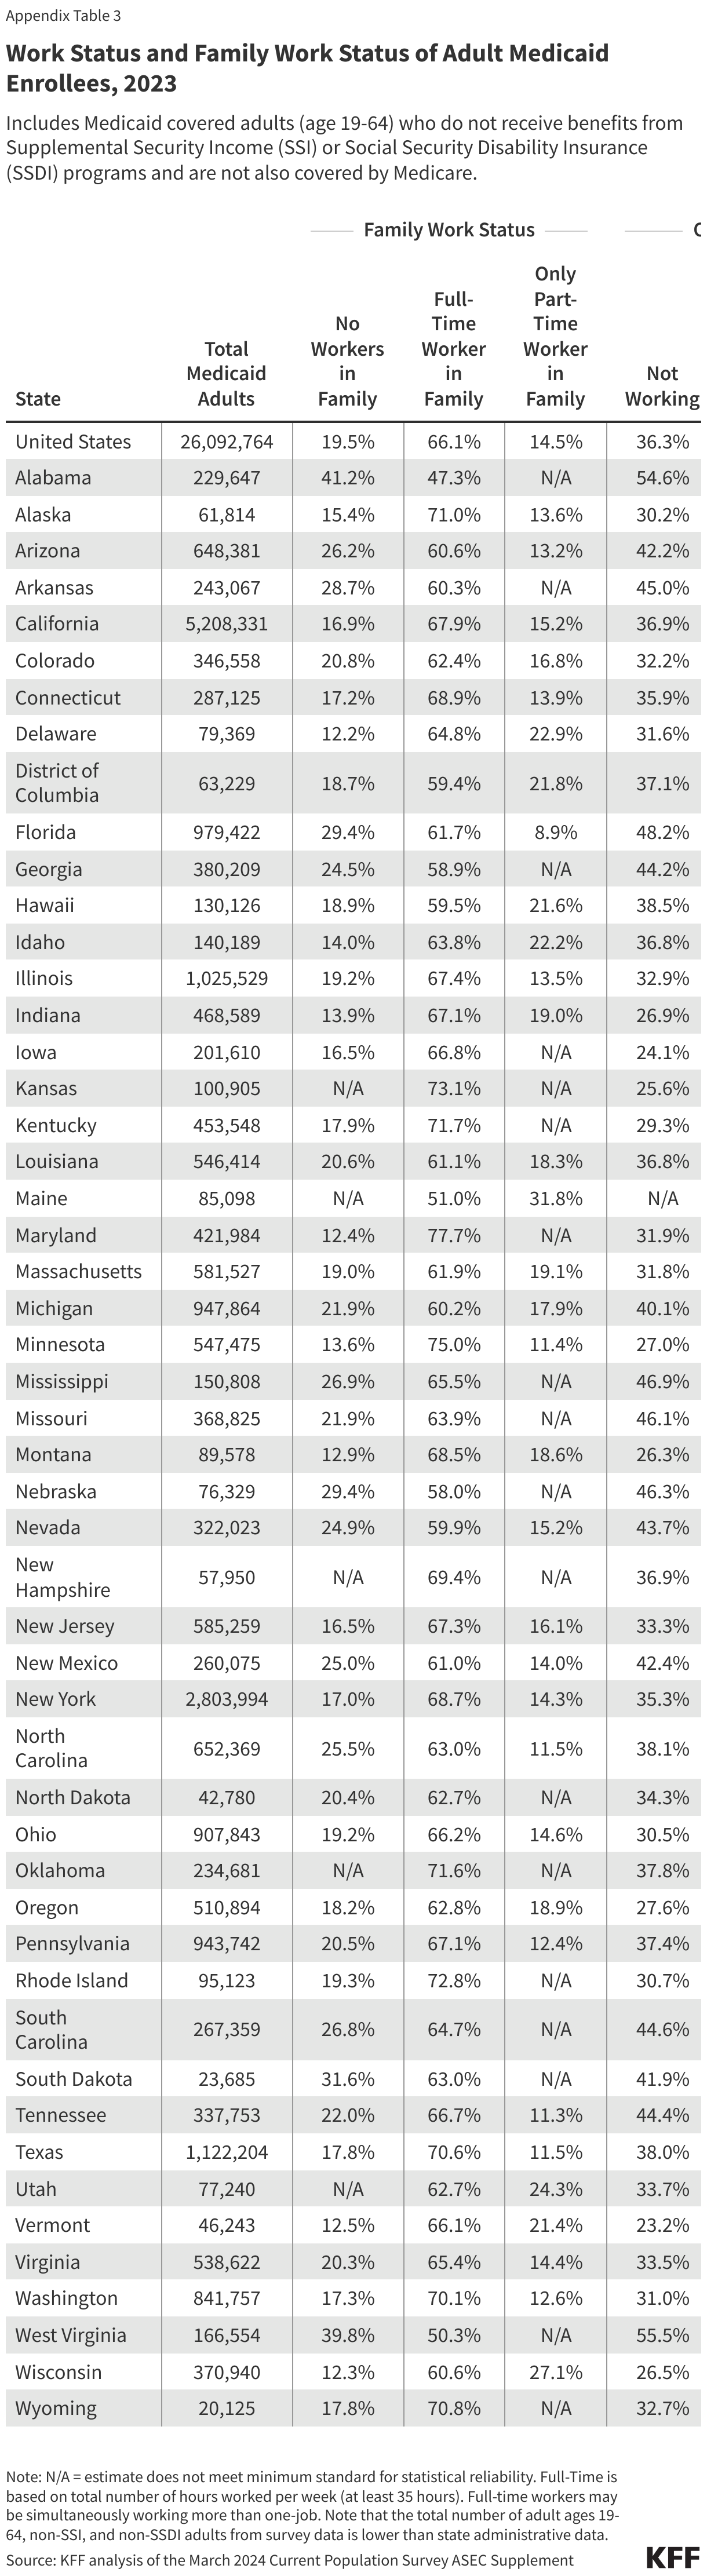
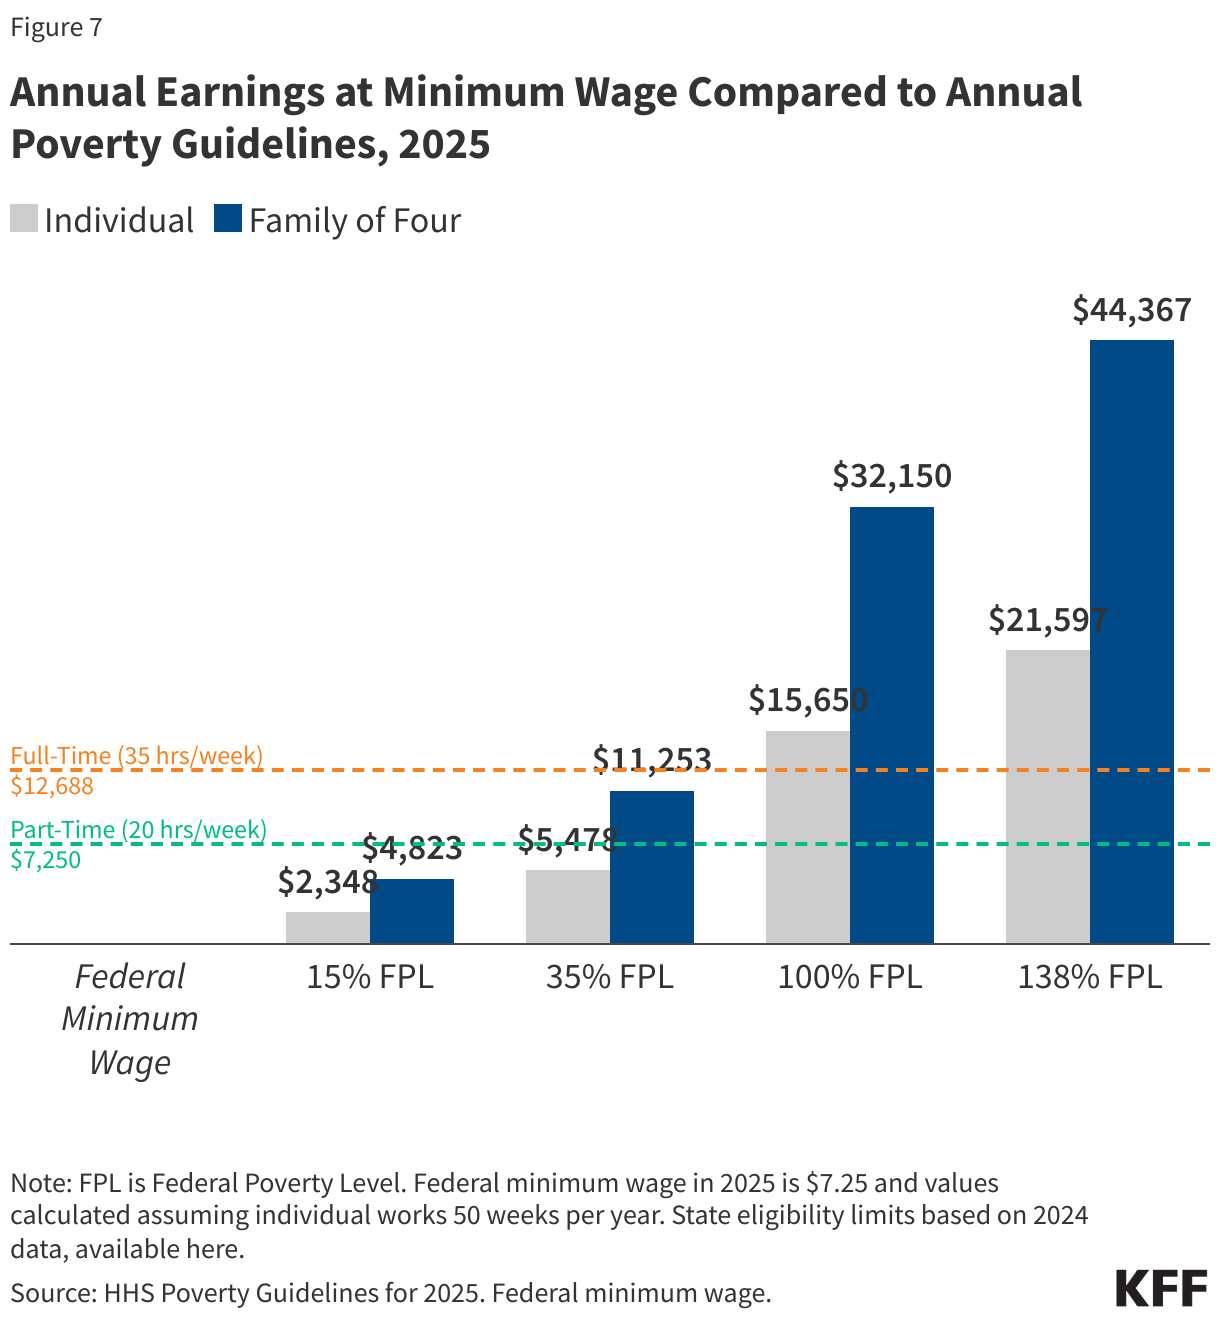
Medicaid adults who work full-time are eligible for Medicaid in expansion states because they work low-wage jobs and meet income eligibility criteria. An individual working full-time (35 hours/week) for the full year (50 weeks) at the federal minimum wage ($7.25 per hour) earns an annual salary of $12,688, which is well below the Medicaid eligibility limit of 138% of the Federal Poverty Level ($15,650 for an individual; $32,150 for a family of four) for adults ages 19-64 in states that have expanded Medicaid under the Affordable Care Act (ACA) (Figure 7). Thus, an adult with this income would be eligible for Medicaid in an expansion state. However, working adults may be ineligible for Medicaid in non-expansion states where the median eligibility limit for parents as of May 2024 was 35% of the FPL (and ranges from 15% in Texas to 100% in Wisconsin) and childless adults are not eligible (except in Wisconsin, where they are covered under a Section 1115 waiver).
Appendix