Political Preferences and Views on U.S. Immigration Policy Among Immigrants in the U.S.: A Snapshot from the 2023 KFF/LA Times Survey of Immigrants
Findings
Immigration has been a hot-button issue in U.S. political debate for decades, with policymakers trying to balance economic, security, and humanitarian concerns, and candidates on both sides using immigration talking points to appeal to their base. Immigration policy at the federal level has often shifted dramatically between presidential administrations, and enforcement differs between states. However, debates over immigration policies, including those that restrict or promote pathways to citizenship and access to benefits for undocumented immigrants, often leave out the viewpoints of immigrants themselves, and in some cases, immigrant feel they are treated as pawns in a political game.
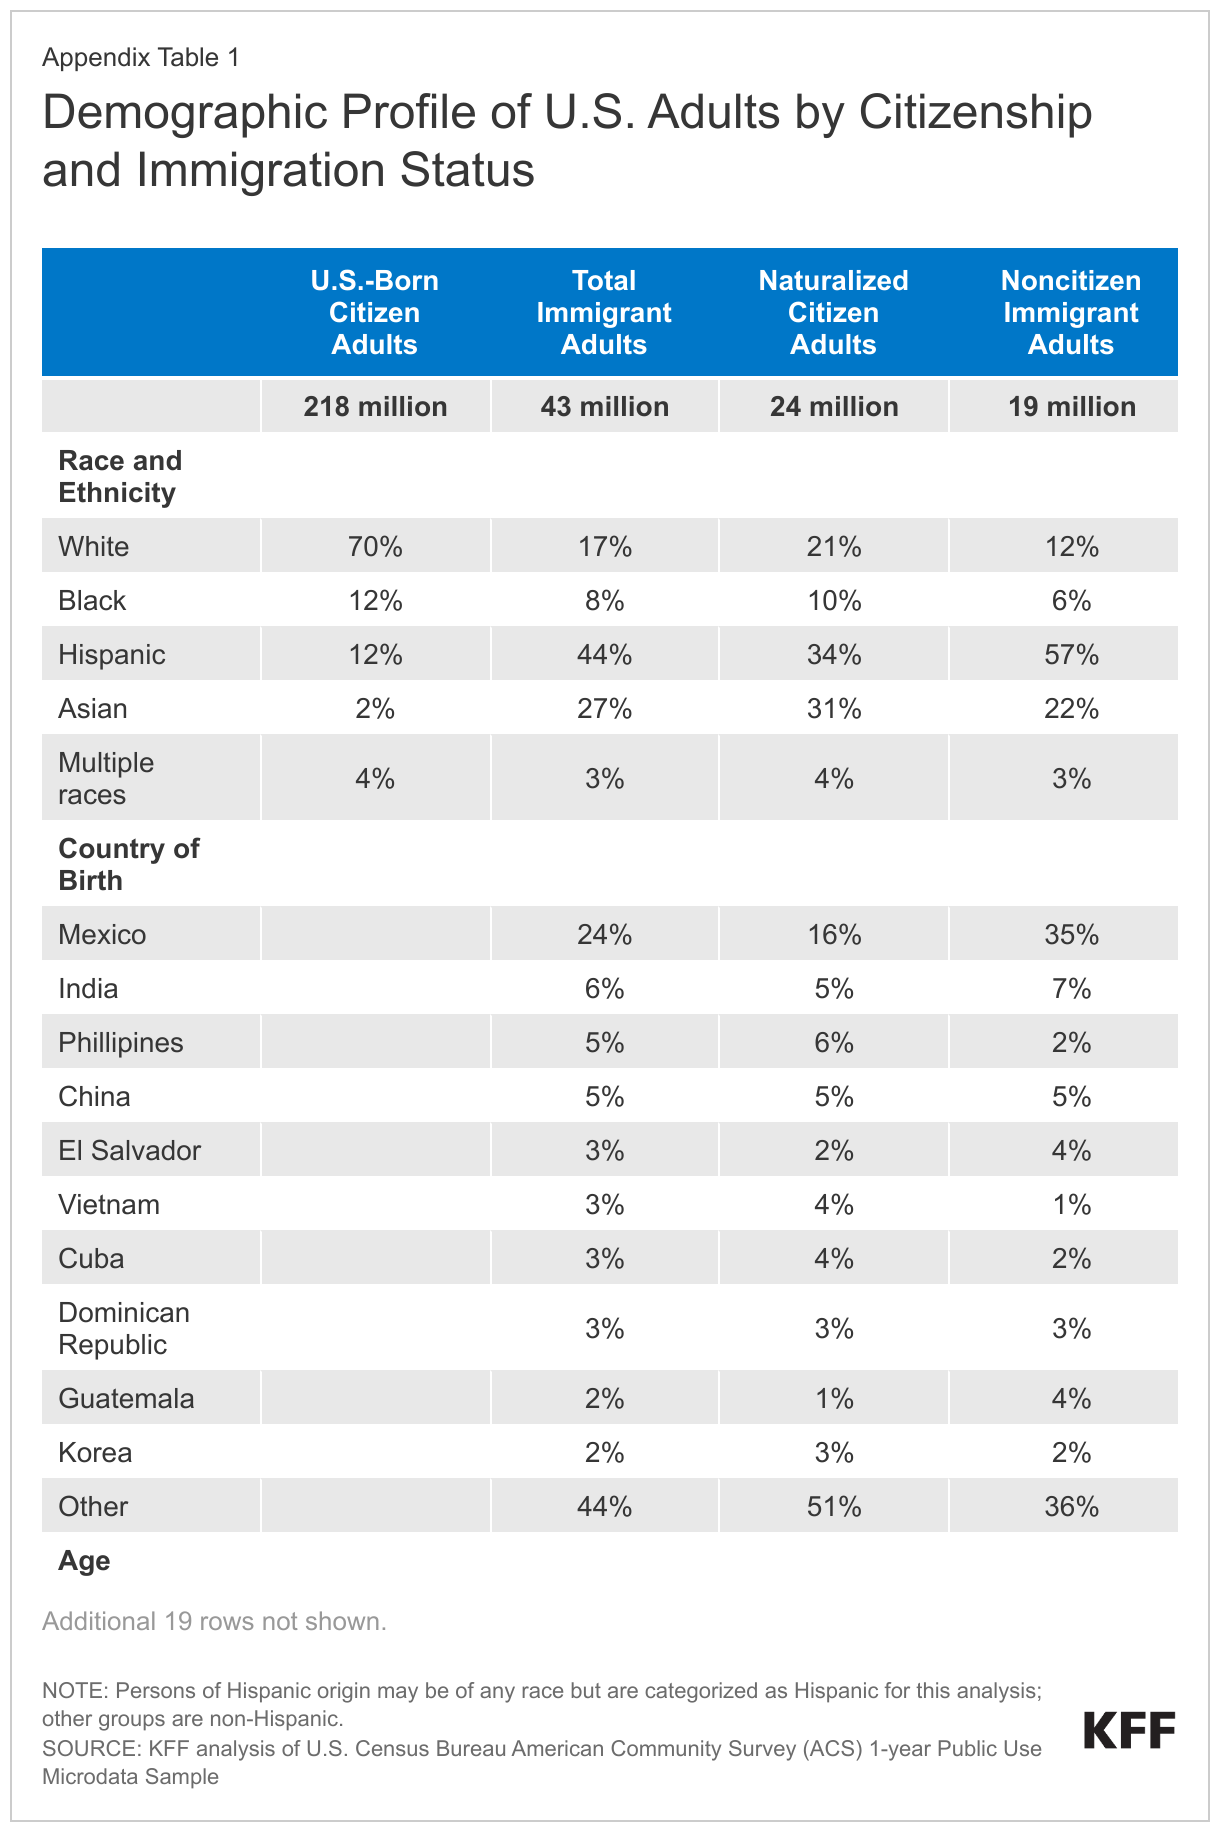
A majority of immigrants are naturalized citizens (58%) and thus eligible to vote in U.S. elections, but their views are not often explored in polls of the general public. Immigrants who are noncitizens may have other ways to influence the U.S. political process, but many face language barriers and immigration-related fears that make it difficult for them to engage in the political process.
The Survey of Immigrants, a partnership between KFF and The Los Angeles Times, is the largest nationally representative survey focused on immigrants, interviewing 3,358 immigrant adults in 10 languages. This report focuses on the political engagement, attitudes, and policy preferences of the growing immigrant population in the U.S.
Highlights
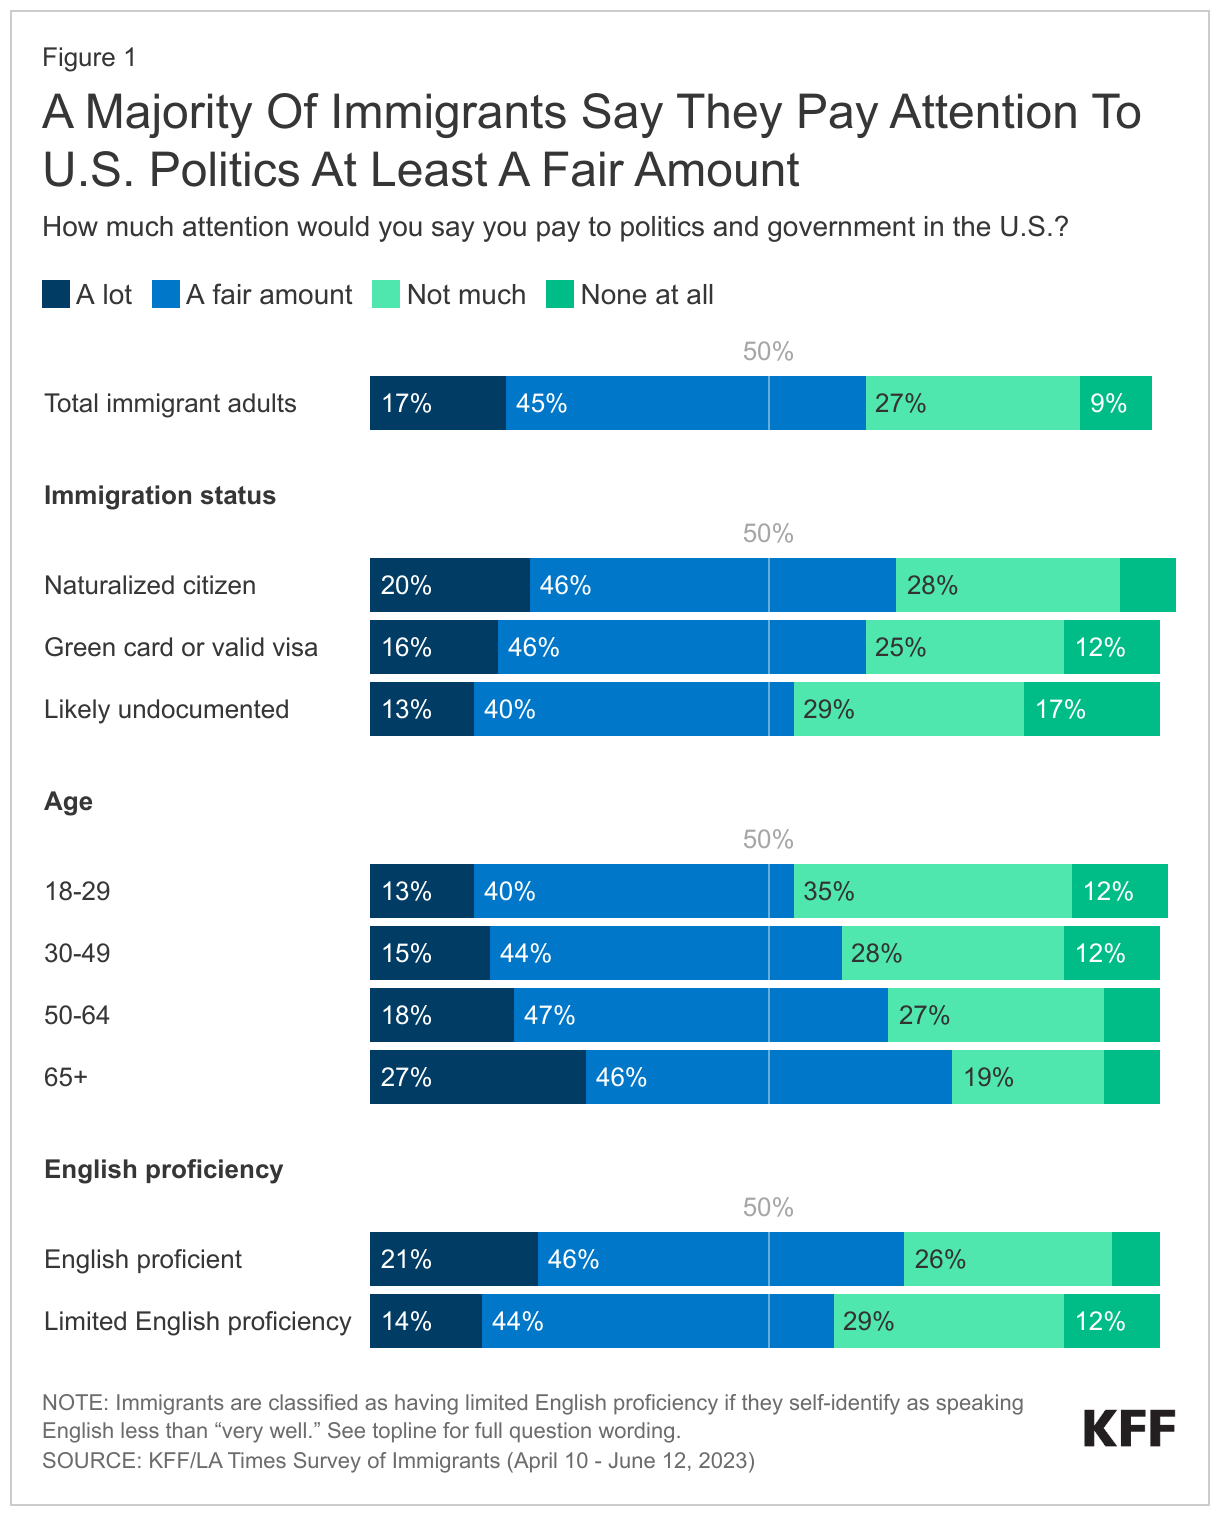
- Most immigrants (62%) say they pay attention to politics and government in the U.S. a least a “fair amount,” though few (17%) say they pay “a lot” of attention. Older immigrants, naturalized citizens and those who are English proficient are among the most likely groups of immigrants to say they pay a lot of attention to U.S. affairs.
- Immigrants, including naturalized citizens, lean more towards the Democrats when asked which political party represents their own views, which party best represents the interests of immigrants overall, and whether immigrants were better off under the Biden or Trump presidencies.
- However, many immigrants do not feel that their views or the interests of immigrants generally are well represented by either of the two major U.S. political parties, and half of all immigrants say that who the president is makes no difference in the lives of immigrants.
- Like most U.S.-born adults, a large majority (79%) of immigrant adults support allowing undocumented immigrants who were brought to the U.S. as children to apply for citizenship. A smaller majority of immigrants (59%) also supports allowing undocumented immigrants to sign up for government-sponsored health insurance, though immigrants who are naturalized citizens are split on this question and a majority (69%) of U.S.-born adults are opposed.
Attention to Politics and Political Leanings of Immigrants
Most immigrants report paying at least some attention to U.S. politics, with those who are older, English proficient, and naturalized citizens being the most engaged. About six in ten (62%) immigrants say they follow politics and government in the U.S. a lot (17%) or a fair amount (45%), with majorities across age and immigration statuses saying they follow it at least a fair amount. Immigrants ages 65 and older, naturalized citizens, and immigrants who speak English at least “very well” are most likely to report that they pay “a lot” of attention to politics and government in the U.S.
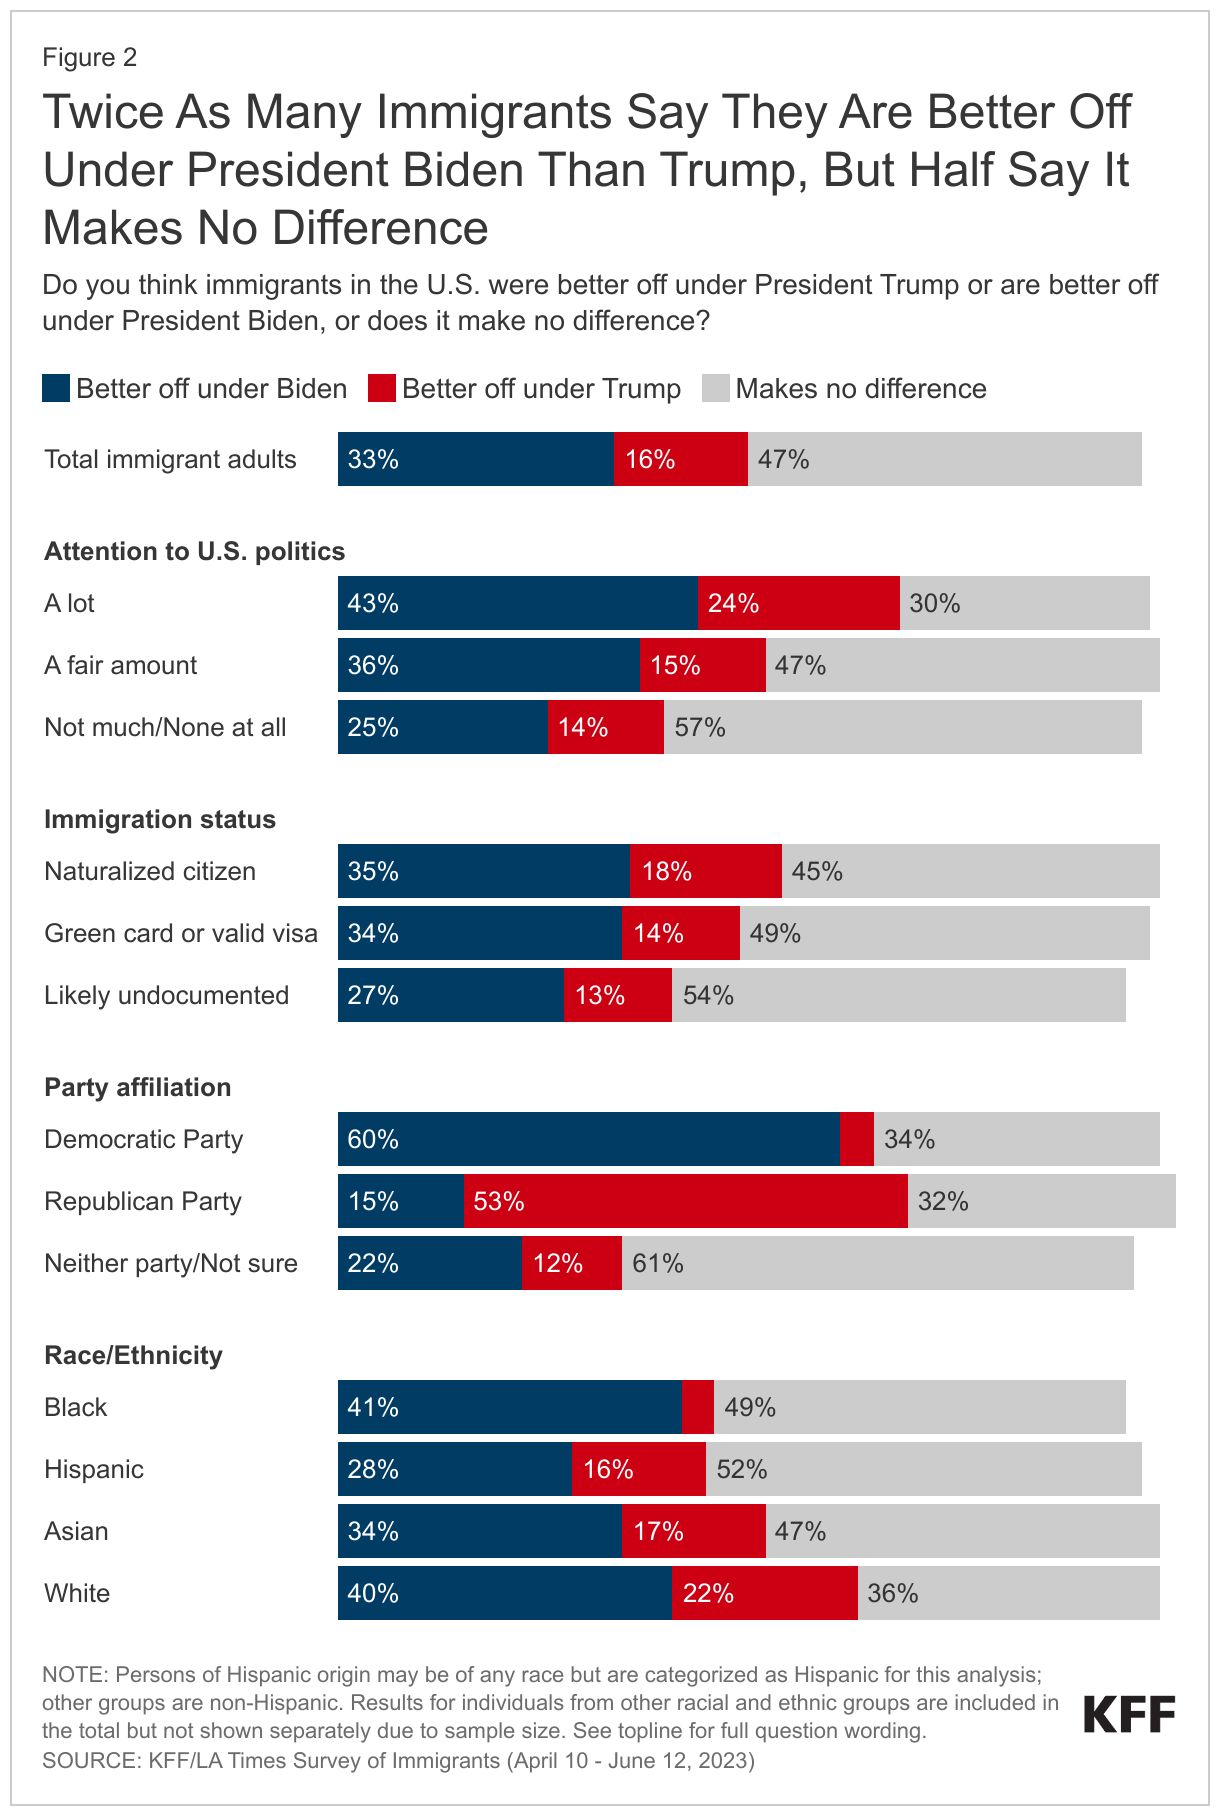
Twice as many immigrants say that immigrants in general are better off under a Biden presidency than a Trump presidency, but about half say who the president is makes no difference in the lives of immigrants. One in three (33%) say immigrants are better off under Biden, and one in six (16%) say immigrants were better off under Trump.
Immigrants who say they follow U.S. politics “a lot” or “a fair amount” are more likely than those who do not to say who the president is makes a difference, yet across levels of political interest, immigrants lean towards President Biden when asked which recent president was better for immigrants. While, unsurprisingly, six in ten immigrants who say they are best represented by the Democratic Party say immigrants are better off under Biden and about half (53%) of Republican-identifying immigrants say immigrants are better off under Trump, one-third of immigrants who say they are best represented by either the Democrats (34%) or Republicans (32%) say it “makes no difference” who the president is.
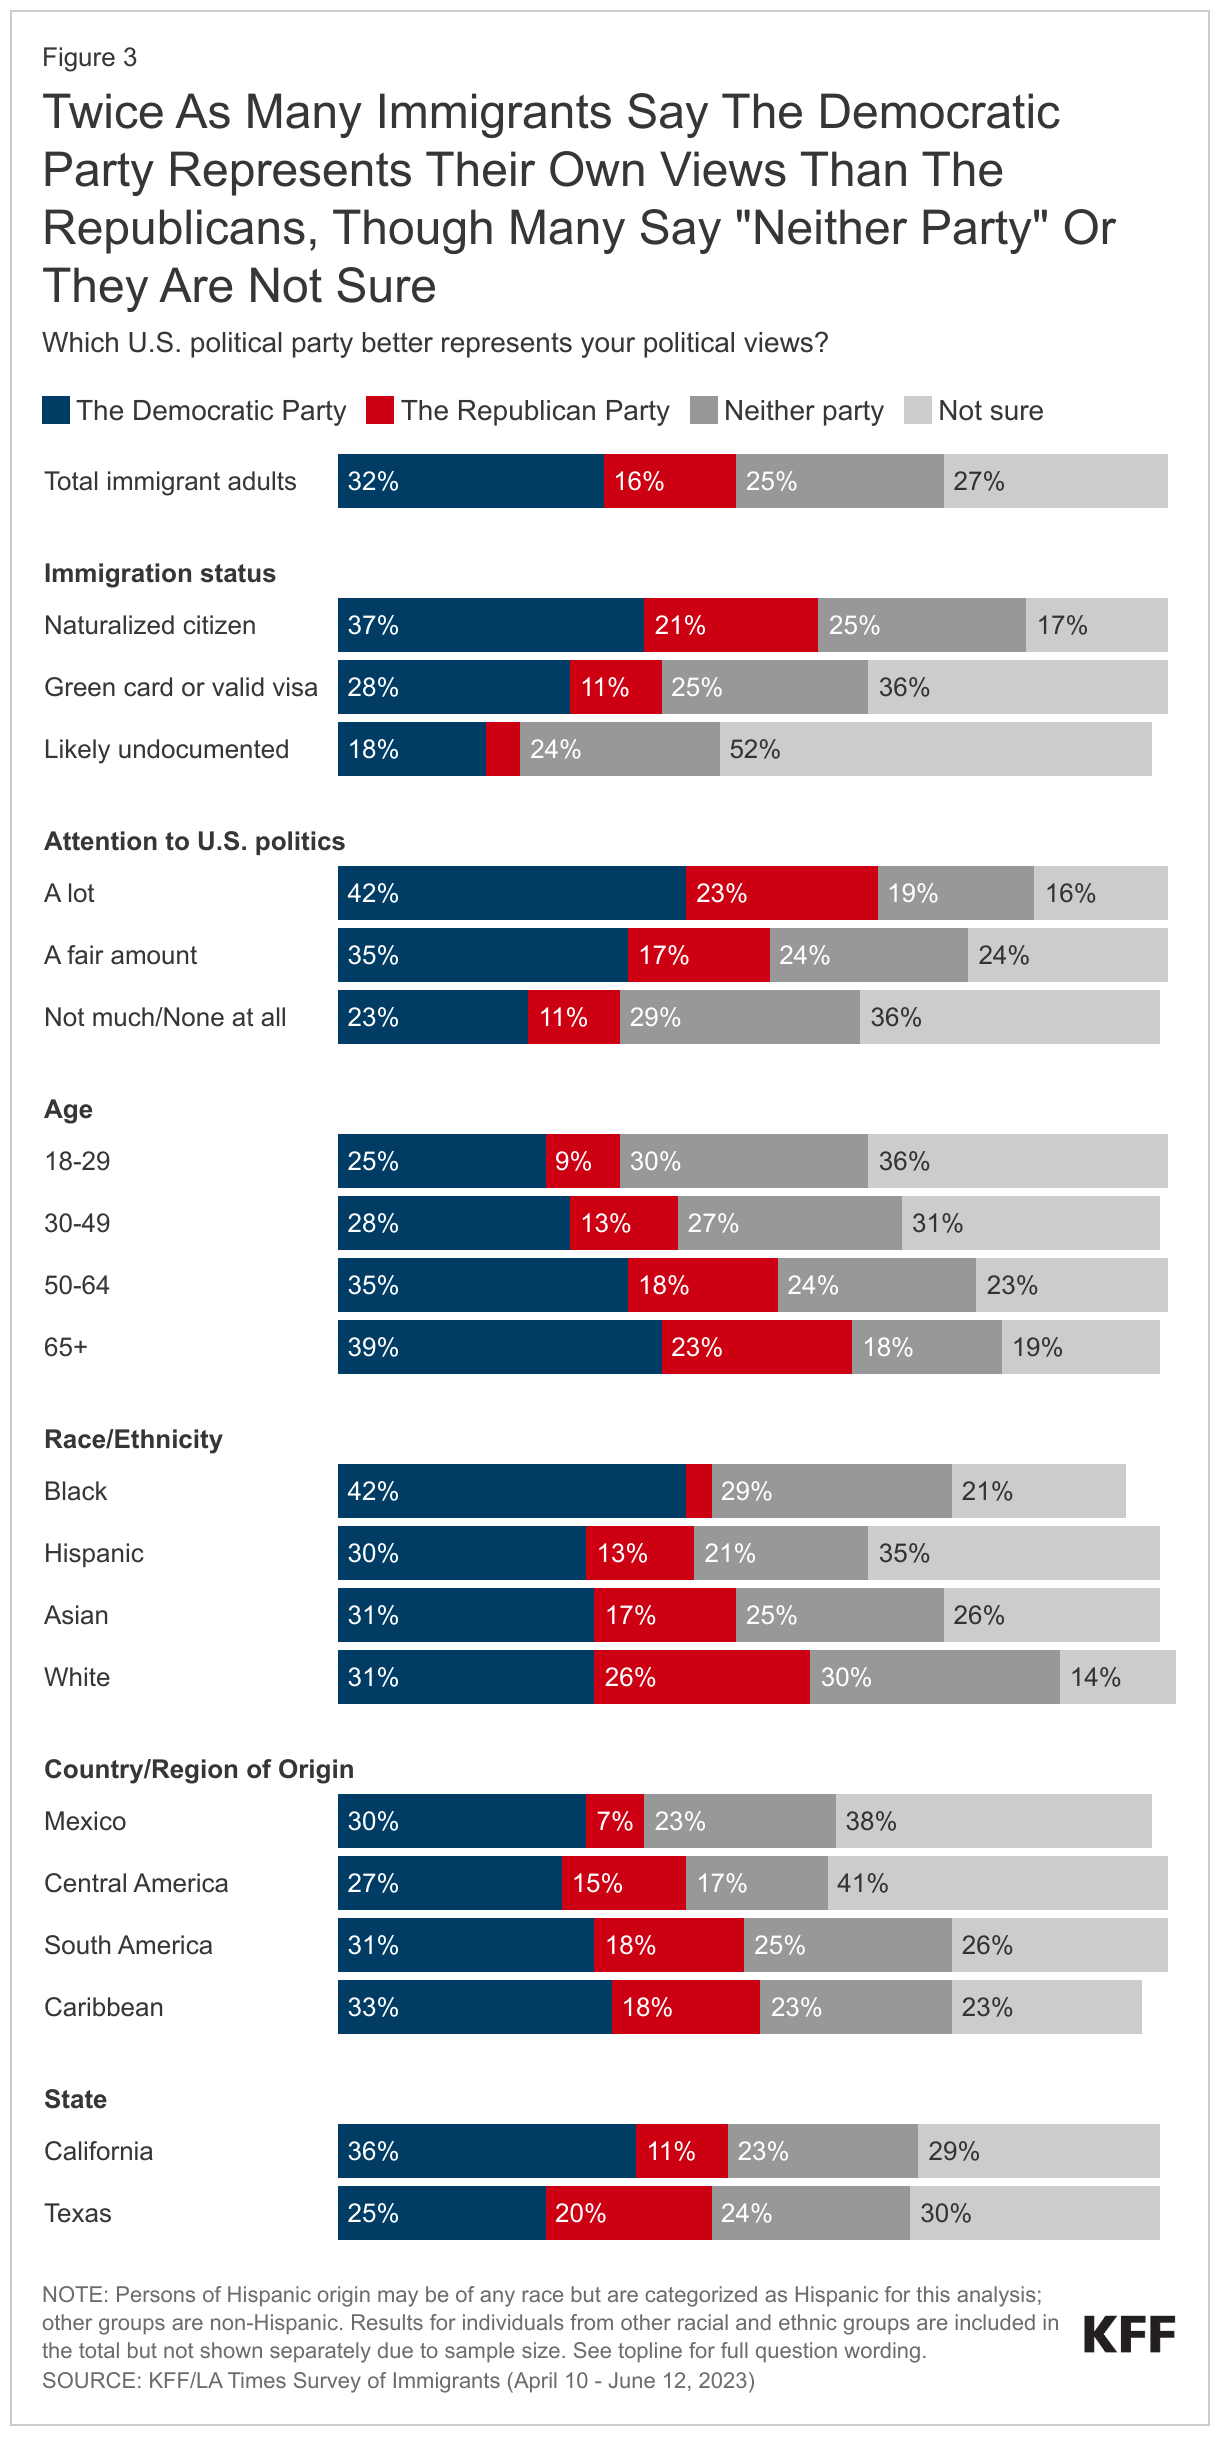
Larger shares of immigrants say that the Democratic Party represents their own personal political views better than the Republican Party. Immigrants overall are twice as likely to say that the Democratic Party (32%) represents their political views better than the Republican Party (16%). However, this still leaves about half of immigrants saying that neither party (25%) best represents their views or that they are not sure (27%). Majorities of undocumented immigrants (76%), recent immigrants (67%), immigrants who do not pay attention to U.S. politics (65%), and younger immigrants (ages of 18 and 29) (65%) say they are “not sure” or that neither party represents their political views.
Immigrants differ by race and ethnicity on their partisan leanings, with Hispanic, Asian, and Black immigrants leaning towards the Democratic Party and White immigrants more evenly split between saying the Democratic and Republican parties best represent their views. Across racial and ethnic groups, large shares—between four in ten and six in ten—say neither party best represents them or that they are not sure.
Although more Hispanic immigrants say they feel better represented by the Democratic Party, there are some differences by country or region of origin. Immigrants from South America (18%), Central America (15%), and the Caribbean (18%) are about twice as likely as those from Mexico (7%) to say the Republican Party best represents their political views. Roughly equal shares—three in ten—across these countries and regions say they feel represented by the Democrats, though larger shares of immigrants from Central America (41%) and Mexico (38%) say they are “not sure” which party better represents their views compared to those from South America (26%) or the Caribbean (23%). Among immigrants from Asia, there are few differences by country or region of origin.
Immigrants in California are more likely to say the Democratic party represents their views (36%) while a smaller share in Texas says the same (25%). Yet in both states, about three in ten immigrants say they are not sure and about one in four say neither party better represents their political views.
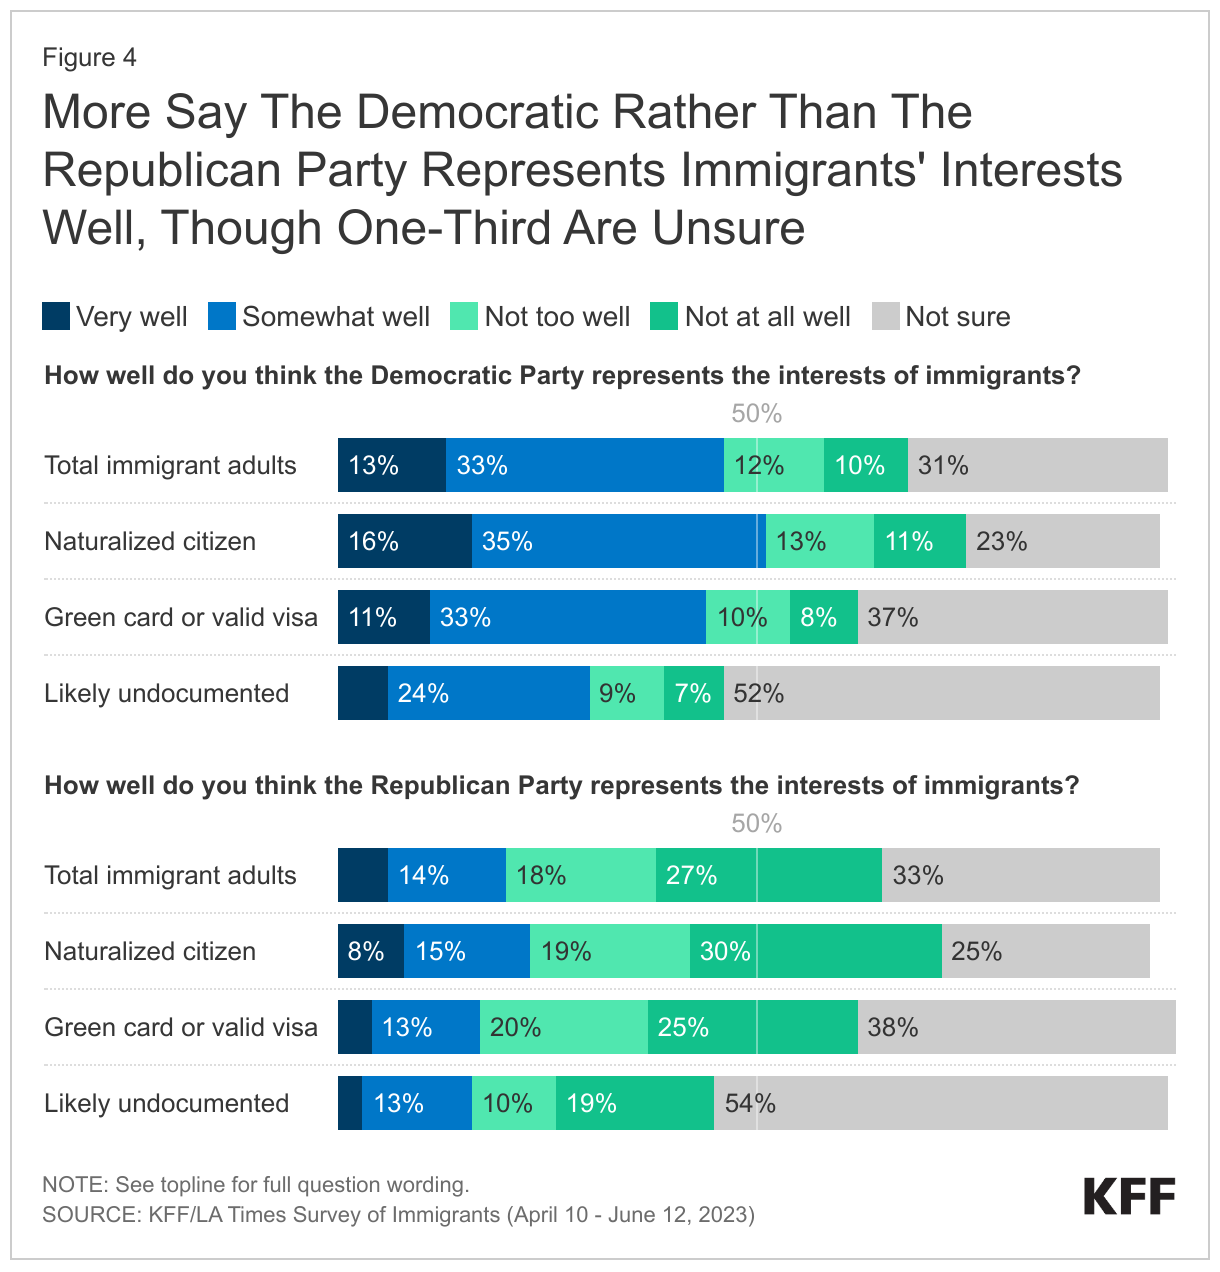
Nearly half of immigrants (46%) say they think the Democratic Party represents the interests of immigrants at least “somewhat well,” more than twice the share who say the same about the Republican Party (20%). Immigrants across immigration statuses are more likely to say the Democratic Party represents immigrants’ interests well than the Republican Party. Three in ten say they are “not sure” about how well the Republican (33%), or Democratic (31%) Parties represent the interests of immigrants. Noncitizens are more likely to say they are “not sure” how well each of the political parties represent the interests of immigrants.
In Their Own Words: Views and Attitudes Towards U.S. Politics and Enforcement Policies
In focus groups, many immigrants expressed that they felt their lives were better off under President Biden than President Trump, though some participants expressed that who the president is does not matter. Many said they feel they are “used as pawns” or “just for their vote.” When asked whether they think their voices are heard, many in these focus groups expressed that they thought voting “doesn’t make a difference,” and many voiced frustrations with the U.S. political system. These mixed feelings are captured in the quotes below.
“I feel the whole thing about politics and immigration is like putting the immigrants as a bait. I see a lot of promises. They come to power and say we are going to do this and that for the immigrants but nothing ever happens. But I feel personally they put the immigrants as bait and of course everybody is better than Trump, which I have to agree but I don’t see any progress.” – 47-year-old Indian immigrant woman in New York
“I feel like they give us the right by voting when a Latino can vote. But other than that, forget it. They just take our vote.” – 36-year-old Mexican immigrant woman in Texas
“During that Trump Administration he built his platform on being stricter on immigration specifically. He said we are going to send out ICE agents to capture all the illegal immigrants and there [were] videos in the media of people being arrested and deported. My family, although we are of legal status here, the process for getting to that point for us was very traumatic. So even though we were of legal status, we still felt scared because all that kind of very extremist stuff about anti-immigration was very scary.” – 24-year-old Korean immigrant woman in New York
“I feel more human right now. Even if the money is not doing well, I feel human. Those of us who are here, we would want documents but I am very pleased that our current President [Biden] gives asylum to refugees” – 34-year-old Mexican immigrant woman in California
Attitudes Towards Immigration Policies
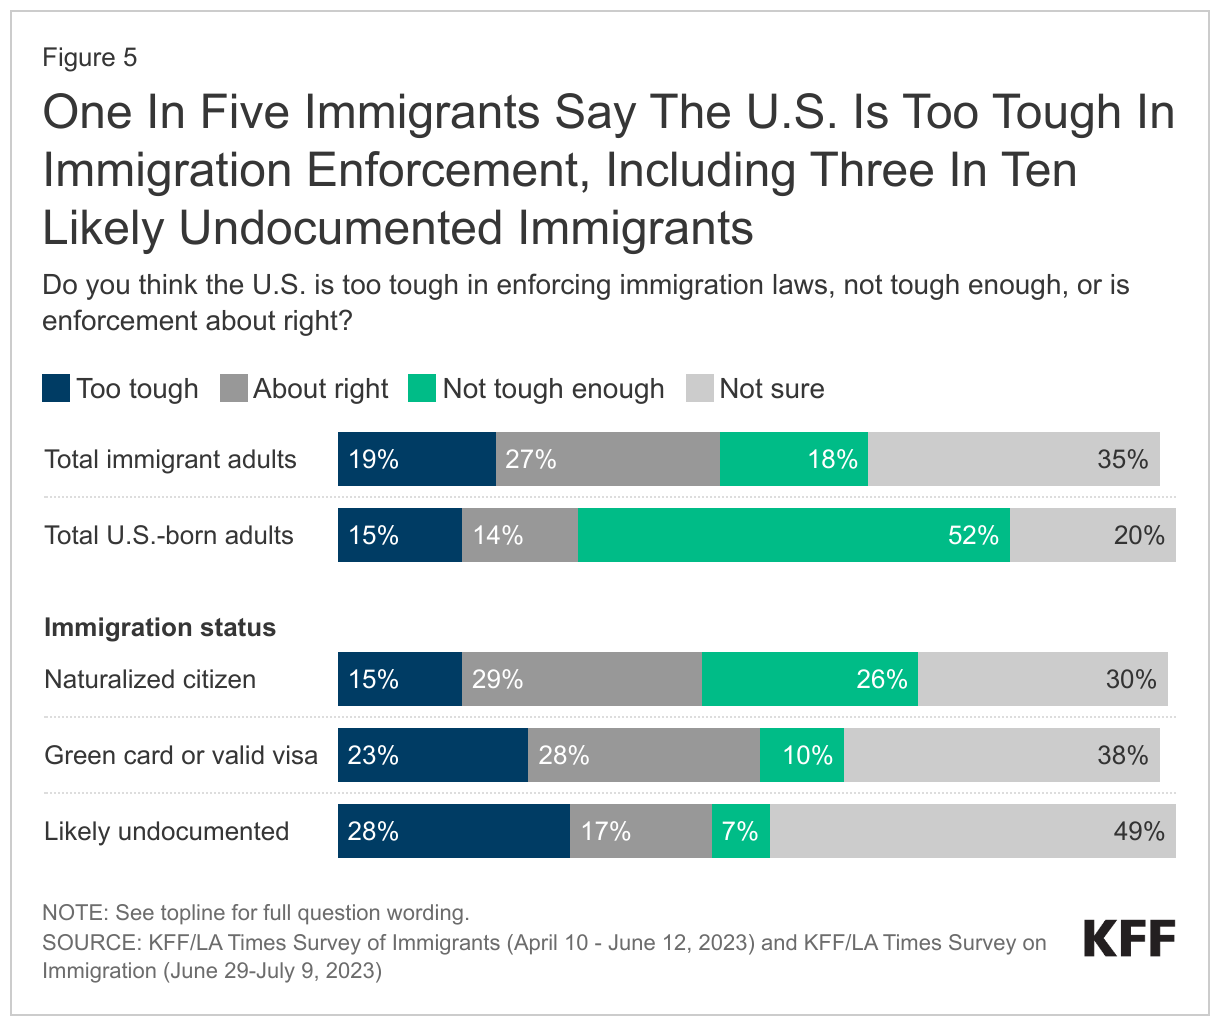
Immigrants have mixed views in their assessments of whether U.S. enforcement of immigration laws is too tough or not tough enough, which stands in stark contrast to the views of U.S.-born adults.1 About one in five immigrant adults say the U.S. is “too tough” (19%) and a similar share say the U.S. is “not tough enough” (18%) in enforcing immigration laws, while about one-fourth (27%) say enforcement is “about right,” and about one-third (35%) say they are not sure. U.S.-born adults are much more likely to say that enforcement of these laws is “not tough enough” (52%), while one in six say enforcement is “too tough” (15%) or “about right” (14%). Immigrants vary somewhat in their assessments of immigration enforcement by immigration status, as naturalized citizens are somewhat more likely to say the U.S. is not tough enough in enforcement, while those who are likely undocumented are more likely to say they are “not sure.”
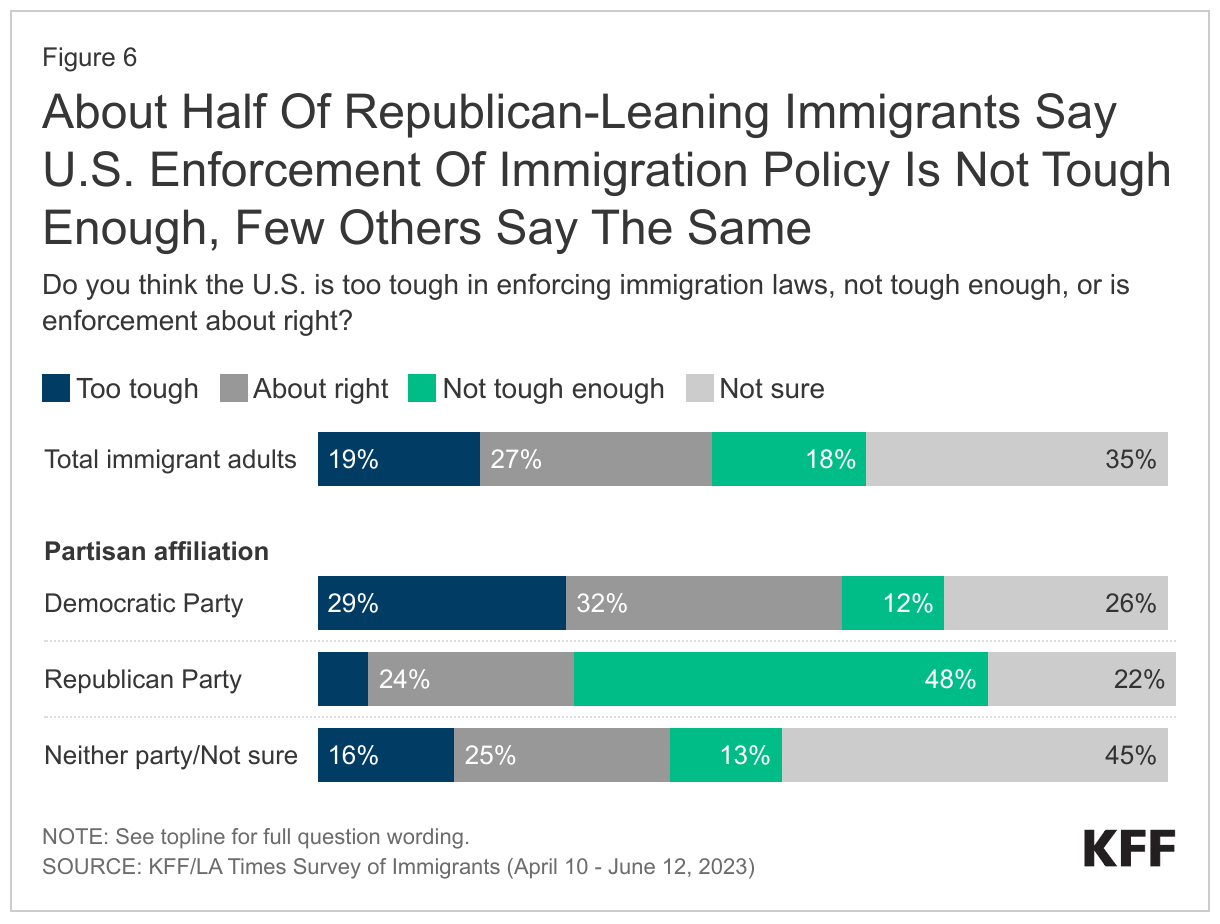
Immigrants’ views on U.S. enforcement of immigration laws are also largely divided by their political leanings. Immigrants who say their views are best represented by the Democratic Party (referred to here as Democratic-leaning) are more likely than Republican-leaning immigrants or immigrants who do not feel represented by either political party to say that enforcement in the U.S. is “too tough” (29%). Republican-leaning immigrants are most likely to say that enforcement in the U.S. is “not tough enough” (48%). However, many immigrants are not sure if immigration enforcement in the U.S. is too tough or not, including about one in four Democratic-leaning (26%) immigrants, one in five Republican-leaning (22%) immigrants and 45% of immigrants who do not have a political leaning.
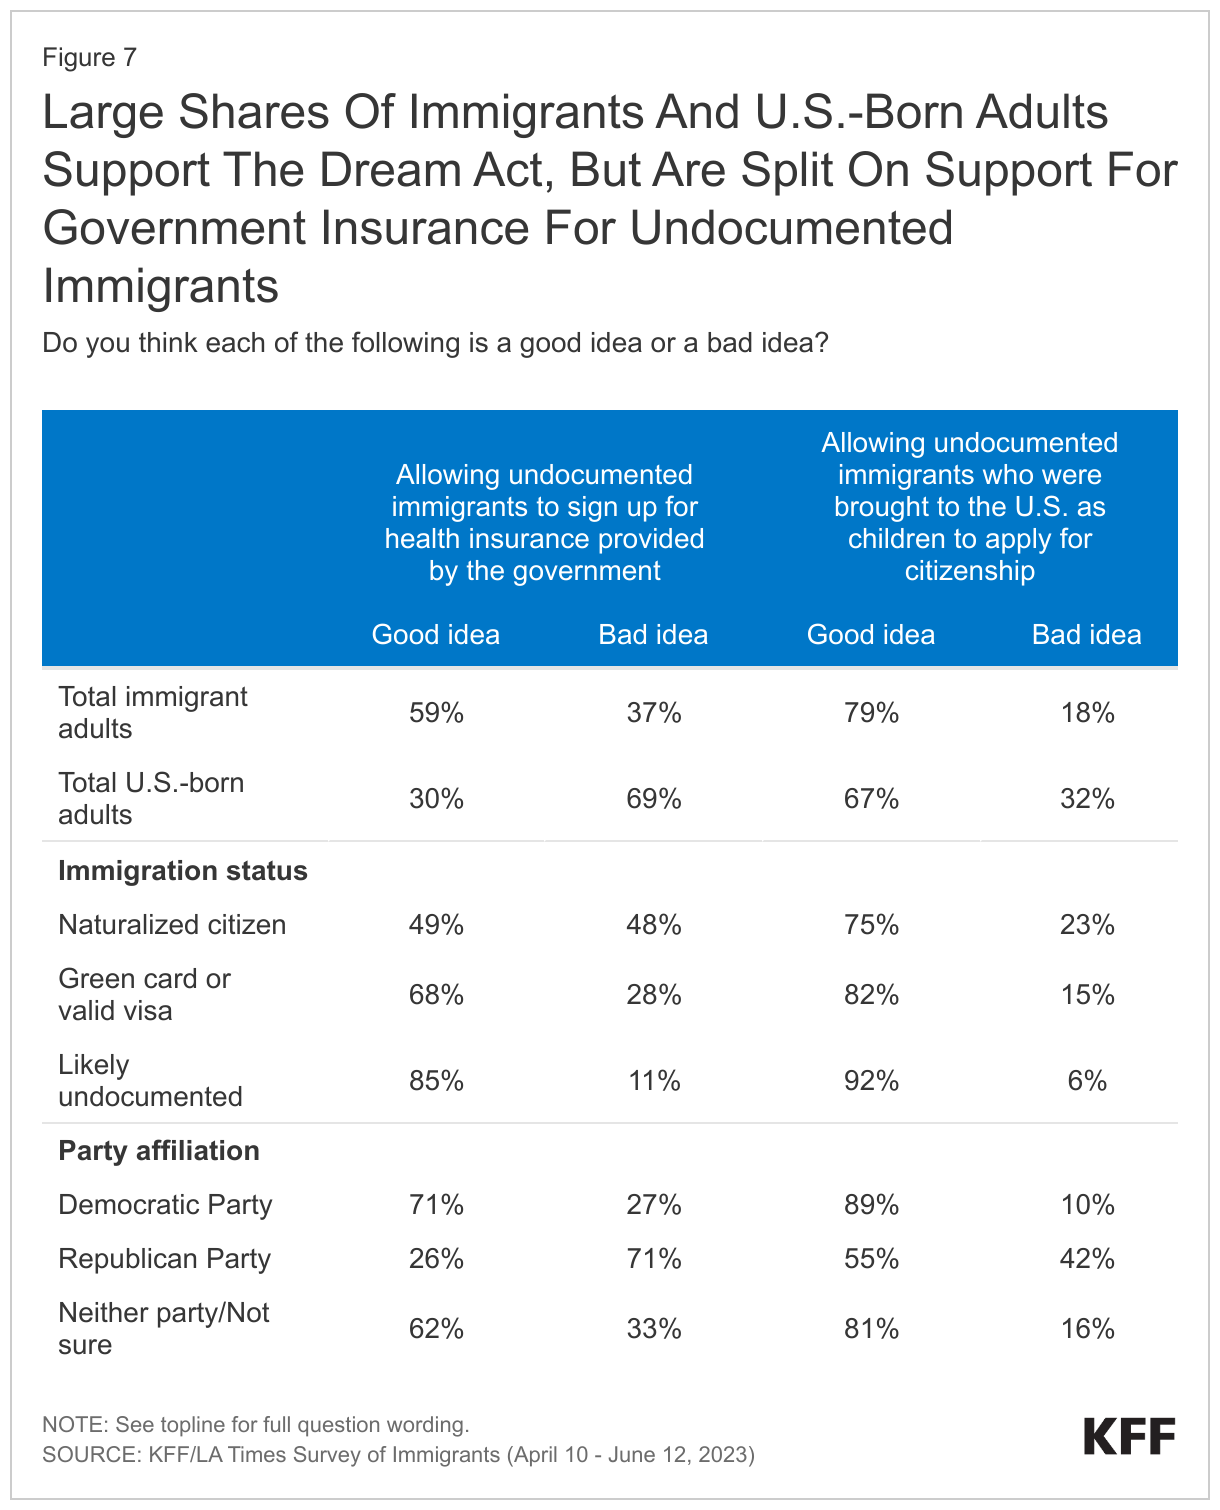
The idea of allowing undocumented immigrants who were brought to the U.S. as children to apply for citizenship is widely popular, with about eight in ten immigrants (79%) and two-thirds of U.S.-born adults saying this is a “good idea.” This proposal has been introduced to Congress in a variety of forms over the past two decades as The Development, Relief, and Education for Alien Minors Act, or DREAM Act, but has failed to pass. Immigrants across partisan affiliation and citizenship status largely support the policy, though fewer (55%) Republican-leaning immigrants say this is a good idea. Under the Deferred Action for Childhood Arrivals (DACA) program created in 2012, eligible young adults who were brought to the U.S. as children can receive protection from deportation and work authorization for temporary, renewable periods. However, DACA does not provide a pathway to U.S. citizenship, and the federal government is not currently processing new DACA requests due to court orders.
While a majority of immigrants support allowing undocumented immigrants to sign up for government-sponsored health insurance, a majority of U.S.-born adults say this is a “bad idea.” Nearly twice the share (59%) of immigrants than U.S.-born adults (30%) say this policy is a “good idea.” Even still, immigrants are split by immigration status and partisan affiliation on their support for this policy. Immigrants who are likely undocumented or lawfully present are more likely to say this policy is a “good idea” (85% and 68%) while naturalized citizens are split, with half saying it is a “good idea” (49%) and half saying it is a “bad idea” (48%). Similar shares of Democratic-leaning immigrants say the policy is a good idea (71%) and Republican-leaning immigrants say it is a bad idea (71%).
Notably, these questions did not offer arguments for or against the policies, and support may be higher or lower in a more contextualized situation.
KFF would like to thank the Association of Asian Pacific Community Health Organizations, the Black Alliance for Just Immigration, Dr. May Sudhinaraset, the National Immigration Law Center, the National Resource Center for Refugees, Immigrants, and Migrants, and UnidosUS for their invaluable inputs, insights, and suggestions throughout the planning, fielding, and dissemination of this survey project.
Methodology
The KFF/LA Times Survey of Immigrants is a partnership survey conducted by KFF and the LA Times examining the U.S. immigrant experience.
The survey was conducted April 10-June 12, 2023, online, by telephone, and by mail among a nationally representative sample of 3,358 immigrants, defined as adults living in the U.S. who were born outside the U.S. and its territories. Respondents had the option to complete the survey in one of ten languages: English (n=2,435), Spanish (n=627), Chinese (n=171), Korean (n=52), Vietnamese (n=22), Portuguese (n=16), Haitian-Creole (n=13), Arabic (n=9), French (n=9), and Tagalog (n=4). These languages were chosen as they are most commonly spoken by immigrant adults from countries of focus for the survey with limited English proficiency (LEP), based on the 2021 American Community Survey (2021).
Teams from KFF and The Los Angeles Times worked together to develop the questionnaire and both organizations contributed financing for the survey. KFF researchers analyzed the data, and each organization bears the sole responsibility for the work that appears under its name. Sampling, data collection, weighting, and tabulation were managed by SSRS of Glenn Mills, Pennsylvania in collaboration with public opinion researchers at KFF.
Respondents were reached through one of three sampling modes: an address-based sample (ABS) (n=2,661); a random digit dial telephone (RDD) sample of prepaid (pay-as-you go) cell phone numbers (n=565); and callbacks to telephone numbers that that were previously randomly sampled for RDD surveys and were identified as speaking a language other than English or Spanish (n=132). Respondents from all three samples were asked to specify their country of birth and qualified for the survey if they were born outside of the U.S.
Project design was informed by a pilot study conducted from January 31-March 14, 2022 among a sample of 1,089 immigrants in collaboration with SSRS. Prior to fielding the pilot study, KFF and SSRS conducted interviews with experts who had previous experience surveying immigrants. These conversations informed decisions on sampling, modes of data collection, recruitment strategies, and languages of interviews. The pilot test measured incidence of immigrant households across four different sample types and offered a short survey in 8 different languages both online and on the telephone. Based on the results of the pilot test, the following recruitment and data collection protocol was implemented:
Sampling strategy and interview modes:
The ABS was divided into areas (strata), defined by Census tract, based on the incidence of immigrants among the population overall and by countries of origin. Within each stratum, the sample was further divided into addresses that were flagged by Marketing Systems Group (MSG) as possibly occupied by foreign-born adults and unflagged addresses. To increase the likelihood of reaching immigrant adults, strata with higher incidence of immigrant households overall, and of immigrants from certain countries of origin were oversampled.
Households in the ABS were invited to participate through multiple mail invitations: 1) an initial letter in English with a short paragraph of instructions in each of the 10 survey languages on the back; 2) a reminder postcard in English plus up to two additional languages; 3) a follow-up letter accompanied by hardcopy questionnaires in English and one additional language; and 4) a final reminder including short messages in all 10 languages. For mailings 2 and 3, additional languages were chosen by using flags to identify the language other than English likely spoken at home. Invitation letters requested the household member ages 18 or older who was born outside of the U.S. with the most recent birthday to complete the survey in one of three ways: by going online, dialing into a toll-free number, or returning the completed paper questionnaire. In addition, interviewers attempted outbound calls to telephone numbers that were matched to sampled addresses. ABS respondents completed the survey online (n=2,087), over the phone (n=105), or by mail on paper (n=469). The random sample of addresses was provided by MSG.
The RDD sample of prepaid (pay-as-you-go) cell phone numbers was obtained through MSG. The prepaid cell phone component was disproportionately stratified to effectively reach immigrants from different countries based on county-level information. To increase the likelihood of reaching immigrant adults, counties with higher incidence of immigrants overall, and of certain countries of origin were oversampled.
The callback sample included 132 respondents who were reached by calling back telephone numbers that were previously randomly sampled for SSRS RDD surveys within two years and coded by interviewers as non-English or non-Spanish speaking.
Incentives:
Initial mailings to the ABS sample included $2 as part of the invitation package, and respondents received a $10 incentive if they completed the survey in the first two weeks after the initial mailing. In order to increase participation among under-represented groups, the incentive increased to $20 for those who did not respond within the first two weeks. ABS phone respondents received this incentive via a check received by mail, paper respondents received a Visa gift card by mail, and web respondents received an electronic gift card incentive. Respondents in both phone samples received a $25 incentive via a check received by mail.
Questionnaire design and translation:
In addition to collaboration between KFF and the LA Times, input from organizations and individuals that directly serve or have expertise in issues facing immigrant populations helped shaped the questionnaire. These community representatives were offered a modest honorarium for their time and effort to review questionnaire drafts, provide input, attend meetings, and offer their expertise on dissemination of findings.
After the content of the questionnaire was largely finalized, SSRS conducted a telephone pretest in English and adjustments were made to the questionnaire. Following the English pretest, Research Support Services Inc. (RSS) translated the survey instrument from English into the nine languages outlined above and performed cognitive testing through qualitative interviews in all languages including English. The results of the cognitive testing were used to adjust questionnaire wording in all languages including English to ensure comprehension and cohesiveness across languages and modes of interview. As a final check on translation and its overlay into the web and CATI program, translators from Cetra Language Solution reviewed each question, as it appears in the program, and provided feedback. The questionnaire was revised and finalized based on this feedback.
Data quality checks:
A series of data quality checks were run on the final data. The online questionnaire included two questions designed to establish that respondents were paying attention and cases were monitored for data quality. Fifteen cases were removed from the data because they failed two or more quality checks, failed both attention check questions, or skipped over 50% of survey questions. An additional 67 interviews were removed after deemed ineligible by SSRS researchers (they were not U.S. immigrants).
Weighting:
The combined sample was weighted to adjust for the sampling design and to match the characteristics of the U.S. adult immigrant population, based on data from the Census Bureau’s 2021 American Community Survey (ACS). Weighting was done separately for each of 11 groups defined by country or region of origin (Mexico, China, Other East/Southeast Asia, South Asia, Europe, Central America, South America, Caribbean, Middle East/North Africa, Sub-Sahara Africa, all others). The samples were weighted by sex, age, education, race/ethnicity, census region, number of adults in the household, presence of children in the household, home ownership, time living in the U.S., English proficiency, and U.S. citizenship. The overall sample was also weighted to match the share of U.S. adult immigrants from each country/region of origin group. The weights take into account differences in the probability of selection for each of the three sample types. This includes adjustment for the sample design and geographic stratification, and within household probability of selection. Subgroup analysis includes data checks to ensure that the weighted demographics of subgroups are within reasonable range from benchmarks whenever possible.
The margin of sampling error including the design effect for the full sample is plus or minus 2 percentage points. Numbers of respondents and margins of sampling error for key subgroups are shown in the table below. For results based on other subgroups, the margin of sampling error may be higher. Sample sizes and margins of sampling error for other subgroups are available by request. Sampling error is only one of many potential sources of error and there may be other unmeasured error in this or any other public opinion poll. KFF public opinion and survey research is a charter member of the Transparency Initiative of the American Association for Public Opinion Research.
| Group | N (unweighted) | M.O.S.E. |
| Total | 3,358 | ± 2 percentage points |
| Race/Ethnicity | ||
| Black immigrants | 274 | ± 8 percentage points |
| Hispanic immigrants | 1,207 | ± 4 percentage points |
| Asian immigrants | 1,318 | ± 4 percentage points |
| White immigrants | 495 | ± 6 percentage points |
| Immigration Status | ||
| Naturalized citizen | 2,134 | ± 3 percentage points |
| Green card or valid visa holder | 819 | ± 5 percentage points |
| Likely undocumented | 372 | ± 6 percentage points |
| English Proficiency | ||
| Speaks English only or “very well” | 1,713 | ± 3 percentage points |
| Speaks English “less than very well” | 1,635 | ± 3 percentage points |
Focus group methodology:
As part of this project, KFF conducted 13 focus groups with immigrant adults across the country to help inform survey questionnaire development, provide deeper insights into the experiences of immigrant groups that had a smaller sample size in the survey, and to provide a richer understanding of some of the survey findings.
Two rounds of focus groups were completed. The first round of 6 groups was conducted between September-October 2022 virtually among participants living across the country who are Hispanic immigrants (conducted in Spanish), Asian (excluding Chinese) immigrants (conducted in English), or Chinese immigrants (conducted in Mandarin Chinese). The groups were separated by gender, lasted 90 minutes, and included 5-7 participants each.
The second round of groups were conducted in-person between May-June 2023 in Los Angeles, CA and Fresno, CA with Hispanic immigrants conducted in Spanish; and in Houston, TX and Irvine, CA with Vietnamese immigrants conducted in Vietnamese. In addition, virtual groups were conducted among participants living in the Texas border region (Hispanic immigrants), the Miami, FL region (Haitian immigrants), and nationally (Black immigrants from sub-Saharan Africa). Groups were mixed gender, lasted between 90 minutes and two hours, and were conducted in English, Spanish, Vietnamese, and Haitian-Creole with 5-8 participants each.
For each group, participants were chosen based on the following criteria: Must be at least 18 years of age and have been born outside of the U.S. and its territories; for groups conducted in languages other than English, must speak English “less than very well” and be able to speak conversationally in the group’s language (i.e., Spanish). In addition, groups were chosen to represent a mix of household composition, including at least some participants who are parents; a mix of household income levels, with a preference for recruiting lower income participants; a mix of health insurance types; and a mix of immigration statuses. Goodwin Simon Strategic Research (GSSR) recruited and hosted the first round of focus groups. PerryUndem recruited and hosted the second round of focus groups. The screener questionnaire and discussion guides were developed by researchers at KFF in consultation with the firms who recruited and hosted the groups. Groups were audio and video recorded with participants’ permission. Each participant was given $150-$175 after participating.
Appendix

Endnotes
- u00a0u00a0Supplemental to the Survey of Immigrants, KFF also conducted a representative survey of 1,049 U.S.-born adults. to compare the immigrant and native-born experience. KFF/LA Times Survey of Immigrants: U.S. Born Adult Comparison (June 29 u2013 July 9, 2023). ↩︎
