KFF designs, conducts and analyzes original public opinion and survey research on Americans’ attitudes, knowledge, and experiences with the health care system to help amplify the public’s voice in major national debates.
This initial analysis examines the private stand-alone Part D drug plans will be available to Medicare beneficiaries in 2011 and provides an early look at key trends in the options, premiums, and other plan characteristics.
It finds that the average Medicare beneficiary will have a choice of 33 Part D stand-alone prescription drug plans in 2011, despite a 30 percent reduction in the total number of stand-alone plans available nationwide. Monthly premiums for stand-alone prescription drug plans will rise by 10 percent, on average, to $40.72 in 2011 if beneficiaries stay with their 2010 plans.
The analysis is based on the 2010 Medicare drug plan information released in late September by the Centers for Medicare & Medicaid Services. The analysis was conducted jointly by researchers at Georgetown University, the Kaiser Family Foundation and the National Opinion Research Center at the University of Chicago.
There is a lot of talk in polling and political circles and some speculation in the media about the role of health reform in the midterm elections. We regularly measure what the public thinks about health reform and you see reports from our monthly tracking polls about that. But whether those opinions will translate into an impact on people’s votes in the upcoming election is an entirely different question.
First, to understand what might happen in an election it is most useful to look at people who are actually going to vote, so we and others switch to samples of “likely voters” not the public in general or even registered voters as we get closer to an election. (It is important not to poll likely voters too early, before people have really focused on an upcoming election.) When we asked likely voters what one issue would be most important to their vote, no surprise, 38 percent picked the economy and jobs. Health reform was picked by 10 percent and was clumped with a number of issues as secondary concerns, including dissatisfaction with government and the budget deficit. The list was no different for seniors who tend to come out to vote in larger numbers in midterms or for independents.
Second, issues themselves, whether health reform or education or the environment or any of the major issues, are not the primary factor influencing voting decisions, especially in midterm elections where there are no presidential candidates to frame clear differences on national issues. We asked likely voters what big picture factors would influence their vote. In order of importance their answers were: the general direction of the nation (picked by 37 percent), specific national issues (21 percent), local and state issues (19 percent), and the candidate’s character and experience (19 percent). A candidate’s stance on issues are just one of many factors influencing voting in a midterm election. And even when it is a factor a candidate’s position on an issue is often more a proxy for voters of the candidate’s general world view (whether the candidate is for more government or less, for the little guy or pro business, and so forth). Most voters do not dissect candidates’ issue positions like experts or the media do.
We have seen many times in the past that our issue ranks second or third or fourth in polls on the public’s issue priority list but it has almost never been a factor in elections according to exit polls and other analyses. Think of it this way: if health reform (or the absence of it) truly influenced voting we probably would have seen action on health reform long before this year.
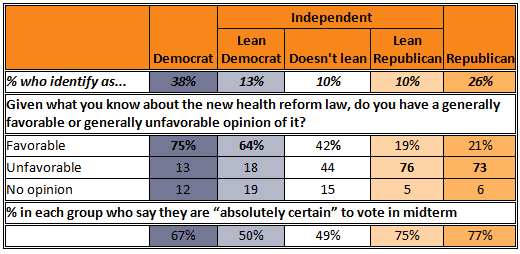
Third, there are relatively few votes left to sway with arguments about health reform in the next few months. Most Democrats currently support the law and most Republicans oppose it, and there are few independents remaining who are not already tilting Democratic or Republican to be moved with arguments about the health reform law. About a third of independents – a group which makes up about a third of the electorate – are closet Democrats; they tilt towards the Democrats and a strong majority of them support health reform. About a third of independents are closet Republicans; they lean Republican and oppose the law. That leaves a relatively small group of independents in the middle and they split about fifty/fifty on the health reform law. You can see this breakdown of independents from our September poll below.
Source: Kaiser Family Foundation Health Tracking Poll (conducted September 14-19, 2010)
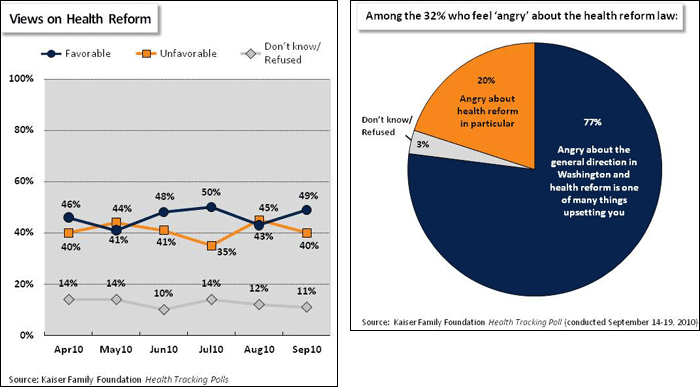
So how could health reform play a role in the election? Possibly by influencing turnout at the margin if health reform serves as a rallying point for larger complaints a slice of the electorate appears to have with Washington and government today. For some on the right health reform has become the kind of issue fluoridation once was – it is symbolic of bigger things they are worried about. (On this theme I recommend an old but great book called The Symbolic Uses of Politics by Murray Edelman). We asked those who said they were angry about the law why they were angry and the vast majority (77 percent in September) answered that they were angry about the general direction in Washington; health reform was just one example of bigger things they are upset about.
To the extent that health reform influences the election this will be how. It will be used by Republicans and conservatives as a symbol of discontent with Washington to build enthusiasm among their base and encourage turnout. But predicting turnout is notoriously difficult. Among likely voters we found a modest gap (41 percent vs. 30 percent) between the percentage of Republicans and Democrats who said health reform made them more interested in voting. Democrats overwhelmingly support the law, but some wanted it to go further, and it does not touch a deeper symbolic nerve for liberals as it does for conservatives – hence the modest health reform enthusiasm gap and its value as a rallying cry for conservatives.
As you can see in the chart, in our September poll we found a ten percentage point gap between the percentage of Republicans and Democrats who said they were “absolutely certain” to vote in November and a notable twenty-five percentage point gap between Republican-leaning independents and independents who lean towards the Democrats. It is impossible to say how much of a role health reform as a symbolic issue is playing in these differences or, with campaigns heating up, if they will still be there in November.
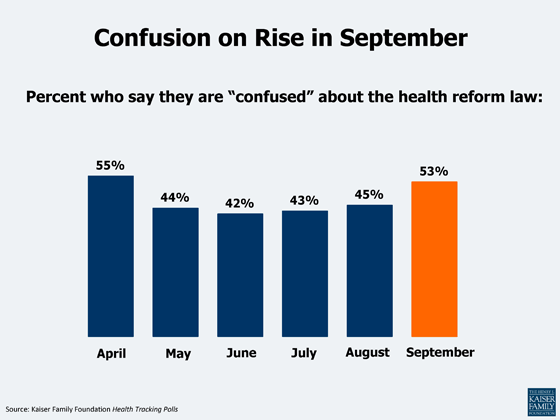
Health reform has become like World War One, with fixed lines not likely to move much any time soon. Democrats have a good case to make with voters because so many of the major provisions of the law are popular with the public, especially the early deliverables being rolled out now, although their message is muted by confusion about the law which our polls show has been rising. But Republicans have weapons too because the requirement that people buy insurance remains unpopular even though it doesn’t take effect for over three years and the law can be used as a lightning rod for voter discontent with Washington. The overall result is the rough stalemate we see on health reform in the polls with the public about evenly split on the law along traditional partisan lines. As I have written elsewhere http://www.washingtonpost.com/wp-dyn/content/article/2010/09/22/AR2010092204604.html, ultimately the public verdict on the law will be based much more on people’s experiences with it and the experiences of their families and friends as implementation slowly unfolds, not the political argument and spin we see today surrounding the midterm election.
Health reform could have a small impact at the margin in this election, most probably on turnout, although even that is not certain. To the extent there is an anti health reform vote it appears that it will be more a referendum on Washington in bad economic times than on the substance of the law itself, and other factors, most notably general perceptions of the direction of the nation in a bad economy, issues specific to local elections, and voters feelings about the candidates themselves will decide local races as they almost always do in midterm elections.
The tug of war for public opinion on health reform continues this month, with approval and disapproval remaining in the same relatively narrow band each has occupied since passage even as favorable views regain a small upper hand, 49 percent favorable vs. 40 percent unfavorable. Opinion is more closely divided among this fall’s likely voters (46 percent vs. 45 percent), and opponents of the law continue to hold their views more emphatically than supporters. Meanwhile, with five weeks left until the midterm elections, confusion over the new health law has risen to its highest point since April, with 53 percent of Americans now saying they are confused about health reform. Misperceptions about the law also persist: for example, three in ten seniors believe the law will permit government panels to make decisions about end-of-life care for Medicare recipients (often referred to as “death panels”). When it comes to voter turnout and vote choice, the September tracking survey suggests that, at least at this point, health reform is not playing a major role or providing a decisive advantage to one party’s position over the other.
Latest Survey Probes Public’s Knowledge and Views of U.S. Role in Global Health
MENLO PARK, Calif. – While many Americans hold misconceptions and negative views of “foreign aid” in general, they are more supportive of such efforts when described more specifically as “improving health in developing countries,” according to a new survey by the Kaiser Family Foundation.
When it comes to U.S. foreign aid in general, six in 10 Americans (61%) say the U.S. spends too much, and four in 10 incorrectly think that foreign aid is one of the two biggest areas of spending in the federal budget. In comparison, when asked about “improving health in developing countries,” 28 percent say the U.S. spends too much, while nearly two thirds say such spending is too little (23%) or about right (42%).
“The old canard that most Americans do not support ‘foreign aid’ is a misunderstanding of how the public really feels,” said Kaiser President and CEO Drew Altman. “When the specific purposes of spending abroad are put before the public, Americans are more supportive of health and development funding.”
The 2010 Survey of Americans on the U.S. Role in Global Health is the third in a series that aims to illuminate the American public’s views and knowledge of U.S. efforts to improve health for people in developing countries. Other key findings include:
Priorities for aid. About half the public says improving education (53%) and helping out after natural disasters (50%) should be a top priority for the president and Congress for aid to developing countries overall. Improving health is seen as a top priority by 37 percent of Americans, similar to the shares who say the top priorities should include reducing poverty (40%), promoting the rights of women (39%) and protecting the environment and fighting climate change (37%).
Home vs. abroad. Half the public (49%) says the U.S. should spend its tax dollars on improving health in the U.S. and globally, while the other half (48%) says the U.S. should spend its tax dollars on improving health in the U.S. only. The public is also largely split on whether more spending from the U.S. and other developed nations will lead to meaningful progress in improving health in developing countries.
Perceptions of progress. When asked how much progress has been made over the past five years broadly on global health, most people think that U.S. spending has made at least a small difference in the lives of individual people (82%) and in changing the overall course of disease (79%) in developing countries, though fewer say it has made a “big difference” on either dimension (34% and 26%, respectively).
Positive and negative news coverage matters. The survey finds a relationship between the media coverage that people report seeing and their perceptions of whether more global health spending will lead to progress. Among those who say they have seen mostly positive news stories about global health efforts, more than half (57%) say that more spending from the U.S. and other developed countries will lead to progress in improving health in developing countries. Among those who say they have seen mostly negative stories, 52% say more spending won’t make much difference.
Preferences for how aid is distributed. A strong majority of the public favors the U.S. giving money to international organizations like the Global Fund to Fight AIDS, Tuberculosis and Malaria (75%), and smaller majorities favor giving money to local non-profits (51%) and religious organizations (53%) working to improve health in developing countries. By contrast, seven in 10 say the U.S. should not give money directly to developing country governments, perhaps in part because corruption is the biggest perceived barrier to progress (eight in 10 say corruption and misuse of funds is a major barrier, and 53% say it is the most important barrier).
What kind of aid is most effective? By a 2-to-1 margin, the public thinks that money donated by individuals and charities is more likely than money donated by governments to reach the people who need it most. Interestingly, the public is as likely to incorrectly believe most aid for improving health comes from charities and individuals as to correctly say most comes from the U.S. government and other developed nation governments (46% each).
Challenges facing women. At a time when the U.S. government is increasingly focusing its international efforts on women and girls, eight in 10 people say that women in developing countries are worse off than men when it comes to their legal rights (81%) and ability to get a good education (78%). More than six in 10 also say women in developing countries are worse off than men in terms of their likelihood of living in poverty (66%) and their ability to get needed health care (61%).
Methodology
The survey was designed and analyzed by the public opinion team at the Kaiser Family Foundation led by Mollyann Brodie, Ph.D., and including Liz Hamel, Carolina Gutierrez, and Theresa Boston. It was conducted August 3-16, 2010, among a nationally representative random sample of 1,213 adults ages 18 and older. Telephone interviews conducted by landline (812) and cell phone (401, including 185 who had no landline telephone) were carried out in English and Spanish. The margin of sampling error for the overall survey is plus or minus 3 percentage points. For results based on subgroups, the margin of sampling error may be higher. A report on the poll, along with full wording and results for all survey questions, can be viewed online at here.
Six months after its enactment, there are two totally different stories to tell about the health-reform law. The public remains split on the law largely along traditional partisan lines. Confusion and misperception are rampant, with more than a third of seniors still thinking the law contains “death panels” (it does not). Yet beneath the political battle lies a success story of early implementation: The federal government that many regard as sluggish and ineffective has turned major elements of the legislation into reality right on schedule.
Since the bill’s passage, the Department of Health and Human Services has set up a program to help people with preexisting health conditions get coverage through state or federal high-risk pools; established a program to help employers provide health insurance to early retirees; issued rebates to help pay drug costs for Medicare beneficiaries stuck in the “doughnut hole”; provided tax credits to small businesses to provide insurance coverage; and created a consumer-friendly Web site, http://HealthCare.gov, that rivals anything coming out of Silicon Valley (where our organization is based).
Several popular provisions take effect Thursday. They include allowing adult children up to age 26 to be on their parents’ insurance; banning lifetime benefits caps and loosening annual limits on insurance coverage payouts; prohibiting insurance companies from kicking people off of their policies when they get sick; and requiring that newly purchased insurance policies cover preventive services at no cost to patients.
Still, our monthly polling finds the public split on the law, with 49 percent in favor vs. 40 percent against in September and the rest undecided. Public sentiment about health reform has shifted within a narrow band since the spring, with slightly more in favor in some months and slightly more against in others. For many who oppose it, the law reflects deeper discontent. When we asked people who said they were angry about the law why they were angry, the vast majority reported that, more than being upset with the law itself, they were angry about the general direction in Washington. Meanwhile, with a few notable exceptions — such as requiring that people have insurance — the law’s major provisions appear to be very popular with the public.
The provisions that will touch the most people — an expansion of Medicaid, new insurance marketplaces in every state, tax subsidies for working people without insurance, guaranteed access to insurance and the hotly debated requirement that almost everybody purchase coverage — do not come until 2014. And eventually, real-world experience with these changes will trump political argument when the public renders its verdict on the law.
The government has made substantial progress already in implementing reform this year, including many measures popular with the public…
No pre-existing condition exclusions for children (72% favorable)
Extend dependent coverage to age 26 (53% favorable)
No out-of-pocket costs for preventative services (70% favorable)
No cancellation of coverage except for fraud (68% favorable)
High risk pool for people with pre-existing conditions (61% favorable)
Small business health insurance tax credits (71% favorable)
Drug rebates for Medicare beneficiaries (64% favorable)
...but major elements of the law that will affect many more people don’t kick in until 2014.
Guaranteed access to insurance regardless of your health(69% favorable)
Insurance exchanges to make it easier to buy coverage (87% favorable)
Tax credits to make insurance more affordable for low and middle income people (76% favorable)
Expanded Medicaid coverage for low income people(71% favorable)
A requirement that people have insurance (70% UNfavorable)
Penalties for employers that don’t offer coverage to workers (51% favorable, 47% unfavorable)
Consider what happened when a Republican-controlled Congress created the Medicare drug benefit in 2004. Three times as many seniors opposed the law as favored it, and many liberals criticized the legislation as a first step toward privatization of Medicare, just as some conservatives call current health reform a government takeover. Within three years, though, supporters of Medicare Part D outnumbered detractors as it became clear the program was working well and helping seniors afford their medicines. The new health-reform law represents a much bigger change than the Medicare drug benefit was and may work out differently, especially if Republicans succeed in their efforts to block full implementation. But if the reform continues on pace, as happened with Part D, the law’s fate will be determined not by the early political debate but by how people believe the law is working for them and their families and friends once its major elements are implemented.
At the six-month mark, the politics of health reform remain as ugly as ever, but implementation of the law’s benefits and changes has been a success story so far. There is a lot of heavy lifting still to come.
Confused about how the new health reform law really works? This short, animated movie — featuring the “YouToons” — explains the problems with the current health care system, the changes that are happening now, and the big changes coming in 2014.
Written and produced by the Kaiser Family Foundation. Narrated by Cokie Roberts, a news commentator for ABC News and NPR and a former member of KFF’s Board of Trustees. Creative production and animation by Free Range Studios.
This video was also produced in Spanish and can be found here.
New Initial Features Include Animated Movie Explaining the Law, Policy and Public Opinion Monitoring, and State-Specific Data
MENLO PARK, Calif. — Nearly six months since the signing of the Patient Protection and Affordable Care Act and as some key provisions are due to be implemented, the Kaiser Family Foundation today launched an online gateway providing easy access to new and comprehensive resources on the health reform law. Recognizing the transition from the debate about passage to the realities of implementing a law, the Health Reform Source, http://healthreform.kff.org, has many new features that provide explanations of the basics of the law, in-depth analysis of policy issues in implementation, and quick and easy access to relevant data, studies and developments.
The Source features the premiere of “Health Reform Hits Main Street,” a new animated short movie designed to explain the health reform law to an American public still confused by how it works. Written and produced by the Foundation, the animated movie features narration by Cokie Roberts, ABC News and NPR news commentator and a member of the Foundation’s Board of Trustees. The movie has three major sections: explaining problems in the current health care system, short-term changes that will take place between now and 2014, and major provisions that will take effect in 2014.
Another new feature, The Scan, provides a daily feed of easily-digestible summaries of the latest research and studies from the Foundation and others, as well as official actions and other developments related to the health law. The site also features the Foundation’s Twitter entries on health care reform and links to Kaiser Health News’ stories to provide U.S. policymakers, journalists, the health care policy community and the general public easy access to timely information about the law.
“We will continue to update and expand the information we provide through the Health Reform Source as implementation ramps up over the next several years,” Kaiser Family Foundation President and CEO Drew Altman. “The Source will be the place where people can go to understand how the new health law really works, and for the latest policy information from us and others.”
The Health Reform Source will also feature ongoing and future research and analysis on the health law conducted by Foundation experts, with a special area of emphasis on the 50 states as they proceed with the implementation of the law with varying approaches and results. As more provisions of the law are implemented, the Foundation will add explanatory, basic information, summaries of the changes and new analyses.
Other new elements available on the Source include:
A customizable Implementation Timeline which presents a detailed list of major provisions that can be viewed by year or by topic.
A series of Video Explainer clips of Foundation experts answering specific questions about the law on a variety of health policy topics.
An interactive state map of the U.S. that features pop-up boxes of key state-specific information related to health coverage and the health law, and links to new health reform pages on the Foundation’s statehealthfacts.org featuring key data, reports, and news for each state.
The Public Opinion: Poll Watch featuring a weekly round-up of surveys from the Foundation and others assessing public attitudes and experiences over time related to the health reform law.
The Foundation’s updated Health Reform Subsidy Calculator to illustrate premiums, government subsidies and out-of-pocket costs for people eligible for health coverage in exchanges due to be established in 2014.
An Official Document Finder that provides quick access to federal regulations and studies related the health law.A Frequently Asked Questions (FAQ) database addressing questions about the health law.
Government Resources provide links to federal government websites that provide information to consumers and regulatory guidance about the provisions of the law.
Kaiser’s Health Reform Source can be viewed online at http://healthreform.kff.org and you can subscribe to alerts via email and RSS feeds. Additionally, the Foundation has established a Facebook page for the Health Reform Source which will feature additional related material.
Content on the site will be continually updated, and new features will be added in the coming weeks and months, including an interactive tool that will illustrate how reform affects different groups of people, video profiles showing the experiences of real people and businesses, and a primer on the health reform law.
The Kaiser Family Foundation is a non-profit private operating foundation, based in Menlo Park, California, dedicated to producing and communicating the best possible analysis and information on health issues.
WASHINGTON — Former U.S. Secretary for Health and Human Services Donna E. Shalala was awarded the 2010 Nelson Mandela Award for Health and Human Rights last night at a ceremony and dinner at Blair House hosted by current U.S. Secretary for Health and Human Services Kathleen Sebelius and the Kaiser Family Foundation honoring her retirement from the Foundation’s Board of Trustees. Former Secretary Shalala, who serves as president of the University of Miami, was recognized for dedication to advancing access to health care in the U.S., helping disadvantaged people around the world, and her special commitment to ending apartheid and developing democracy in South Africa.
“Whether it’s providing better health care to soldiers returning from two wars, or shaping the future of nursing here at home, or providing relief efforts in Haiti, or providing leadership on health reform, Donna Shalala has always been there when the people of our country and the world have needed her,” said Kaiser Family Foundation President and CEO Drew Altman.
Established in 1992 by the Kaiser Family Foundation at the behest of Nelson Mandela shortly after his release from 27 years of incarceration, the Mandela Award honors individuals for outstanding dedication to improving the health and life chances of disadvantaged populations in South Africa and internationally. Recipients are selected in conjunction with the Nelson Mandela Foundation and with the approval of Mr. Mandela.
Secretary Shalala received the award from two former recipients of the Mandela Award. South African Ambassador to the U.S. Ebrahim Rasool, the 1998 award winner, and Surgeon General Regina Benjamin, the 1997 award winner. Ambassador Rasool spoke of Dr. Shalala’s efforts in assisting South African exiles in the U.S. when she was serving as president of Hunter College and then the University of Wisconsin, and her association with the Kaiser Family Foundation’s work in South Africa as a Trustee over the past nine years. The Award was presented by Surgeon General Benjamin. Secretary Shalala is a 2008 recipient of the Presidential Medal of Freedom.
Recipients of the Nelson Mandela Award for Health and Human Rights are given a statuette bearing a likeness of Mr. Mandela.
The Kaiser Family Foundation is a non-profit private operating foundation, based in Menlo Park, California, dedicated to producing and communicating the best possible analysis and information on health issues
Most Americans receive their health insurance through their own job or the job of a family member; an offer of coverage at work is an important determinant of the likelihood of having private health insurance. This analysis examines the percentage of nonelderly, full-time adult workers (age 18 through 64) in private firms who were offered health insurance at their current primary job and how that changed over the period from 1995 to 2005.
The condition of the national economy often has an effect on the offer rate among workers. From 1995 to 2005, gross domestic product expanded at a rate of 2.6% in 1995 and accelerated to 4.1% in 2000, but growth slowed markedly to 1.1% in 2001 and stood at 3.1% in 2005. As one might expect, the percentage of workers offered coverage at work rose similarly in the late 1990s and fell after 2000. The current economic slowdown has been particularly deep, with GDP flat in 2008 and shrinking 2.6% in 2009. Consequently, there is concern that the poor economic conditions of recent years have led not only to a loss of jobs but also to fewer workers being offered coverage at work and a reduction of employment-based coverage.
To assess the impact of the economic booms and busts on employer-sponsored coverage, we analyzed workers in private (non-government) businesses using data from the 1995, 2001 and 2005 February Contingent Worker Supplement of the Current Population Survey (CPS).1 Workers were considered full-time if they reported that they usually worked 35 or more hours per week at a primary job. Our analysis focused only on a worker’s main job; second workplaces were not examined.
Rates of Offers of Employer-Sponsored Insurance
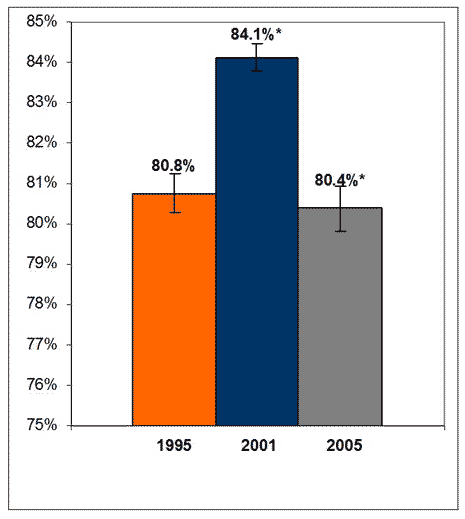
Just over 80% of adult full-time workers in private businesses were offered health insurance at a primary job in February of 2005 (Figure 1). The percentage of these workers offered coverage rose from 80.8% in 1995 to 84.1% in 2001, before falling back to 80.4% in 2005.
Figure 1: Percent of Workers Offered Employer-Sponsored Insurance, 1995, 2001, and 2005
* Statistically significantly different from the previous available data year at the 0.05 levelSource: Kaiser Family Foundation calculations based on data from the Current Population Survey, 1995, 2001, 2005, conducted by the Bureau of Labor Statistics.
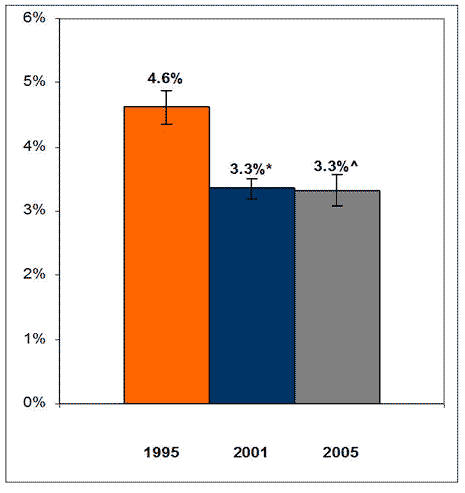
An additional 3% of adult full-time workers in 2005 worked for an employer that offered health insurance to some workers but not to them, a reduction from 4.6% of such workers in 1995 (Figure 2).2 When asked why they were not offered coverage, 55.9% of this group in 2005 reported that they had not worked for their employer long enough to be covered. This was the leading reason among these workers for not being offered coverage in each of the three years. Almost 15.8% of these workers in 2005 said that they were not offered coverage because they did not work enough hours per week or enough weeks per year, a somewhat surprising finding because the analysis is limited to adult workers who report that they usually work at least 35 hours per week. In addition, this share nearly doubled between 1995 and 2005 (Figure 3.)
Figure 2: Percent of Workers Not Offered Employer-Sponsored Insurance (ESI) while ESI Offered to Others, 1995, 2001, and 2005
* Statistically significantly different from the previous available data year at the 0.05 level^ Statistically significantly different from the 1995 data year at the 0.05 levelSource: Kaiser Family Foundation calculations based on data from the Current Population Survey, 1995, 2001, 2005, conducted by the Bureau of Labor Statistics.
Figure 3: Worker Reasons for Not Receiving an Offer of Health Insurance
1995
2001
2005
Don’t work enough hours per week or weeks per year
8.6%
13.5% *
15.8% ^
Contract or temporary employees not allowed in plan
7.9%
7.5%
10.1% *
Haven’t worked for this employer long enough to be covered
62.4%
62.2%
55.9% * ^
Have a pre-existing condition
1.7%
1.2%
1.0%
Other
19.4%
15.7% *
17.2%
* Statistically significantly different from the previous available data year at the 0.05 level^ Statistically significantly different from the 1995 data year at the 0.05 levelSource: Kaiser Family Foundation calculations based on data from the Current Population Survey, 1995, 2001, 2005, conducted by the Bureau of Labor Statistics.
Offer Rate Differences Across Worker Earnings
The percentage of adult full-time workers in private businesses offered health insurance varied significantly with wage level. To produce comparable wage levels over the time period, full-time adult workers were divided into four equal groups (quartiles) based on their reported average weekly wages from a primary job. The results show that offer rates are significantly correlated with wage levels throughout the wage distribution (Figure 4). Looking at 2005, for example, 53.4% of workers in the lowest wage quartile were offered health insurance, compared with 76.9% of workers in the second-lowest wage quartile, 86.5% of workers in the second highest wage quartile, and 92.3% of workers in the highest wage quartile. The percentage differences are statistically significant between each wage level for each of the three years. Workers in the lowest wage quartile were also more likely to have a primary job where health insurance was available to other workers but not to them; this pattern also held over each of the three years.
Figure 4: Percent of Workers Offered Employer-Sponsored Insurance, by Worker Earnings, Compared Across Earnings Quartiles
1995
2001
2005
Offered to Worker
Overall
80.8%
84.1%
80.4%
Lowest 25th
52.9% *
62.3% *
53.4% *
25th – 50th
76.3% *
81.1% *
76.9% *
50th – 75th
86.9% *
89.5% *
86.5% *
Highest 25th
92.2%
94.0%
92.3%
Offered to others / not them
Overall
4.6%
3.3%
3.3%
Lowest 25th
10.4% *
7.3% *
7.2% *
25th – 50th
5.6% *
4.4% *
3.6% *
50th – 75th
3.6% *
2.5% *
2.7% *
Highest 25th
1.9%
1.1%
1.6%
* Statistically significantly different from the next highest earnings quartile at the 0.05 levelSource: Kaiser Family Foundation calculations based on data from the Current Population Survey, 1995, 2001, 2005, conducted by the Bureau of Labor Statistics
Offer Rate Fluctuations by Worker Earnings
Offer rates increased significantly between 1995 and 2001, and then fell significantly between 2001 and 2005. This trend occurred within each wage quartile, although the percentage swings up and down were relatively larger in the lower wage quartiles (Figure 5). The climb and subsequent fall of the offer rate reached almost a ten percent differential for the lowest quartile, while the highest quartile of earners peaked and fell less than 2% from their initial rate. These findings suggest that the improving economy in the late 1990s and the economic slowdown after 2000 affected offer rates for workers at all wage levels, but that health insurance offers to lower wage workers may be more sensitive to economic changes.
Further, workers in lower earnings quartiles had lower offer rates during the height of the economy in 2001 than workers in higher earnings quartiles had during the lower-offer periods of 1995 and 2005. For example, although the second quartile reached an offer rate of 89.5% in 2001, this share was still below the lowest observed offer rate (92.2%) of the top quartile. This comparison highlights the significant difference in offer rates among workers at different income levels, and indicates that income is more strongly associated with offer rates than the strength of the economy.
Figure 5: Percent of Workers Offered Employer-Sponsored Insurance, by Worker Earnings, Compared Across Years
1995
2001
2005
Offered to me
Overall
80.8%
84.1 *
80.4 *
Lowest 25th
52.9%
62.3% *
53.4% *
25th – 50th
76.3%
81.1% *
76.9% *
50th – 75th
86.9%
89.5% *
86.5% *
Highest 25th
92.2%
94.0% *
92.3% *
* Statistically significantly different from the previous available data year at the 0.05 level^ Statistically significantly different from the 1995 data year at the 0.05 levelSource: Kaiser Family Foundation calculations based on data from the Current Population Survey, 1995, 2001, 2005, conducted by the Bureau of Labor Statistics.
Offer Rates by Hours Worked Per Week
The percentage of workers offered health insurance at a primary job also varied with the average number of hours that they worked at that job. Since this analysis is limited to workers who report that they usually work at least 35 hours per week, these differences occurred among workers who typically would be considered as full-time. In general, workers averaging less than 40 hours per week and workers whose hours varied were much less likely to be offered health insurance at their main job than workers who reported a higher average number of hours worked (Figure 6). Even people who reported working 40 hours per week, which was the largest group of workers, were less likely to be offered health insurance than people who reported working more than 40 hours per week. These patterns held over all three years. In addition, people working less than 40 hours per week and people whose hours varied were more likely in each of the three years to work at a main job where health insurance was offered to others but not to them. It is evident from these findings that full-time jobs demanding a relatively high commitment of hours were more likely to provide health insurance than jobs requiring only 35 to 40 hours of work. The share of workers in positions that required 35-39 hours was greatest (15.8%) in the leisure and hospitality sector, while those requiring 50 or more hours a week were most prevalent (30.9%) in the mining industry in 2005.
Figure 6: Percent of Workers Offered Employer-Sponsored Insurance, by Hours Worked Per Week
1995
2001
2005
Offered to Worker
Overall
80.8%
84.1%
80.4%
Varies
67.5% * ^ †
71.5% * ^ †
67.3% * ^ †
35-39
67.7% * ^ †
70.0% * ^ †
68.9% * ^ †
40
81.1% ^ †
84.3% ^ †
80.5% ^ †
41-49
86.0%
90.2% †
86.8%
50+
85.5%
88.7%
86.0%
* Statistically significantly different from 40 Hours Worked per Week at the 0.05 level^ Statistically significantly different from 41-49 Hours Worked per Week at the 0.05 level† Statistically significantly different from 50+ Hours Worked per Week at the 0.05 levelSource: Kaiser Family Foundation calculations based on data from the Current Population Survey, 1995, 2001, 2005, conducted by the Bureau of Labor Statistics.
Offer Rates by Industry
The percentage of workers offered health insurance at a primary job also varied significantly by industry in all three years (Figure 7). In 2005, for example, the percentage ranged from around 46% for workers employed with agriculture, forestry, fishing, and hunting to almost 92% for workers engaged in manufacturing or mining. A statistically larger share also reported having full time positions with variable hours in agriculture, forestry, fishing, and hunting (18.6%) than in manufacturing (5.1%), but not mining (14.1%). Trends in offer rates also varied within industries over time, with some industries showing significant volatility over the period (e.g., construction; leisure and hospitality) while others showed a fairly consistent level of offering (e.g., financial services; transportation and utilities). And while the overall offer rate fell slightly between 1995 and 2005, seven industries (construction; education and health services; information; manufacturing; other services; professional and business services; and wholesale and resale trade) saw a statistical increase in offering over the period.
Figure 7: Percent of Workers Offered Employer-Sponsored Insurance, by Industry
1995
2001
2005
Offered to Worker
Overall
80.8%
84.1% *
80.4% *
Agriculture, forestry, fishing, and hunting
49.4%
55.9%
45.8% *
Construction
56.4%
64.9% *
60.4% * ^
Educational and health services
85.3%
90.1% *
89.1% ^
Financial activities
87.3%
87.7%
88.9%
Information
87.4%
90.2% *
90.8% ^
Leisure and hospitality
57.5%
61.3% *
56.6% *
Manufacturing
90.0%
93.1% *
91.6% * ^
Mining
91.5%
93.7%
91.6%
Other services
64.4%
66.2%
70.0% * ^
Professional and business services
78.8%
85.2% *
82.6% * ^
Transportation and utilities
86.1%
85.2% * ^
84.7% * ^
Wholesale and retail trade
84.4%
84.2% *
83.0% ^
* Statistically significantly different from the previous available data year at the 0.05 level^ Statistically significantly different from the 1995 data year at the 0.05 levelSource: Kaiser Family Foundation calculations based on data from the Current Population Survey, 1995, 2001, 2005, conducted by the Bureau of Labor Statistics.
Offer Rates by Industry and Wage
This last portion of this analysis focuses on the interaction of industry and wage levels on the percentage of workers offered coverage. An important question for policy is whether industry differences in offering are simply a reflection of wage differences across industries or whether other factors are involved. For the analysis, industries were divided into High-ESI and Low-ESI groups; an industry was classified as High-ESI if at least 75 percent of workers were offered health insurance in each of the three years.3 Workers were again divided into quartiles based on weekly earnings.
Workers in High-ESI industries were much more likely to be offered health insurance than workers in Low-ESI industries in each wage quartile and in each year (Figure 8). The differences were consistent and large in all quartiles. In 2005, for example, among the lowest quartile of earners, 66.3% of High-ESI workers received offers compared to only 34.7% of Low-ESI workers, an industry-attributable difference of more than 30%. In fact, in the lowest two wage quartiles, the offer rates for workers in High-ESI industries averaged more than 25 percentage points higher than the offer rates for workers in Low-ESI industries. These large differences indicate that industry, and not wages alone, correlates with a worker’s likelihood of receiving an offer of health insurance.
Figure 8: Percent of Workers Offered Employer-Sponsored Insurance, by Industry and Wage
1995
2001
2005
Offered to Worker
Overall
80.8%
84.1%
80.4%
Low ESI Industry
58.5%
63.4%
60.5%
High ESI Industry
85.6% *
88.6% *
87.4% *
Lowest 25th
Low ESI
38.3%
45.1%
34.7%
High ESI
60.4% *
69.9% *
66.3% *
25th – 50th
Low ESI
56.6%
60.7%
58.5%
High ESI
81.0% *
85.9% *
84.0% *
50th – 75th
Low ESI
70.6%
74.4%
71.3%
High ESI
90.0% *
92.5% *
91.3% *
Highest 25th
Low ESI
74.8%
80.1%
80.6%
High ESI
94.4% *
95.7% *
94.9% *
* Statistically significantly different from the Low ESI category within the same income quartile and data year at the 0.05 levelSource: Kaiser Family Foundation calculations based on data from the Current Population Survey, 1995, 2001, 2005, conducted by the Bureau of Labor Statistics.
Discussion
About four in five adult full-time workers were offered health insurance at a primary job in 2005. The offer rate rose between 1995 and 2001 and then fell between 2001 and 2005, largely in sync with changing economic conditions. The upward and downward changes affected workers at all wage levels, but the shifts were larger for workers in the lower wage quartiles, suggesting that offers to lower-wage workers may be especially sensitive to economic conditions.
The troubled state of the economy has likely resulted in even fewer workers receiving health insurance offers at work, further fraying the employer-based health insurance system that covers most Americans. Lower wage workers appear to be most at risk, but some workers at all wage levels may be affected.
The health reform law recently passed by Congress and signed into law by President Obama contains many provisions that are also likely to affect trends in employer-sponsored health insurance. These provisions include both mandates and subsidies for employers, and new state-based health insurance exchanges that will facilitate the purchase of insurance for individuals and small businesses. Beginning in 2010, small businesses that offer health insurance will be able to take advantage of tax credits, and in 2014 these employers will be able to participate in small business health insurance exchanges, while larger employers will be required to either offer health insurance or pay a fee for each worker who uses a subsidy to buy coverage through an exchange.
These aspects of the health reform law may spur an increase in offer rates among employers. Yet, many employers will still decline to offer health insurance, and workers in these firms may either purchase insurance through the new exchanges or enroll in Medicaid if they are eligible under the program’s 2014 expansion—also an element of the health reform law. Massachusetts may offer some clues regarding the effects of the implementation of health reform since the state’s 2006 health care reform law served as a model for the federal law. Between 2007 and 2009, Massachusetts saw its employer offer rate increase from 72% to 76%, even as the national offer rate held constant.4 This trend may have resulted in part from the Massachusetts law’s employer “fair share contribution” of up to $295. Most employers are required to pay this fee for each employee for whom they do not contribute to health insurance costs. The federal law contains a similar penalty for larger employers, but it is a much more substantial fine of $2,000 or more. Although this incentive may serve to increase offer rates nationally, the federal law also exempts far more employers from the requirement than the Massachusetts law. While employers with more than 50 workers are required to pay a fee under national reform, all firms with more than 11 employees must make a “fair share contribution” in Massachusetts. In any case, the rate at which premiums rise will also have a considerable influence on employers’ future decisions regarding health insurance benefits. Consequently, Massachusetts is unlikely to be a perfect predictor of the effects of national health reform, and the extent to which health reform will alter the employer offer rate nationally remains to be seen.
This paper was prepared by Gary Claxton, Anthony Damico, and John Connolly of the Kaiser Family Foundation.
Methodology
This analysis uses data from the Current Population Survey (CPS). The CPS is a monthly household survey of labor force characteristics of the U.S. civilian noninstitutional population. Information on whether employees are offered health insurance at work is from the Contingent Work Supplement, which is a periodic supplement to the CPS February Basic Survey. The Supplement was last asked in 1995, 2001, and 2005. In order to analyze health insurance offers by worker wage levels, we merged the Contingent Work Supplements (1995, 2001, 2005) with extracts prepared by the National Bureau of Economic Research from the CPS Annual Earnings File (also called the Merged Outgoing Rotation Group, MORG) files.5 The MORG captures information about wages and earnings for households in CPS panels as they rotate out of the survey.
We restricted the analysis to people (1) between the ages of 18 and 64, (2) who were employed and who report usually working 35 hours per week or more, (3) who are not self-employed and do not work for a government employer, (4) for whom earnings information was available on the MORG. Temporary and seasonal workers were not excluded from the analysis (unless they failed on the other criteria), because questions about seasonality of employment and temporary employment status were only asked of a subset of the surveyed population.
The merged MORG data matched more than 90% of all records in the Contingent Work Supplement, allowing the use of the standard February final weights. In the rare cases that duplicate February case numbers existed after the merge, weights of both case numbers were halved to minimize bias. In all three of the final merged files, more than 95% of records had valid income data; the remaining records were not included in any analyses. The exclusion of records without earnings data caused only minimal shifts in the principal findings, as seen below (Figure 9).
Figure 9: Percent of Workers Offered Employer-Sponsored Insurance, by Earnings Availability
1995
2001
2005
Records without Earnings Included
Offered to Worker
80.2%
83.4%
79.5%
Offered to others
4.7%
3.6%
3.5%
Records without Earnings Excluded
Offered to Worker
80.8%
84.1%
80.4%
Offered to others
4.6%
3.3%
3.3%
Source: Kaiser Family Foundation calculations based on data from the Current Population Survey, 1995, 2001, 2005, conducted by the Bureau of Labor Statistics
In calculating the main offer variable, some records were recoded based on responses to the two questions asking why the respondent was not in their employer’s health plan. If a worker indicated that an offer was made but they were not in the plan because ‘contract or temporary employees not allowed in plan’ or because they had ‘not worked long enough for this employer to be covered’, they were recoded as ‘Offered to others’; conversely, workers indicating they were not made an offer because the plan was ‘too expensive’ were recoded as ‘Offered to Worker’, since this analysis examined only offer rates, not costs.
Standard errors were calculated by following the formula presented on page 16-8 (PDF page 326 of 329) of the 2005 Contingent Work Supplement (available at http://www.nber.org/cps/cpsfeb05.pdf). Differences between two standard errors were calculated by summing the squares of each standard error, then taking the square root of that sum.
Notes:
1. U.S. Census Bureau, “Current Population Survey (CPS),” Available online at: http://www.census.gov/cps/.
2. The difference between 2001 and 2005 is not statistically significant.
3. Low-ESI industries include: Agriculture, forestry, fishing, and hunting, Construction, Leisure and hospitality, and Other services. High-ESI industries include all others.