Poll Finding

Kaiser Health Tracking Poll: November 2012

Published: Nov 13, 2012

The November poll finds that while health care ranked as a second-tier issue in this month’s election, President Obama and Republican nominee Mitt Romney tied among voters who felt strongly about the Affordable Care Act, and President Obama won an advantage among voters who said Medicare was important to their vote, and among women on women’s health issues.

The November poll is the latest in a series designed and analyzed by the Foundation’s public opinion research team.

icon_fact_sheet

 Findings (.pdf)

icon_fact_sheet

 Chartpack (.pdf)

icon_fact_sheet

 Toplines (.pdf)

Health Care Factored In 2012 Election, But Far From A Starring Role

As predicted, there was a role for health care issues in voters’ 2012 election decision, but Kaiser’s November Health Tracking Poll—fielded in the days immediately following last week’s presidential election—suggests it was a trailing issue rather than a leading one.

FIGURE 1: Health Care On The List Of Most Important Factors To Vote, But Not At The Top
What one factor mattered most to you in deciding who you voted for in the presidential election? What would you say was the second most important factor in deciding who you voted for in the presidential election? (Total mentions; open-ended question)
RankVoted for President ObamaVoted for Governor Romney
1Candidate characteristics/record (55%)Candidate characteristics/record (48%)
2Economy and jobs (18%)Economy and jobs (48%)
3Health care (16%)Health care (13%)
4Social issues (9%)Social issues (13%)
5Women’s issues (7%)Foreign policy/Budget deficit (each named by 11%)

To keep the issue list in perspective, the November survey first asked voters to name the top two factors in their vote in an open-ended question, without providing answer choices. Here we confirm the importance of the candidates’ personal characteristics in voters’ decisions: for both those supporting President Barack Obama and those backing Governor Mitt Romney, it was the voters’ sense of the characteristics and records of the candidates themselves rather than any one issue that was at the top of their minds. Taken together, health care issues came in third (or tied for third) among both groups, volunteered by 16 percent of Obama voters and 13 percent of Romney voters as one of the two most important factors in their vote. More specifically, eight percent of all voters mentioned something about the Affordable Care Act (ACA) as important to their vote, either pro or con, while one percent volunteered something about the Medicare program and the same share volunteered Medicaid [see question 5/6 of the topline for full results]. Interestingly, while the economy and jobs were just as important as the candidates’ own strengths for Romney voters, it was named by significantly fewer Obama voters.

Health Care Is More Than Just the ACA

As previous months of Kaiser polling have shown, however, when voters talked about ‘health care’ they were talking about much more than the ACA, even though the signature Obama administration legislation looms large for those deeply immersed in the latest health policy developments. When voters were asked to assess the importance of a lengthy list of issues to their votes, large shares named a variety of health issues as a major factor in their vote, including: the future of the Medicare program (70 percent), the ACA (69 percent), the future of Medicaid (61 percent), and the candidates’ views on women’s health issues (57 percent).

Pressed to choose among this admittedly long laundry list of issues, voters splintered in their priorities, and no health care issue garnered more than single digit support as the biggest factor in their choice in 2012. That honor was saved for the economy (19 percent), the direction of the nation (15 percent), and President Obama’s performance during his first term (15 percent).
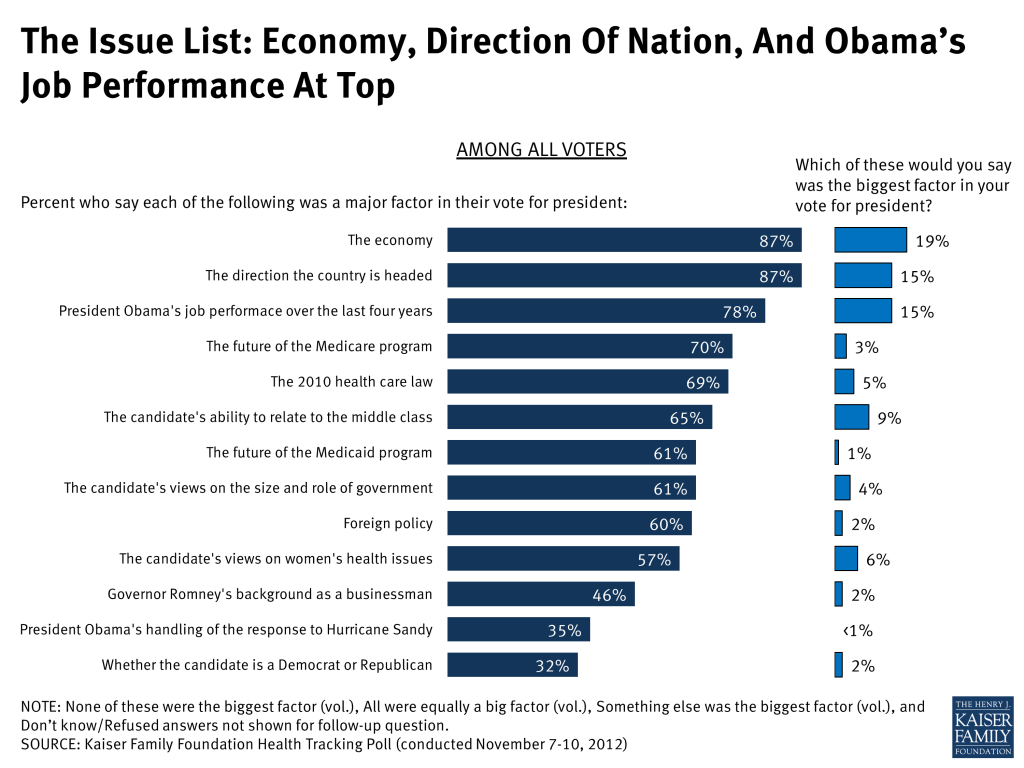
Figure 2

Did Health Care Issues Benefit One Candidate Over The Other?

The national exit poll1  conducted by a consortium of major media organizations on election night also found health care in the mix as a second tier issue (18 percent picked health care from a list of four possible issues, compared to 59 percent that picked the economy), and suggested that health care voters were much more likely to have voted for President Obama than for Governor Romney. Kaiser’s November tracking survey also found voters that volunteered a health care-related issue as one of the top two factors in their choice gave the edge to President Obama, 55 percent to 41 percent, though by a significantly smaller margin than the exit poll found in answer to a closed-ended version of the most important issue question.

FIGURE 3: A Look at How Health Care Voters Voted: Across Several Possible Definitions of “Health Care Voters”, President Obama Had the Edge. The One Exception, The ACA, Where The Candidates Were Tied
Data from National Exit PollData from KFF November Health Tracking Poll – Among Voters Who…
Selected health care as their top issue (closed-end)…said health care was top factor to vote (open-end)…said the 2010 health care law was a ‘major factor’ in their vote…said the future of the Medicare program was a ‘major factor’ in their vote…said the future of the Medicaid program was a ‘major factor’ in their vote…said the candidate’s stance on women’s health issues was a ‘major factor’ in their vote
Share of electorate18%14%69%70%61%57%
% who voted for Pres. Obama75%55%46%50%52%59%
% who voted for Gov. Romney244147413931
Obama – Romney percentage point diffc.+51+14-1+9+13+28

Among the much larger groups of the electorate that did not necessarily name a health care issue as the “biggest” factor in their vote, but still agreed that a variety of related issues did play some role, President Obama’s edge over Governor Romney varied. For example among those that agreed women’s health or Medicaid played a role, the incumbent had a double digit advantage over his challenger (28 percentage points and 13 points respectively). On one of the other controversial issues of the election, the 70 percent of voters that said the future of Medicare played some role in their vote went for President Obama somewhat more narrowly, 50 percent compared to 41 percent for Gov. Romney.

Finally, the two candidates were tied among those voters that said the ACA was a major factor in their vote, suggesting that the controversial health law worked both ways in the election. According to the November tracking poll, supporters of the law were just as likely to name it as a factor in their vote as opponents, suggesting it motivated both sides on the issue in equal measure.

FIGURE 4: ACA Motivated Both Opponents and Supporters Equally
Percent of voters that said the 2010 health care law was…Among voters who have a favorable view of the ACAAmong voters who have an unfavorable view of the ACA
…a ‘major factor’ in their vote for president71%73%
…the ‘biggest factor’ in their vote for president5%7%

Women were a key constituency in the president’s win and women’s issues, including those related to their reproductive health choices, were a small, but measureable factor for this group. Six percent of women voters specifically mentioned women’s issues as one of the most important factors to their vote in the open-end, compared to one percent of men. Two-thirds (65 percent) of female voters rated “the candidate’s views on women’s health issues, including birth control and abortion” as a major factor in their vote choice (compared to about half of men), with eight percent naming it as the biggest factor.

A Post-Election Look At Seniors

Seniors have been an interesting group to watch this election cycle: previous polling shows that they have been more likely than others to prioritize Medicare in their electoral choice, more likely to oppose changing the program to a premium support system along the lines proposed by Gov. Romney and his running-mate Congressman Paul Ryan, but at the same time more likely to give Gov. Romney a small edge as the candidate they trusted with the future of the program. This new post-election poll finds similar results, but also echoes the theme above that health care wasn’t moving extremely large portions of any segment of the electorate this year.

There was an age gap in prioritizing the nation’s primary health program for retirees: A large majority of voters aged 65 and older said Medicare’s future was a major factor in their vote (82 percent), 16 percentage points higher than among younger voters. But, as was true nationwide, few senior voters named it as the ‘biggest’ single factor in their vote choice (5 percent), and in the open-ended item, only 12 percent of seniors named any health issue as one of the primary elements in their decision, with only one percent offering up Medicare specifically. Meanwhile, though seniors have remained somewhat more skeptical than younger Americans of the Affordable Care Act, the November survey finds them more in line with the rest of the public on the 2010 law, with 40 percent favorable versus 40 percent unfavorable and the remaining two in ten not offering an opinion.
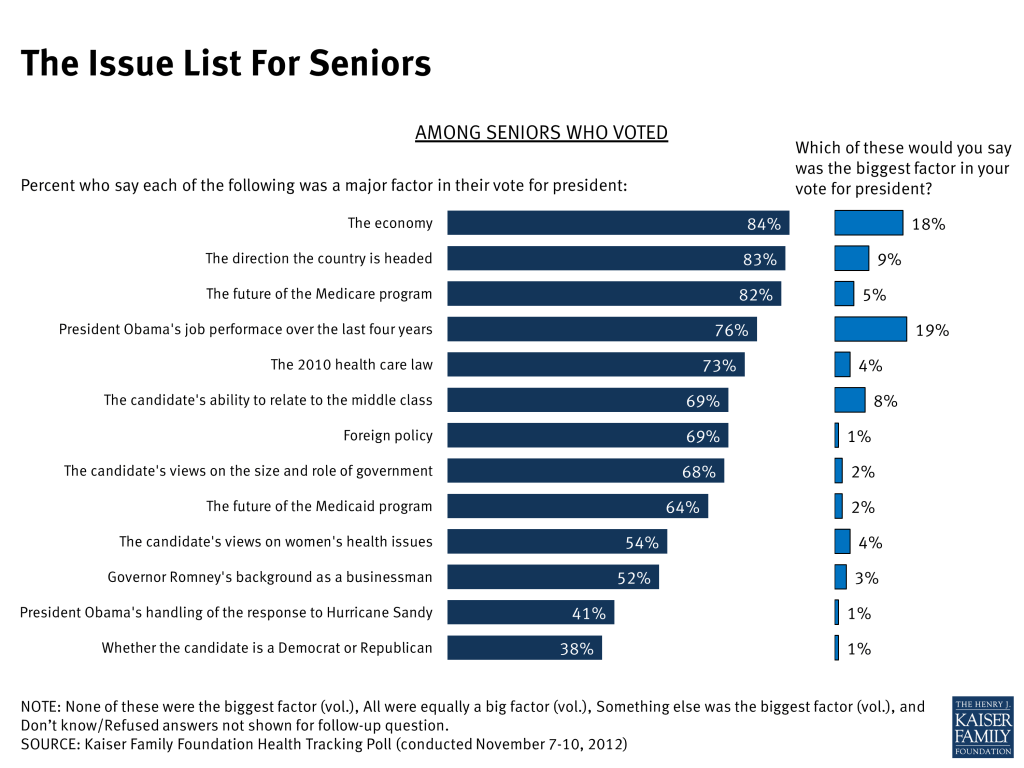
Figure 5

According to the national exit poll, Gov. Romney won among seniors by a comfortable margin. Even so, more of those aged 65 and up say that President Obama’s policies will be good for seniors as a group than expect they will be bad (47 percent versus 33 percent). Similarly, somewhat more seniors expect his policies will be good for the Medicare program than bad (45 percent compared to 35 percent).

As To The Affordable Care Act, Not Even An Election Can Disturb Its Consistent Ratings

Meanwhile, not even a presidential election can disturb the relatively stable opinion trend on the Affordable Care Act. Looking among the American public as a whole in the days after the long race ended, the November survey found the public comfortably in the relatively narrow band that we have seen since passage of roughly split views. Meanwhile, not surprisingly, three-quarters of Obama voters reported having favorable views of the ACA, while eight in ten Romney voters reported the opposite, with 65 percent saying their views of the law were “very” unfavorable.
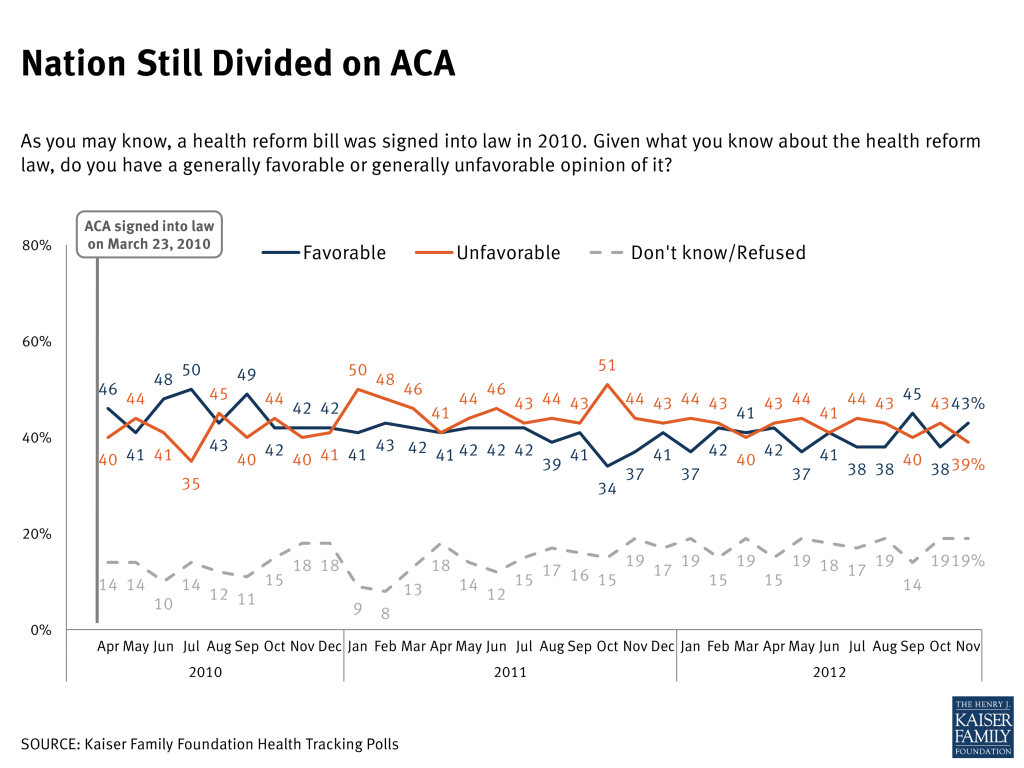
Figure 6

At the same time, the proportion of Americans that report wanting to see the law repealed dropped to a new low of 33 percent. (Last week returning Republican House Majority Leader John Boehner told a network TV interviewer that “Obamacare is the law of the land” and the House will not move forward with further votes to repeal the law.)
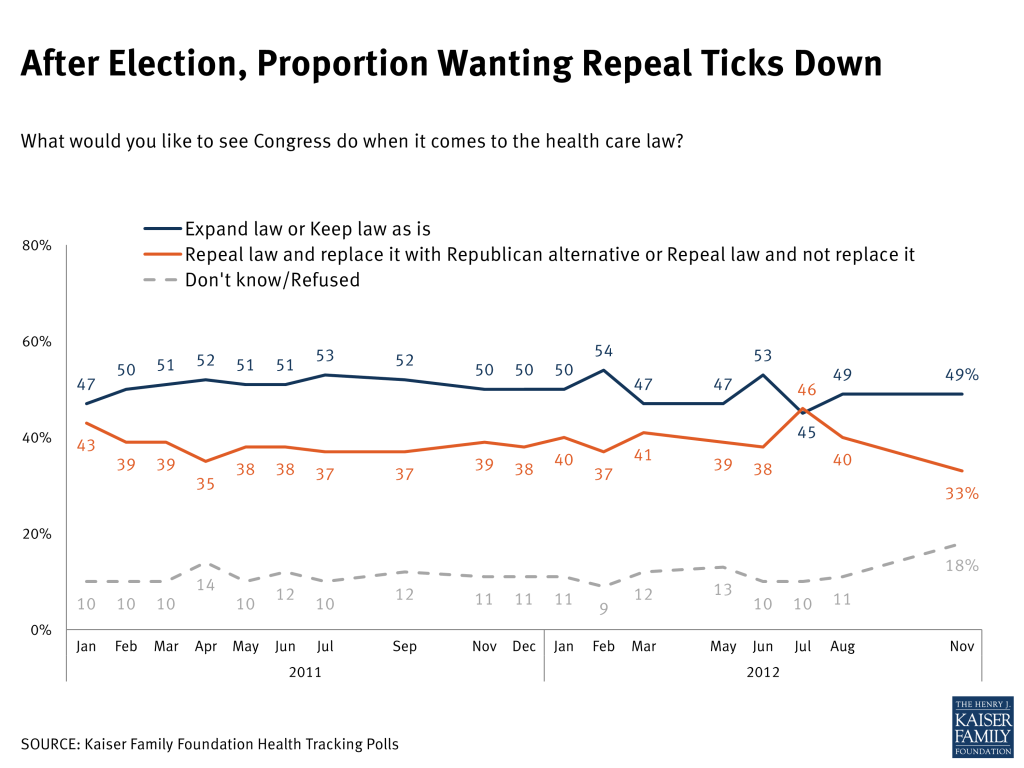
Figure 7

Going Forward: Views Of President Obama’s Second Term

A clear majority of Americans anticipate President Obama’s second term will be good for lower income Americans and for women, while Americans are quite divided on what it will mean for the wealthy. In terms of health issues, more think President Obama’s policies will be good for Medicare, Medicaid and the ACA, than think they will be bad.
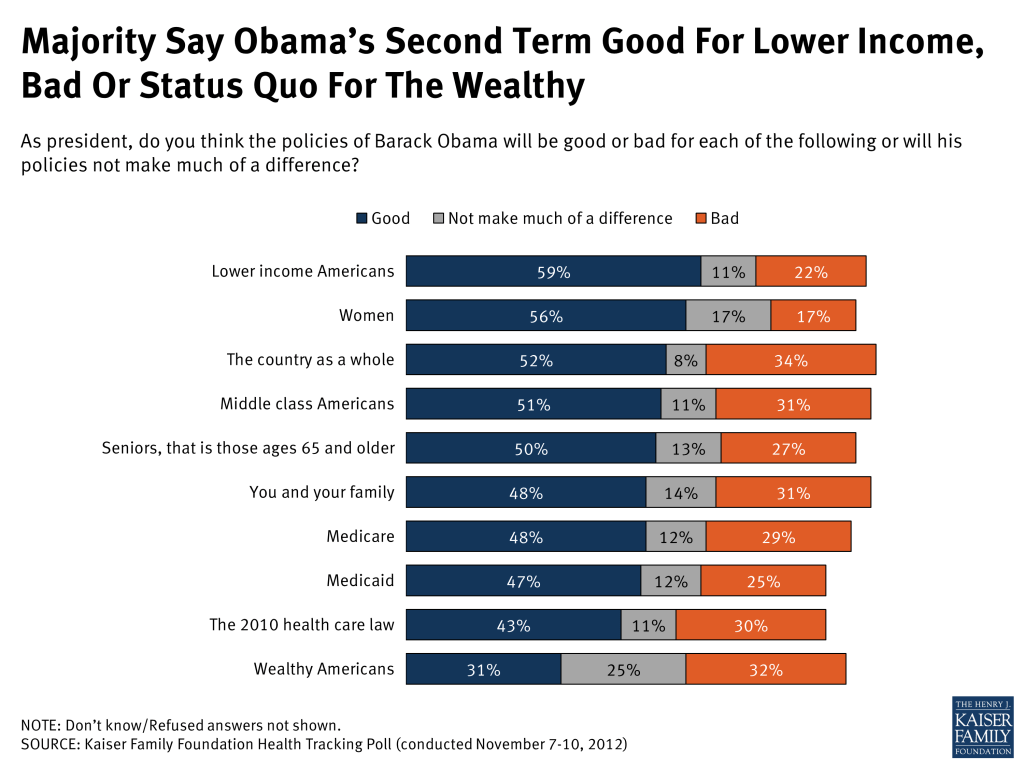
Figure 8

Below is an abbreviated version of the chartpack for the November 2012 Kaiser Health Tracking Poll. To view the full chartpack, please download the PDF under Related Materials.

This Kaiser Health Tracking Poll was designed and analyzed by public opinion researchers at the Kaiser Family Foundation led by Mollyann Brodie, Ph.D., including Claudia Deane, Sarah Cho, and Theresa Boston. The survey was conducted November 7-10, 2012, among a nationally representative random digit dial telephone sample of 1,223 adults ages 18 and older, living in the United States, including Alaska and Hawaii (note: persons without a telephone could not be included in the random selection process). Computer-assisted telephone interviews conducted by landline (708) and cell phone (515, including 274 who had no landline telephone) were carried out in English and Spanish by Braun Research, Inc. under the direction of Princeton Survey Research Associates International (PSRAI). Both the landline and cell phone samples were provided by Survey Sampling International, LLC. For the landline sample, respondents were selected by asking for the youngest adult male or female currently at home based on a random rotation. If no one of that gender was available, interviewers asked to speak with the youngest adult of the opposite gender. For the cell phone sample, interviews were conducted with the person who answered the phone.

The combined landline and cell phone sample was weighted to balance the sample demographics to match estimates for the national population data from the Census Bureau’s 2011 Annual Social and Economic Supplement (ASEC) on sex, age, education, race, Hispanic origin, nativity (for Hispanics only), and region along with data from the Census on population density. The sample was also weighted to match current patterns of telephone use using data from the July-December 2011 National Health Interview Survey. The weight takes into account the fact that respondents with both a landline and cell phone have a higher probability of selection in the combined sample and also adjusts for the household size for the landline sample. All statistical tests of significance account for the effect of weighting. Weighted and unweighted values for key demographic variables are shown in the table below.

Sample Demographics
UnweightedWeighted
Gender
Male48.2%48.6%
Female51.8%51.4%
Age
18-248.7%12.4%
25-3413.6%17.8%
35-4413.7%16.7%
45-5418.5%18.8%
55-6419.5%15.7%
65+23.9%17.0%
Education
Less than HS Grad.8.0%12.5%
HS Grad.25.4%33.6%
Some College24.6%24.3%
College Grad.40.1%28.2%
Race/Ethnicity
White/not Hispanic71.2%66.4%
Black/not Hispanic11.0%11.2%
Hisp – US born5.8%6.5%
Hisp – born outside4.0%6.8%
Other/not Hispanic5.1%6.3%
Party Identification
Democrat34.0%33.9%
Independent31.8%32.3%
Republican24.4%22.8%
Other4.9%5.0%

The number of respondents and the margin of sampling error for key subgroups are presented in the table below. For results based on subgroups, the margin of sampling error may be higher. Sample sizes and margin of sampling errors for other subgroups are available by request. Note that sampling error is only one of many potential sources of error in this or any other public opinion poll.

Number of respondentsMargin of sampling error
Total1,223±3  percentage points
All voters947±4 percentage points
Obama voters452±5 percentage points
Romney voters410±5 percentage points
Did not vote276±6 percentage points

Note, the data was not weighted to the final popular vote numbers and as a result the reported vote number in Q3/Q4 does not exactly match the popular vote. In this survey, 70 percent of the public overall reported voting in the presidential election, which is much higher than the estimated 57.5 percent of the voting-eligible population that actually turned out to vote. Vote over-reporting is common in public opinion surveys. In this poll, 47 percent of voters reported voting for President Obama and 43 percent reported voting for Governor Romney. If these responses are re-calculated based on those who reported their vote for president, then 50 percent reported voting for President Obama and 45 percent for Governor Romney. This is reasonably close to the actual national vote count of about 50.5 percent Obama, 48 percent Romney.

The response rate calculated based on the American Association of Public Opinion Research’s Response Rate 3 formula was 13 percent for the landline sample and 11 percent for the cell phone sample.

Endnotes

  1. Data for the 2012 exit poll were collected by Edison Research for the National Election Pool, a consortium of ABC News, The Associated Press, CBS News, CNN, Fox News and NBC News. The data from this survey is available online on a number of media websites. See, for example, http://www.washingtonpost.com/wp-srv/special/politics/2012-exit-polls/table.html ↩︎
Snapshots: Premiums, Cost-Sharing and Coverage at Public, Private and Non-Profit Firms

Published: Nov 9, 2012

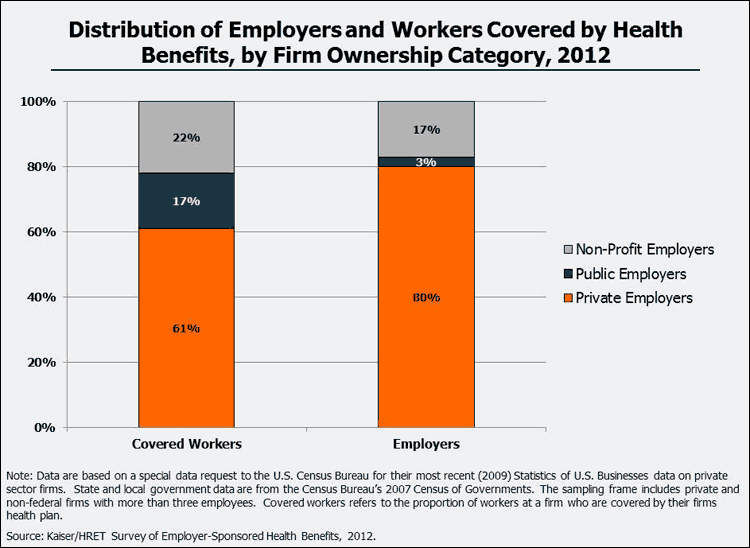
There are important differences in the legal organization and mission of different employers in the United States. In addition to collecting information about premiums and employee cost sharing, the 2012 Employer Health Benefits Survey asked respondents to characterize their ownership structure. Respondents were asked to describe their organization as either a “private firm, including publicly traded companies and privately owned businesses,” “a public firm, such as a state or local government agency,” or as a “non-profit, such as a 501(c)(3).”1 Sixty-one percent of workers covered by a health plan are employed by a private firm, 17% are employed by a public employer, and 22% are employed by a non-profit employer.2 Since public and non-profit employers tend to have more workers on average, a larger portion of the total number of employers is comprised of private firms.

There are important differences in the health plans being offered by employers in each of the three ownership categories. On average, workers covered by health plans at privately owned firms are required to pay higher premium contributions for both single and family coverage. At the same time, these workers face higher cost-sharing requirements when they access services.

Premiums and Worker Contributions

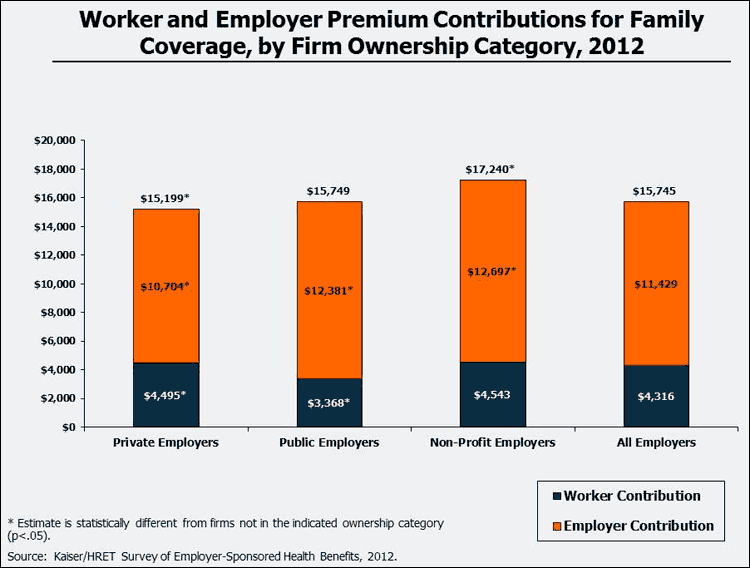
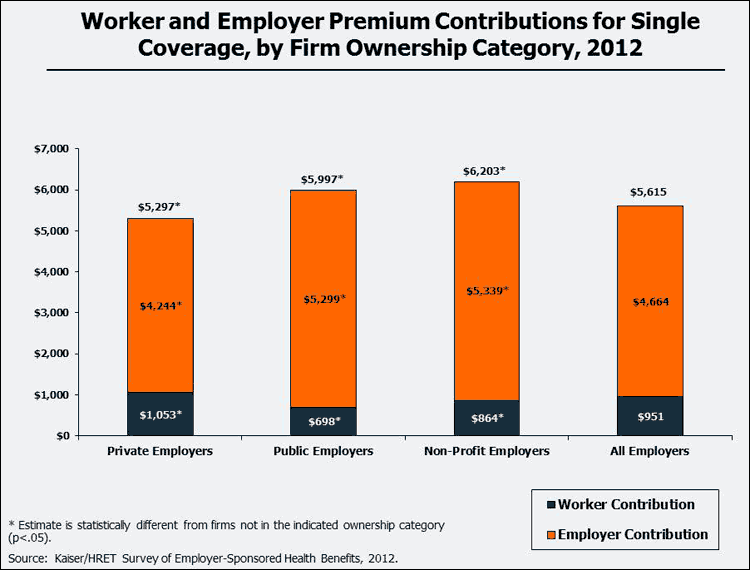
For both single and family coverage, covered workers at private firms are enrolled in plans with less expensive premiums ($5,297 and $15,199, annually) than covered workers in the two other ownership categories. The average premium is made up of both a worker contribution and an employer contribution. While, on average, covered workers are covered by plans with less expensive premiums at private firms, they are responsible for a larger share of the total premium than their counterparts at public and non-profit employers. On average, the employer contribution for covered workers enrolled in family coverage at private employers is $10,704, less than the average public employer contribution ($12,381) and non-profit employer contribution ($12,697). Covered workers at public employers have the smallest worker contributions: $3,368 for family coverage and $698 for single coverage.

Chart1_4.gif
Chart2_4.gif

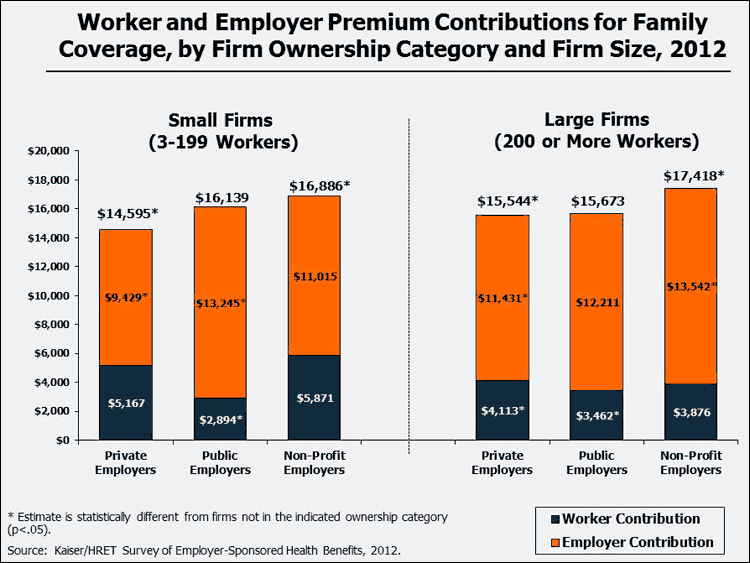
There are important differences in premium contributions when comparing types of employers within size categories. Covered workers at private employers are covered by less expensive family premiums both when the worker is at a small employer ($14,595) (3-199 workers) or a large employer ($15,544) (200 or more workers) when compared to employers in other ownership categories. In addition, covered workers at private employers receive smaller employer premium contributions then covered workers in the other ownership types at both small and large employers. Workers at public employers contribute the smallest amount to their premium at both small ($2,894) and large employers ($3,462).


Chart3_4.gif

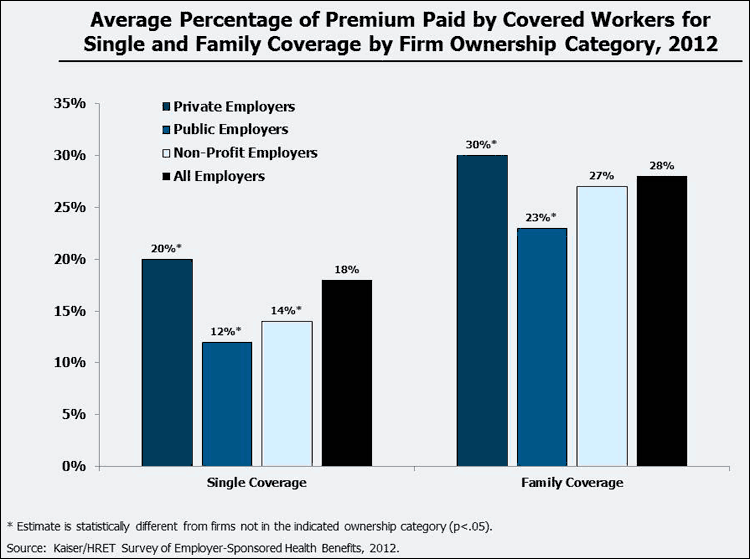
On average covered workers at public employers are responsible for a smaller portion of the premium than covered workers employed in the other ownership categories. Covered workers at public employers contribute 12% of the cost of single coverage and 23% of the cost of family coverage. Conversely, covered workers at private employers contribute a larger percentage of the premium than covered workers in the other ownerships types; workers at private employers contribute 20% of the premium for single coverage and 30% of the premium for family coverage.

Chart4_4.gif

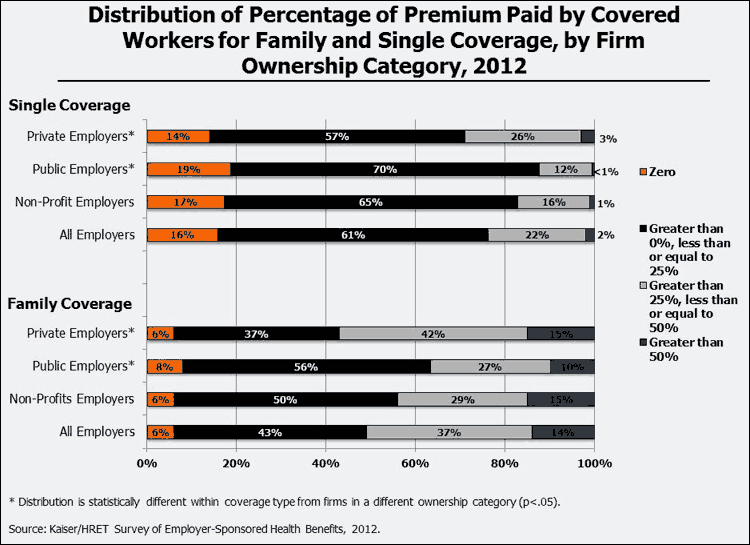
There is significant variation in workers’ premium contributions within employer ownership type. A majority of covered workers at private employers are responsible for more than a quarter of the family premium (57%). Conversely, over half of covered workers at public and non-profit employers are enrolled in plans in which they contribute a quarter or less of the family premium.

Chart5_5.gif

Employee Cost Sharing

In addition to being responsible for a larger proportion of premium costs, workers at private employers face higher cost-sharing requirements when they access services.

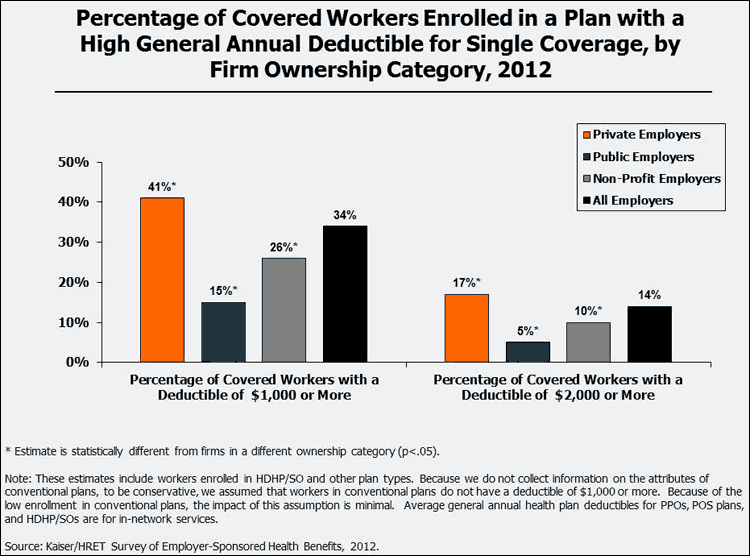
A general annual deductible is an amount that must be paid by the enrollee before all or most services are covered by their health plan. On average, workers at private employers face higher deductibles before services are covered: 41% of covered workers at private employers face a deductible of a $1,000 or more compared to 15% at public employers and 26% at non-profits. Seventeen percent of covered workers at private employers are required to meet a deductible of $2,000 dollars or more.

Chart6_4.gif

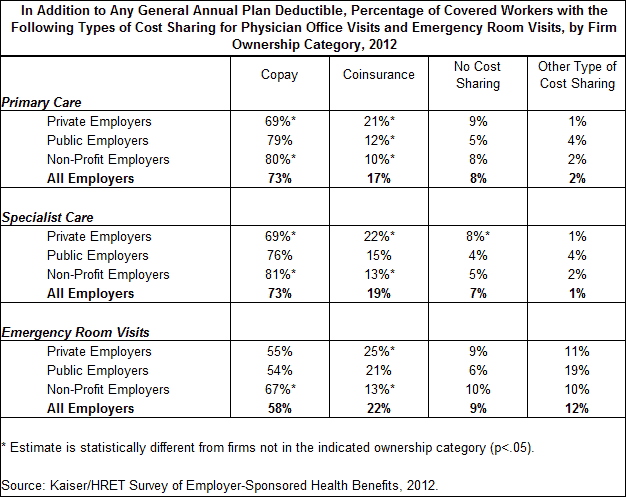
In addition to the general annual deductible, workers are often required to pay a coinsurance or copay for visits with health care professionals. Covered workers at private employers are more likely to be required to pay a coinsurance rate and less likely to pay a copay for primary and specialist office visits than workers at other types of employers. Depending on the coinsurance rate and whether the cost-sharing formula includes minimums and maximums, coinsurance rates often place a greater financial burden on workers for high cost services than a copay.

table1_3.gif

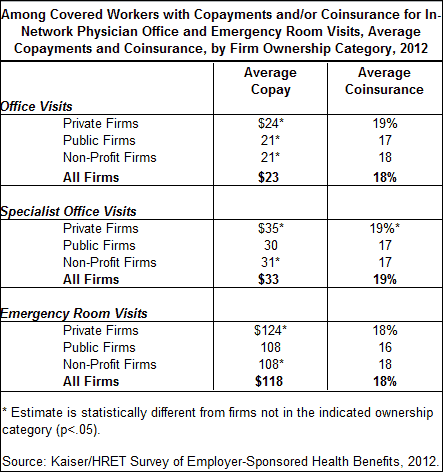
Among covered workers who face copays for office visits or emergency room visits in addition to the general annual deductible, workers at private employers face higher average copays than their counterparts at non-profit and public employers. On average, covered workers at private employers have copays of $24 for primary care office visits, $35 for specialist visits, and $124 for emergency room visits.

table2_3.gif

Coverage and Enrollment

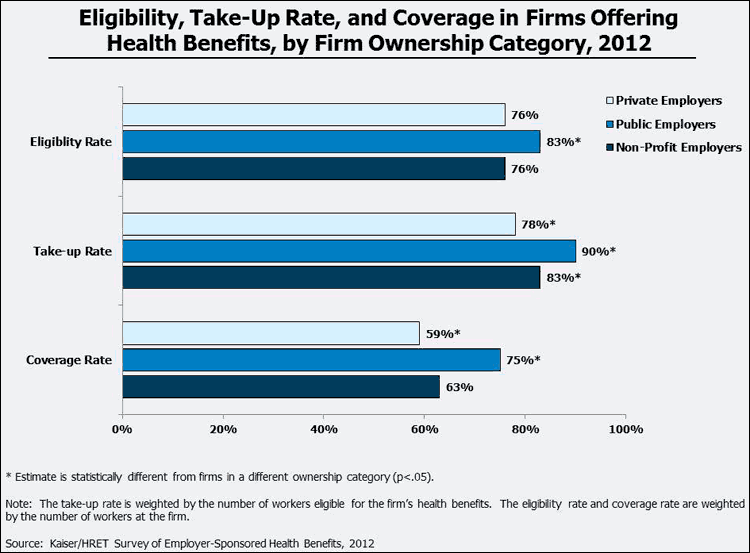
The number of workers eligible and covered by an employer’s health benefits varies by ownership category. Among public employers offering health benefits, 75% of workers are covered by their firm’s health benefits plan, more than the 59% at private employers and 63% at non-profit employers. The number of workers covered by health benefits is the product of how many workers are eligible to enroll and how many “take-up” or participate in that coverage. Public employers have both a higher eligibility rate and a higher take-up rate. Eighty-three percent of workers at public employers that offer coverage are eligible to enroll. Among workers eligible to participate in health benefits, 90% of covered workers at public employers take-up coverage, significantly more than the 78% that take-up at private employers and the 83% that take-up at non-profits.

Chart7_5.gif

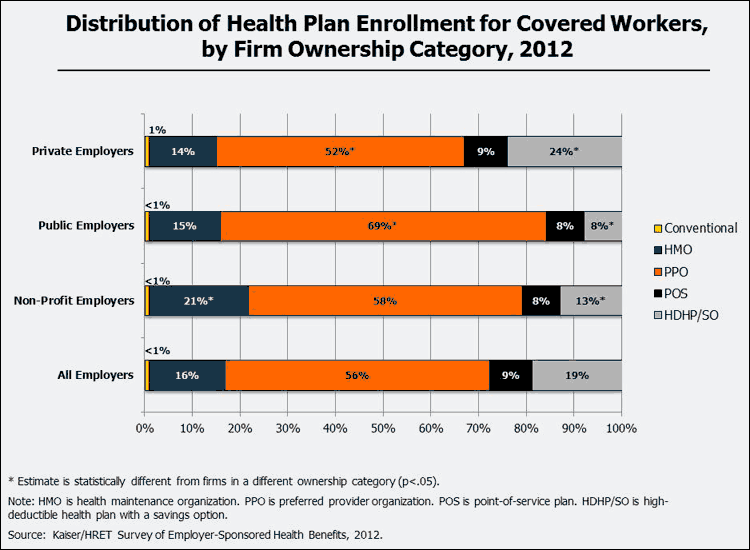
Covered workers at private employers are more likely to be enrolled in a high-deductible health plan with either a health reimbursement arrangement (HRA) or a health savings account (HSA) compared to covered workers in other ownership categories. Similarly, covered workers at public employers are more likely to be enrolled in a PPO plan.

Chart8_4.gif

Other Notes

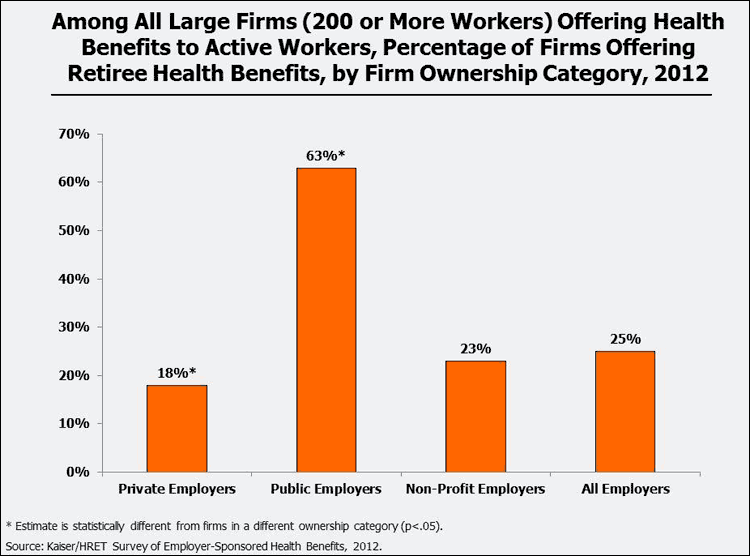
There are other important differences in the health plans being offered at private, public and non-profit employers. Among large firms offering health benefits, a significantly greater percentage of public employers (63%) offer retiree benefits compared to private (18%) or non-profit employers (23%).

Chart9_3.gif

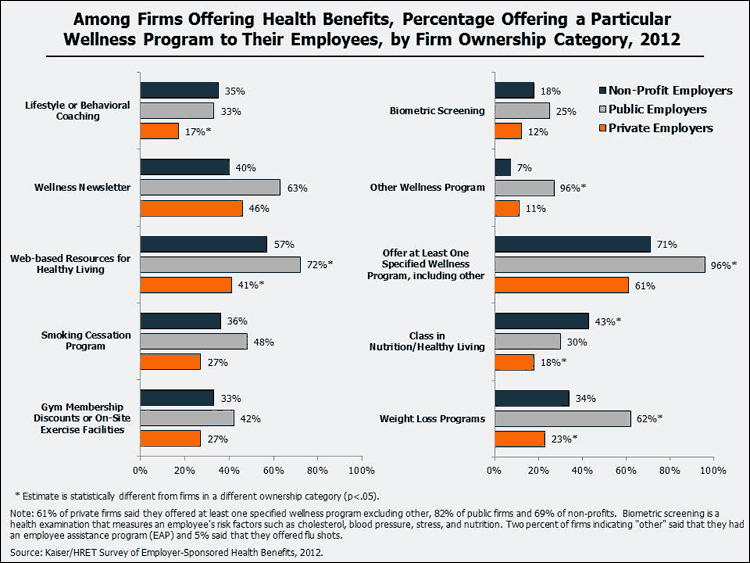
In order to reduce health costs and improve employees’ health, many employers offer wellness programs. The survey asks employers who offer health benefits if they offer one of eight specified health programs or another unspecified program. A significantly higher proportion of public employers offer at least one of the specified wellness programs or an unspecified program (96%). Public employers are more likely to offer weight loss programs (62%) or web-based resources for healthy living (72%) than employers in other ownership categories.

Chart10_3.gif

Conclusion

It is important to recognize that there is significant variation in the types of health plans being offered by employers within each of the ownership categories. On average, workers at private employers face higher employee premium contributions and cost sharing than their counterparts at public and non-profit employers. Even when comparing employers within large and small size categories, covered workers at public employers are responsible for a smaller portion of their coverage than workers at private employers.

Methods

The Employer Health Benefits Survey is a national probability survey of over 2,100 private and non-federal public employers with three or more employees. Non-federal firms are sampled from the 2007 U.S. Census of Governments and private sector firms are sampled by Survey Sampling Incorporated (SSI) which obtains information from Dun and Bradstreet. Employer industry classifications used in sampling are based on a firm’s primary SIC code. Employer ownership categories are defined by a survey question asking respondents to characterize their organization as a public, private, or non-profit employer. Weights are post stratified to industry; size and regional counts provided by the Census Bureau’s Statistics of U.S. Businesses and the Census of Governments. Interviews are conducted with HR directors and office managers about the firm’s HMO, PPO, POS, and HDHP/SO plan with the largest enrollment. For more information on the survey design and sampling methodology of the Employer Health Benefits Survey, see the Survey Design and Methods Section of the 2012 report 3  Statistical testing in this snapshot compares firms in one ownership category against all firms not in the indicated category at an alpha level of 0.05.

Chart11_3.gif

This snapshot was prepared by Matthew Rae, Nirmita Panchal, and Gary Claxton of the Kaiser Family Foundation’s Health Care Marketplace Project.

Notes:

  1. Less than 0.05% of respondents selected “don’t know” and were imputed using a hotdeck approach.
  2. Data are based on a special data request to the U.S. Census Bureau for their most recent (2009) Statistics of U.S. Businesses data on private sector firms.  State and local government data are from the Census Bureau’s 2007 Census of Governments.
  3. The full report of the 2012 Kaiser/HRET Survey of Employer-Sponsored Health Benefits is available at http://www.kff.org/insurance/8345.cfm

State Coverage of Preventive Services for Women under Medicaid: Findings from a State-Level Survey

Published: Nov 2, 2012

Medicaid is a critical source of health coverage and long-term care for millions of low-income women. Federal Medicaid rules require that the program cover many, but not all, important preventive screening services, but states also have considerable latitude in establishing which preventive services are covered for adults and whether or not to charge enrollees copayments for these services. As such, there is sizable variability by state in Medicaid coverage of preventive services for adults. As of 2014, these state policy choices will affect millions more women who will be newly eligible for Medicaid after the implementation of the Affordable Care Act (ACA).

The ACA will also provide an enhanced federal matching payment to state Medicaid programs that cover certain recommended preventive services without cost-sharing starting in 2013. The Kaiser Commission on Medicaid and the Uninsured (KCMU) and Health Management Associates (HMA) surveyed Medicaid officials in all 50 states and the District of Columbia in 2010 to collect baseline data on state coverage of preventive services prior to ACA implementation. This brief reviews Medicaid’s role in covering preventive care for women, presents findings of importance to women from the survey, and discusses the implications for women on Medicaid following the implementation of health reform.

Report (.pdf)

Snapshots: The Prevalence and Cost of Deductibles in Employer Sponsored Insurance

Authors: , , and
Published: Nov 2, 2012

Over the past several years enrollees in employer-sponsored health plans have contributed more towards their care through the use of increased cost sharing.  The growth in deductibles is one of the more visible increases in employee cost sharing.

A deductible is an amount that must be paid out-of-pocket by an enrollee before some or all services are covered by their health plan.  Health plans may impose deductibles on specific services, such as outpatient surgery or pharmaceutical drugs, or require a general annual deductible which is applied to most or all services.  In recent years, deductibles have become more common as employers attempt to reduce premium costs and ensure that workers have incentives to reduce utilization.  Evidence shows that higher deductibles and other cost sharing reduce the use of health care by exposing enrollees to a larger share of their health care spending and thereby encourage them to be more selective with the services they consume.1

The Employer Health Benefits Survey has tracked changes in the prevalence and cost of deductibles in employer-sponsored health plans across time.2  In 2006 we changed the questions on deductibles to gather additional information on the different types of deductibles being used.  Throughout this report, small firms are defined as those with 3 to 199 workers, and large firms are those with 200 or more workers.  Deductibles are reported for single coverage and for in-network services.3

The Prevalence of General Annual Deductibles:

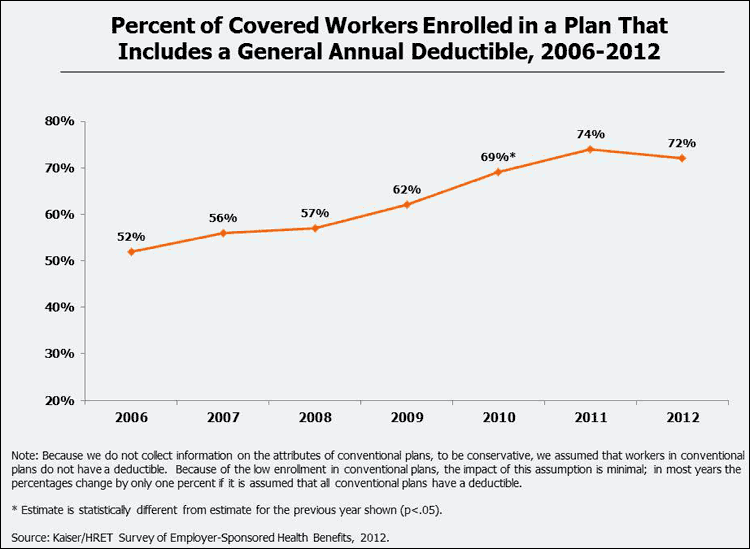
The percent of covered workers enrolled in a plan with a general annual deductible has increased significantly over time.  In 2006, just over half (52%) of covered workers had a deductible for single coverage, compared with almost three-quarters (72%) in 2012.

snap1_1.gif

The number of covered workers with a general annual deductible is increasing both because of shifts in enrollment patterns among plan types as well as the increasing prevalence of deductibles within plan types.  There are important differences in the use of deductibles among plan types; deductibles are much more common for workers enrolled in Preferred Provider Organizations (PPOs) than for workers enrolled in Health Maintenance Organizations (HMOs).  Since 2006, the percentage of workers enrolled in plan types which are less likely to require a deductible, such as HMOs, has decreased (20% to 16%) and enrollment in High-Deductible Health Plans with Savings Options (HDHP/SOs) has increased (4% to 19%).4  We define high-deductible health plans with savings options as plans with a deductible of at least $1,000 and eligible for either a health reimbursement arrangement (HRAs) or Health Savings Account (HRAs).5

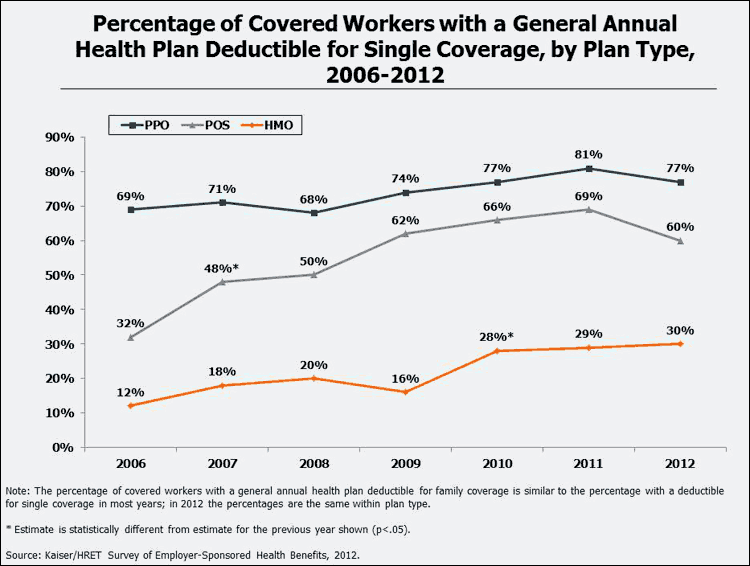
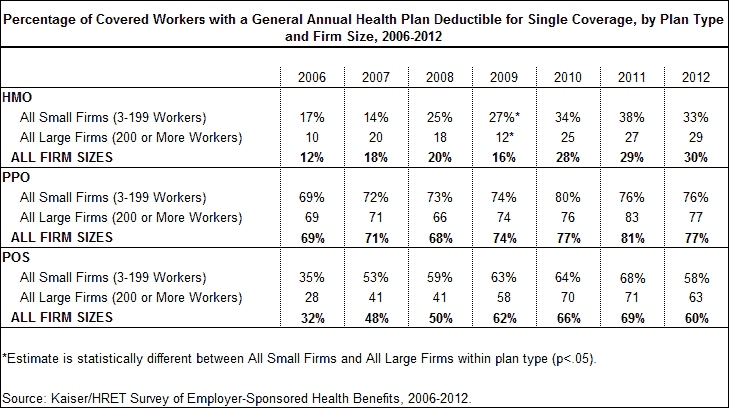
There has been a significant increase in the prevalence of deductibles for covered workers enrolled in each plan type (HMO, PPO, and POS) since 2006.  For example, in 2012, 77% of covered workers enrolled in a PPO plan had a general annual deductible for single coverage, compared to 69% in 2006.  General annual deductibles have become common for workers enrolled in HMO plans, growing from just 12% of workers enrolled in an HMO plan in 2006 to 30% in 2012.

snap2_1.gif

The Cost of General Annual Deductibles for Single Coverage:

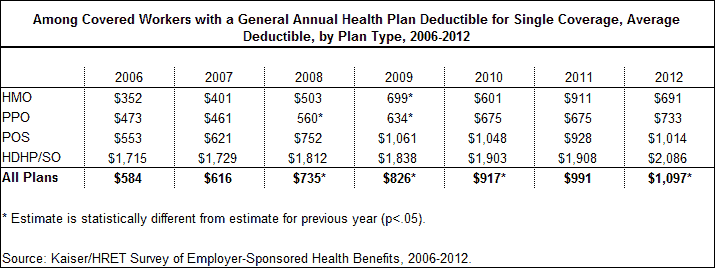
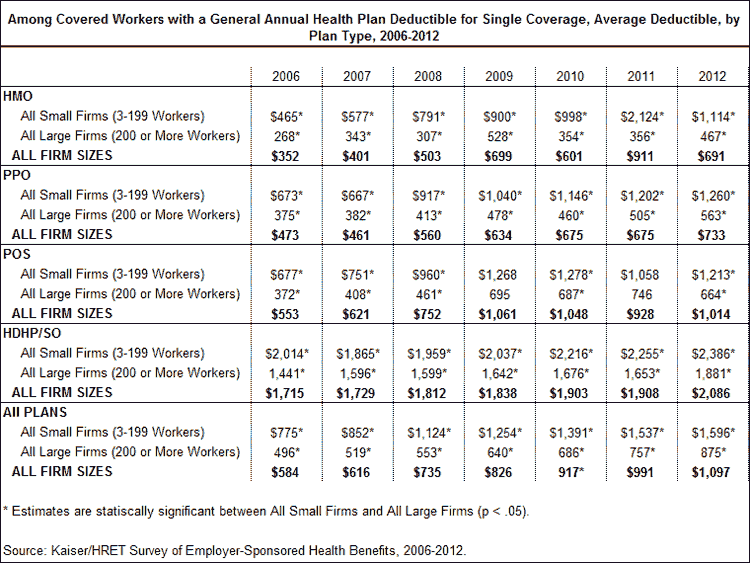
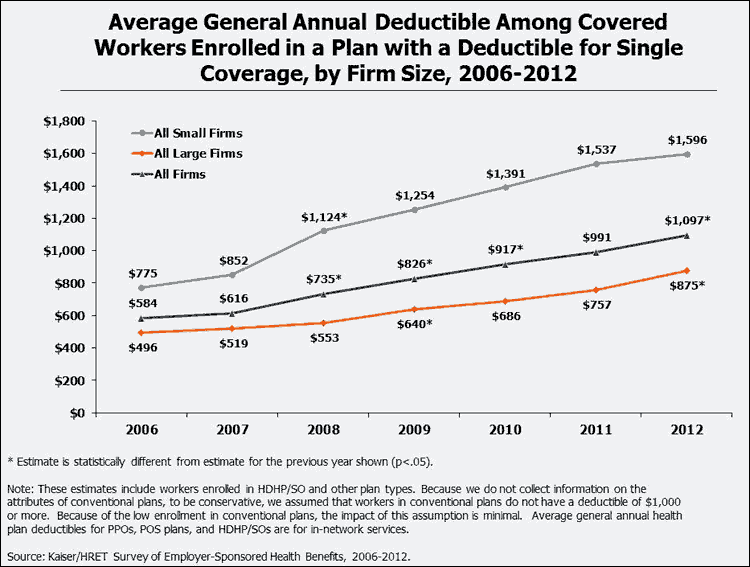
In addition to more workers facing a general deductible, the amount of these deductibles has also steadily increased.  Since 2006, the average general annual deductible among covered workers who have a deductible for single coverage has increased for each plan type.  Overall, the average general annual deductible is $1,097 for covered workers enrolled in a single coverage plan requiring a deductible; an increase of 88% since 2006, with significant annual increases in four of the last five years.  There are significant differences in the costs of deductibles by plan type, with covered workers enrolled in HMO plans facing smaller deductibles than workers enrolled in HDHP/SOs.

table3_5.gif

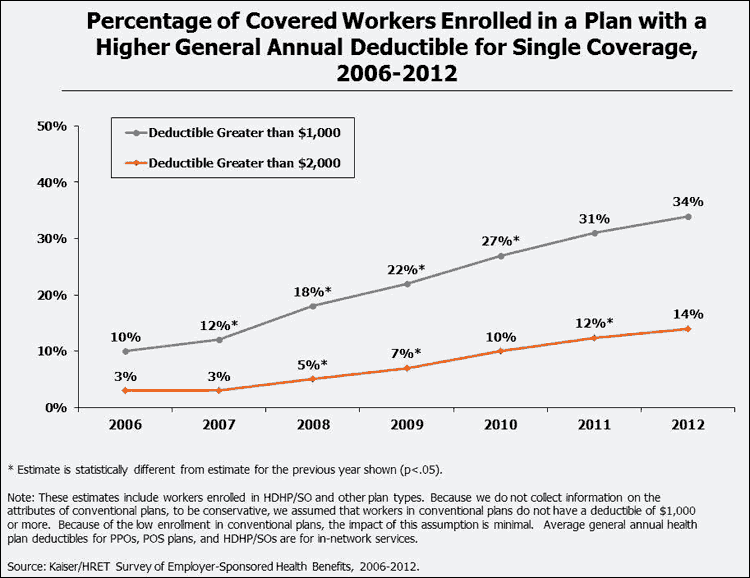
The growing prevalence and amount of deductibles has resulted in an increasing percentage of covered workers enrolled in a plan with high deductibles.  In 2012, about a third (34%) of covered workers were enrolled in a plan with a deductible of a $1,000 or more compared to 10% in 2006, and 14% were enrolled in a plan with a deductible of $2,000 or more compared to 3% in 2006.  The percentages of workers include workers who are enrolled in a high deductible plans with a savings account (HDHP/SO), such as an HSA or an HRA, and those who are in a plan without a savings account.

snap4_1.gif

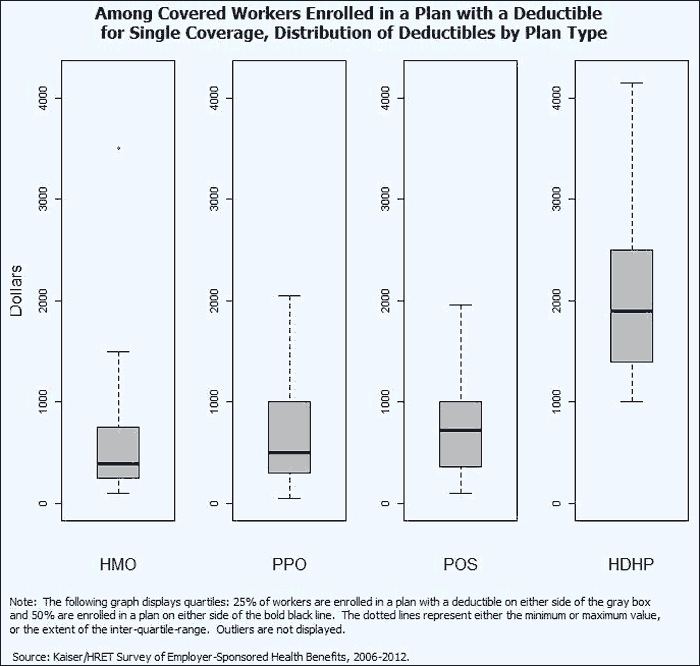
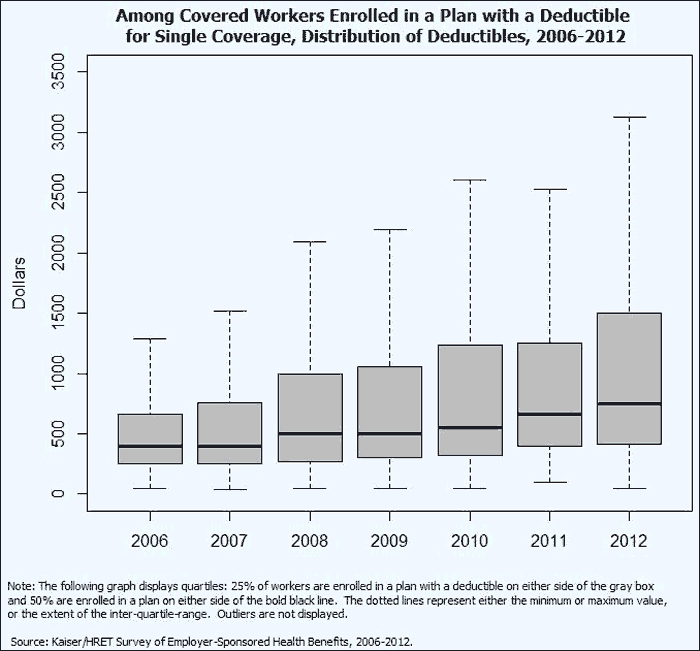
Deductibles levels also vary within plan types.  The following graph displays quartiles: 25% of workers are enrolled in a plan with a deductible on either side of the gray box and 50% are enrolled in a plan on either side of the bold black line.6 For workers enrolled in an HMO plan, 25% of workers have a deductible less than $250 and 25% percent have a deductible of $750 or more.  Twenty-five percent of workers enrolled in a PPO plan are enrolled in a plan with a deductible less than $300 and 25% are in a plan of $1,000 dollars are more.  Deductibles are much higher for workers enrolled in HDHP/SO plans, with 25% of workers enrolled in a plan with a deductible between $1,000 and $1,400, and 25% of workers in a plan with a deductible greater than $2,500. Many workers enrolled in these plans have access to a savings option to pay for qualified medical expenses and may therefore be able to defer some of the cost of higher deductibles.

snap7_1.gif

There is increasing variance in the average deductible across all plan types. In 2006, 50% of workers had a deductible between $250 and $665. In 2012, 50% of workers had a deductible between $417 and $1,500.7  With the growth of higher deductible plans over the past couple of years, some workers are facing much higher deductibles than others.

snap5_1.gif

Differences in General Annual Deductibles for Single Coverage between Different Types of Firms:

While there are important differences in the cost-sharing structures used by small and large firms, the percentage of covered workers enrolled in a plan that requires a general annual deductible is similar between small and large firms within each plan type.

table7_4.gif

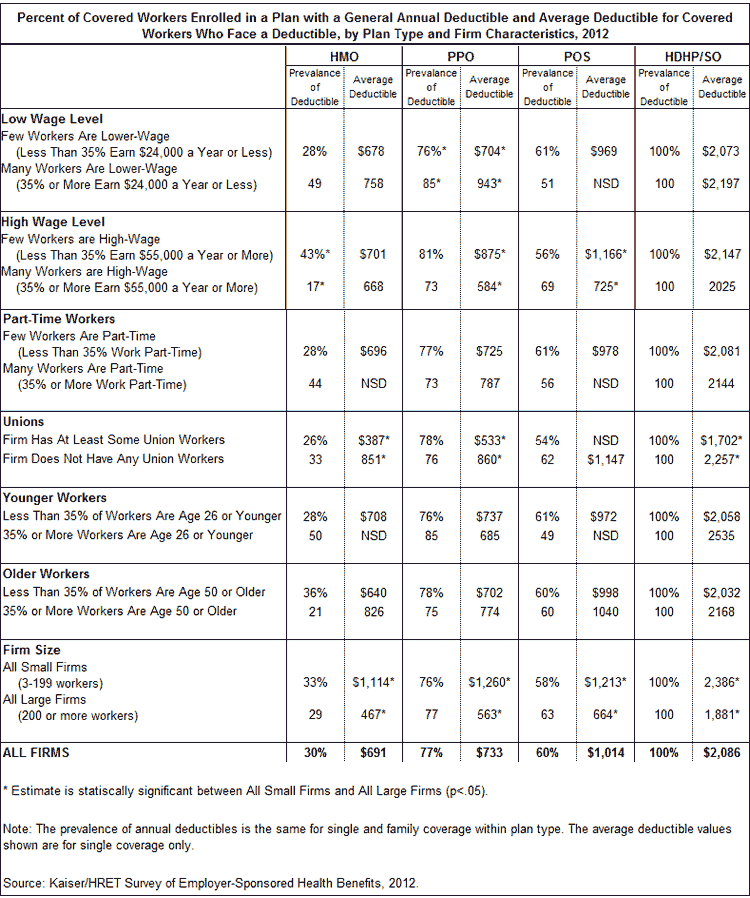
Although workers at small firms are no more likely to be enrolled in health coverage that includes a deductible, they typically face much higher deductibles than workers at large firms.  The average deductible for covered workers enrolled in single coverage at a small firm is nearly twice as much as the deductible for covered workers at larger firms.  Within PPOs, the plan type with largest enrollment, the average deductible for workers at small firms is $1,260, compared to $563 for workers at large firms.  The average deductible among all plan types for workers at small firms is $1,596, more than the $875 dollars for covered workers at larger firms.  Despite the higher deductibles for workers at small firms, the rate of growth for deductibles is similar between firms in either size category: the average single coverage deductible for workers at small firms has increased 106% since 2006, a statistically similar change to the 76% for covered workers at large firms.

table-8_1.gif
snap6_1.gif

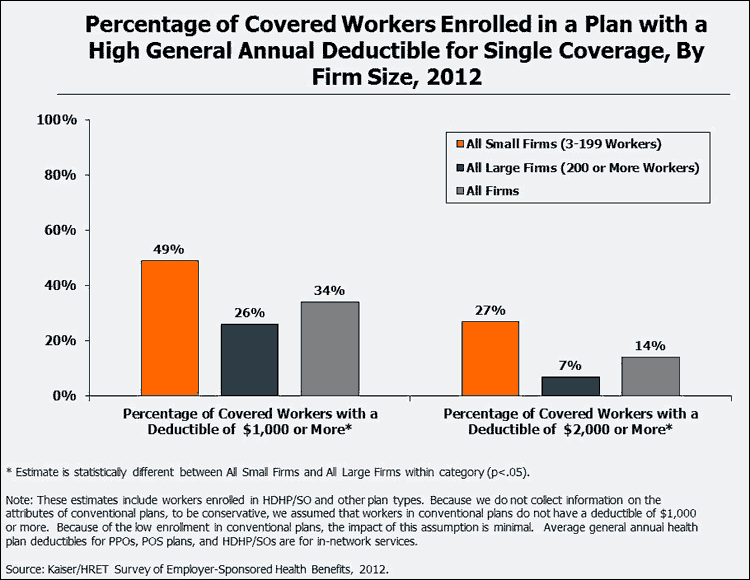
Plans with deductibles of over $1,000 have become much more commonplace for workers at small firms.  Almost half of workers  enrolled in a health plan at small firms face a deductible of $1,000 or more, compared to just over a quarter of workers enrolled at large firms (49% vs. 26%).  A meaningful portion of covered workers at small firms are required to meet a deductible of $2,000 or more  before most services are covered (27% at small firms compared to 7% at large firms).  This is explained both by the higher enrollment in HDHP/SO plans at small firms, as well as higher deductibles for covered workers at small firms within each plan type.8

snap10_1.gif

There are few differences in the proportion of workers enrolled in plans that are required to meet general annual deductibles between different firm characteristics, but there are significant differences in the average deductible amounts.  Covered workers enrolled in PPO and POS plans with many higher-wage workers tend to have lower deductibles than their counterparts at firms with fewer higher-wage workers.9  Covered workers in HMO, PPO and HDHP/SO plans at firms with some unionized workers have lower general annual deductibles than workers at firms without unions.

table-11_2.gif

General Annual Deductibles Structure:

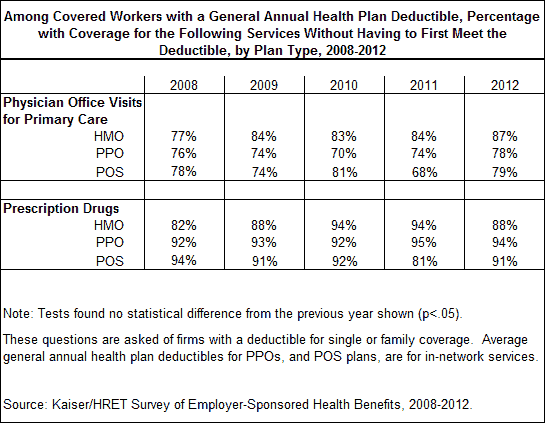
Health plans use a variety of structures for deductibles that effect how much cost sharing enrollees are exposed to.  Many health plans will cover certain services even if an enrollee has not yet met the deductible.  For example, a majority of enrollees receive coverage for primary care office visits and prescription drugs regardless of whether they have satisfied the deductible.  This has remained consistent over time and, also, across HMO, PPO, and POS plan types. Additionally, with the implementation of the Affordable Care Act, coverage independent of general annual deductibles will expand to include preventive services, such as cardiovascular health and cancer screenings.10  By law HSA-qualified plans can only cover preventive care services before the deductible is met.

table-12_4.gif

Service Specific Deductibles:

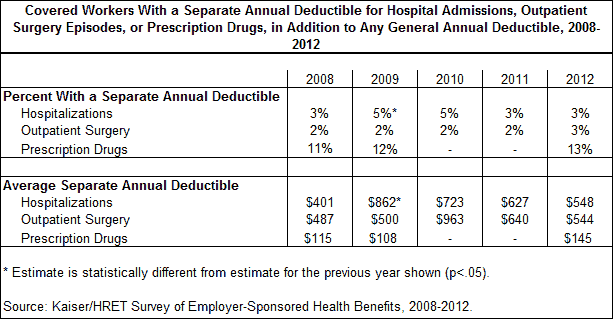
Both in addition to, and in lieu of, a general annual deductible, health plans may impose a service specific deductible (or a separate annual deductible).  These plans require that an enrollee cover the first portion of costs for a specific service, such as an outpatient surgery or hospitalization.  Employers may use service-specific deductibles as one method of decreasing their total costs towards an employee’s coverage.  However, the prevalence of such deductibles has remained low over time.  For example, only three percent of enrollees face aseparate annual deductible for hospitalizations or outpatient surgeries.  Thirteen percent have a separate deductible for prescription drugs. The amount of these service-specific deductibles also shows little change over time. In 2012, the deductibles for hospitalizations and outpatient surgeries are roughly $550. A lower deductible is seen for prescription drugs ($145).  Many plans have additional types of cost sharing, such as copays or coinsurances, for these services.

table-13_1.gif

Conclusion:

In addition to contributing more towards premiums, covered workers are increasingly faced with higher cost sharing.  A larger proportion of workers are required to meet a deductible prior to utilizing services and these deductibles are increasing in size.  It has become commonplace for covered workers to be enrolled in a plan with a deductible of a $1,000 or more.  While many working families have sufficient savings and coverage in case of a medical emergency.11 The growth in workers’ contributions and cost sharing may increasingly become a financial strain on some households.

This snapshot was prepared by Matthew Rae, Nirmita Panchal, and Gary Claxton of the Kaiser Family Foundation’s Health Care Marketplace Project.

Notes:

  1. “The Role of Consumer Copayments for Health Care: Lessons from the RAND Health Insurance Experiment and Beyond”. Kaiser Family Foundation. October 2006.   http://www.kff.org/health-costs/report/the-role-of-consumer-copayments-for-health/
  2. The Employer Health Benefits Survey is a national probability survey of over 2,100 private and non-federal public firms with three or more employees.  Interviews are conducted with HR directors and office managers about the firm’s HMO, PPO, POS, and HDHP/SO plan with the largest enrollment. For more information on the survey design and sampling methodology of the Employer Health Benefits Survey, see the Survey Design and Methods Section of the 2012 report.  Significance differences are reported at the 0.05 level.  http://www.kff.org/health-costs/report/employer-health-benefits-2012-annual-survey/  Kaiser/HRET Survey of Employer-Sponsored Health Benefits, 2012.
  3. Because of the variety of structures that employers use for family coverage, this snapshot looks at single coverage. For more information on family deductibles or the survey’s definition of deductibles see Section 7 of the 2012 report: http://www.kff.org/report-section/ehbs-2012-section-7/  Kaiser/HRET Survey of Employer-Sponsored Health Benefits, 2012.
  4. For more information on changes in enrollment patterns see exhibit 5.1 of the 2012 report:http://www.kff.org/report-section/ehbs-2012-section-5/ Kaiser/HRET Survey of Employer-Sponsored Health Benefits, 2012.
  5. By law, high-deductible plans with a health savings account (HSAs) have a general annual deductible of $1,200 or more.  For more information about HDHP/SO plan see Section 8: http://www.kff.org/report-section/ehbs-2012-section-8/, Kaiser/HRET Survey of Employer-Sponsored Health Benefits, 2012.
  6. The dotted lines represent either the minimum or maximum value, or the extent of the inter-quartile-range.  Outliers are not displayed.
  7. Both the 25th and 75th percentiles are significantly higher in 2012 compares against 2006.
  8. For more information on the differences in enrollment patterns between small and large firms see Exhibit 5.2: http://www.kff.org/report-section/ehbs-2012-section-5/.  Kaiser/HRET Survey of Employer-Sponsored Health Benefits, 2012.
  9. Firms with many lower-wage workers are ones where 35% or more of employees earn $24,000 or less.  Firms with many higher-wage workers are ones where 35% or more of employees earn $55,000 or more. Wage cutoffs are the inflation adjusted 25th and 75th percentile of national wages according to the National Compensation Survey: Occupational Earnings in the United States, 2010.
  10. For more information see: “Preventive Services Covered by Private Health Plans under the Affordable Care Act.” Kaiser Family Foundation. September 2011. http://www.kff.org/health-reform/fact-sheet/preventive-services-covered-by-private-health-plans/.
  11. Claxton, Gary & Jacobs, Paul.  “Comparing the Assets Of Uninsured Households to Cost Sharing Under High-Deductible Health Plans”. Health Affairs.  May 2008.  27:3 w214-w221.
Poll Finding

National Survey of Teens and Young Adults on HIV/AIDS

Published: Nov 1, 2012

This national survey of 15-24 year olds about HIV/AIDS finds that nearly three times as many Black teens and young adults, and twice as many Latino youth, say HIV/AIDS is an issue that concerns them personally as compared to whites the same age.

The poll, designed and analyzed by public opinion researchers at the Kaiser Family Foundation, was conducted Sept. 21 ‐ Oct. 1, 2012 among a nationally representative online sample of 1,437 youth ages 15‐24 living in the United States. The margin of sampling error for the full sample is plus or minus 4 percentage points. For results based on subgroups, the margin of sampling error may be higher.

News Release

Findings (.pdf)

Chartpack (.pdf)

Toplines (.pdf)

The Cost and Coverage Implications of the ACA Medicaid Expansion: National and State-by-State Analysis

Published: Nov 1, 2012

A central goal of the Patient Protection and Affordable Care Act (ACA) is to significantly reduce the number of uninsured by providing a continuum of affordable coverage options through Medicaid and new Health Insurance Exchanges. Following the June 2012 Supreme Court decision, states face a decision about whether to adopt the Medicaid expansion. These decisions will have enormous consequences for health coverage for the low-income population.

This analysis uses the Urban Institute’s Health Insurance Policy Simulation Model (HIPSM) to provide national as well as state-by-state estimates of the impact of ACA on federal and state Medicaid costs, Medicaid enrollment, and the number of uninsured. The analysis shows that the impact of the ACA Medicaid expansion will vary across states based on current coverage levels and the number of uninsured. This analysis shows that by implementing the Medicaid expansion with other provisions of the ACA, states could significantly reduce the number of uninsured. Overall state costs of implementing the Medicaid expansion would be modest compared to increases in federal funds, and some states are likely to see small net budget savings.

News Release

Executive Summary (.pdf)

Full Report (.pdf)

Data Note (.pdf)

Materials From November 26, 2012 Conference Call Briefing

Audio

Slides (.pdf)

Transcript (.pdf)

Faces of the Medicaid Expansion: Experiences and Profiles of Uninsured Adults Who Could Gain Coverage

Published: Nov 1, 2012

These two papers provide insight into how state decisions to expand Medicaid under the Affordable Care Act are likely to impact people. Based on focus groups and interviews conducted in Cincinnati, Houston, Las Vegas and Tampa with uninsured adults who could be eligible for the Medicaid expansion in 2014, these papers highlight the experiences of uninsured adults and the significant health and financial consequences of being uninsured, which sometimes impact their ability to work and their daily lives and relationships. The papers include a brief on key themes from the focus groups and ten individual profiles of selected focus group participants. They provide a human dimension of what is at stake in state decisions to expand Medicaid under the ACA.

Overview Brief (.pdf)

Personal Profiles (.pdf)

Why Does Medicaid Spending Vary Across States: A Chartbook of Factors Driving State Spending

Published: Nov 1, 2012

This detailed chartbook provides an illustrative overview of some of the key factors that contribute to the substantial variation in Medicaid spending across states today. The chartbook provides a broad range of state-by-state data on subjects including state revenue and spending, the demand for public services, health care markets, and state Medicaid policy choices. Understanding this variation can be important for assessing state fiscal issues, the differences across states and their implications for federal and state policy changes to the Medicaid program.

Report (.pdf)

What Issues Are Most Important To Voters in This Election? The Answer Depends On The Question

Authors: , , and
Published: Nov 1, 2012

Election polling has entered hyperdrive, with several polls released daily. As Nov. 6 draws near, it is important to keep in mind that question wording and format do matter, sometimes quite a lot. In our October Kaiser Health Tracking Poll, we measured voters’ top issue priorities two ways: First, we asked one group to name the most important issue to their vote for president in an open-end question, allowing respondents to say in their own words what is on their minds.1 Second, using a defined list of nine issues, we asked a separate group of voters to rate each as either “extremely important”, “very important”, “somewhat important”, or “less important than that”.2 There is no “right way” to ask this question, as both questions provide valuable, but different, information. The open-end approach helps illuminate the issues on the forefront of voters’ thoughts, while the close-end approach elicits their opinion about issues on the agenda, including some that may not be top of mind. This data note will compare the results from these two questions and illustrate how results can differ depending on the question approach that is utilized.

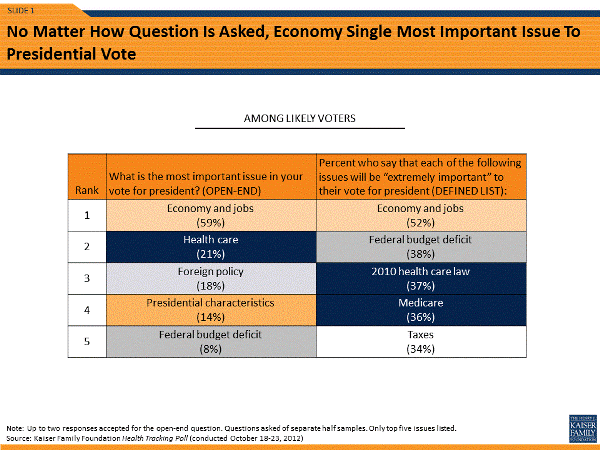
There is no denying this fact: No matter how you ask it, the economy is clearly the number one issue for a majority of voters. Among likely voters,52 percent rate the economy and jobs as “extremely important” to their vote for president. Similarly, when asked to volunteer their own answer for the most important issue to their vote, six in ten (59 percent) voters mentioned the economy.

Policy-insights-110112datanotenomatterhowasked

While the economy is tops in both approaches, the rest of the issue priority list differs depending on the question approach. In the open-end question, health care comes into the second slot (mentioned by 21 percent), followed closely by foreign policy (18 percent).4 But, foreign policy drops out of the top three and is ranked seventh out of the nine issues in the close-ended question, while health care still makes a strong showing in the defined list with a little over a third of likely voters saying the health reform law (37 percent) and Medicare (36 percent) are “extremely important” to their vote. These health care issues are neck and neck with the deficit (38 percent) and taxes (34 percent) for the number two spot in this approach. While the federal budget deficit and taxes are high up on the defined list, fewer than ten percent of voters offer up either issue as most important to their vote (8 percent of likely voters mention the deficit, 5 percent taxes) when asked to name one.

Issues related to health care are clearly on many voters’ minds, but the open-end question fails to show the nuances of what people mean by “health care”. In the defined list approach Medicare is clearly towards the top of the issue priority list (statistically tied for second), but in the open-end approach few specifically name Medicare as the main factor to their vote for president. Just three percent mention Medicare, which were then rolled into the general health care category. One characteristic does apply to both approaches: Seniors are more likely to rate Medicare as “extremely important” (50 percent versus 32 percent for those ages 18-64) and are also more likely to name the issue as important to their vote in the open-end. In fact, one in ten senior voters volunteer Medicare as their top voting issue compared to just one percent of non-seniors.

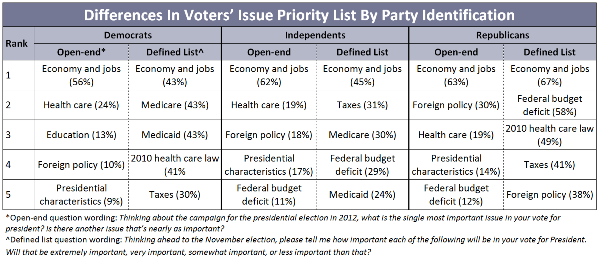
These differences are also seen when looking at voters by their political party identification. This pattern is particularly evident among likely voters who are Republican. The economy is still the top issue for these voters, but the deficit sharply drops from the second most important issue when asked as part of a defined list (rated as “extremely important” to their vote by 58 percent) to barely cracking the top five in the open-end, with one in ten (12 percent) naming it as the most important issue.

Differences in Voters

So what issue is really on voters’ minds? In the current election, the economy is the number one issue regardless of the strategy used to answer this question. But, depending on the question approach, the issue directly following the economy can be up for interpretation both among voters overall and within each subgroup. It seems as though health care and foreign policy are other top issues on their minds, but the deficit, ACA, Medicare, and taxes also rise towards the top when the question reminds them of those issues. Our advice: Even though the economy is at the forefront of voters’ minds, other issues are still a factor, so look for both approaches in the days ahead, take all data points into account and don’t limit your poll watching to just one poll.

__________________________________________1. Note: for the open-end question up to two responses were accepted. Figures reported for this approach are “NET” percentages. For example, “economy and jobs” also includes mentions of “unemployment” and “jobs moving overseas”.2. For full question wording and results, see Kaiser Family Foundation, Health Tracking Poll, October 2012, http://www.kff.org/kaiserpolls/8381.cfm.3. In this data note, likely voters are defined as those that reported being registered to vote and either ‘absolutely certain’ or ‘probably’ planning to vote.4. Note: The field period for this tracking poll (October 18th through 23rd) overlapped with the final presidential debate on October 22nd, which focused on the topic of foreign policy.

Best Bets for Reducing Medicare Costs for Dual Eligible Beneficiaries: Assessing the Evidence

Published: Oct 31, 2012

With pressure mounting to slow the growth in federal health care spending, policymakers are exploring ways to reform the way care is delivered to the 9 million low-income Medicare beneficiaries who also receive Medicaid – a group that on average is sicker and frailer than other Medicare beneficiaries, and therefore receive significantly more care at greater cost. Major efforts are underway at the federal and state level to better coordinate care for this population and lower health care costs – with some estimates projecting hundreds of billions of dollars in savings over the next decade.

This study reviews prior pilot projects and demonstrations and finds support for modest Medicare savings through well-targeted interventions. Authored by Randall Brown and David R. Mann of Mathematica Policy Research, the authors point to a small number of fully integrated, capitated managed care programs and fee-for-service based interventions for dual eligible beneficiaries that succeeded in reducing hospitalizations, although few of these programs were able to demonstrate net savings for Medicare.

The study neither examines the potential for federal and state Medicaid savings nor analyzes whether the new initiatives just getting underway could achieve Medicare savings, but provides a synthesis of earlier evidence that could inform those efforts.

Issue Brief (.pdf)