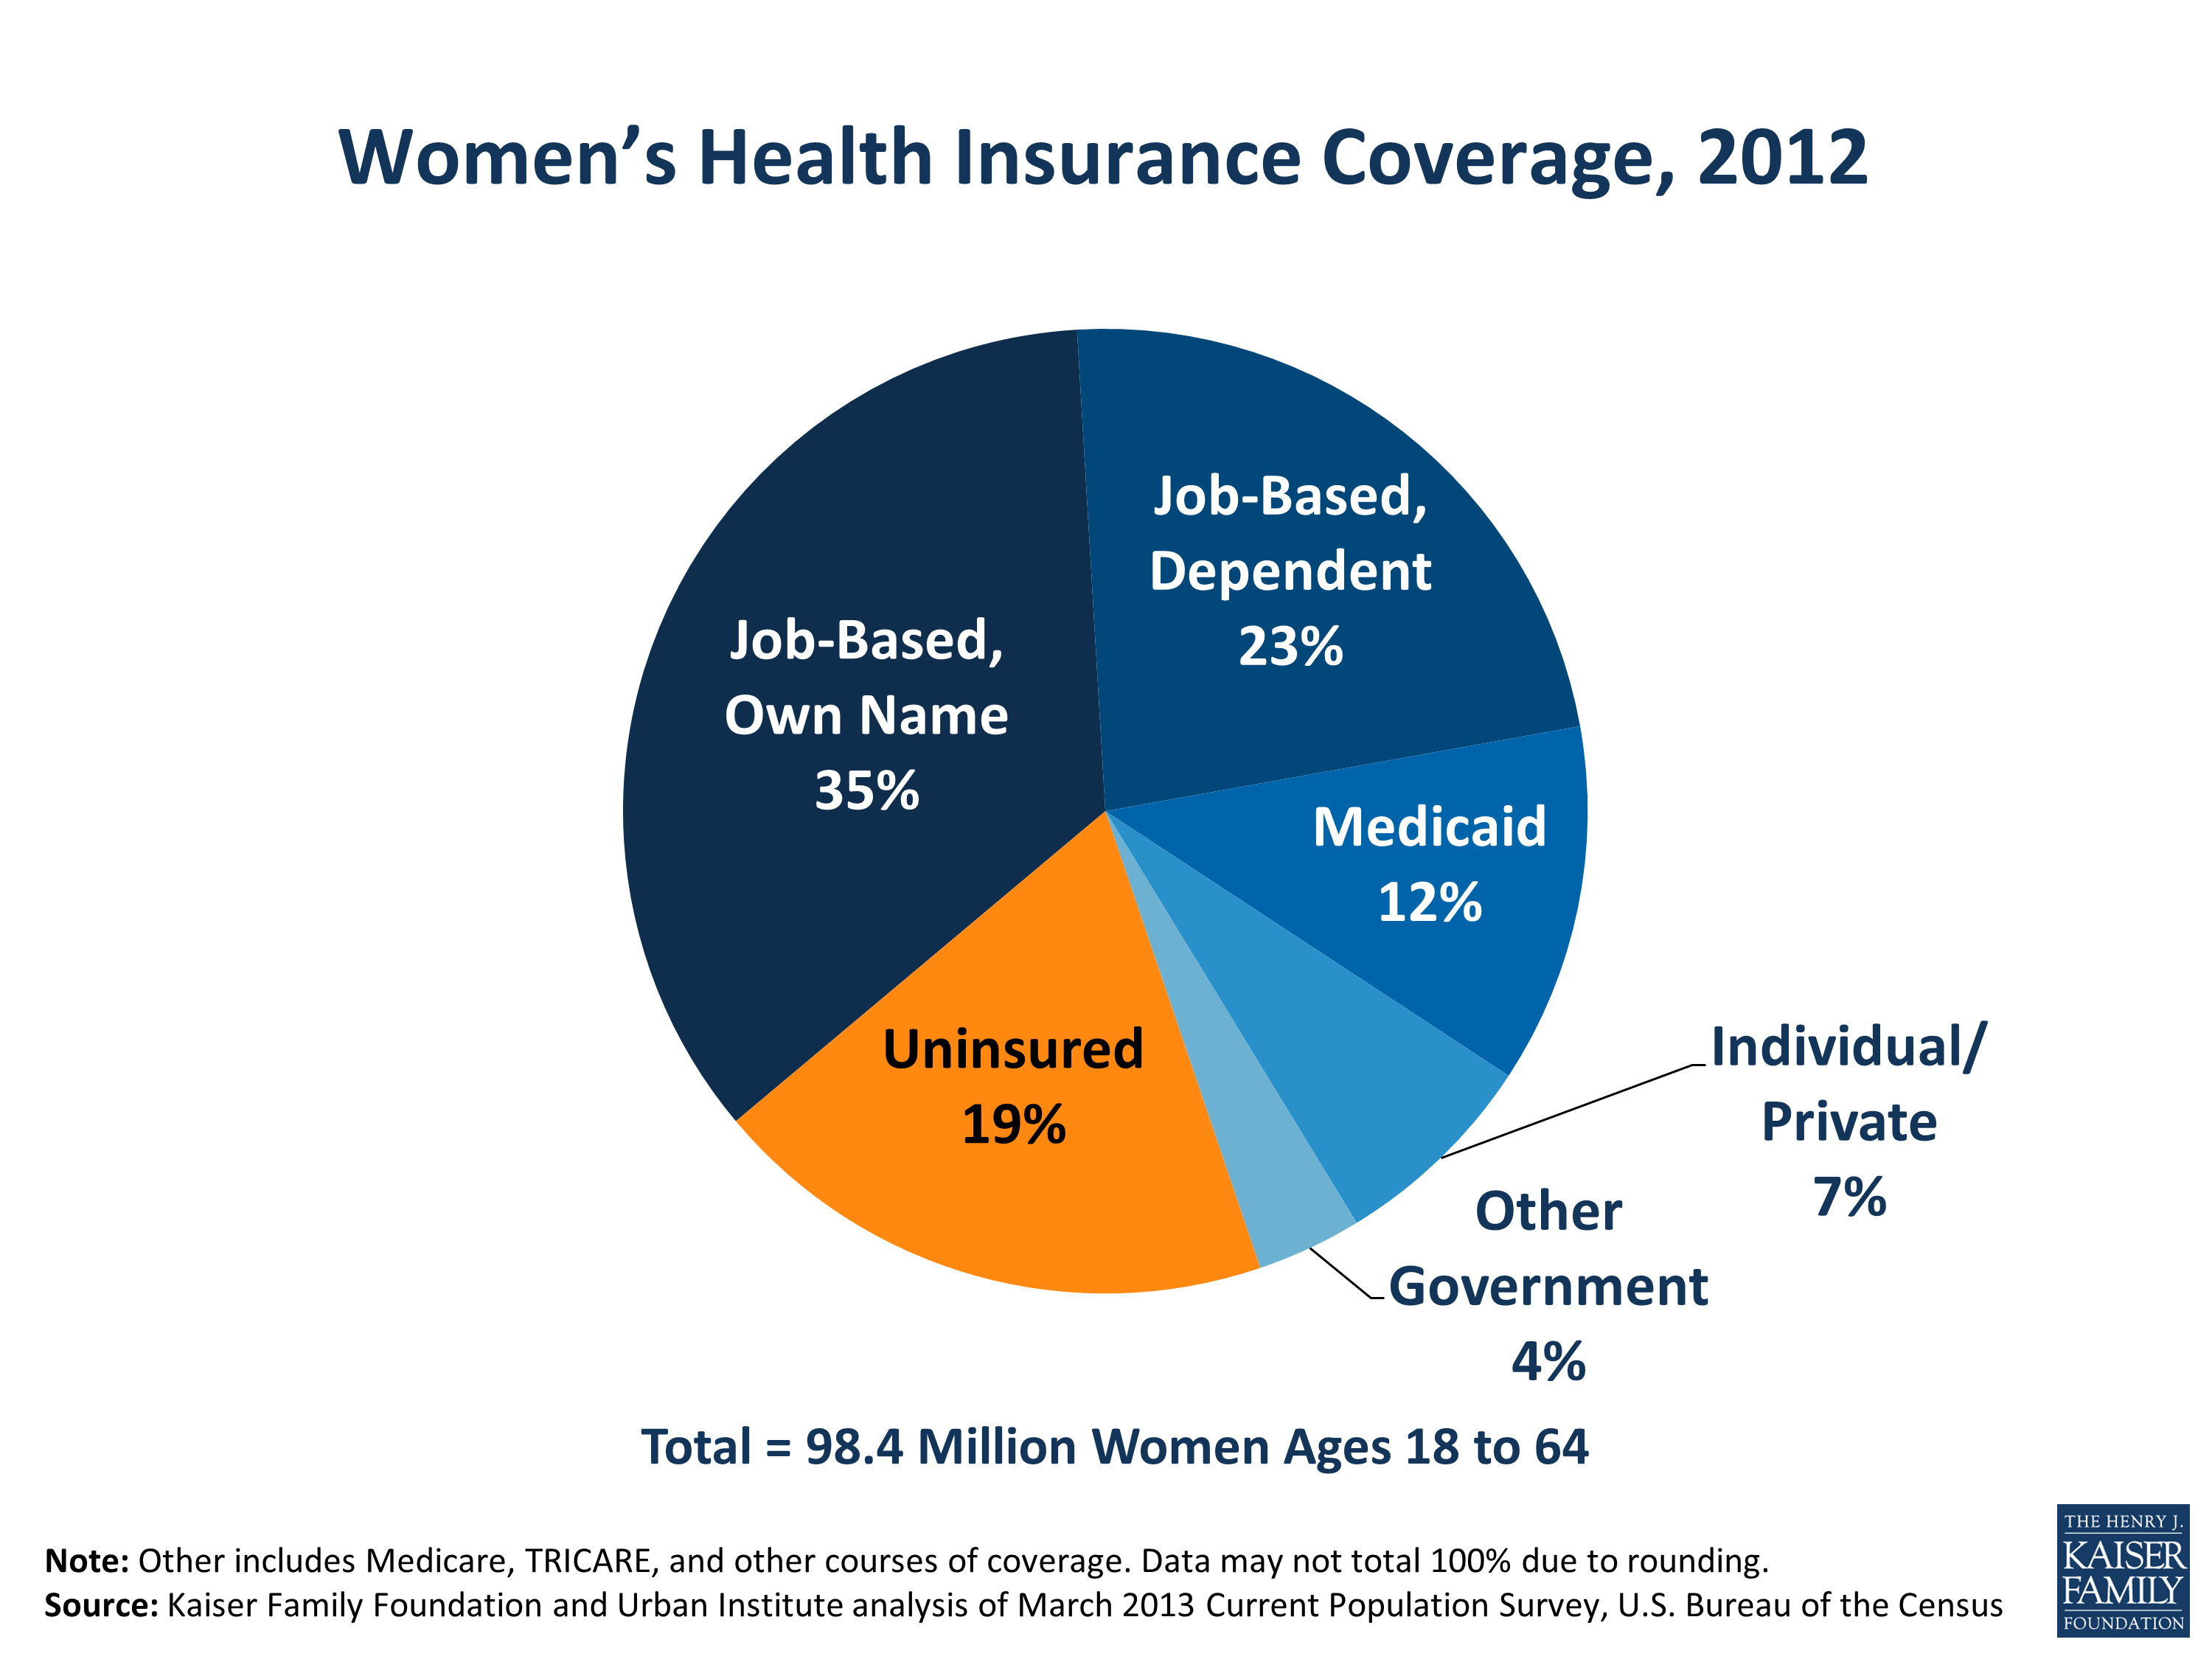
Women’s Health Insurance Coverage, 2012
The independent source for health policy research, polling, and news.
Si usted tiene Medicare, su cobertura de salud no tiene cambios como consecuencia del Obamacare. Usted puede seguir confiando en el Medicare para ayudar a pagar su hospital, doctores y otros gastos médicos.
Usted todavía tiene la opción de elegir entre el Medicare tradicional o el Medicare Advantage Plan (como un Medicare HMO) ofrecido en su área, y entre otros planes de Medicare para medicamentos recetados. Si usted está en Medicare y tiene bajos ingresos, también puede calificar para ayuda extra con las primas (el costo mensual de su seguro) y los costos compartidos. La Ley de Cuidado de Salud a Bajo Precio no cambió estas opciones. Para más información sobre sus opciones de cobertura, visite es.medicare.gov o llame a la línea de ayuda 1-800-MEDICARE (1-800-633-4227).
La reforma de salud hizo mejoras significativas a los beneficios de Medicare que pueden ayudarlo:
1. Medicare ya no requiere que usted pague una tarifa por el chequeo anual con su doctor.2. Medicare ya no cobra por muchos exámenes preventivos como cáncer, depresión, diabetes, colesterol, obesidad y otras condiciones.3. Medicare está gradualmente reduciendo el monto de dinero que las personas con altos gastos en medicinas recetadas deben pagar cada año, cerrando la brecha en la cobertura, brecha que también se conoce “doughnut hole.”
La mayoría de los otros cambios al Medicare afectan cómo el programa le paga a a las compañías aseguradoras de salud, hospitales y otros proveedores de atención de salud por el cuidado que reciben los beneficiarios del Medicare. Por ejemplo, la ley redujo lo que el Medicare paga a las HMO’s y a otros planes privados de Medicare Advantage. Otros cambios están diseñados para que los hospitales, doctores y otros proveedores de cuidados de salud mejoren la calidad del cuidado que proveen a las personas del Medicare; por ejemlo animando a los proveedores a trabajar más unidos para coordinar el cuidado de los pacientes cuando son dados de alta de los hospitales, y tomando recaudos para prevenir readmisiones hospitalarias innecesarias. La mayoría de estos esfuerzos están en sus estadíos iniciales, y tomará tiempo para ver qué tipo de impacto tienen.
La ley también incluye nuevas tarifas para beneficiarios del Medicare con ingresos relativamente altos. Si usted es soltero y su ingreso es mayor de $85.000 anuales, o si es casado y su ingreso es mayor de $170.000 anuales, usted puede pagar primas de Medicare más altas.
El Gobierno federal tiene una línea telefónica que funciona las 24 horas para atender consultas de los consumidores: 1-800-318-2596. Para encontrar más información sobre el Obamacare, visita www.cuidadodesalud.gov.
Si usted tiene cobertura de beneficios de salud a través de su empleador o del empleador de un miembro de su familia, usted probablemente pueda mantener esa cobertura y no tener que hacer ningún cambio. En la mayoría de los casos, la cobertura de su empleador satisface los requerimientos de la ley sobre la obtención de seguro.
Algunas características de la cobertura de su empleador pueden ya haber cambiado como resultado de la Ley del Cuidao de Salud a Bajo Precio. Por ejemplo, si usted es padre, sus hijos pueden ahora estar bajo su póliza hasta que tengan 26 años.
Su plan seguramente cubra ahora servicios preventivos como inmunizaciones y exámenes sin costo para usted, aunque algunos planes a través del empleador vigentes en 2010 están exentos de este requerimiento.
Comenzando en el 2014, su plan no puede imponer un límite anual de dólares en sus beneficios, límite que lo podría dejar sin cobertura si usted se enferma gravemente. Su plan tampoco puede ya limitar la cobertura a cualquier persona porque tenga una condición preexistente. Su plan tampoco ya no puede poner un límite a la cantidad de beneficios que usted puede recibir a lo largo de su vida. A los planes de su empleador también se les requiere limitar la cantidad de gasto compartido (como deducibles o copagos) que usted debe pagar por servicios cubiertos de $6.350 por persona por año. Esta provisión tendrá plena vigencia en el 2015.
En algunos casos, su empleador puede necesitar cambiar sus beneficios de salud para ajustarse a los requerimientos de la ley. Por ejemplo, si en la actualidad usted recibe una escueta cobertura a través de su empleador —por ejemplo, ayuda para pagar las visitas de rutina al médico, con poca o ninguna cobertura para hospitalización o enfermedad grave— esa cobertura ya no se ofrecerá en el 2014. Su empleador puede decidir ofrecer una cobertura más amplia, como muchos empleadores ya están haciendo, o puede decidir no ofrecer ninguna cobertura a sus trabajadores.
La ley anima a los empleadores a ofrecer seguro médico. Los empleadores más grandes —aquéllos con al menos 50 empleados trabajando a tiempo completo (o el equivalente en trabajadores de medio tiempo) — pueden enfrentar penalizaciones si no ofrecen cobertura accesible a sus empleados de tiempo completo. Los empleadores más pequeños — aquéllos con 50 o menos de 50 empleados de tiempo complete — no tienen el requerimiento de ofrecer cobertura, pero pueden tener créditos impositivos si la ofrecen.
Si su empleador ofrece seguro médico que es muy costoso para con respecto a su ingreso, usted puede comprar cobertura a través del nuevo Mercado de Seguros Médicos (o de intercambio) de su estado. El Mercado de Seguros es como una “tienda por internet” para que las personas compren su propio seguro de salud, y le permite comparar planes en base a precios y a otros factores. Usted puede calificar para créditos impositivos para comprar esta cobertura si su empleador no le ofrece una cobertura que cumpla con los requerimientos de la ley y si su ingreso entra en un cierto rango: alrededor de hasta $46.000 para un individuo y $78.000 para una familia de tres. Si su ingreso es muy bajo (menos de $16.000 para un solo individuo) usted podría calificar para cobertura bajo el Medicaid.
El Gobierno federal tiene una línea telefónica que funciona las 24 horas para atender consultas de los consumidores: 1-800-318-2596. Para encontrar más información sobre el Obamacare, visitar www.cuidadodesalud.gov.
Si usted compra su plan de salud por su cuenta (en vez de tener cobertura a través de su empleador), usted tendrá nuevas opciones para tener su cobertura, pero la Ley del Cuidado de Salud a Bajo Precio requiere que usted esté asegurado o será multado.
Bajo Obamacare, los planes de salud deben cubrir visitas al doctor, hospitalizaciones, recetas de drogas y cuidado materno sin restricciones por condiciones preexistentes, o condiciones físicas o enfermedades mentales existentes antes de que comenzara la cobertura. Estos planes son generalmente más amplios que los del actual mercado individual y deben cubrir todas condiciónes preexistentes. Cubren servicios preventivos como inmunizaciones, exámenes, y contracepción sin gasto para usted. Todos los planes deben cubrir cuidado prenatal y parto sin costos extras en la cobertura. Ya no se le pedirá dar un detalle de su salud o su historia clínica para aplicar por cobertura.
La ley establece nuevos Mercados de Seguros Médicos (o de intercambio) en cada estado que le permiten comparar planes y precios. La inscripción comenzó el 1 de octubre del 2013 y la cobertura entra en efecto el 1 de enero del 2014. Los planes tanto dentro como fuera del Mercado se presentan en cuatro niveles – bronce, plata, oro y platino – que varían en lo que cubren, lo que cuestan las primas (el costo mensual de su seguro), y qué deducibles y gastos de bolsillo requieren. Si usted es menor de 30 años, puede ser capaz de obtener un plan de seguro “catastrófico,” que tiene primas más bajas pero gastos mayores en cuentas médicas. Las aseguradoras no pueden cobrarle más basándose en su historia médica o en si es mujer. Sólo pueden variar sus primas basándose en su edad, el número de miembros de su familia cubiertos por la póliza y en si usted consume tabaco.
Si usted elige comprar una nueva póliza a través del Mercado de Seguros Médicos de su estado, usted puede ser elegible para asistencia financiera basada en su ingreso, para ayudar a cubrir el costo. En general, usted puede ser elegible para asistencia federal si es una persona soltera con un ingreso anual en el rango de $11.500 a $46.000 o si su ingreso familiar está en el rango de $19.500 a $78.000 para una familia de tres. El rango puede variar de acuerdo al tamaño de la familia. Use la calculadora on-line de la Kaiser Family Foundation para tener un estimado de las primas y los subsidios disponibles para usted. Las personas con ingresos más bajos que compren cobertura a través del mercado de seguros también pueden ver reducidos sus deducibles y gastos de bolsillo. Si su ingreso es más bajo, usted puede ser elegible para cobertura a través del Medicaid.
Si elige comprar cobertura por fuera del nuevo Mercado de Seguros Médicos, su plan todavía puede ofrecer las mismas protecciones que los planes ofrecidos a través del mercado estatal, pero no se le ofrece asistencia financiera.
Si su actual plan continúa ofreciendo cobertura el año que viene, usted puede permanecer en ese plan. Sin embargo, no será elegible para créditos impositivos por esa cobertura. Usted podría querer comparar sus actuales primas y beneficios con las que podría ser capaz de adquirir a través del mercado estatal antes de decidir cuál es la mejor opción para usted.
El Gobierno federal tiene una línea telefónica que funciona las 24 horas para atender consultas de los consumidores: 1-800-318-2596. Para encontrar más información sobre el Obamacare, visita www.cuidadodesalud.gov.
Obamacare crea muchas formas de obtener cobertura de salud. Usted puede aprender sobre sus opciones llenando una única aplicación. Así, se le dirá si califica para cobertura gratis o a bajo costo a través del programa Medicaid, o a través de los nuevos Mercados de Seguros Médicos que han sido establecidos en cada estado. Usted debería aplicar para cobertura aunque en el pasado no haya tenido la capacidad de tenerla a través del Medicaid o de compañías privadas de seguros. Éstas son nuevas opciones bajo la Ley de Cuidado de Salud a Bajo Precio.
Obamacare expande el Medicaid para muchos adultos de bajos ingresos, incluyendo adultos que no tengan niños como dependientes. Sin embargo, más de dos docenas de estados han elegido no expandir el Medicaid bajo la ley o todavía están debatiendo este asunto. En los estados que expandieron el Medicaid, usted puede calificar para como un individuo soltero si gana menos de unos $16.000 al año, mientras que familias de otros tamaños pueden calificar con ingresos más altos. En los estados que no expandieron el Medicaid, usted puede tener pocas o ninguna opción de cobertura accesible. En ese caso, usted no tendrá que pagar una multa por no tener cobertura.
Aún en los estados que no expandieron el Medicaid, usted puede ser capaz de obtener subsidios a travees de créditos impositivos, que ayudan a pagar la cobertura en el nuevo mercado de seguros de salud si su ingreso anual está entre $11.500 y $46.000 para una sola persona, o entre $19.500 y $78.000 para una familia de tres. Ya sea con base estatal o federal, los Mercados de Seguros Médicos sirven como una “tienda en internet,” en la que usted puede comprar planes de seguros de salud ofrecidos por compañías de seguros privadas.Usted puede ver si es elegible para tener asistencia federal para bajar sus primas (el costo mensual de su seguro) y reducir cuánto usted debe pagar de su bolsillo cuando busque cuidado médico. Use la calculadora on-line de la Kaiser Family Foundation para tener un estimado de las primas y subsidios que pueden estar disponibles para usted.
Usted puede comenzar aplicando para cobertura durante el período de inscripción abierta, que va desde el 1 de octubre hasta el 31 de marzo, para la cobertura que comienza el 1 de enero del 2014. Si necesita ayuda para llenar la aplicación hay personas que pueden asistirlo. Una lista de personas que pueden ayudarlo cerca suyo debería estar disponible en el sitio web del nuevo Mercado de Seguro Médico de su estado. Si usted califica para Medicaid, puede inscribirse en cualquier momento, no sólo durante el período de inscripción. Si usted tiene Medicaid ahora, usted continúa teniendo cobertura para usted y su familia.
El Gobierno federal tiene una línea telefónica que funciona las 24 horas para atender consultas de los consumidores: 1-800-318-2596. Para encontrar más información sobre Obamacare, visita www.cuidadodesalud.gov.
Obamacare ha creado nuevas maneras de tener cobertura de salud. Si usted no tiene seguro médico a través de su empleador, seguramente pueda obtenerlo a través del nuevo Mercado de los Seguros Médicos (o “intercambio”) en su estado.
Llenando una única aplicación, usted aprenderá sobre sus opciones de planes médicos y los costos, y si califica para tener cobertura a través de Medicaid o para recibir un subsidio para comprar un seguro médico en el nuevo Mercado de los Seguros Médicos de su estado. Usted puede calificar para Medicaid si gana al año cerca de $16.000 para un individuo, incluso si es un adulto sin niños en el hogar, y aunque antes no hubiera sido elegible para obtener cobertura a través de este programa. Grupos familiares de otros tamaños pueden calificar con ingresos mayores. Sin embargo, no es mandatorio que los estados expandan el Medicaid y más de dos docenas no ha avanzado en este tema.
Si usted gana demasiado para ser elegible para el Medicaid, todavía puede obtener cobertura accesible en los nuevos Mercados. Ya sea con base estatal o federal, estos mercados funcionan como una “tienda en internet” en donde usted puede comprar un plan médico ofrecido por aseguradoras privadas en su área. Los planes de seguros se presentan en cuatro niveles – bronce, plata, oro y platino – que varían en lo que cubren, las primas que cuestan, y los costos de los deducibles y los gastos de bolsillo. Si tiene menos de 30 años, podría tener un plan de cobertura “catastrófica” que tiene primas más bajas pero requiere que usted pague más de su propio bolsillo en cuentas médicas. No se le podrá negar cobertura médica porque tenga una condición preexistente y necesitará obtener cobertura para evitar recibir una multa.
Dependiendo de su ingreso, usted puede ser elegible para una asistencia federal que bajará las primas que usted paga y reducirá cuánto dinero debe pagar de su bolsillo cuando busque seguro médico. En general, una persona soltera con un ingreso anual de entre $11.500 y $46.000, o un hogar con un ingreso de entre $19.500 y $78.000 para una familia de tres, pueden tener ayuda si la cobertura se compra a través del mercado de seguros.
El rango puede variar dependiendo del tamaño de la familia. Utilice la calculadora de la Kaiser Family Foundation para tener un estimado de las primas y subsidios que pueden estar disponibles para usted.Usted puede comenzar aplicando para la cobertura que entra en efecto el 1 de enero del 2014, durante el período abierto de inscripción que comenzó el 1 de octubre del 2013 y se extiende hasta el 31 de marzo del 2014. Si usted necesita ayuda con la aplicación hay personas que pueden asistirlo. Una lista de los navegadores (promotores) que pueden ayudarlo debe estar disponible en el sitio web del mercado de seguros de su estado. Si califica para Medicaid, puede inscribirse en cualquier momento, no sólo durante el período de inscripción.
Si usted no compra cobertura puede llegar a tener que pagar una multa. La penalidad mínima será de $95 dólares en el 2014, pero puede alcanzar miles de dólares, dependiendo de su ingreso. Algunas personas no tendrán que pagar penalidad aunque no tengan cobertura. Esto incluye a cualquier persona no asegurada por menos de tres meses, personas que no deben realizar su declaración de impuestos, o aquéllos que hubieran calificado para Medicaid pero sus estados decidieron no expandir el programa, entre otros.
El Gobierno federal tiene una línea telefónica que funciona las 24 horas para atender consultas de los consumidores: 1-800-318-2596. Para encontrar más información sobre el Obamacare, visita www.cuidadodesalud.gov.
The Kaiser Family Foundation 2013 Survey of Americans on the U.S. Role in Global Health is the fifth in a series of surveys designed, conducted, and analyzed by the Kaiser Family Foundation in order to shed light on the American public’s perceptions, knowledge, and attitudes about the role of the United States in efforts to improve health for people in developing countries. This latest survey updates trends from Kaiser’s previous surveys dating back to 2009, and explores new questions including the public’s perception of the “bang for the buck” of U.S. aid and its ability to promote self-sufficiency in developing countries, views of spending reductions in the context of the federal budget deficit, and more detail on people’s sources of information, including how much news they report hearing about specific global health issues. For the first time, the survey also includes some more detailed questions on perceptions and awareness of polio.
A few key highlights from the survey are described here, and a more detailed set of findings and charts can be found below.
As the country continues to climb out of economic recession and policymakers battle over the federal budget and national debt, Americans’ basic level of support for current levels of U.S. spending on efforts to improve health for people in developing countries has held relatively steady in recent years. Six in ten say the country spends either too little or about the right amount on such efforts, while three in ten say we spend too much. While there are some partisan differences in attitudes towards U.S. global health spending, these differences are much smaller than other surveys have found on questions of domestic health care policy.
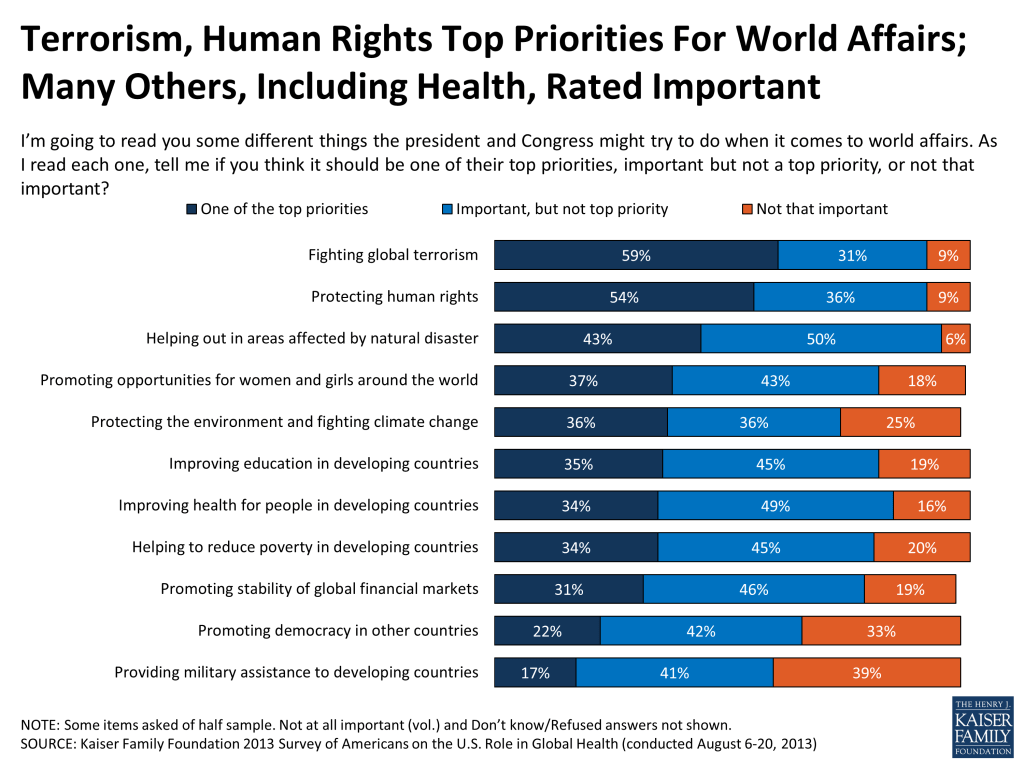
Improving health in developing countries is one of many priorities the public sees as important for the President and Congress to address in world affairs, but not the top one. Fighting terrorism tops the list of priorities, followed by protecting human rights and helping out in areas affected by natural disasters.
As previous Kaiser surveys have found, misperceptions persist about the size of U.S. foreign aid and how aid is directed. On average, Americans think 28 percent of the federal budget is spent on foreign aid, when it is about 1 percent. Further, four in ten think a major part of U.S. foreign aid is given directly to developing countries to use as they see fit, when in reality most U.S. aid is directed to specific program areas. As we’ve seen in the past, people are more supportive of foreign aid spending when a specific purpose is mentioned – in this case, improving the health of people in developing countries – than they are of the idea of foreign aid in general.
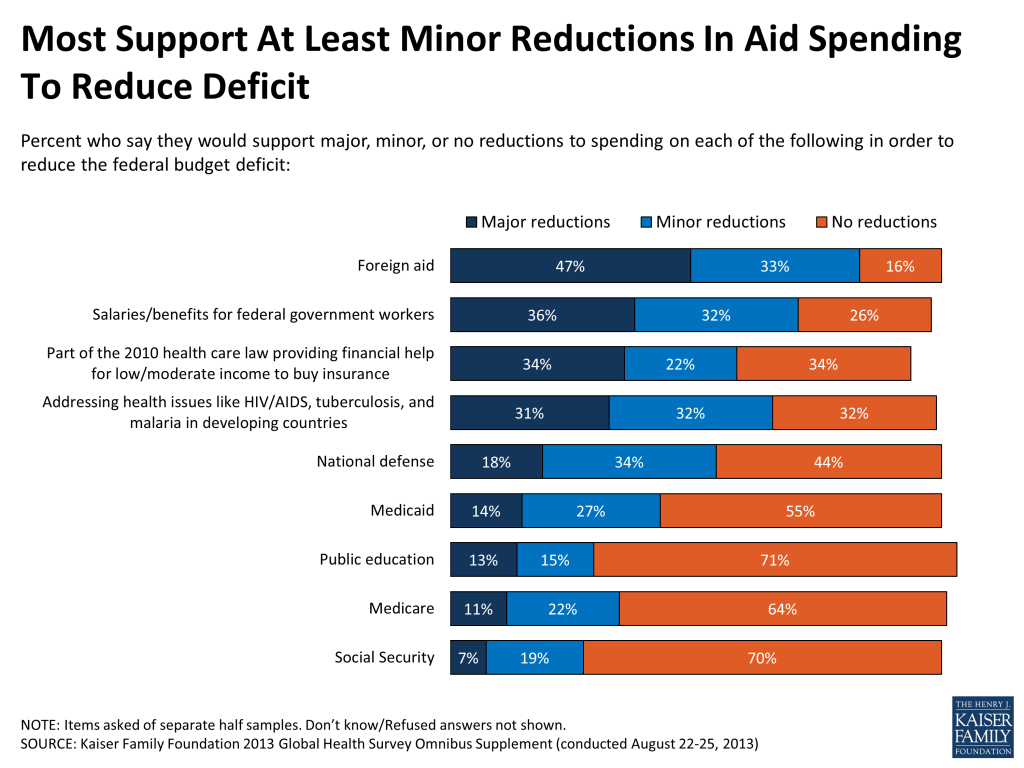
There are several important caveats to Americans’ support for U.S. global health spending. Current economic conditions make people wary of increasing spending abroad, and when it comes to contributing to deficit reduction, larger shares of the public support cuts in overseas aid compared with domestic programs like Medicare, Medicaid, public education, and Social Security. Further, most Americans do not think U.S. aid aimed at improving health delivers a good “bang for the buck,” and only about a third think it increases self-sufficiency in developing countries.
An ongoing challenge for those looking to increase the public’s level of interest in and support of global health is grabbing their attention, and there are some signs that the visibility of global health issues has declined in recent years. News media continues to be the public’s top source of information on global health, and there is great variation in how much people report hearing in the news about specific health issues in developing countries, with hunger and malnutrition at the top of the list. Few say they’ve heard much about tuberculosis or polio from the news media. Still, public awareness of the global challenge of polio is high; three-quarters are aware that the disease has not been eradicated worldwide.
Improving health in developing countries is one of many priorities the public sees as important for the president and Congress to address in world affairs. At the top of the public’s list, more than half see fighting global terrorism and protecting human rights as a top priority, followed by disaster relief. Following these are a cluster of issues seen as top priorities by more than a third of the public, including promoting opportunities for women and girls, protecting the environment and fighting climate change, improving education, improving health, and reducing poverty in developing countries. After two wars, these priorities rank higher for the public than promoting democracy and providing military assistance to developing countries.
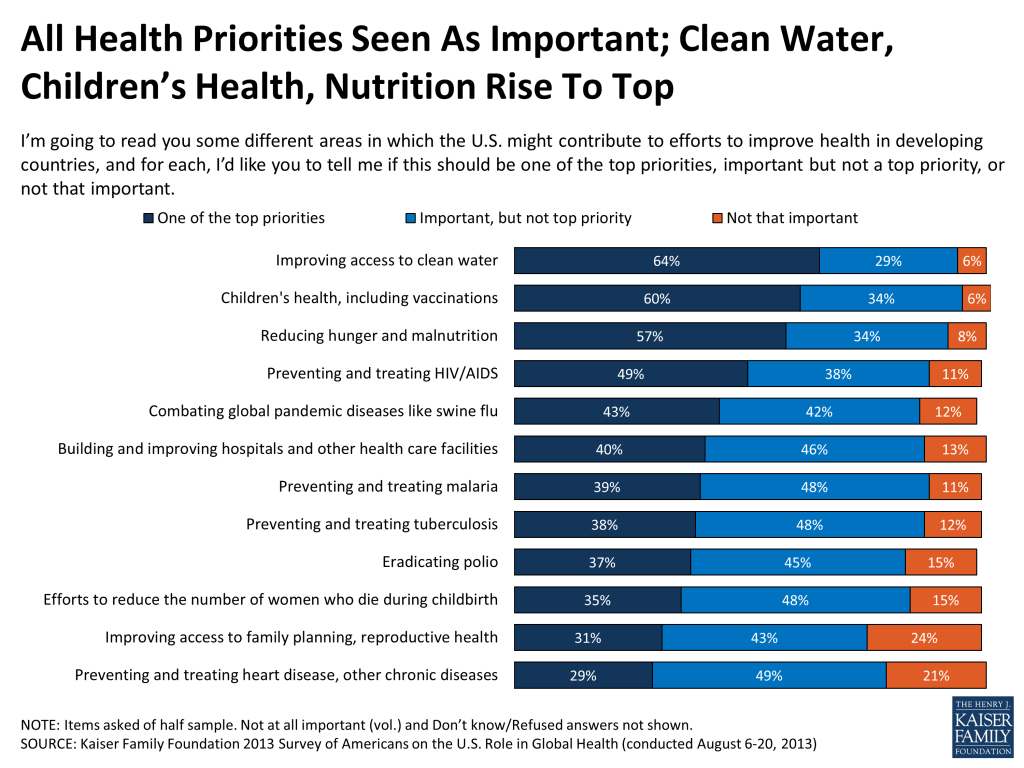
When asked about a variety of different priorities for U.S. efforts to improve health in developing countries, large majorities believe each area is important, and between three and six in ten say each should be “one of the top” priorities. Highest on the list of those considered top priorities are basic needs such as improving access to clean water and reducing hunger, along with children’s health and vaccinations.
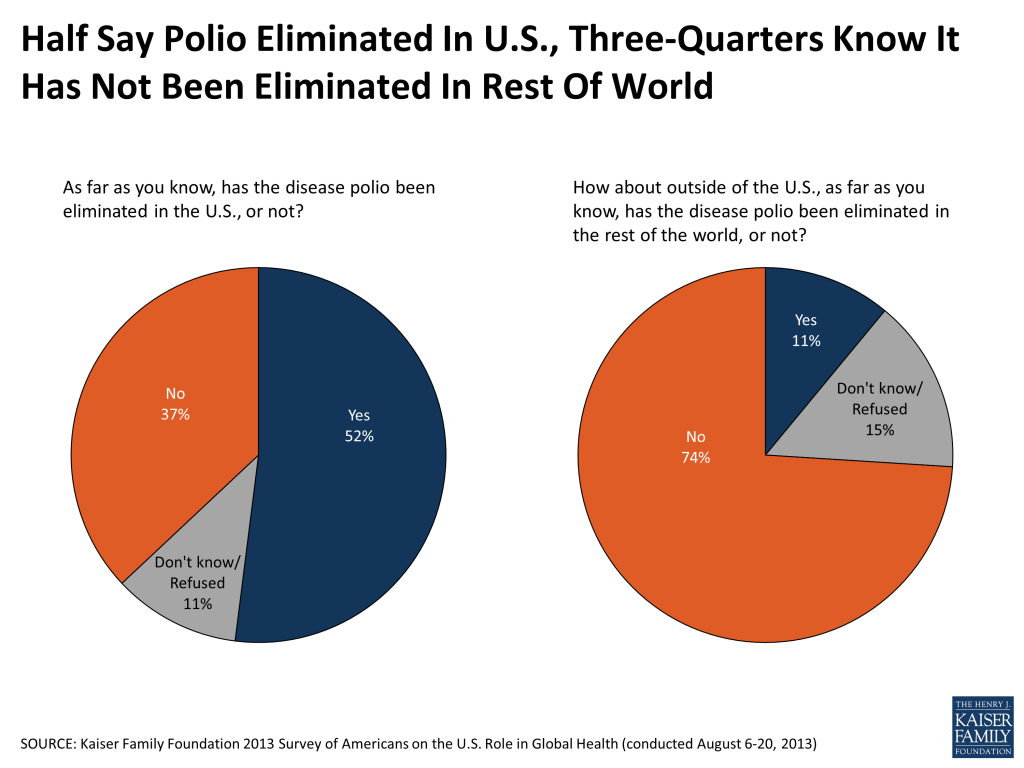
Given growing attention to polio eradication worldwide, this year’s survey included some more detailed questions about the disease. While eradicating polio does not rank high on the public’s list of priorities for U.S. involvement in improving health in developing countries, awareness of the global challenge of polio is relatively high. Nearly three-quarters (74 percent) of the public are aware that polio has not been eradicated around the world. Public awareness is somewhat less accurate when it comes to the status of the polio epidemic at home. About half (52 percent) are aware that the disease has been eliminated in the U.S., but nearly four in ten (37 percent) mistakenly believe it has not been eliminated in the U.S., and another one in ten (11 percent) are unsure.
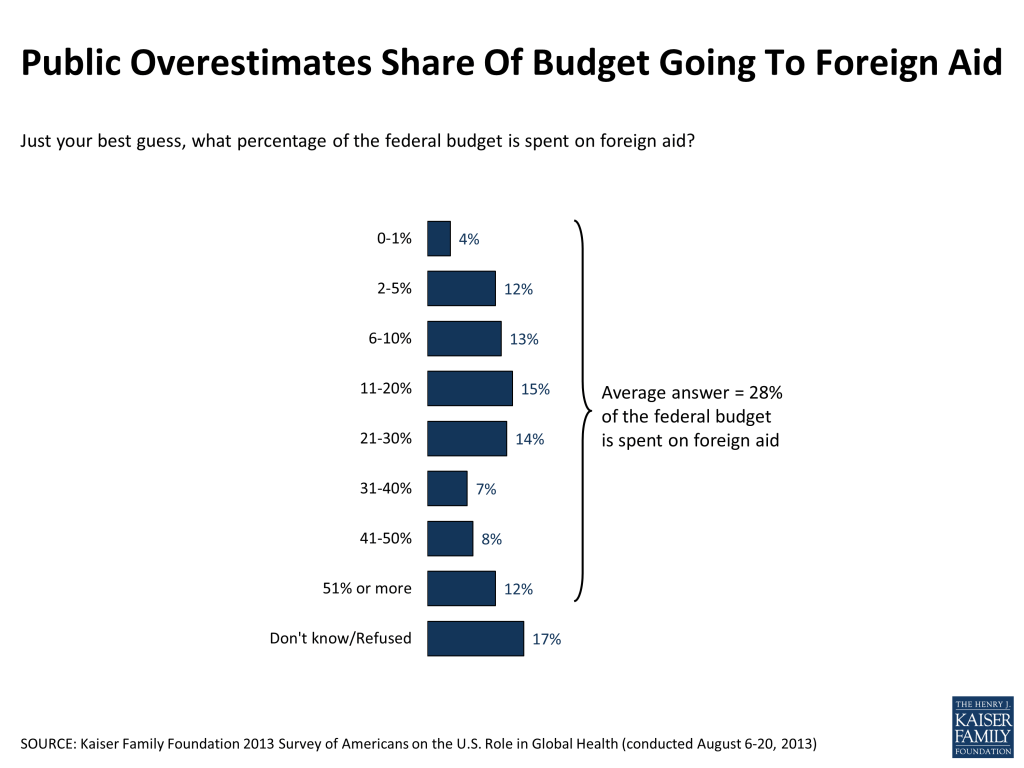
Consistent with previous Kaiser polls, the 2013 survey finds that the vast majority of the public overestimates the size of the federal budget that is spent on foreign aid, with just four percent correctly saying that foreign aid makes up one percent or less of the federal budget. A majority give answers above 10 percent, and on average, Americans answer that 28 percent of the budget is spent on foreign aid.
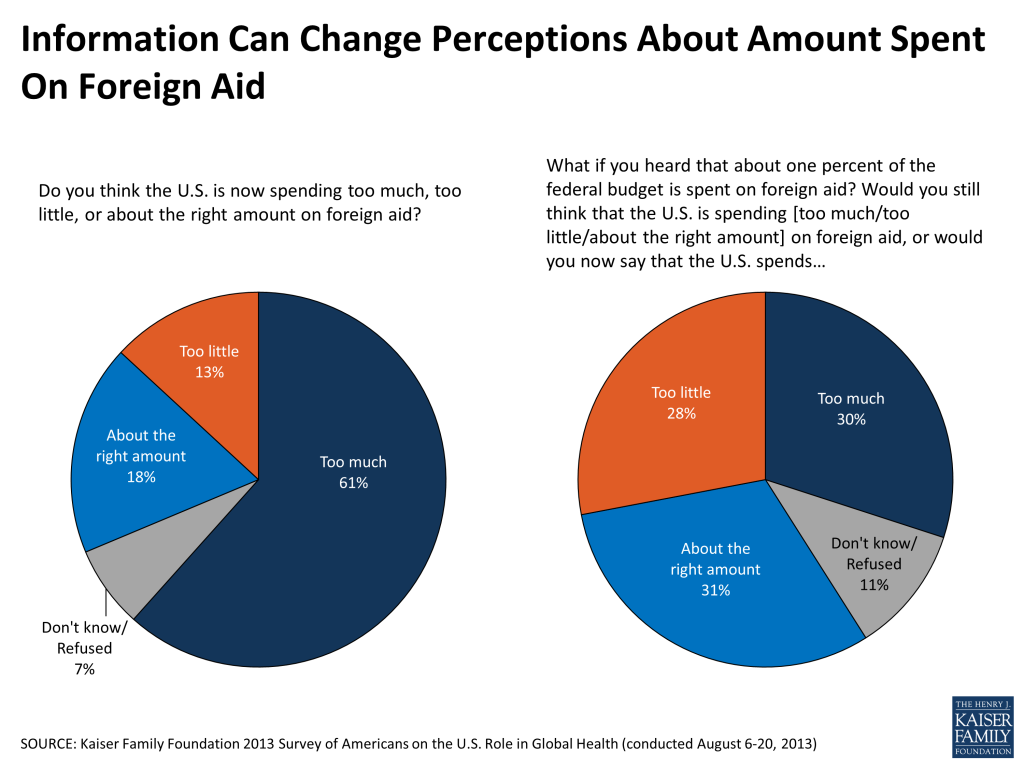
As previous Kaiser surveys have shown, spending on “foreign aid” continues to be unpopular, and in this survey, six in ten think the U.S. is now spending too much on foreign aid, and just 13 percent say the country is spending too little. However, we also find that providing people with accurate information has the potential to move opinion significantly. When survey respondents are told that only about one percent of the federal budget is spent on foreign aid, the share saying the U.S. spends too little more than doubles (from 13 percent to 28 percent), while the share saying we spend too much drops in half (from 61 percent to 30 percent).
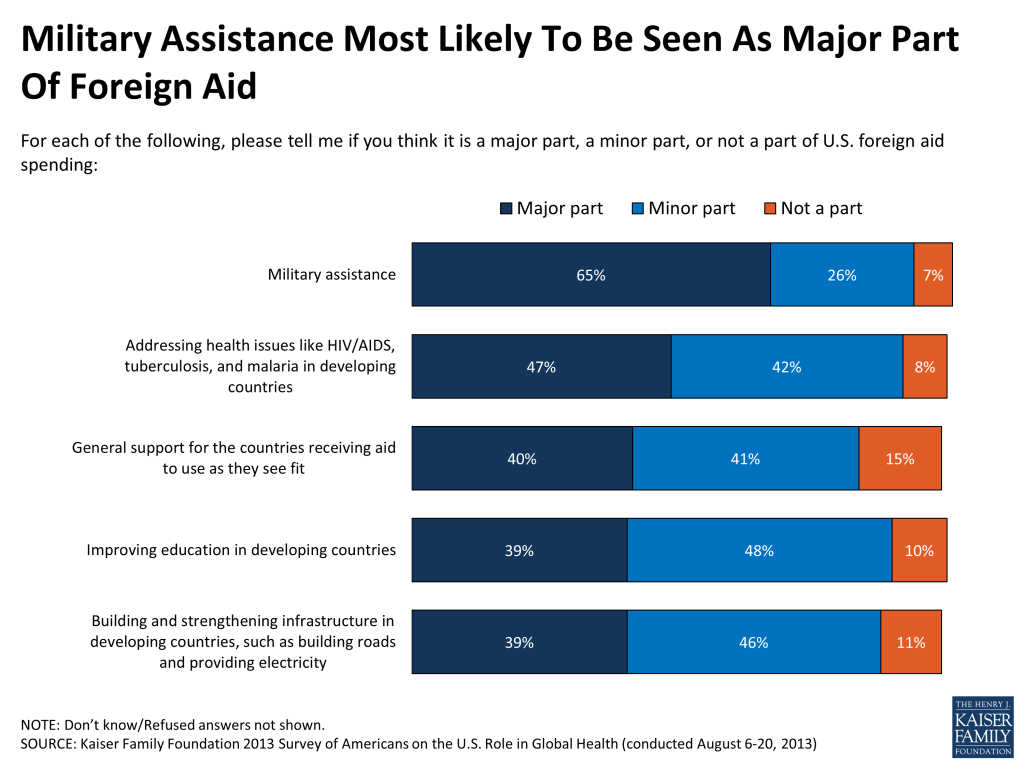
When it comes to the types of things U.S. foreign aid money is actually spent on, the public perceives a variety of components as making up this spending. At the top of the list, 65 percent think military assistance is a “major part” of U.S. foreign aid spending, and nearly half (47 percent) say the same about addressing health issues in developing countries. Around four in ten (39 percent) see improving education and building and strengthening infrastructure as major parts of U.S. foreign aid spending. In addition to these specific areas, 40 percent believe a major part of foreign aid is given to developing countries to use as they see fit. In fact, most U.S. foreign aid spending goes to specific program areas (such as agriculture, disease prevention, and maternal health, among others), and most aid does not go directly to governments, but rather to local or international non-governmental organizations, including to U.S.-run programs, in developing countries.1
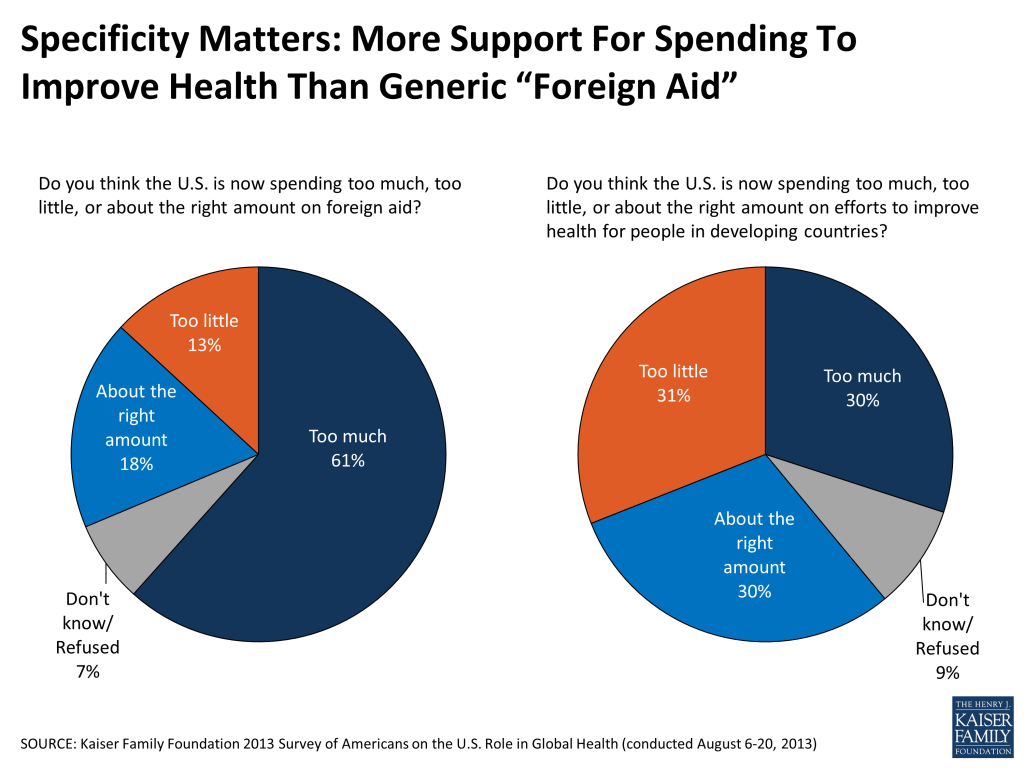
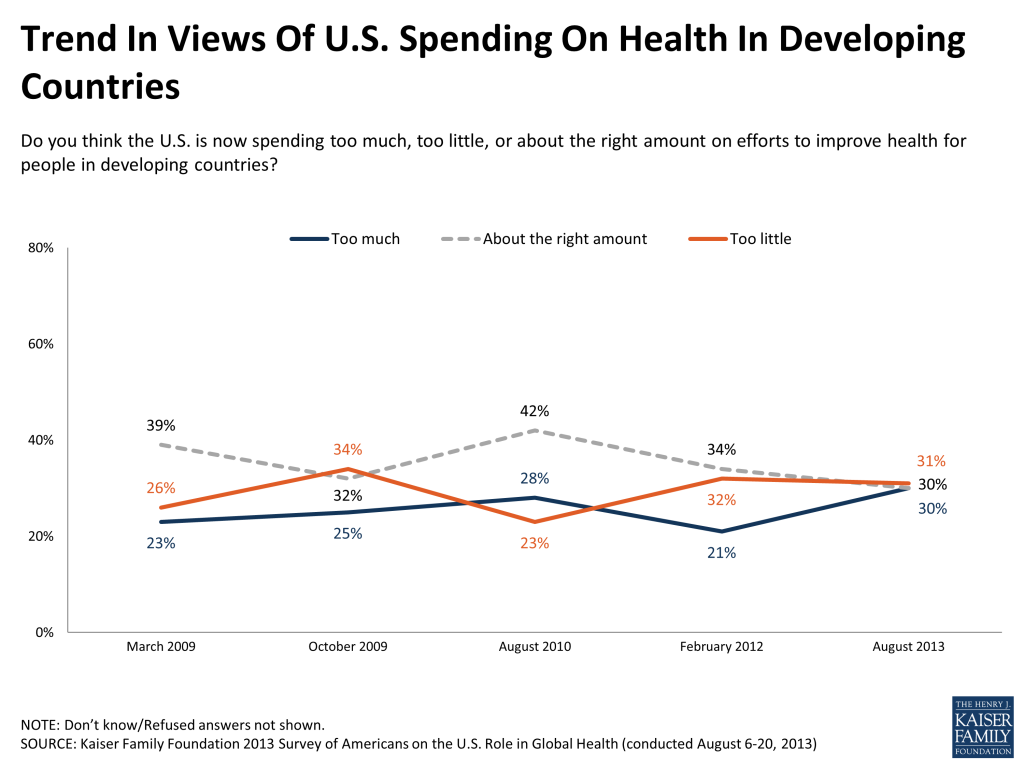
Kaiser surveys have consistently found that Americans are more likely to support U.S. spending for global health specifically than they are when asked about foreign aid more generally. In the current survey, about six in ten say the U.S. is now spending too little (31 percent) or about the right amount (30 percent) on efforts to improve health for people in developing countries, while three in ten say the country is spending too much.
Attitudes towards the amount of U.S. spending on health in developing countries have held relatively steady in recent years over the course of the country’s economic recovery and battles over the federal budget and deficit. The share who say the U.S. is spending “too much” on these efforts is somewhat higher in 2013 than it was in 2012, but is close to the level measured in 2010.
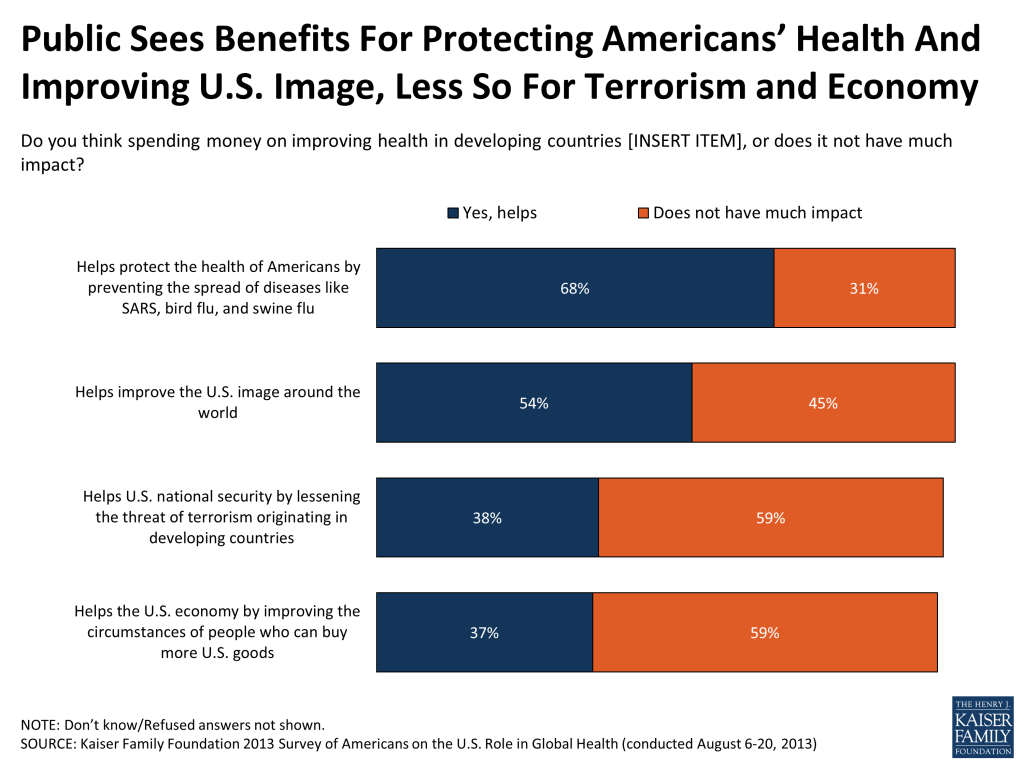
Nearly seven in ten believe that U.S. spending on health in developing countries helps protect the health of Americans by preventing the spread of diseases, and over half believe such spending is helpful for improving the U.S. image around the world. The public is somewhat less convinced that U.S. global health spending helps U.S. national security or the U.S. economy, with close to four in ten saying it is helpful in these areas and about six in ten saying it doesn’t have much impact.
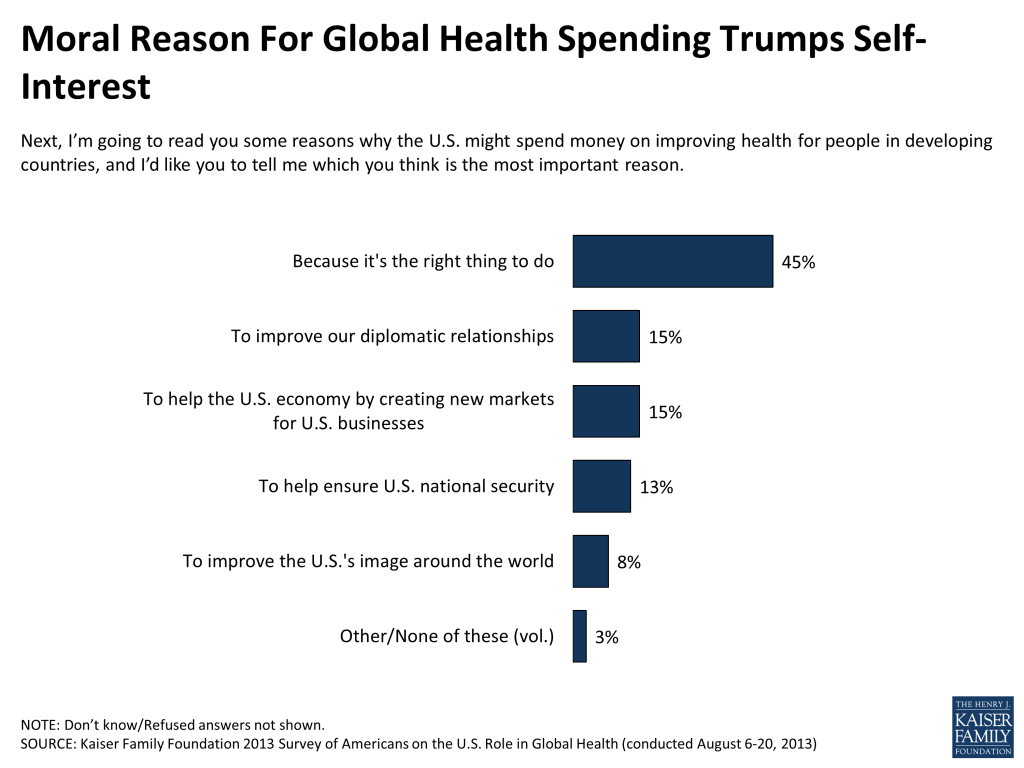
While many recognize these potential benefits at home, the moral argument ranks higher than self-interest arguments among the public in terms of reasons for giving aid. Nearly half say the most important reason for the U.S. to spend money on improving health in developing countries is “because it’s the right thing to do,” while far fewer choose reasons related to U.S. diplomacy, economy, or security.
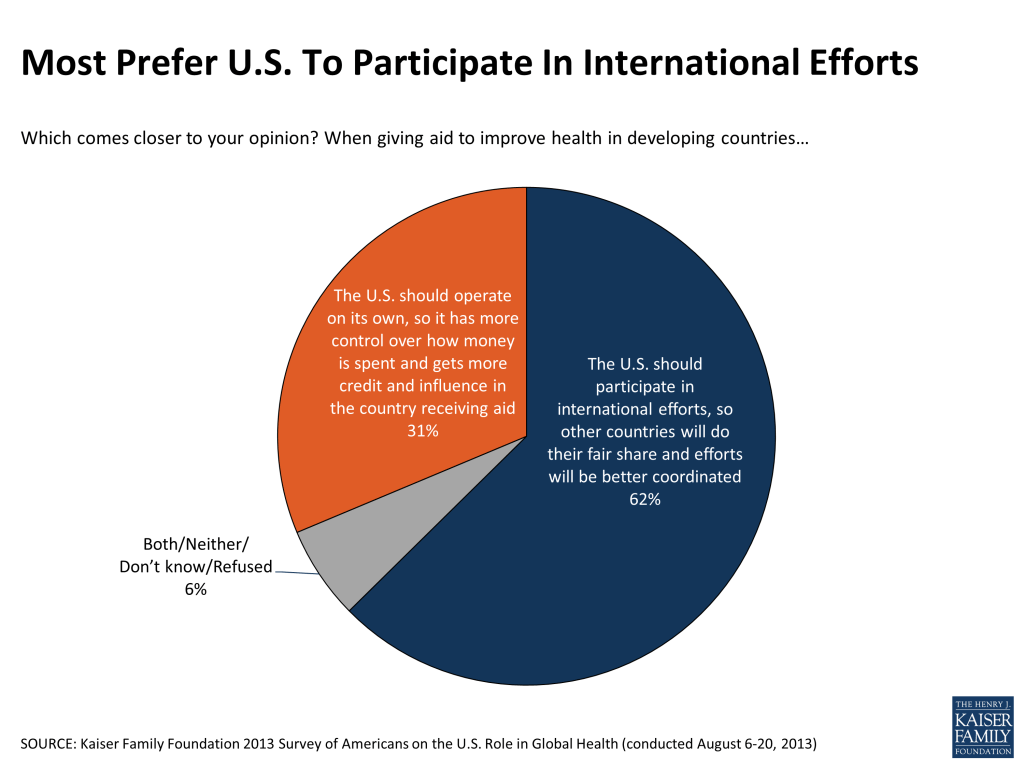
When it comes to how the U.S. should go about providing aid to improve health in developing countries, over six in ten say the country should participate in international efforts, so other countries will do their fair share and efforts will be better coordinated. About half as many (31 percent) feel that it’s better for the U.S. to operate on its own, so we have more control over how money is spent and get more credit and influence in the countries receiving aid. This desire to participate in international efforts may be related to the fact that half of Americans believe the U.S. is already contributing more than its fair share to global health efforts compared to other wealthier countries, while just 13 percent think the U.S. is doing less than its fair share and three in ten say the U.S. share is about right.
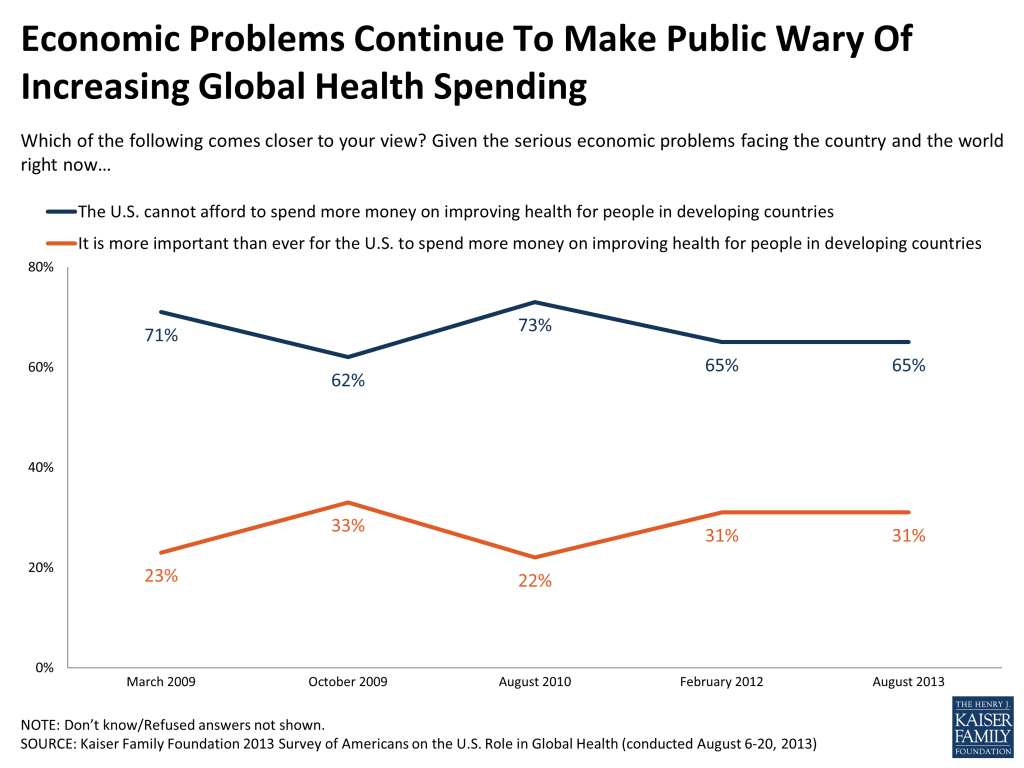
While six in ten Americans say that the current level of U.S. spending to improve health in developing countries is either too low or about right, economic concerns continue to make the public wary of the idea of increasing spending abroad. Since 2009, a solid majority of the public has said that given the serious economic problems facing the country and the world, the U.S. can’t afford to spend more money on health in developing countries, while a much smaller share have said the current economic conditions make it more important than ever for the U.S. to increase such spending.
Another important caveat to support for current levels of spending is that the public is much more likely to back reductions in spending on overseas aid in order to reduce the deficit than they are to support cuts in domestic programs like Medicare, Social Security, and public education. Nearly half say they would support major reductions to spending on foreign aid as a way to reduce the federal budget deficit, and another third would support minor reductions. While fewer say they would support major reductions in “spending to address health issues like HIV/AIDS, tuberculosis and malaria in developing countries” versus the generic “foreign aid,” still over six in ten support major or minor reductions. By contrast, more than half say they would support no reductions to spending on public education, Social Security, Medicare, or Medicaid in order to reduce the deficit.
Since 2009, the public has also been divided as to whether more spending from the U.S. and other wealthier countries will lead to meaningful progress in improving health in developing countries or won’t make much difference. In 2013, 44 percent believe spending will lead to progress, while just over half say it won’t make much difference.
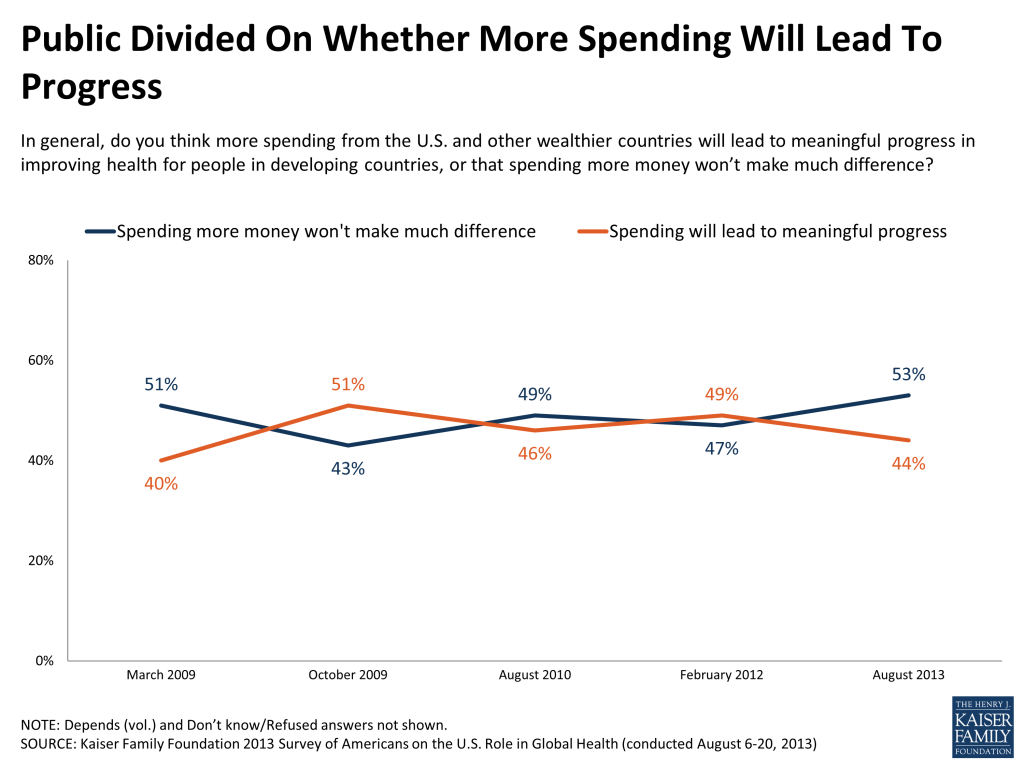
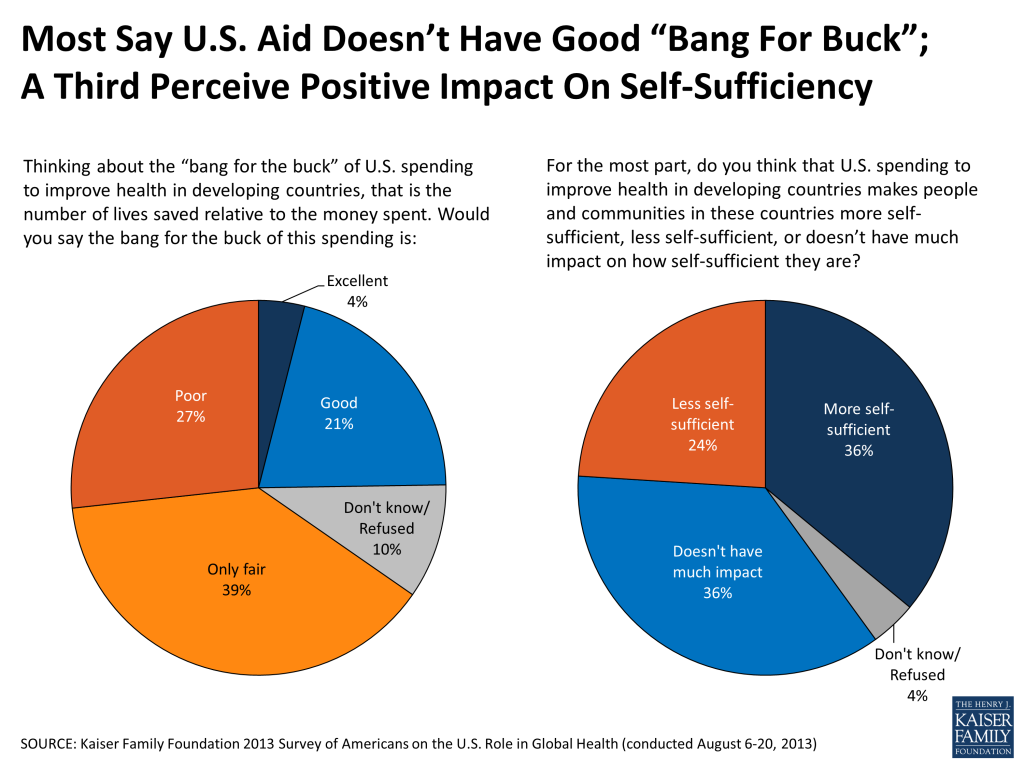
Skepticism about whether spending will lead to progress may be related to the fact that most Americans don’t believe U.S. spending on health in developing countries delivers a good return on investment, and only about a third think it improves self-sufficiency.
Two-thirds of the public rates the “bang for the buck” of U.S. spending on health in developing countries as “only fair” or “poor,”, while just a quarter say it is “good” or “excellent.” And while just over a third of the public believes such spending helps make people and communities more self-sufficient, an equal share believes this type of aid doesn’t have much impact on self-sufficiency, and roughly a quarter say it decreases self-sufficiency.
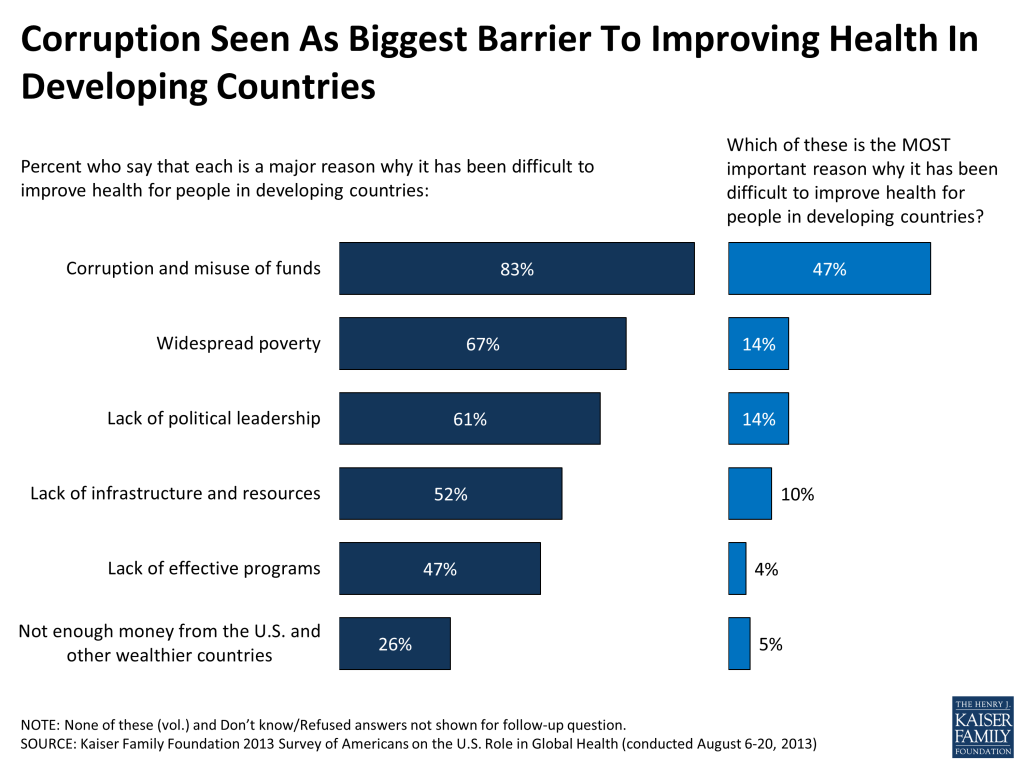
Another finding that has been consistent in Kaiser surveys: The public sees corruption as the biggest barrier to progress on global health. In the latest survey, 83 percent say corruption and misuse of funds is a “major reason” why it has been difficult to improve health for people in developing countries, and nearly half say it is the most important reason. Perhaps because of this concern about corruption, two-thirds of the public (66 percent) think the U.S. should have the primary role in determining how U.S. aid is spent in developing countries to ensure tax dollars are well spent, while just about a quarter (27 percent) say it’s better for the developing country governments to make decisions about how aid is spent since they know their country’s problems best.
As is the case when it comes to most questions involving federal spending, attitudes towards U.S. spending on efforts to improve health in developing countries differ somewhat by individual political party identification. However, these partisan differences are much smaller than we find on questions of domestic health care policy and spending. For example, Republicans are 15 percentage points more likely than Democrats to say the U.S. currently spends too much on health in developing countries, but still over half of Democrats, Republicans, and independents say such spending is either too little or about right.
| FIGURE 17: VIEWS OF CURRENT LEVELS OF U.S. GLOBAL HEALTH SPENDING BY PARTY ID | ||||
| Total | Democrats | Independents | Republicans | |
| Do you think the U.S. is now spending too much, too little, or about the right amount on efforts to improve health for people in developing countries? | ||||
| Too much | 30% | 24% | 30% | 39% |
| About right | 30 | 29 | 31 | 32 |
| Too little | 31 | 40 | 30 | 20 |
| TOTAL TOO LITTLE OR ABOUT RIGHT | 61 | 69 | 61 | 52 |
Some underlying partisan differences in perceptions of the impact of U.S. spending on health in developing countries may help explain the small but measurable differences in support for spending. For example, while a majority of Democrats believe that more spending from the U.S. and other wealthier countries will lead to meaningful progress in improving health, two-thirds of Republicans feel that more spending won’t make much difference. Democrats are also more likely than Republicans to believe that U.S. aid helps people and communities in developing countries to become more self-sufficient, while Republicans are more likely to perceive a negative impact on self-sufficiency. Republicans and independents are more likely to believe U.S. spending on health in developing countries delivers a “poor” bang for the buck, though even among Democrats, relatively few see such spending as offering a good return on investment.
| FIGURE 18: VIEWS OF IMPACTS OF U.S. GLOBAL HEALTH SPENDING BY PARTY ID | ||||
| Total | Democrats | Independents | Republicans | |
| In general, do you think more spending from the U.S. and other wealthier countries will lead to meaningful progress in improving health for people in developing countries, or that spending more money won’t make much difference? | ||||
| Will lead to meaningful progress | 44% | 55% | 45% | 31% |
| Won’t make much difference | 53 | 42 | 53 | 67 |
| For the most part, do you think that U.S. spending to improve health in developing countries makes people and communities in these countries more self-sufficient, makes them less self-sufficient, or doesn’t have much impact on how self-sufficient they are? | ||||
| More self-sufficient | 36 | 44 | 36 | 30 |
| Less self-sufficient | 24 | 20 | 25 | 29 |
| Doesn’t have much impact on self-sufficiency | 36 | 33 | 36 | 39 |
| Next, thinking about the “bang for the buck” of U.S. spending to improve health in developing countries, that is the number of lives saved relative to the money spent. Would you say the bang for the buck of this spending is…? | ||||
| Excellent | 4 | 6 | 3 | 2 |
| Good | 21 | 23 | 24 | 16 |
| Only fair | 39 | 42 | 37 | 41 |
| Poor | 27 | 20 | 28 | 33 |
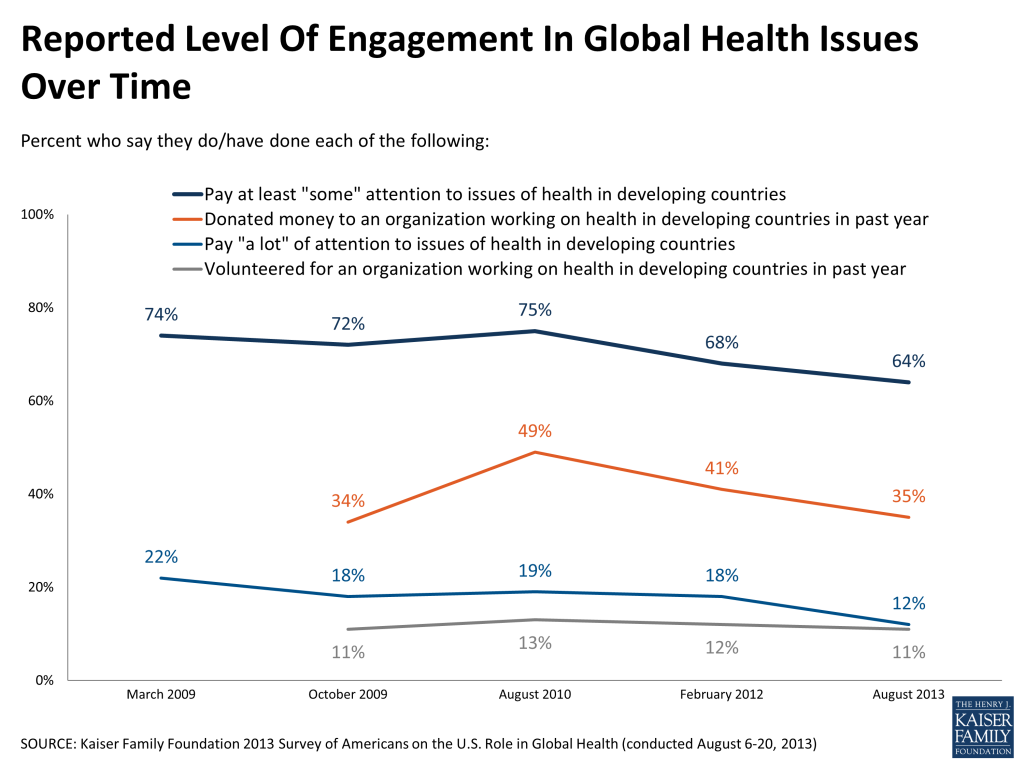
The public reports engaging in global health issues on various levels, but there is some indication that the level of visibility and attention has declined somewhat in recent years. In 2013, close to two-thirds of the public say they pay at least “some” attention to issues of health in developing countries, but just 12 percent say they pay “a lot” of attention. Each of these shares is down 10 percentage points from March 2009. About a third of the public reports having donated to an organization working on global health issues in the past year, down from a high of 49 percent in August 2010 (the year of the Haiti earthquake), and similar to the level measured in 2009. Eleven percent say they have volunteered for an organization working on health in developing countries in the past year, a share that has held steady since 2009.
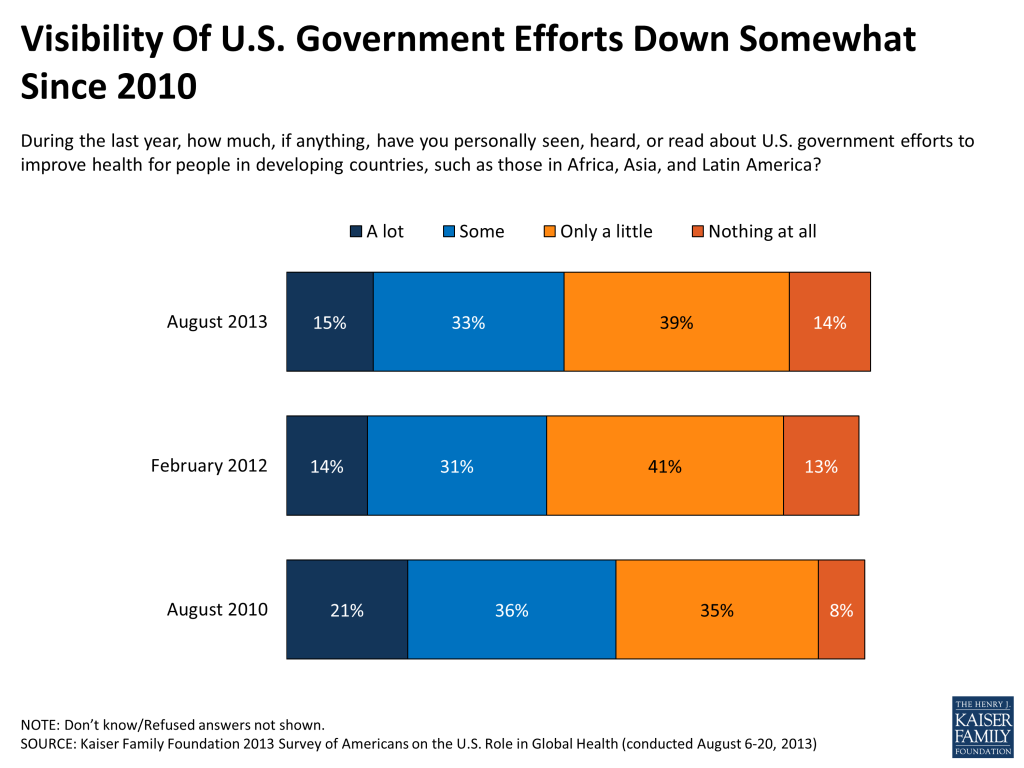
Over half of the public reports hearing “only a little” or “nothing at all” about U.S. government efforts to improve health in developing countries over the past year, while a third say they’ve heard “some” and just 15 percent say they’ve heard “a lot.” Visibility of U.S. government efforts in this area are similar to 2012, but still somewhat lower than 2010, when more than half said they had heard “a lot” or “some” about these efforts.
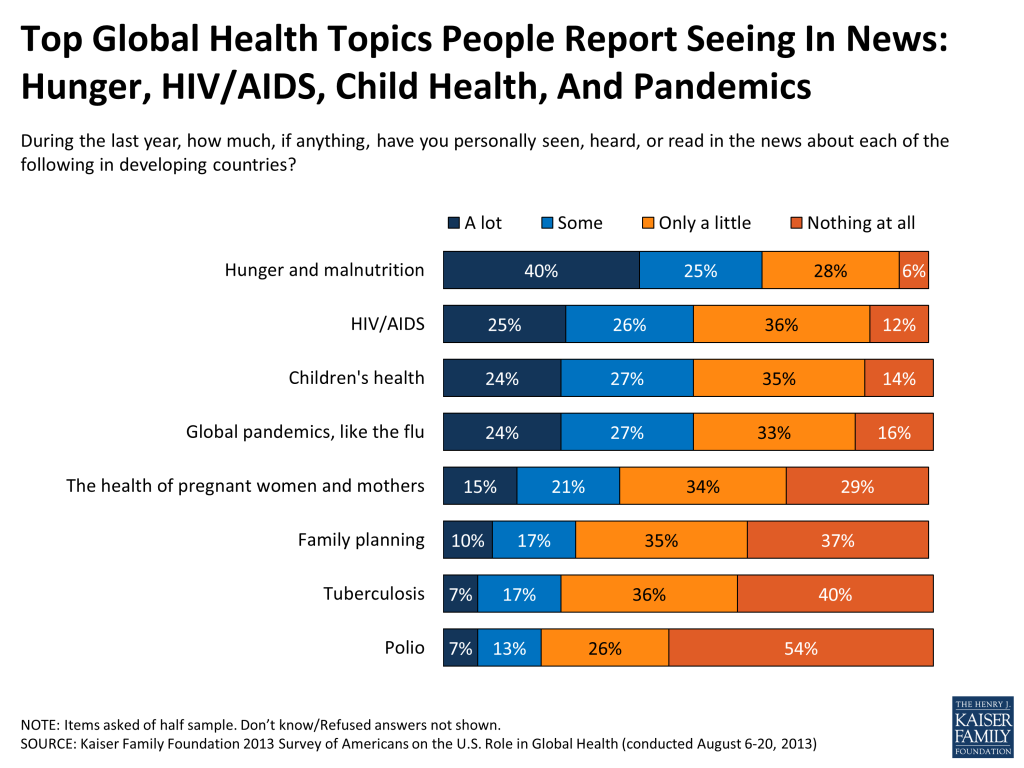
U.S. government efforts, there is variation in how much the public reports hearing in the news about specific global health issues and problems. Most prominently, nearly two-thirds say they have heard “a lot” or “some” in the past year about hunger and malnutrition in developing countries. Just over half report hearing news about HIV/AIDS, children’s health, and global pandemics like the flu, while somewhat fewer report hearing something about maternal health. Less visible issues include family planning, tuberculosis, and polio.
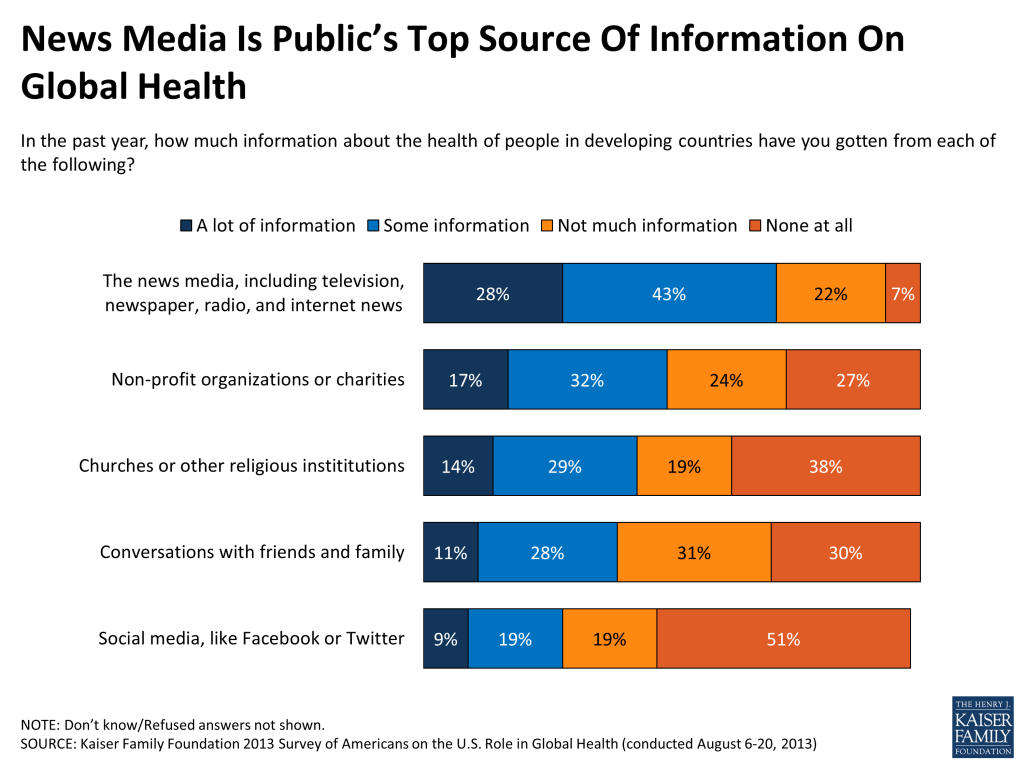
As it is on many topics, the news media remains the public’s top source of information on global health, with seven in ten saying they have gotten “a lot” or “some” information about the health of people in developing countries from news media sources in the past year. Behind the media as sources of information are non-profit organizations, churches and other religious institutions, and conversations with friends and family. Social media ranks at the bottom of the list as a source of information, with just 28 percent saying they’ve gotten “a lot” or “some” information about health in developing countries from sites like Facebook or Twitter in the past year. Young adults are somewhat more likely than others to report getting information about global health from social media (47 percent of those ages 18-29 say they’ve gotten at least “some” in the past year), but news media is still the top source, far outranking social media for Americans of all ages.
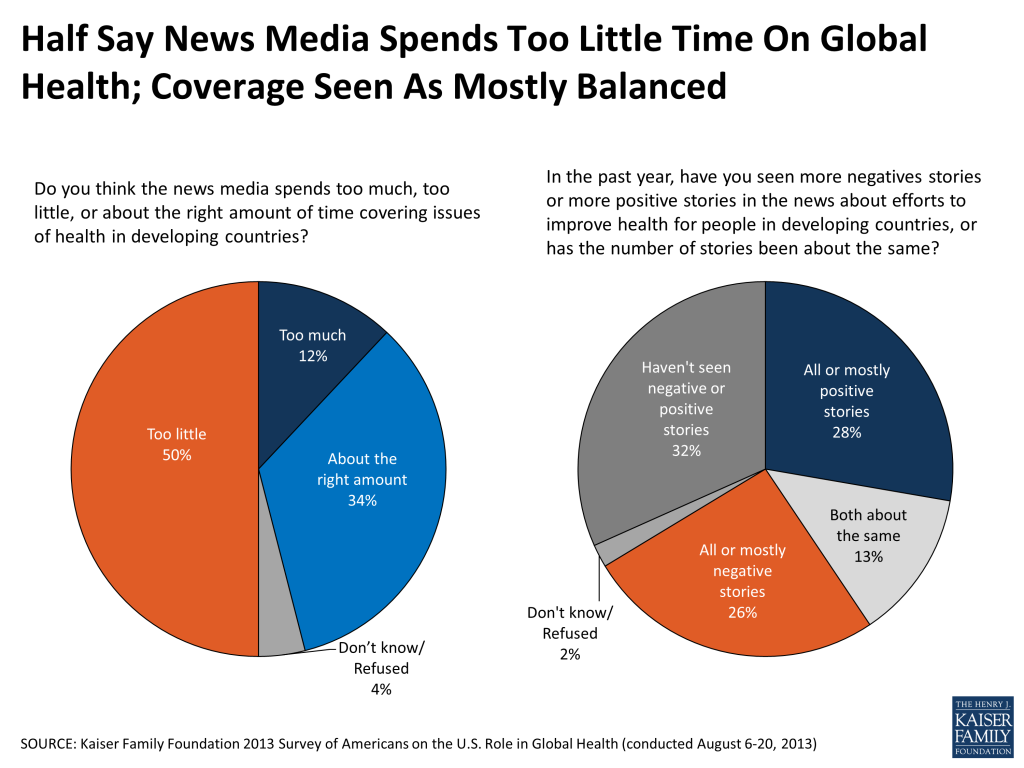
With the news media as their top source of information on issues of health in developing countries, many Americans say they would like to hear more from this source. Fully half say the news media spends too little time covering global health issues, while just 12 percent say the news media spends too much time on the topic and a third say the amount of coverage is about right. When it comes to the content of that coverage, Americans report hearing a fairly even mix of positive and negative stories. Overall, 28 percent say they’ve heard only or mostly positive news stories about global health in the past year (such as stories about successful programs), and a similar share – 26 percent – say they’ve heard only or mostly negative stories (such as those about corruption).
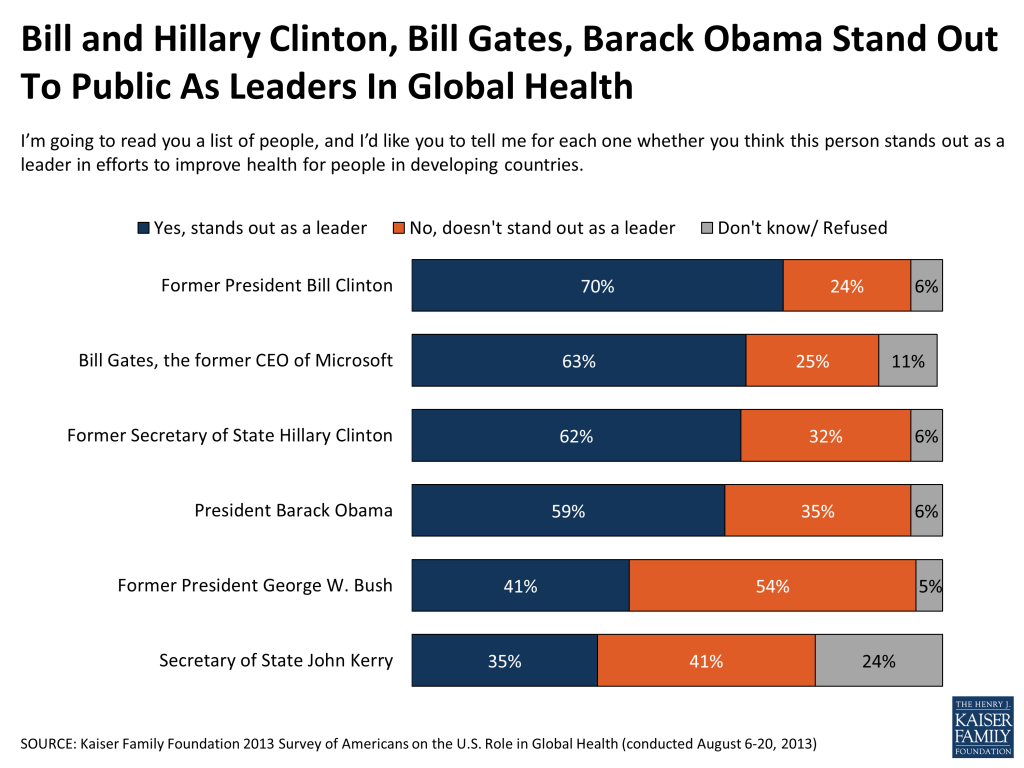
When asked about various people who might be perceived as leaders in efforts to improve health for people in developing countries, Bill Clinton tops the list, with 70 percent saying the former president stands out as a leader in this area. He is followed closely by philanthropist and former Microsoft CEO Bill Gates, former Secretary of State Hillary Clinton, and President Barack Obama. Fewer see former president George W. Bush or current Secretary of State John Kerry as leaders in global health.
The Kaiser Family Foundation 2013 Survey of Americans on the U.S. Role in Global Health was designed and analyzed by public opinion researchers at the Foundation led by Mollyann Brodie, Ph.D., including Liz Hamel and Becky Hanna. The survey was conducted August 6-20, 2013, among a nationally representative random digit dial telephone sample of 1,507 adults ages 18 and older, living in the United States, including Alaska and Hawaii (note: persons without a telephone could not be included in the random selection process). Computer-assisted telephone interviews conducted by landline (752) and cell phone (755, including 427 who had no landline telephone) were carried out in English and Spanish by Braun Research under the direction of Princeton Survey Research Associates International (PSRAI). Both the random digit dial landline and cell phone samples were provided by Survey Sampling International, LLC. For the landline sample, respondents were selected by asking for the youngest adult male or female currently at home based on a random rotation. If no one of that gender was available, interviewers asked to speak with the youngest adult of the opposite gender. For the cell phone sample, interviews were conducted with the person who answered the phone. The survey fieldwork was funded through a grant from the Bill & Melinda Gates Foundation.
The combined landline and cell phone sample was weighted to balance the sample demographics to match estimates for the national population using data from the Census Bureau’s 2011 American Community Survey (ACS) on sex, age, education, race, Hispanic origin, nativity (for Hispanics only), and region along with data from the 2010 Census on population density. The sample was also weighted to match current patterns of telephone use using data from the July-December 2012 National Health Interview Survey. The weight takes into account the fact that respondents with both a landline and cell phone have a higher probability of selection in the combined sample and also adjusts for the household size for the landline sample. All statistical tests of significance account for the effect of weighting.
The margin of sampling error including the design effect for the full sample is plus or minus 3 percentage points. For results based on subgroups, the margin of sampling error may be higher. Sample sizes and margin of sampling errors for other subgroups are available by request. Note that sampling error is only one of many potential sources of error in this or any other public opinion poll.
One additional question (the deficit question labeled O1 and listed on page 18 of the survey topline) was asked on the PSRAI omnibus survey. Different research clients purchase space on the omnibus survey and therefore additional questions covering a wide variety of topics may have preceded or followed this question. The Kaiser Global Health Omnibus Supplement was conducted August 22-25, 2013, among a nationally representative random digit dial telephone sample of 1,001 adults ages 18 and older, living in the continental United States (note: persons without a telephone could not be included in the random selection process). Computer-assisted telephone interviews conducted by landline (501) and cell phone (500, including 253 who had no landline telephone) were carried out in English by MKTG under the direction of PSRAI.
The combined landline and cell phone sample was weighted to balance the sample demographics to match estimates for the national population using data from the Census Bureau’s 2011 American Community Survey (ACS) on sex, age, education, race, Hispanic origin, and region along with data from the 2010 Census on population density. The sample was also weighted to match current patterns of telephone use using data from the July-December 2012 National Health Interview Survey.
The margin of sampling error including the design effect for the full sample on the omnibus supplement is plus or minus 4 percentage points. Full methodological details, including weighted and unweighted values for key demographic variables and response rates are available upon request.
This fact sheet provides state-by-state data on the uninsured rate, as well as rates of private insurance coverage and Medicaid coverage, among women nationally, in the 50 states and the District of Columbia.
| Health Insurance Coverage of Women Ages 18 to 64, by State, 2011-2012 | |||||
| Estimated Number of Women (Thousands) | ESI/Other Public* | Individual | Medicaid | Uninsured | |
| Percent Distribution | |||||
| United States | 98,283 | 61% | 7% | 12% | 19% |
| Alabama | 1,534 | 65% | – | 11% | 18% |
| Alaska | 221 | 64% | 5% | 10% | 22% |
| Arizona | 2,010 | 58% | 5% | 16% | 21% |
| Arkansas | 897 | 56% | 7% | 11% | 26% |
| California | 12,058 | 55% | 8% | 15% | 23% |
| Colorado | 1,607 | 62% | 10% | 10% | 18% |
| Connecticut | 1,143 | 70% | 7% | 13% | 10% |
| Delaware | 289 | 66% | 5% | 17% | 12% |
| District of Columbia | 229 | 59% | 9% | 23% | 9% |
| Florida | 5,987 | 58% | 7% | 9% | 27% |
| Georgia | 3,186 | 60% | 6% | 8% | 26% |
| Hawaii | 415 | 71% | 5% | 14% | 10% |
| Idaho | 461 | 61% | 8% | 8% | 23% |
| Illinois | 4,012 | 64% | 7% | 13% | 17% |
| Indiana | 2,012 | 65% | 4% | 14% | 18% |
| Iowa | 944 | 65% | 10% | 13% | 12% |
| Kansas | 852 | 67% | 8% | 9% | 16% |
| Kentucky | 1,385 | 63% | 6% | 12% | 20% |
| Louisiana | 1,417 | 56% | 5% | 12% | 27% |
| Maine | 434 | 62% | 6% | 20% | 12% |
| Maryland | 1,928 | 69% | 6% | 9% | 16% |
| Massachusetts | 2,142 | 68% | 6% | 22% | 4% |
| Michigan | 3,073 | 64% | 7% | 15% | 15% |
| Minnesota | 1,653 | 70% | 7% | 13% | 10% |
| Mississippi | 904 | 59% | 5% | 15% | 20% |
| Missouri | 1,849 | 64% | 8% | 11% | 17% |
| Montana | 299 | 57% | 10% | 8% | 25% |
| Nebraska | 562 | 66% | 11% | 8% | 15% |
| Nevada | 846 | 59% | 6% | 7% | 28% |
| New Hampshire | 425 | 74% | 6% | 5% | 14% |
| New Jersey | 2,773 | 66% | 5% | 10% | 18% |
| New Mexico | 633 | 53% | 5% | 14% | 27% |
| New York | 6,294 | 60% | 6% | 20% | 14% |
| North Carolina | 3,023 | 61% | 6% | 11% | 22% |
| North Dakota | 216 | 70% | 12% | 7% | 11% |
| Ohio | 3,540 | 64% | 7% | 13% | 16% |
| Oklahoma | 1,147 | 62% | 6% | 10% | 22% |
| Oregon | 1,240 | 59% | 10% | 12% | 19% |
| Pennsylvania | 4,078 | 66% | 8% | 13% | 13% |
| Rhode Island | 337 | 62% | 7% | 16% | 15% |
| South Carolina | 1,513 | 62% | 5% | 12% | 20% |
| South Dakota | 246 | 63% | 12% | 9% | 17% |
| Tennessee | 2,029 | 61% | 7% | 15% | 17% |
| Texas | 8,095 | 57% | 5% | 8% | 30% |
| Utah | 826 | 66% | 8% | 7% | 18% |
| Vermont | 201 | 61% | 7% | 23% | 9% |
| Virginia | 2,587 | 70% | 7% | 7% | 17% |
| Washington | 2,189 | 65% | 6% | 11% | 18% |
| West Virginia | 594 | 62% | 3% | – | 20% |
| Wisconsin | 1,774 | 64% | 9% | 16% | 11% |
| Wyoming | 176 | 62% | 8% | 9% | 21% |
| * ESI/Other Public category includes: employer-based coverage and other public insurance, such as Medicare and military-related coverage. – Sample size too small.SOURCE: State-level figures based on Urban Institute and Kaiser Family Foundation estimates of pooled 2012 and 2013 Current Population Surveys. U.S. Total figures based on 2013 Survey. | |||||
| Health Insurance Coverage of Low-income Women Ages 18 to 64, by State, 2011-2012 | ||||||
| Estimated Number of Women (Thousands) | % of Women Who are Low-Income | ESI/Other Public* | Individual | Medicaid | Uninsured | |
Percent Distribution | ||||||
| United States | 36,740 | 37% | 29% | 8% | 27% | 36% |
| Alabama | 636 | 41% | 36% | – | 23% | 33% |
| Alaska | 85 | 38% | 37% | – | 22% | 35% |
| Arizona | 811 | 40% | 26% | – | 32% | 37% |
| Arkansas | 412 | 46% | 29% | – | 21% | 43% |
| California | 5,013 | 42% | 24% | 8% | 29% | 38% |
| Colorado | 496 | 31% | 27% | 14% | 24% | 35% |
| Connecticut | 327 | 29% | 35% | 9% | 34% | 22% |
| Delaware | 106 | 37% | 35% | – | 38% | 23% |
| District of Columbia | 79 | 35% | 19% | 12% | 54% | 15% |
| Florida | 2,295 | 38% | 29% | 7% | 18% | 46% |
| Georgia | 1,306 | 41% | 32% | 8% | 16% | 45% |
| Hawaii | 181 | 44% | 49% | 6% | 28% | 17% |
| Idaho | 188 | 41% | 31% | – | 18% | 42% |
| Illinois | 1,421 | 35% | 31% | 8% | 29% | 32% |
| Indiana | 798 | 40% | 32% | – | 31% | 31% |
| Iowa | 296 | 31% | 29% | 12% | 32% | 26% |
| Kansas | 281 | 33% | 33% | 10% | 22% | 35% |
| Kentucky | 571 | 41% | 31% | – | 24% | 37% |
| Louisiana | 641 | 45% | 28% | – | 23% | 44% |
| Maine | 143 | 33% | 25% | 7% | 46% | 22% |
| Maryland | 528 | 27% | 33% | 8% | 25% | 35% |
| Massachusetts | 675 | 32% | 34% | – | 51% | 7% |
| Michigan | 1,104 | 36% | 31% | 10% | 32% | 27% |
| Minnesota | 435 | 26% | 26% | 12% | 38% | 24% |
| Mississippi | 415 | 46% | 31% | – | 29% | 34% |
| Missouri | 667 | 36% | 31% | – | 26% | 35% |
| Montana | 117 | 39% | 29% | 11% | 17% | 43% |
| Nebraska | 169 | 30% | 36% | 12% | 19% | 32% |
| Nevada | 353 | 42% | 33% | – | 14% | 47% |
| New Hampshire | 99 | 23% | 39% | – | 17% | 34% |
| New Jersey | 873 | 31% | 29% | – | 25% | 38% |
| New Mexico | 283 | 45% | 25% | – | 25% | 45% |
| New York | 2,439 | 39% | 29% | 8% | 40% | 24% |
| North Carolina | 1,161 | 38% | 30% | – | 24% | 38% |
| North Dakota | 58 | 27% | 31% | 19% | 23% | 27% |
| Ohio | 1,339 | 38% | 31% | 10% | 29% | 30% |
| Oklahoma | 439 | 38% | 33% | – | 22% | 39% |
| Oregon | 447 | 36% | 24% | – | 25% | 37% |
| Pennsylvania | 1,394 | 34% | 30% | 12% | 33% | 25% |
| Rhode Island | 121 | 36% | 26% | – | 35% | 30% |
| South Carolina | 610 | 40% | 34% | – | 25% | 35% |
| South Dakota | 83 | 34% | 31% | 13% | 21% | 34% |
| Tennessee | 821 | 40% | 30% | – | 31% | 30% |
| Texas | 3,361 | 42% | 27% | 5% | 17% | 52% |
| Utah | 287 | 35% | 39% | – | 17% | 32% |
| Vermont | 59 | 29% | 24% | – | 49% | 17% |
| Virginia | 777 | 30% | 35% | 11% | 17% | 36% |
| Washington | 731 | 33% | 30% | 7% | 25% | 37% |
| West Virginia | 227 | 38% | 30% | – | 31% | 35% |
| Wisconsin | 528 | 30% | 26% | – | 41% | 23% |
| Wyoming | 58 | 33% | 28% | 12% | 23% | 37% |
| * ESI/Other Public category includes: employer-based coverage and other public insurance, such as Medicare and military-related coverage. – Sample size too small.Note: Low income is defined as incomes less than 200% of the poverty threshold, which equaled $38,180 for a family of three in 2012.SOURCE: State-level figures based on Urban Institute and Kaiser Family Foundation estimates of pooled 2012 and 2013 Current Population Surveys. U.S. Total figures based on 2013 Survey. | ||||||
Key provisions of the 2010 Affordable Care Act (ACA) create new Marketplaces for people who purchase insurance directly and provide new premium tax credits to help people with low or moderate incomes afford that coverage. We estimate that about 17 million people who are now uninsured or who buy insurance on their own (“nongroup purchasers”) will be eligible for premium tax credits in 2014. This issue brief provides national and state estimates for tax credit eligibility for people in these groups. We also estimate that about 29 million people nationally could look to new Marketplaces as a place to purchase coverage.
A key focus of the ACA is to reduce the number of uninsured by expanding the number of people who buy nongroup coverage. It does this by removing existing barriers that keep people with health problems from obtaining coverage, and by providing financial assistance through premium tax credits for low and moderate income people who purchase coverage through new state Marketplaces operated by states or the federal government. The Congressional Budget Office estimates that by 2018 around 20 million people covered in marketplaces will receive premium tax credits to assist them with their premium costs.1
Under the law, people with incomes between 100 percent and 400 percent of the federal poverty level may be eligible for premium tax credits when they purchase coverage in a Marketplace. People who are eligible for other types of public or private coverage, for example Medicaid or coverage through an employer-provided plan, generally cannot claim a premium tax credit. These tax credits also are not available to people who are not lawfully present in the country or who are incarcerated. Legally residing immigrants who recently arrived in the country are eligible for premium tax credits despite being ineligible for Medicaid; they may qualify if their income does not exceed 400 percent of the federal poverty level.2
The amount of tax credit that a person receives depends on their family income and the cost of health insurance where they live. The law establishes a maximum percentage of income that people within the 100 to 400 percent of poverty income range must pay for a benchmark plan where they live. The percentages range from 2% of income for people with income at the federal poverty line to 9.5% of income for people with incomes at four times federal poverty. If the premium that a person or family faces for the benchmark plan in their area is higher than the maximum percent of income defined in the law for their income, they are eligible for a tax credit and the tax credit is equal to the difference between the premium for the benchmark plan and the defined percent of their income. The benchmark plan is the second-lowest-cost plan in the silver cost-sharing tier offered through the marketplace for the area where they live.3 Additional explanations and examples are available by using the Kaiser Premium Subsidy Calculator.
People who are eligible for a premium tax credit can apply it to reduce the premium for any plan (other than catastrophic plans) offered in the marketplace. Their cost will be the actual premium for the plan that they enroll in minus the value of the premium tax credit they receive. One thing to note is that because marketplace premiums vary by age in most states, people with the same income but different ages will qualify for different premium tax credit amounts. In some cases, the premium for a benchmark plan for people at younger ages will be less than the defined percentage of income specified in the law; in this case the person would not receive a premium tax credit and would have to pay the full premium for any plan that they choose. However, they would still be able to purchase coverage, and their cost as a share of income will match the cost for others with comparable incomes. Premiums also vary by geographic area, which means that premium tax credits may differ for otherwise similar people if they live in different places.
We used data from the 2012 and 2013 Current Population Survey (CPS) Annual Social and Economic Supplement (ASEC) to estimate the number of people eligible for premium tax credits for marketplace coverage. The ASEC provides detailed information on family composition, income and insurance status for national and state samples of residents. We use that information to determine whether each individual would be eligible to purchase coverage through a marketplace and whether they would be eligible to receive a premium tax credit.
The analysis starts with a pool of people who have no insurance or who purchase nongroup insurance. People who are covered by a public program or by employer-based coverage are assumed to retain that coverage and would not be eligible for premium tax credits. Two other groups of people were then removed from this potential pool of tax-credit eligible individuals: uninsured adults and children whose incomes would make them eligible for Medicaid or CHIP and people who are not legally residing in the United States. Neither group is eligible for premium tax credits under the ACA. For those remaining in the pool, we looked at their family incomes under ACA rules and the premiums that they would face for benchmark coverage to determine whether they would qualify for a premium tax credit. The vast majority of potential eligibles with incomes between 100 percent and 400 percent of poverty would qualify for a tax credits; those who do not qualify in this income range are younger people who face a premium that is lower than the defined percent of income under the law. As a final step, we removed approximately 16 percent of potential eligibles because research shows that some people who are uninsured or have nongroup coverage have access to employer-based coverage, either through an offer from their own employer or through an offer through a spouse or parent. Those that remain in the potential pool constitute our estimate of tax-credit eligible individuals. A more complete description of this data and our methods is provided in the methods section below.
We estimate that over 17 million people nationally will be eligible for tax credits in 2014. The national and state totals are shown in Table 1. Three states (Texas, California, and Florida) each have more than 1 million tax-credit-eligible residents, and another seven states have more than 500,000 tax-credit-eligible residents. At the lower end, seven states have fewer than 50,000 tax-credit-eligible residents, with the District of Columbia (9,500) and Vermont (27,000) having the fewest. The five states with the most tax-credit-eligible individuals account for about 40 percent of all such individuals nationally.
People eligible for premium tax credits are likely to look to new marketplaces when they want coverage because tax credits are only available to marketplace enrollees. Others looking to purchase coverage on their own also might want to purchase in new marketplaces, although nongroup policies will be available outside of marketplaces as well. Generally, nongroup policies written inside and outside of marketplaces will provide the same benefits, have the same cost-sharing tiers, and be subject to the same market rules.
We estimate the potential market for coverage in marketplaces by starting with current nongroup purchasers and uninsured people who are legally residing in the United States and who are not eligible for Medicaid or CHIP. We then excluded two groups from among the current uninsured. The first group is people with incomes above Medicaid eligibility levels but below poverty, referred to as the gap group. Because they are not eligible for financial assistance, few will have the means to afford nongroup coverage. We also excluded current uninsured people who are in a household of a full-time worker who either has or is offered employer-based insurance. As noted above, these people would be ineligible for premium tax credits, so we assume that they would choose employer-based coverage rather than nongroup coverage if they choose to become insured.4
This calculation leaves about 29 million people nationally who might look to the new marketplaces. The largest potential markets are in the states with the largest tax-credit eligible population: California, Texas, and Florida. Six states have a potential market of more than 1 million people, and another 12 have a potential market of more than 500,000 people.
The Congressional Budget Office (CBO) projects that 7 million people will enroll in health insurance exchanges in 2014, including 6 million who will be receiving tax credits to subsidize their premiums. Based on our analysis above, these enrollment levels would mean that 25% of potential exchange enrollees would choose to participate in year one of the ACA, with a slightly higher proportion of people eligible for tax credits (35%) buying coverage in an exchange.
From the perspective of delivering assistance to people eligible for it, enrollment in exchanges is a key measure, since tax credits are only available to those who buy coverage on their own in an exchange. It often takes time for enrollment in a new program to ramp up, and consistent with this view, CBO projects the number of people receiving tax credits in exchanges to triple by 2016.
The take-up of tax credits may vary significantly across states, for a variety of reasons. In the early stages of open enrollment, it’s clear that the enrollment process is working more smoothly in some state-based exchanges than in others, and the difficulties with the federal marketplace have been widely reported. In addition, significantly greater outreach and consumer assistance resources are available in state-based exchanges due to the availability of federal grants under the ACA and limited budget for implementation of the federal marketplace. Our estimates of the number of people eligible for tax credits by state can serve as a barometer for tracking the success of enrollment efforts.
The overall enrollment in Marketplace coverage is likely to be a metric that is watched closely. While it is not, in fact, the most relevant measure for assessing the stability of the individual insurance market, it may provide some signals as to the health of the market and where premiums may be heading in 2015.
More important than how many enroll is who enrolls – Are they disproportionately younger and healthier or older and sicker? And, it is the composition of the entire individual market that is important, not just who enrolls in exchanges. That is because insurers are required to set premiums for individual insurance market coverage across all plans they offer, inside and outside of exchanges. Also, the risk adjustment system – which will redistribute money from plans that serve disproportionately healthy enrollees to those that enroll a disproportionately sick population – applies to plans inside and outside exchanges as well.
However, the likelihood of getting a balanced mix of enrollees in the individual market is related to the total number of new signups. It is expected that people who have a pre-existing condition and have been excluded from the individual insurance market previously will likely be among the early entrants. In addition, many people in state-based high risk pools will likely switch over to the individual market as well. Therefore, low enrollment levels may indicate a disproportionately sick risk pool, while higher enrollment levels may suggest a more balanced pool. And, it is likely that many new entrants to the individual market will enter through Marketplaces, so the number and composition of Marketplace enrollment may be suggestive of how the market is doing overall. Because insurance pools operate at the state level, the composition of enrollment state-by-state will be what drives the stability of insurance markets. Enrolling a large number of young and healthy people in California, for example, would not offset low take-up in Texas.
The analysis uses pooled data from the 2012 and 2013 Current Population Survey (CPS) Annual Social and Economic Supplement (ASEC). The CPS ASEC provides socioeconomic and demographic information that can be used for national and state estimates.
Estimating eligibility for Medicaid, CHIP and premium tax credits for marketplace coverage requires grouping individuals together in different ways to determine their income under the different program rules. Our approach is described here. We analyzed people without coverage or with nongroup coverage to determine their potential eligibility for premium-tax-credits and as potential marketplace participants. The first step was to remove adults and children with incomes below Medicaid and CHIP eligibility levels in their state.5 We also removed people who are not legal residents from the pool of potential eligibles. The ASEC does not ask about legal status of non-citizens, so we imputed documentation status as described here. Programming code to create the households and to perform the immigration status imputation is available upon request.
Premium tax credits. We analyzed the sample of remaining uninsured and nongroup people to determine eligibility for premium tax credits based on the income for their tax household and the premiums in the state where they lived. More than 40 percent of the unweighted records in the 2012-2013 CPS have a county identified — so a second lowest silver plan premium for that county was directly merged on to these records. Other records were assigned a premium based on the within-state average premium for all undisclosed counties, weighted by the Census Bureau’s 2010 Small Area Health Insurance Estimates (SAHIE) of the uninsured population of those counties. Premiums were adjusted for age based on the age-rating curve in each state. We assumed that all eligible members of a tax household would enroll in nongroup coverage and calculated their premium as a percent of household income. This premium percentage was compared to the maximum percentages in the ACA that families in the tax credit range (100 to 400 percent of poverty) must pay toward the cost of the second-lowest cost silver plan where they live. People in families with incomes between 100 and 400 percent of poverty and whose household premium exceeded the maximum ACA percentage were identified as potentially tax credit eligible, subject to one additional adjustment described below.
As a final step, we reduced the number of people eligible for premium tax credits to reflect offers of employer-sponsored coverage. Under the law, people offered employer-sponsored coverage that meets minimum standards are not eligible to receive premium tax credits, even if they purchase nongroup coverage in a marketplace. The ASEC does not ask whether respondents were offered coverage at work, so we derived offer rates using data from Wave 6 of the 2008 Survey of Income and Program Participation (SIPP). Wave 6 asks respondents if they were offered health insurance at their main job. We assume that people who live with a spouse or parent that has coverage or an offer of coverage through a job also was offered coverage. We calculated offer rates for people without insurance and with nongroup insurance, stratified by age and income. We applied these percentages to the ASEC sample to reduce each state’s count of uninsured and current nongroup individuals potentially eligible for premium tax credits.
Potential Market. As with our estimates for tax-credit eligibles, the estimate for the number of people who might look for coverage in Marketplaces starts with people legally residing in the United States who are uninsured or have nongroup coverage and have incomes above Medicaid and CHIP eligibility levels. We retain all remaining nongroup purchasers, even those with low incomes, as potential Marketplace purchasers because they are purchasing nongroup coverage now. Among the current uninsured, we excluded two groups from potential purchasers. The first group is people with access to employer-based coverage. As discussed above, we assume that these people would choose coverage through a job rather than nongroup coverage if they want to get insurance. We used information from Wave 6 in SIPP, as described above, to remove them from the number of potential marketplace purchasers. Excluding currently uninsured people with access to employer-sponsored insurance reduces the number of potential purchasers by a little over five million people. The second group we excluded was uninsured people with incomes below poverty, referred to as the gap group. These uninsured adults live in states that elected not to adopt the ACA Medicaid expansion, and are not eligible for financial assistance to help them get coverage in exchanges. We assume that few would have sufficient resources to purchase nongroup coverage. Excluding this gap group reduces the number of potential purchasers by about 4.8 million people.
The issue brief was prepared by Gary Claxton, Larry Levitt, Anthony Damico, Rachel Garfield, Nirmita Panchal, Cynthia Cox and Matthew Rae.
| TABLE 1 | ||
| Estimated Number of Tax-Credit-Eligible Individuals and Potential Market for Marketplace Coverage, By State | ||
| Number of Tax Credit Eligible Residents | Potential Market Size | |
| National | 17,187,000 | 28,605,000 |
| Alabama | 270,000 | 464,000 |
| Alaska | 55,000 | 78,000 |
| Arizona | 313,000 | 551,000 |
| Arkansas | 150,000 | 227,000 |
| California | 1,903,000 | 3,291,000 |
| Colorado | 254,000 | 501,000 |
| Connecticut | 109,000 | 216,000 |
| Delaware | 29,000 | 48,000 |
| District of Columbia | 9,000 | 36,000 |
| Florida | 1,587,000 | 2,545,000 |
| Georgia | 654,000 | 1,063,000 |
| Hawaii | 29,000 | 58,000 |
| Idaho | 130,000 | 202,000 |
| Illinois | 501,000 | 937,000 |
| Indiana | 354,000 | 525,000 |
| Iowa | 127,000 | 262,000 |
| Kansas | 161,000 | 298,000 |
| Kentucky | 192,000 | 302,000 |
| Louisiana | 344,000 | 489,000 |
| Maine | 77,000 | 122,000 |
| Maryland | 201,000 | 419,000 |
| Massachusetts | 118,000 | 259,000 |
| Michigan | 436,000 | 725,000 |
| Minnesota | 90,000 | 298,000 |
| Mississippi | 204,000 | 298,000 |
| Missouri | 386,000 | 657,000 |
| Montana | 97,000 | 152,000 |
| Nebraska | 122,000 | 239,000 |
| Nevada | 155,000 | 249,000 |
| New Hampshire | 81,000 | 137,000 |
| New Jersey | 400,000 | 628,000 |
| New Mexico | 118,000 | 193,000 |
| New York | 779,000 | 1,264,000 |
| North Carolina | 684,000 | 1,073,000 |
| North Dakota | 43,000 | 77,000 |
| Ohio | 544,000 | 812,000 |
| Oklahoma | 256,000 | 446,000 |
| Oregon | 187,000 | 337,000 |
| Pennsylvania | 715,000 | 1,276,000 |
| Rhode Island | 40,000 | 70,000 |
| South Carolina | 336,000 | 491,000 |
| South Dakota | 70,000 | 118,000 |
| Tennessee | 387,000 | 645,000 |
| Texas | 2,049,000 | 3,143,000 |
| Utah | 206,000 | 331,000 |
| Vermont | 27,000 | 45,000 |
| Virginia | 518,000 | 823,000 |
| Washington | 272,000 | 507,000 |
| West Virginia | 71,000 | 117,000 |
| Wisconsin | 301,000 | 482,000 |
| Wyoming | 47,000 | 80,000 |
Source: KFF analysis of March 2012 and 2013 CPS. See Methods for more details.
MENLO PARK, Calif., Nov. 4, 2013—The Kaiser Family Foundation has produced a new consumer web portal to help people living with HIV navigate the Affordable Care Act (ACA). Specifically designed to address the needs of people with HIV, the Obamacare & You portal, funded by Gilead Sciences, Inc., is presented as part of Greater Than AIDS, a leading national public information initiative developed by the Kaiser Family Foundation together with the Black AIDS Institute.
It is estimated that about one in four people with HIV in care in the U.S. are currently uninsured and many more are underinsured. People with HIV could be among those who make the greatest gains in coverage from the ACA, and the portal was developed to help navigate the new healthcare environment.
Features of the Greater Than AIDS Obamacare and You portal include:
“Our new Obamacare & You web portal for people with HIV is part of a growing body of resources the Foundation is developing to help Americans understand the ACA and their choices under the law,” said Kaiser Family Foundation President & CEO Drew Altman. “It is especially important that people with HIV understand how potential changes in health insurance will affect their coverage status and access to care and medications that are vitally important to their health and continuing prevention efforts.”
Among the aspects of the ACA that have particular relevance for people with HIV seeking coverage in the private insurance market are reforms that preclude insurance companies from using pre-existing conditions as a cause for denying coverage. The removal of spending limits—both annual and lifetime—also have bearing given the high cost of ongoing HIV care. In addition, since HIV rates are disproportionately higher among those with lower incomes, it is also expected that many people living with HIV will seek coverage in expanded Medicaid programs in those states that opt to do so.
The Obamacare & You consumer web portal is part of the Foundation’s ongoing effort to help consumers understand the ACA and their choices under the law. The content is the sole product and responsibility of the Kaiser Family Foundation. Gilead Sciences, Inc. provided funding for its development. More of the Foundation’s consumer resources on the ACA can be found on www.kff.org/aca-consumer-resources/.
The Foundation also produces fact sheets and analyses on the topic of HIV/AIDS, including materials on how the ACA affects people living with HIV. This information is available at www.kff.org/hivaids/.
More information on Greater Than AIDS is available at www.greaterthan.org.
About the Kaiser Family Foundation
The Kaiser Family Foundation, a leader in health policy analysis, health journalism and communication, is dedicated to filling the need for trusted, independent information on the major health issues facing our nation and its people. The Foundation is a non-profit private operating foundation, based in Menlo Park, California.
About Greater Than AIDS
Greater Than AIDS is a leading national public information response focused on the U.S. domestic epidemic. Launched in 2009, it is supported by a broad coalition of public and private sector partners, including: major media and other business leaders; Federal, state and local health agencies and departments; national leadership groups; AIDS service and other community organizations; and foundations, among others.
Through targeted media messages and community outreach, Greater Than AIDS works to increase knowledge, reduce stigma and promote actions to stem the spread of the disease. While national in scope, Greater Than AIDS focuses on communities most affected.
The Kaiser Family Foundation (provides strategic direction and day-to-day management, as well as oversees the production of the campaigns. The Black AIDS Institute – a think tank exclusively focused on AIDS in Black America – provides leadership and expert guidance and supports community engagement. Additional financial and substantive support is provided by the Elton John AIDS Foundation, Ford Foundation and MAC AIDS, among others.
About Gilead Sciences, Inc.
Gilead Sciences, Inc. is a biopharmaceutical company that discovers, develops and commercializes innovative therapeutics in areas of unmet medical need. The company’s mission is to advance the care of patients suffering from life-threatening diseases worldwide. Headquartered in Foster City, California, Gilead has operations in North and South America, Europe and Asia Pacific.