KFF designs, conducts and analyzes original public opinion and survey research on Americans’ attitudes, knowledge, and experiences with the health care system to help amplify the public’s voice in major national debates.
The 2010 Affordable Care Act (ACA) has the potential to extend coverage to many of the 47 million nonelderly uninsured people nationwide, including the 756,000 uninsured Marylanders. The ACA establishes coverage provisions across the income spectrum, with the expansion of Medicaid eligibility for adults serving as the vehicle for covering low-income individuals and premium tax credits to help people purchase insurance directly through new Health Insurance Marketplaces serving as the vehicle for covering people with moderate incomes. The June 2012 Supreme Court ruling made the Medicaid expansion optional for states, and as of December 2013, Maryland was planning to implement the expansion in 2014. As a result, the ACA will be fully implemented in Maryland, and almost all nonelderly uninsured, most of whom are adults, are eligible for coverage expansions. As the ACA coverage expansions are implemented and coverage changes are assessed, it is important to understand the potential scope of the law in the state.
How Does the ACA Expand Health Insurance Coverage in Maryland?
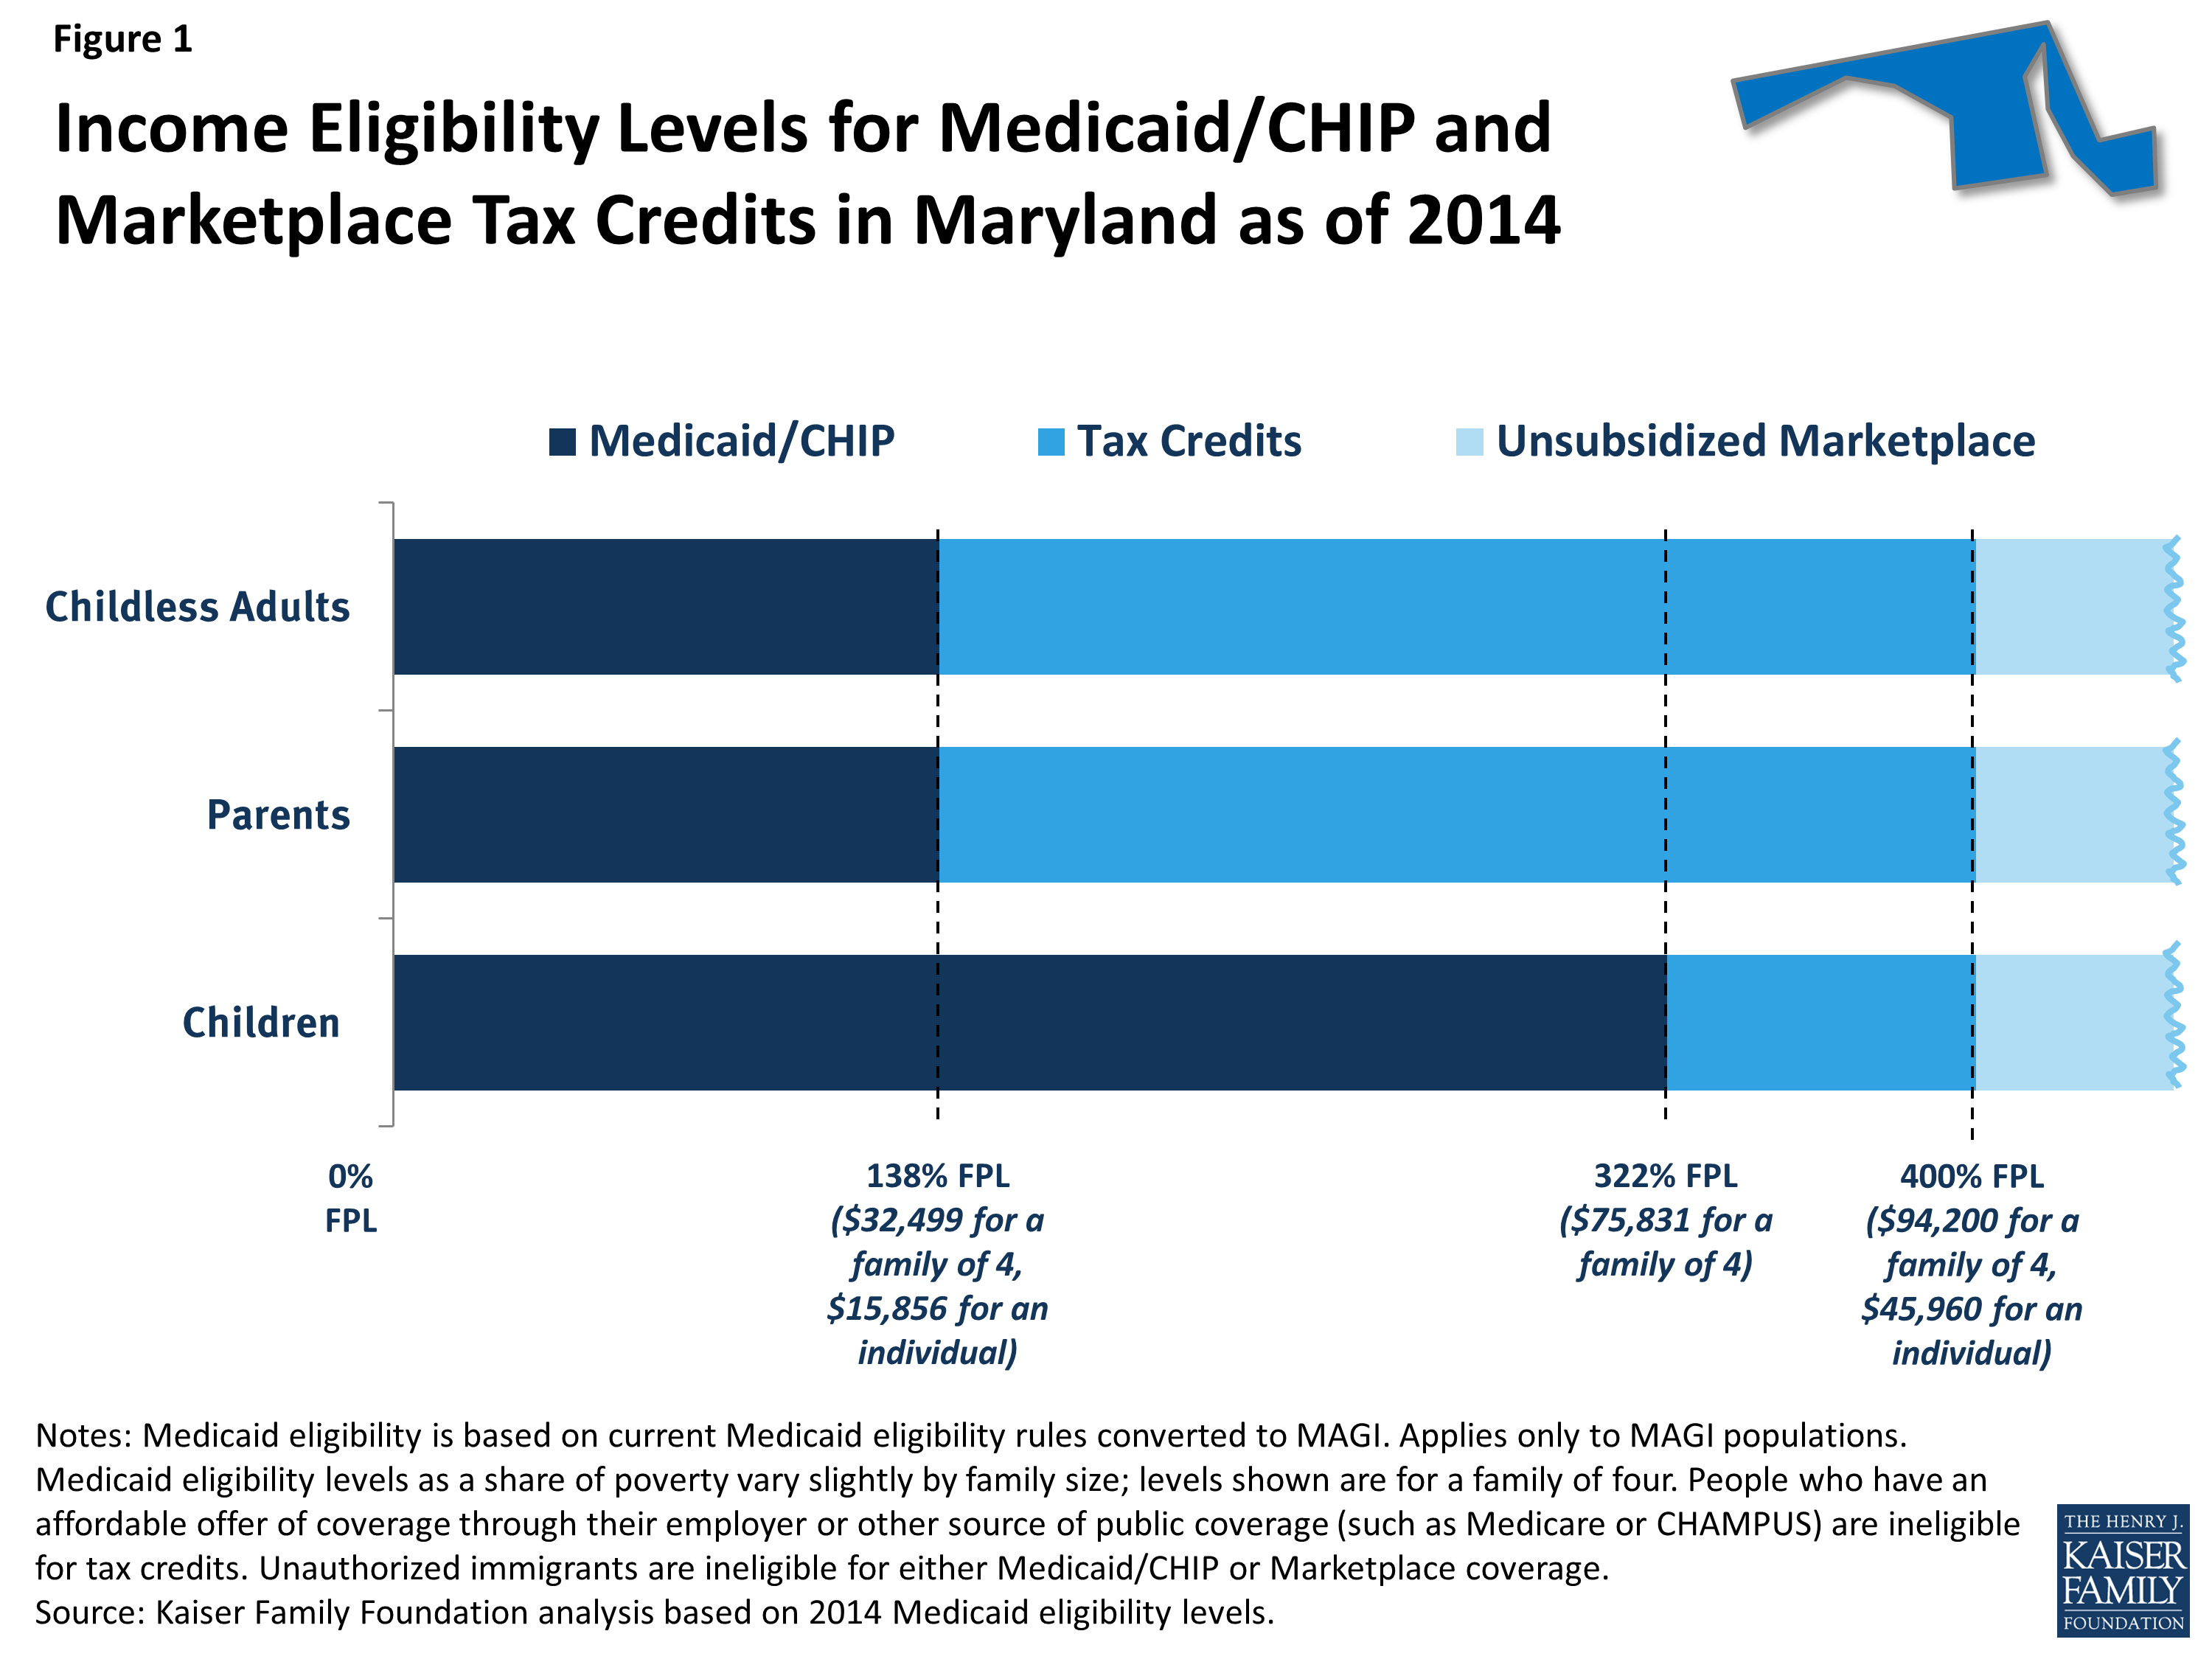
Historically, Medicaid had gaps in coverage for adults because eligibility was restricted to specific categories of low-income individuals, such as children, their parents, pregnant women, the elderly, or individuals with disabilities. In most states, adults without dependent children were ineligible for Medicaid, regardless of their income, and income limits for parents were very low—often below half the poverty level.1 The ACA aimed to fill in these gaps by extending Medicaid to nearly all nonelderly adults with incomes at or below 138% of poverty (about $32,500 for a family of four in 2013). Thus, as of January 2014, Medicaid eligibility in Maryland covers almost all nonelderly adults up to 138% of poverty, as shown by the dark blue shading in Figure 1. All states previously expanded eligibility for children to higher levels than adults through Medicaid and the Children’s Health Insurance Program (CHIP), and in Maryland, children with family incomes up to 322% of poverty (about $75,800 for a family of four) are eligible for Medicaid or CHIP. As was the case before the ACA, undocumented immigrants remain ineligible to enroll in Medicaid, and recent lawfully residing immigrants are subject to certain Medicaid eligibility restrictions.2
Under the ACA, people with incomes between 100% and 400% of poverty may be eligible for premium tax credits when they purchase coverage in a Marketplace. The amount of the tax credit is based on income and the cost of insurance, and tax credits are only available to people who are not eligible for other coverage, such as Medicaid/CHIP, Medicare, or employer coverage, and who are citizens or lawfully-present immigrants. Thus, the effective lower income limit for tax credits in Maryland is 322% of poverty for children and 138% of poverty for adults, as indicated by the bright blue shading in Figure 1. Citizens and lawfully-present immigrants with incomes above 400% of poverty can purchase unsubsidized coverage through the Marketplace.
How Many Uninsured Marylanders Are Eligible for Assistance Under the ACA?
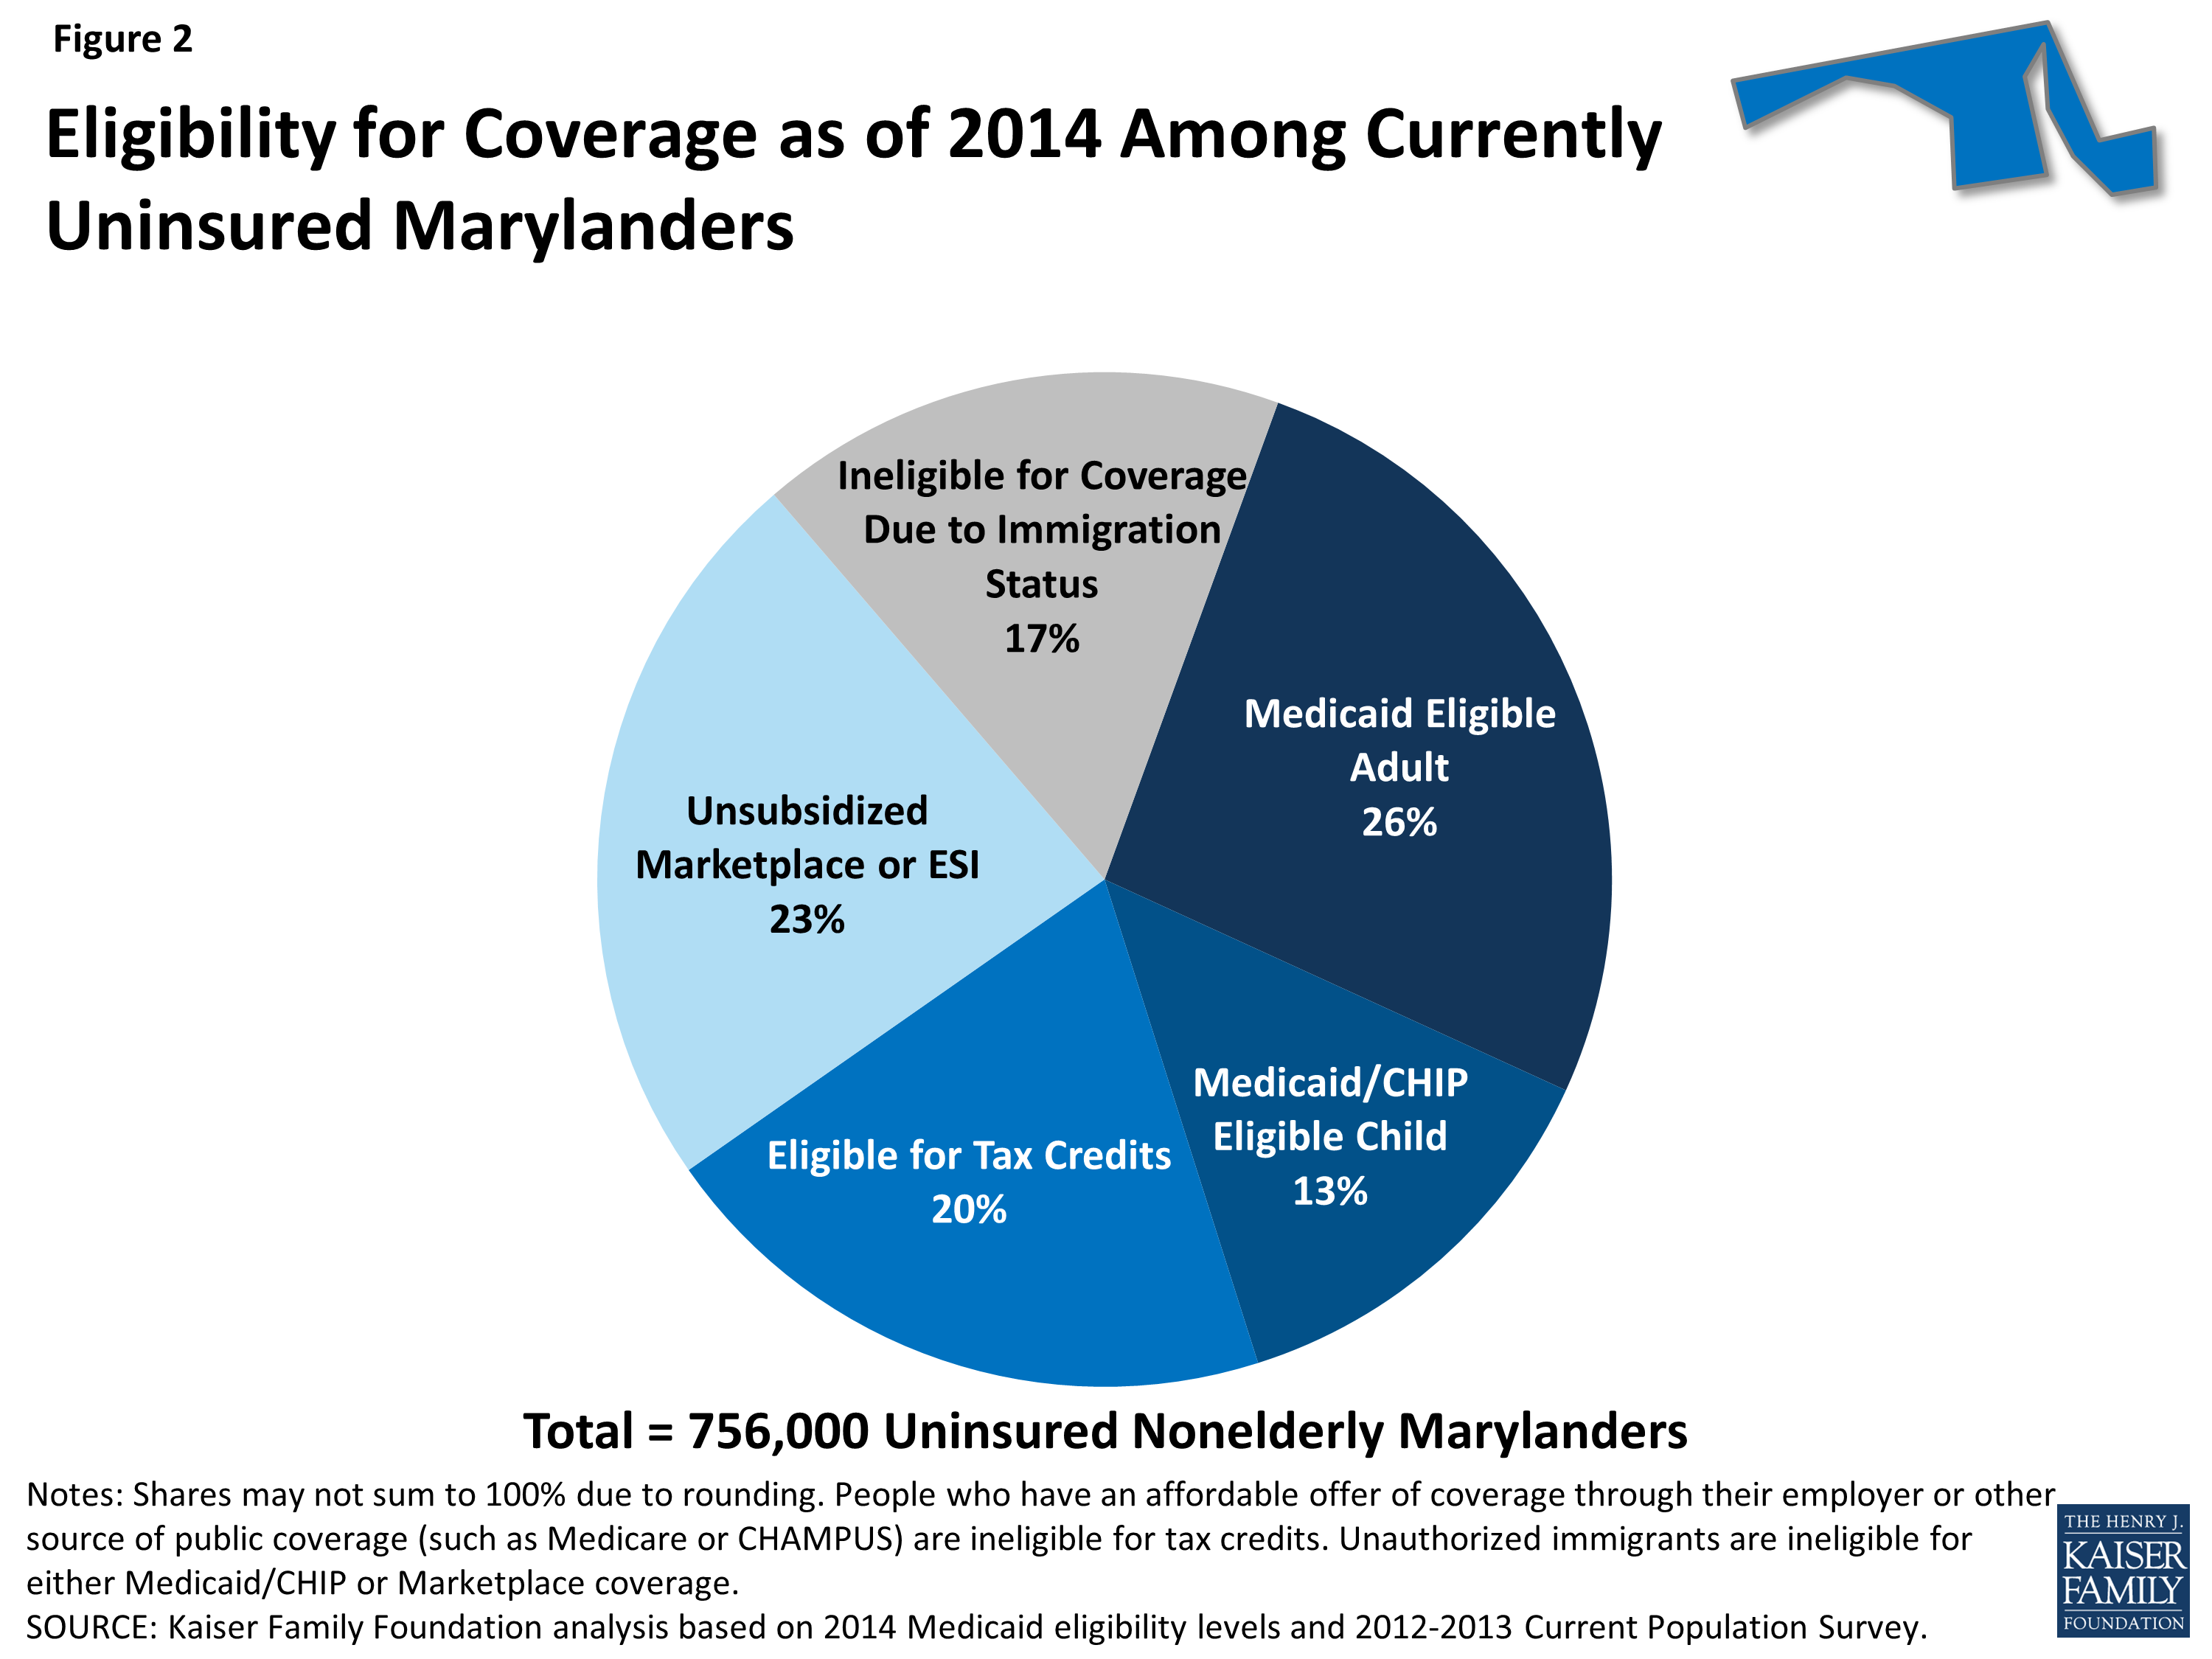
With Maryland deciding to implement the Medicaid expansion, nearly six in ten (59%) uninsured nonelderly people in the state are eligible for financial assistance to gain coverage through either Medicaid or the Marketplaces (Figure 2). Given the income distribution of the uninsured in the state, the main pathway for coverage is Medicaid, with four in ten (40%) uninsured Marylanders eligible for either Medicaid or CHIP as of 2014. While some of these people (such as eligible children) are eligible under pathways in place before the ACA, most adults are newly-eligible through the ACA expansion. One in five (20%) uninsured people in Maryland are eligible for premium tax credits to help them purchase coverage in the Marketplace.
Other uninsured Marylanders may gain coverage under the ACA but will not receive direct financial assistance. These people include the 23 percent with incomes above the limit for premium tax subsidies or who have an affordable offer of coverage through their employer. Some of these people are still be able to purchase unsubsidized coverage in the Marketplace, which may be more affordable or more comprehensive than coverage they could obtain on their own through the individual market. Lastly, the approximately 17 percent of uninsured people in Maryland who are undocumented immigrants are ineligible for financial assistance under the ACA and barred from purchasing coverage through the Marketplaces. This group is likely to remain uninsured, though they will still have a need for health care services.
***
The ACA will help many currently uninsured Marylanders gain health coverage by providing coverage options across the income spectrum for low and moderate-income people. While almost all of the uninsured in Maryland are eligible for some type of coverage under the ACA, the impact of the ACA will depend on take-up of coverage among the eligible uninsured, and outreach and enrollment efforts will be an important factor in decreasing the uninsured rate. The ACA includes a requirement that most individuals obtain health coverage, but some people (such as the lowest income or those without an affordable option) are exempt and others may still remain uninsured. There is no deadline for enrolling in Medicaid coverage under the ACA, and open enrollment in the Marketplaces continues through March 2014. Continued attention to who gains coverage as the ACA is fully implemented and who is excluded from its reach—as well as whether and how their health needs are being met—can help inform decisions about the future of health coverage in Maryland.
The 2010 Affordable Care Act (ACA) has the potential to extend coverage to many of the 47 million nonelderly uninsured people nationwide, including the 1 million uninsured Virginians. The ACA establishes coverage provisions across the income spectrum, with the expansion of Medicaid eligibility for adults serving as the vehicle for covering low-income individuals and premium tax credits to help people purchase insurance directly through new Health Insurance Marketplaces serving as the vehicle for covering people with moderate incomes. With the June 2012 Supreme Court ruling, the Medicaid expansion became optional for states, and as of December 2013, Virginia was not planning to implement the expansion. As a result, many uninsured adults in Virginia who would have been newly-eligible for Medicaid will remain without a coverage option. As the ACA coverage expansions are implemented and coverage changes are assessed, it is important to understand the potential scope of the law in the state.
How Does the ACA Expand Health Insurance Coverage in Virginia?
Historically, Medicaid had gaps in coverage for adults because eligibility was restricted to specific categories of low-income individuals, such as children, their parents, pregnant women, the elderly, or individuals with disabilities. In most states, adults without dependent children were ineligible for Medicaid, regardless of their income, and income limits for parents were very low—often below half the poverty level.1 The ACA aimed to fill in these gaps by extending Medicaid to nearly all nonelderly adults with incomes at or below 138% of poverty (about $32,500 for a family of four in 2013).
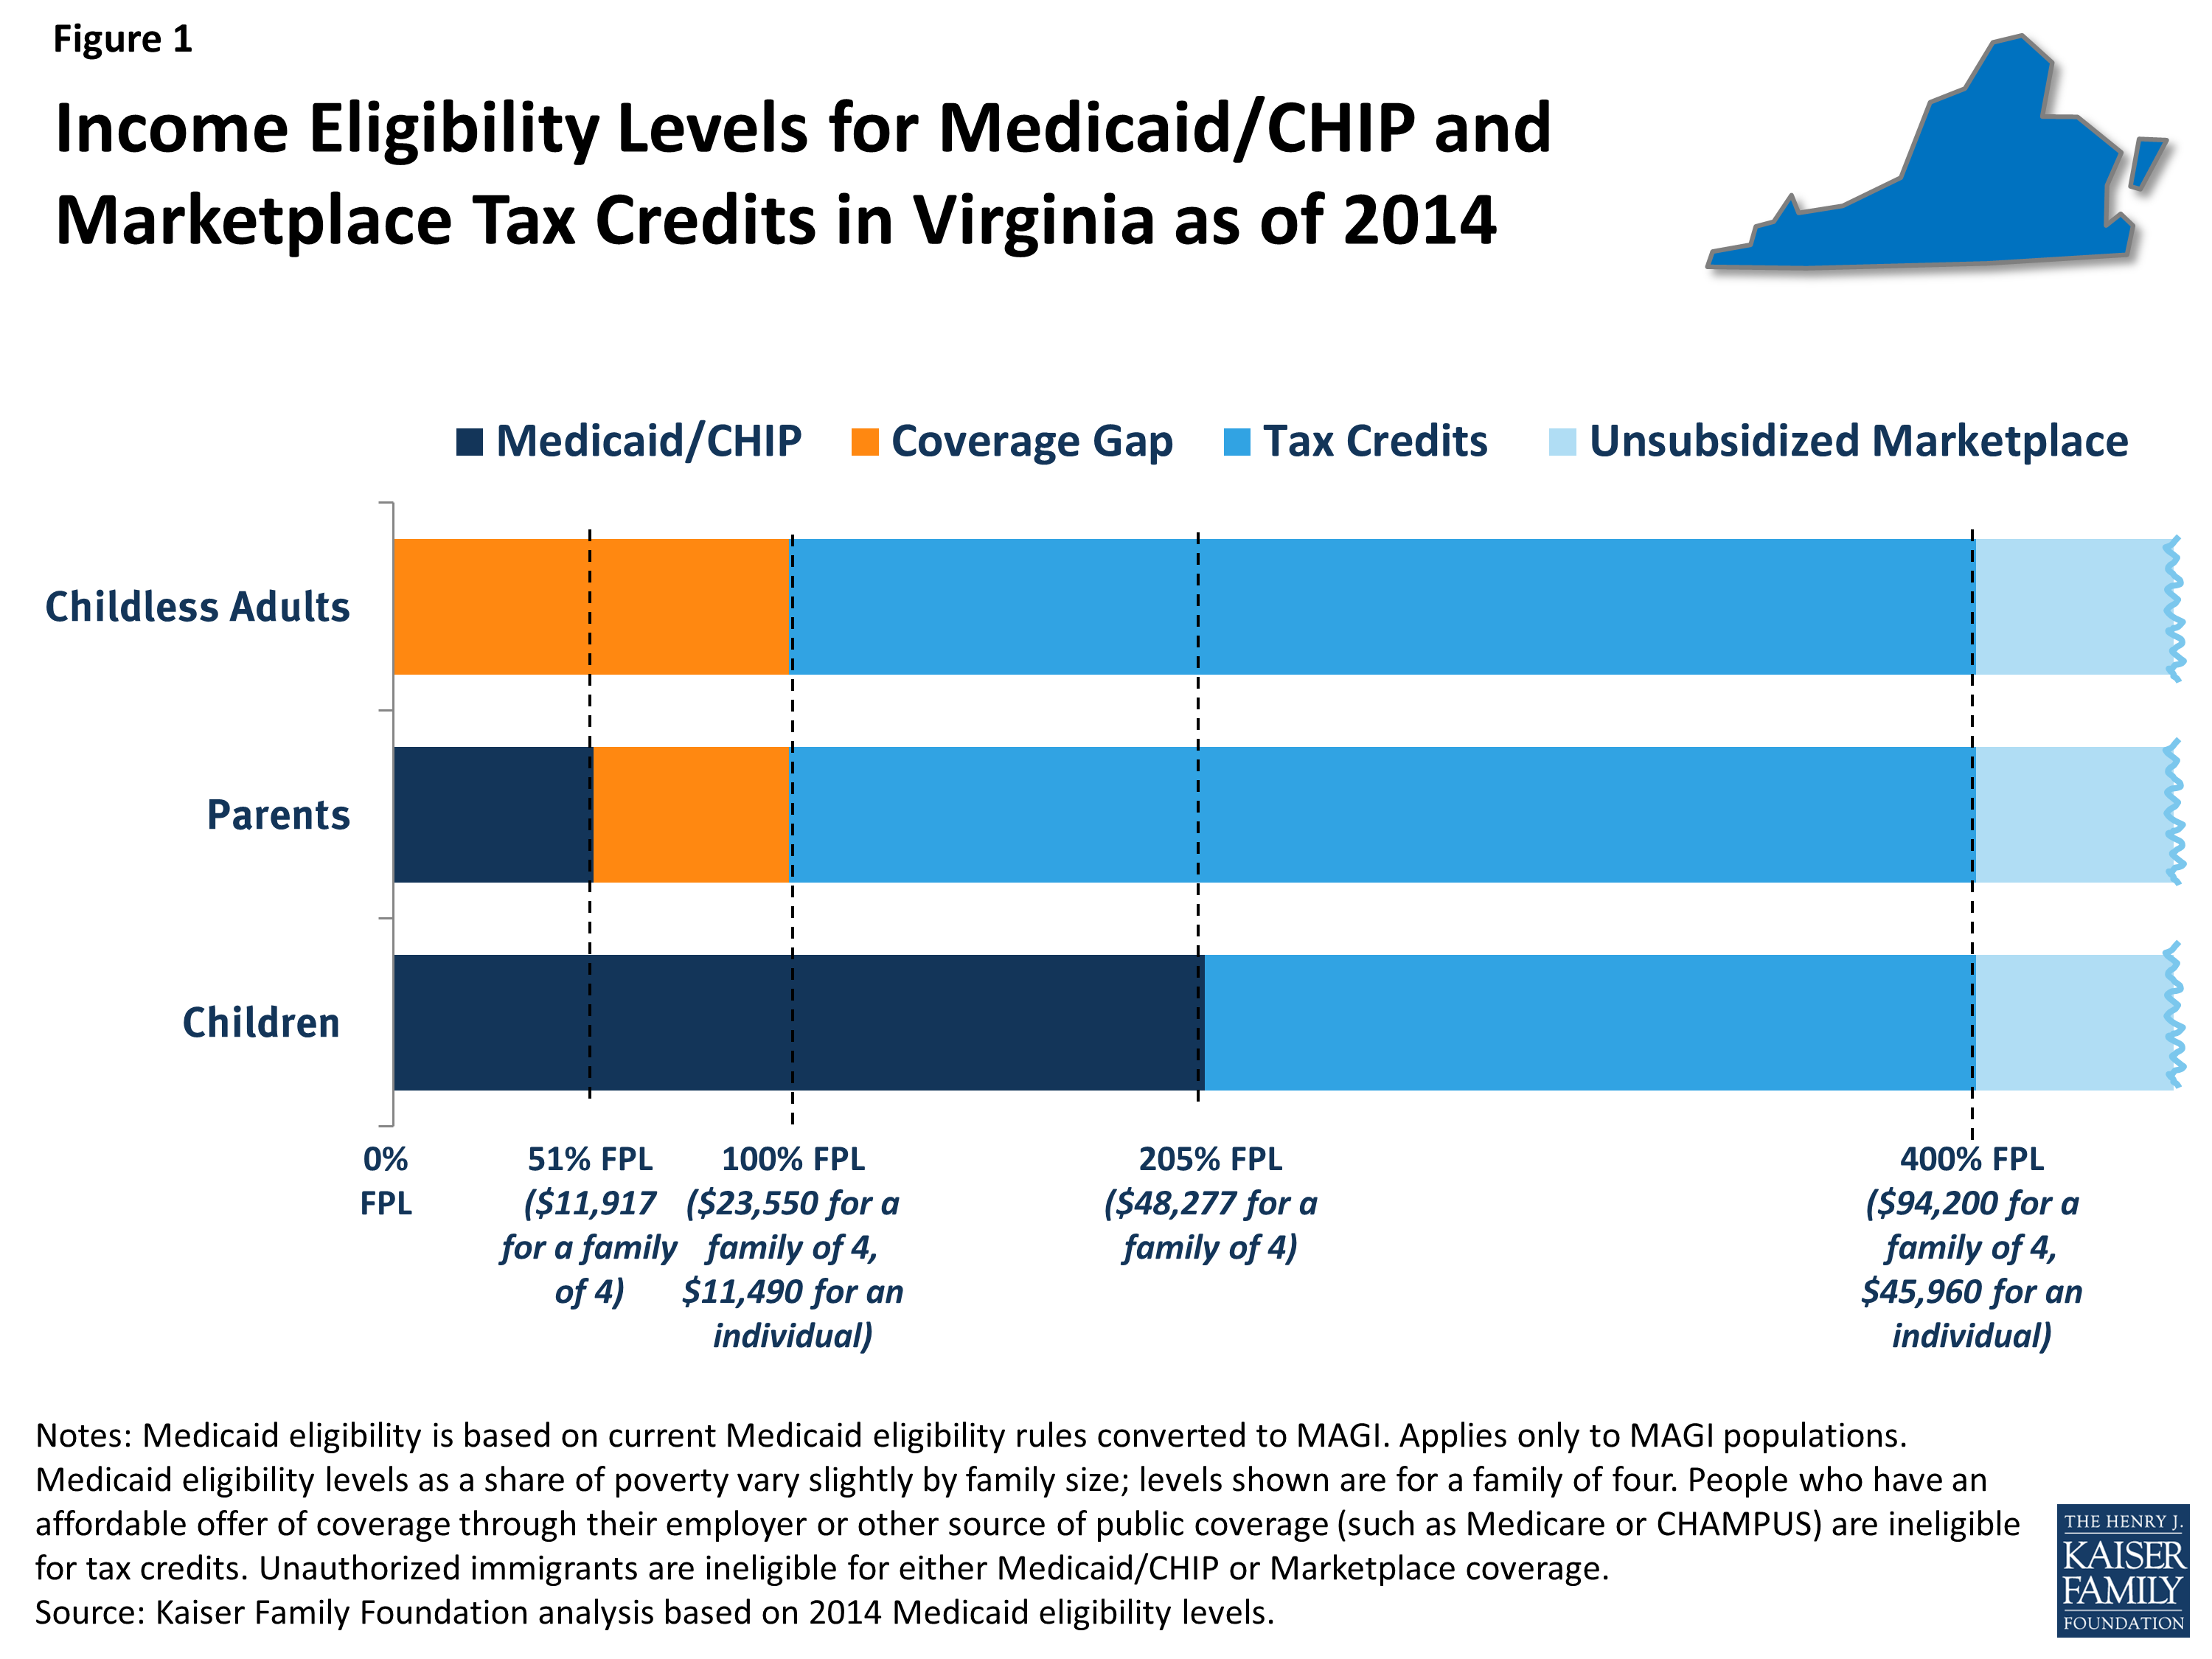
In states that do not implement the expansion (such as Virginia), Medicaid eligibility for adults will remain quite limited, as shown by the dark blue shading in Figure 1. As of January 2014, in Virginia, Medicaid eligibility for non-disabled adults is limited to parents with incomes below 51% of poverty, or about $11,900 a year for a family of four, and adults without dependent children remain ineligible regardless of their income. All states previously expanded eligibility for children to higher levels than adults through Medicaid and the Children’s Health Insurance Program (CHIP), and in Virginia, children with family incomes up to 205% of poverty (about $48,300 for a family of four) are eligible for Medicaid or CHIP. As was the case before the ACA, undocumented immigrants remain ineligible to enroll in Medicaid, and recent lawfully residing immigrants are subject to certain Medicaid eligibility restrictions.2
Under the ACA, people with incomes between 100% and 400% of poverty may be eligible for premium tax credits when they purchase coverage in a Marketplace, as indicated by the bright blue shading in Figure 1. The amount of the tax credit is based on income and the cost of insurance, and tax credits are only available to people who are not eligible for other coverage, such as Medicaid/CHIP, Medicare, or employer coverage, and who are citizens or lawfully-present immigrants. Citizens and lawfully-present immigrants with incomes above 400% of poverty can purchase unsubsidized coverage through the Marketplace. Because the ACA envisioned low-income people receiving coverage through Medicaid, people below poverty are not eligible for Marketplace subsidies. Thus, some adults in Virginia fall into a “coverage gap” of earning too much to qualify for Medicaid but not enough to qualify for premium tax credits, as shown by the orange shading in Figure 1. People in the coverage gap are ineligible for financial assistance under the ACA, while people with higher incomes are eligible for tax credits to purchase coverage.
How Many Uninsured Virginians Are Eligible for Assistance Under the ACA?
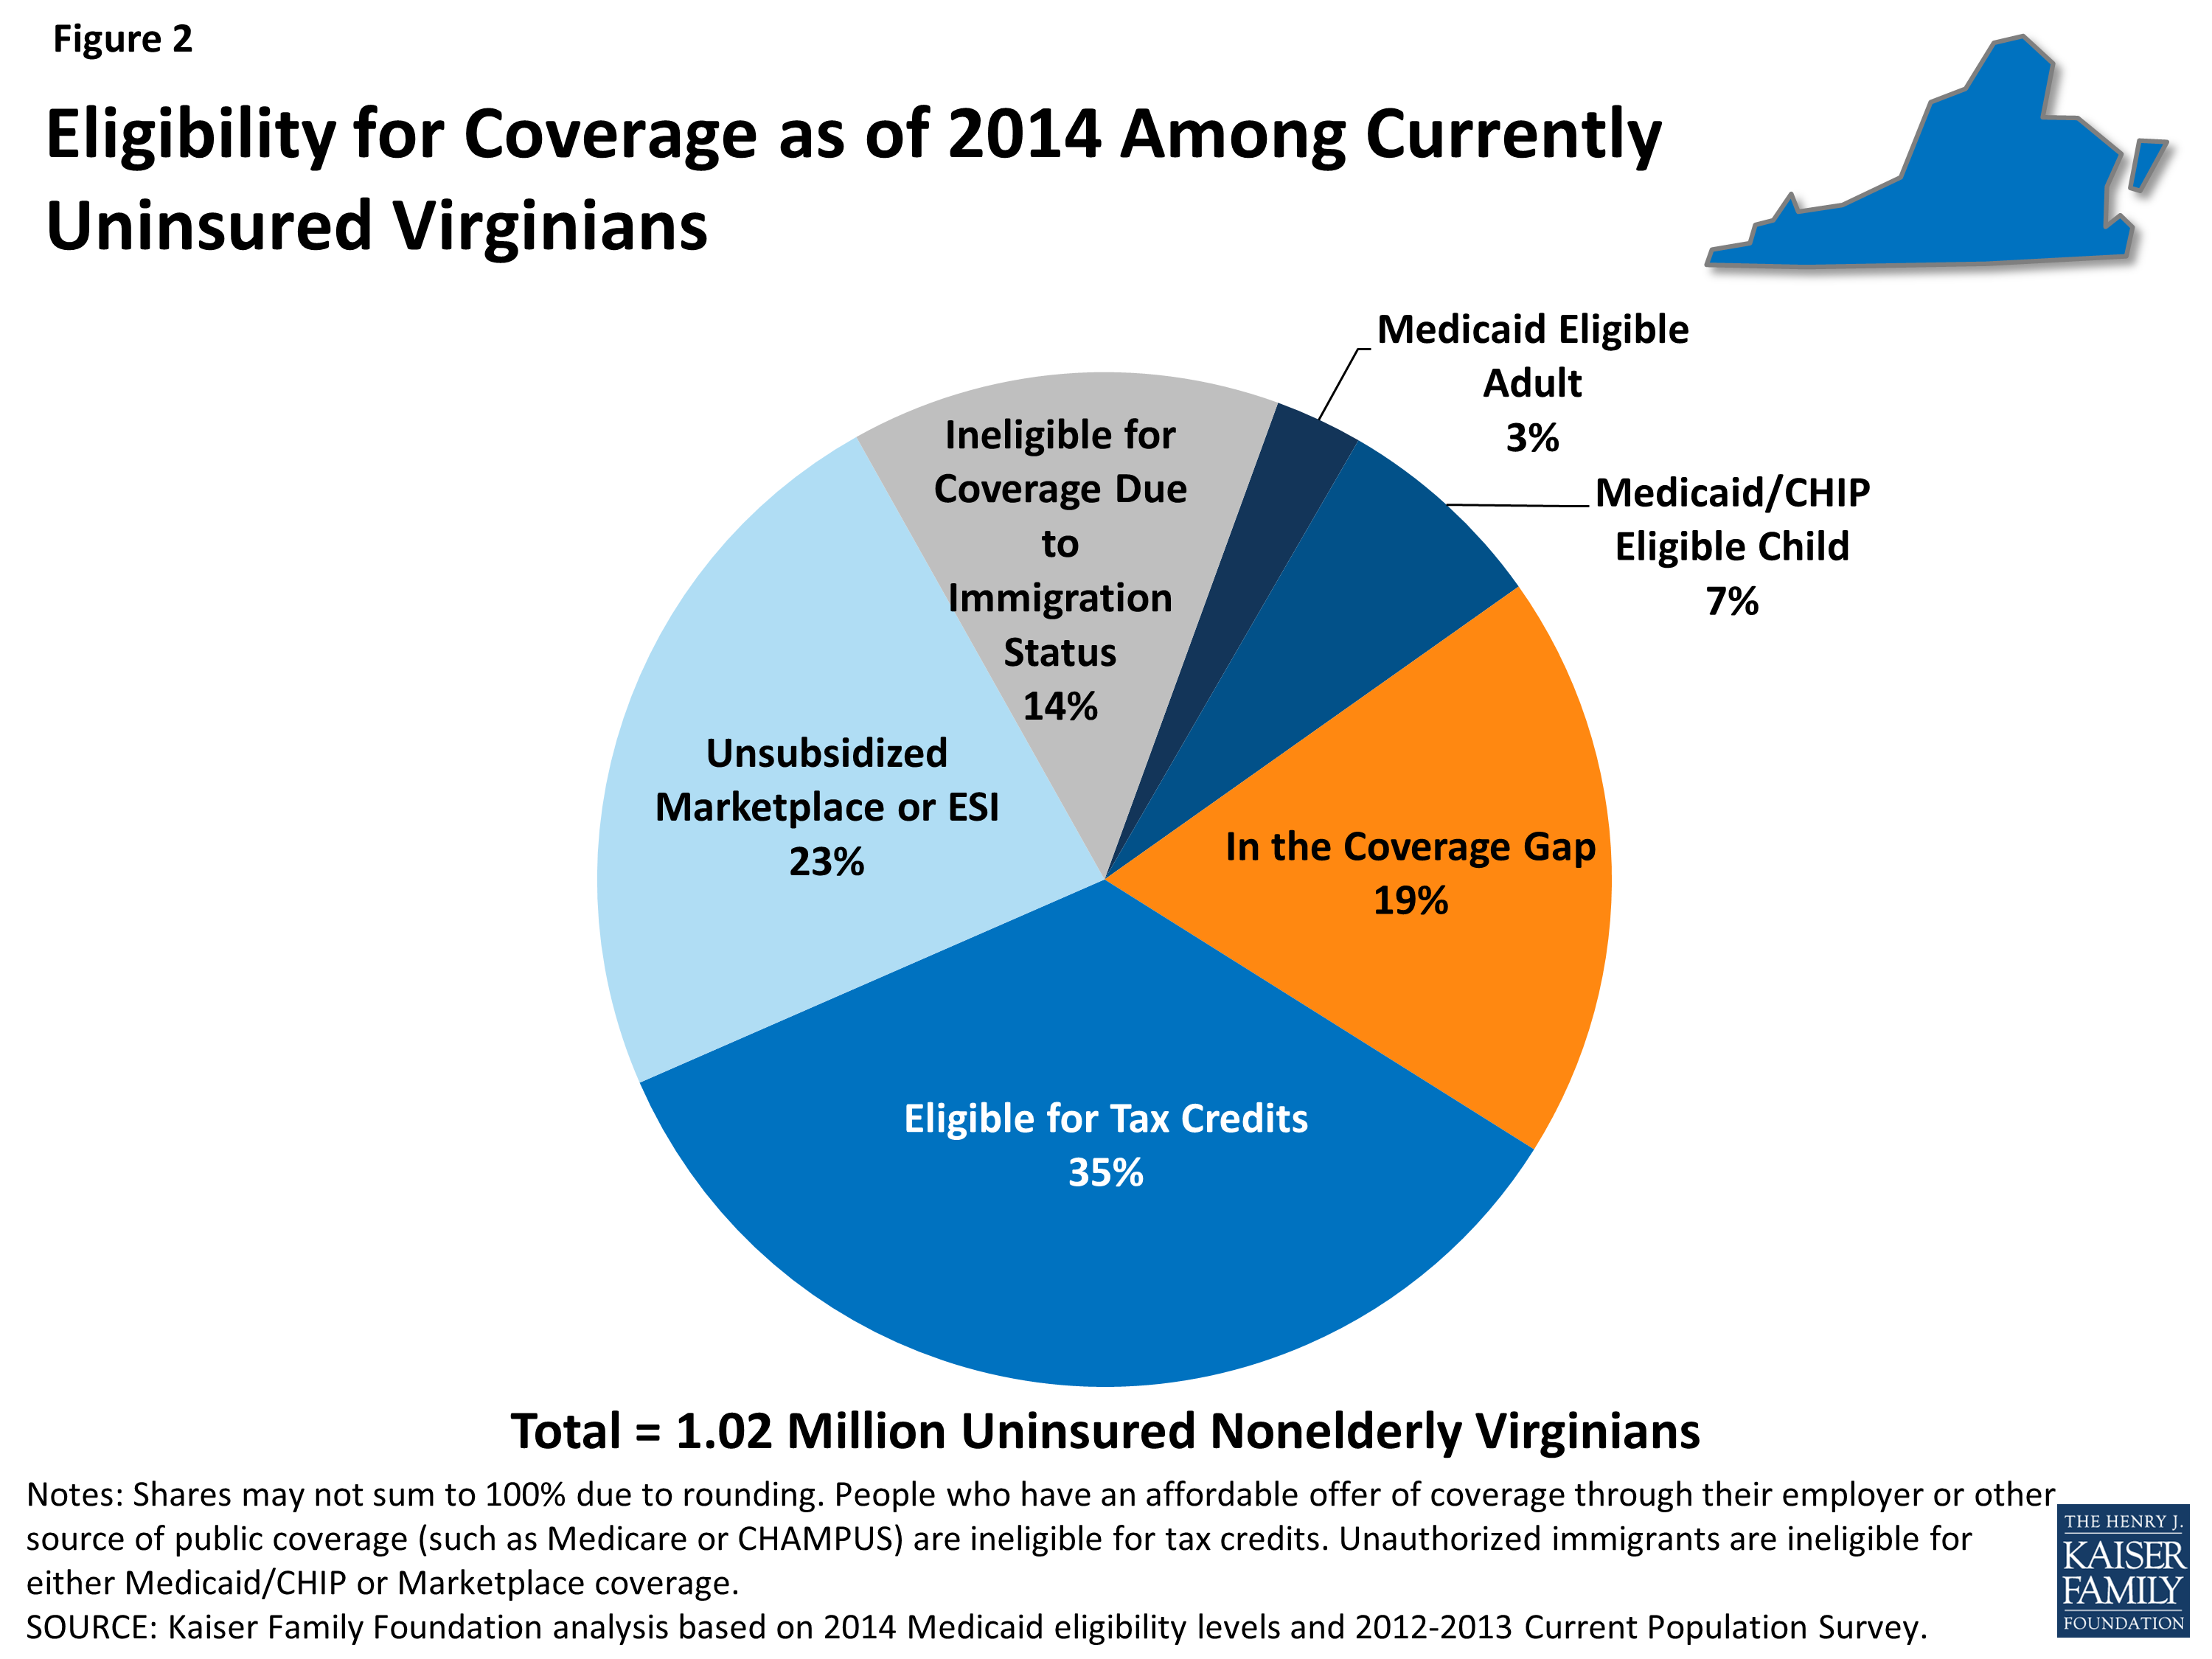
Under the ACA, in Virginia, more than four in ten (45%) currently uninsured nonelderly people are eligible for financial assistance in gaining coverage (Figure 2). The main pathway for the currently uninsured to gain coverage is the Marketplace, the new coverage option in the state: about 352,000 (over one in three) uninsured Virginians are eligible for premium tax credits to help them purchase coverage in the Marketplace.
Even though the state is not expanding Medicaid eligibility, some currently uninsured people are eligible for Medicaid in 2014. Reflecting higher eligibility levels for children than for adults, the majority (71%) of uninsured Virginians eligible for Medicaid are children who are already eligible but not yet enrolled in coverage. A small number of uninsured adult parents (3% of the uninsured in the state) are eligible for Medicaid in Virginia under eligibility pathways in place before the ACA. Not all eligible individuals are enrolled in the program due to lack of knowledge about their eligibility and historic enrollment barriers. As the ACA coverage expansions are implemented, it is likely that broad outreach efforts and new streamlined enrollment processes will lead to increased enrollment of eligible individuals into Medicaid.
In Virginia, 191,000 uninsured adults (19% of the uninsured in the state) who would have been eligible for Medicaid if the state expanded fall into the coverage gap. These adults are all below the poverty line and thus have very limited incomes. Because they do not gain an affordable coverage option under the ACA, they are most likely to remain uninsured.
Two other groups of uninsured Virginians are outside the reach of financial assistance for health coverage under the ACA. First, people with incomes above the limit for premium tax subsidies or who have an affordable offer of coverage through their employer are ineligible for financial assistance. Some of these people are still able to purchase unsubsidized coverage in the Marketplace, which may be more affordable or more comprehensive than the coverage they could obtain on their own through the individual market. Second, uninsured undocumented immigrants (14% of uninsued nonelderly Virginians) are ineligible for assistance under the ACA and barred from purchasing coverage through the Marketplace. This group is likely to remain uninsured, though they will still have a need for health care services.
***
The ACA will help many currently uninsured Virginians gain health coverage, but many who could have obtained financial assistance through the Medicaid expansion will remain outside its reach. Further, the impact of the ACA will depend on take-up of coverage among the eligible uninsured, and outreach and enrollment efforts will be an important factor in determining how the law affects the uninsured rate in the state. The ACA includes a requirement that most individuals obtain health coverage, but some people (such as the lowest income or those without an affordable option) are exempt and others may still remain uninsured. Notably, there is no deadline for state decisions about implementing the Medicaid expansion, and open enrollment in the Marketplaces continues through March 2014. Continued attention to who gains coverage as the ACA is fully implemented and who is excluded from its reach—as well as whether and how their health needs are being met—can help inform decisions about the future of health coverage in Virginia.
The 2010 Affordable Care Act (ACA) has the potential to extend coverage to many of the 47 million nonelderly uninsured people nationwide, including the 110,000 uninsured South Dakotans. The ACA establishes coverage provisions across the income spectrum, with the expansion of Medicaid eligibility for adults serving as the vehicle for covering low-income individuals and premium tax credits to help people purchase insurance directly through new Health Insurance Marketplaces serving as the vehicle for covering people with moderate incomes. With the June 2012 Supreme Court ruling, the Medicaid expansion became optional for states, and as of December 2013, South Dakota was not planning to implement the expansion. As a result, many uninsured adults in South Dakota who would have been newly-eligible for Medicaid will remain without a coverage option. As the ACA coverage expansions are implemented and coverage changes are assessed, it is important to understand the potential scope of the law in the state.
How Does the ACA Expand Health Insurance Coverage in South Dakota?
Historically, Medicaid had gaps in coverage for adults because eligibility was restricted to specific categories of low-income individuals, such as children, their parents, pregnant women, the elderly, or individuals with disabilities. In most states, adults without dependent children were ineligible for Medicaid, regardless of their income, and income limits for parents were very low—often below half the poverty level.1 The ACA aimed to fill in these gaps by extending Medicaid to nearly all nonelderly adults with incomes at or below 138% of poverty (about $32,500 for a family of four in 2013).
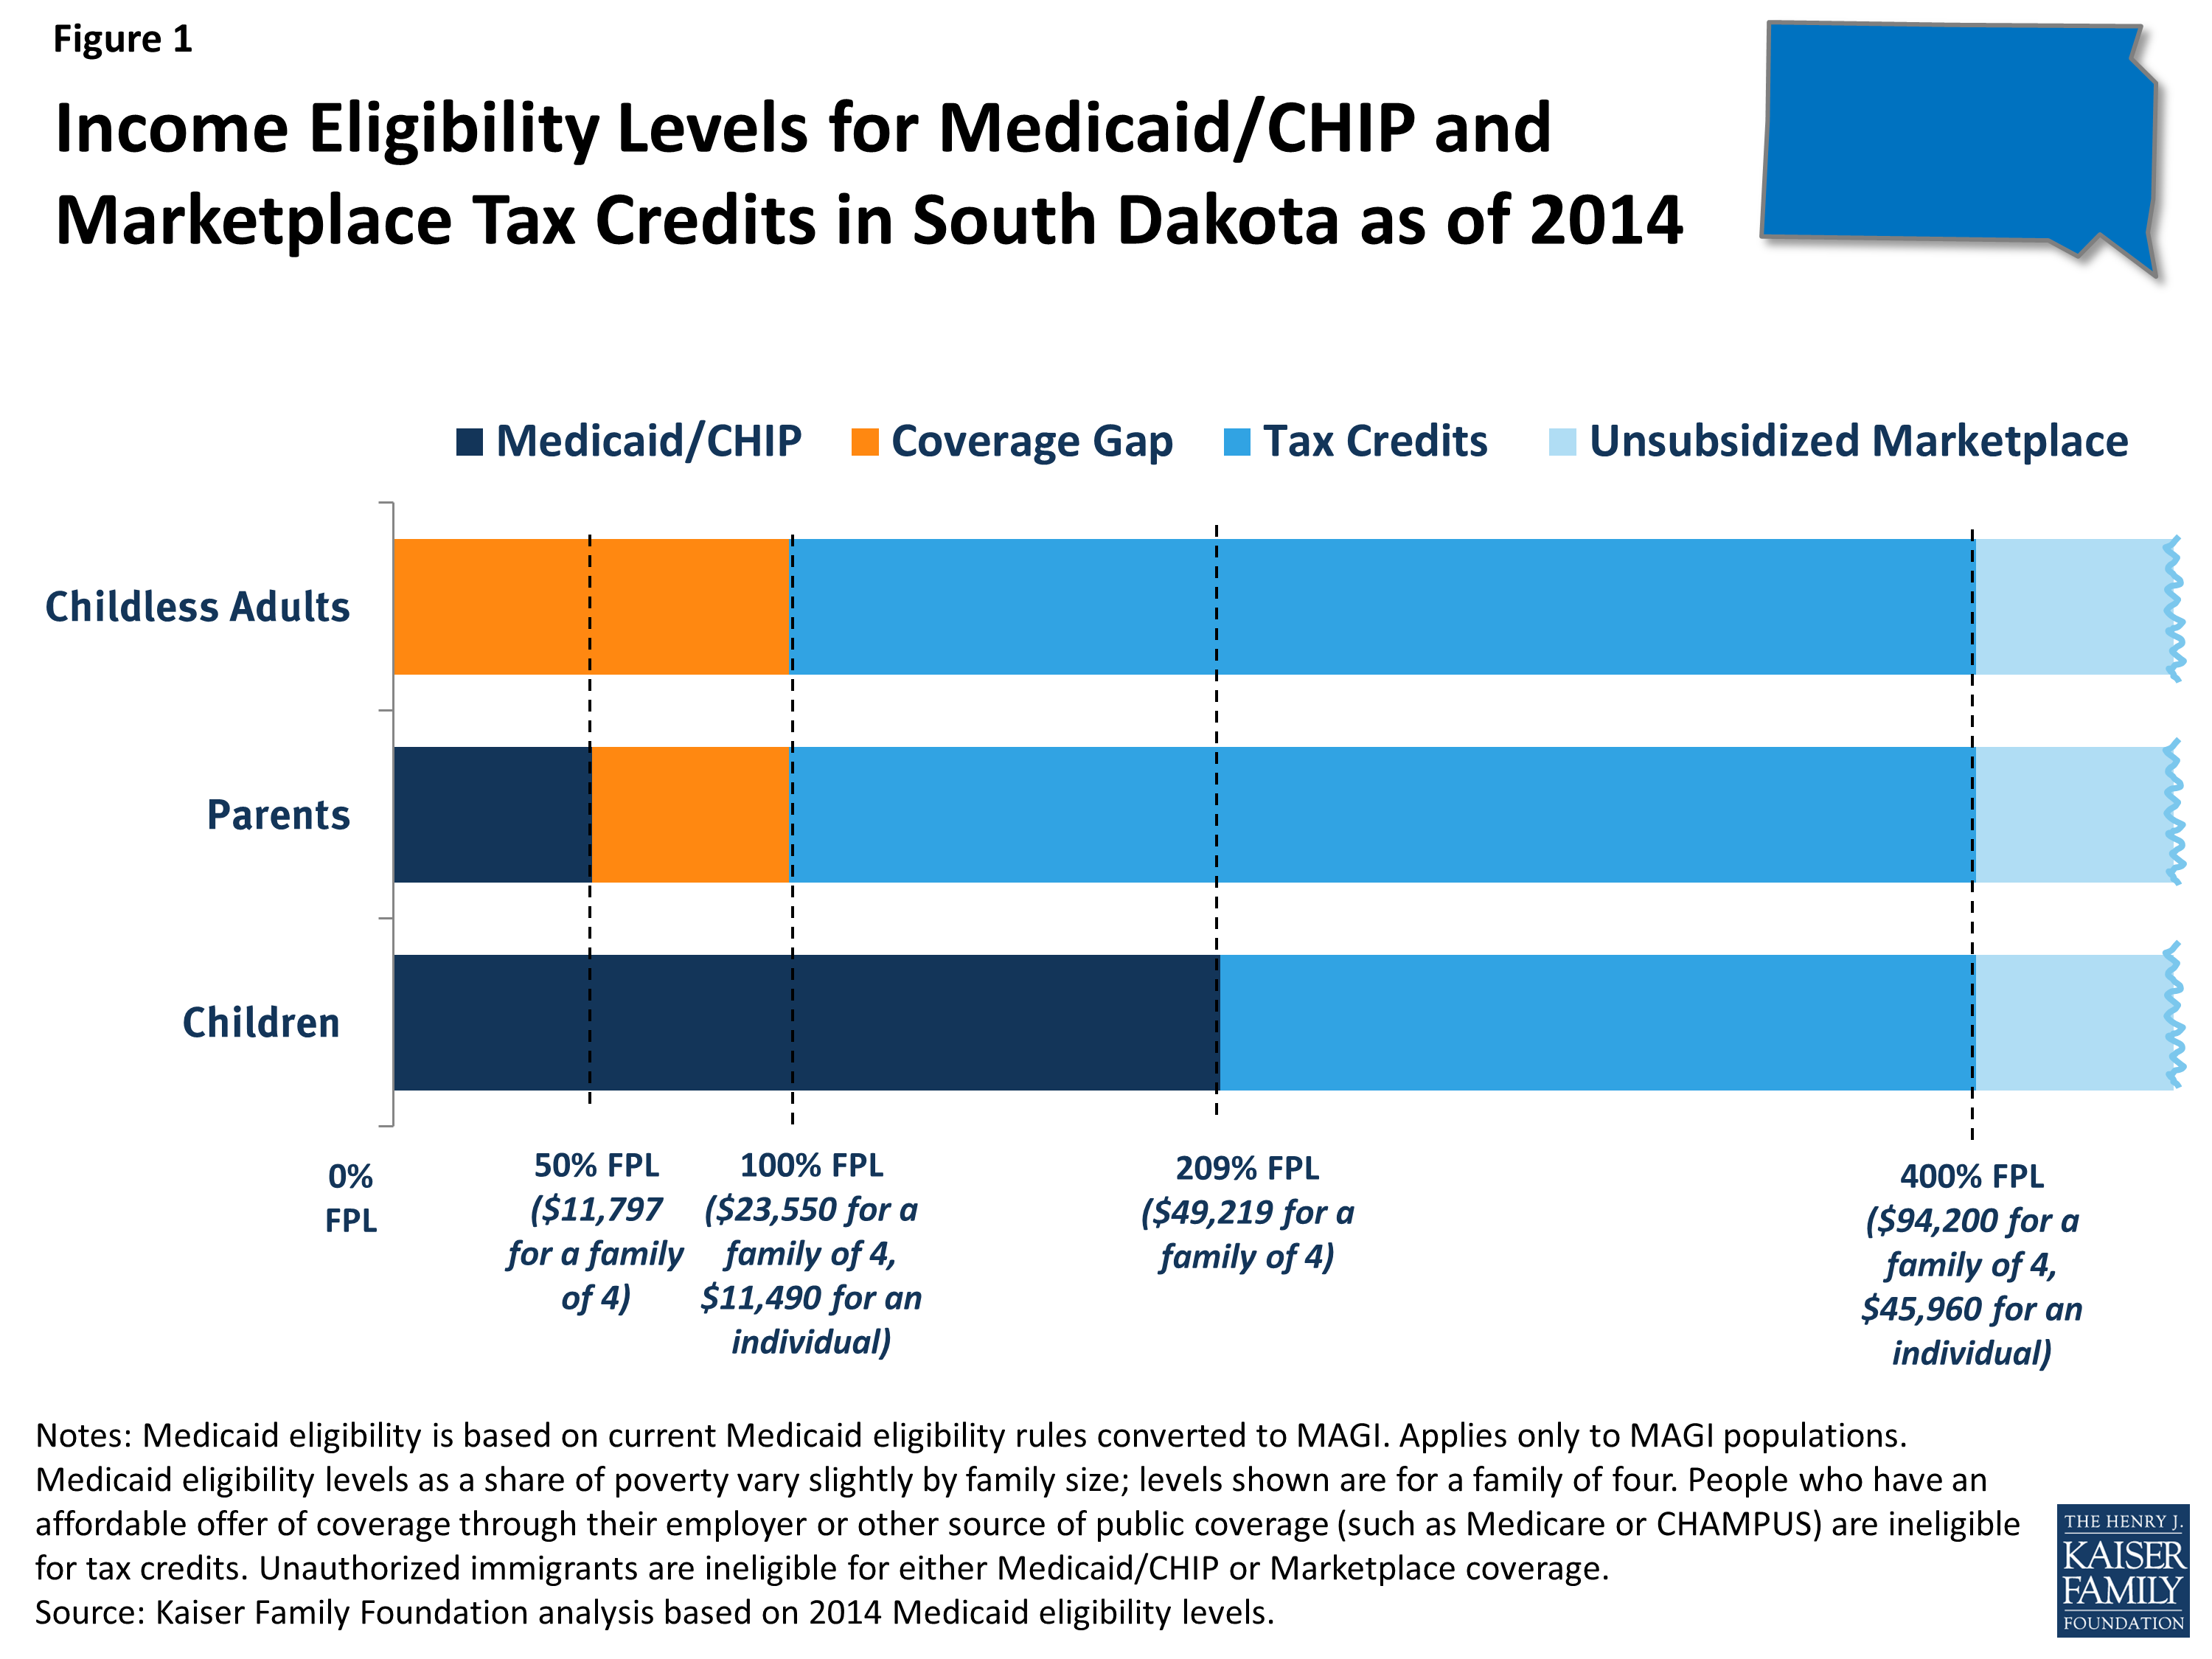
In states that do not implement the expansion (such as South Dakota), Medicaid eligibility for adults will remain quite limited, as shown by the dark blue shading in Figure 1. As of January 2014, in South Dakota, Medicaid eligibility for non-disabled adults is limited to parents with incomes below 50% of poverty, or about $11,800 a year for a family of four, and adults without dependent children remain ineligible regardless of their income. All states previously expanded eligibility for children to higher levels than adults through Medicaid and the Children’s Health Insurance Program (CHIP), and in South Dakota, children with family incomes up to 209% of poverty (about $49,200 for a family of four) are eligible for Medicaid or CHIP. As was the case before the ACA, undocumented immigrants remain ineligible to enroll in Medicaid, and recent lawfully residing immigrants are subject to certain Medicaid eligibility restrictions.2 Under the ACA, people with incomes between 100% and 400% of poverty may be eligible for premium tax credits when they purchase coverage in a Marketplace, as indicated by the bright blue shading in Figure 1. The amount of the tax credit is based on income and the cost of insurance, and tax credits are only available to people who are not eligible for other coverage, such as Medicaid/CHIP, Medicare, or employer coverage, and who are citizens or lawfully-present immigrants. Citizens and lawfully-present immigrants with incomes above 400% of poverty can purchase unsubsidized coverage through the Marketplace. Because the ACA envisioned low-income people receiving coverage through Medicaid, people below poverty are not eligible for Marketplace subsidies. Thus, some adults in South Dakota fall into a “coverage gap” of earning too much to qualify for Medicaid but not enough to qualify for premium tax credits, as shown by the orange shading in Figure 1. People in the coverage gap are ineligible for financial assistance under the ACA, while people with higher incomes are eligible for tax credits to purchase coverage.
How Many Uninsured South Dakotans Are Eligible for Assistance Under the ACA?
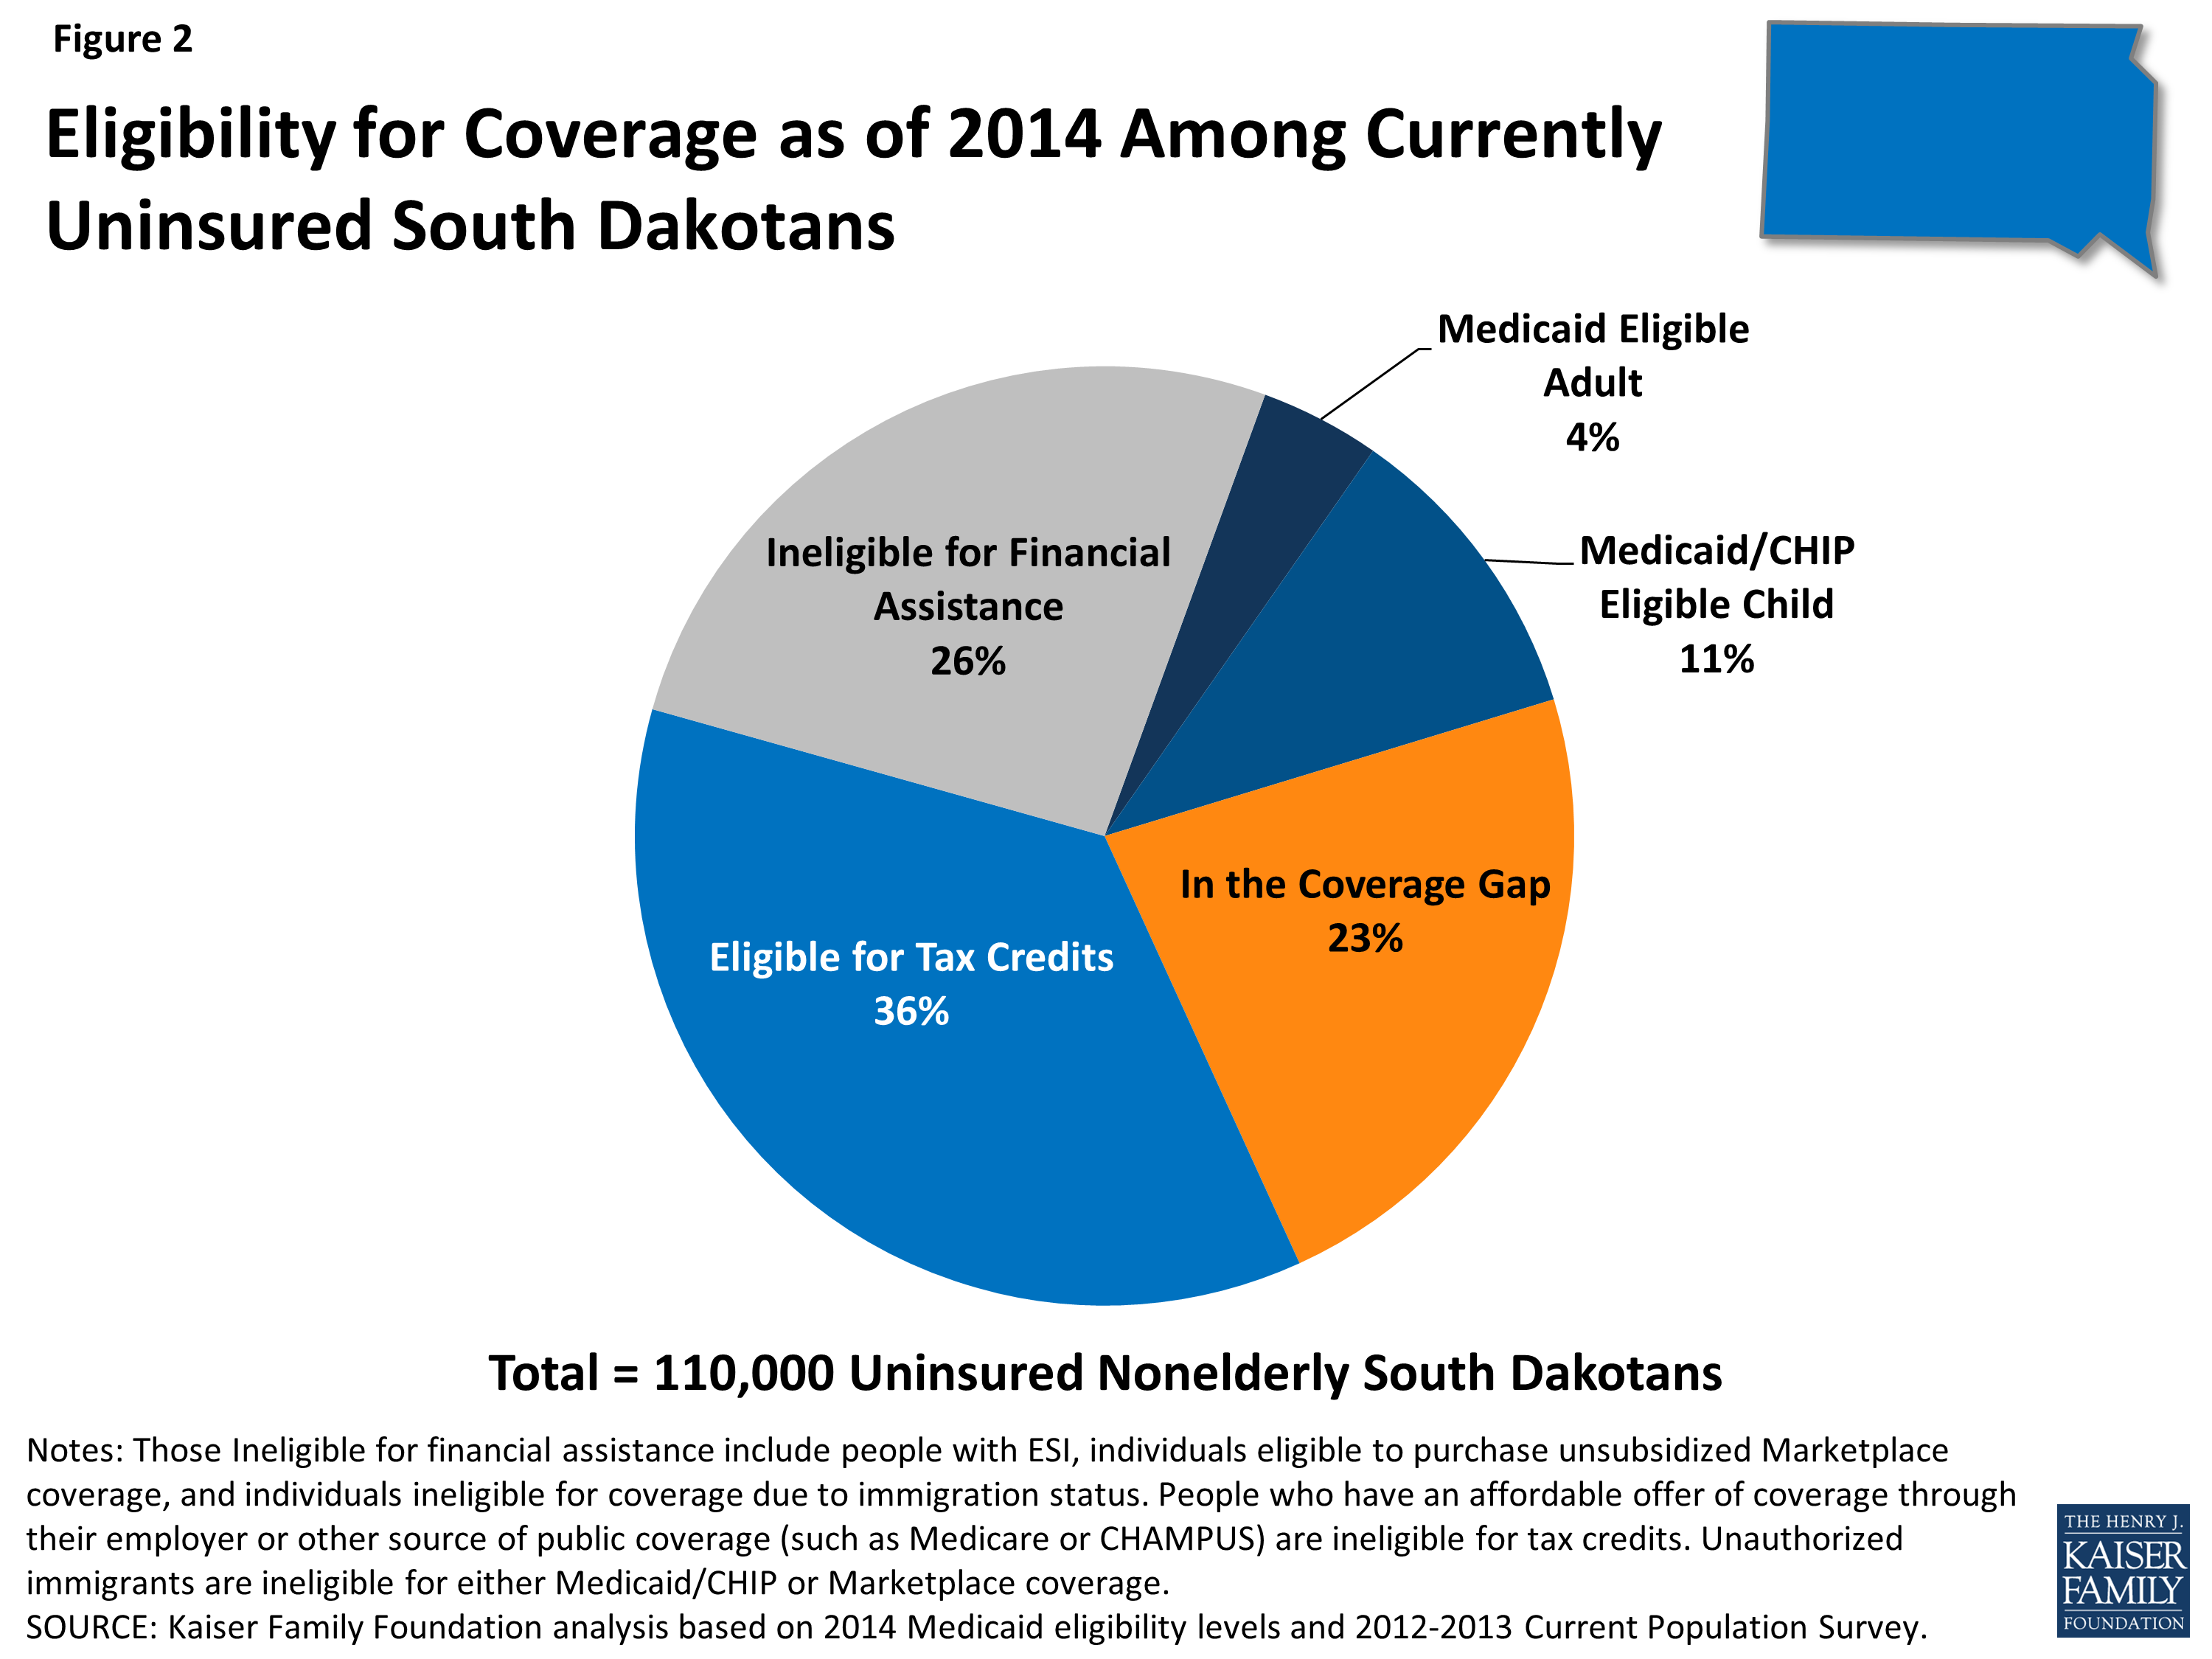
Under the ACA, in South Dakota, about half (51%) of currently uninsured nonelderly people are eligible for financial assistance in gaining coverage (Figure 2). The main pathway for the currently uninsured to gain coverage is the Marketplace, the new coverage option in the state: about 40,000 (over one in three) uninsured South Dakotans are eligible for premium tax credits to help them purchase coverage in the Marketplace.
Even though the state is not expanding Medicaid eligibility, some currently uninsured people are eligible for Medicaid in 2014. Reflecting higher eligibility levels for children than for adults, the majority (75%) of uninsured South Dakotans eligible for Medicaid are children who are already eligible but not yet enrolled in coverage. A small number of uninsured adult parents (4% of the uninsured in the state) are eligible for Medicaid in South Dakota under eligibility pathways in place before the ACA. Not all eligible individuals are enrolled in the program due to lack of knowledge about their eligibility and historic enrollment barriers. As the ACA coverage expansions are implemented, it is likely that broad outreach efforts and new streamlined enrollment processes will lead to increased enrollment of eligible individuals into Medicaid. In South Dakota, 25,000 uninsured adults (23% of the uninsured in the state) who would have been eligible for Medicaid if the state expanded fall into the coverage gap. These adults are all below the poverty line and thus have very limited incomes. Because they do not gain an affordable coverage option under the ACA, they are most likely to remain uninsured. Two other groups of uninsured South Dakotans are outside the reach of financial assistance for health coverage under the ACA. First, people with incomes above the limit for premium tax subsidies or who have an affordable offer of coverage through their employer are ineligible for financial assistance. Some of these people are still able to purchase unsubsidized coverage in the Marketplace, which may be more affordable or more comprehensive than the coverage they could obtain on their own through the individual market. Second, uninsured undocumented immigrants are ineligible for assistance under the ACA and barred from purchasing coverage through the Marketplace. This group is likely to remain uninsured, though they will still have a need for health care services.
***
The ACA will help many currently uninsured South Dakotans gain health coverage, but many who could have obtained financial assistance through the Medicaid expansion will remain outside its reach. Further, the impact of the ACA will depend on take-up of coverage among the eligible uninsured, and outreach and enrollment efforts will be an important factor in determining how the law affects the uninsured rate in the state. The ACA includes a requirement that most individuals obtain health coverage, but some people (such as the lowest income or those without an affordable option) are exempt and others may still remain uninsured. Notably, there is no deadline for state decisions about implementing the Medicaid expansion, and open enrollment in the Marketplaces continues through March 2014. Continued attention to who gains coverage as the ACA is fully implemented and who is excluded from its reach—as well as whether and how their health needs are being met—can help inform decisions about the future of health coverage in South Dakota.
The 2010 Affordable Care Act (ACA) has the potential to extend coverage to many of the 47 million nonelderly uninsured people nationwide, including the 407,000 uninsured Utahns. The ACA establishes coverage provisions across the income spectrum, with the expansion of Medicaid eligibility for adults serving as the vehicle for covering low-income individuals and premium tax credits to help people purchase insurance directly through new Health Insurance Marketplaces serving as the vehicle for covering people with moderate incomes. With the June 2012 Supreme Court ruling, the Medicaid expansion became optional for states, and as of December 2013, Utah was not planning to implement the expansion. As a result, many uninsured adults in Utah who would have been newly-eligible for Medicaid will remain without a coverage option. As the ACA coverage expansions are implemented and coverage changes are assessed, it is important to understand the potential scope of the law in the state.
How Does the ACA Expand Health Insurance Coverage in Utah?
Historically, Medicaid had gaps in coverage for adults because eligibility was restricted to specific categories of low-income individuals, such as children, their parents, pregnant women, the elderly, or individuals with disabilities. In most states, adults without dependent children were ineligible for Medicaid, regardless of their income, and income limits for parents were very low—often below half the poverty level.1 The ACA aimed to fill in these gaps by extending Medicaid to nearly all nonelderly adults with incomes at or below 138% of poverty (about $32,500 for a family of four in 2013).
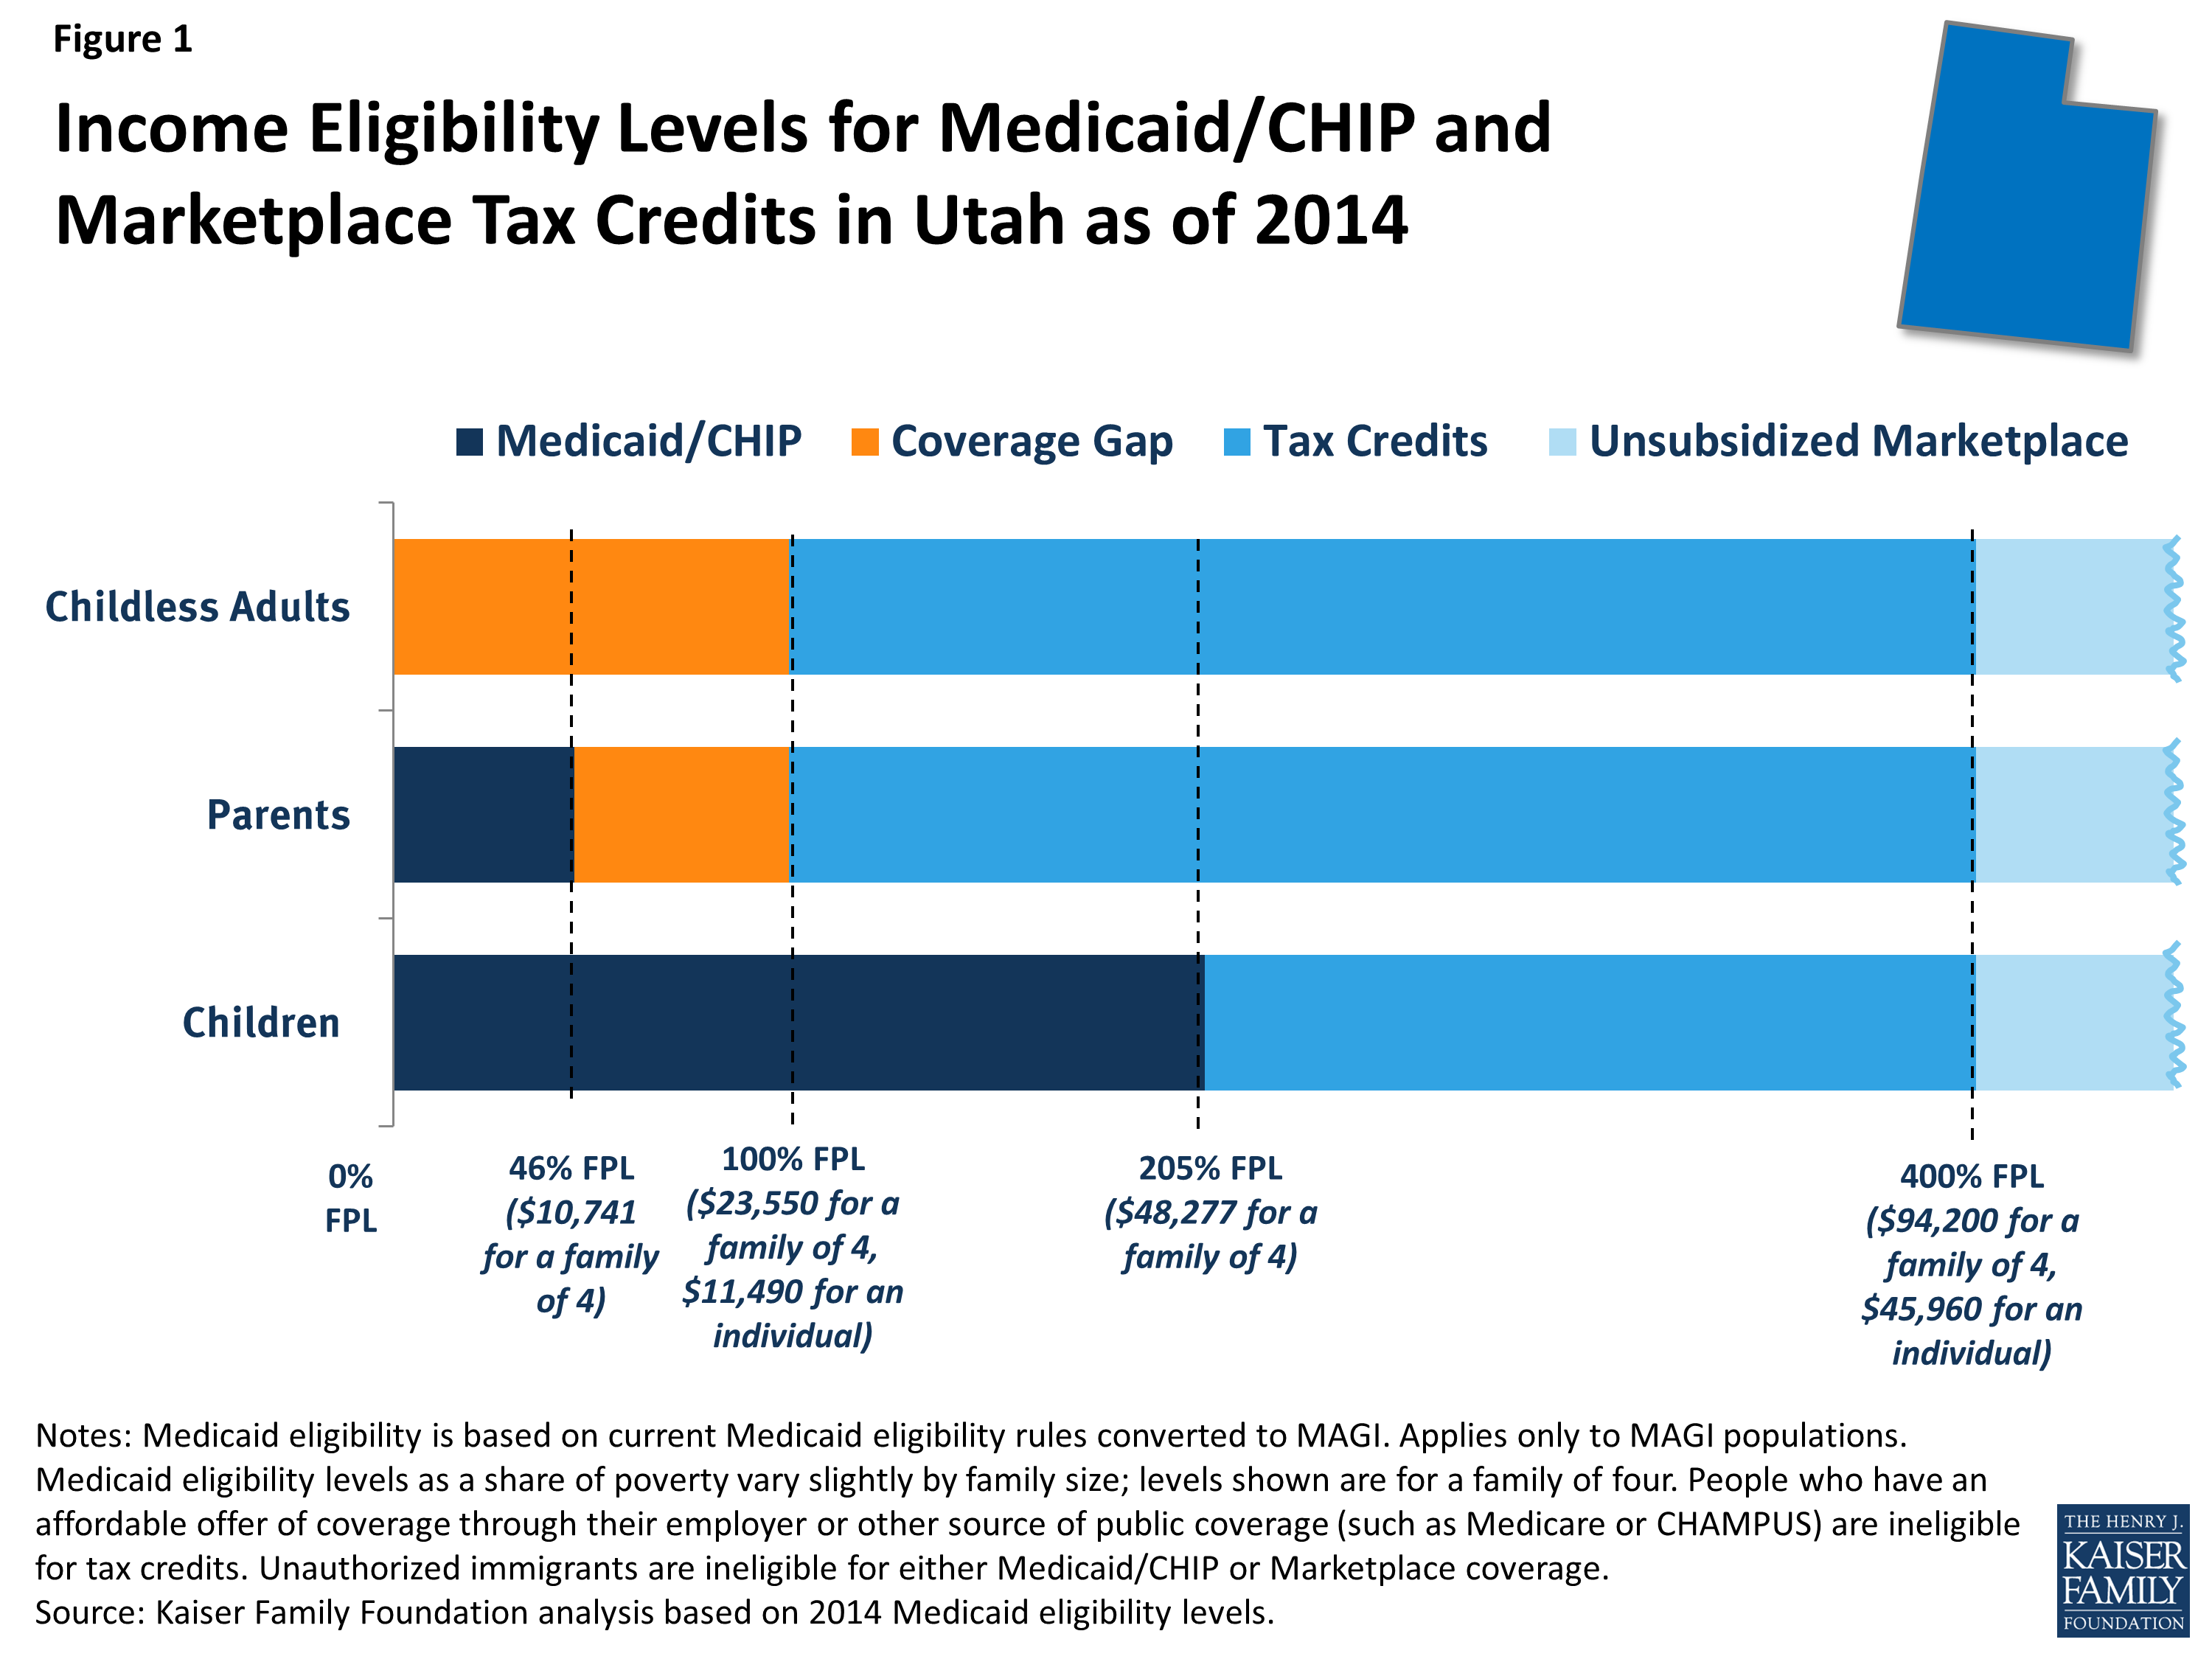
In states that do not implement the expansion (such as Utah), Medicaid eligibility for adults will remain quite limited, as shown by the dark blue shading in Figure 1. As of January 2014, in Utah, Medicaid eligibility for non-disabled adults is limited to parents with incomes below 46% of poverty, or about $10,700 a year for a family of four, and adults without dependent children remain ineligible regardless of their income. All states previously expanded eligibility for children to higher levels than adults through Medicaid and the Children’s Health Insurance Program (CHIP), and in Utah, children with family incomes up to 205% of poverty (about $48,300 for a family of four) are eligible for Medicaid or CHIP. As was the case before the ACA, undocumented immigrants remain ineligible to enroll in Medicaid, and recent lawfully residing immigrants are subject to certain Medicaid eligibility restrictions.2
Under the ACA, people with incomes between 100% and 400% of poverty may be eligible for premium tax credits when they purchase coverage in a Marketplace, as indicated by the bright blue shading in Figure 1. The amount of the tax credit is based on income and the cost of insurance, and tax credits are only available to people who are not eligible for other coverage, such as Medicaid/CHIP, Medicare, or employer coverage, and who are citizens or lawfully-present immigrants. Citizens and lawfully-present immigrants with incomes above 400% of poverty can purchase unsubsidized coverage through the Marketplace. Because the ACA envisioned low-income people receiving coverage through Medicaid, people below poverty are not eligible for Marketplace subsidies. Thus, some adults in Utah fall into a “coverage gap” of earning too much to qualify for Medicaid but not enough to qualify for premium tax credits, as shown by the orange shading in Figure 1. People in the coverage gap are ineligible for financial assistance under the ACA, while people with higher incomes are eligible for tax credits to purchase coverage.
How Many Uninsured Utahns Are Eligible for Assistance under the ACA?
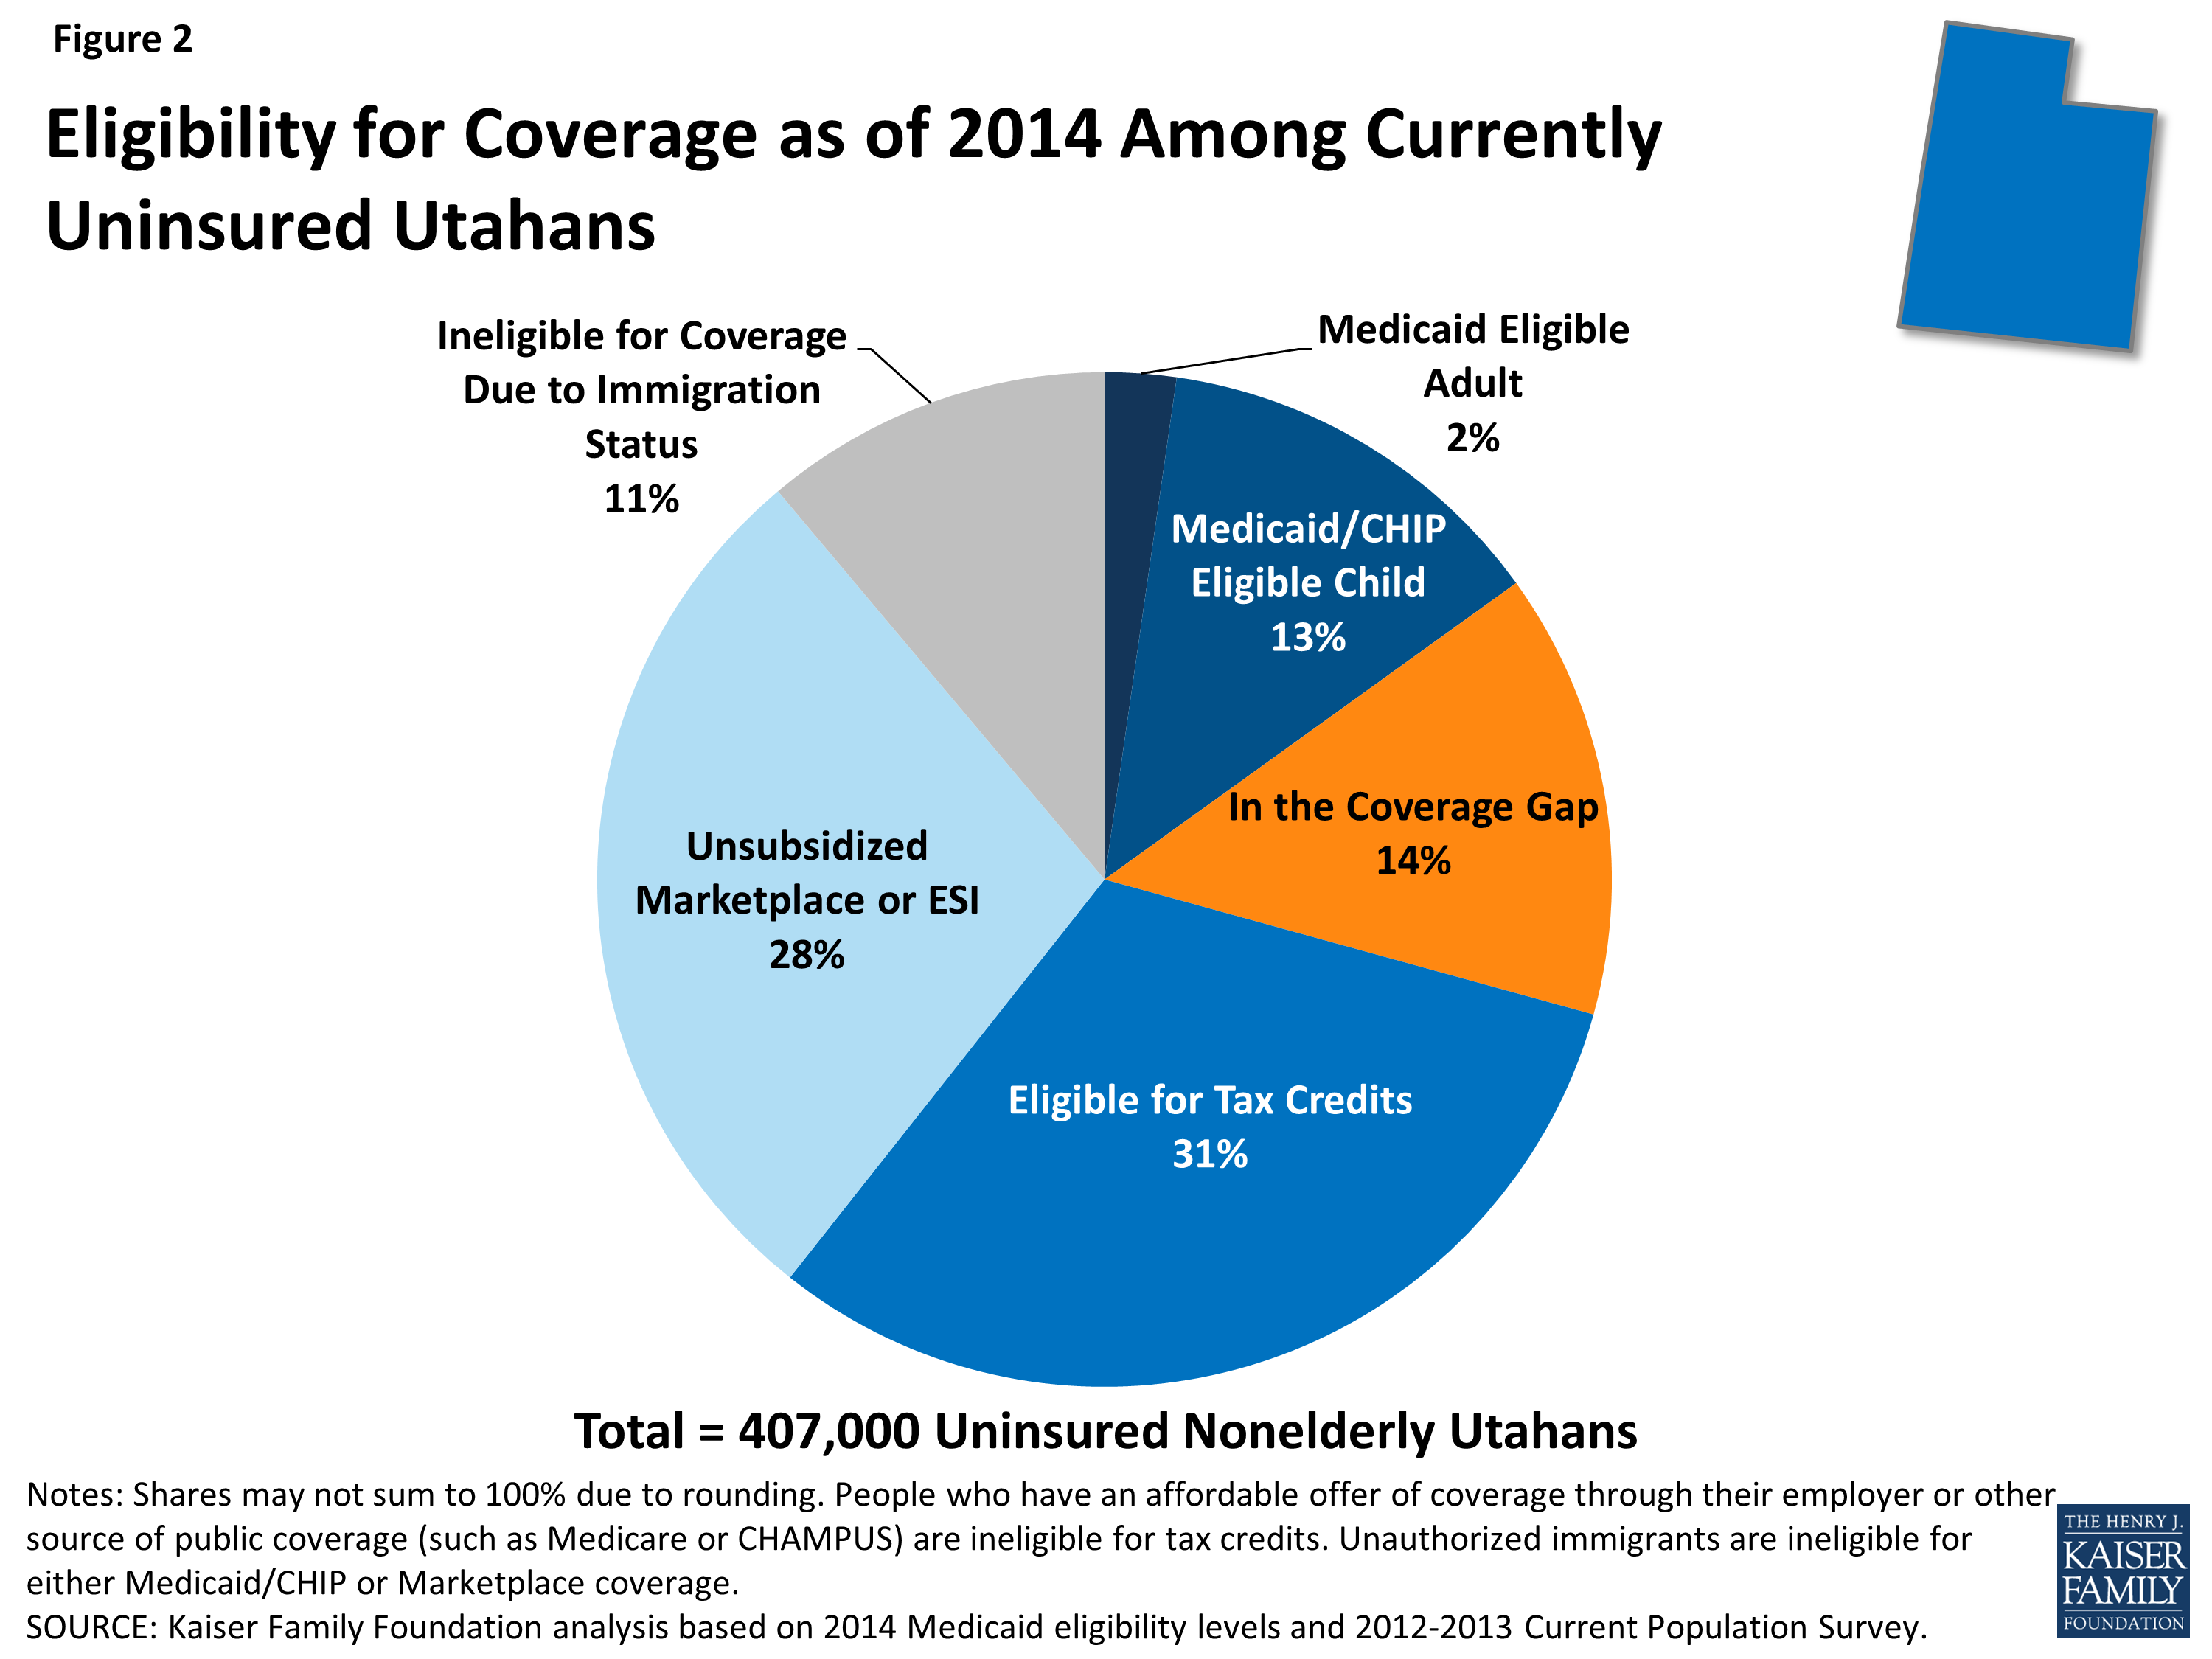
Under the ACA, in Utah, nearly half (46%) of currently uninsured nonelderly people are eligible for financial assistance in gaining coverage (Figure 2). The main pathway for the currently uninsured to gain coverage is the Marketplace, the new coverage option in the state: about 128,000 (over three in ten) uninsured Utahns are eligible for premium tax credits to help them purchase coverage in the Marketplace.
Even though the state is not expanding Medicaid eligibility, some currently uninsured people are eligible for Medicaid in 2014. Reflecting higher eligibility levels for children than for adults, the majority (85%) of uninsured Utahns eligible for Medicaid are children who are already eligible but not yet enrolled in coverage. A small number of uninsured adult parents (2% of the uninsured in the state) are eligible for Medicaid in Utah under eligibility pathways in place before the ACA. Not all eligible individuals are enrolled in the program due to lack of knowledge about their eligibility and historic enrollment barriers. As the ACA coverage expansions are implemented, it is likely that broad outreach efforts and new streamlined enrollment processes will lead to increased enrollment of eligible individuals into Medicaid.
In Utah, 58,000 uninsured adults (14% of the uninsured in the state) who would have been eligible for Medicaid if the state expanded fall into the coverage gap. These adults are all below the poverty line and thus have very limited incomes. Because they do not gain an affordable coverage option under the ACA, they are most likely to remain uninsured.
Two other groups of uninsured Utahns are outside the reach of financial assistance for health coverage under the ACA. First, people with incomes above the limit for premium tax subsidies or who have an affordable offer of coverage through their employer are ineligible for financial assistance. Some of these people are still able to purchase unsubsidized coverage in the Marketplace, which may be more affordable or more comprehensive than the coverage they could obtain on their own through the individual market. Second, uninsured undocumented immigrants (11% of uninsured nonelderly Utahns) are ineligible for assistance under the ACA and barred from purchasing coverage through the Marketplace. This group is likely to remain uninsured, though they will still have a need for health care services.
***
The ACA will help many uninsured Utahns gain health coverage, but many who could have obtained financial assistance through the Medicaid expansion will remain outside its reach. Further, the impact of the ACA will depend on take-up of coverage among the eligible uninsured, and outreach and enrollment efforts will be an important factor in determining how the law affects the uninsured rate in the state. The ACA includes a requirement that most individuals obtain health coverage, but some people (such as the lowest income or those without an affordable option) are exempt and others may still remain uninsured. Notably, there is no deadline for state decisions about implementing the Medicaid expansion, and open enrollment in the Marketplaces continues through March 2014. Continued attention to who gains coverage as the ACA is fully implemented and who is excluded from its reach—as well as whether and how their health needs are being met—can help inform decisions about the future of health coverage in Utah.
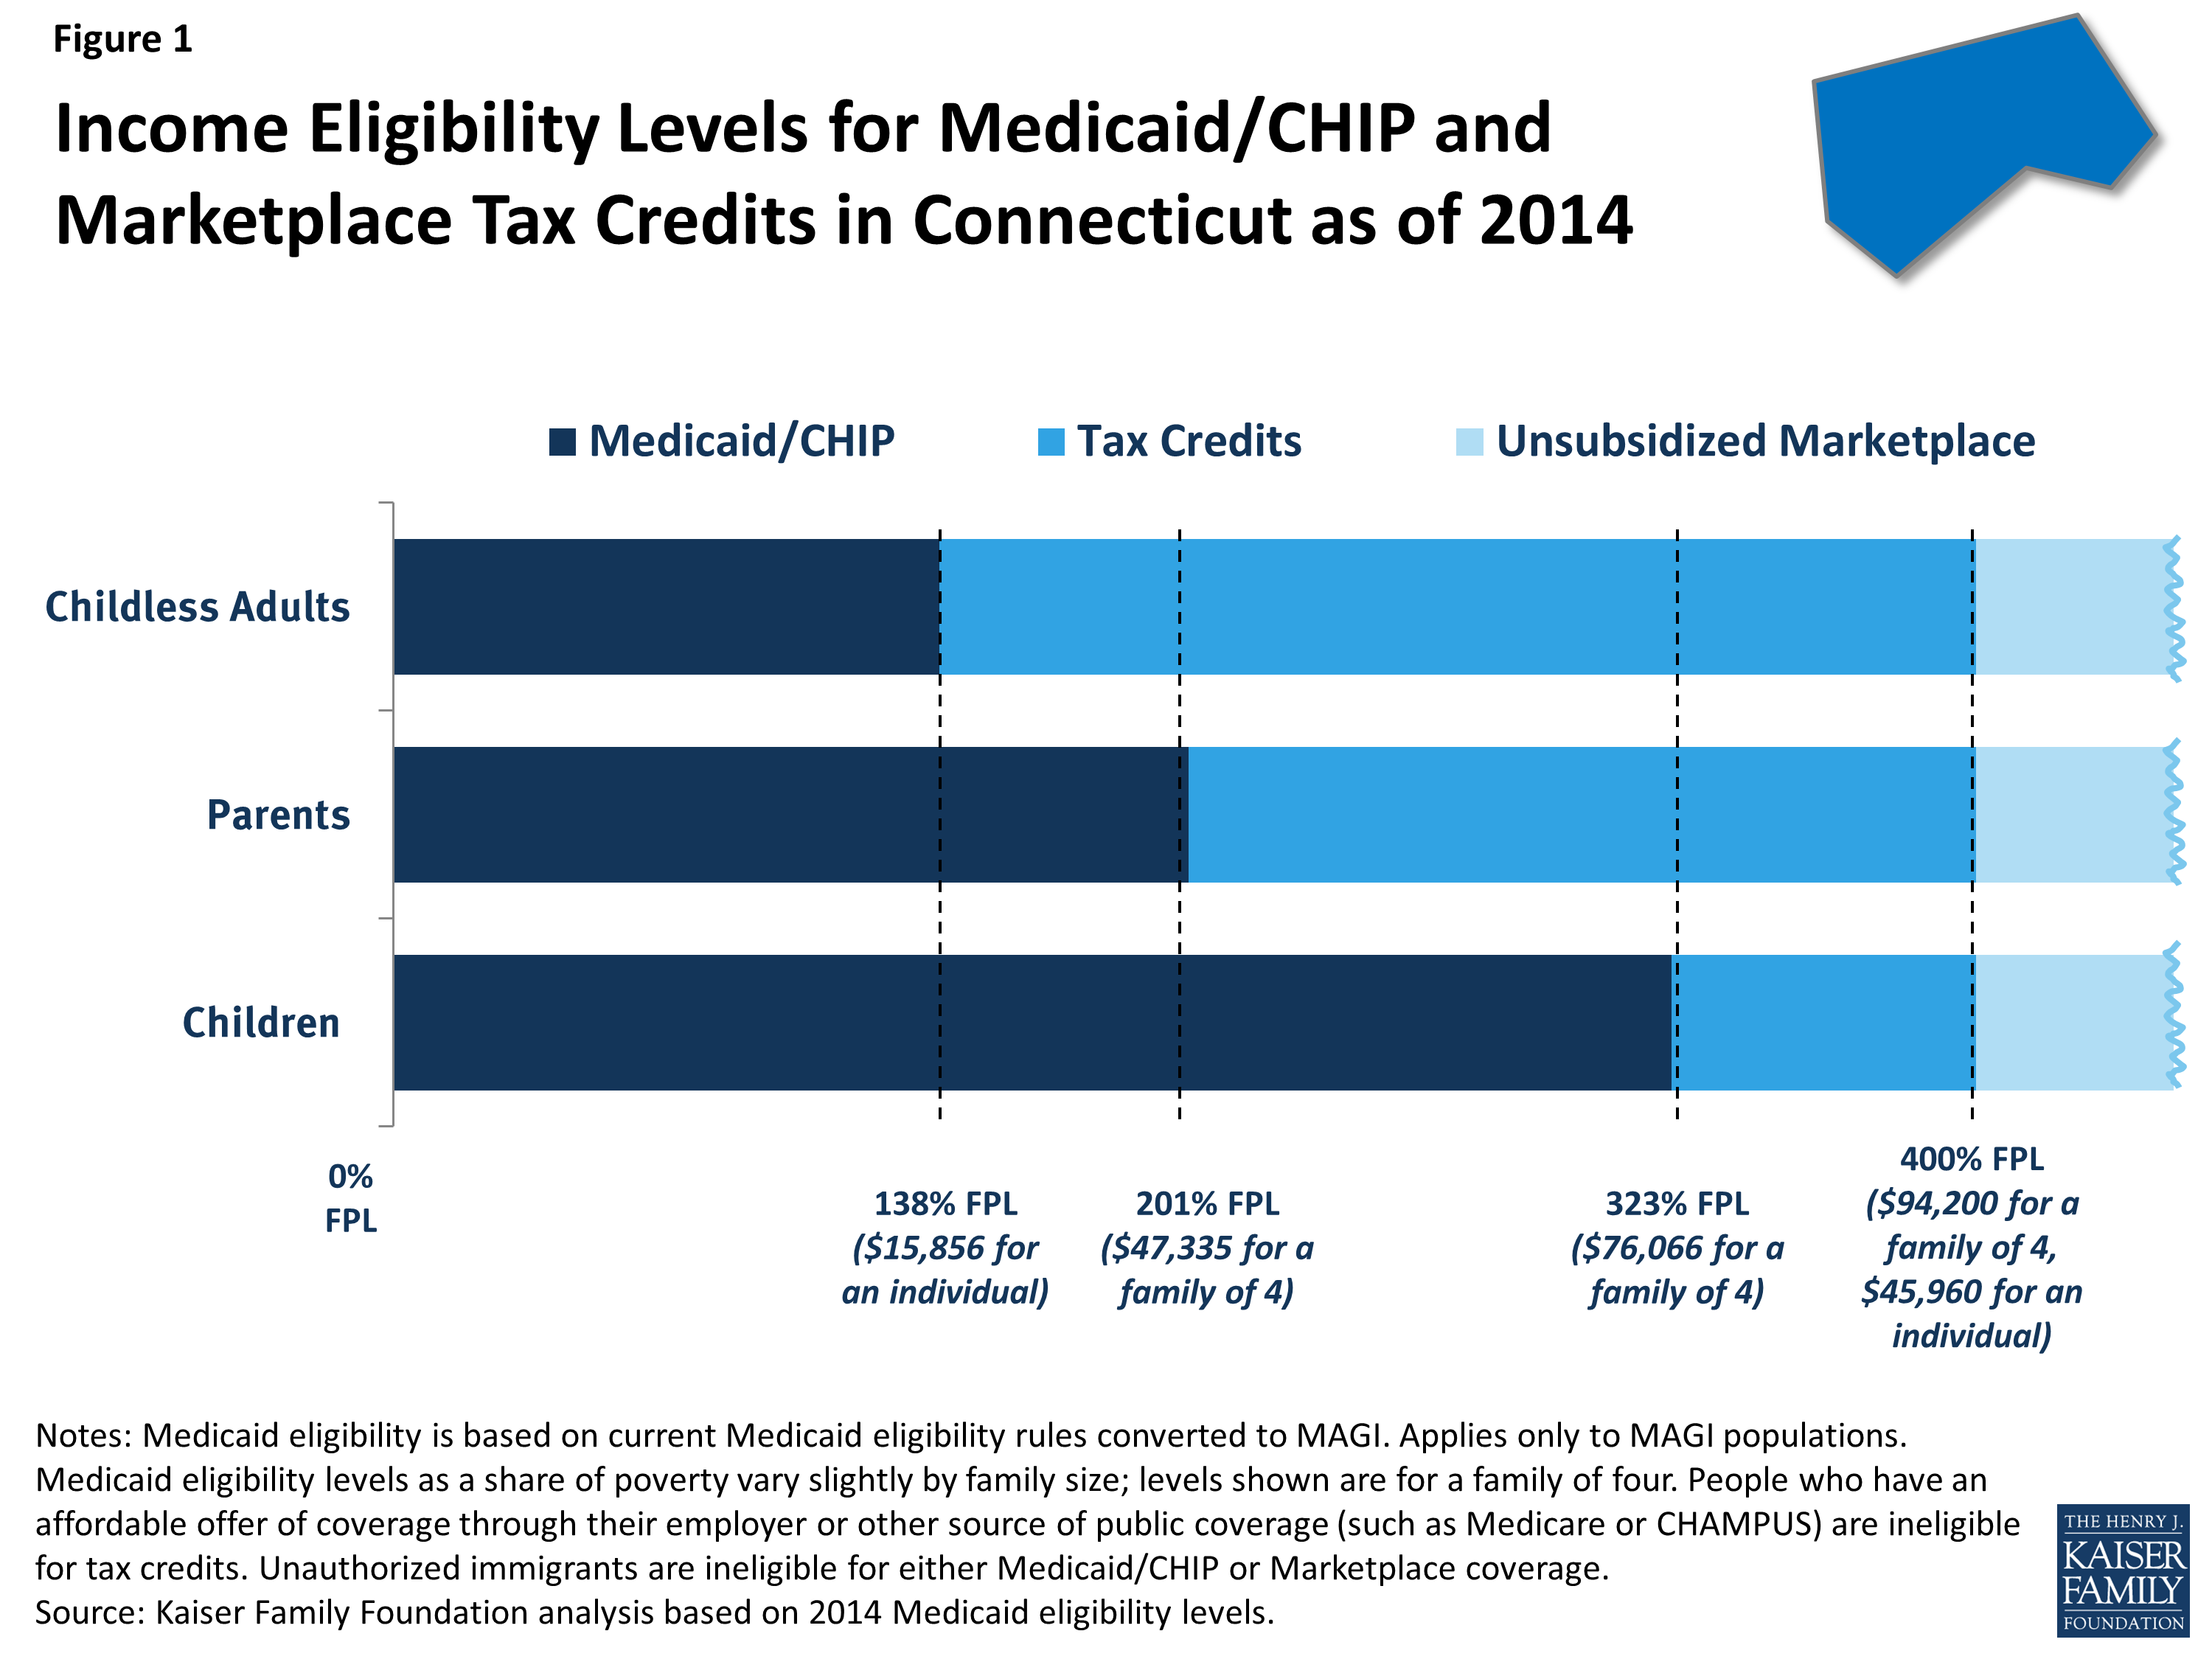
The 2010 Affordable Care Act (ACA) has the potential to extend coverage to many of the 47 million nonelderly uninsured people nationwide, including the 286,000 uninsured people from Connecticut. The ACA establishes coverage provisions across the income spectrum, with the expansion of Medicaid eligibility for adults serving as the vehicle for covering low-income individuals and premium tax credits to help people purchase insurance directly through new Health Insurance Marketplaces serving as the vehicle for covering people with moderate incomes. The June 2012 Supreme Court ruling made the Medicaid expansion optional for states, and as of December 2013, Connecticut was planning to implement the expansion in 2014. As a result, the ACA will be fully implemented in Connecticut, and almost all nonelderly uninsured, most of whom are adults, are eligible for coverage expansions. As the ACA coverage expansions are implemented and coverage changes are assessed, it is important to understand the potential scope of the law in the state.
How does the ACA Expand Health Insurance Coverage in Connecticut?
Historically, Medicaid had gaps in coverage for adults because eligibility was restricted to specific categories of low-income individuals, such as children, their parents, pregnant women, the elderly, or individuals with disabilities. In most states, adults without dependent children were ineligible for Medicaid, regardless of their income, and income limits for parents were very low—often below half the poverty level.1 However, some states, including Connecticut, had expanded coverage to parents at higher income levels or provided coverage to adults without children. The ACA aimed to fill in these gaps by extending Medicaid to nearly all nonelderly adults with incomes at or below 138% of poverty (about $32,500 for a family of four in 2013). As of January 2014, Medicaid eligibility in Connecticut covers almost all nonelderly parents up to 201% of poverty and other non-disabled adults up to 138% of poverty, as shown by the dark blue shading in Figure 1. All states previously expanded eligibility for children to higher levels than adults through Medicaid and the Children’s Health Insurance Program (CHIP), and in Connecticut, children with family incomes up to 323% of poverty (about $76,100 for a family of four) are eligible for Medicaid or CHIP. As was the case before the ACA, undocumented immigrants remain ineligible to enroll in Medicaid, and recent lawfully residing immigrants are subject to certain Medicaid eligibility restrictions.2
Under the ACA, people with incomes between 100% and 400% of poverty may be eligible for premium tax credits when they purchase coverage in a Marketplace. The amount of the tax credit is based on income and the cost of insurance, and tax credits are only available to people who are not eligible for other coverage, such as Medicaid/CHIP, Medicare, or employer coverage, and who are citizens or lawfully-present immigrants. Thus, the effective lower income limit for tax credits in Connecticut is 323% of poverty for children, 201% of poverty for parents, and 138% of poverty for other non-disabled adults, as indicated by the bright blue shading in Figure 1. Citizens and lawfully-present immigrants with incomes above 400% of poverty can purchase unsubsidized coverage through the Marketplace.
How Many Uninsured People from Connecticut Are Eligible for Assistance Under the ACA?
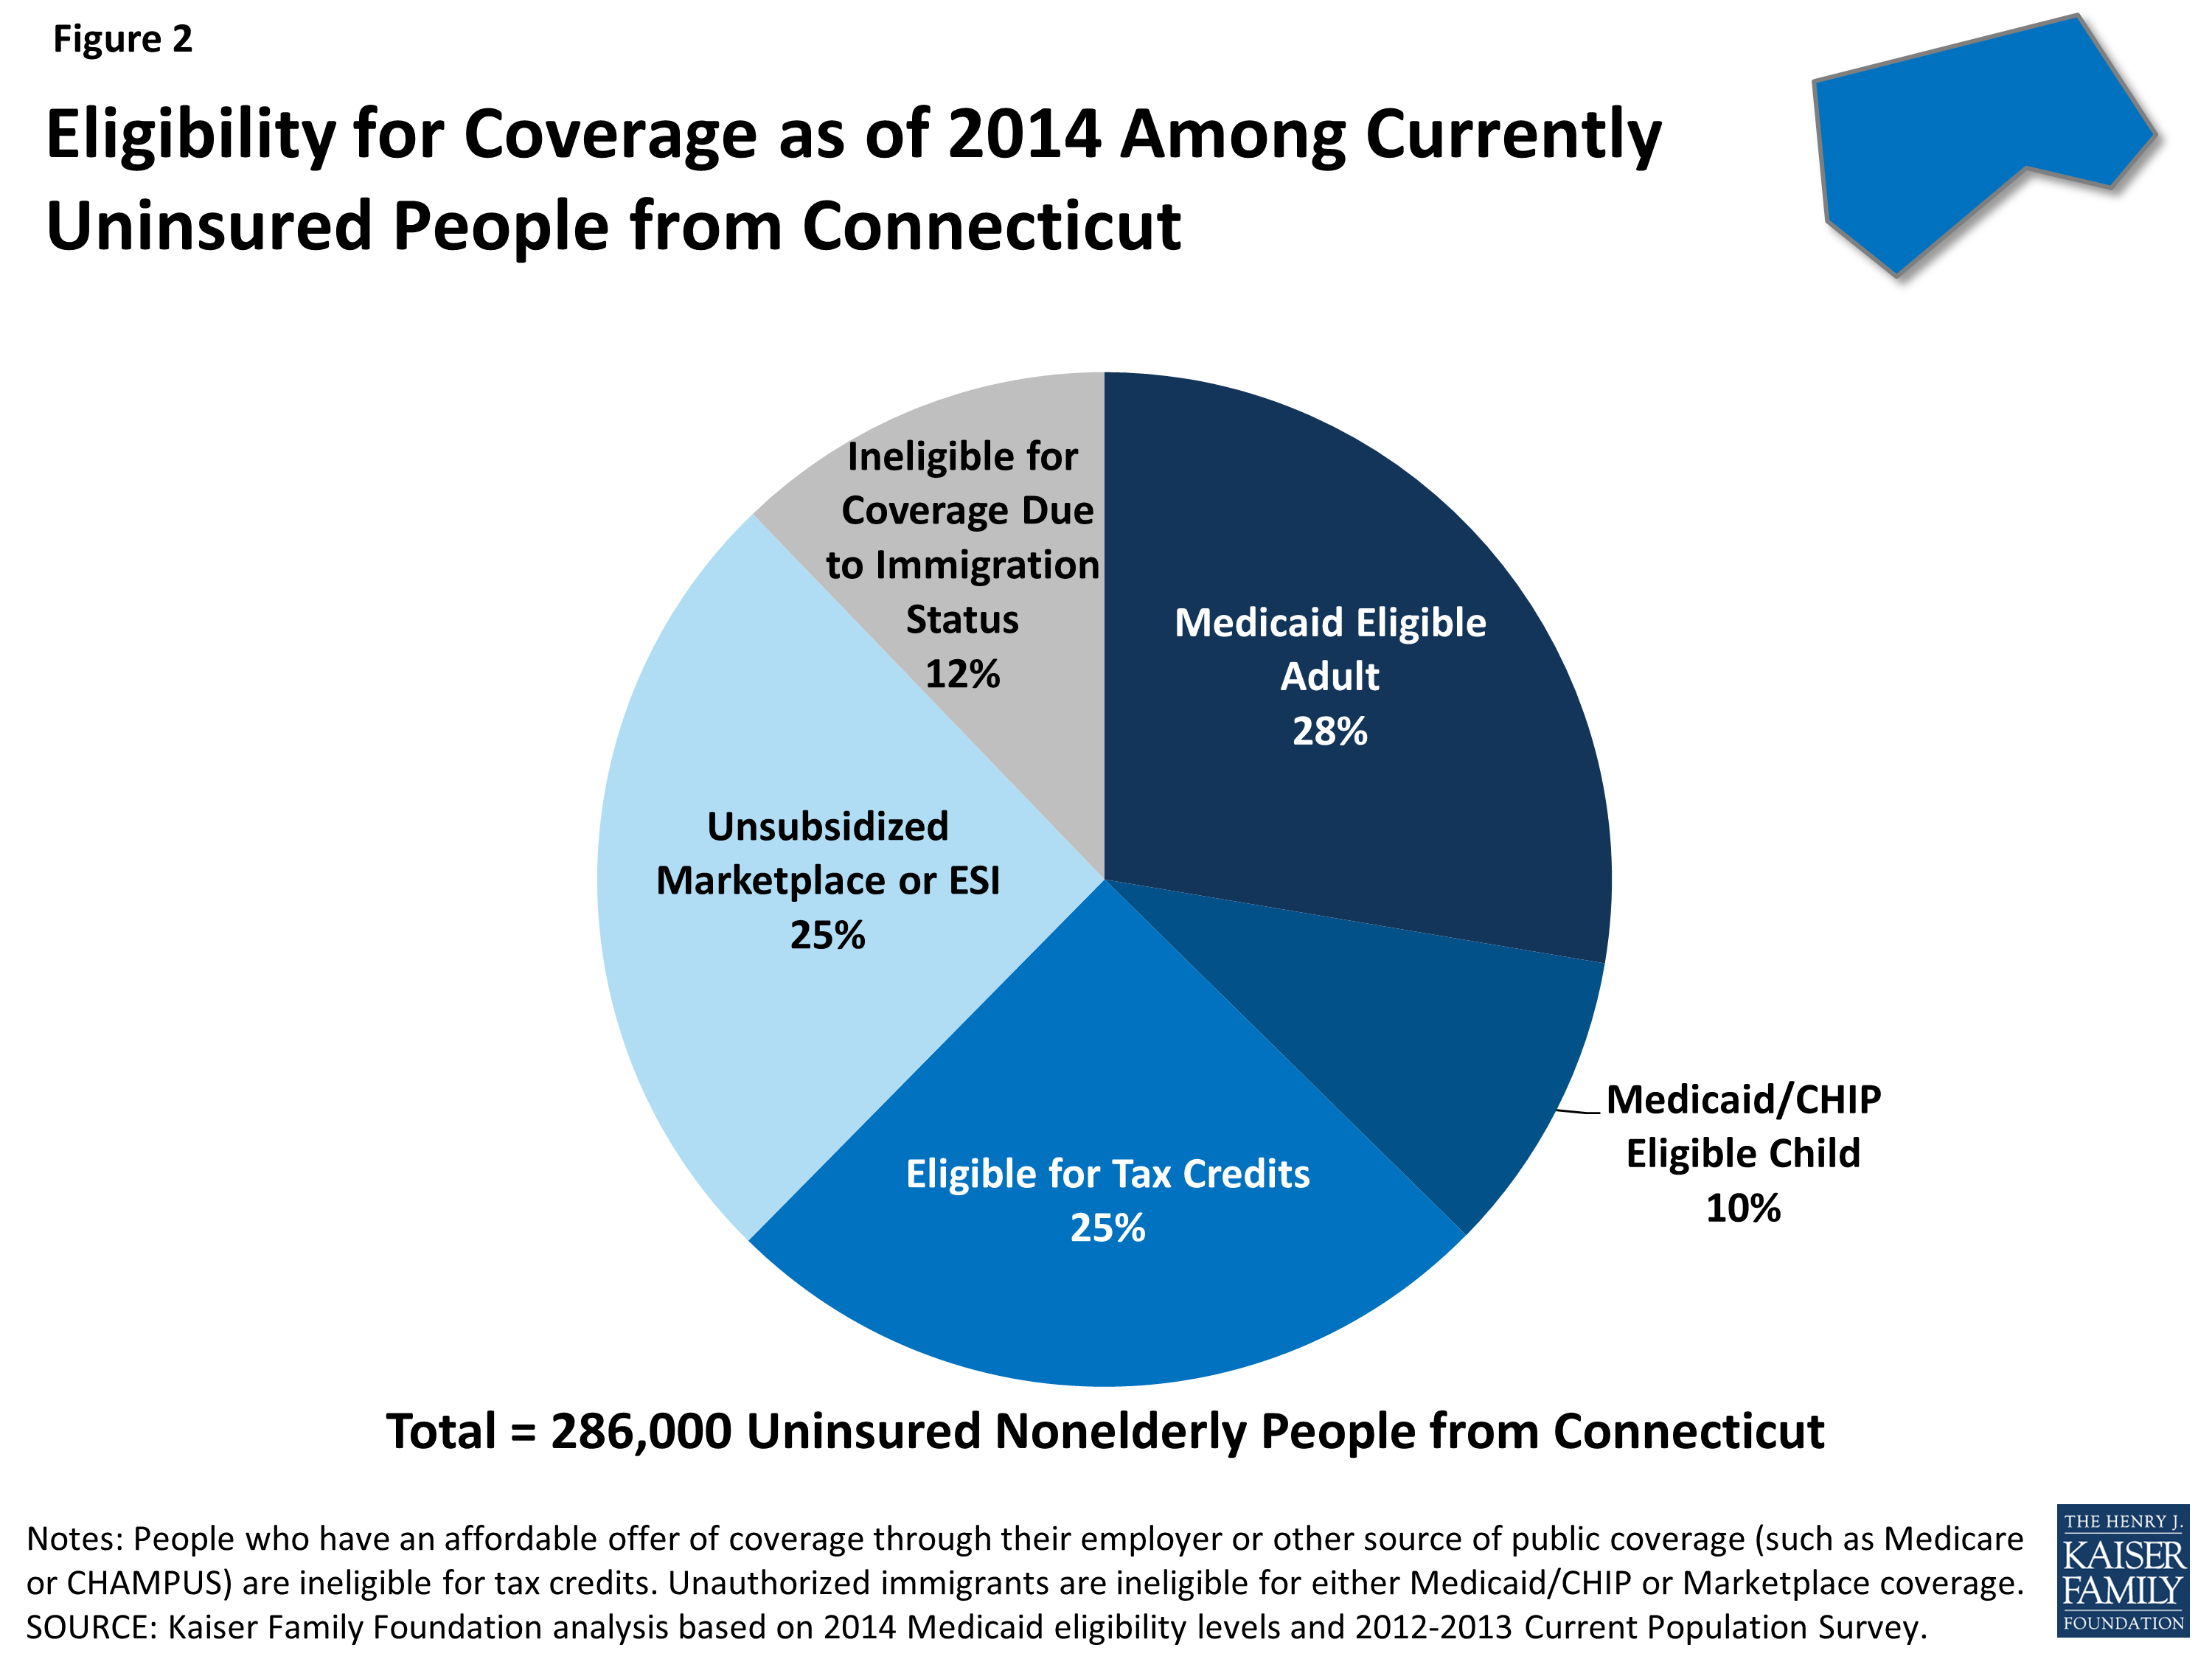
With Connecticut deciding to implement the Medicaid expansion, over six in ten (63%) uninsured nonelderly people in the state are eligible for financial assistance to gain coverage through either Medicaid or the Marketplaces (Figure 2). Given the income distribution of the uninsured in the state, the main pathway for coverage is Medicaid, with over a third (38%) of uninsured people from Connecticut eligible for either Medicaid or CHIP as of 2014. While some of these people (such as eligible children) are eligible under pathways in place before the ACA, most adults are newly-eligible through the ACA expansion. One quarter (25%) of all uninsured people in Connecticut are eligible for premium tax credits to help them purchase coverage in the Marketplace.
Other uninsured Connecticut residents may gain coverage under the ACA but will not receive direct financial assistance. These people include the 25 percent with incomes too high to be eligible for premium tax subsidies or who have an affordable offer of coverage through their employer. Some of these people are still able to purchase unsubsidized coverage in the Marketplace, which may be more affordable or more comprehensive than coverage they could obtain on their own through the individual market. Lastly, the approximately 12 percent of uninsured people in Connecticut who are undocumented immigrants are ineligible for financial assistance under the ACA and barred from purchasing coverage through the Marketplaces. This group is likely to remain uninsured, though they will still have a need for health care services.
***
The ACA will help many currently uninsured people from Connecticut gain health coverage by providing coverage options across the income spectrum for low and moderate-income people. While almost all of the uninsured in Connecticut are eligible for some type of coverage under the ACA, the impact of the ACA will depend on take-up of coverage among the eligible uninsured, and outreach and enrollment efforts will be an important factor in decreasing the uninsured rate. The ACA includes a requirement that most individuals obtain health coverage, but some people (such as the lowest income or those without an affordable option) are exempt and others may still remain uninsured. There is no deadline for enrolling in Medicaid coverage under the ACA, and open enrollment in the Marketplaces continues through March 2014. Continued attention to who gains coverage as the ACA is fully implemented and who is excluded from its reach—as well as whether and how their health needs are being met—can help inform decisions about the future of health coverage in Connecticut.
The implementation of the Affordable Care Act (ACA) has focused attention on the composition of the nongroup market: how it looked before the new regulatory provisions take effect and how it will change afterwards. One basic question has been how many people are covered in the nongroup market. There are several ways of answering this question, depending on the time period for measuring enrollment and the information source. There is substantial turnover among people with nongroup coverage, which means that the number of people covered at the beginning of a year (or at any other point in time) is quite different than the number of people who keep that coverage throughout the whole year.
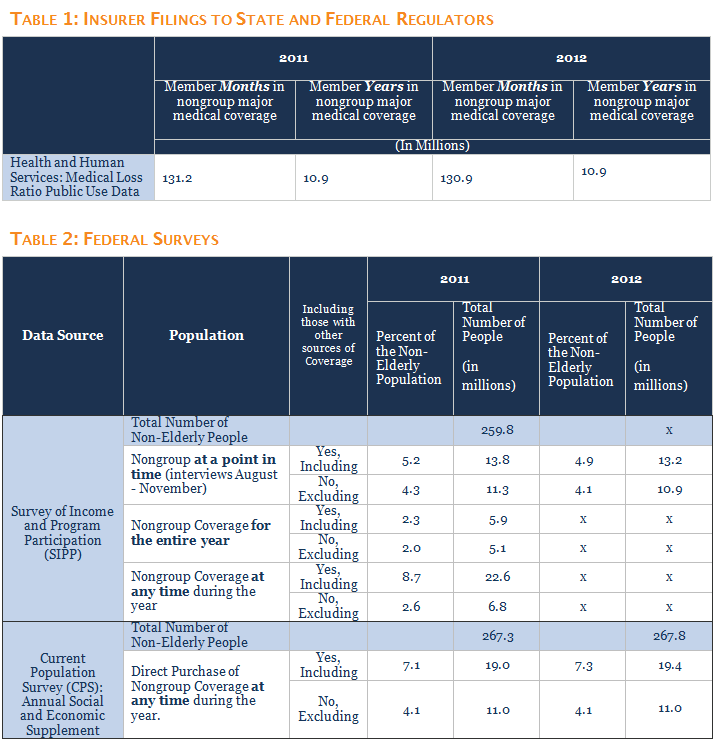
Administrative data from regulatory filings by insurers can be used to count the number of months of nongroup enrollment for a year.1 In 2011 and 2012, there were about 131 million covered months of enrollment in nongroup major medical coverage,2 which translates into about 10.9 million full years of nongroup coverage (Table 1).3 This “member year” number gives us a good estimate of the number of people who have nongroup coverage in an average month, but does not tell us about the types of people who had coverage or for how long they kept it. These questions can be better answered using survey data.
This brief discusses coverage estimates from two national surveys often used to analyze health coverage: the Survey of Income and Program Participation (SIPP) and the Annual Social and Economic Supplement of the Current Population Survey (ASEC). SIPP is a good source of information because it is a large survey, follows respondents over a period of time, and collects coverage information for each month of the year. The ASEC also is a large survey and has the advantage in that it can support coverage estimates at the state level. Our discussion uses data for 2011 because some estimates in SIPP are not available for 2012. All of the estimates discussed in the text are shown in Table 2, which also includes estimates for 2012 where available.
Survey of Income and Program Participation
The Survey of Income and Program Participation (SIPP) interviews a panel of respondents three times each year for several years (the panels vary in duration) and collects coverage information for each month of each year that a respondent participates in the survey. The 2008 panel started with more than 40,000 eligible households. Respondents with insurance coverage are asked about their insurance coverage for each month of the year. SIPP also collects detailed income, employment and demographic information (similar to the ASEC) that can be used to analyze the circumstances of people and families with different types of coverage. Unfortunately, although it has a large national sample, it does not support coverage or other estimates at the state level.
SIPP enables analysis of several different questions about the nongroup market for any year, such as: how many people have nongroup coverage at any particular point in time during a year (e.g., in January or some other month); how many people had nongroup coverage at any time during a year (i.e., the total number of people with at least one month of nongroup coverage), and how many people have nongroup coverage for each month during the year. Longer periods also can be analyzed, although response rates diminish over time and statistical techniques need to be used to correct for loss of participants.
Particularly important for the nongroup market, where there is considerable turnover and where people use the market for different purposes, is that SIPP allows analysis of coverage duration: how long do people stay with nongroup coverage once they have it? People who rely on the nongroup market for long periods of time, such as the self-employed, may have different needs and different resources than people who use nongroup coverage for short periods, such as those who purchase coverage when they are between jobs. The monthly approach in SIPP also allows analysis of people who report multiple types of coverage during a year: did they have more than one coverage type at the same time or did they have different types of coverage at different times of the year? 4
Beginning with a point-in-time estimate, we use SIPP to look at the coverage reported by respondents in the month prior to their Fall 2011 interview (the last year for which calendar-year weights are available for SIPP) and find that about 13.8 million people had nongroup coverage at that time.5 Of these, 11.3 million had nongroup coverage and no other type of coverage, which is likely the best answer to the question of how many people rely on the nongroup market at any given time. An additional 2.5 million people had nongroup coverage and some other type of coverage during the same month. In some cases those people may have been in the midst of a transition, or the nongroup coverage they are reporting may be supplemental insurance rather than comprehensive major medical coverage.
Looking at coverage over a whole the year, about 22.6 million nonelderly people had nongroup coverage in at least one month during 2011. Of these, 6.8 million people had nongroup coverage as their only type of coverage (other than being uninsured) during 2011, including about 5.1 million people who had nongroup coverage (and no other type of coverage) in all 12 months of 2011.
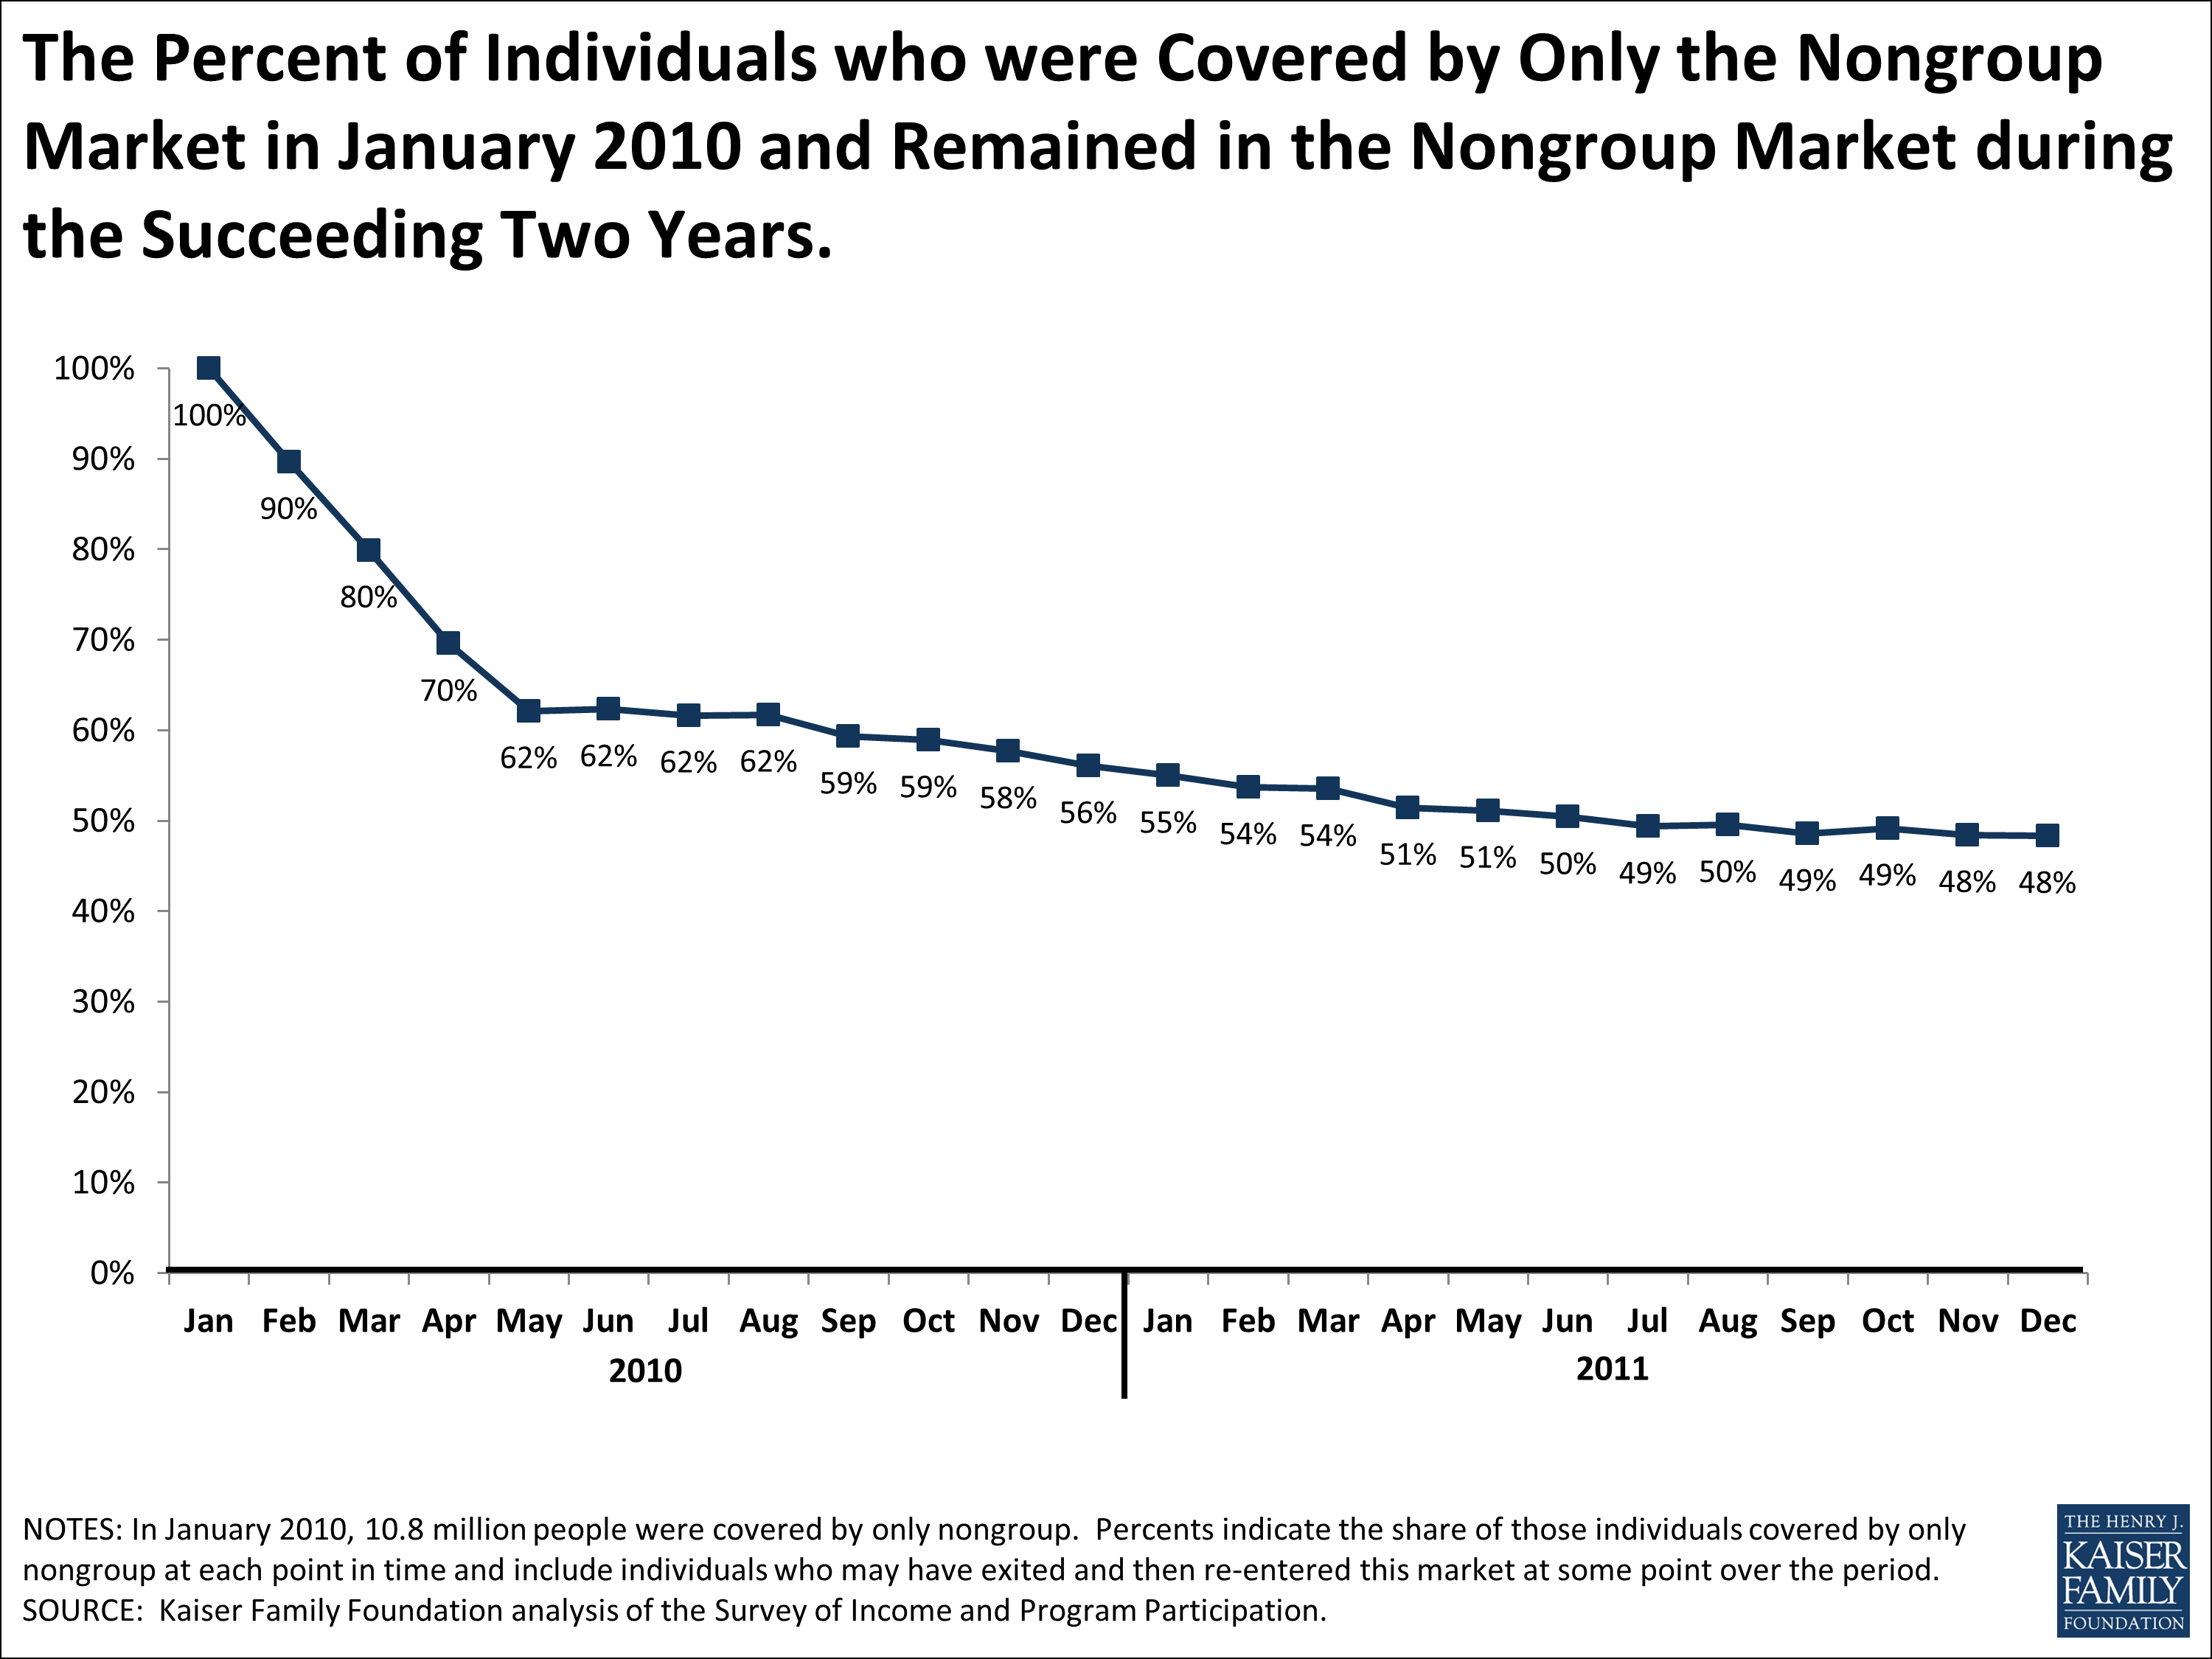
We also can use SIPP to look at how long people who have nongroup coverage keep it. One way of doing this is to look at people who had nongroup coverage at the beginning of a period and then see what percentage report having nongroup coverage at later points in time. As shown in the chart above, if we start with people who had only nongroup coverage in January, 2010, 62% still had only nongroup coverage in July, 2010, 56% still had only nongroup coverage in December, 2010, and 48% had nongroup coverage only in December, 2011. The percentages are almost identical if we look at people who had nongroup plus other coverage types and follow them over the same period. These percentages fall, however, if we look only at people who are continuously covered by nongroup coverage (e.g., they are covered by nongroup coverage for every month across the periods considered). Starting again with people reporting nongroup coverage only in January, 2010, 56% were continuously covered by nongroup coverage through July, 2010, 44% were continuously covered by nongroup coverage through December, 2010, and 31% were continuously covered through December, 2011.
One of the difficulties in using surveys to analyze coverage is that they do not always capture enough information to categorize the coverage reported. In SIPP for 2011, about 8.8 million nonelderly people had coverage identified as “other” at some point during the year, and, of this group, 1.1 million have no other source of coverage during the entire year. If we look at a point in time, about 3.9 million nonelderly people had “other” coverage in the Fall of 2011, with about 2.4 million of them having no other type of coverage. The majority of the 3.9 million people with “other” coverage is young (78 percent are under age 27) and about half (51 percent) say that they are covered by someone outside of the household. This pattern is similar to what we see in the ASEC, discussed below: there are a number of younger people covered as dependents where there is no information to determine the type of coverage that it is. It seems likely that most of these people are dependents under employer-based coverage, because that is the largest source of coverage for families, but some are likely dependents under TRICARE or nongroup policies.6 We do not know how many of these people with “other” coverage have nongroup policies, but to the extent that they do the estimates above are somewhat lower than they should be.
Current Population Survey
The ASEC is the survey that many analysts use for basic estimates of insurance coverage. The Foundation bases many of its estimates on the ASEC, including the basic coverage statistics published in State Health Facts and our primer on the uninsured. The ASEC provides socioeconomic and demographic information of the non-institutionalized American population. The Census Bureau and the Bureau of Labor Statistics administer ASEC as a supplement of the Current Population Survey.7 It is conducted every March and asked of over 60,000 households.
The ASEC is widely used because it is timely, supports both national and state-level estimates, and provides detailed information on insurance coverage, income, employment, and other personal characteristics. The health coverage questions on the ASEC ask about enrollment in public and private types of coverage, the source of coverage (e.g, through an employer or purchased directly), and whether individuals are covered in their own name or as a dependent on someone else’s policy. There is some disagreement among analysts about the time period over which coverage is being measured. The questions ask about having each type of coverage at any time during the year, but many analysts treat the estimates as reflecting the number of people enrolled in a coverage type on any given day during the year (i.e., a point-in-time estimate).8
Estimated from the ASEC, about 19 million nonelderly people were covered by a plan purchased directly from an insurer in 2011. This is the source of the higher range of estimates for the size of the nongroup market that is sometimes cited. However, about 8 million of these people also have other types of coverage as well during the year, primarily coverage from a current or former employer, from Medicaid, or from another government program. In some cases a person may have different types of coverage at different times in the year and in others a person may have more than one type of coverage at the same time. The number of nonelderly people who report having coverage purchased directly from an insurer as their only source of coverage is about 11 million in 2011. This is similar to the SIPP estimate of 11.3 million people with nongroup coverage only in the Fall of 2011.
In addition to those who report direct coverage from an insurer, a number of respondents in the ASEC report that they are covered through someone who lives outside of their household. As with SIPP, the ASEC does not ascertain whether this coverage is provided through an employer, a military program such as TRICARE, or a policy purchased directly from an insurer. About 8.4 million nonelderly people are covered by someone outside of their household in 2011, and for 5.8 million it is the only source of coverage reported in the survey. The vast majority of people with only coverage provided outside of the household are young (86 percent were below the age of 27 in 2011). While most of this coverage is likely dependent coverage under employer-based plans, some of it is nongroup coverage, and to the extent that it is, the estimates above of nongroup coverage are somewhat lower than they should be. The Foundation previously has treated a portion of this coverage as “other private” and included them in the nongroup category in some publications, which likely overstated the number of people with nongroup coverage alone.9
One of the limitations of the ASEC is that it does not address coverage dynamics. Respondents are asked if they had different types of coverage in the past year, but the survey does not collect information about how long people keep each type of coverage that they report or whether they had them at the same time or at different times during the year. Without this information, it is difficult to assess how much respondents depend on each type of coverage that they report. This is one reason why using SIPP may provide a fuller picture of the nongroup market for national estimates.
Discussion
The pre-reform nongroup market is complicated. It was fairly small, serving less than 5 percent of the nonelderly population, with a much smaller population relying on the nongroup market as their only source of coverage. In addition, the nongroup market experiences substantial turnover. There is a large group of purchasers with short stays and another group who rely on the market for longer periods of time. This makes sense because the nongroup market really serves several purposes. Most people with coverage get it through the employer-based system or through public coverage because both receive large federal and state subsidies and are stable sources of coverage. The nongroup market has to fit in around the edges of these other sources of coverage and largely has served the various groups of people who do not qualify for them for one reason or another (e.g., the self-employed, workers or unemployed people without an offer of employer-sponsored coverage, and early retirees not yet eligible for Medicare).The turnover in, and varied populations served by, the pre-reform nongroup market have posed challenges for analysts and others trying to understand the changes occurring under the ACA. The number of people who have and keep nongroup coverage as their primary source of protection is considerably smaller than the number of people in the market at any given point in time. A considerably larger number of people have nongroup coverage sometime during a year, but many have short tenures and may or may not experience any of the changes underway.
Looking forward, the size of the market is predicted to grow dramatically as millions of uninsured people, many assisted by new premium tax credits, obtain and retain nongroup coverage. By 2016, CBO estimates that about 18 million additional people will have nongroup coverage.10 The financial assistance, plus the new requirement that people have coverage or pay a penalty, will likely lengthen the average time that people stay in this market. However, the market will also continue to serve people between jobs or in transitions, so some turnover will continue as people move into and out of employer-based or public coverage.
The Medical Loss Ratio (MLR) provision of the Affordable Care Act requires health insurance issuers to publicly report certain financial and enrollment figures each year. Health and Human Services (HHS) makes these MLR data publicly available for years dating back to 2011. Insurers operating in the nongroup market (and similarly in the small and large group markets) must report enrollment in terms of covered lives, member months, and life-years. The number of covered lives represents the total number of people insured under the plan (including dependents) on the last day of the reporting period. As this is a point-in-time measurement, the number of covered lives does not necessarily reflect enrollment changes throughout the year. The number of member months is the number of people insured (including dependents) on a certain day of each month in the reporting year. By dividing members months by twelve, insurers arrive at the number of life-years. Life-years (also called member years) is a measure of average monthly enrollment and therefore accounts for changes in enrollment throughout the year. ↩︎
The calculation is enrollment months divided by 12. ↩︎
Our analysis of the Survey of Income and Program Participation entailed three separate weighting methodologies: point-in-time weights included with every interview microdata file; 2011 calendar-year weights; 2009-2011 three-year panel weights. These three weighting techniques follow the recommendations by the Census Bureau and allow for generalizations to the noninstitutionalized population of the United States over the varying periods of time mentioned in the text, figure, and table. ↩︎
SIPP interviews the individuals within each household on a four-month rotating basis. Although these estimates were derived from responses collected across four months during the Fall of 2011 (2008 Panel, Wave 10), since each respondent only had one interview in that period, the results are analytically very similar to cross-sectional data. The US Census Bureau commonly employs this strategy to minimize any possible recall bias. Using the cross-sectional weights to look only at the month of September, the 13.8 million we presented in the text would not change. ↩︎
Coverage from outside of the household is likely private coverage because eligibility for public programs is determined for each person and not on a family basis. ↩︎
The Bureau of Labor Statistics. Labor Force Statistics from the Current Population Survey. ↩︎
See for example, Kenney, Genevieve, John Holahan, and Len Nichols. “Toward a More Reliable Federal Survey for Tracking Health Insurance Coverage and Access.” Health Services Research 41.3p1 (2006): 918-45. Print.
Klerman, Jacob, Michael Davern, Kathleen Call, Victoria Lynch, and Jeanne Ringel. “Understanding The Current Population Survey’s Insurance Estimates And The Medicaid ‘Undercount’.” Health Affairs 28.6 (2009): n. pag. Web.
Short, Pamela. Counting and Characterizing The Uninsured. Economic Research Initiative on the Uninsured. University of Michigan, n.d. Web. ↩︎
In prior publications, people with coverage from outside of the household and no other type of coverage were split into two categories: those under age 15 were treated as having employer-sponsored coverage and those age 15 and older were treated as having other private or nongroup coverage. ↩︎
Congressional Budget Office. CBO’s May 2013 Estimate of the Effects of the Affordable Care Act on Health Insurance Coverage. N.p., n.d. Web. 3 Dec. 2013. . The baseline estimates 22 million new enrollees in insurance exchanges, with a 4 million person reduction in nongroup and other. ↩︎
Community health centers are a key source of primary care in medically underserved areas, and their role is expected to grow as coverage expands under the ACA. To sharpen understanding of the health center patient population, this brief compares the characteristics of health center patients and the low-income population overall, using data from the Health Center Patient Survey and the National Health Interview Survey. Health center patients are poorer, more racially and ethnically diverse, and more likely to be uninsured. They also report worse health status. Health center patients fare at least as well as low-income people overall on important measures of preventive care and care management. Findings on receipt of cancer care and selected chronic care services may reflect health center difficulties securing specialist referrals for patients. This pre-ACA profile of health center patients sets the stage for measuring change in the coming years and highlights important health center-related implications of states’ Medicaid expansion decisions.
Section:
0/0
Community health centers are a key source of comprehensive primary care in medically underserved communities across the country, and their role is expected to grow as health coverage expands under the Affordable Care Act (ACA). To sharpen understanding of the health center patient population, this brief compares it to the overall low-income population, using data from the Health Center Patient Survey and the National Health Interview Survey, respectively. The pre-ACA profile of health center patients that emerges sets the stage for measuring change following implementation of the reform law and can inform health center policy, planning, and assessment moving forward.
Key Findings
Compared to the low-income population overall, health center patients are more disadvantaged. Health center patients are poorer, more racially and ethnically diverse, and more likely to be unemployed and uninsured than the broader low-income population.
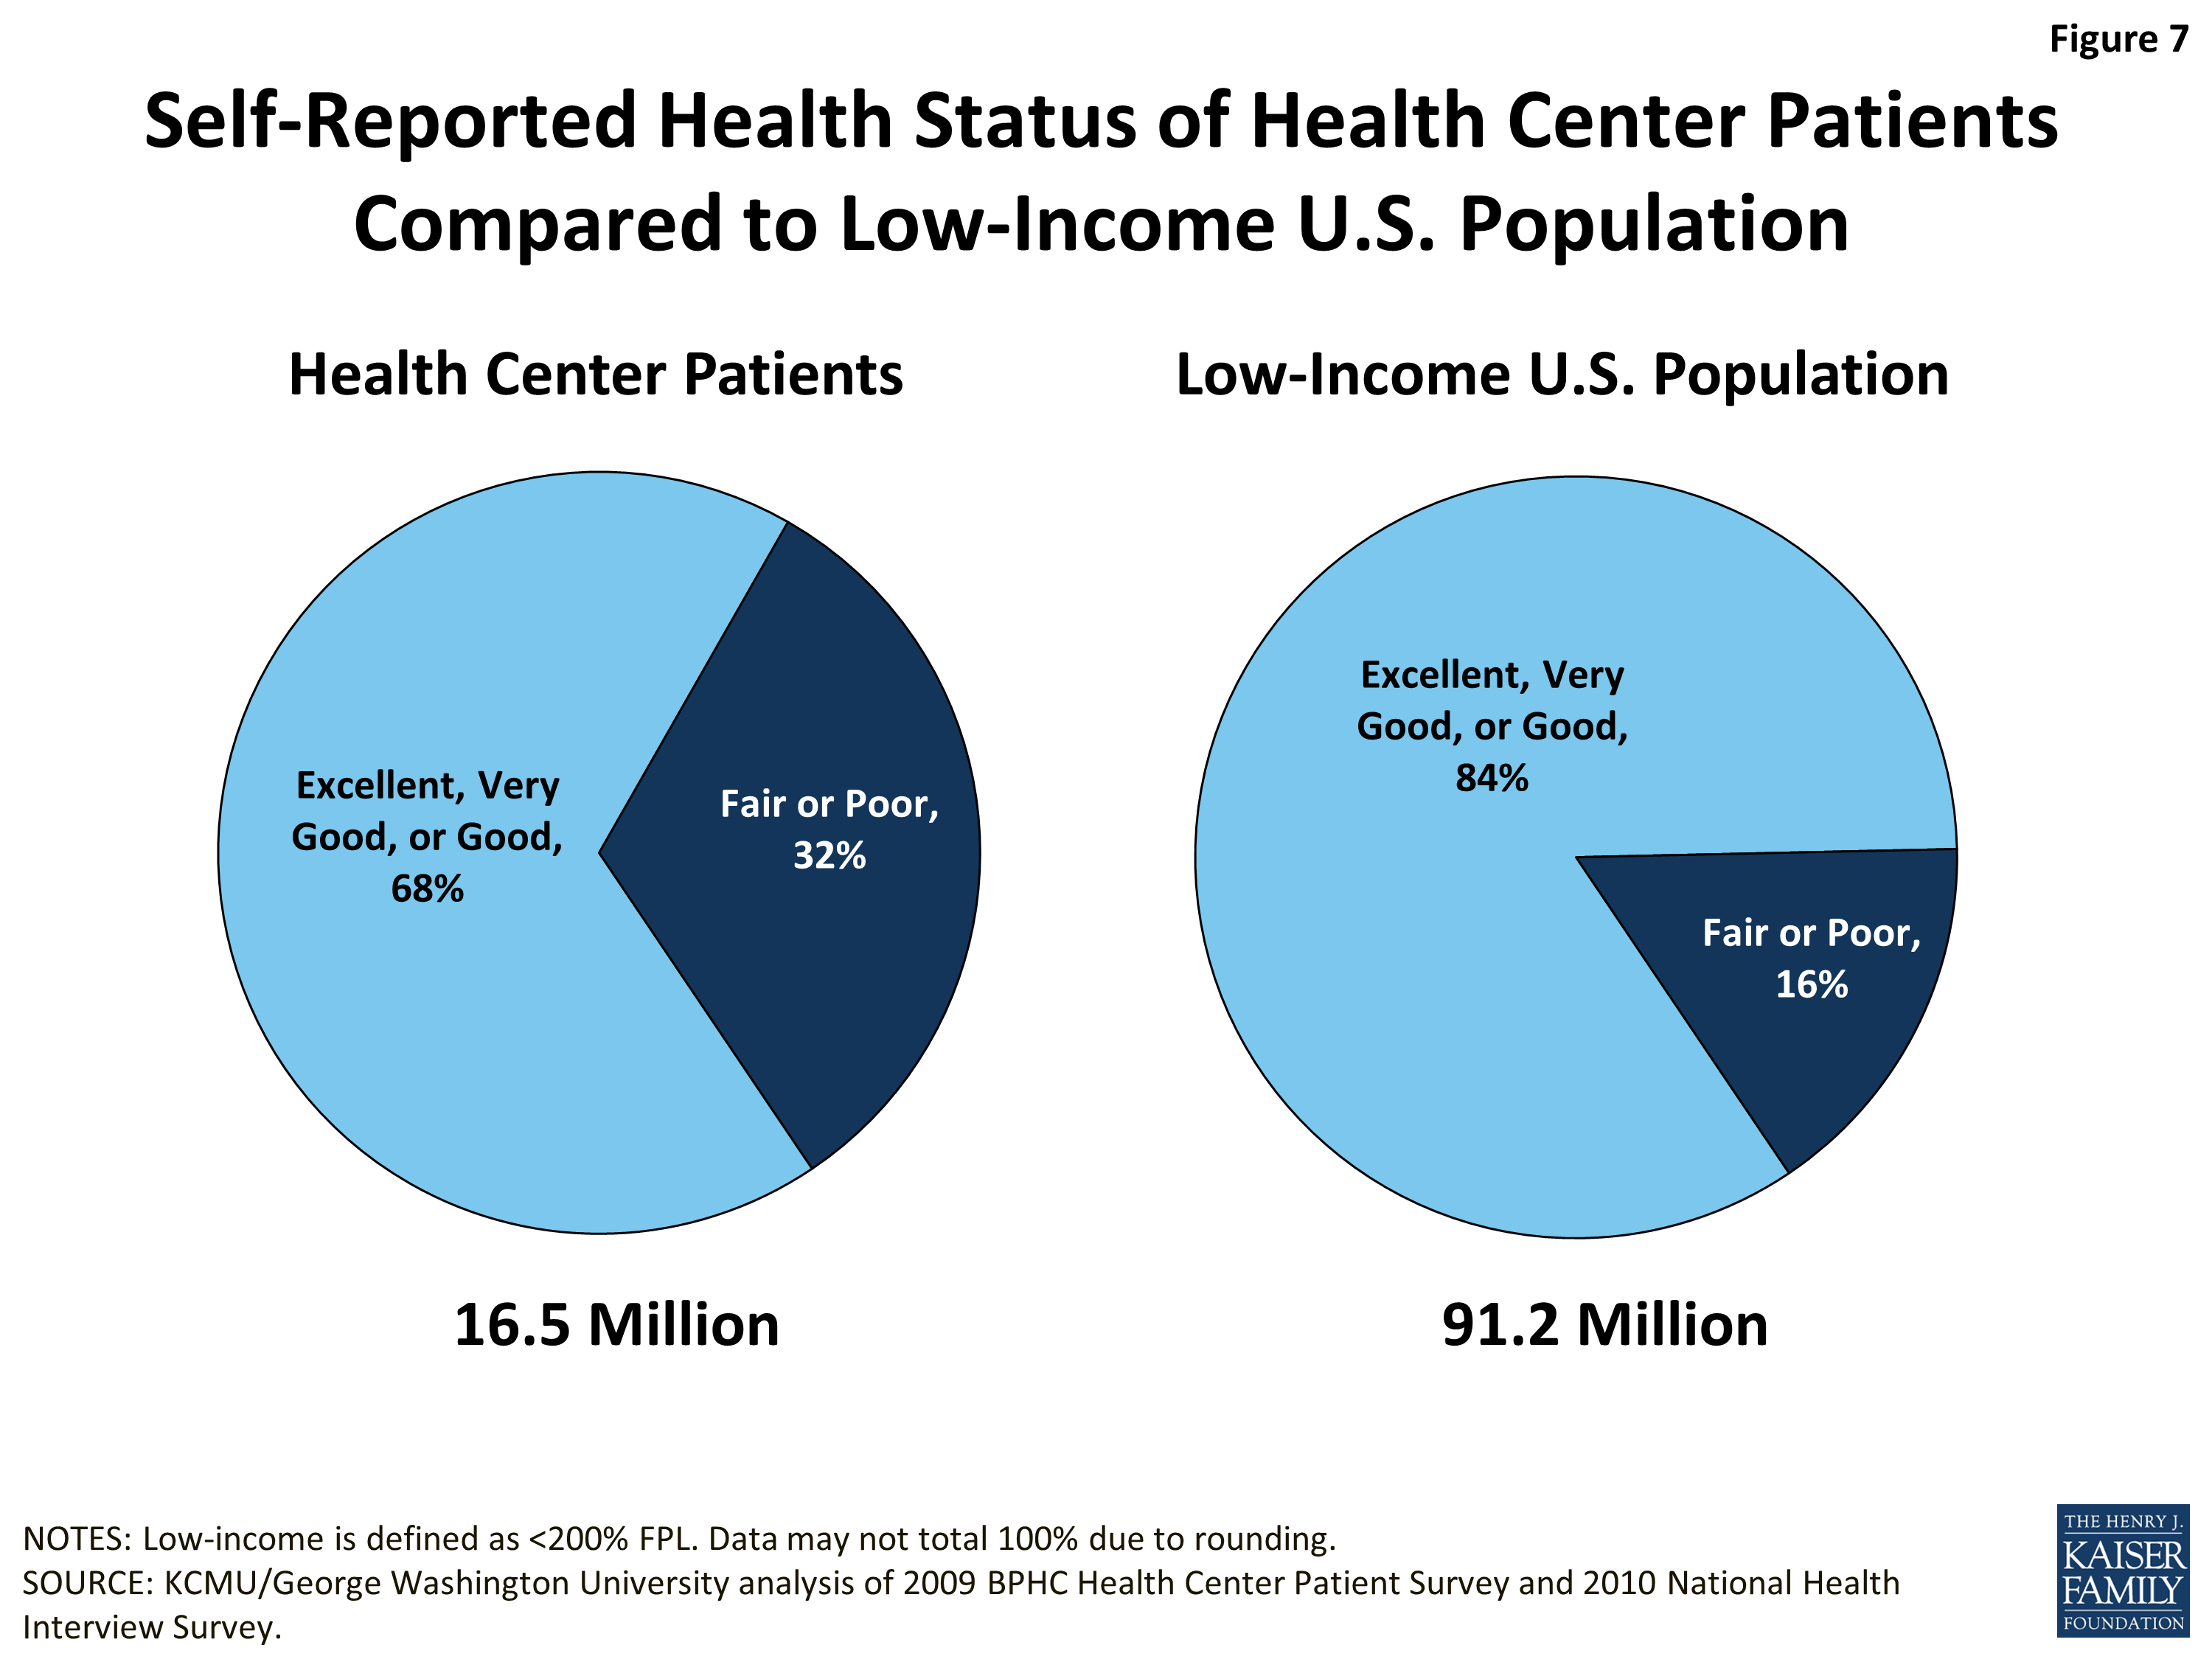
Health center patients are twice as likely as low-income people overall to report being in only fair or poor health – 32% compared to 16%. The disparity in self-reported health status is apparent not only in the aggregate, but also within different insurance categories. For example, among both Medicaid beneficiaries and the uninsured, 1 in 3 health center patients report being in fair or poor health, compared to about 1 in 7 low-income individuals generally. These findings point to health centers as a locus of care for a largely low-income population with substantial health burdens.
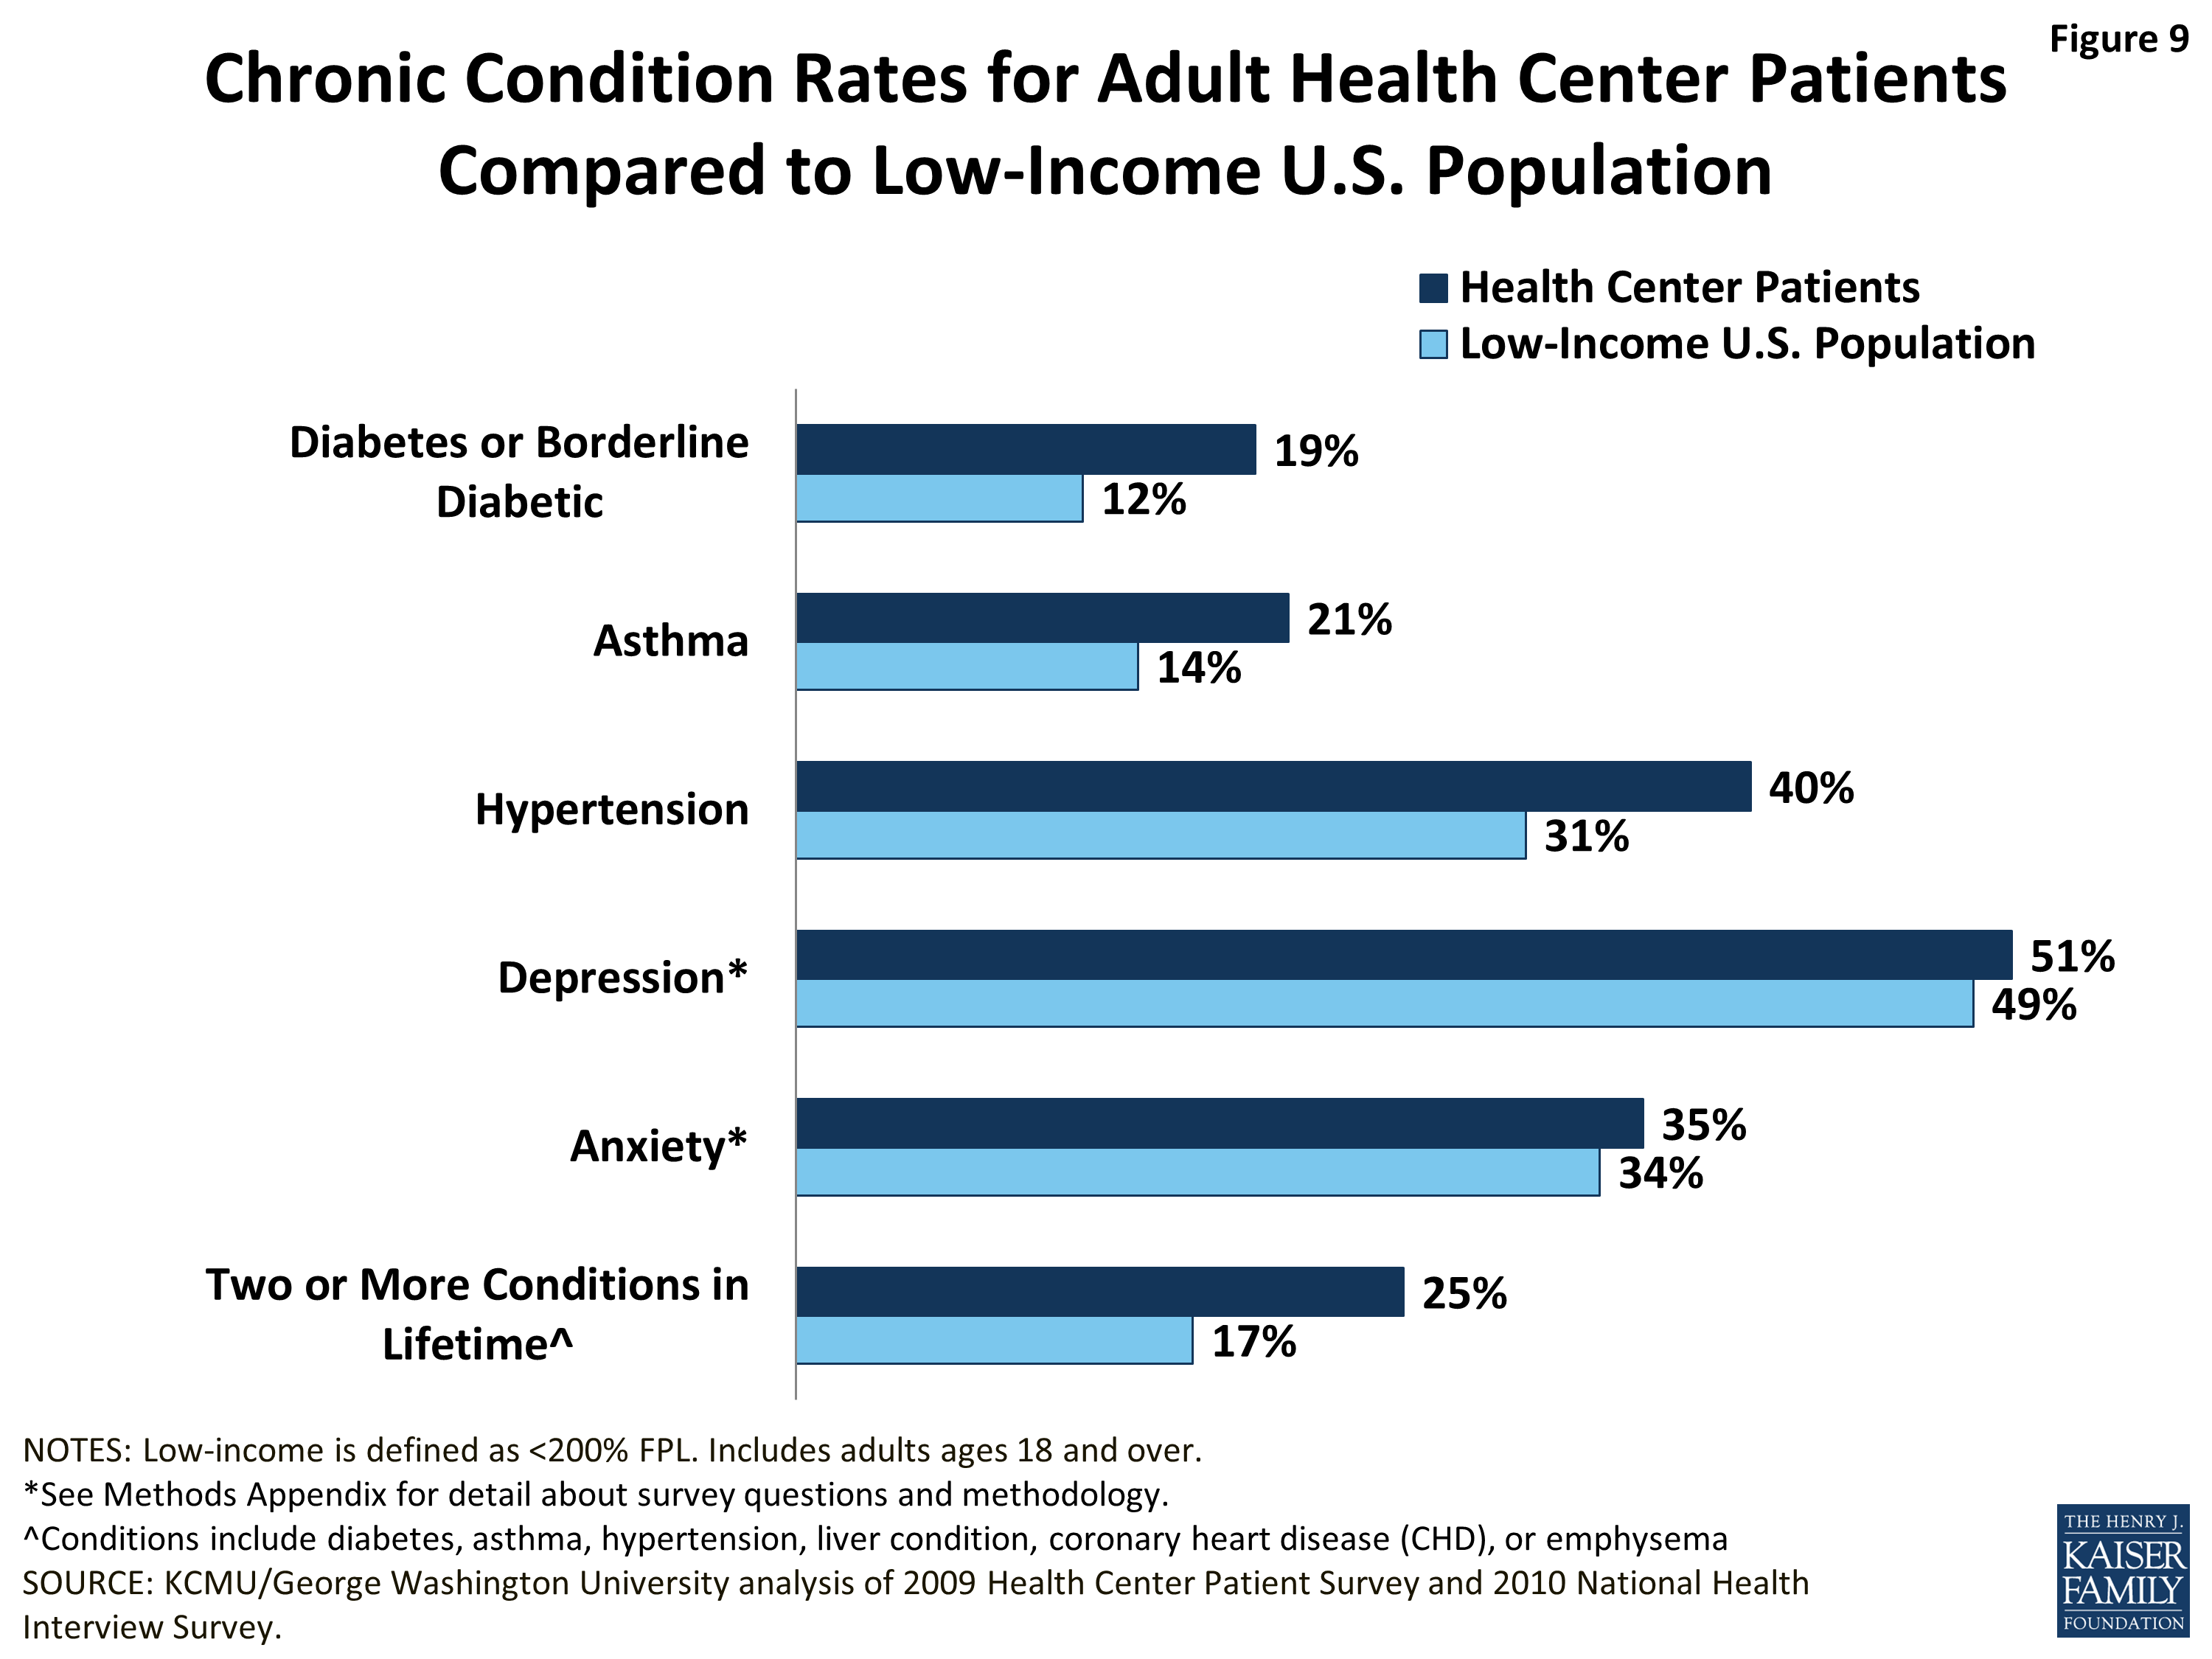
Rates of chronic conditions are higher among the health center patient population. Adult health center patients report having diabetes and asthma at rates 50% higher than the rates among all low-income adults. Their self-reported rate of hypertension is also higher.
On key measures of preventive care and care management, health center patients fare as well as or better than the low-income population in general. Children who are health center patients are more likely than all low-income children to have received a check-up and a dental visit in the past year. Cancer screening rates are roughly similar between adult health center patients and all low-income adults, and adult health center patients with chronic diseases are at least as likely to receive chronic care services. However, mixed findings on cancer care and low rates of chronic care receipt point to health center difficulties in securing access to specialist care for patients.
Conclusion
Expanded coverage under the ACA promises health centers new revenues to expand and improve care, and newly insured patients stand to gain greater access to specialists as they join health plans with broader provider networks. In states that do not expand Medicaid, health centers and some 1 million uninsured health center patients will miss out on these improvements. Even as coverage expands, health centers will continue to serve many uninsured people and provide services not covered by insurance. Ongoing grant funding is needed to meet these costs. With expected changes in the health center population as many uninsured adults gain coverage, health centers may begin to strengthen their capacity to manage serious and chronic conditions and to enhance their adult preventive services to keep adults healthy and active.
Issue Brief: Introduction
Community health centers play a central role in ensuring access to care in medically underserved communities across the country. Typically, they are located in low-income areas that are lacking in other health care resources. In 2011, over 1,100 federally funded health centers operating in about 8,500 urban and rural locations across the United States served more than 20 million patients. Health centers provide comprehensive primary medical care, often including behavioral health services and dental care, and provide support services such as translation, transportation, and case management that help patients to gain access to care. The nation’s reliance on health centers is likely to grow as health insurance coverage expands under the Affordable Care Act (ACA). Recognizing the need to expand the role of health centers, the ACA established a dedicated five-year $11 billion health center trust fund to broaden access to care in medically underserved, low-income communities.
Knowledge about the characteristics of health center patients and how they use care is important for several reasons. First, the increased emphasis on “patient-centeredness” that is part of comprehensive health system reform begins with an understanding of the patients being served. Second, such understanding is needed to inform policy specifically related to the establishment, operation, payment, and funding of community health centers. Third, it is likely that, as health centers grow in number and strength in response to the ACA’s insurance expansions and direct investments, the profile of health center patients may change. Health centers already play a key role in the provider networks of Medicaid and CHIP health plans, and, in many communities, they are expected to play a key role in the networks offered by Qualified Health Plans, especially plans offered by firms that do business in both the Medicaid market and the new Marketplaces (either through a single plan that satisfies the requirements of both markets, or through affiliated plans that share common networks). Establishing a profile of health center patients before the ACA is implemented sets the stage for measuring change over time, understanding the impact of the ACA, particularly the impact of state decisions regarding the Medicaid expansion, and assessing the environment in which health centers operate and the resources available to them to carry out their mission.
The Health Resources and Services Administration (HRSA)’s Bureau of Primary Health Care periodically collects information on a nationally representative sample of health center patients, through its Health Center Patient Survey. To learn more about the health center population, this brief compares data from the most recent Health Center Patient Survey, conducted in 2009, to data on the low-income* U.S. population, drawn from the National Health Interview Survey (NHIS), on which the Health Center Patient Survey is also modeled. The 2010 NHIS was used because it included more variables of interest for this study than the 2009 NHIS. Detail on the data and methodology associated with each of the two surveys are available in the Methods Appendix at the end of this report.
* In this paper, “low-income” is defined as income below 200% of the federal poverty level (FPL), which is $22,980 for an individual and $47,100 for a family of four in 2013.
Issue Brief: Demographic Characteristics
Community health center patients differ demographically from the total U.S. population and even from the low-income U.S. population. In part, the differences reflect health centers’ specific statutory mission to serve medically underserved communities and populations. In addition, some of the differences reported in this analysis may stem from the fact that the comparison presented here is between people who use health center services and a general low-income population that comprises both people who use and people who do not use health care (including care offered by health centers) in the survey period. Compared to the low-income population overall, health centers users are poorer, more racially and ethnically diverse, more likely to be working-age adults, and more likely to be unemployed and uninsured. Many of these factors relate to one another. For example, people of color experience disproportionately high rates of unemployment and low income,1 and low-income working-age adults are more likely than others to be uninsured.2
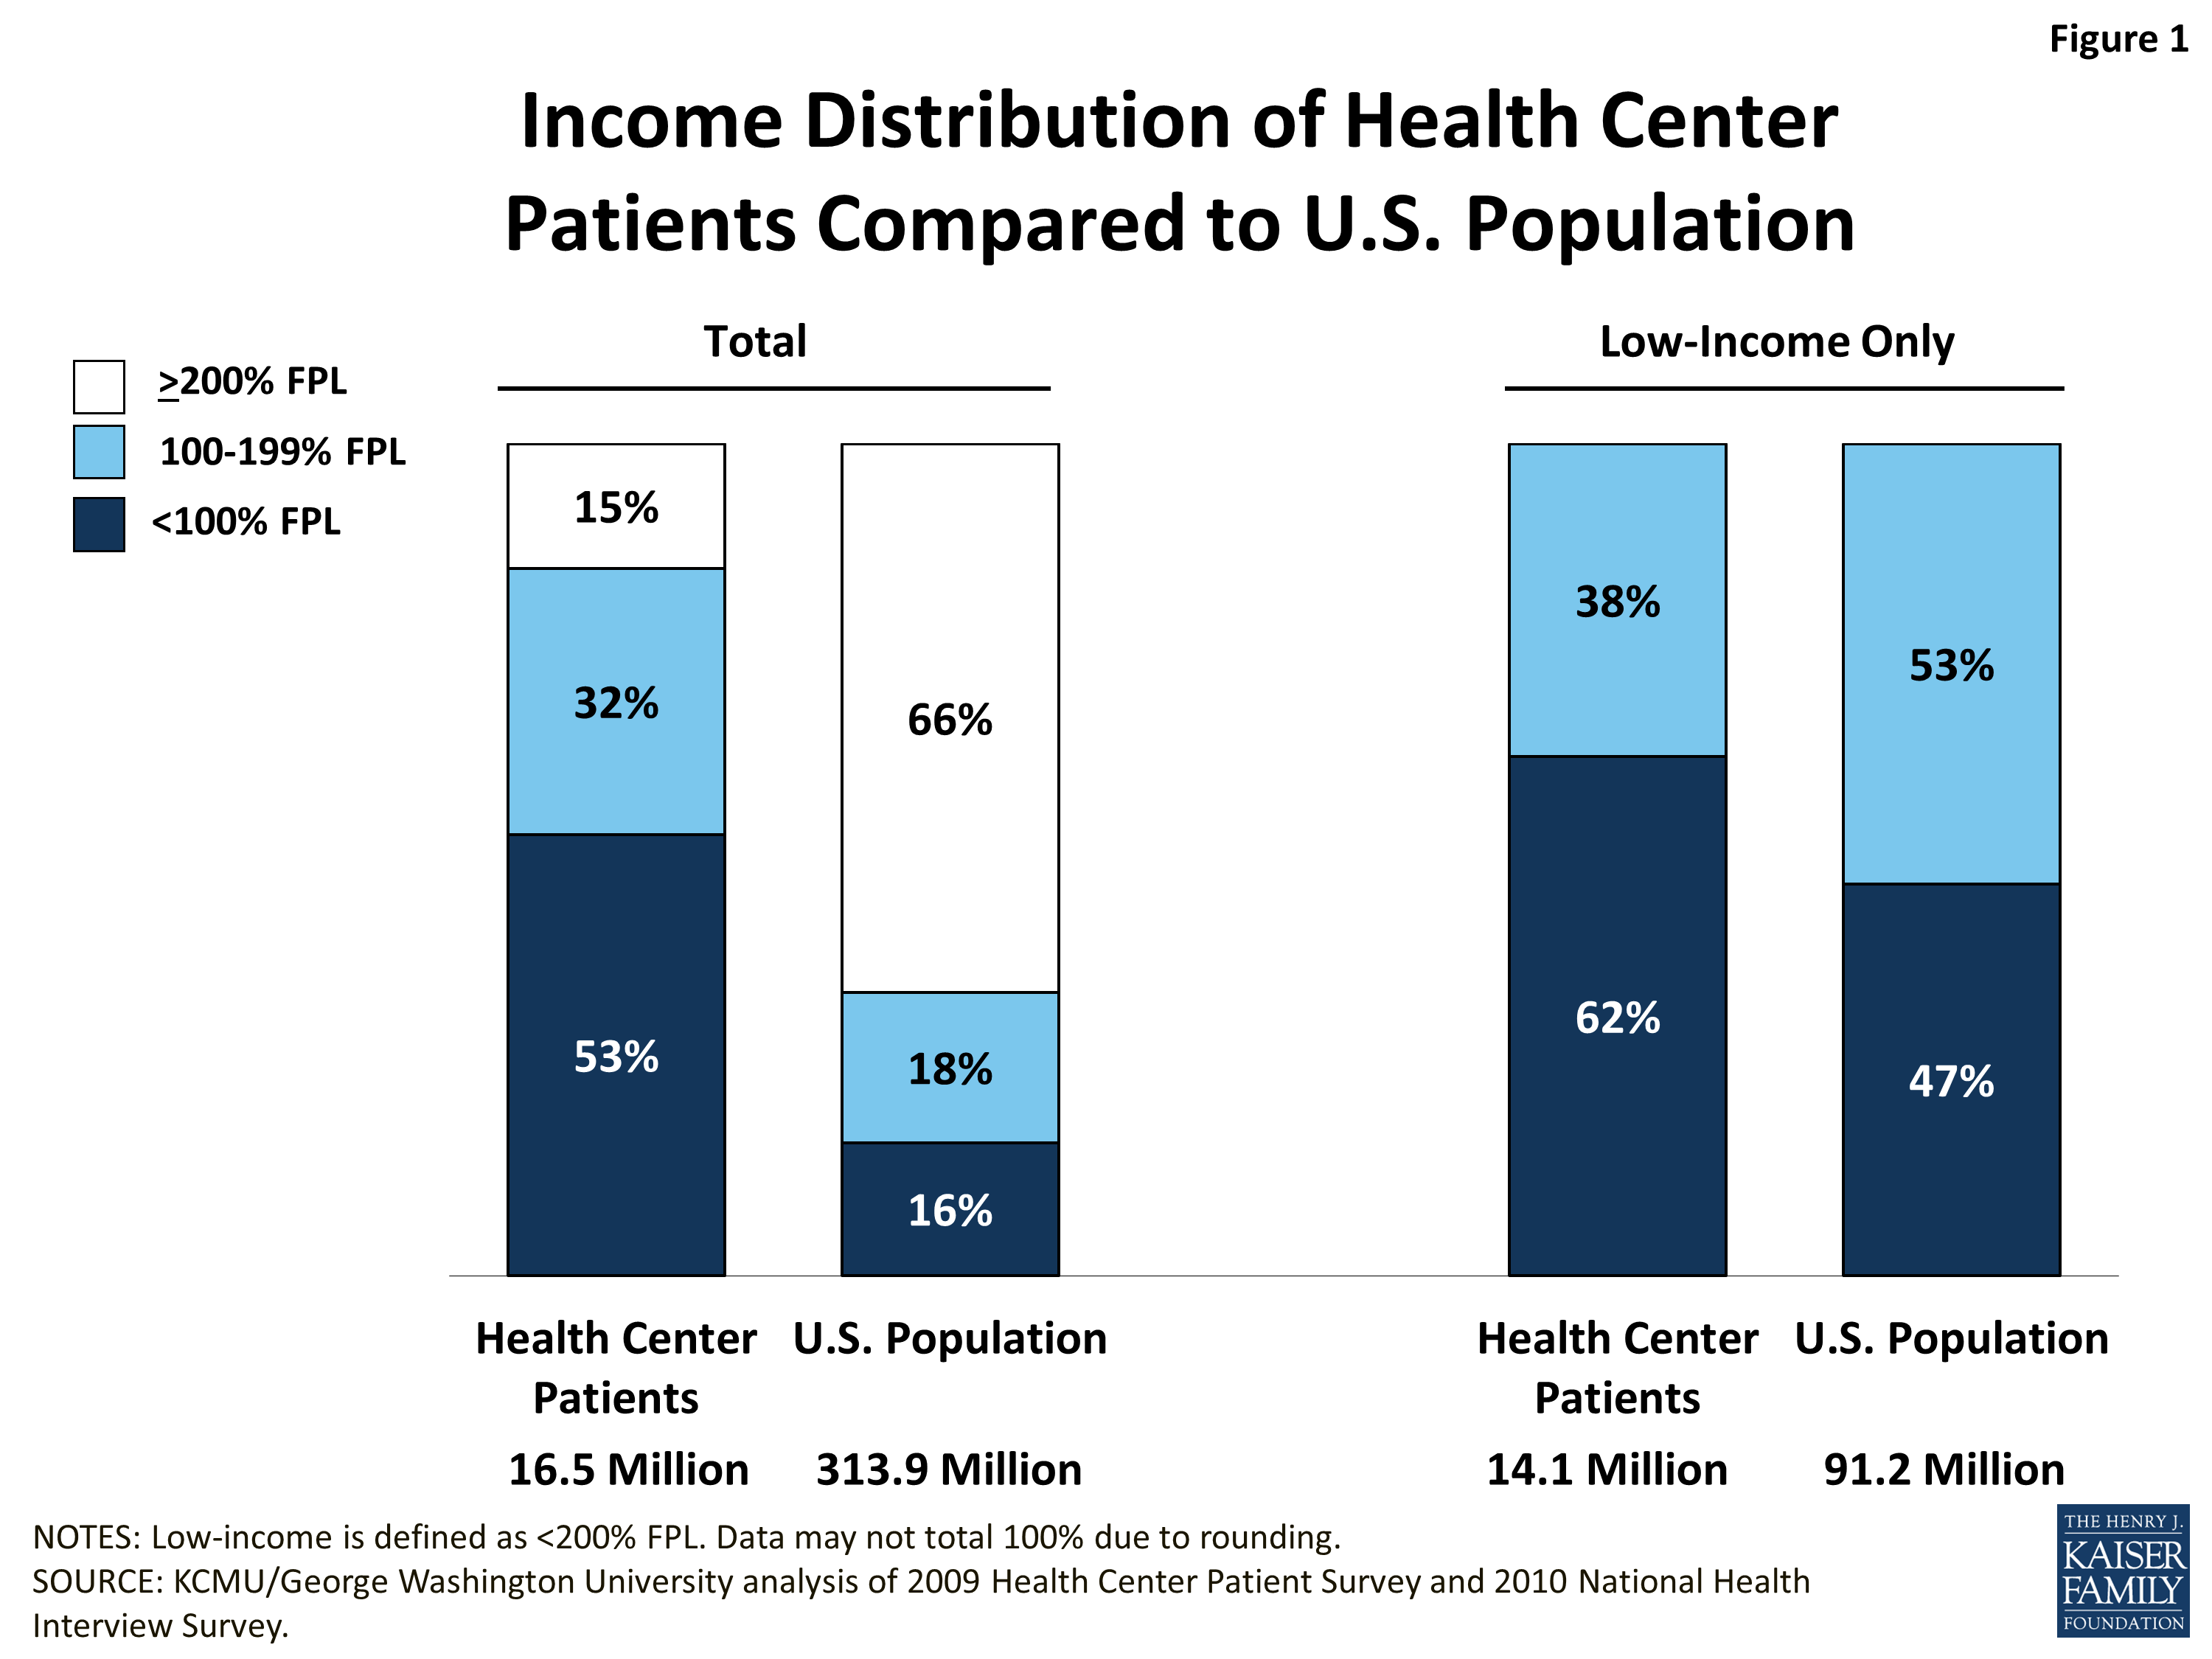
Income. Community health center patients are much more likely to be low-income than the U.S. population overall. More than half (53%) of individuals who obtain at least some of their care from health centers have income below the federal poverty level (FPL) ($11,490 for an individual and $23,550 for a family of four in 2013), and almost another third (32%) have income between 100% and 199% FPL (Figure 1, left panel). The remaining 15%, who have income equal to at least 200% FPL, tend to have very limited income as well. A recent analysis found that only 3% of CHC patients had incomes above 400%.3
The income distribution of the total U.S. population is much different. One-third of the population is below 200% FPL, divided about evenly between those below poverty and those between 100% and 199% FPL. Two-thirds have income at or above 200% FPL, and income levels in this group are not bunched near 200% FPL but are widely distributed.
Even within the population below 200% FPL, poverty is deeper among health center patients (Figure 1, right panel). More than six in ten low-income health center patients have income below the poverty level; by contrast, less than half (47%) of the low-income population overall is in this lowest income band. Our study population – all health center patients* – is overwhelmingly a low-income one. For that reason, and because low income is so strongly associated with certain other patient characteristics, we use the low-income U.S. population as our comparison group in the remainder of this analysis.
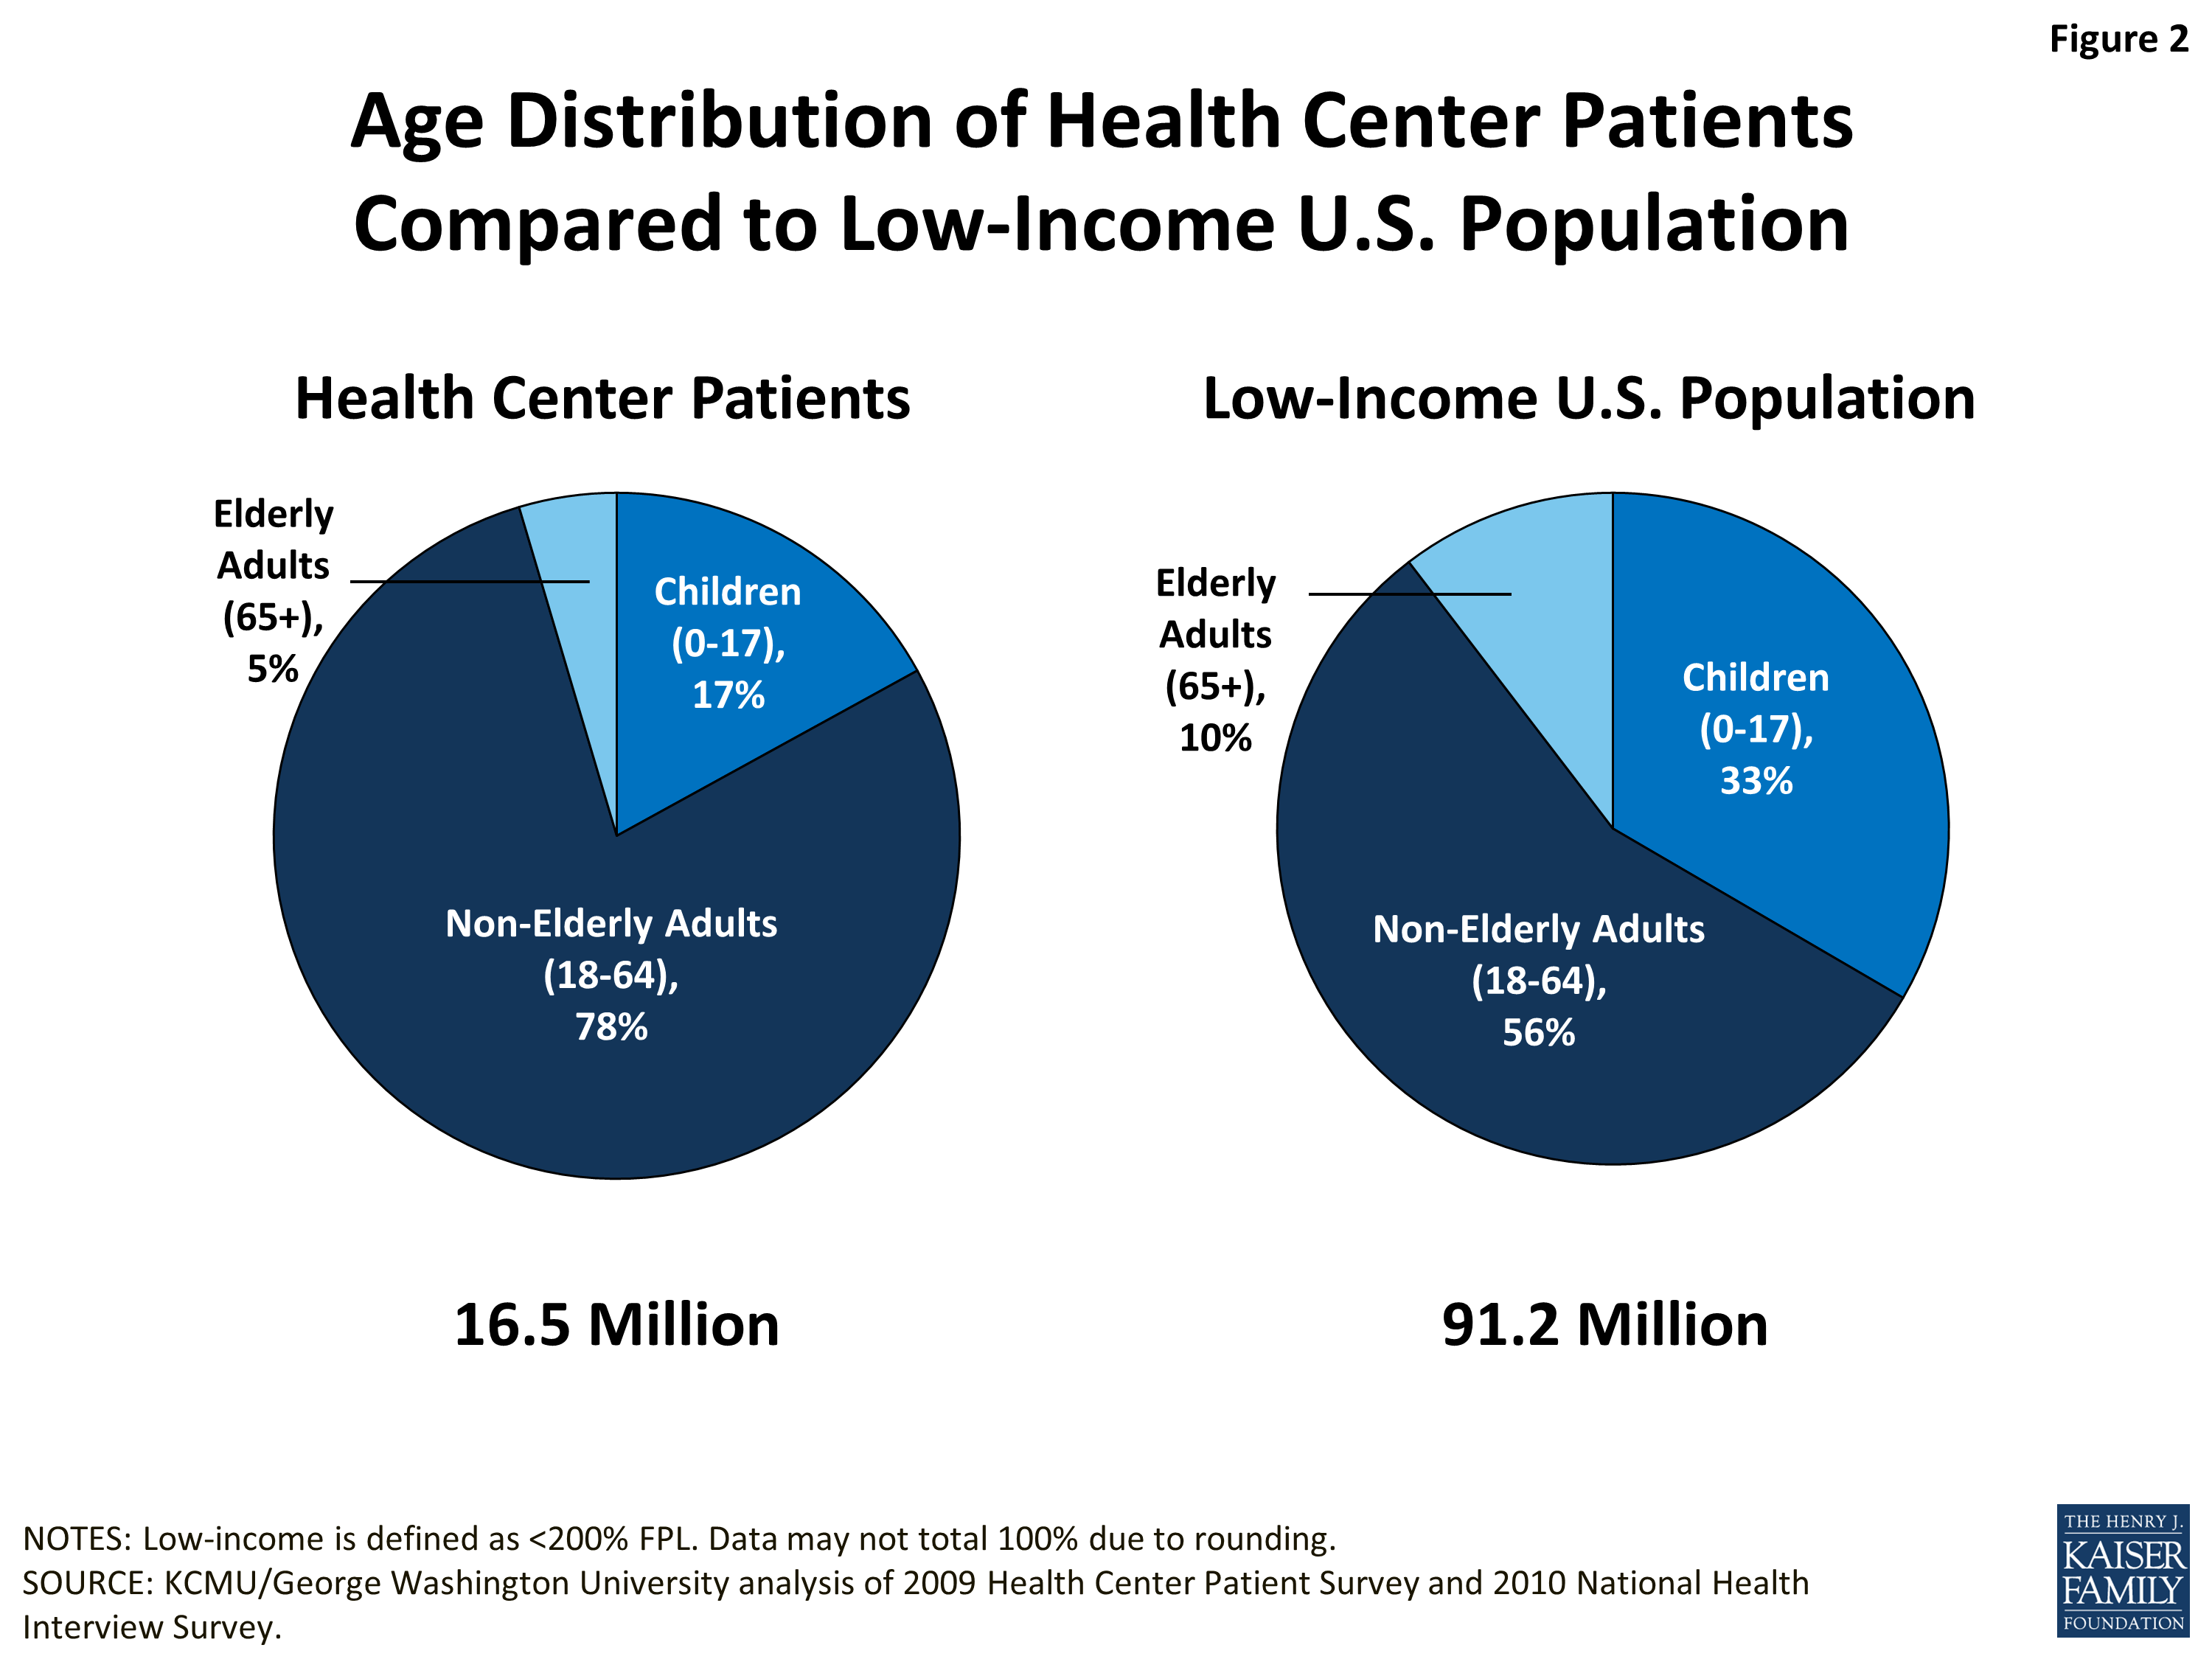
Age. Non-elderly adults (age 18-64) make up a much larger share of the health center patient population than of the low-income population overall. More than three-quarters of health center patients are working-age adults, compared to 56% of low-income people generally (Figure 2). Correspondingly, both children and people age 65 and older make up smaller shares of the health center population. Children represent 17% of health center patients, compared to 33% of low-income people overall; people age 65 and older represent 5% of health center patients, compared to 10% of all low-income people. The higher representation of working-age adults among health center patients suggests that low income non-elderly adults are especially reliant on health centers, compared to either low-income children or older adults. This finding likely reflects the significantly elevated uninsured rate among low-income working-age adults compared to other low-income age groups, a fact that requires them to depend more heavily on safety-net providers for care.4 It also may reflect the relatively high and unmet need for health care among a segment of the low-income adult population, which, when a health center exists in the community, leads them to seek care.
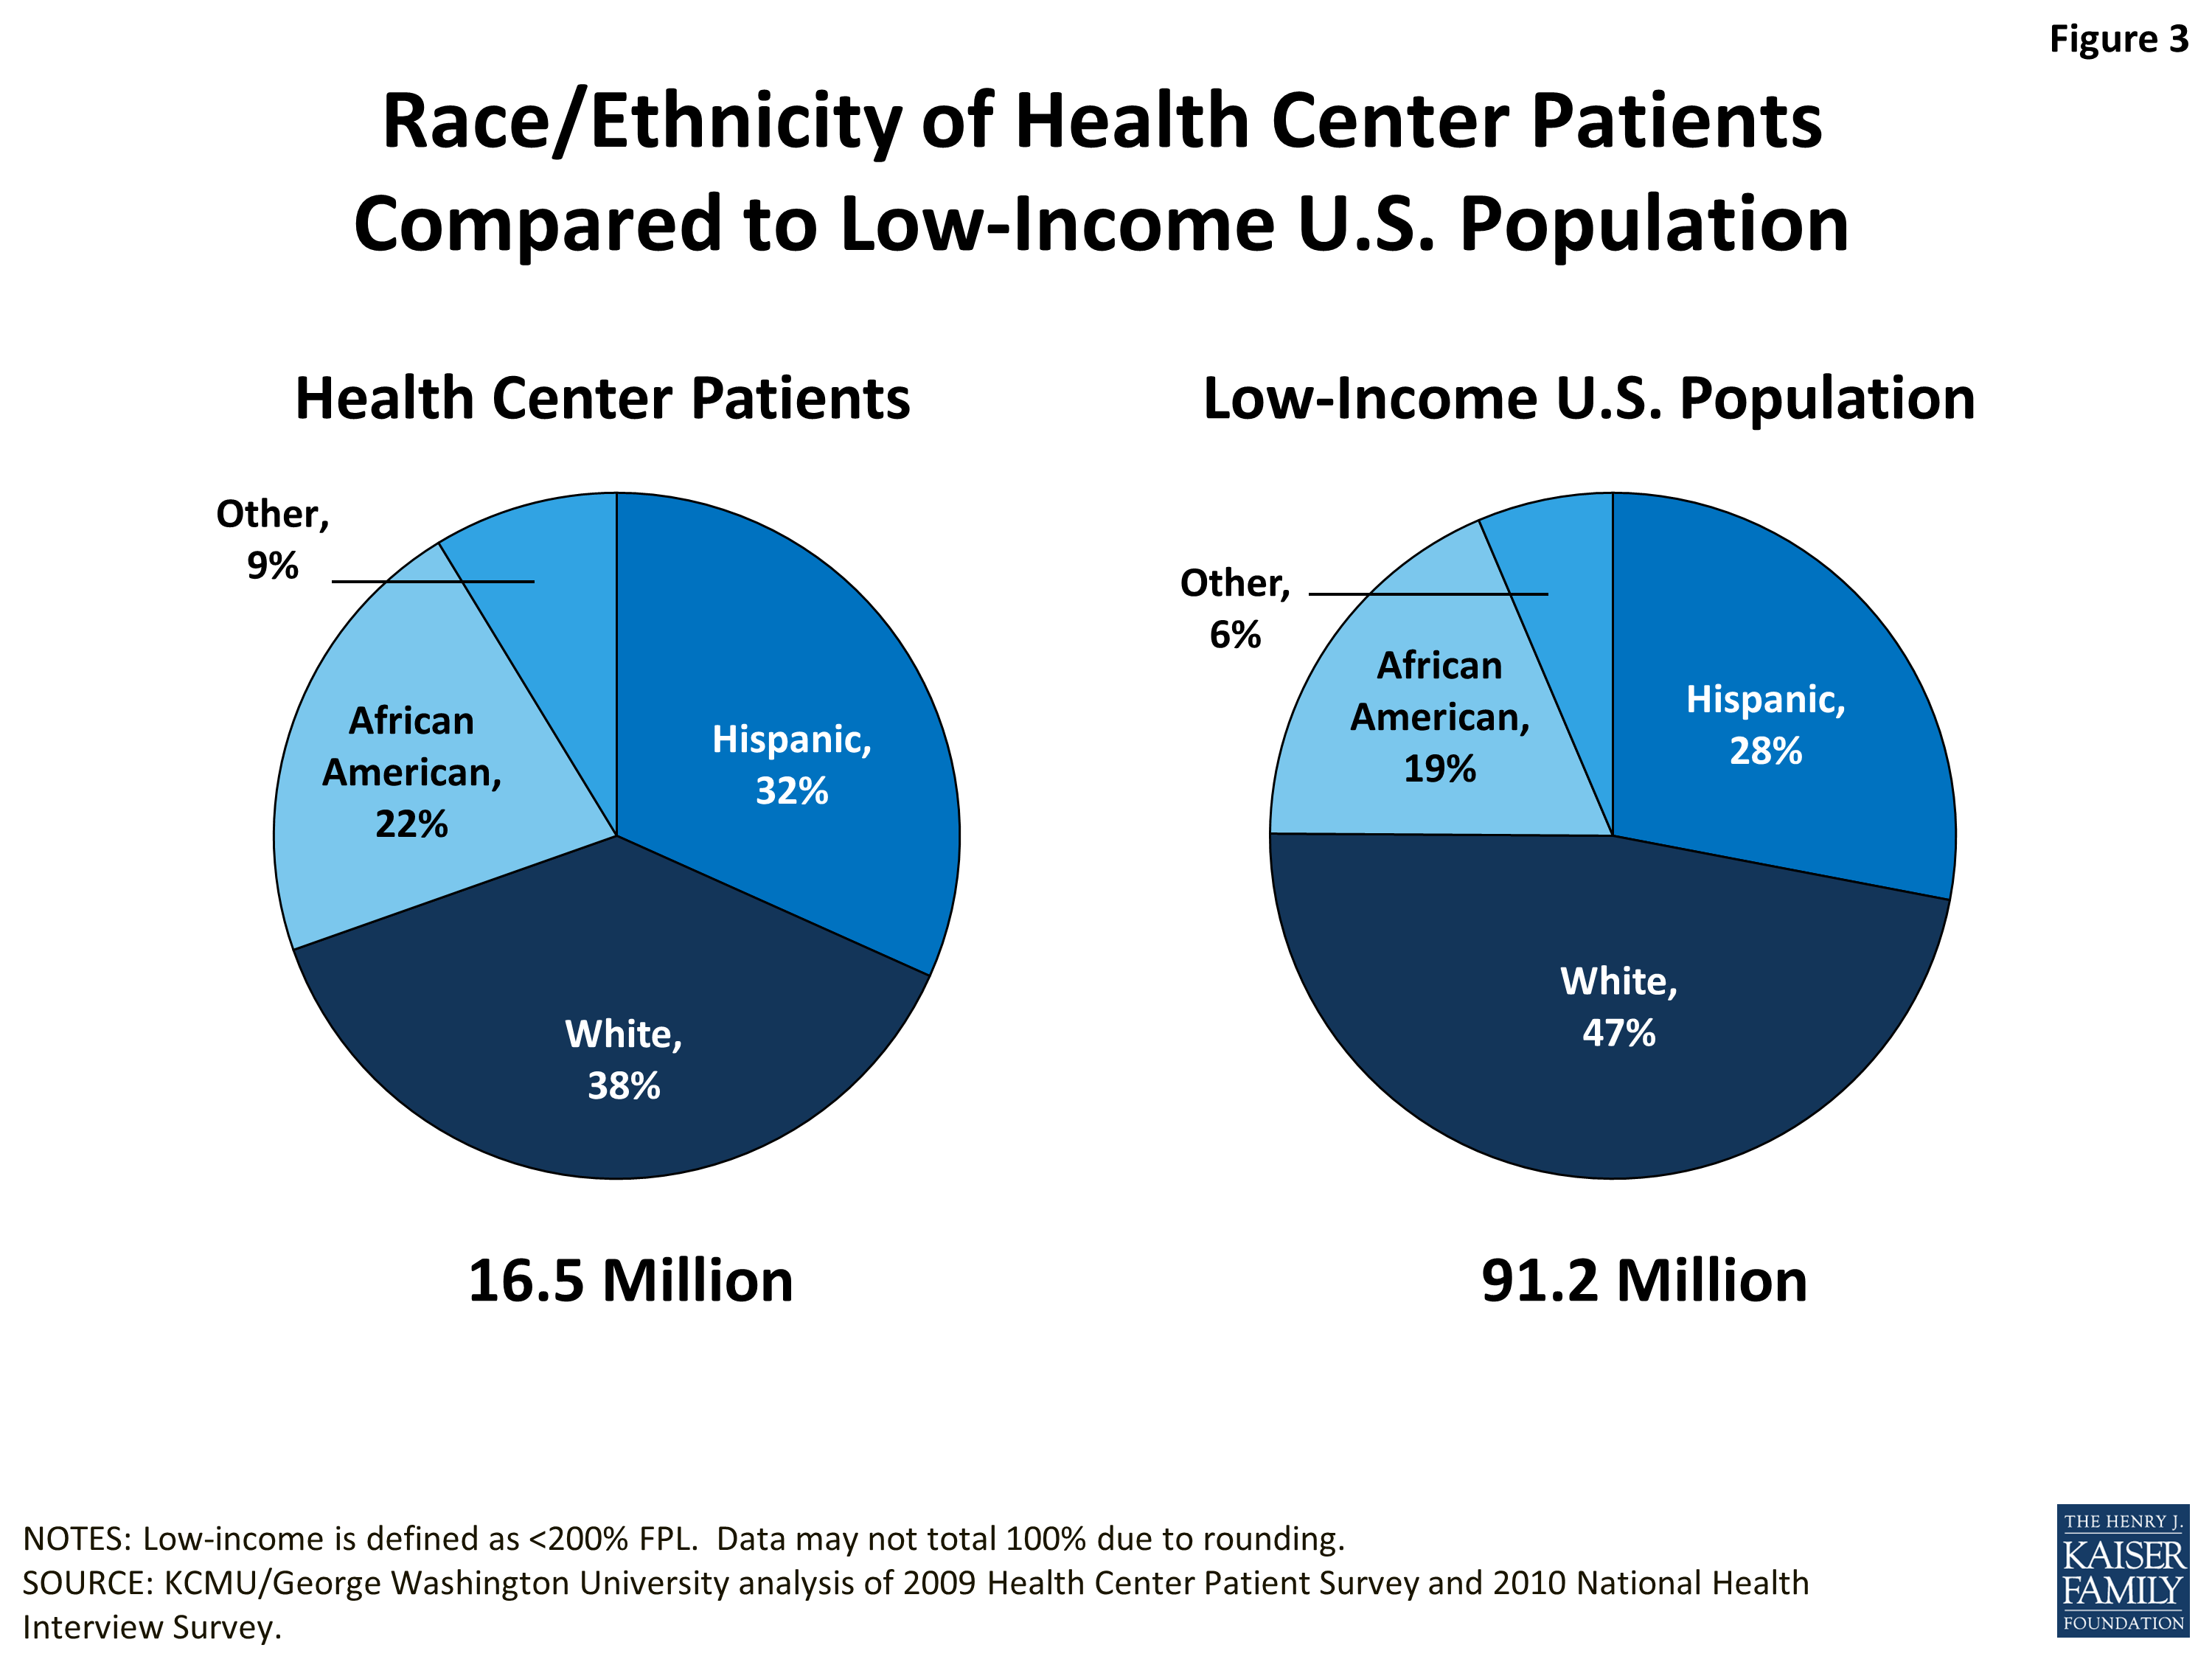
Race/ethnicity. Health center patients are more racially and ethnically diverse than the low-income population overall. They are more likely to be Hispanic, African-American, or a member of another racial or ethnic minority group. Patients are less likely to be White than the general low-income population (Figure 3). Thus, health centers play an important role in serving communities of color and helping narrow racial and ethnic disparities in health care. The relatively high representation of people of color among health center patients is likely a reflection of the strong correlations between race/ethnicity and low income, poorer health status, higher uninsured rates, and residence in medically underserved areas.
Language preference/primary language. Roughly three-quarters of both health center patients and the low-income population overall report English as their preferred or primary language. Over a fifth (22%) of health center patients say they prefer to speak Spanish over English or another language. Among the general low-income population, 13% say they speak only or mostly Spanish, while another 6% say they speak both English and Spanish. However, the two surveys ask about primary language differently, so the measures are not directly comparable between the two populations (Figure 4).
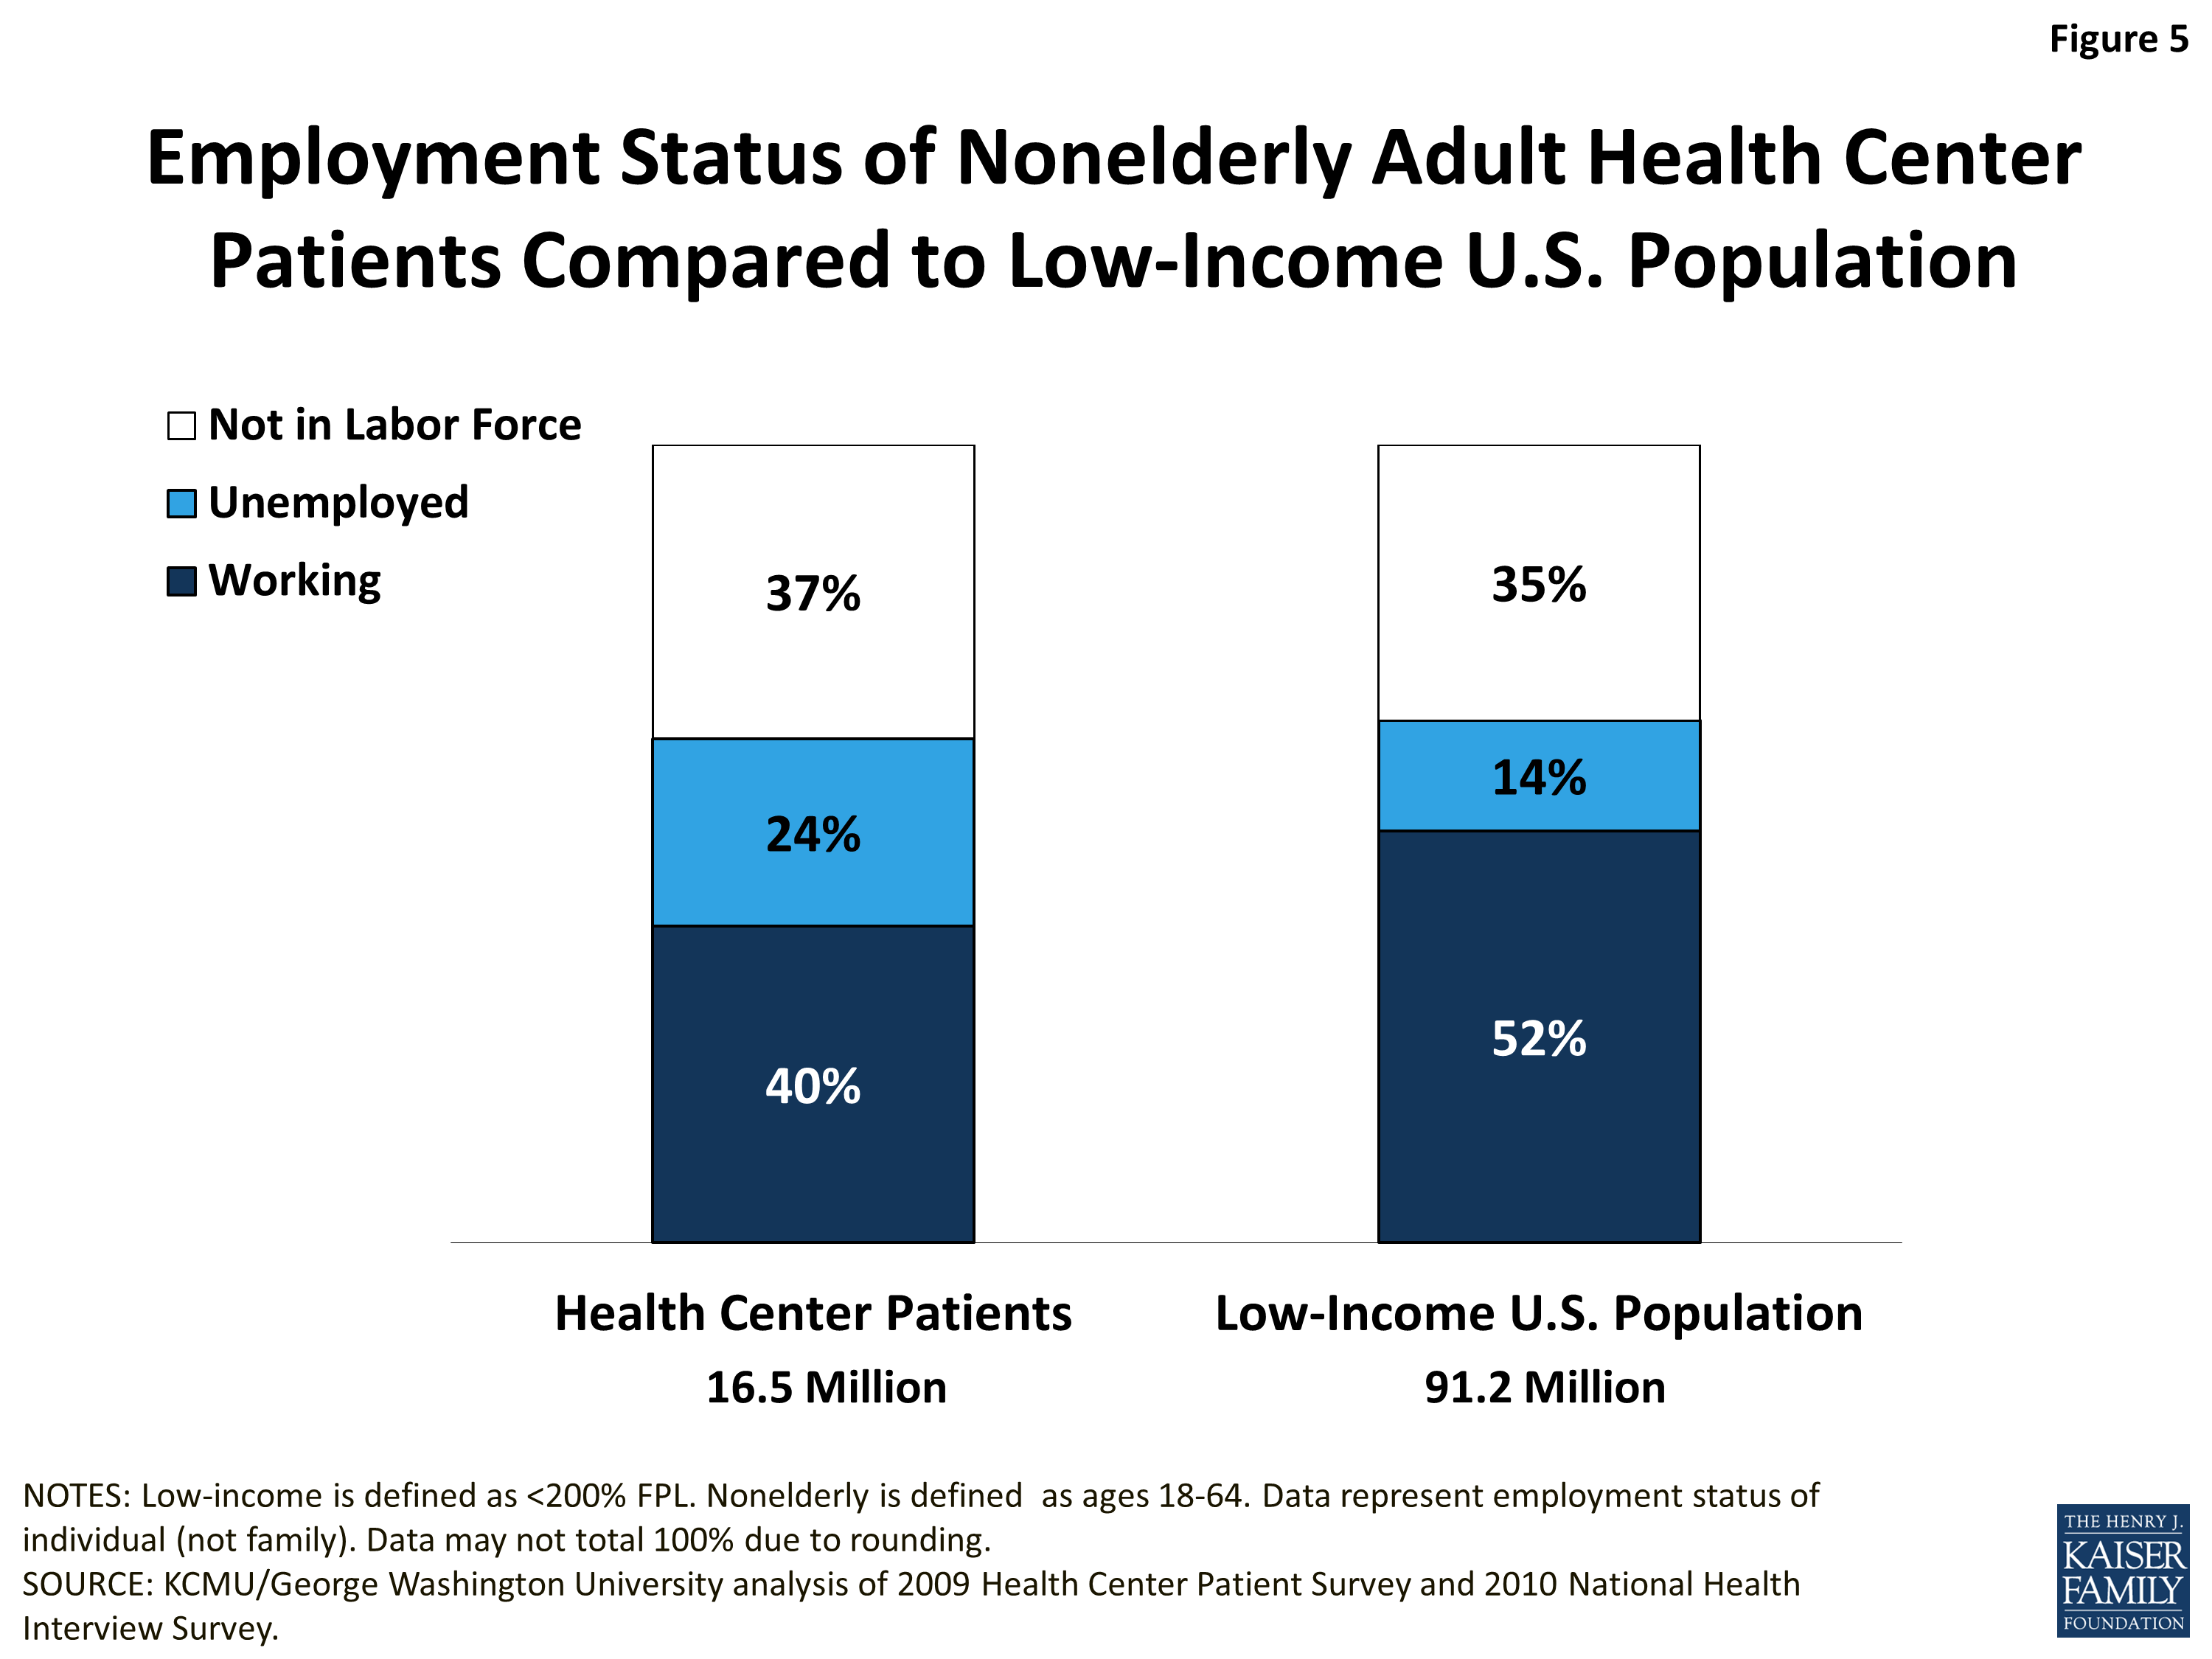
Employment status. Health center patients are more likely to be unemployed than low-income people overall. In 2009-2010, 24% of working-age adult health center patients were unemployed, compared to 14% of all low-income working-age adults (Figure 5). Given the adverse impact of joblessness on insurance coverage, the resulting difficulty that unemployed people face affording necessary health care, and the fact that health centers have traditionally served as a source of care for people who have trouble affording services, the higher unemployed rate among health center patients is not surprising.
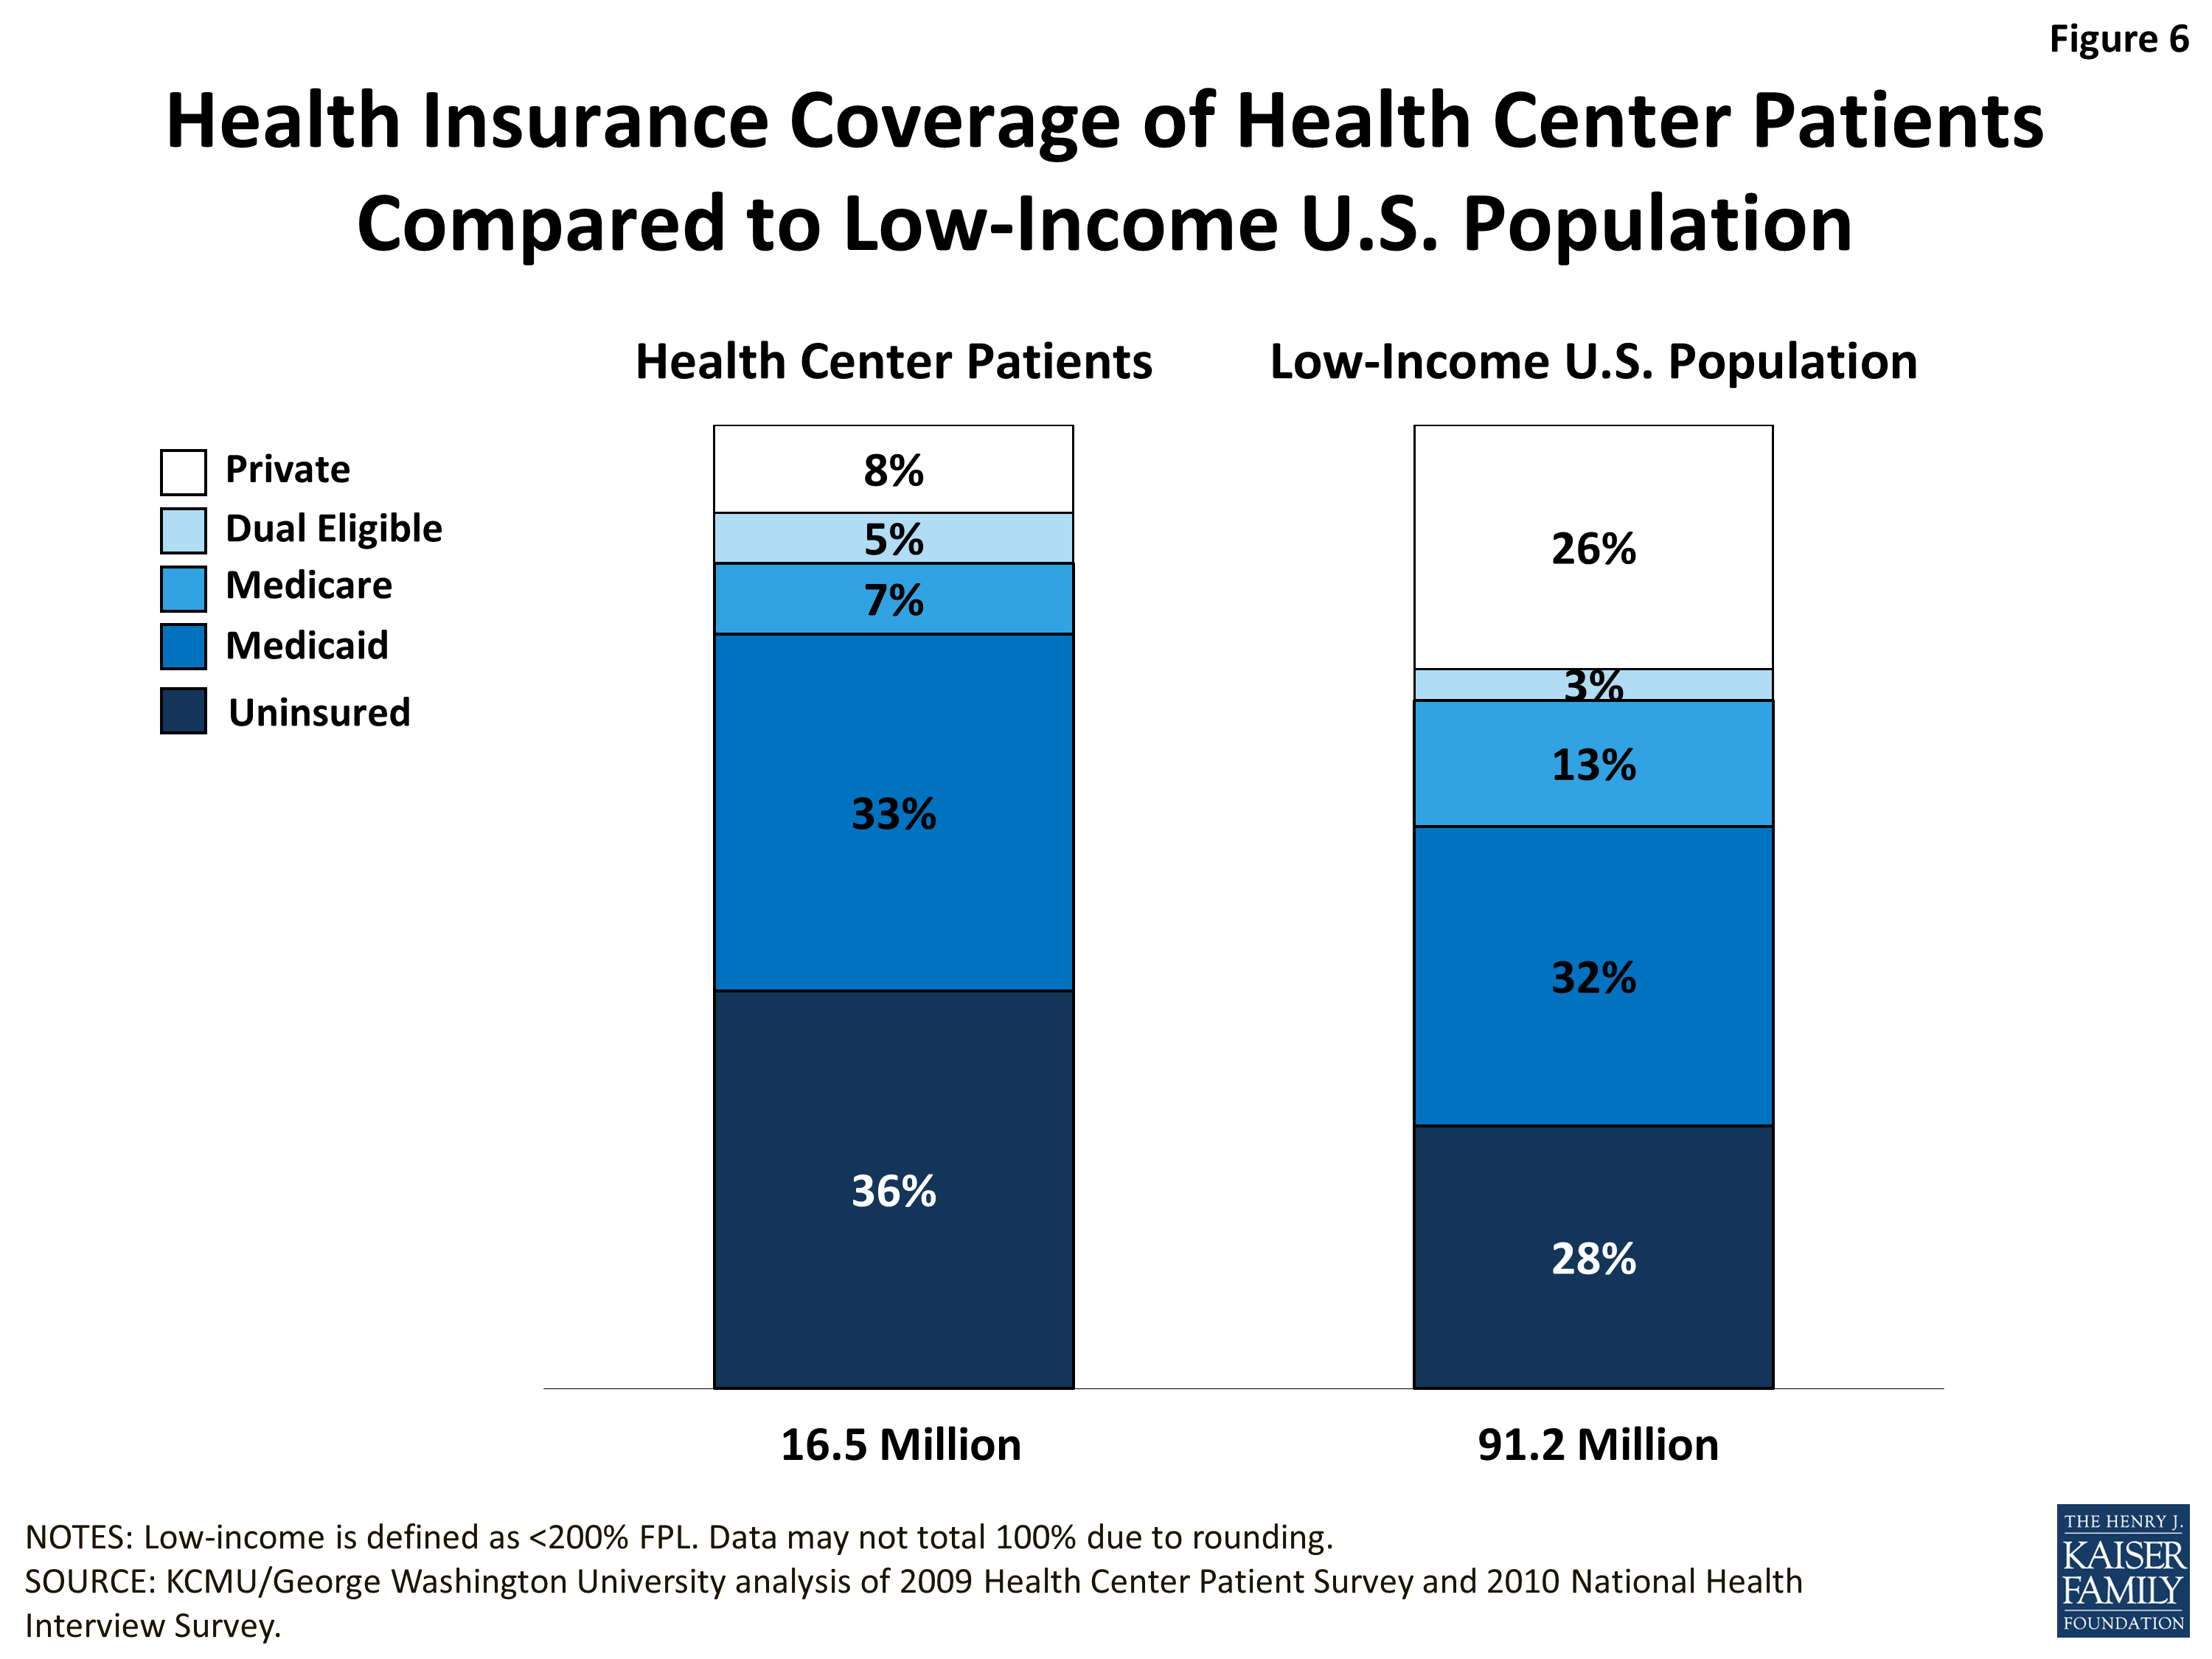
Uninsured rate. Health center patients have higher uninsured rates than the general low-income population, in part because they are more likely to fall into the age range (nonelderly adults) in which the risk of being uninsured is highest. While 28% of all low-income people are uninsured, 36% of all health center patients are uninsured (Figure 6). Despite the fact that health center patients are more likely to be uninsured, the proportion of people with Medicaid coverage is almost the same – roughly one-third – among health center patients and the low-income population generally. Not unexpectedly, given the under-representation of patients age 65 and older among health center users (relative to the overall low-income population), the share of individuals with Medicare is relatively low among health center patients, compared to the overall low-income population (7% versus 13%). Also, even though working-age adults make up a substantially larger share of health center patients than of the broader low-income population, the rate of private coverage – largely, employer-sponsored insurance – is much lower among health center patients than among low-income people generally – 8% compared to 26%. Factors that may help to explain health center patients’ lower rate of private coverage include the deeper poverty of health center users, their worse health status (discussed below), and their higher rate of unemployment.
* Note: The total health center population is 16.5 million in all Figures in this brief. This total differs from the total of 20 million health center patients, cited in the Introduction. The difference is attributable to the use of different data sources (2009 Health Center Patient Survey and 2011 Uniform Data System Report (HRSA, 2012), respectively), and to the weighting methodology and additional adjustments to the data in the Health Center Patient Survey.
Issue Brief: Health Status
Health center patients are in poorer health than the low-income population overall. They report poorer health status, more chronic health conditions, and higher rates of smoking and obesity. These patterns reflect underlying differences in health status between health center patients and the general low-income population, but also the fact that people who seek health care — here, health center users — are, by definition, likely to need services, whereas the overall low-income population includes both health care users and non-users, whose health care needs presumably are more limited. The data show that health center patients are a population with substantial needs for health care.
Self-reported health status. Health center patients are twice as likely as low-income people overall to report being in fair or poor health, as opposed to excellent, very good, or good health (32% vs. 16%) (Figure 7). It is important to note again that, because all individuals participating in the Health Center Patient Survey are seeking care, they might be more likely to be in fair or poor health than the broader low-income population captured in the NHIS, a household survey that includes both users and non-users.
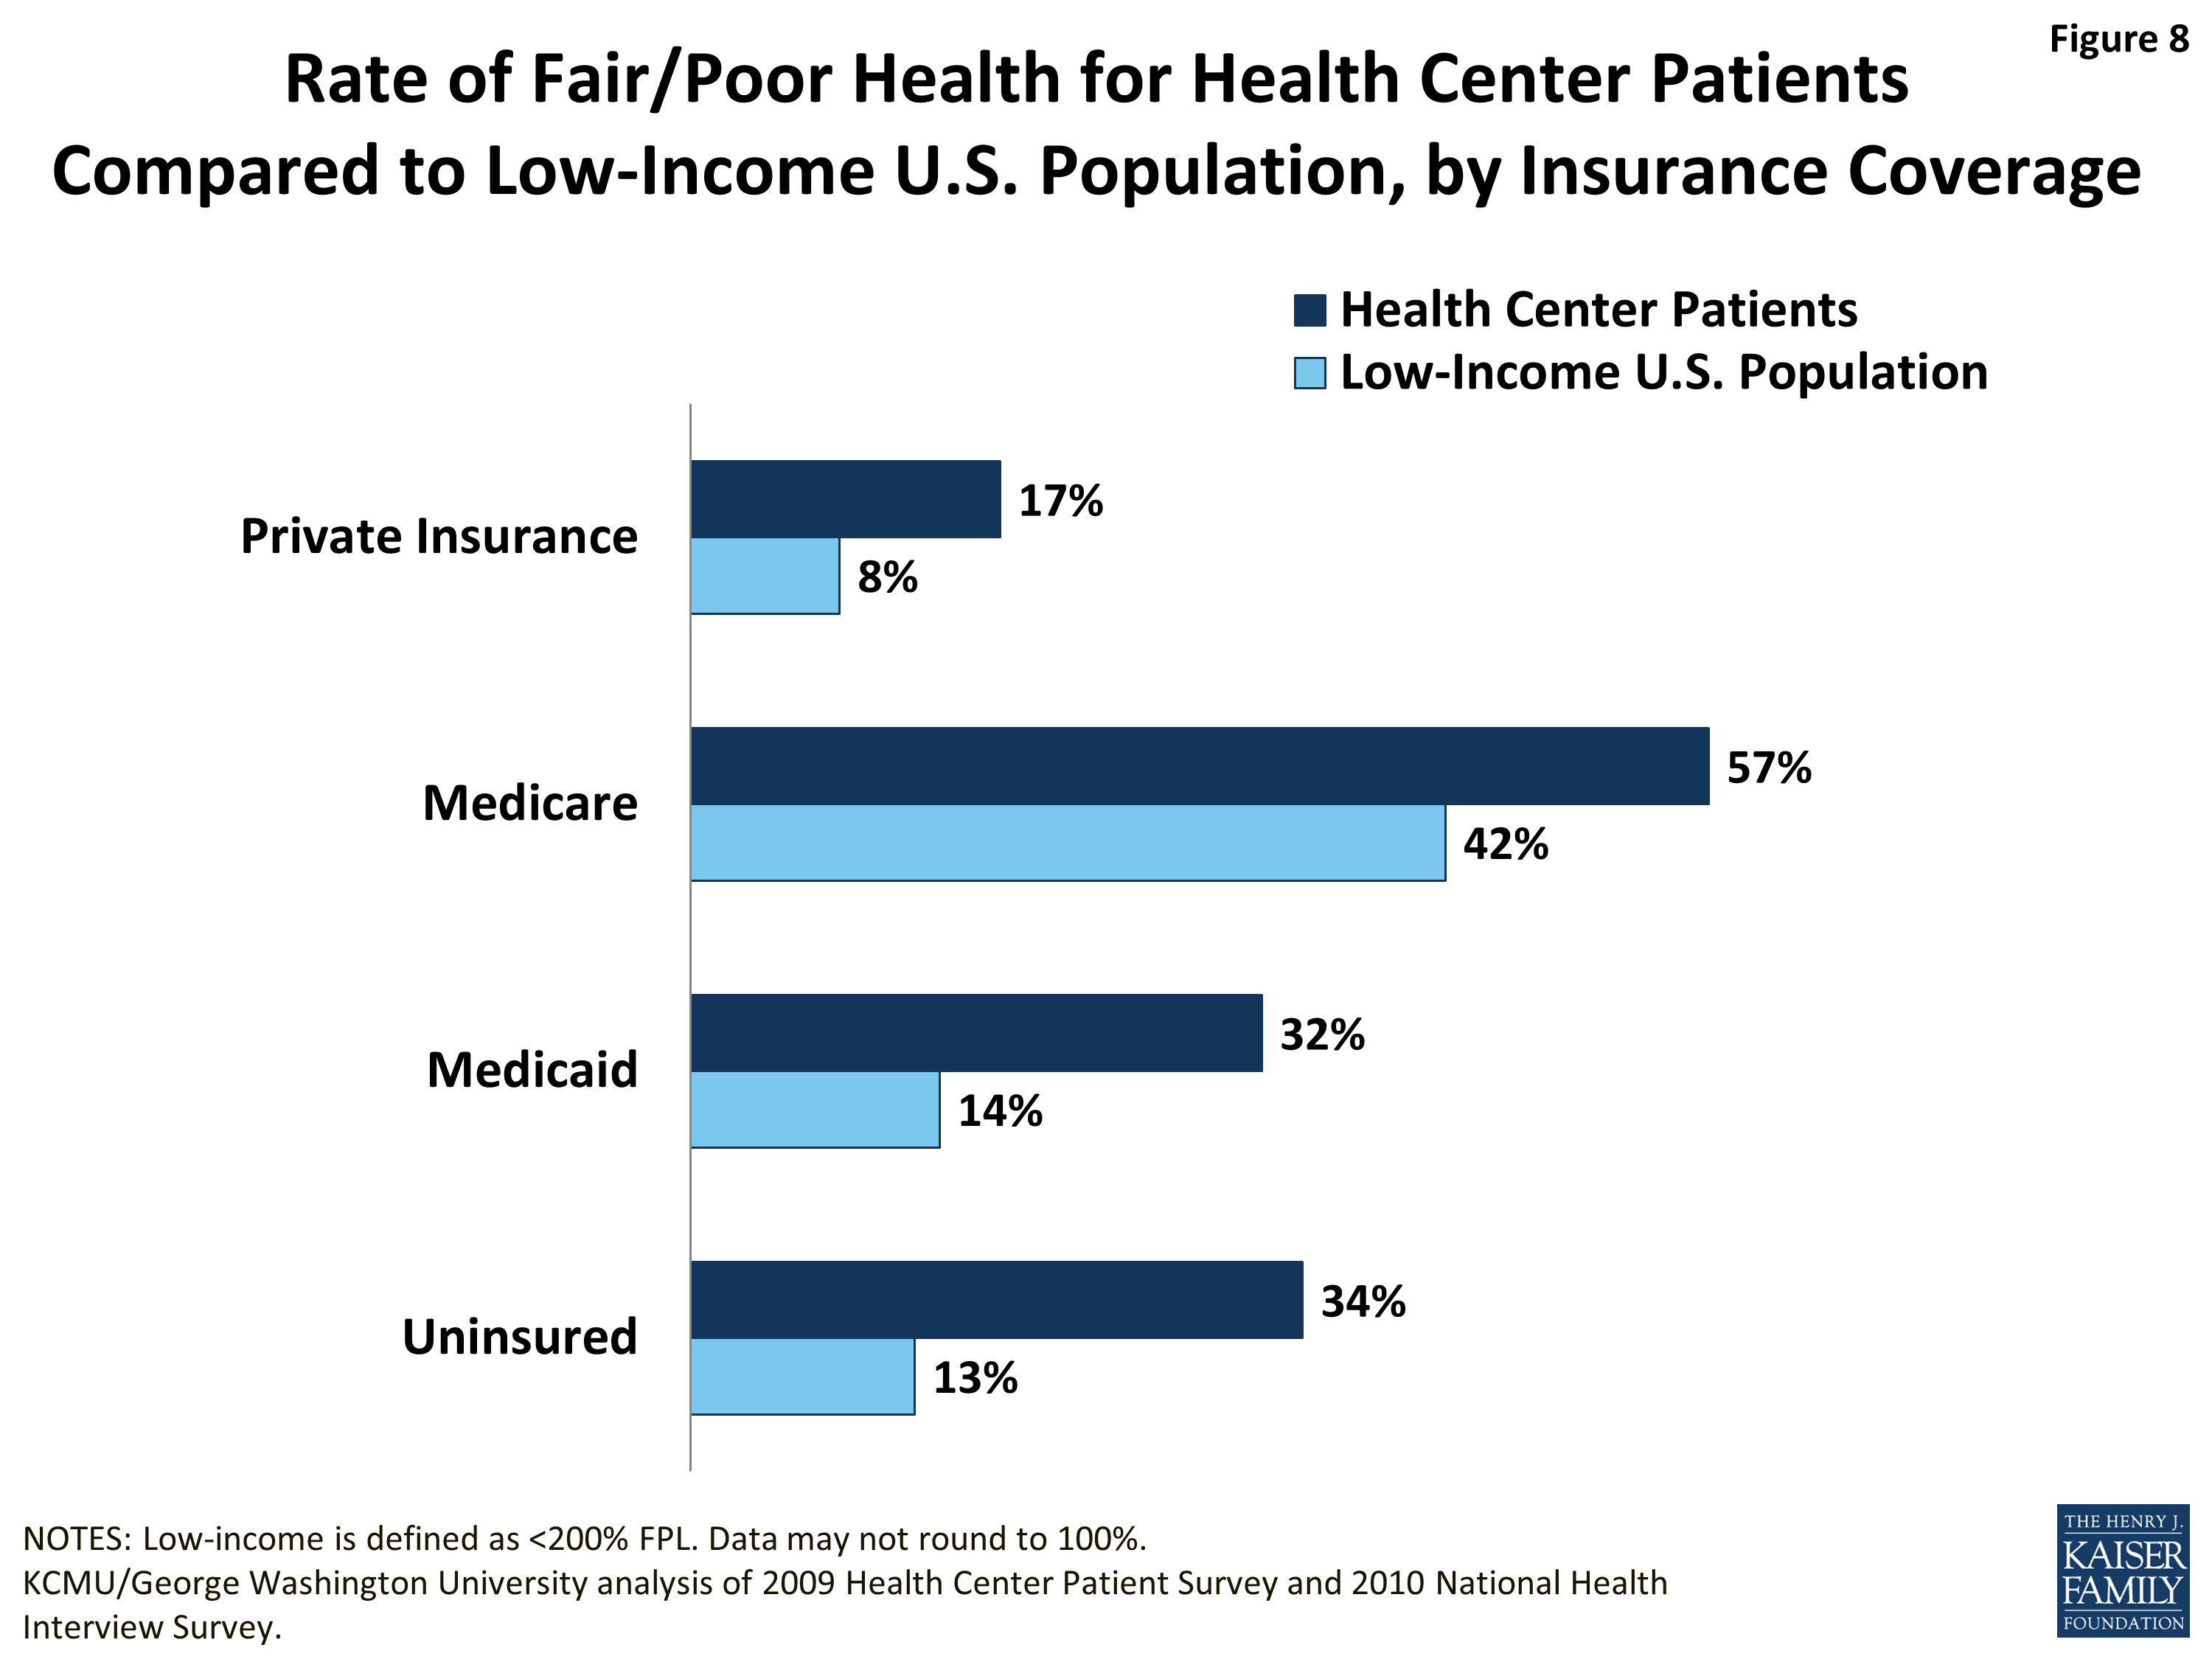
Self-reported health status, by insurance coverage. Health center patients are more likely to report being in fair or poor health than the general low-income population, not only in the aggregate but also within different health insurance categories. Among the privately insured, the share reporting fair/poor health is twice as high for health center patients as for low-income people overall (17% vs. 8%) (Figure 8). Within the Medicare, Medicaid, and uninsured populations, which have much higher rates of fair/poor health than the privately insured, the rates for health center patients far exceed those for low-income people overall in the same coverage group. Among Medicaid beneficiaries, 42% of all low-income people but 57% of health center patients report fair/poor health. Among both Medicaid beneficiaries and the uninsured, 1 in 3 health center patients reports being in fair/poor health, compared to about 1 in 7 low-income individuals generally. These findings point to health centers as a locus of care for a subgroup of the low-income population that has substantial health burdens.
Chronic conditions. Adult health center patients are more likely than low-income adults overall to report that they have had one or more of a number of major chronic conditions during their lifetime. In particular, adult health center patients report rates of diabetes and asthma 50% higher than in the total low-income adult population (Figure 9). They also report higher rates of hypertension. In addition, a quarter of all adult health center patients report having had two or more chronic conditions, compared to 17% of all low-income adults. Half of both adult health center patients and low-income adults overall report depression, and about a third of both populations report anxiety. These high rates of mental health conditions may in part stem from the way the survey questions related to these conditions were framed. The Health Center Patient Survey asked patients to self-report whether they had ever had depression or anxiety in their lifetime. The NHIS asked only a subsample of adults who reported symptoms of anxiety/depression whether they had been told by a medical professional that they had either of these conditions.
The high rates of chronic illness among adult health center patients may be one reason these individuals presented for care. The high rates also reveal that care of people with chronic diseases and conditions is central to the work of health centers.
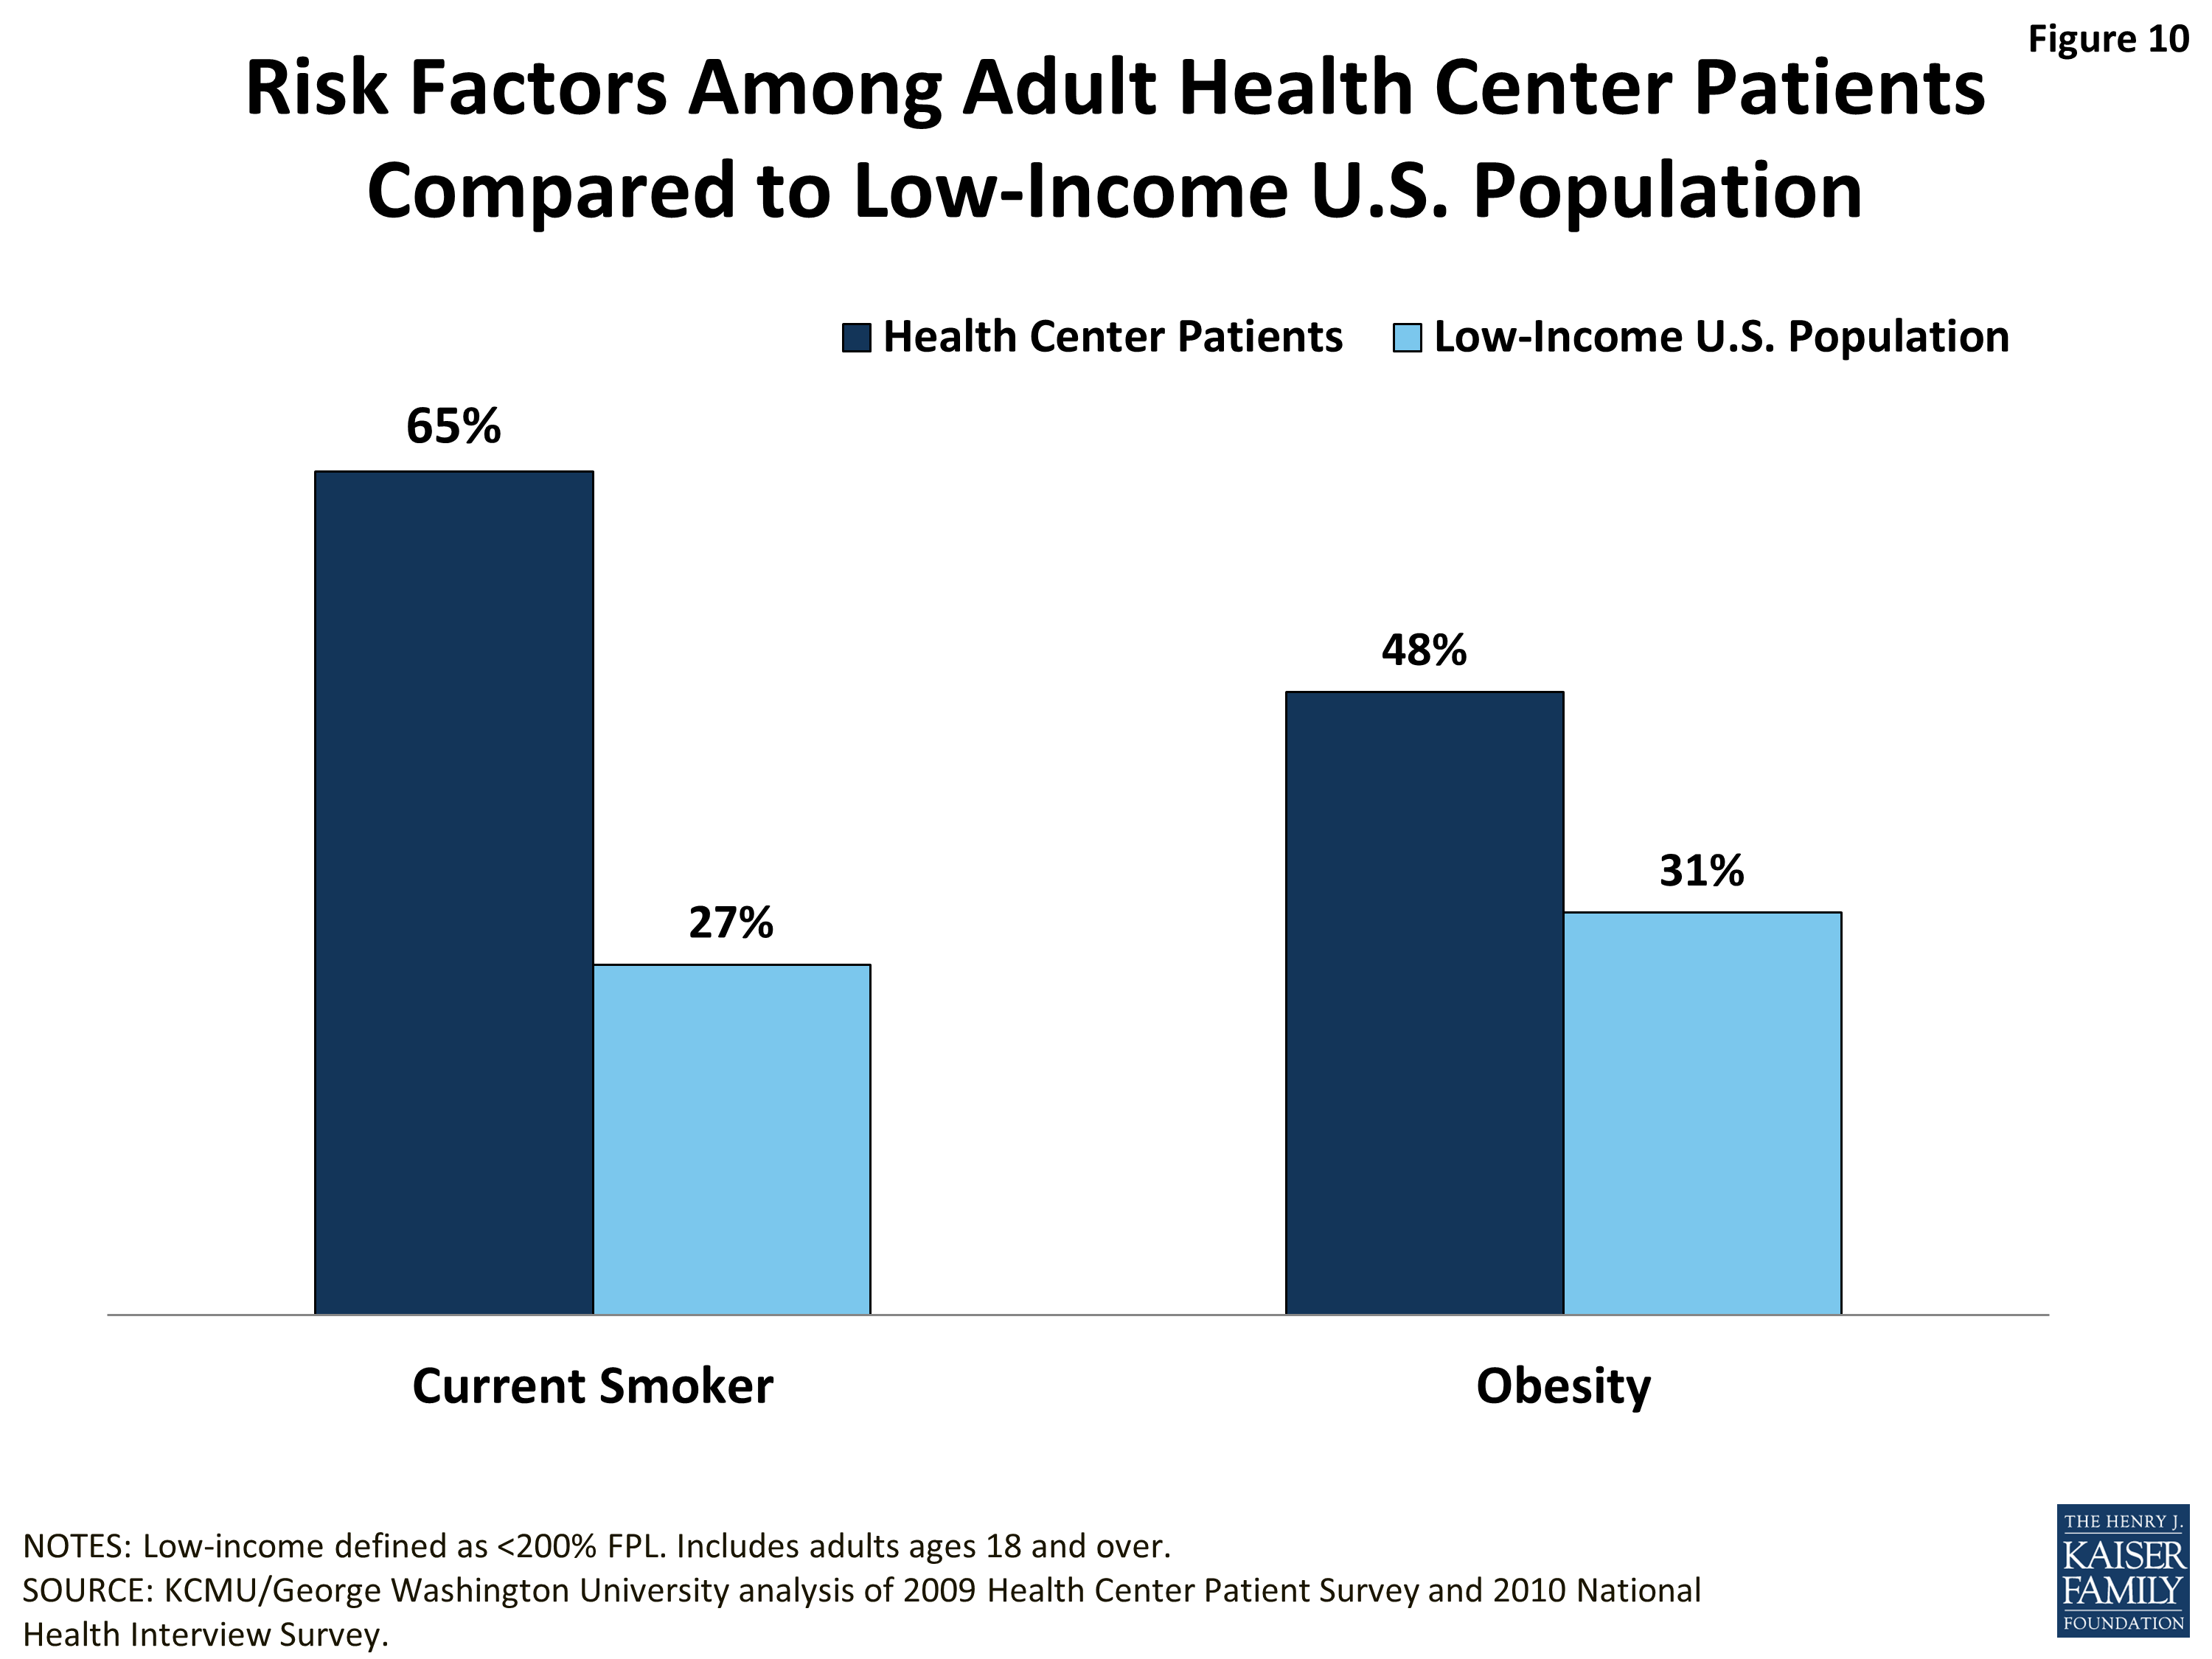
Health risk factors. Smoking and obesity rates are not only high among adult health center patients, but also much higher than for the low-income population overall. Nearly two-thirds (65%) of health center patients are current smokers, compared to about a quarter (27%) of all low-income adults (Figure 10). Almost half are obese, compared to 31% of low-income adults overall. Smoking and obesity are closely linked with serious health problems such as cardiovascular disease and diabetes. The very high prevalence of these risk factors in the health center population may help to explain the patterns in chronic disease prevalence discussed above.
Issue Brief: Use Of Care
Health centers’ mission is to provide comprehensive primary care to their patients. Preventive health services and care management for ongoing health conditions are core components of this care, and several of the metrics used to evaluate health center quality focus on such services. Other research has demonstrated that health centers perform comparably to, if not better than, private practice physicians and other primary care providers in these spheres of care.5 This analysis, which complements that research, finds that, on key measures of preventive care and care management, health center users fare better than the low-income population in general. As with the results on health status, comparisons of utilization between health center patients and the low-income population overall may partly reflect the fact that health center patients are, by definition, already receiving care. However, even accounting for this difference, the analysis indicates some areas for concern regarding health center patients’ ability to access follow-up services, which may be outside the scope of services available at most health centers and thus require referrals. Because so many health center patients are uninsured, health centers face particular challenges in obtaining referrals.
Preventive Care
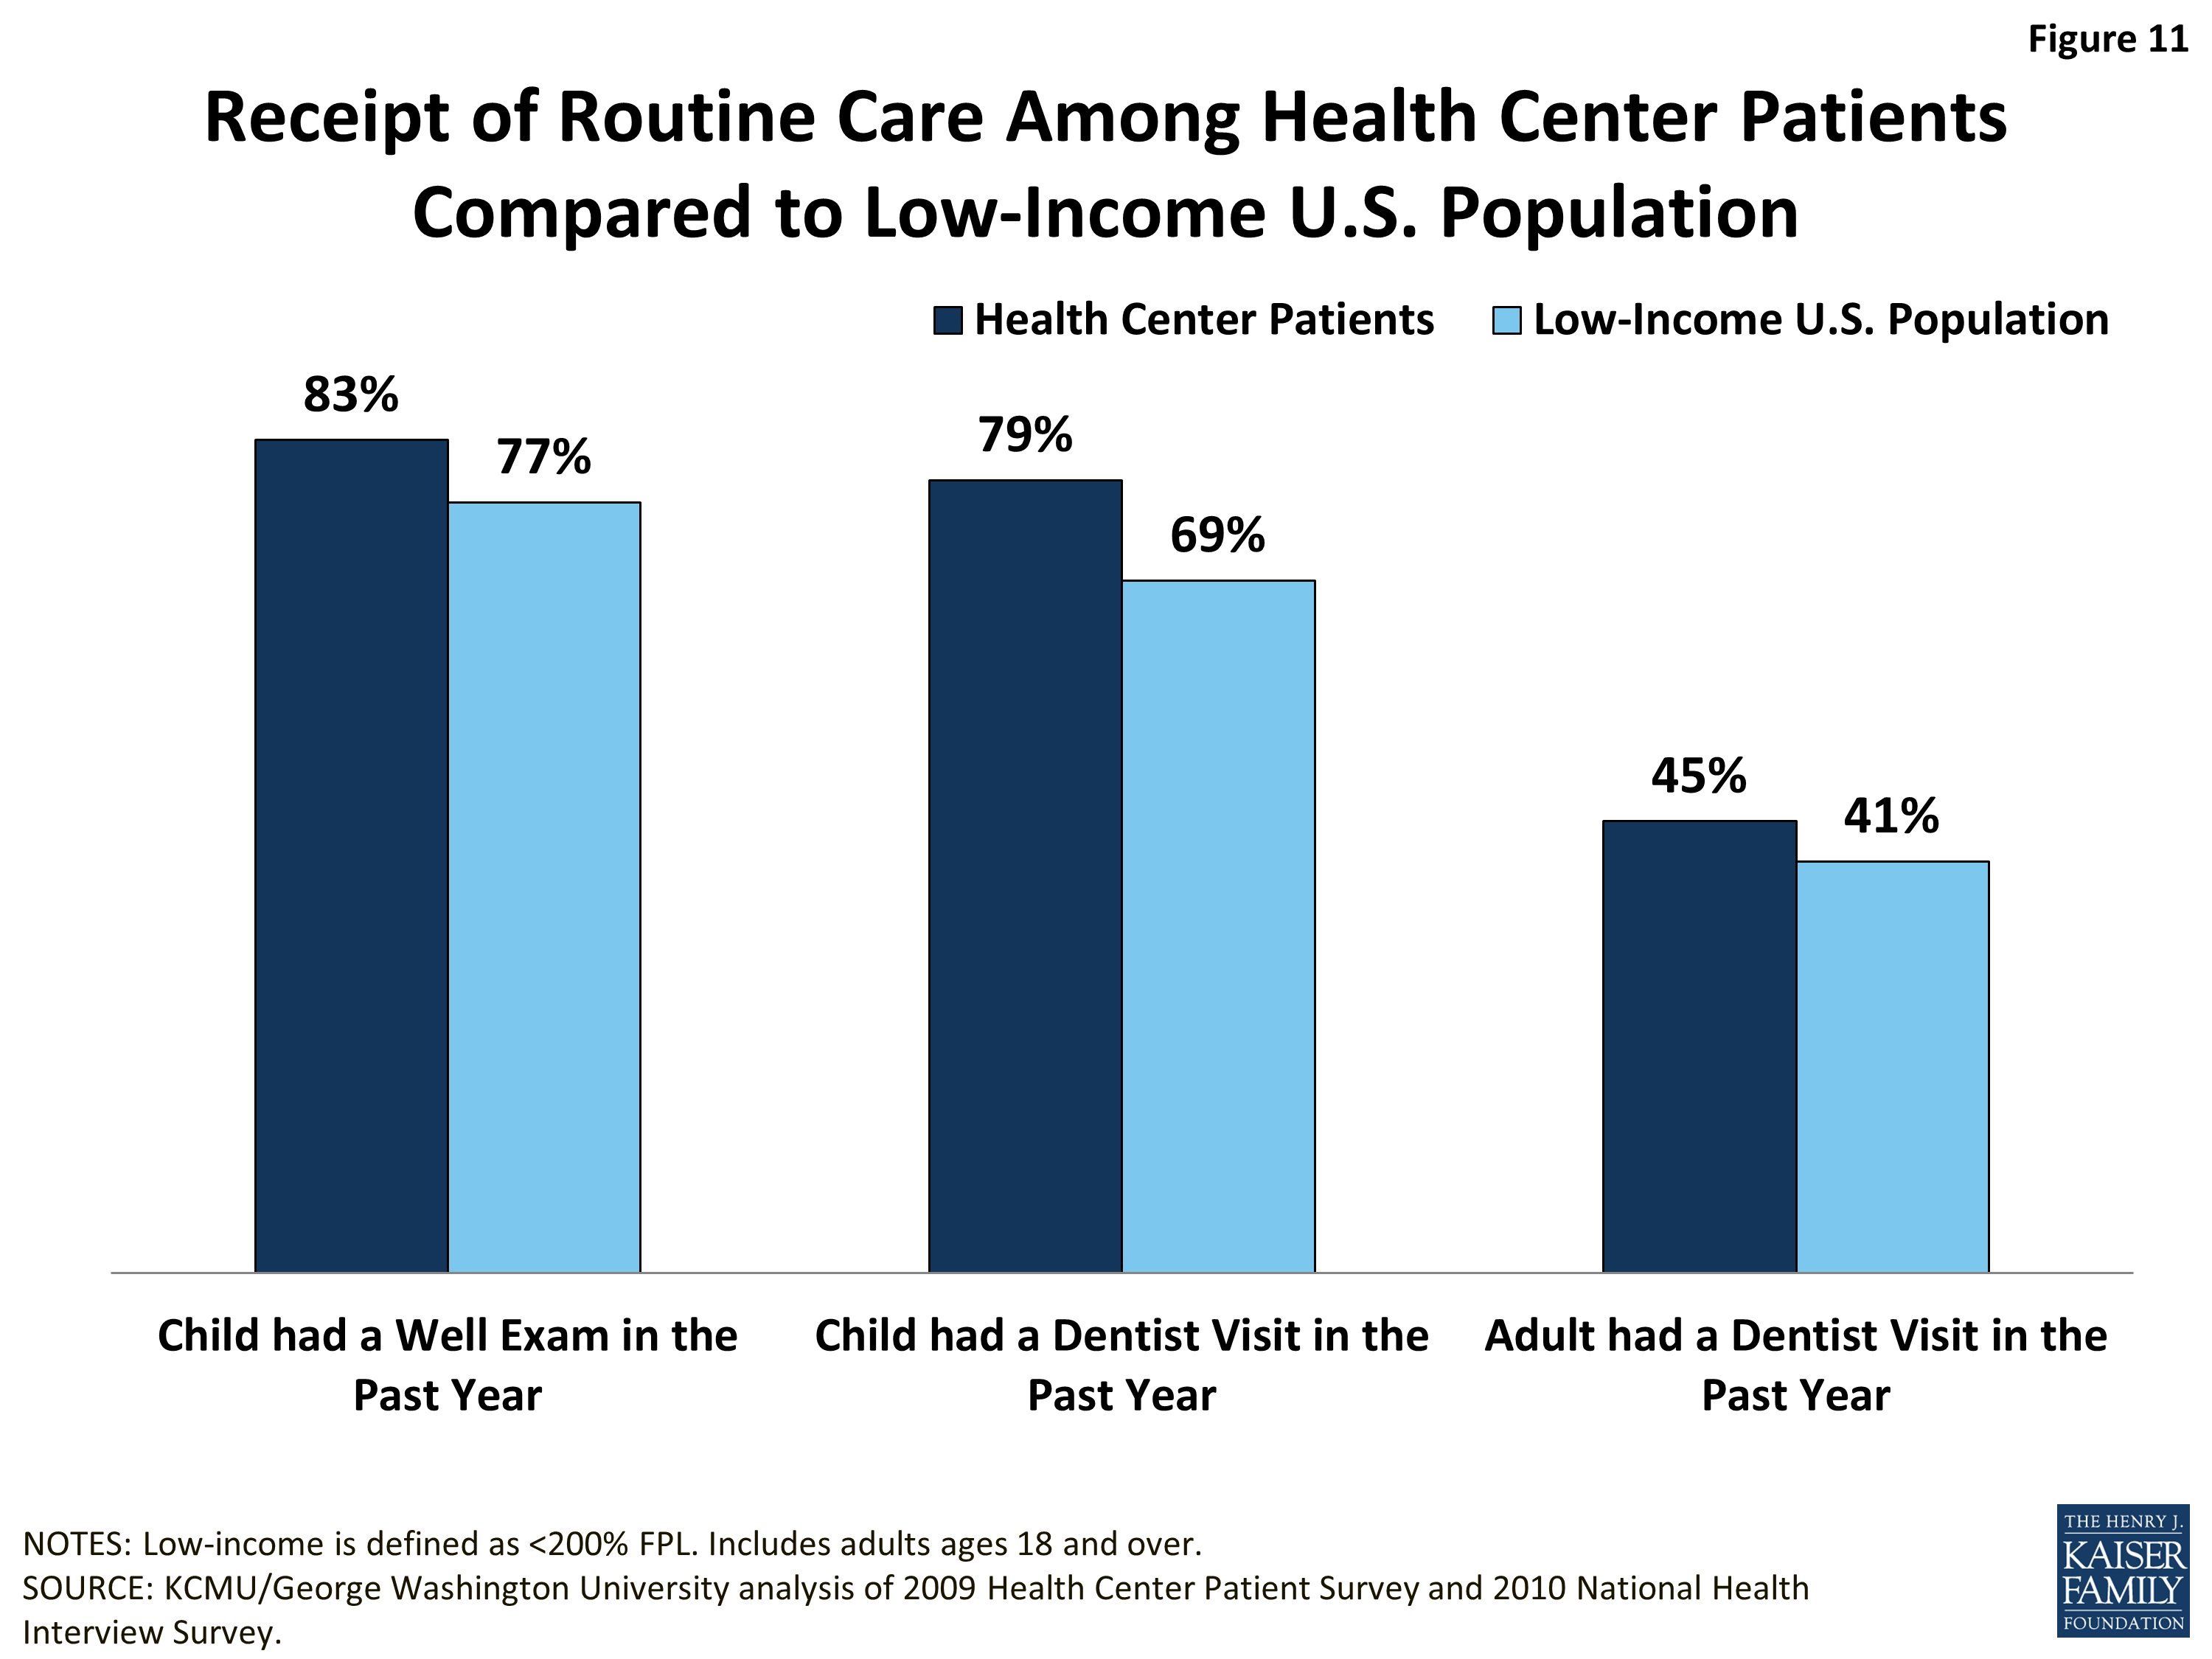
Well-child visits. On the most basic measure of preventive care for children—whether a child had a check-up within the past year—the data show that children who were health center patients fared better than children in the broader low-income population (Figure 11). This difference could reflect several underlying causes: patients who visit health centers may be more engaged in their care and thus more likely to visit a doctor for well-visits; health centers may do a better job of bringing patients in for routine care; or patients not seeking care at a health center may encounter barriers to well-child visits.
Dental visit. Health center patients are at least as likely as the general low-income population to report having had a dental visit in the past year (Figure 11). The share of adults with a dental visit is similar between the two populations. The fact that, in both groups, fewer than half received a visit warrants concern given the importance of good oral health to good overall health. The low visit rate likely reflects the high uninsured rate among low-income adults as well as very limited Medicaid coverage of adult dental benefits and low dentist participation in Medicaid. The low proportion of adult health center patients with a dental visit may also reflect the fact that, while dental care has been a priority expansion service for health centers, as of 2011, only 78% of all health centers reported offering dental care.6 Dental visit rates are higher among children, likely because of Medicaid’s comprehensive benefit package for children, known as EPSDT, which includes oral health services. Notably, children who are health center patients are more likely than low-income children overall to report a dental visit in the past year (79% vs. 69%). It is possible that children who receive at least some care in health centers are more connected to the health care system generally (including dental care), compared to all low-income children, or that they have better access to dental care through health centers compared to children who do not use health centers. The extent to which health centers that offer dental care focus on pediatric oral health also may be a factor.
Considering that health center patients are more likely to be uninsured than low-income people overall, it is interesting that they appear at least as likely to secure a dental visit. This finding may reflect the fact that, as mentioned earlier, most health centers offer dental care. At the same time, given that it is not possible to know whether the care received was preventive in nature or treatment for a dental problem, this finding is difficult to interpret. It could indicate a stronger connection to the health care system among health center users compared to low-income people overall, the availability of dental services in most health centers, and/or higher rates of oral disease among health center patients.
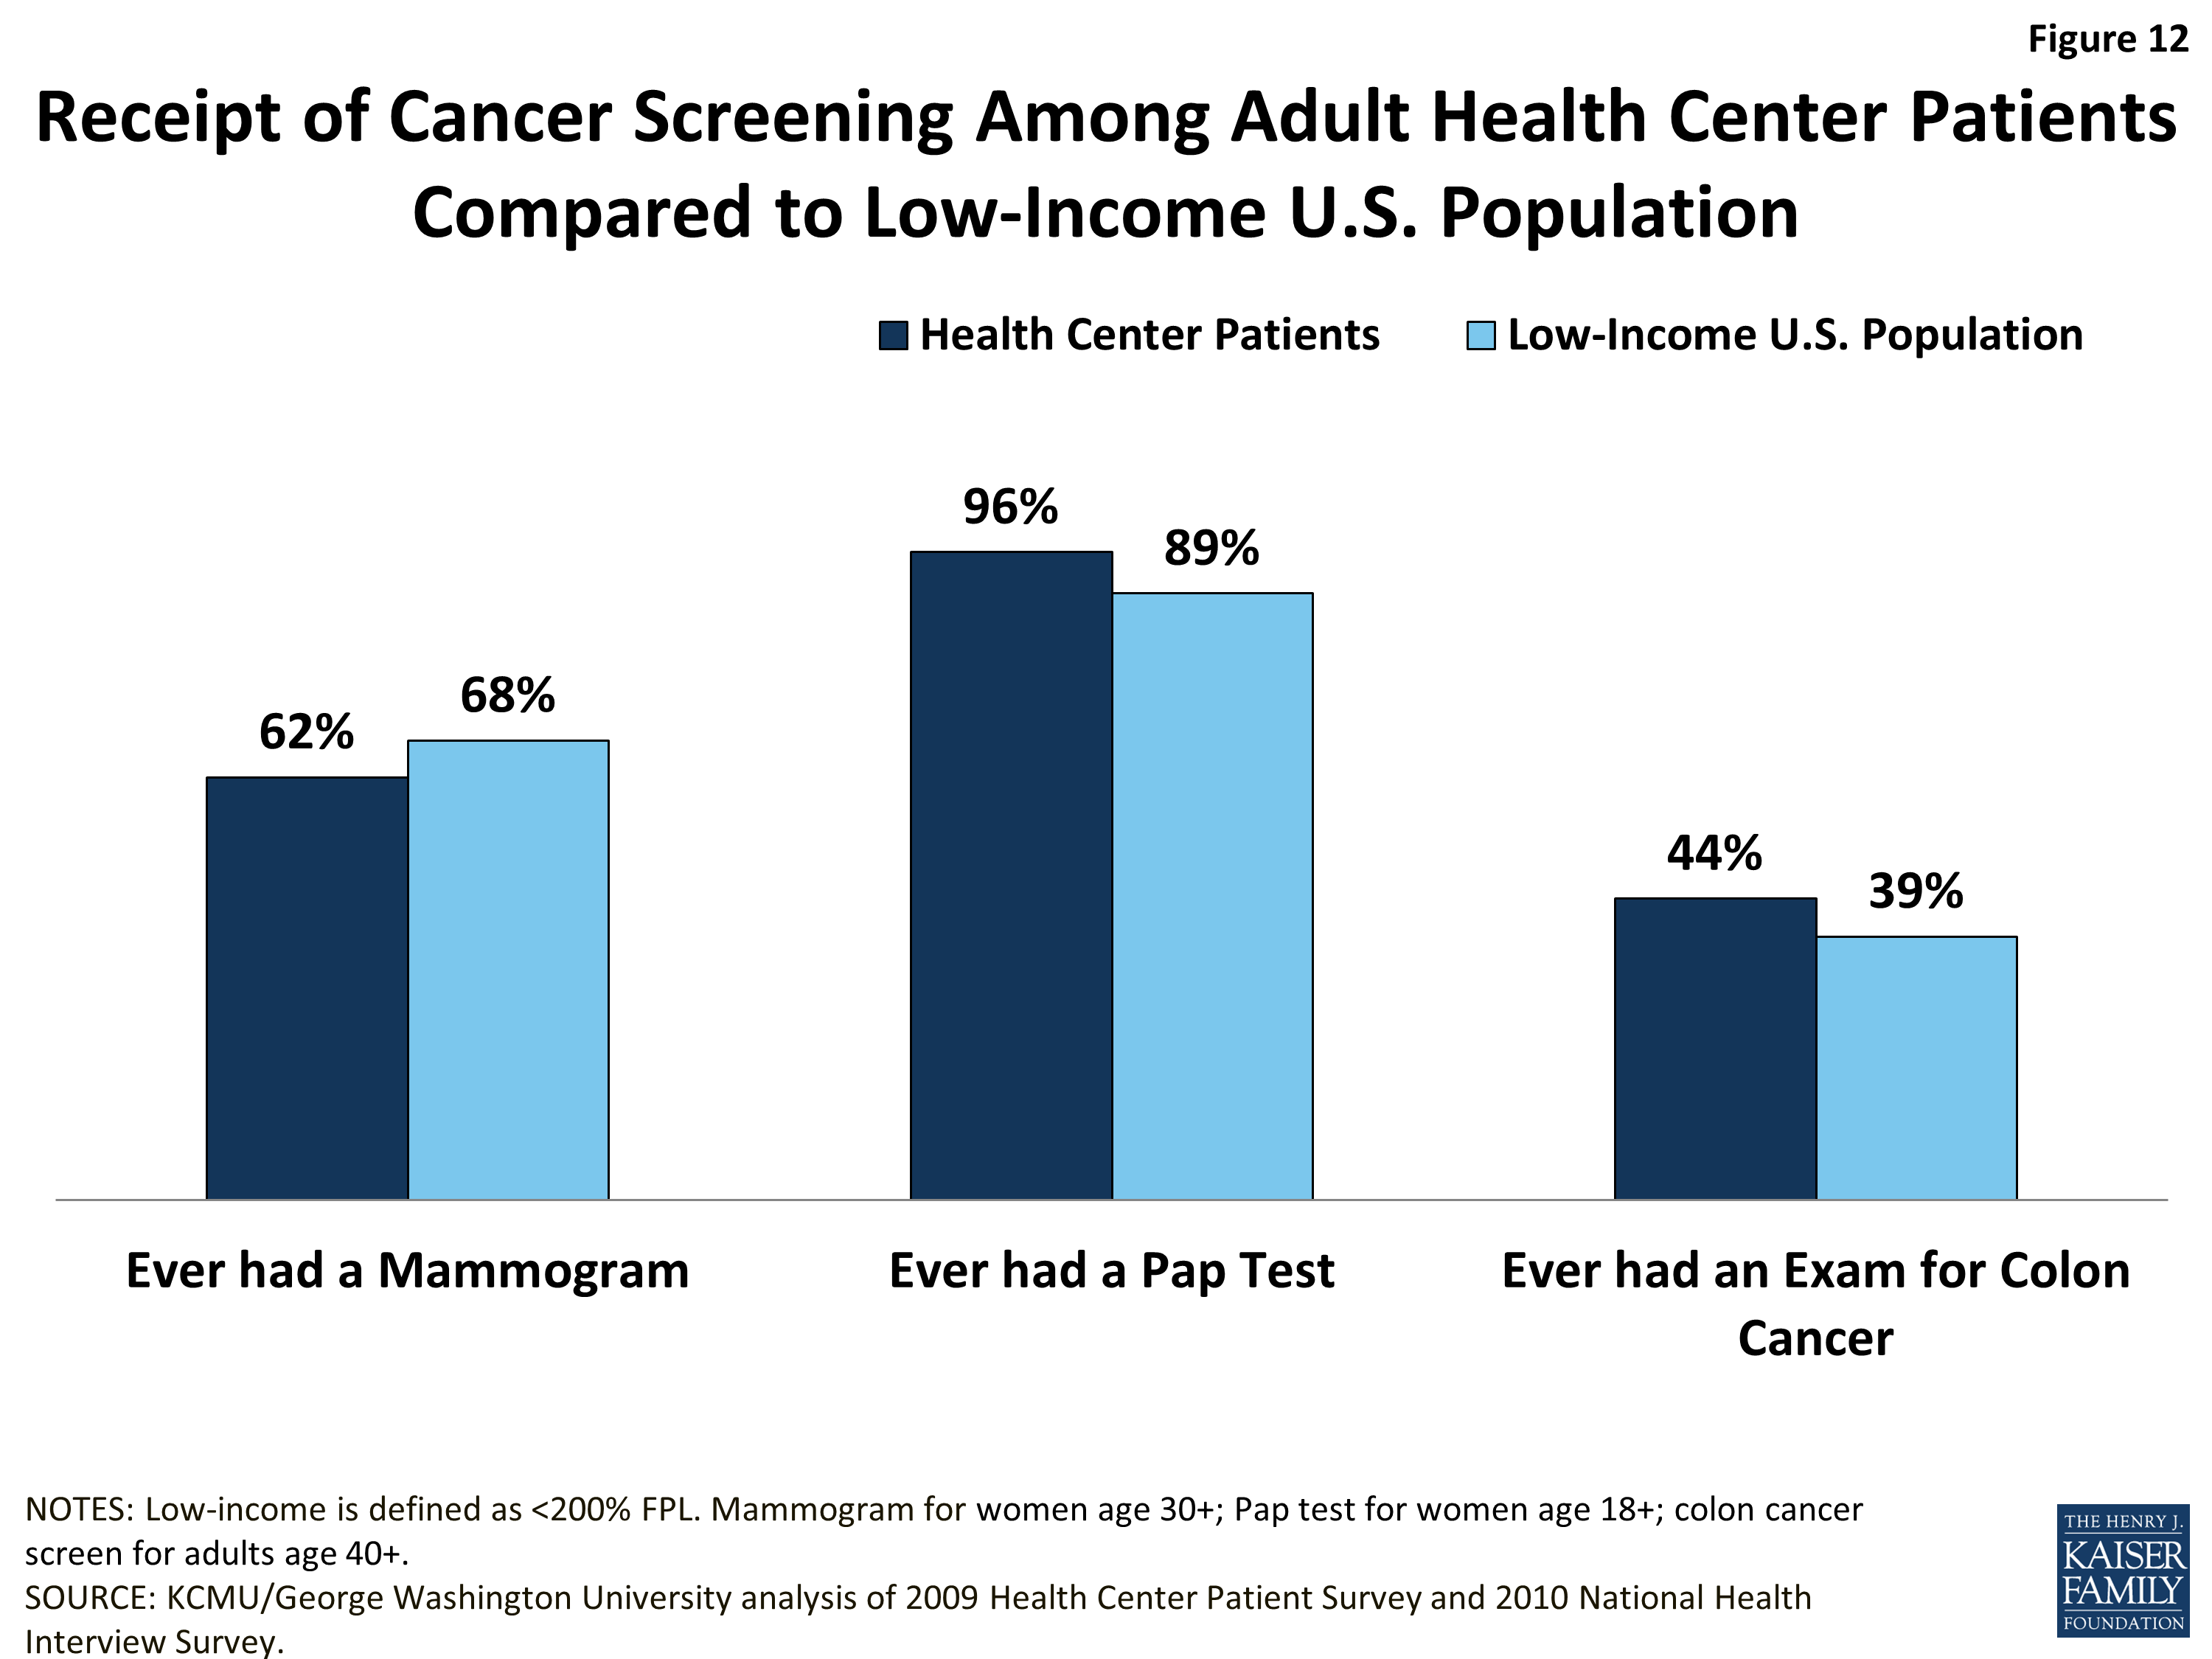
Cancer screening. Adult health center patients are at least as likely as low-income adults overall to report ever having received a Pap test (women only) or an exam for colon cancer, but appear slightly less likely to report ever having received a mammogram (women only) (Figure 12).
Follow-up and Chronic Care
Follow-up cancer care. In addition to check-ups and screenings, referral for follow-up services and ongoing management of chronic illnesses are core components of comprehensive care. The findings on health center patients’ access to follow-up cancer tests are mixed and caution is required in interpreting them.
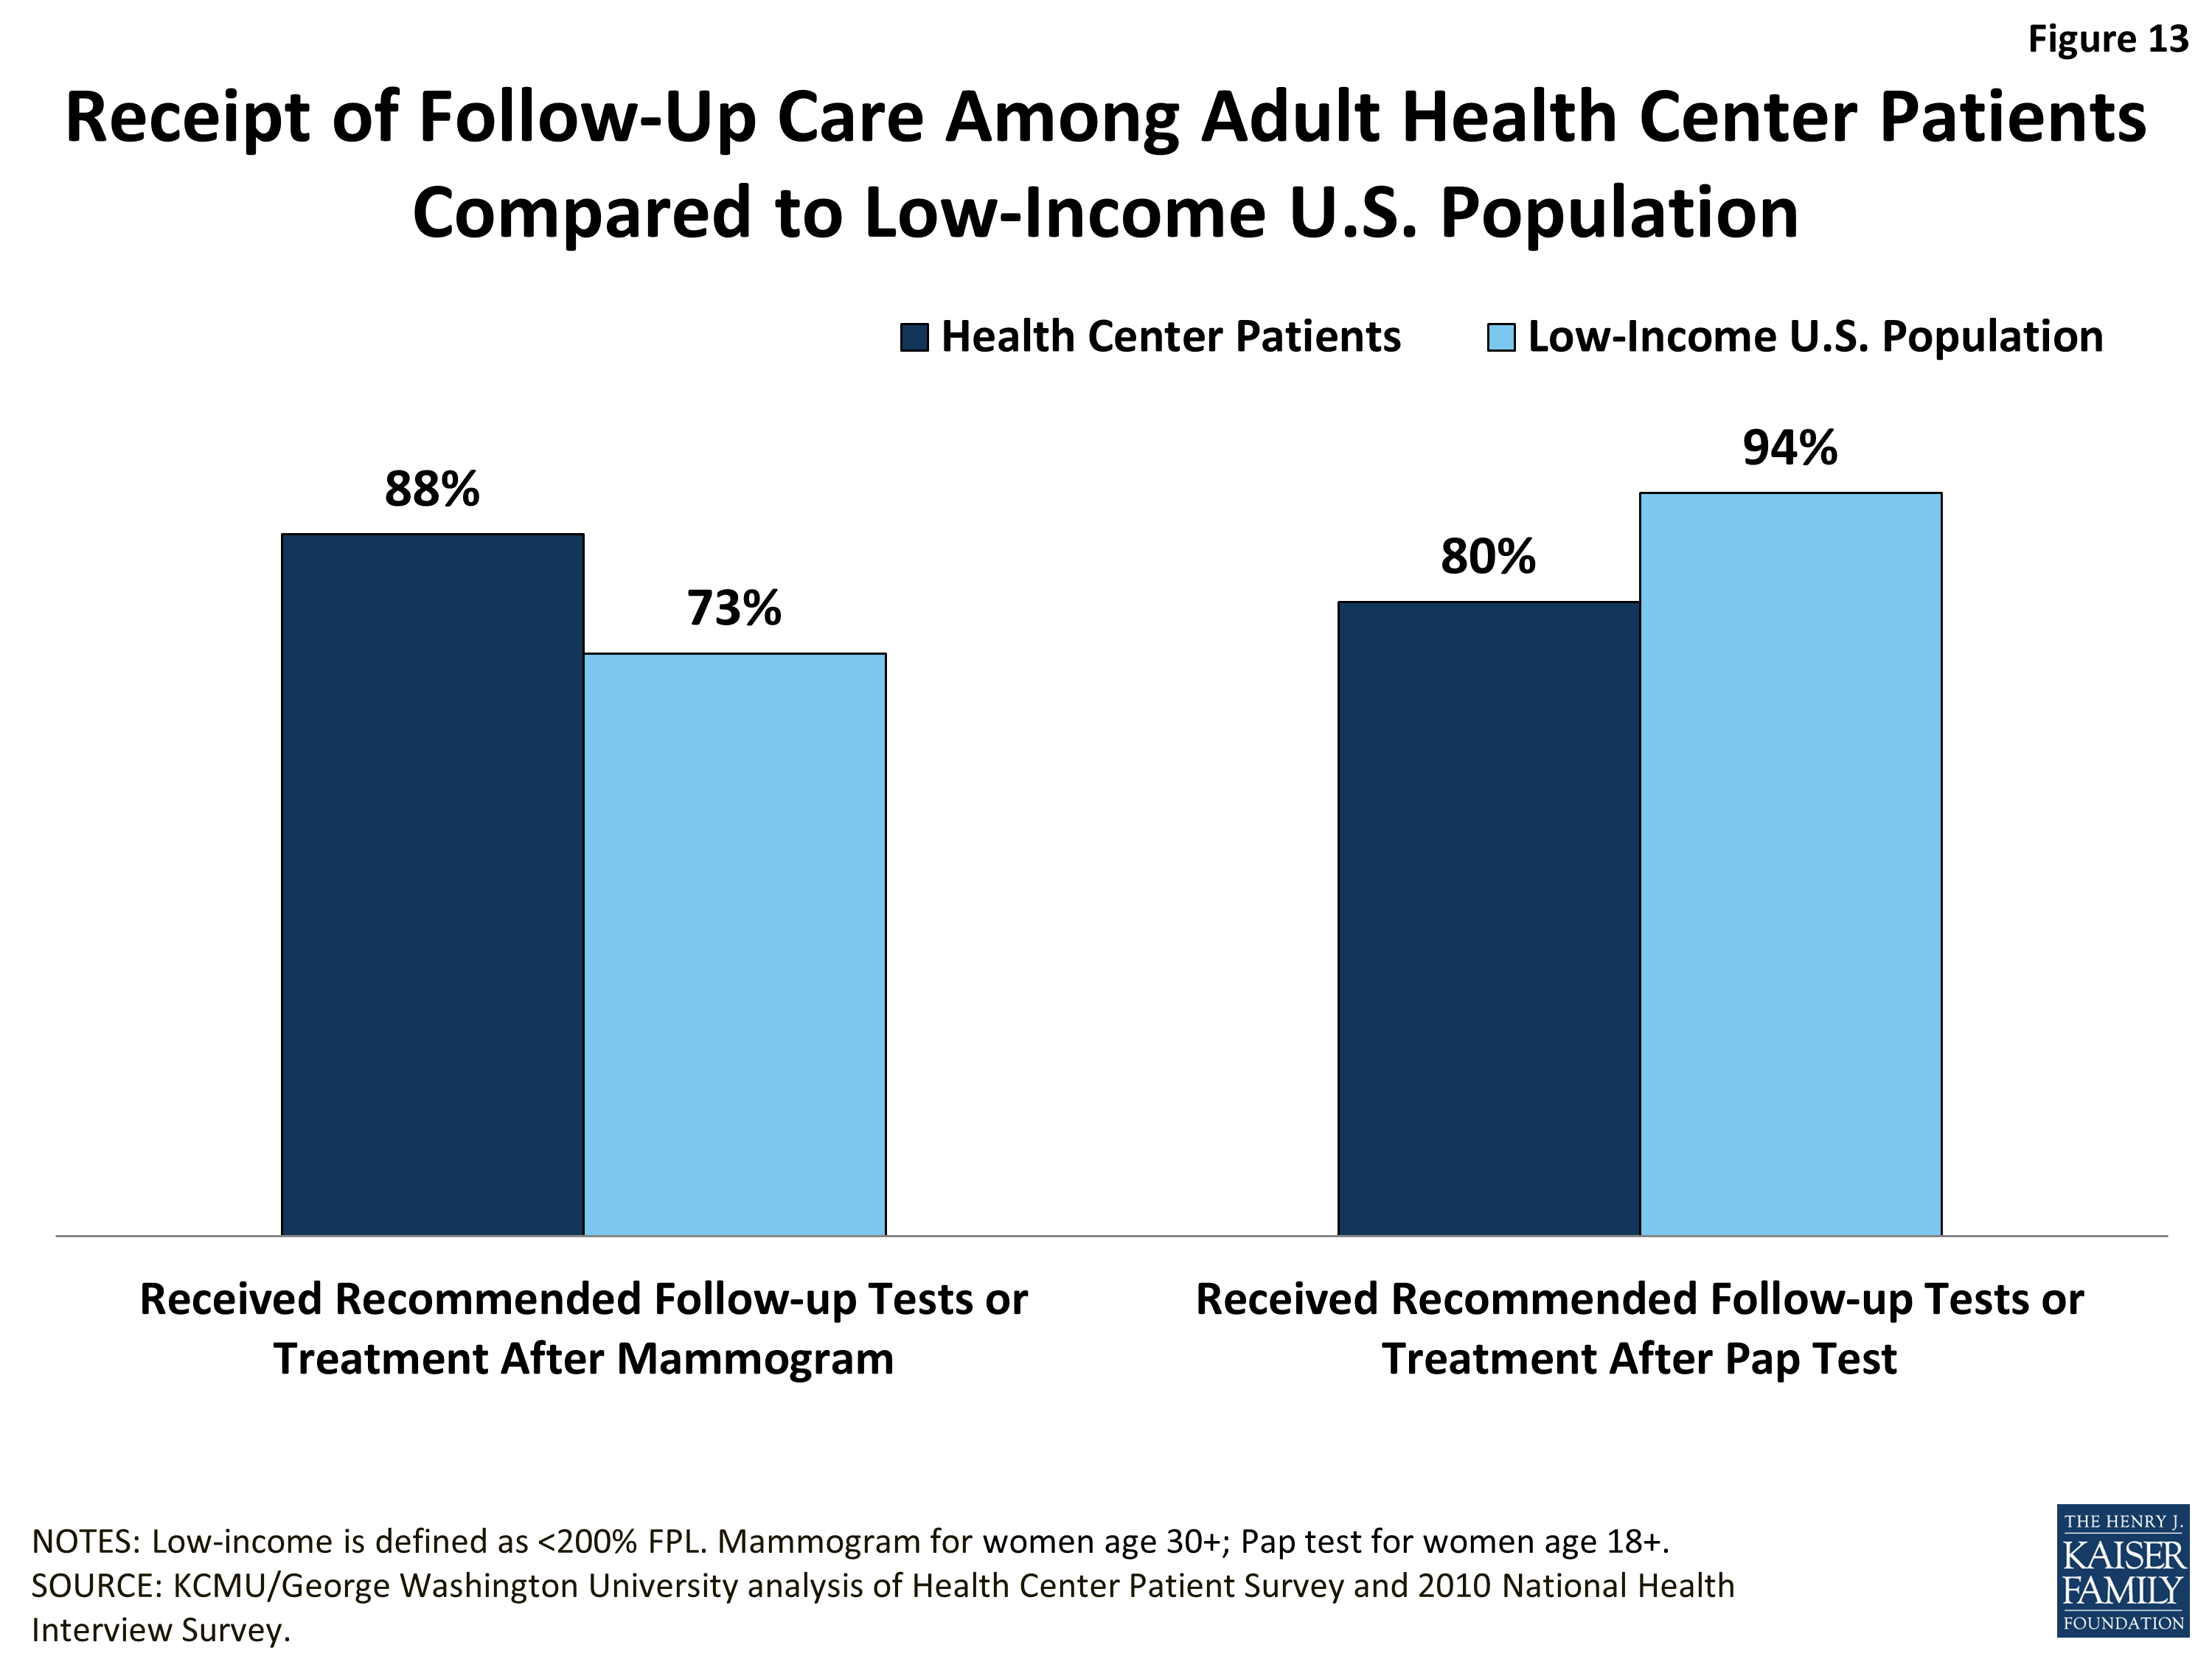
Although female health center patients are slightly less likely than all low-income women to report ever having received a mammogram, those who did have a mammogram and were referred for follow-up care are more likely (88% versus 73%) to have reported receiving the recommended follow-up care (Figure 13). At the same time, although they are slightly more likely than low-income women overall to report ever having received a Pap test, health center patients who did receive a Pap test are markedly less likely to report that they received the recommended follow-up care. Because health centers’ capacity to provide or arrange for specialist care, including cancer treatment, is very limited, measures of receipt of recommended follow-up cancer care by health center patients may reflect more about the issue of low-income people’s access to specialty care broadly, than about health centers or health center patients in particular. At the same time, a separate study of family planning services at health centers (which include Pap tests) suggests that health centers may focus less on providing this cancer screening service than other family planning services.7 Differences in follow-up care between health center patients and all low-income people may also stem from insurance differences between the two groups that affect their access.
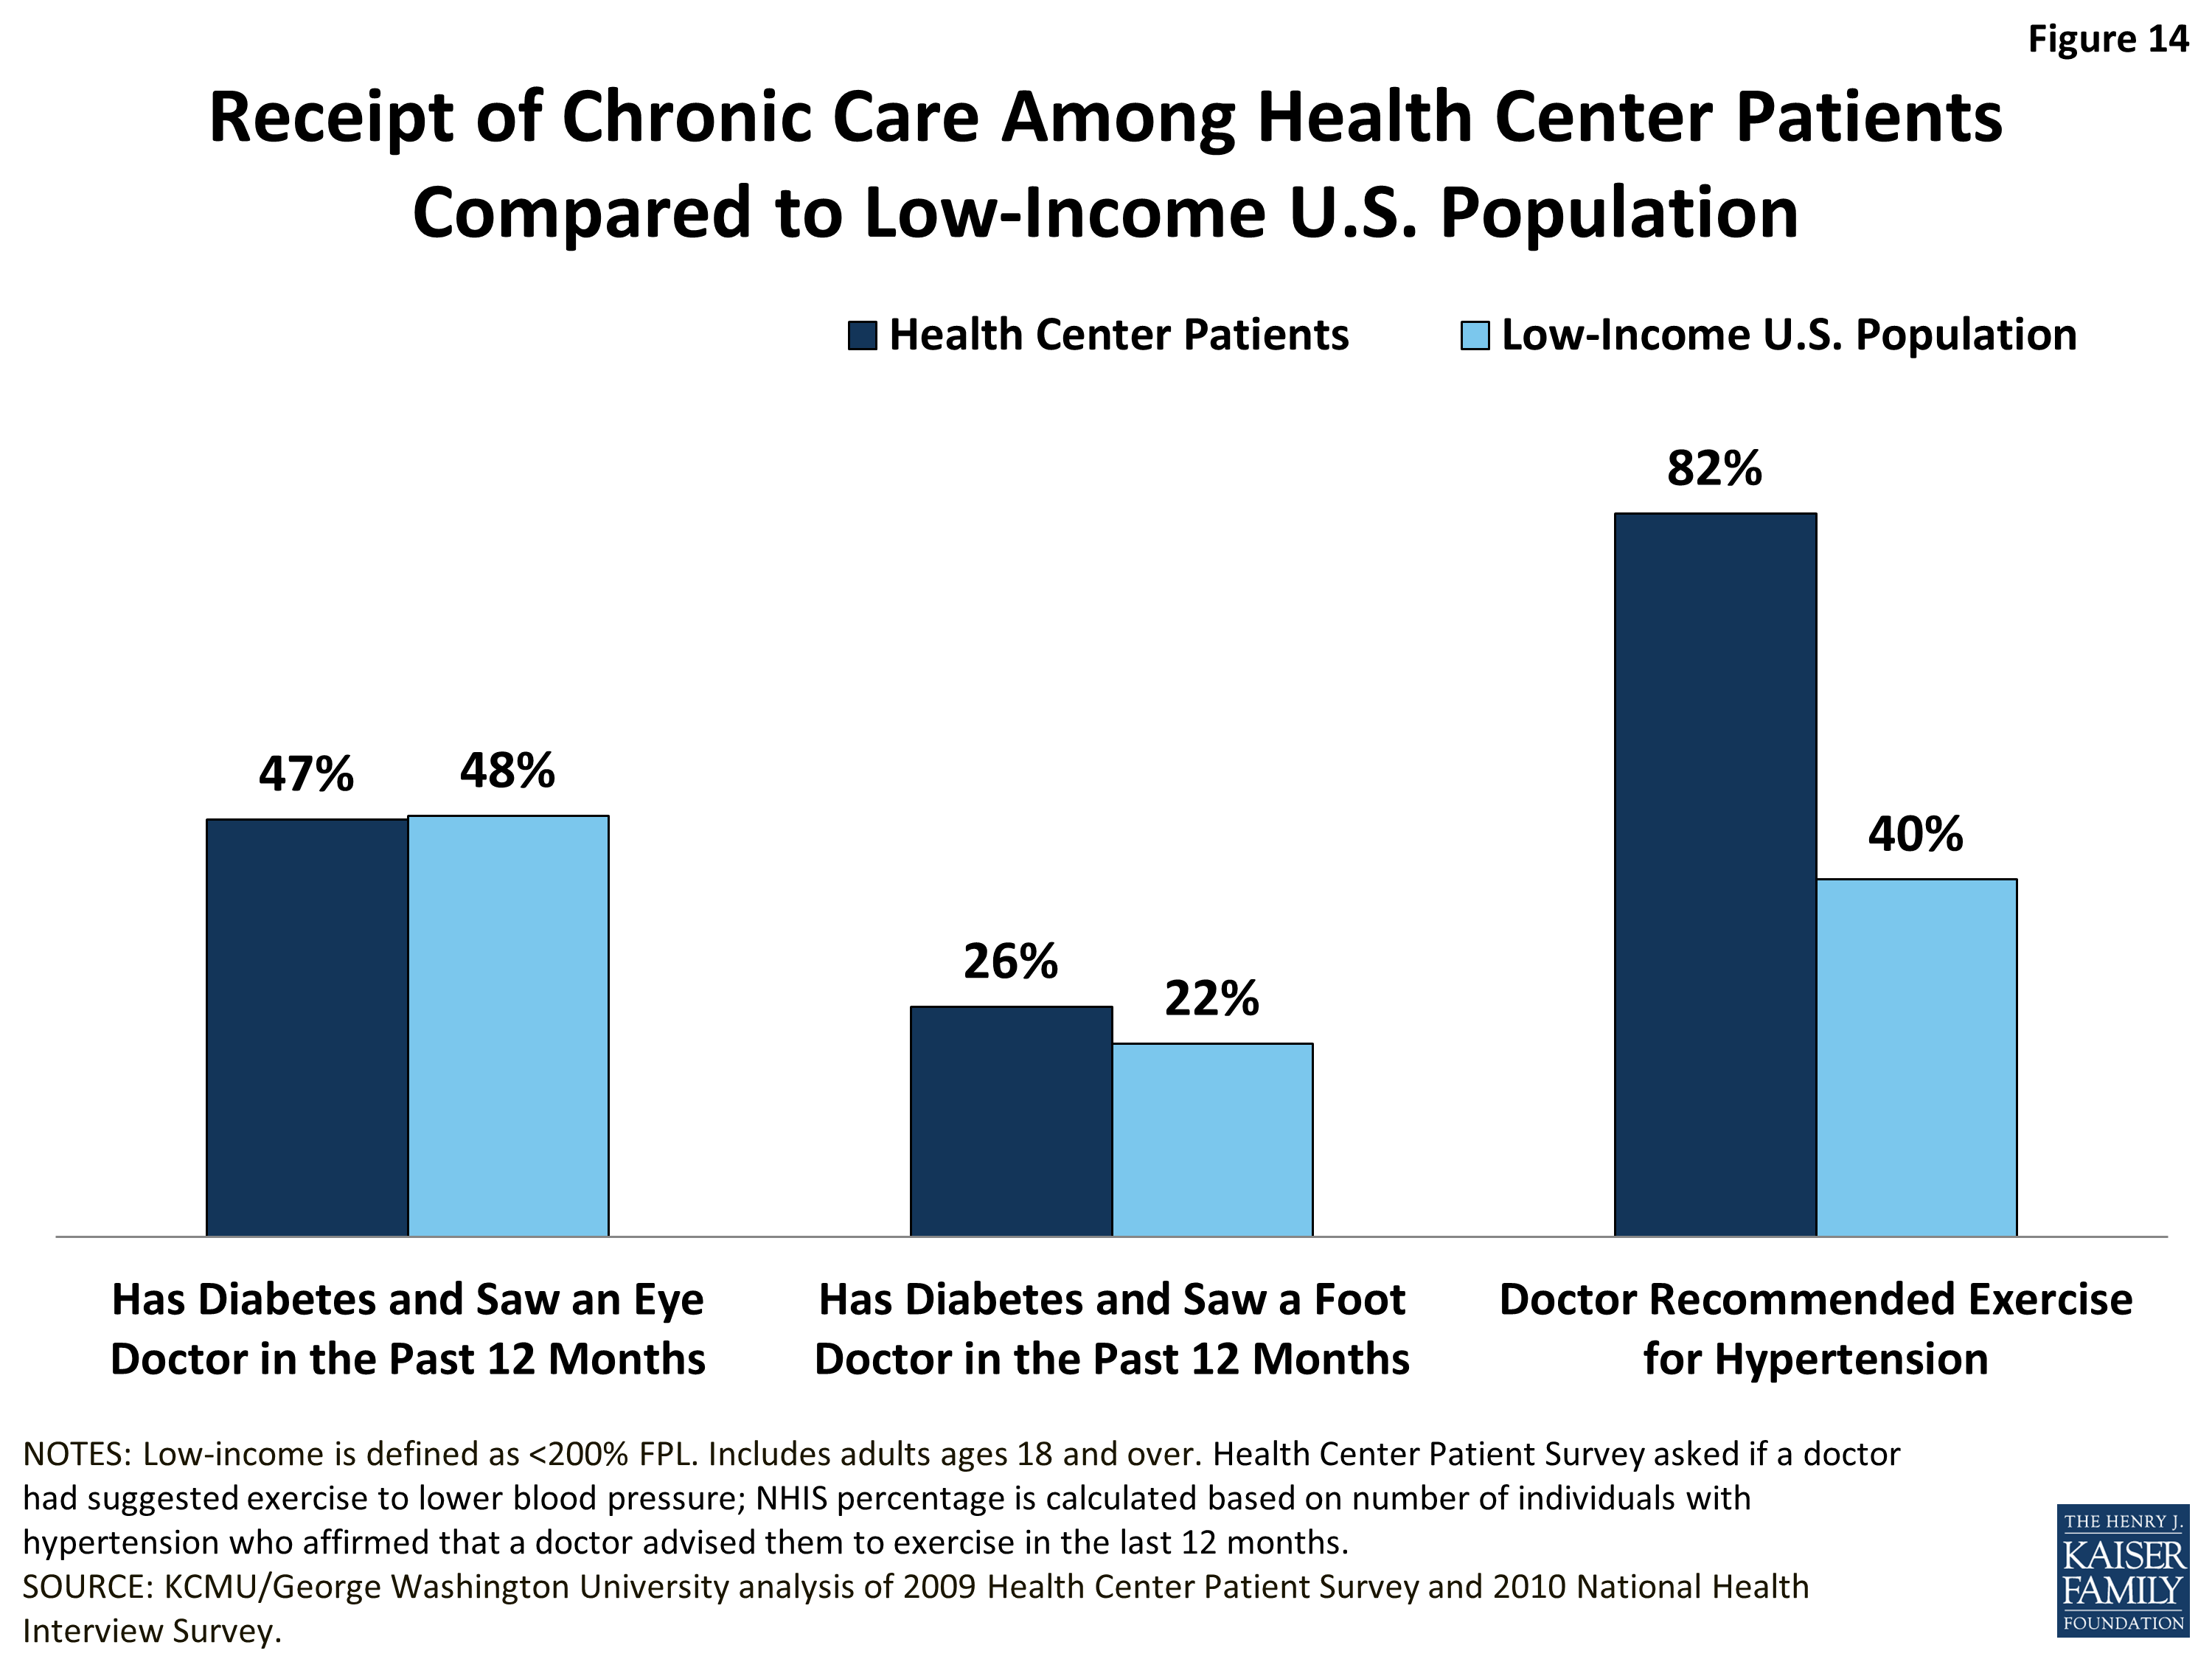
Chronic care. Among adults with diabetes, health center patients and all low-income adults report relatively similar rates of receipt of care to manage their diabetes. Roughly half of both populations report having seen an eye doctor in the past 12 months, and about one-quarter report having seen a foot doctor (Figure 14). As with cancer care, the follow-up eye and foot care described here is specialty care that health centers generally do not offer; thus, these measures, too, are indicators of access to specialty care among low-income people, rather than of health center performance or effectiveness.
Adult health center patients with hypertension are more than twice as likely as all low-income adults with hypertension to report that a doctor recommended exercise for them (82% vs. 40%). Some of this difference may reflect methodological differences in how the rates for the two groups are determined. The rate for health center patients is based directly on the Health Center Patient Survey question that asks respondents if a doctor suggested exercise to lower their blood pressure. The rate for low-income adults was derived as the share of NHIS respondents with hypertension who affirmed that their doctor advised them to exercise in the last 12 months. As distinct from the other two measure of chronic care, which require access to specialists, a recommendation to exercise is squarely within health centers’ preventive and primary care capacity. The higher rate of receipt of this intervention for hypertension among health center patients compared to low-income adults overall suggests that health centers are playing an important role in fostering patient self-management of this prevalent chronic condition.
Issue Brief: Conclusion
The findings of this analysis point to two important sets of implications stemming from the ACA. The first has to do with the impact of health reform – primarily, the Medicaid expansion – on current health center patients and operations. The second concerns potential changes in the profile of the patients who seek care from health centers and potential resulting changes in health centers’ activities and role in the health care system.
Impact of coverage expansions on current health center patients and operations.The ACA is expected to significantly expand health coverage among current health center patients. A recent study estimates that approximately 4 million uninsured health center patients will gain coverage in 2014 through the Medicaid expansion and the new Marketplaces.8 In the 26 states (including DC) moving forward with the expansion, an estimated 2.8 million uninsured health center patients will gain coverage, of whom roughly 1.2 million will gain Medicaid. In the 25 states that, as of October 2013, were not moving forward with the expansion, about 1.2 million uninsured health center patients will gain coverage through the Marketplaces. However, over 1 million health center patients who could have gained Medicaid will remain uninsured.
State decisions on the Medicaid expansion have implications not only for health center patients but also for health center operations, because increased insurance coverage will generate new third-party revenues that health centers need to expand and improve care. The same study mentioned above estimates that health centers in the states expanding Medicaid will see $900 million more in patient revenues than they would have had they elected not to expand Medicaid. By the same token, health centers in the states not moving forward will miss out on an estimated $555 million in Medicaid revenues in 2014 – about half of the total $1.2 billion in new patient revenues that they could have generated if their states had opted in favor of the expansion.
An important positive implication of expanded coverage is that patients will join health plans that offer provider networks and formal referral arrangements that should improve their access to specialist care that is not furnished directly by health centers. Several factors currently contribute to health centers’ struggle to secure referrals.9 The first is their location in medically underserved communities, where the number of specialists is limited. A second factor is the slow development of formal affiliation agreements between health centers and specialty care practices and institutions.10 A third factor may be the fact that health centers must guarantee that all their patients, not only the insured ones, have access to specialty referrals; this requirement may reduce specialists’ willingness to enter referral arrangements if they seek to avoid a high volume of uncompensated cases. Even as health center patients gain insurance and plan membership under the ACA, travel time and distance to providers may continue to pose obstacles to access. In many communities, health centers are seeking to overcome travel and financial barriers through telemedicine arrangements with specialists. However, whether insurers will cover telemedicine consultations remains to be seen.
Health center patients are at higher risk for social and behavioral as well as health problems. To serve these patients effectively, the health care system, including health centers, must function at a higher level and on a broader set of fronts than the clinical health care front alone. A number of new demonstration programs and funding opportunities under the ACA are ushering in important system changes that have the potential to improve care for health center patients. In particular, increased funding for health centers provides support for expanded services, such as behavioral health care and dental care. Further, a new ACA demonstration program to test the patient-centered medical home (PCMH) model in health centers offers promise as a path to addressing patient needs more comprehensively. More than 500 health centers are participating in this program. Going forward, a key challenge will be to ensure that public and private insurers incorporate into their payment systems the financial support needed to sustain the PCMH model, which requires not only excellent clinical practice, but also greater patient engagement efforts, including the development of strong provider-patient relationships, investment in care management, ongoing communication, increased time, health education and patient supports, and the use of health information technology.
Health centers in the states not moving forward with the Medicaid expansion, and even in the states that do expand Medicaid, will continue to serve a large share of uninsured people and will need ongoing grant funding to treat these patients. They will also need grant support to cover the costs they absorb for insured patients who are unable to afford their cost-sharing amounts. In addition, they will have to bear the costs of non-covered services (e.g., adult dental care) and services for insured patients who hit their treatment limits (e.g., an annual maximum number of mental health visits). Further, despite the relative breadth of the essential health benefits, they are unlikely to include the array of health supports needed by low-income adult health center patients, such as health education and transportation, or social services, such as assistance with enrolling in and renewing their insurance. In Massachusetts, where health centers are in their sixth year of operating in a health reform environment, grant funding remains essential to program operations. Federal grant funding comprised approximately 18.3% of Massachusetts health center revenues in 2011, defraying the costs of serving both uninsured patients and uninsured clinical and health support services.11
ACA impact on the profile of patients that health centers will serve. The ACA will expand coverage not only among current health center patients, but also among the broader communities that health centers serve. As adults gain coverage, they can be expected to seek care, and in medically underserved communities (where uninsured adults disproportionately reside), the quest for care can be expected to further heighten the need for health center resources. An immediate after-effect of health reform in Massachusetts was a surge in the demand for primary care from health centers.12 Over the 2007-2011 time period, the number of patients served by health centers in Massachusetts grew by 6%, from 123,388 to 131,141. The growth was fueled by both insured and uninsured patients, as more insured people sought care and as more uninsured people turned to health centers as other sources of care for the uninsured shrank.
What will the new health center patients be like? Presumably, some will be similar to those who currently use health centers – very poor and confronting serious health risks and conditions. But many can be expected to be younger, healthier, and less impoverished men and women seeking primary health care that, for the first time, they can afford. Many health centers have established clinical sites on community college campuses and in other locations accessible to lower-income younger workers and their families. Given the possible shift in the demographic profile of the health center population under the ACA, current repositioning by health centers, to serve healthy individuals and families as well as patients with significant health needs, seems likely to continue, reshaping health centers’ role. In addition to increasing their capacity to manage chronic conditions, they may focus on building strong adult preventive services, including wellness programs, women’s preventive services, the full complement of adult immunization services, and other clinical services aimed at keeping adults healthy and active. This increased emphasis on prevention might also, in many communities, lead to partnerships between health centers and employers to offer worksite and community wellness activities that may reduce downstream health care costs and expand the role of health centers in advancing community health.
Additional support for this paper was provided by the RCHN Community Health Foundation.
Table 1
Table 1: Demographic Characteristics, Health Status, and Receipt of Preventive Care of CommunityHealth Center Patients and the Low-Income U.S. Population, 2009/2010
Health Center Patients
Low-Income U.S. Population
Weighted N
16.5 Million
91.2 Million
Demographic Characteristics
Age
Children (Age 0-17)
17.0%
33.4%
Non-Elderly Adults (Age 18-64)
78.4%
56.2%
Elderly Adults (Age 65+)
4.6%
10.4%
Race/Ethnicity
White
37.9%
47.1%
Hispanic
31.7%
28.0%
African American
21.7%
18.5%
Other
8.7%
6.4%
Primary Language
English
77.2%
76.7%
Spanish
22.0%
13.4%
Bilingual
N/A
5.5%
Other
0.8%
4.3%
Employment Status (Ages 18-64)
Working
39.6%
51.6%
Unemployed
23.5%
13.8%
Not in the Labor Force
36.8%
34.6%
Health Insurance Coverage
Uninsured
36.4%
27.7%
Medicaid
32.6%
31.6%
Medicare
6.5%
13.3%
Medicare-Medicaid Dual Eligible
4.6%
3.3%
Private Insurance
8.0%
25.7%
Health Status
All Ages
Self-Reported Health Status
Excellent, Very Good, or Good
67.7%
84.1%
Fair or Poor
32.3%
15.9%
Share in Fair/Poor Health by Insurance Coverage
Uninsured
34.4%
12.6%
Medicaid
32.1%
13.5%
Medicare
57.2%
42.4%
Private Insurance
17.4%
8.4%
Adults (Ages 18+)
Health Conditions that Individuals have Ever Had
Diabetes or Borderline Diabetic
19.2%
12.0%
Depression*
50.8%
49.2%
Anxiety*
35.4%
33.6%
Asthma
20.6%
14.3%
Hypertension
39.9%
30.5%
Two or More Conditions in Lifetime^
25.4%
16.6%
Risk Factors
Current Smoker
64.9%
27.1%
Obesity
48.1%
31.1%
Use of Care
Children
Receipt of Routine/Well Care
Child had Well Exam in the Past Year
83.0%
76.8%
Child had Dentist Visit in the Past Year
78.7%
69.4%
Adults (Ages 18+)
Receipt of Routine/Well Care
Adult had Dentist Visit in the Past Year
44.8%
41.4%
Receipt of Cancer Screening
Ever Had a Mammogram (Women ages 30+)
62.3%
67.7%
Ever Had a Pap Test (Women ages 18+)
95.5%
89.4%
Ever Had an Exam for Colon Cancer (Ages 40+)
44.4%
38.8%
Receipt of Follow-Up Care (Among Those Who Needed It)
Received Recommended Follow-Up Tests/Treatment for Mammogram (Women ages 30+)
88.4%
73.4%
Received Recommended Follow-Up Tests/Treatment for Pap Test (Women ages 18+)
79.9%
93.6%
Receipt of Chronic Care Among Adults
Has Diabetes and Saw Eye Doctor in Past 12 Months
47.2%
47.6%
Has Diabetes and Saw Foot Doctor in Past 12 Months
26.0%
21.8%
Doctor Recommended Exercise for Hypertension
81.8%
40.4%
NOTES: Data represent all ages unless otherwise noted. Data for health center patients are for the year 2009, and data for the U.S. low-income population are for the year 2010.
* The Health Center Patient Survey asked respondents to self-report whether they had ever had anxiety or depression in their lifetime. The NHIS depression and anxiety questions were asked of sample adults who completed the Quality of Life supplement (administered to approximately one-quarter of sample adults). The questions asked respondents who reported feeling worried, nervous, or anxious at least monthly, or who took medication for those feelings, whether they agreed with the statement: “I have been told by a medical professional that I have anxiety/depression.”^ Conditions include diabetes, asthma, hypertension, liver condition, coronary heart disease, and emphysema.
SOURCE: KCMU/George Washington University analysis of 2009 Health Center Patient Survey and 2010 National Health Interview Survey (NHIS).
Methods Appendix
Data Sources: This analysis uses data from the 2009 Health Center Patient Survey and the 2010 National Health Interview Survey (NHIS). The Health Center Patient Survey is a nationally representative survey of patients served by HRSA-supported community health centers. The survey collects self-reported information on socio-demographic characteristics, access to health care services, health status, utilization of services, and satisfaction and perceived quality of care. In the 2009 survey, 4,562 individuals were surveyed at 347 health center sites.To compare health center patients to the general population, we relied on the 2010 NHIS, a nationally representative survey of the health, health care access, and health services use of the civilian non-institutionalized population in the United States.13 We used the 2010 NHIS (rather than 2009, the year of the Health Center Patient Survey) because it included more variables of interest for this analysis than the 2009 NHIS. In order to have a national comparison group similar to health center patients, we restrict the NHIS sample to the low-income subpopulation (<200% FPL). The sample size for the 2010 NHIS low-income subpopulation was 31,020.
Analysis. For both the health center patient and NHIS samples, we examined socio-demographic characteristics including income, age, gender, race/ethnicity, language preference, employment status, and insurance status.
To evaluate adult health status, we compared self-perceived health status, report of smoking, and whether the respondent had ever been told that he or she had asthma, diabetes, hypertension, emphysema, liver or heart disease. We also assessed whether respondents had depression or anxiety. In the Health Center Patient Survey, we captured depression and anxiety based on self-reports of whether the respondent had ever had these illnesses in his/her lifetime. In the NHIS, we measured depression and anxiety using questions in the Quality of Life supplement, which is administered to approximately one-quarter of adults in the overall sample. These questions asked respondents who either (i) reported feeling worried, nervous, or anxious at least monthly, or (ii) took medication for those feelings, a follow-up question about whether they had been told by a medical professional that they had anxiety or depression. We used the follow-up question to estimate overall prevalence of depression or anxiety. Last, we measured obesity by calculating each respondent’s body mass index (BMI) based on self-report of height and weight.
We assessed receipt of preventive services based on whether respondents reported receiving routine annual physical and dental exams, as well as cancer screenings appropriate to their age and gender. Last, we measured receipt of follow-up care for women and chronic condition management for respondents with diabetes and hypertension.
Peter Shin, Jessica Sharac, and Sara Rosenbaum, Assessing the Potential Impact of the Affordable Care Act on Uninsured Community Health Center Patients: A Nationwide and State-by-State Analysis (Washington, DC: George Washington University School of Public Health and Health Services, October 2013), http://sphhs.gwu.edu/sites/default/files/GG%20uninsured%20impact%20brief.pdf. ↩︎
Peter Shin, Jessica Sharac, and Sara Rosenbaum, Assessing the Potential Impact of the Affordable Care Act on Uninsured Community Health Center Patients: A Nationwide and State-by-State Analysis (Washington, DC: George Washington University School of Public Health and Health Services, October 2013), http://sphhs.gwu.edu/sites/default/files/GG%20uninsured%20impact%20brief.pdf. ↩︎
The Latest Kaiser Health Tracking Poll finds a 13 percentage point rebound in support for the Affordable Care Act (ACA) among Democrats this month, but no overall movement in support or opposition to the ACA since the November poll found a negative shift in views following the problem-plagued rollout of the law. In December, 34 percent have a favorable view of the ACA and 48 percent have an unfavorable view. The share of Americans that expect to see no personal impact from the law reached a new high in Kaiser polling this month and now stands at nearly half the public. Still, the public is more likely to attribute negative consequences to the law (believing it has increased the federal deficit and caused many people to lose their insurance coverage) than to say it has had positive effects (such as lowering prescription costs for seniors, eliminating cost-sharing for preventive services, and providing rebates to consumers whose health plans spent too much on administration). Americans are divided on what they would like Congress to do next with the law, with about four in ten wanting the law to be expanded or kept as is and a similar share wanting to see it repealed (either being replaced with a Republican alternative or repealed and not replaced). This month’s survey also highlights some of the problems the uninsured continue to experience in accessing and paying for health care; for example, the uninsured are about twice as likely as those with insurance to report problems paying medical bills, and four times as likely to say they had trouble getting medical care in the past year.
Overall Views Remain The Same As In November, Despite Rallying Support From Democrats
The latest Kaiser Health Tracking Poll finds that in December, about a third (34 percent) of the public has a favorable view of the ACA, while nearly half (48 percent) view the law unfavorably, shares that are largely unchanged from November. Support rallied this month among Democrats – 68 percent of them now express a favorable view of the law, up from 55 percent last month.
Figure 1Figure 2
This month’s poll did not find a similar rebound in support among independents who say they lean toward the Democratic Party. In previous polls, this group’s views have pretty closely mirrored those of Democrats, but while the share of Democrats with a favorable view of the ACA jumped 13 percentage points from November to December, the share of Democratic-leaning independents viewing the law favorably was flat (49 percent in December, the same share measured in the November poll).
Views of the law continue to be overwhelmingly negative among both Republicans and Republican-leaning independents. Among “pure” independents this month (those who say they don’t lean towards either party), unfavorable views outnumber favorable ones by a margin of two to one (52 percent unfavorable versus 25 percent favorable).
FIGURE 3: Views Of The ACA Sharply Divided By Party ID
As you may know, a health reform bill was signed into law in 2010. Given what you know about the health reform law, do you have a generally favorable or generally unfavorable opinion of it?
Total public
Democrats
Democratic-leaning independents
“Pure” independents (don’t lean)
Republican-leaning independents
Republicans
Favorable
34
68
49
25
12
7
Unfavorable
48
13
25
52
78
80
Don’t know/Refused
18
19
27
23
10
13
Views also continue to tilt negative among women this month – a group that had historically been more evenly split on the law but shifted negative in November. This month, 49 percent of women have an unfavorable view of the ACA and 35 percent have a favorable view. This is similar to the split among men (32 percent favorable, 48 percent unfavorable).
When those with an unfavorable view of the law are asked why they feel this way, the most common responses have to do with concerns about costs (23 percent of those with an unfavorable view), opposition to the law’s individual mandate (18 percent), and concerns about the role of government (13 percent). Smaller shares say they are opposed to the process by which the law was passed or that individuals should have to pay for their own insurance (7 percent each). Two issues that have recently been in the news were each mentioned each by 6 percent as a reason their views are unfavorable: employers cancelling health insurance policies and a sense that the government hasn’t delivered on its promises.
FIGURE 4: In Their Own Words
Among the 48 percent who have an unfavorable view: Could you tell me in your own words what is the main reason you have an unfavorable opinion of the health reform law?
Category
Percent mentioning
Quotes
Cost concerns
23
“I am now paying more for my insurance than I was before.”“Increased the cost of my health care.”“The cost to the consumer is more.”“It’s going to bankrupt the country.”
Opposed to individual mandate/Unconstitutional
18
“Because it does not give me a choice of whether I want it or not.”“That it shouldn’t be forced upon people.”“It forcing people to do things they don’t want to do.”“I believe it is unconstitutional and it takes away from our freedoms as Americans.”
Concerns about government
13
“Because the government shouldn’t be involved in our health care.”“I don’t want the government sticking their nose into my private business.”“I think it’s an overreach of the federal government.”“Not a fan of socialized medicine.”
Opposed to process
7
“It was poorly thought out it was poorly executed it’s still not working out properly.”“Poorly thought out and poorly organized.”
Individuals should pay their own way
7
“Because it is asking those who work for a living to provide health care for people who take from the government.”“Because I’m getting tired of paying everybody’s bills.”“I think everyone should be able to fend for themselves and get what they can afford.”
Policy cancellations
6
“Don’t like the idea that some people had to have their health care cancelled, and the idea of them losing their doctors.”“My existing plan was cancelled and cost for my insurance has more than doubled.”
Didn’t do what it was supposed to
6
“I believe we were misled by the president.”“Because it was supposed to lower prices, but my premium has gone up.”“Because it’s nothing of what was promised, it’s caused all these people to lose their health care.”
Among those with a favorable view of the law, by far the most common reasons given have to do with the fact that the law will expand access to health care and insurance (57 percent). Just under one in ten of those with a favorable view also mention a belief that the law will control or decrease health care costs (9 percent), help people with pre-existing conditions (8 percent), and leave the country better off in general (7 percent).
FIGURE 5: In Their Own Words
Among the 34 percent who have a favorable view: Could you tell me in your own words what is the main reason you have a favorable opinion of the health reform law?
Category
Percent mentioning
Quotes
Expanding access to care and insurance
57
“Because it provides health care to a lot of people who wouldn’t have it otherwise.”“Because health care should be accessible for everybody.” “I can stay with my parents insurance.”“It gives our low income families in the country a chance at health care.”
Will make health care more affordable/control costs/lower costs
9
“Because for years the rising cost of health care has bankrupted the country. At least we are trying to do something.”“I believe it’s making health care more affordable.”“Because there are too many people who don’t have a way of paying for their health care without going bankrupt.”
Insurance reforms/Will help people with pre-existing conditions
8
“No cap, and that they can’t hold it against you for having a pre-existing condition.”“People are not being denied for no reason.”“It allows people with pre-existing conditions to get health insurance.”
Country/people will be better off generally
7
“A lot people have been benefited of the new health care law.”“I think it will be good in the long run for Americans.”“It helps people that need help.”
The public is divided this month on what it would like to see Congress do next with the law. Just over four in ten (42 percent) want to see the law repealed (including 16 percent who want it replaced with a Republican alternative and 26 percent who want it repealed and not replaced), while a similar share (43 percent) want Congress to expand the law (23 percent) or keep it as is (20 percent). This is a shift from October, when those who wanted to keep or expand the law outnumbered those who wanted to repeal it by a 10-point margin.
Figure 6
Public More Likely To Attribute Negative Than Positive Consequences To Law
In terms of views of what the law has accomplished so far, Americans are more likely to attribute negative rather than positive consequences to the ACA. Perhaps reflecting the recent focus on policy cancellations in the non-group market, six in ten believe the law has caused many people to lose their health coverage (61 percent), and a similar share believe it has increased the federal budget deficit (57 percent). These beliefs reflect deeper divisions on the law, as Republicans and those with an unfavorable view of the law are much more likely to attribute these consequences to the ACA than are Democrats and those with a favorable view.
When it comes to positive consequences, about half think the law has allowed many young adults to obtain coverage (48 percent), and a similar share believe the law has already reduced the number of people who are uninsured (45 percent). The public is less likely to think the law has lowered prescription drug costs for seniors (29 percent say the law has done this, including 22 percent of seniors), eliminated cost-sharing for preventive services (29 percent), helped slow down the rate of increase in health care costs (28 percent), and provided refunds for consumers whose health plans spent too much on administrative costs (21 percent). Democrats are more likely than Republicans and independents to attribute these positive consequences to the law, but still more than half of Democrats say the law has not done each of these four things or they are not sure if it has.
Figure 7
Largest Share Continue To Expect No Personal Impact
On a personal level, the share of the public saying they expect the law won’t make much difference for their own families reached a new high in Kaiser tracking this month. Nearly half (47 percent) now say they don’t expect the law to impact them, up from 41 percent last month. As to whether they’ve already been impacted, nearly two-thirds (64 percent) say they haven’t been helped or hurt by the law so far, while about a quarter say they’ve been negatively affected and one in nine say they’ve benefited from the law.
Figure 8Figure 9
Among those who say they’ve been negatively affected by the law, most (59 percent) point to concerns about health care costs as the specific way in which the law has hurt them. Just over one in ten mention cuts in benefits or scaled-back choices (13 percent), while ten percent mention coverage cancellations (either that they or someone they know has had their coverage cancelled, or that they fear their coverage will be cancelled because of the law). Among those who feel they’ve been helped by the law, nearly half (47 percent) mention expanded access to health care or benefits, while a quarter (25 percent) point to lower health care costs and 12 percent mention the extension of dependent coverage to adults under age 26.
Some Progress Perceived In Fixing Website Problems, But Government Still Gets Poor Ratings For Implementation
Attention to news about the ACA rollout continues to be high in December, with about six in ten saying they followed these news stories very (21 percent) or fairly closely (38 percent). The share saying they closely followed news about the ACA rollout is somewhat lower than the share paying as much attention to reports about the U.S. economy (67 percent), and about equivalent to the share that reports following news about the death of Nelson Mandela (62 percent). Just over half the public continues to say that news coverage of the law is mainly about politics and controversies, while 7 percent say it’s mostly about how the law will impact people and a third say it’s a balance of the two. The plurality (40 percent) say news coverage is mostly unbiased, but twice as many say coverage is biased against (34 percent) as biased in favor of the law (17 percent).
Figure 10
One of the main ACA stories in the news this month has been the ongoing government efforts to fix the website problems with the online health insurance marketplace, Healthcare.Gov. Half the public believes the federal government has made “a lot” (11 percent) or “some” progress (39 percent) in fixing these problems, while four in ten say there has been “not much” progress (26 percent) or “no progress at all” (15 percent).
Figure 11
Despite perceiving at least some progress on this front, the public continues to give the federal government very low ratings for implementing the law – eight in ten say they’re doing an “only fair” (31 percent) or “poor” job (50 percent), while just 15 percent rate it as “excellent” or “good,” similar to October’s ratings.
The public gives their state governments somewhat higher ratings than the federal government when it comes to implementing the law, though still more than six in ten think their state is doing an “only fair” or “poor” job. Residents of states that are operating their own health insurance marketplaces are about twice as likely as those in states defaulting to the federal marketplace to give their state government a positive rating for implementation (33 percent versus 17 percent), but even in these states the majority say the state is doing an “only fair” or “poor” job.
FIGURE 12: Federal Government Gets Poor Ratings for Implementation, States Only Slightly Setter
Regardless of whether you support or oppose the health care law, how good a job would you say the FEDERAL GOVERNMENT is doing implementing the law?
Regardless of whether you support or oppose the health care law, how good a job would you say your STATE GOVERNMENT is doing implementing the law?
Total public
Total public
Among those in states operating their own marketplace
Among those in states defaulting to the federal marketplace*
NET Excellent/Good
15
23
33
17
Excellent
3
4
6
2
Good
12
19
27
15
NET Only fair/Poor
81
63
55
68
Only fair
31
34
33
35
Poor
50
29
22
33
Don’t know/Refused
4
14
13
15
*includes those states with a state-federal partnership exchange
A Spotlight On The Uninsured
With new coverage for some individuals set to begin in a few weeks, more than half (54 percent) of the non-elderly uninsured continue to say they don’t have enough information about the ACA to know how the law will impact them, and seven in ten (69 percent) say they’ve heard only a little or nothing about the new health insurance marketplace. This month, 15 percent of the uninsured say they’ve been personally contacted by someone about the law through a phone call, email, text message, or door-to-door visit.
The survey also highlights the difficulties those without health insurance continue to experience in accessing and paying for medical care. Roughly half (49 percent) of the uninsured say their family has had problems paying medical bills in the last year, about twice as many as adults under age 65 with health insurance (26 percent). And 44 percent of the uninsured say they’ve had trouble getting medical care, four times the rate reported by those with insurance (11 percent). The uninsured also report other financial struggles at higher rates, including taking on a second job or extra hours at work and having difficulty paying housing costs.
Figure 13
The uninsured are also less likely than those with insurance to say their health needs are being met “very well.” This is true when it comes to both their physical health needs (31 percent of the uninsured versus 61 percent of the insured under age 65) and their mental or emotional health needs (42 percent versus 64 percent).
This Kaiser Health Tracking Poll was designed and analyzed by public opinion researchers at the Kaiser Family Foundation (KFF) led by Mollyann Brodie, Ph.D., including Liz Hamel, Bianca DiJulio, and Jamie Firth. The survey was conducted December 10-15, 2013, among a nationally representative random digit dial telephone sample of 1,206 adults ages 18 and older, living in the United States, including Alaska and Hawaii (note: persons without a telephone could not be included in the random selection process). Computer-assisted telephone interviews conducted by landline (602) and cell phone (604, including 304 who had no landline telephone) were carried out in English and Spanish by Princeton Data Source under the direction of Princeton Survey Research Associates International (PSRAI). Both the random digit dial landline and cell phone samples were provided by Survey Sampling International, LLC. For the landline sample, respondents were selected by asking for the youngest adult male or female currently at home based on a random rotation. If no one of that gender was available, interviewers asked to speak with the youngest adult of the opposite gender. For the cell phone sample, interviews were conducted with the person who answered the phone. KFF paid for all costs associated with the survey.
The combined landline and cell phone sample was weighted to balance the sample demographics to match estimates for the national population using data from the Census Bureau’s 2011 American Community Survey (ACS) on sex, age, education, race, Hispanic origin, nativity (for Hispanics only), and region along with data from the 2010 Census on population density. The sample was also weighted to match current patterns of telephone use using data from the July-December 2012 National Health Interview Survey. The weight takes into account the fact that respondents with both a landline and cell phone have a higher probability of selection in the combined sample and also adjusts for the household size for the landline sample. All statistical tests of significance account for the effect of weighting.
The margin of sampling error including the design effect for the full sample is plus or minus 3 percentage points. Numbers of respondents and margin of sampling error for key subgroups are shown in the table below. For results based on other subgroups, the margin of sampling error may be higher. Sample sizes and margin of sampling errors for other subgroups are available by request. Note that sampling error is only one of many potential sources of error in this or any other public opinion poll.
SummaryPrior to the enactment of the Affordable Care Act (ACA), a number of states used Section 1115 Medicaid Demonstration Waivers to expand coverage to adults and to operate Medicaid programs in ways not otherwise allowed under federal rules. Beginning in January 2008, Indiana began enrolling adults in its new Healthy Indiana Plan (HIP), which was authorized under Section 1115 waiver demonstration authority. Under the plan, Indiana uses Medicaid funds to provide a benefit package modeled after a high-deductible health plan and health savings account to previously uninsured very poor and low-income adults.
As enacted, the ACA called for an expansion of Medicaid for nearly all non-disabled adults with incomes at or below 138% of the Federal Poverty Level (FPL) that is largely funded with federal dollars. However, as a result of the Supreme Court ruling on the ACA, the Medicaid expansion is effectively a state option. The majority of states that have used Section 1115 waivers to expand Medicaid coverage to adults plan to implement the Medicaid expansion and transition current waiver coverage to new coverage under the ACA. By doing so, these states will receive the enhanced federal matching funds for this coverage. A smaller number of states with existing waivers that cover adults are not moving forward with the ACA Medicaid expansion and their waivers are set to expire beginning January 1, 2014. If these states do not renew their waivers, adults covered by the waivers will lose coverage when they expire.
On September 3, 2013, Indiana obtained a one-year waiver extension from the Centers for Medicare and Medicaid Services (CMS) with some amendments primarily related to who is eligible for coverage. CMS extended the plan “to not disrupt the coverage currently afforded in Indiana as the state continues to consider its coverage options.”1 While this temporarily preserves coverage for many adults currently covered by the waiver, it also leaves many who would be eligible under the ACA’s full Medicaid expansion without access to new coverage options. The waiver also allows for higher-cost sharing than otherwise allowed under the Medicaid program. The state also will not be able to access the enhanced federal matching funds tied to new coverage that is available to states implementing the Medicaid expansion. Governor Pence remains committed to expanding Healthy Indiana and continuing discussions with CMS. This brief provides an overview of HIP and the implications of the waiver extension and Indiana’s decision to not implement the ACA Medicaid expansion.
Goals for Healthy Indiana Plan
When enacted, HIP had 7 goals:
Reduce the number of uninsured residents in the state;
Improve statewide access to health care services for low-income residents;
Promote value-based decision making and personal responsibility;
Promote primary care and prevention;
Prevent chronic disease progression with secondary prevention (treatment, prescriptions);
Provide appropriate, and quality or evidence-based, health care services; and
Ensure state fiscal responsibility and efficient management of the program.
The HIP waiver renewal application shows progress in meeting each of these goals based on evaluations and analysis performed by the state, Mathematica and Milliman.
Eligibility and Enrollment in the Healthy Indiana Plan
Eligibility and Enrollment from 2008 – 2012. As approved in 2008, HIP expanded coverage to parents with dependent children with incomes above the state’s eligibility limit for full Medicaid coverage (22% FPL) and below 200% FPL and other adults with incomes between 0% and 200% FPL. While there was no enrollment cap for parents, other childless adults were subject to an enrollment cap of 34,000. At the end of 2008, 37,568 adults were enrolled in HIP. Two-thirds of those enrollees were childless adults and the remaining third were parents (Figure 1).2
Figure 1: HIP Enrollment of Parents with Dependent Children and Other Adults, 2008 -2012
Enrollment remained open for childless adults until March 2009 when it neared the enrollment cap. The state has since opened enrollment twice, but enrollment has fallen over time through attrition. As of December 2012, there were only 13,225 childless adults enrolled in HIP, accounting for only a third of enrollment allowed under its current cap of 36,500 and an additional 46,388 adults remain on the waitlist for coverage.3 In contrast, parent enrollment increased between 2008 and 2012, from about 12,000 parents to over 25,000.
A 2009 study found that compared to the commercially insured population in Indiana, the HIP population had higher utilization, costs, frequency of disease and morbidity. The study also found that individuals who enrolled earliest had the highest average risk scores suggesting that the most severe adverse selection was when the program was first implemented.4 At the end of 2012, most (70%) of the 39,005 total enrollees in HIP were poor and nine in ten (90%) had income below 150% of poverty.5 Nearly one in three (29%) was age 50 or older.6 Race distribution has stayed relatively steady over the course of the demonstration with over eight in ten identifying as White, one in ten as Black, and the remaining 7% identifying as either Hispanic or Native American.7
Eligibility and Enrollment Under the Waiver Extension. As of January 2014, individuals with incomes above 100% FPL will be eligible for premium tax credits to help purchase coverage through the new Health Insurance Marketplaces established by the ACA. As such, the 2013 waiver extension will decrease HIP eligibility levels from 200% FPL to 100% FPL for both parents and childless adults on April 30, 2014.8 For current HIP enrollees and childless adults on the waitlist, Indiana has a plan to transition those who have incomes between 100% and 200% FPL to Marketplace coverage. Similar to the original waiver, under the extension, parents will not be limited by enrollment caps or open enrollment periods, and will have the ability to enroll in HIP provided they make the required contributions (discussed below). Enrollment for childless adults, however, will be capped at 36,500 and limited by open enrollment periods. While the extension does not establish caps on parent enrollment, it allows Indiana to amend the waiver to change eligibility criteria for both parents and childless adults if the state finds that expenditures will exceed annual state funds. Due to funding constraints, HIP was never intended to cover all eligible residents. Estimated take-up has ranged from 5% to 16% of those eligible.9 State estimates predict total enrollment in HIP to be about 45,000 in 2014.
Program Design
The HIP benefit package is modeled after a high-deductible plan and health savings account.10 It consists of three components provided through managed care plans:
High-deductible coverage: After meeting a $1,100 deductible, individuals are covered for state-specified benefits up to a $300,000 annual cap and a $1 million lifetime cap.
Personal Wellness and Responsibility (POWER) Account: This account is used to cover the $1,100 in initial medical costs. The POWER Accounts provide incentives for participants to utilize services in a cost-efficient manner. To stay enrolled in coverage, HIP members make monthly contributions to their POWER Accounts (based on income but no more than 2% of income for enrollees at or below 100% FPL). Medicaid funds cover the gap between the enrollees’ payments and the $1,100 deductible amount required for the POWER Account. Employers are permitted to contribute up to 50% of the members required contribution to their employees’ POWER Accounts. The renewal for 2013 allows Not-for-profit organizations are allowed to contribute up to 75% of an enrollee’s contributions.
A portion of enrollees do not contribute to POWER accounts and the state pays the full amount. This portion was about 35% in 2008 and has decreased to about 21% of enrollees in 2010 through 2012. Of HIP enrollees not contributing to their accounts, about 13% were parents with no income or already contributing at least 5% of their family income to their child’s CHIP coverage. The other 87% of non-contributors were childless adults with no income.11 About 8% of HIP members ever enrolled in the program between 2008 and 2010 were disenrolled due to failure to make POWER account payments. This suggests that some low-income, uninsured adults are willing to make financial contributions to their health care, although as discussed above, many individuals in HIP have higher medical needs.
Preventive care: Individuals are covered for up to $500 in preventive care that is not subject to the deductible and does not draw from the POWER Account. By obtaining state-specified preventive care, enrollees can carry over state POWER Account contributions to the next year, which helps offset required enrollee payments.Evaluations have found 90% of HIP members have a physician visit within 12 months of enrolling as well as declines in the number of members reporting the ER as their usual source of care. Compared to Indiana’s Hoosier HealthWise (HHW) Medicaid population, HIP enrollees had higher rates of well-care visits (higher rates for caretakers than non-caretakers).12
Enrollees receive care through managed care plans that contract with the state. Once an individual selects or is assigned to a plan and makes an initial POWER Account payment, the enrollee must remain in that plan for 12 months.13 Currently, there are three managed care plans from which most enrollees choose—Anthem Blue Cross and Blue Shield (62% of the enrollees), MDWise with AmeriChoice (24%), and Managed Health Services (MHS) (9%).14 Enrollees who have an identified high-risk condition (e.g., cancer, organ transplant recipient, HIV/AIDS) receive benefits through the “Enhanced Services Plan (ESP) (4% of enrollees),” which is a fee-for-service inpatient health plan that also manages the state’s high risk pool.
Key Issues to Consider
The ACA Medicaid expansion eliminates the need for states to obtain a Section 1115 waiver to cover adults. One of the primary goals of the original HIP waiver was to reduce the uninsured.15 Prior to the ACA, states could only cover childless adults and receive federal Medicaid funds by obtaining a Section 1115 waiver. As such, section 1115 waivers that to expanded coverage to adults often included limited benefit packages, higher cost-sharing and/or enrollment caps to limit costs. Since the ACA expands Medicaid to adults with significant federal funding, the need for and role of waivers fundamentally changes. CMS guidance specifies that states will not be eligible for enhanced matching funds from the ACA if there is a cap on enrollment or a partial expansion. CMS has recently issued new regulations related to cost-sharing and it is not clear if they will grant waivers of these limits that would be eligible for enhanced matching funds.16
In the absence of the Medicaid expansion, coverage gaps will remain for poor adults in Indiana. The one year extension of HIP preserves coverage for the parents and other adults currently covered by the program. However, because enrollment in the program remains limited many poor uninsured adults who would be eligible for coverage under the Medicaid expansion will not gain access to coverage. Poor adults who are not enrolled in the waiver will remain ineligible for Medicaid and they also will be ineligible for tax credits for Marketplace coverage, which begin at 100% FPL. Recent analysis finds that some 181,930 poor adults in Indiana could fall into this coverage gap, representing 88% of the state’s poor uninsured (this analysis assumes that parents with incomes above 24% FPL and childless adults fall into the coverage gap because the waiver provides limited coverage).17 These individuals will not have other alternatives for full coverage and will likely remain uninsured. Further, the safety net of clinics and hospitals that has traditionally served the uninsured population will continue to be stretched in Indiana.
Without implementing the ACA Medicaid expansion, Indiana also will forgo significant amounts of federal financing. If Indiana implemented the Medicaid expansion, the state could see an additional $17.3 billion, or 24%, increase in federal funds over the 2013-2022 period with small increases in state funding $537 million or a 1.3% increase after accounting for savings due to reduced uncompensated care costs. States could also see additional savings and broader economic benefits from the increases in coverage and federal financing.18 Under the waiver renewal, Indiana is not eligible for enhanced federal matching funds and continues to receive the state’s regular match rate for adults covered under the waiver.
There is no deadline by which states must determine whether they will implement the Medicaid expansion. Indiana can continue to evaluate how it will proceed and whether it will adopt the Medicaid expansion as they continue to offer coverage through the HIP waiver that will expire at the end of 2014. In a letter to Secretary Sebelius from November 15, 2013, Governor Pence said that he was looking forward to further discussions regarding the potential expansion of the Healthy Indiana Plan; however, he also stated that “it is essential that the State be able to maintain the consumer-driven model on which the program is predicated.”19 CMS has raised issues about the monthly account contributions required under HIP.
Parents below 22% were eligible for regular Medicaid before implementation of the Healthy Indiana Plan, and continue to receive regular Medicaid coverage. Parents below 22% FPL who are not eligible for Medicaid because they exceed resource limits ($1,000) are eligible for the Healthy Indiana Plan. ↩︎
Parents below 22% were eligible for regular Medicaid before implementation of the Healthy Indiana Plan, and continue to receive regular Medicaid coverage. Parents below 22% FPL who are not eligible for Medicaid because they exceed resource limits ($1,000) are eligible for the Healthy Indiana Plan. ↩︎
Parents below 22% were eligible for regular Medicaid before implementation of the Healthy Indiana Plan, and continue to receive regular Medicaid coverage. ↩︎
Parents below 22% were eligible for regular Medicaid before implementation of the Healthy Indiana Plan, and continue to receive regular Medicaid coverage. Parents below 22% FPL who are not eligible for Medicaid because they exceed resource limits ($1,000) are eligible for the Healthy Indiana Plan. ↩︎
Indiana extended coverage for individuals between 100 and 200% until April 30, 2014 due to issues enrolling in the federal marketplace. ↩︎
Although modeled after a High Deductible Health Plan (HDHP) and HSA, there are key differences between the structure of the HIP and a HDHP-HSA. First, the individual has the ability to choose whether or not to participate, and how much to invest, in an HSA in the private market. This is not the case for HIP enrollees. Second, individuals manage their HSAs and can use it to pay for a broad set of medical expenses. In contrast, POWER Accounts are administered by the managed care plans. As such, individuals with HSAs can “shop around” for the most cost effective plan and use the funds where they need; HIP enrollees, on the other hand, have much less control over their POWER Account funds. ↩︎
Enrollees may change plans for cause such as: failure of insurer to provide covered services; failure of insurer to comply with established standards of medical administration; significant language or cultural barriers; corrective action levied against the insurer by the state ↩︎
Anthem and MHS are established commercial plans in Indiana that serves some regular Medicaid enrollees. MDWise is an established Medicaid plan in Indiana that has partnered with AmeriChoice to provide HIP coverage. ↩︎
Kaiser Commission on Medicaid and the Uninsured, The Coverage Gap: Uninsured Poor Adults in States that Do Not Expand Medicaid (Washington, DC: Kaiser Commission on Medicaid and the Uninsured, October 2013), https://modern.kff.org/wp-content/uploads/2013/10/8505-the-coverage-gap-uninsured-poor-adults7.pdf. This analysis assumes childless adults and parents with incomes above 24% ($4,697 annually) would fall into the coverage gap. The gap does not account for more limited coverage included in the waiver (due to the cap and the higher cost-sharing requirements). ↩︎