KFF designs, conducts and analyzes original public opinion and survey research on Americans’ attitudes, knowledge, and experiences with the health care system to help amplify the public’s voice in major national debates.
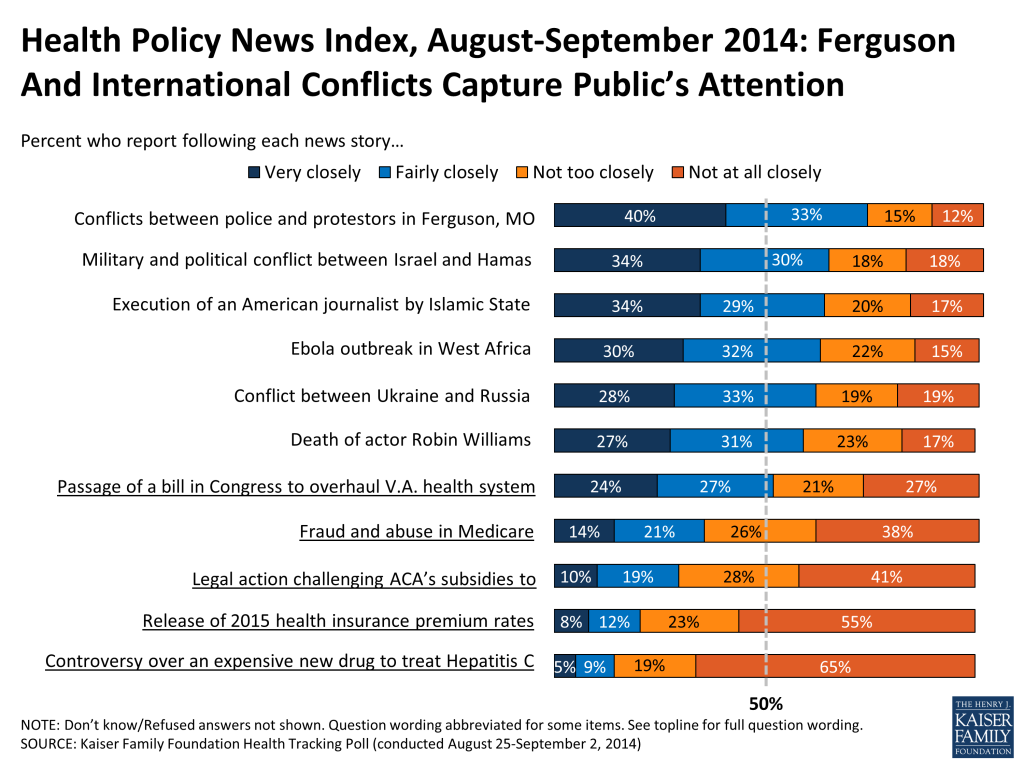
The Kaiser Health Policy News Index is designed to help journalists and policymakers understand which health policy-related news stories Americans are paying attention to, and what the public understands about health policy issues covered in the news. The latest Index finds that attention to health policy stories in August took a back seat to breaking national news such as the unrest in Ferguson, Missouri, international events in the West Bank, Syria and Ukraine and a global health story, the Ebola outbreak in West Africa. The only U.S. health policy news story that garnered a significant amount of public attention this month was the passage of a bill in Congress to overhaul the Veterans Affairs health system, closely followed by 51 percent.
Figure 1
The latest Kaiser Health Policy News Index finds that health policy news took a back seat in public attention this month, as the public was more focused on news of conflicts both here in the U.S. and overseas. The most closely-followed story was the conflict between police and protestors in Ferguson, Missouri following the police shooting of Michael Brown, followed “very” or “fairly” closely by nearly three-quarters of the public (73 percent). Although the story captured the attention of a large majority of the public overall, Blacks (58 percent) were more likely than Whites (37 percent) and Hispanics (39 percent) to say they followed the events in Ferguson “very” closely. Somewhat smaller shares of the general public, about six in ten, report closely following several international stories, including the military and political conflict between Israel and Hamas (64 percent), the execution of an American journalist, James Foley, by Islamic State militants (63 percent)1 , and the conflict between Ukraine and Russia (61 percent). Just as many Americans followed global health news of the Ebola outbreak in West Africa (62 percent). And back on the home front, nearly as many report following the death of actor Robin Williams (58 percent).
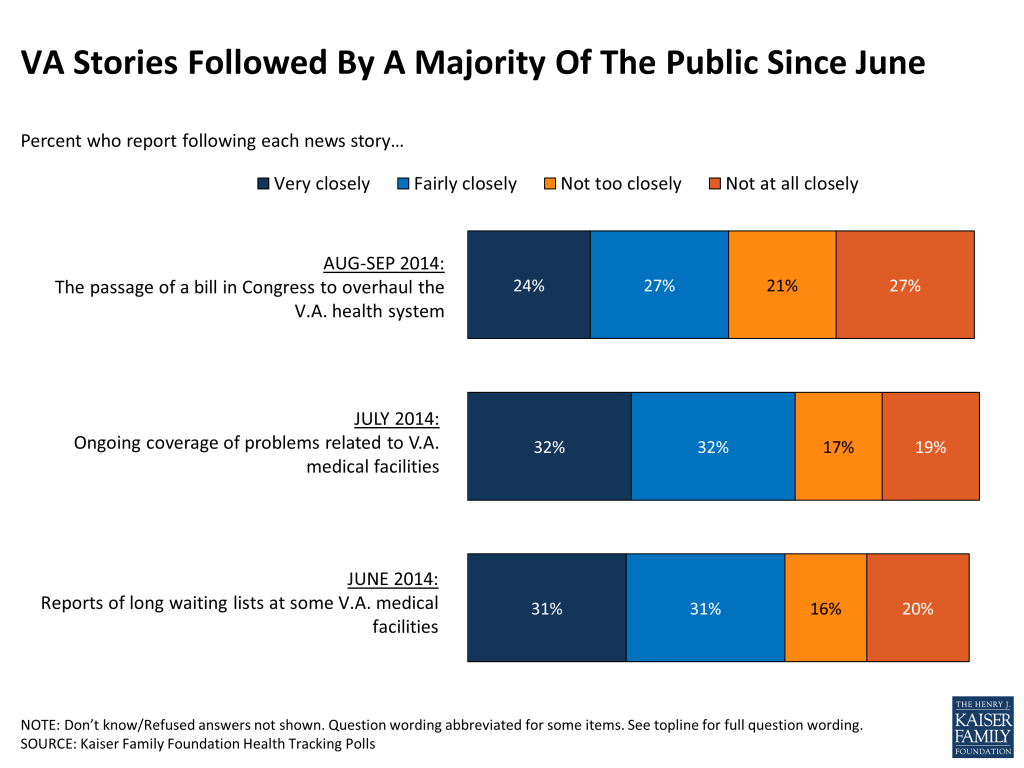
The top U.S. health policy news story, and the only health policy story followed closely by at least half of the public (51 percent), was the passage of a bill in Congress to overhaul the V.A. health system. For the third consecutive poll, coverage of stories pertaining to the V.A. health system have been followed by a majority of the public and have ranked as the most closely followed health policy stories.
Figure 2
Other health policy stories fell to the bottom of the public’s radar this month. Just about a third (35 percent) say they followed news about fraud and abuse in Medicare, and fewer say they closely followed coverage of legal action challenging the health care law’s subsidies to help individuals buy insurance (29 percent), the release of 2015 health insurance premium rates by insurers in some states (20 percent), and controversy over, Sovaldi, an expensive new drug to treat hepatitis C (14 percent).
NOTE: These questions were asked as part of the August-September 2014 Kaiser Health Tracking Poll. For more results from that survey, including methods, see: Kaiser Health Tracking Poll: August-September 2014.
The survey was in the field August 25-September 2, before the news that a second American journalist, Steven Sotloff, was also executed by Islamic State militants. ↩︎
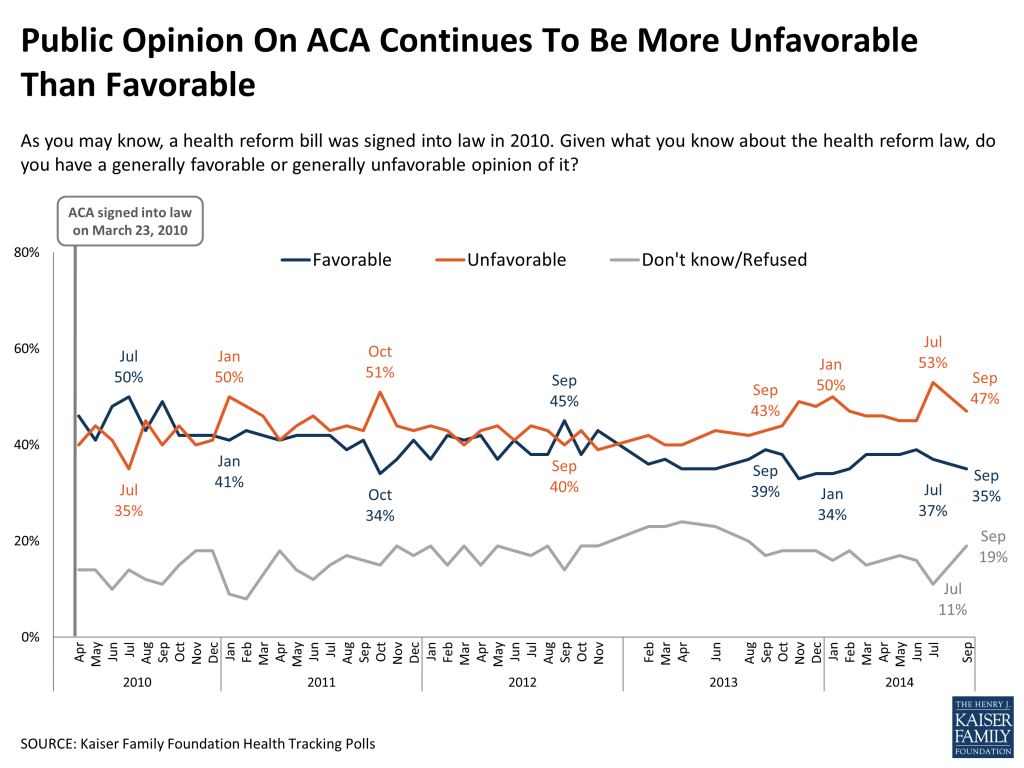
The latest Kaiser Health Tracking Poll finds that public opinion on the Affordable Care Act (ACA) remains more negative than positive, with 47 percent viewing the law unfavorably (closer to levels measured earlier this year after rising to 53 percent in July) and 35 percent having a favorable view. Partisan divisions on the law are as deep as ever, not only when it comes to overall opinion but also in the public’s perception of how the law has impacted their own families and the next steps they want Congress to take.
This poll takes a special look at registered voters’ views of the ACA and what role, if any, the law might be playing in the upcoming midterm election. The survey finds that health care is named as an important voting issue by about one in eight voters, ranking behind the economy and jobs, and clustered with several other issues such as foreign policy and national defense, dissatisfaction with government, immigration, and education. At the same time, the ACA is prominent among the issues voters report hearing about from candidates in their campaigns and advertising. And the messages they are hearing in political advertising are decidedly more anti-ACA than pro-ACA, particularly in states with competitive Senate races. This messaging in advertising may be a reflection of Republican candidates playing to their base, as the survey finds that most Republican voters want candidates to continue talking about the ACA, while most Democrats want them to focus on other issues. Two months out from Election Day, Republicans have a modest edge among the most enthusiastic voters. However, it does not appear that opposition to the ACA is a big driver of that enthusiasm, as these voters are no more likely than others to mention health care as an important factor in their vote.
More Continue to View ACA Unfavorably than Favorably
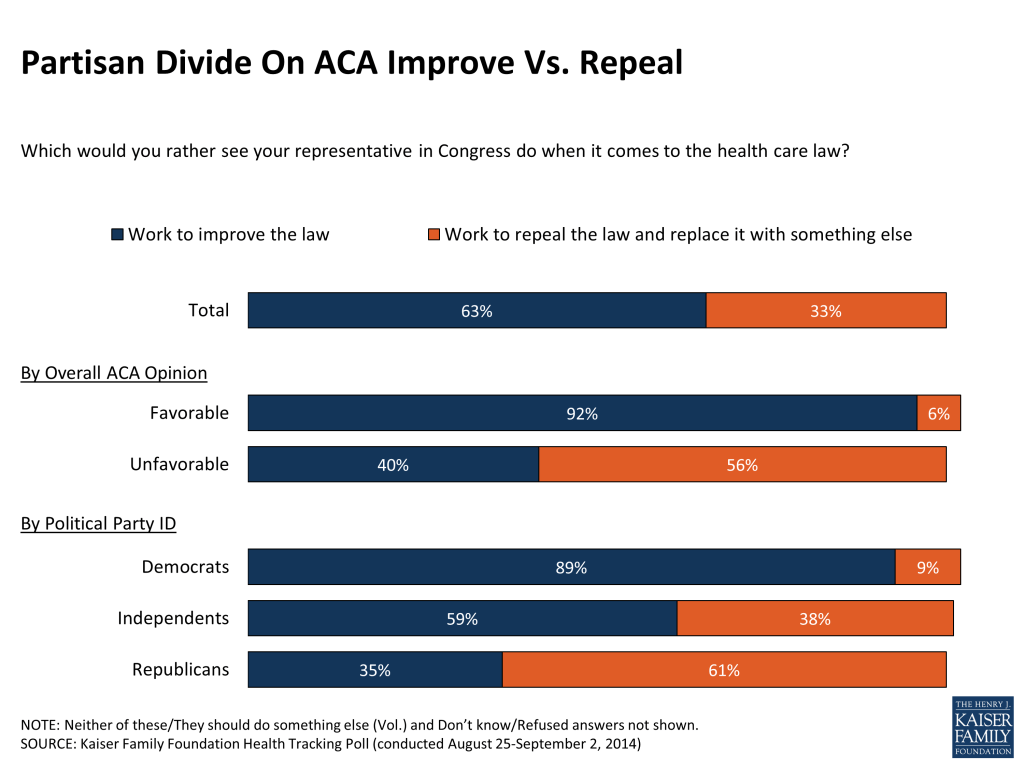
The latest Kaiser Health Tracking Poll finds that the public continues to be more likely to express an unfavorable view of the health care law (47 percent) than a favorable one (35 percent). However, after rising to 53 percent in July, the latest poll finds that the share with an unfavorable view fell back down closer to the shares reported earlier in the year. The share not offering an opinion on the law increased to 19 percent this month, while the share with a favorable view remains similar to previous levels. Even as overall opinion remains more negative than positive, nearly twice as many Americans say they want their Congressional representative to work to improve the law (63 percent) rather than to repeal it and replace it with something else (33 percent).
Figure 1
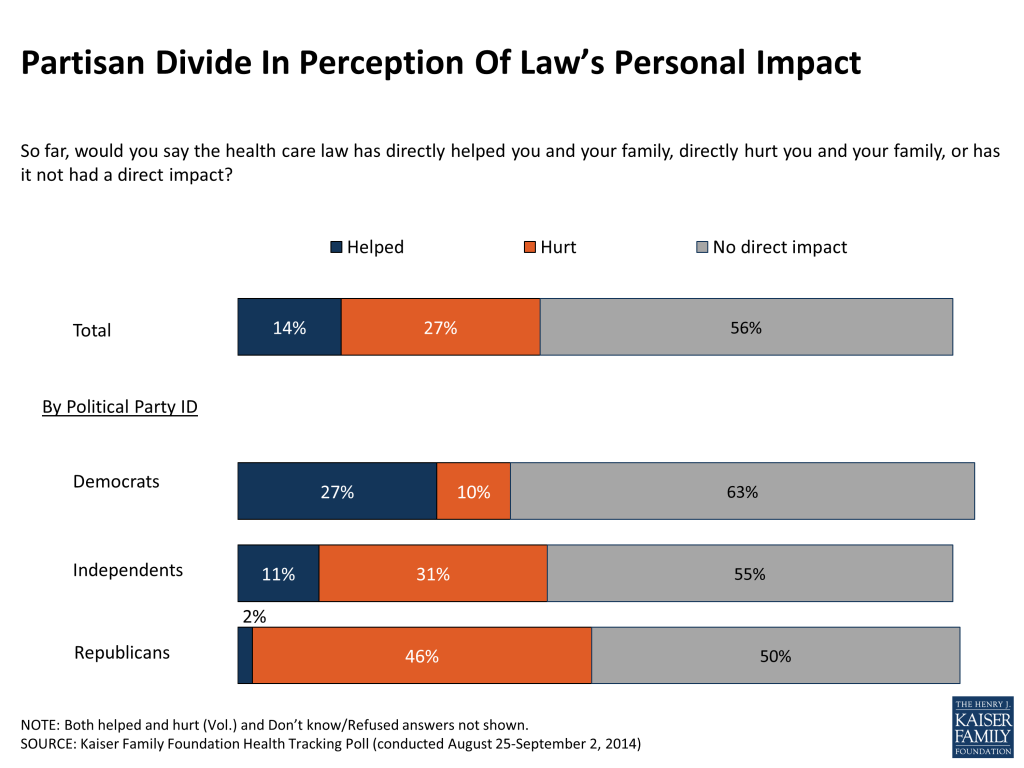
When it comes to personal impact, a majority of the public (56 percent) says the law has not directly impacted them or their families. Of those who say the law has touched them directly, about twice as many report being hurt (27 percent) as report being helped (14 percent). Those who report being hurt by the law mainly say that it has increased the cost of their health care or insurance (16 percent), while those who say the law has helped them mainly say it has allowed someone in their family to get or keep health coverage (6 percent) or made it easier for them to get the health care they need (4 percent).
Party Identification Sharply Divides Opinion Of Health Care Law
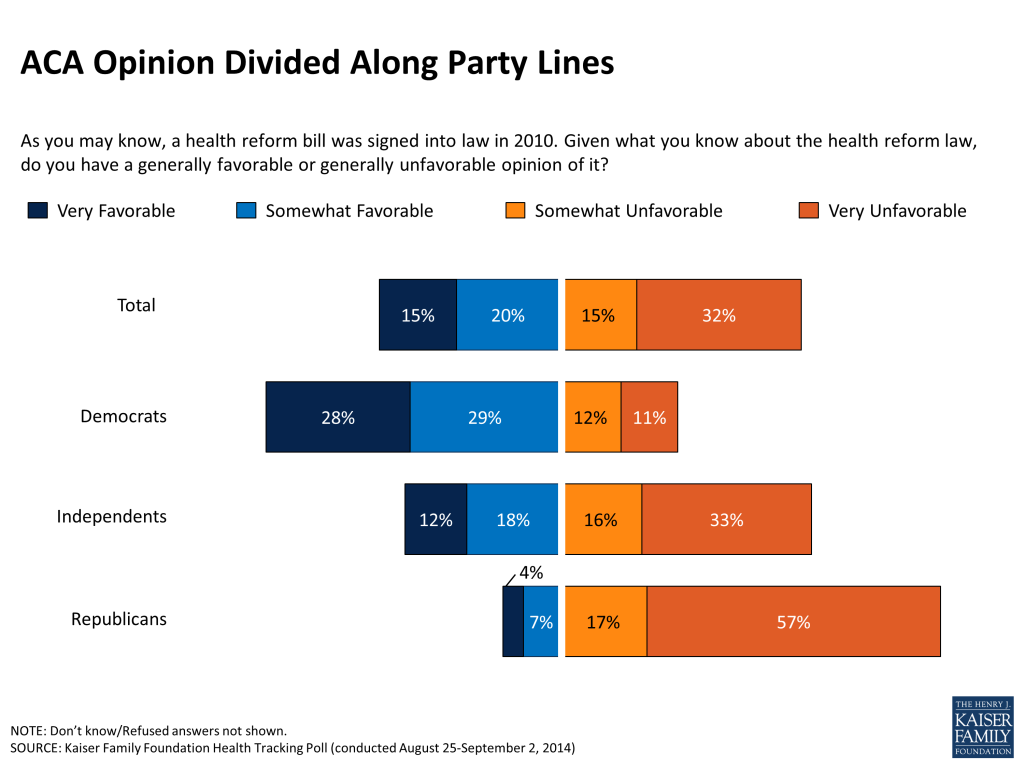
Consistent with previous Kaiser Health Tracking Polls, opinions of the health care law including views overall, impression of personal impact and what Congress should do next are sharply divided along party lines. A majority of Democrats report a favorable opinion of the law (57 percent), while a majority of Republicans report an unfavorable opinion (74 percent), and independents fall in between the two, although more of them have an unfavorable than a favorable view (49 percent versus 30 percent). Intensity in opinion of the law lies with the Republicans, with about twice as many Republicans expressing a “very” unfavorable opinion of the law as Democrats expressing a “very” favorable opinion (57 percent versus 28 percent).
Figure 2
Just as opinion of the law in general is divided along party lines, reported personal impact is as well. Democrats (27 percent) are more likely than independents (11 percent) and Republicans (2 percent) to report that the law has directly helped them. And vice versa, Republicans are more likely to say that the law has directly hurt them (46 percent) than are independents (31 percent) and Democrats (10 percent).
Figure 3
The public’s preferences for next steps with the health care law also differ sharply by party identification, with a large majority of Democrats wanting their representative in Congress to work to improve the law (89 percent), and a majority of Republicans wanting them to work to repeal the law and replace it with something else (61 percent). However, notable shares of both Republicans (35 percent) and those with an unfavorable opinion of the law (40 percent) say that they want their representative to work to improve the law.
Figure 4
Where Does Health Care Rank As A Voting Issue?
This month’s poll takes a special look at registered voters’ views of the ACA and what role, if any, the law might be playing in the upcoming midterm election. Like the public overall, registered voters are more likely to have an unfavorable view of the ACA than a favorable one (49 percent versus 35 percent). Opinion tilts even more negative among likely voters1 (51 percent versus 35 percent).
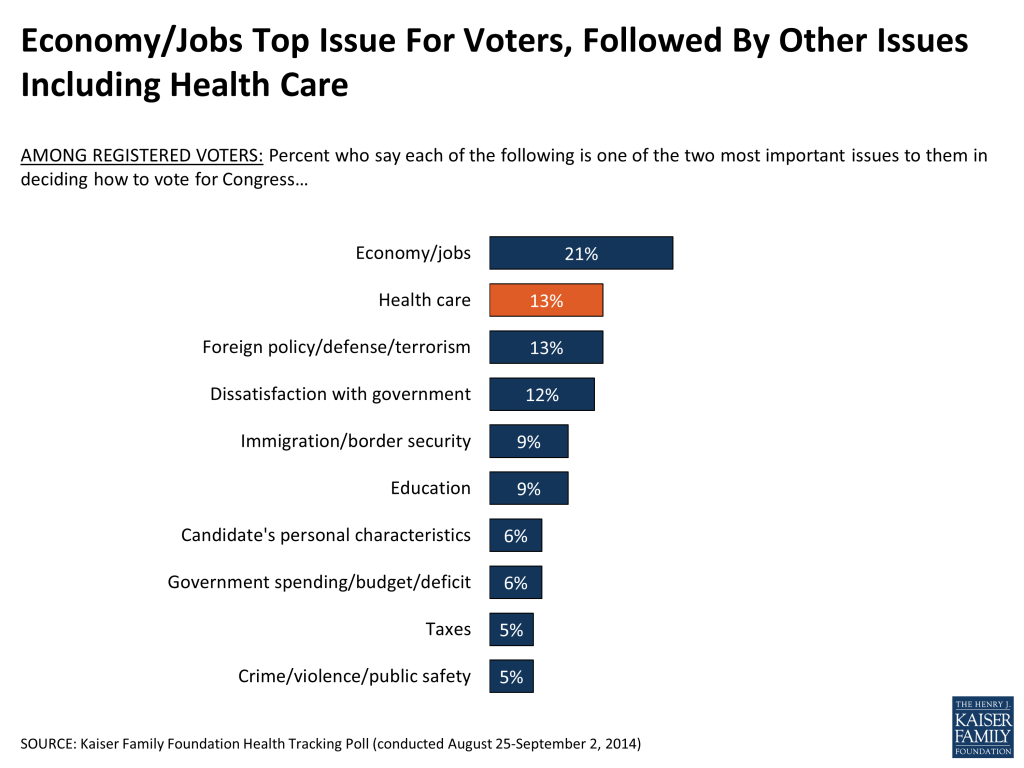
However, health care does not appear to be the dominant issue on voters’ minds when thinking about how to vote in November. Asked to name in their own words the two most important issues in deciding their vote for Congress, the most frequently-mentioned issue is the economy and jobs (21 percent). Thirteen percent of voters name health care as a top issue, including just 3 percent who specifically mention the Affordable Care Act. Those who view the law favorably are about equally likely to mention health care as a top issue in their vote as are those with an unfavorable view (12 percent versus 15 percent).
As a voting issue, health care is clustered with a number of other issues, including foreign policy/national defense/terrorism (13 percent), dissatisfaction with the way government is working (12 percent), immigration and border security (9 percent), and education (9 percent).
Figure 5
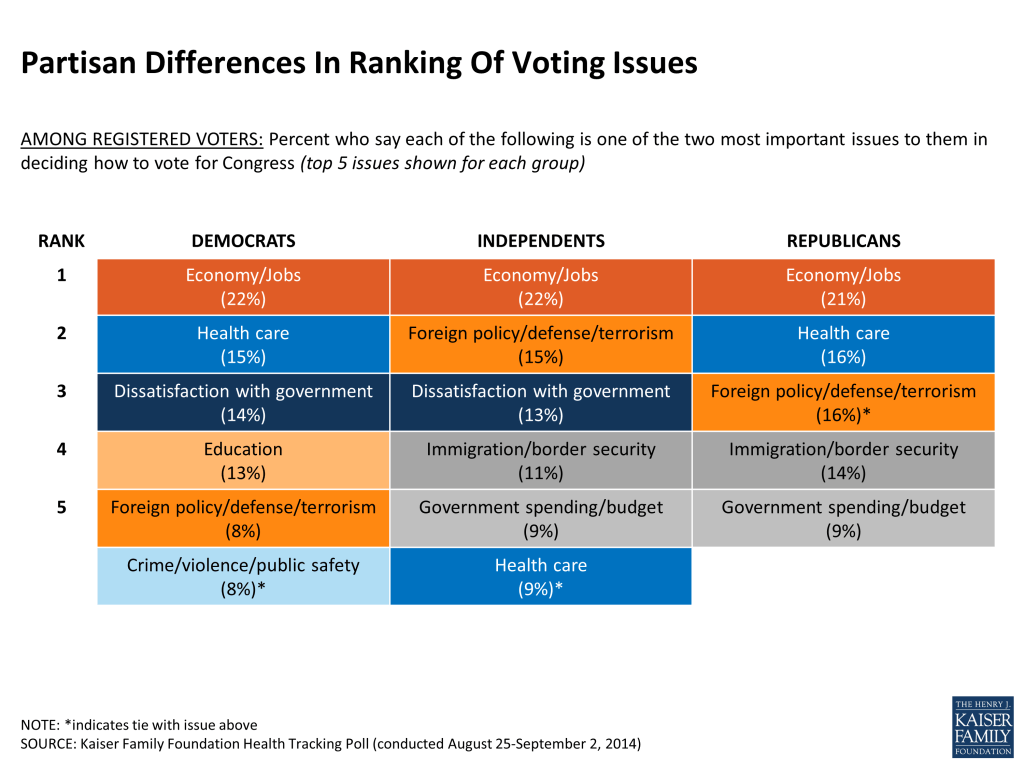
Looking at registered voters by party identification, the economy is the most frequently mentioned voting issue among Democrats, Republicans, and independents alike. While health care ranks second and is mentioned by a similar share of Democrats (15 percent) and Republicans (16 percent), it ranks further down the list and is mentioned by a smaller share of independent voters (9 percent). When Republicans mention health care as a top voting issue, they are more likely to mention the ACA or Obamacare by name (7 percent of Republicans versus 2 percent of Democrats), while Democrats are more apt to name other health care issues or health care more generally.
Other partisan differences are also apparent. For example, foreign policy, immigration, and government spending all receive more mentions among independents and Republicans than among Democrats, while Democrats and independents are more likely than Republicans to name dissatisfaction with government. Two issues make the top five list for Democrats but do not rank as high for other voters: education and crime/public safety.
Figure 6
Issues Are Only One Part Of Voters’ Decisions
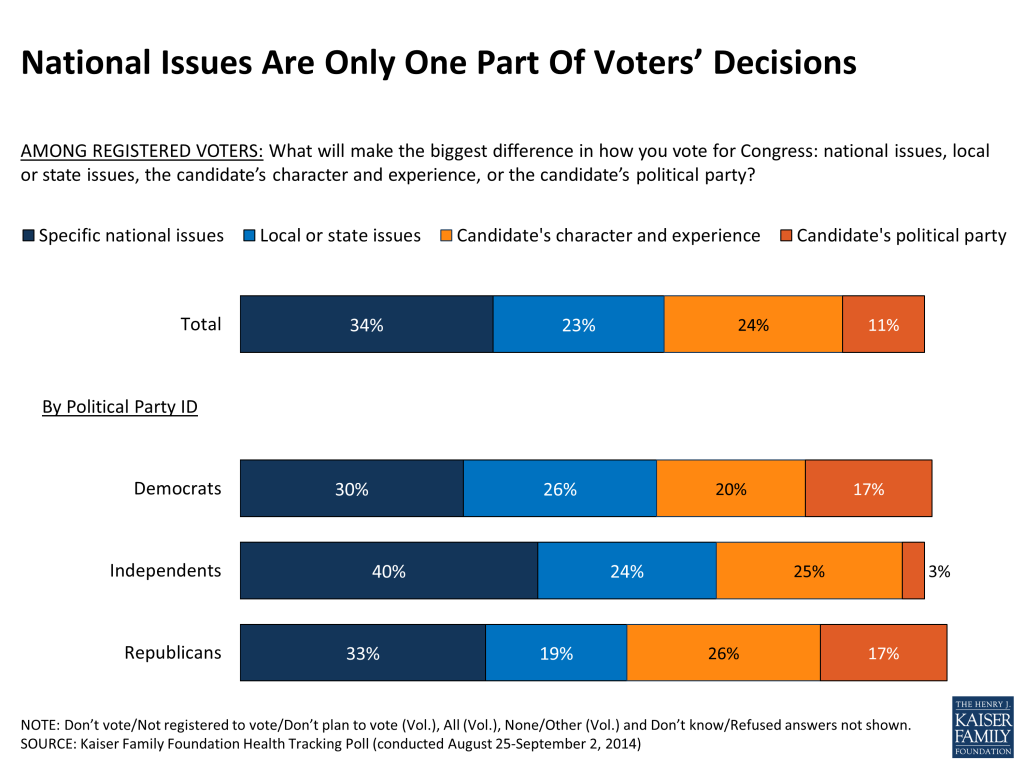
In assessing how the health care law will influence voting decisions, it’s important to keep in mind that national issues like the ACA are only one part of the calculus for voters. While about a third (34 percent) of registered voters say specific national issues will make the biggest difference in how they vote for Congress, about a quarter each say their vote will be mostly based on the candidate’s character and experience (23 percent) or local or state issues (24 percent), and 11 percent say the candidate’s party affiliation will be the most important factor.
Figure 7
Voters Are Hearing Candidates Talk About Jobs, Immigration, And The ACA
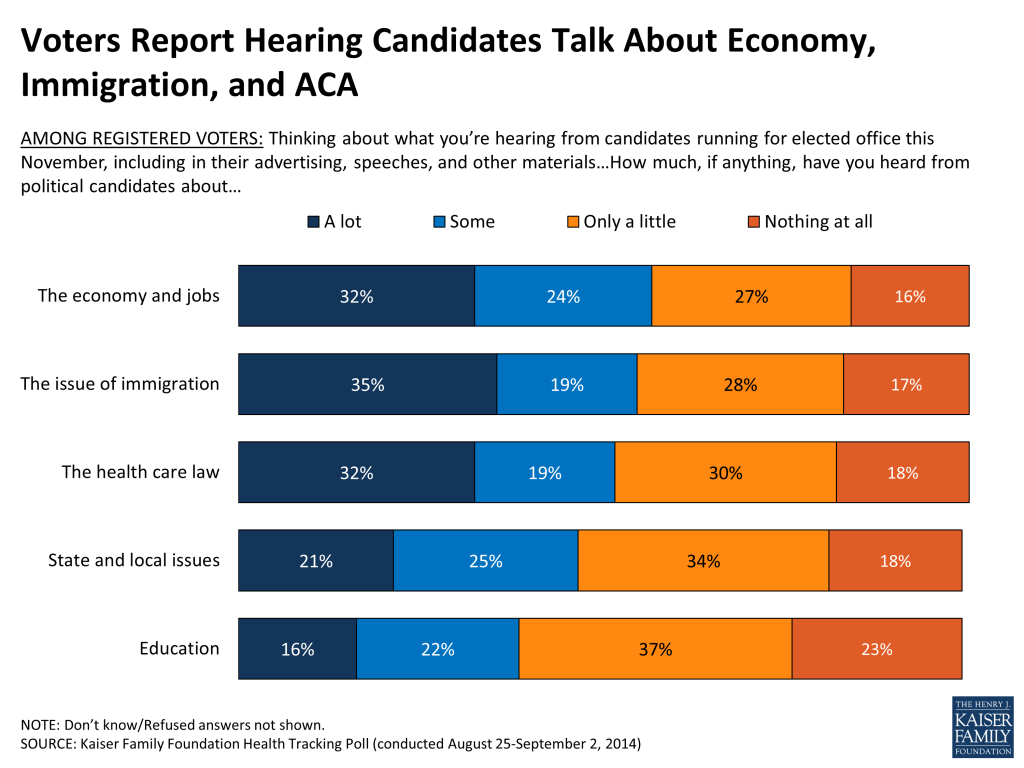
While the ACA may not be top-of-mind for most voters when deciding how to vote, it is prominent among the issues voters report hearing about from candidates. About a third (32 percent) of registered voters say they’ve heard “a lot” from candidates about the health care law, and another one in five (19 percent) say they’ve heard “some” about the issue. Similar shares report hearing from candidates about immigration and the economy, while fewer say they’re hearing from candidates about education or state and local issues.
Voters who identify as Republican are somewhat more likely than Democratic voters to say they’re hearing “a lot” from candidates about immigration (41 percent versus 31 percent) and state and local issues (26 percent versus 17 percent), but for other issues, including the health care law, there is no partisan difference in how much voters report hearing from candidates.
Figure 8
Voters Report Seeing More Anti-ACA Than Pro-ACA Advertising
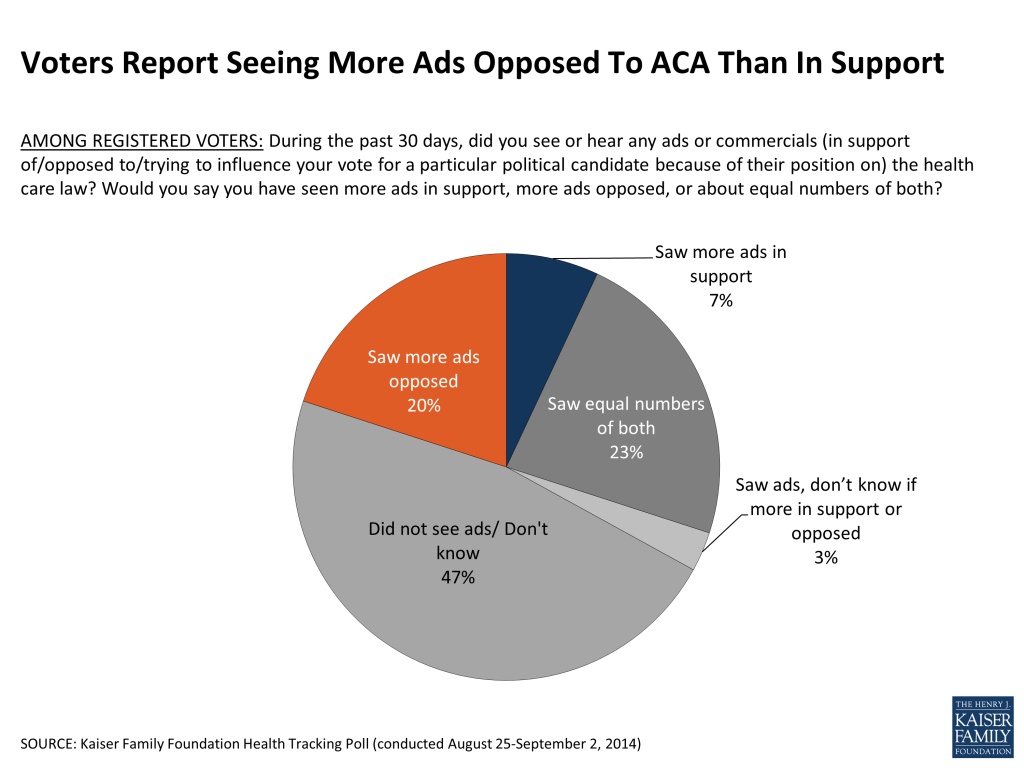
In addition to hearing candidates talk about the ACA, about half of voters (53 percent) report seeing some type of political or issue advertising related to the health care law in the past 30 days, including ads that were opposed to or in support of the law itself, as well as ads that tried to influence their vote for a particular candidate because of their position on the law. Overall, nearly three times as many voters say that most of the ads they saw were opposed to the law (20 percent) as say most of them were in support of the law (7 percent), while just under a quarter (23 percent) say they saw about equal numbers of both.
Figure 9
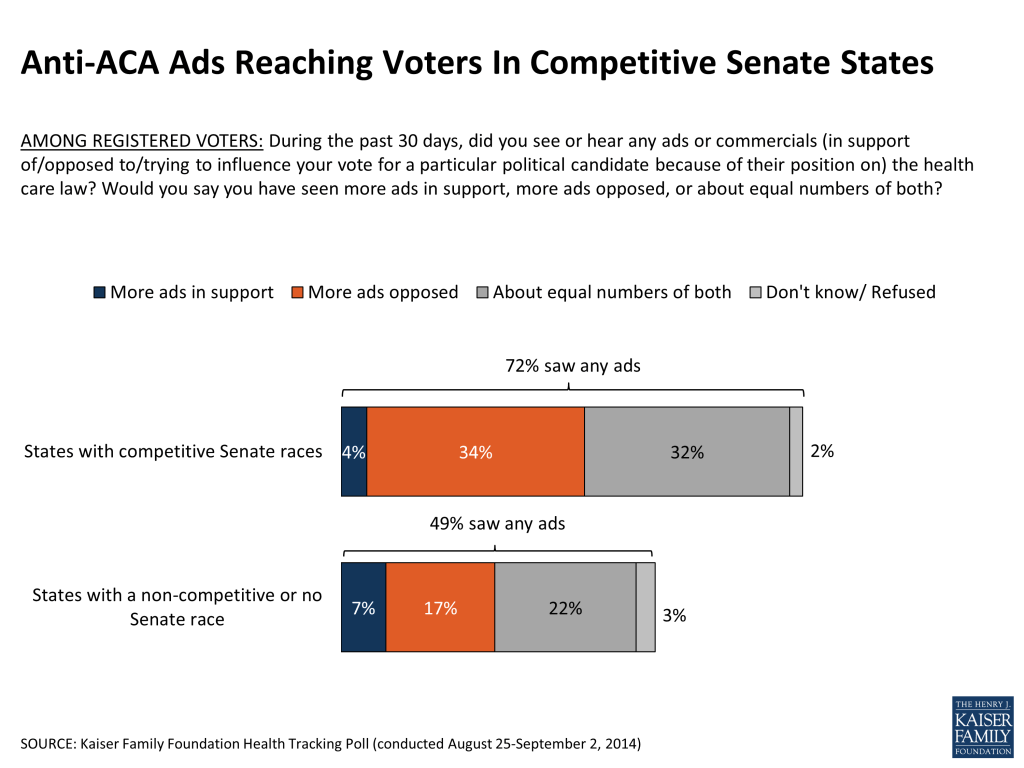
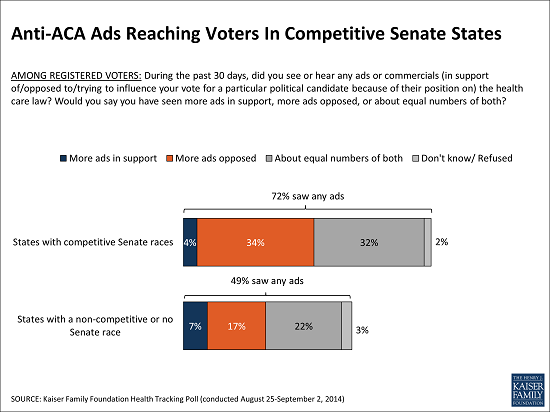
In states with competitive Senate races2, an even larger share of voters reports seeing ads related to the law (71 percent), and the balance of negative over positive ads is even more lopsided (34 percent say they saw more ads opposed to the law while just 4 percent report seeing more ads in support).
Figure 10
Voters Are Divided On Whether Candidates Should Continue Talking About ACA
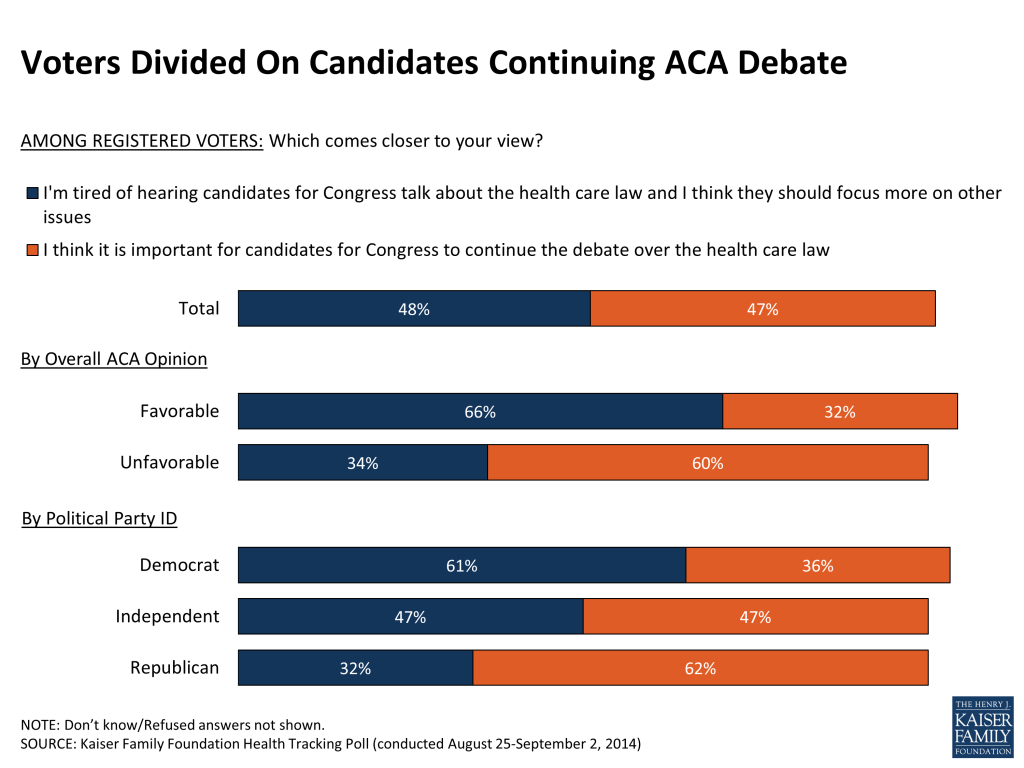
At this point in the campaign, voters are evenly divided on whether they want to hear candidates for Congress continue to talk about the ACA. About half (48 percent) of voters say they are tired of hearing candidates talk about the law and would rather they focus on other issues, while a similar share (47 percent) feel it’s important for candidates to continue the debate. The desire for continued debate is more on the side of the law’s opponents than its supporters; about six in ten Republicans and those with an unfavorable view of the law want candidates to keep up the debate, while similarly large shares of Democrats and those who view the law favorably say they should move on to other issues.
Despite the fact that voters in states with competitive Senate races report seeing more campaign advertising related to the law, they are not more likely than voters in other states to say they are tired of hearing candidates talk about the ACA (49 percent in states with competitive Senate races versus 48 percent in other states).
Figure 11
Republicans Have An Edge Among “Enthusiastic” Voters, But Not Necessarily Because Of ACA
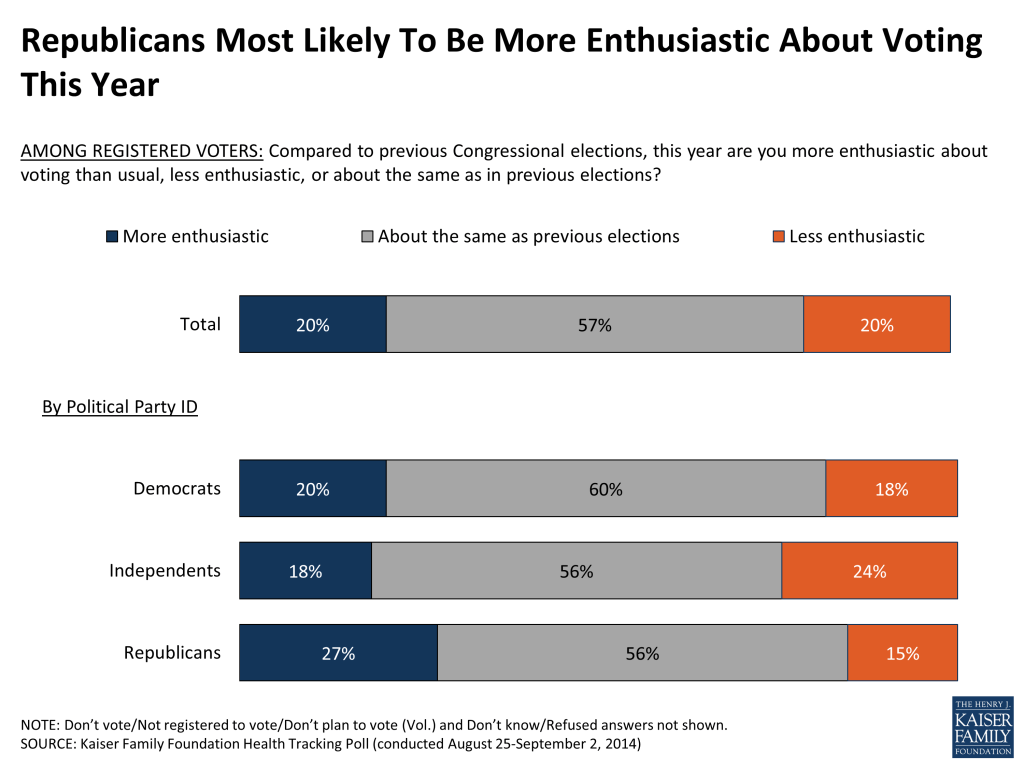
As other polls have shown, Republicans have a modest edge when it comes to voter enthusiasm. While a majority of voters of all political stripes say their enthusiasm about voting this year is “about the same” as in previous Congressional elections, 27 percent of Republicans say they are “more enthusiastic” about voting this year than in the past, compared with 20 percent of Democrats and 18 percent of independents.
Figure 12
Overall, the survey finds that registered voters are fairly evenly divided between those who want to see the Democrats hold on to their majority in the Senate (43 percent) and those who would prefer to see the Republicans gain the majority (40 percent). This narrows to a dead heat among likely voters – 43 percent say they want a Democratic majority and 43 percent want a Republican one. However, Republicans have an edge among those who say they’re more enthusiastic about voting this year; half (50 percent) of these voters say they’d prefer to see the Republicans gain the majority in the Senate and 38 percent say they’d like the Democrats to hold on to their majority.
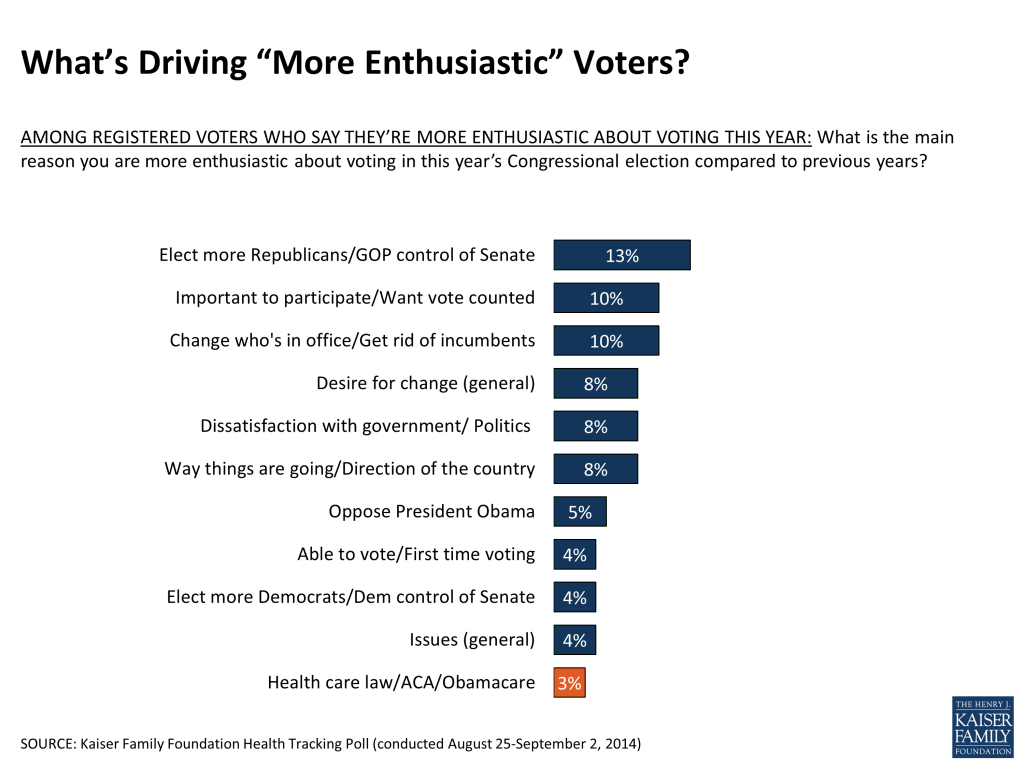
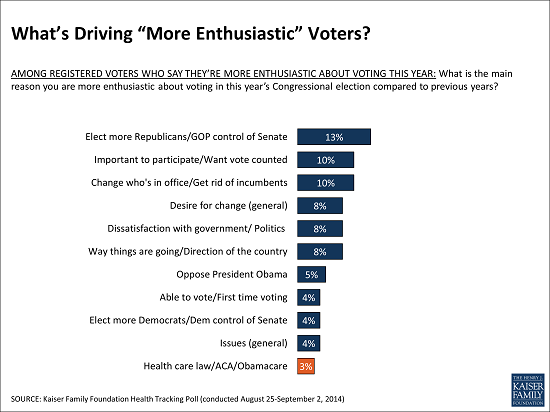
While the “more enthusiastic” voters may give Republicans an edge, opposition to the ACA does not seem to be the dominant factor driving their enthusiasm. These voters are no more likely than other voters to name health care as one of the most important issues in deciding their vote (14 percent name health care – including 6 percent who name the ACA specifically, ranking behind the economy at 21 percent and foreign policy/defense at 16 percent). Further, when asked to say in their own words why they’re more enthusiastic about voting this year, the most common responses relate to a desire to elect more Republicans or help Republicans gain control of the Senate (13 percent), followed by a general sense that participation is important (10 percent), a desire to change who’s in office or get rid of incumbents (10 percent), a general desire for change (8 percent), dissatisfaction with the way government is working (8 percent), and the overall direction of the country (8 percent). Just 3 percent of “more enthusiastic” voters mention the health care law as the main reason for their enthusiasm.
Figure 13
How Do Voters Say A Candidate’s Position On The ACA Will Affect Their Vote?
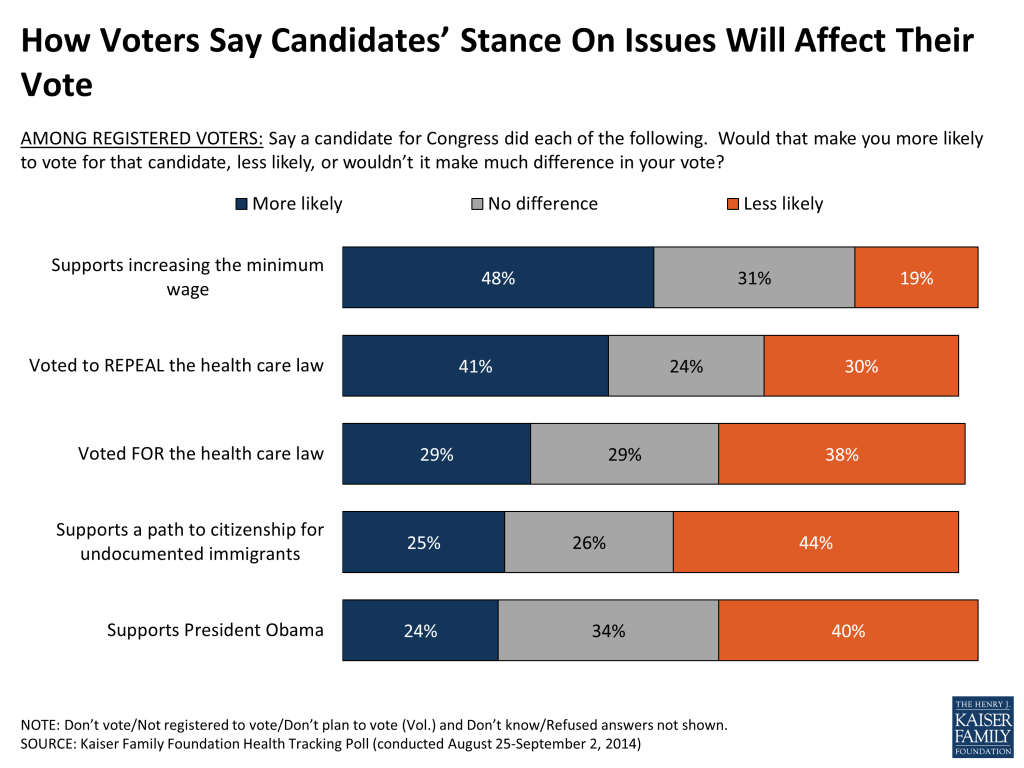
While the ACA may be just one factor in voters’ decisions, many say that a candidate’s position on the law – along with a variety of other issues – would make them more or less likely to vote for that candidate. Almost four in ten (38 percent) say that if a candidate voted for the health care law, they would be less likely to vote for that candidate, while 29 percent say they would be more likely to vote for them. The numbers are almost exactly opposite when it comes to a candidate who voted to repeal the law: 41 percent say they would be more likely to vote for that candidate and 30 percent say they would be less likely to vote for them. To put the ACA in context with other issues, nearly half (48 percent) of voters say they’d be more likely to vote for a candidate who supports increasing the minimum wage, and over four in ten (44 percent) say they’d be less likely to vote for a candidate who supports a path to citizenship for undocumented immigrants.
Figure 14
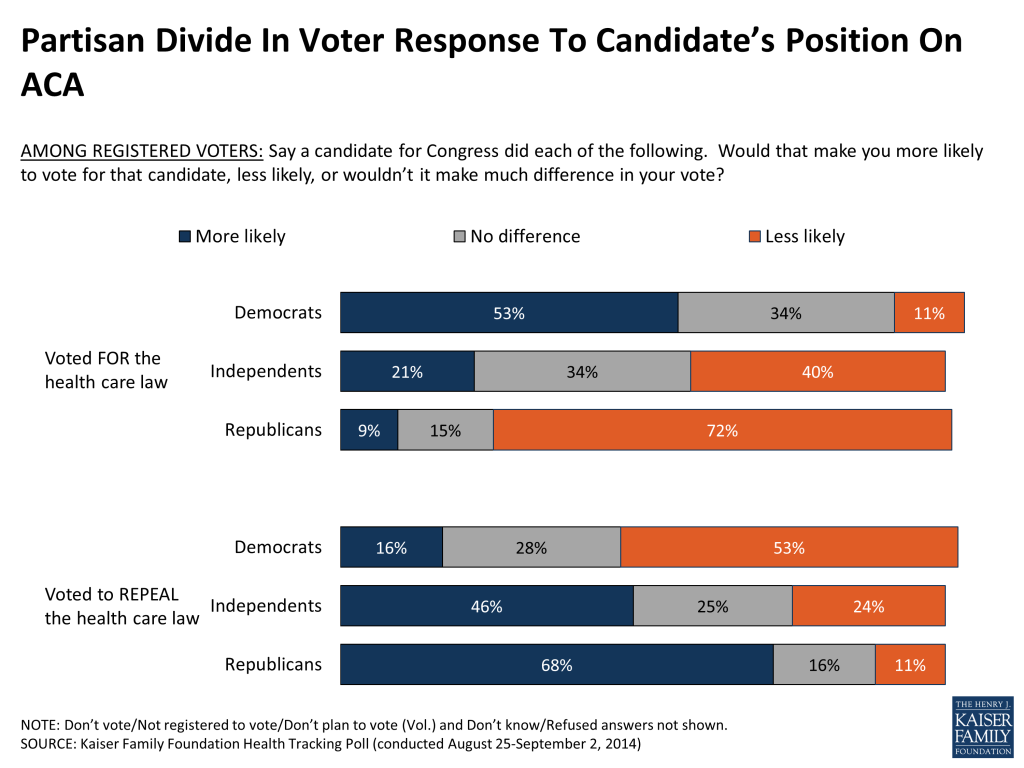
Not surprisingly, voters’ reactions to different candidate positions on the ACA divide sharply on party lines, and once again Republicans appear to have the edge in terms of enthusiasm. Just over half (53 percent) of Democrats say they would be more likely to support a candidate who voted for the ACA, but an even larger share of Republicans (72 percent) say they would be less likely to back such a candidate. Similarly, when asked how they would react to a candidate who voted to repeal the law, 68 percent of Republicans say they would be more likely to vote for them and 53 percent of Democrats say they would be less likely.
Figure 15
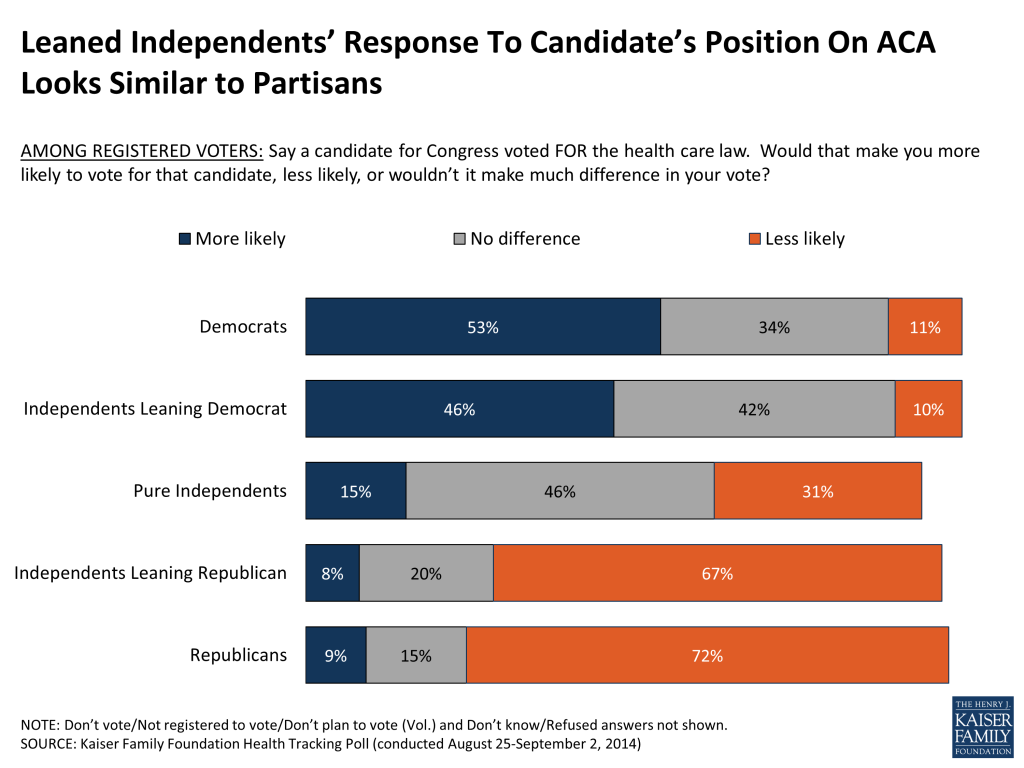
Among independent voters overall, about twice as many say they would be less likely to vote for a candidate who voted for the ACA as say they would be more likely to vote for such a candidate (40 percent versus 21 percent). But as previous Kaiser tracking polls have shown, independents who lean towards one party or another have views that look more like their partisan counterparts. Nearly half (46 percent) of independent voters who lean toward the Democratic party say they would be more likely to support a candidate who voted for the health care law, while two-thirds (67 percent) of Republican-leaning independents say they would be less likely to support such a candidate.
Figure 16
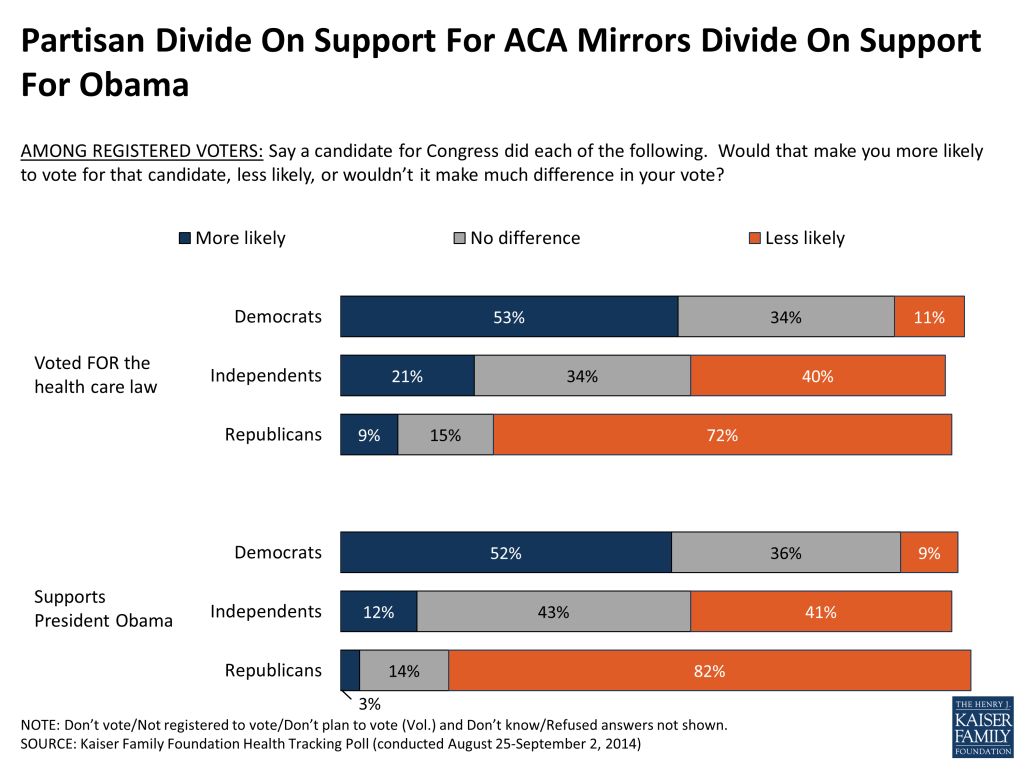
As other polls have shown, voters’ views on the ACA, nicknamed “Obamacare” for the president who championed its passage and signed it into law, often mirror their views on the president himself. And in fact, this survey finds that partisan divisions in voters’ reactions to a candidate who “supports President Obama” are very similar to a candidate who “voted for the health care law.” Just over half (52 percent) of Democratic voters say they’d be more likely to vote for a candidate who supports the president (almost identical to the 53 percent who say the same about a candidate who voted for the ACA), and 82 percent of Republican voters say they’d be less likely to vote for such a candidate (similar to the 72 percent who say they’d be less inclined to back a candidate who voted for the ACA).
Figure 17
This Kaiser Health Tracking Poll was designed and analyzed by public opinion researchers at the Kaiser Family Foundation (KFF). The survey was conducted August 25- September 2, 2014, among a nationally representative random digit dial telephone sample of 1,505 adults ages 18 and older, living in the United States, including Alaska and Hawaii (note: persons without a telephone could not be included in the random selection process). Computer-assisted telephone interviews conducted by landline (753) and cell phone (752, including 424 who had no landline telephone) were carried out in English and Spanish by Princeton Data Source under the direction of Princeton Survey Research Associates International (PSRAI). Both the random digit dial landline and cell phone samples were provided by Survey Sampling International, LLC. For the landline sample, respondents were selected by asking for the youngest adult male or female currently at home based on a random rotation. If no one of that gender was available, interviewers asked to speak with the youngest adult of the opposite gender. For the cell phone sample, interviews were conducted with the adult who answered the phone. KFF paid for all costs associated with the survey.
The combined landline and cell phone sample was weighted to balance the sample demographics to match estimates for the national population using data from the Census Bureau’s 2012 American Community Survey (ACS) on sex, age, education, race, Hispanic origin, nativity (for Hispanics only), and region along with data from the 2010 Census on population density. The sample was also weighted to match current patterns of telephone use using data from the July-December 2013 National Health Interview Survey. The weight takes into account the fact that respondents with both a landline and cell phone have a higher probability of selection in the combined sample and also adjusts for the household size for the landline sample. All statistical tests of significance account for the effect of weighting.
The margin of sampling error including the design effect for the full sample is plus or minus 3 percentage points. Numbers of respondents and margin of sampling error for key subgroups are shown in the table below. For results based on other subgroups, the margin of sampling error may be higher. Sample sizes and margin of sampling errors for other subgroups are available by request. Note that sampling error is only one of many potential sources of error in this or any other public opinion poll.
Group
N (unweighted)
M.O.S.E.
Total
1,505
±3 percentage points
Party Identification
Democrats
473
±5 percentage points
Republicans
368
±6 percentage points
Independents
510
±5 percentage points
Opinion of ACA
Favorable Opinion of the ACA
544
±5 percentage points
Unfavorable Opinion of the ACA
698
±4 percentage points
Registered Voters (RV)
1,239
±3 percentage points
Likely Voters
1,056
±3 percentage points
“More Enthusiastic” Voters
265
±7 percentage points
Party Identification (among RV)
Democrats
401
±6 percentage points
Republicans
329
±6 percentage points
Independents
400
±6 percentage points
Opinion of ACA (among RV)
Favorable Opinion of the ACA
457
±5 percentage points
Unfavorable Opinion of the ACA
598
±5 percentage points
Senate Races (among RV)
States with competitive Senate races
212
±8 percentage points
States with a non-competitive or no Senate race
1,027
±4 percentage points
Endnotes
Likely voters are defined as those who say they are “absolutely certain” to vote or will “probably” vote in the Congressional election in November. ↩︎
States with competitive Senate races are those identified by the Cook Political Report ratings as “Toss Up,” “Lean Democrat,” or “Lean Republican as of Sept. 4: AK, AR, CO, GA, IA, KY, LA, MI, NC, NH, and WV (see http://cookpolitical.com/senate/maps). ↩︎
Anti-Obamacare Ads Reaching Most Voters in Competitive Senate Races
Health Care Ranks Among Several Second-Tier Issues for Voters in Midterm Elections Behind the Economy
The latest Kaiser Family Foundation Health Tracking Poll finds Republicans with a modest edge in terms of voter enthusiasm, but the Affordable Care Act, also called Obamacare, is not the main motivator.
The poll finds that 27 percent of Republicans say they are “more enthusiastic” about voting this year than in past Congressional elections, compared with 20 percent of Democrats and 18 percent of independents.
Asked to say in their own words why they’re more excited about voting this year, the most common response among enthusiastic voters relates to a desire to elect more Republicans or help Republicans gain control of the Senate (13%). Just 3 percent mention the health care law specifically.
The findings come from the Foundation’s August-September poll, which includes a special look at registered voters’ views and what role, if any, the ACA might be playing in the upcoming midterm election. The survey was released at a joint Kaiser Family Foundation/Cook Political Report briefing in Washington.
Nationally about half of voters (53%) report seeing some type of political or issue advertising related to the health care law in the previous 30 days, and nearly three times as many say that most ads were opposed to the law (20%) as say most were in support of it (7%).
Among voters in the 11 states with the most competitive Senate races as rated by The Cook Political Report, more than seven in ten (72%) report seeing ads related to the health care law, and the balance is even more heavily tilted against the law (34% saw more ads in opposition; 4% saw more ads in support).
The poll finds voters divided in terms of whether they want the candidates to talk about the health care law, with similar shares saying they are tired of hearing candidates talk about the law and would rather they focus on other issues (48%) and they feel it’s important for candidates to continue the debate (47%).
The law’s opponents are clearly more interested in continuing the debate: Among Republican voters and those with an unfavorable view of the law, about six in ten want candidates to keep up the debate, while similarly large shares of Democrats and those who view the law favorably say they should move on to other issues.
When asked to name in their own words the two most important issues in deciding their vote for Congress, the most frequently-mentioned issue is the economy and jobs (21%). Fewer voters cite health care (13%, including just 3% who specifically mention the Affordable Care Act or Obamacare). Mentions of health care are similar among Democrats (15%) and Republicans (16%), but lower among independent voters (9%).
As a voting issue, health care is clustered with a number of other issues, including foreign policy/national defense/terrorism (13%), dissatisfaction with the way government is working (12%), immigration and border security (9%), and education (9%).
While not a top-tier issue for most voters, almost four in ten (38%) say that if a candidate voted for the health care law, they would be less likely to vote for that candidate, while three in 10 (29%) say they would be more likely to do so. When asked about a candidate who voted to repeal the law, the results flip, with four in 10 (41%) saying they would be more likely to vote for that candidate and three in 10 (30%) saying they would be less likely to do so.
To put the ACA in context with other issues, nearly half (48%) of voters say they’d be more likely to vote for a candidate who supports increasing the minimum wage, and more than four in ten (44%) say they’d be less likely to vote for a candidate who supports a path to citizenship for undocumented immigrants.
The poll also shows that national issues like the ACA are only one factor influencing voters. About a third (34%) of registered voters say specific national issues will make the biggest difference in how they vote for Congress, while about a quarter each say their vote will be mostly based on the candidate’s character and experience (24%) or local or state issues (23%), and one in 9 (11%) say the candidate’s party affiliation will be the most important factor.
Overall, registered voters are fairly evenly divided between those who prefer to see the Democrats hold on to their majority in the Senate (43%) and those who would prefer to see the Republicans gain the majority (40%). This narrows to a dead heat among likely voters (43% favor each party’s control), but Republicans hold an edge among those who say they’re more enthusiastic about voting: 50 percent of these voters say they’d prefer to see the Republicans gain the majority and 38 percent say they’d like the Democrats to retain control.
The latest poll also tracks the public’s overall views of the health reform law. Key findings include:
Public opinion on the ACA overall remains more negative than positive, with 47 percent viewing the law unfavorably (closer to levels measured earlier this year after rising to 53 percent in July) and 35 percent having a favorable view. Views are similar among registered voters (49% unfavorable, 35% favorable); opinion tilts even more negative among likely voters (51% vs. 35%).
At the same time, nearly twice as many Americans want their Congressional representative to work to improve the law (63%) rather than to repeal it and replace it with something else (33%).
Partisan divisions on the law are as deep as ever on overall opinion, on the next steps for Congress and even in perceptions of how the law has impacted their own families. Democrats (27%) are more likely than independents (11%) and Republicans (2%) to say that the law has directly helped them, while Republicans (46%) are more likely than are independents (31%) and Democrats (10%) to say that the law has directly hurt them.
Also available is the August-September installment of the Kaiser Health Policy News Index, which finds public attention this month was more focused on news of conflicts both here in the U.S. and overseas than on health policy issues.
Methodology
The latest tracking poll was designed and analyzed by public opinion researchers at the Kaiser Family Foundation and was conducted from August 25-September 2 among a nationally representative random digit dial telephone sample of 1,505 adults ages 18 and older, including 1,239 who said they were registered to vote. Interviews were conducted in English and Spanish by landline (753) and cell phone (752). The margin of sampling error is plus or minus 3 percentage points for the full sample and for registered voters. For results based on other subgroups, the margin of sampling error may be higher.
The Affordable Care Act’s requirement that most private health insurance plans provide contraceptive coverage has been the focus of ongoing litigation in the federal courts. In response to recent Supreme Court actions in the Hobby Lobby and College of Wheaton cases, the U.S. Department of Health and Human Services issued an interim final rule and a proposed rule on August 22, 2014 addressing how some employers with religious objections to birth control can comply with the contraceptive coverage requirement when offering health insurance to their workers.
A new infographic and fact sheet from the Kaiser Family Foundation walk women through the key questions to help them identify whether their employer-based insurance is required to provide contraceptive coverage. These materials are an important resource for understanding the current implementation of the ACA’s contraceptive coverage requirement, in light of the recently issued HHS regulations and ongoing legal challenges.
For more information about the ACA and women’s health coverage, visit kff.org.
Individuals transitioning into and out of the criminal justice system include many low-income adults with significant physical and mental health needs who face a variety of economic and social challenges. The Affordable Care Act (ACA) coverage expansions, particularly the Medicaid expansion, provide new opportunities to increase health coverage for this population, which may contribute to improvements in their ability to access care as well as greater stability in their lives and reduced recidivism rates. This brief provides an overview of the adult criminal justice-involved population and the potential impacts of the ACA on their health coverage. (For information on health coverage and care for youth in the juvenile justice system, see: https://www.kff.org/medicaid/issue-brief/health-coverage-and-care-for-youth-in-the-juvenile-justice-system-the-role-of-medicaid-and-chip/.)
The Criminal Justice System
Figure 1: Overview of Types of Correctional Facilities
The criminal justice system is comprised of a range of different types of correctional facilities (Figure 1). Correctional facilities include prisons, which typically house longer-term felons or inmates serving a sentence of more than one year, and jails, which house individuals awaiting trial or sentencing and those convicted of misdemeanors and serving shorter terms that are typically less than one year. There also are several forms of community-based corrections, including probation, parole, and halfway houses. Offenders in community corrections often are required to adhere to strict conditions and rules, and failure to comply with these requirements may lead to incarceration or re-incarceration.
Prisons are overseen by the federal government and states, while jails typically are governed by the local city or county. The federal correctional system consists of prisons overseen by the Federal Bureau of Prisons, which house individuals convicted of a federal crime and generally serving a term of more than one year. State correctional systems oversee prisons housing individuals convicted of state crimes and generally serving terms of more than one year. Each state governs its own prison system through a Department of Corrections. There are over 3,200 jails nationwide housing individuals awaiting trial or serving a short sentence for a misdemeanor, with most counties (2,977 out of 3,069) operating their own jails.1
The Criminal Justice-Involved Population
About 2.3 million individuals are incarcerated in prison or jail, but millions more interact with the correctional system annually (Table 1). (See Appendix Table 1 for data by state.) About 1.5 million individuals were incarcerated in prisons as of the end of 2012. Over the course of the year, about 600,000 individuals are admitted to prison and a similar number are released.2 As of mid-year 2013, over 730,000 individuals were in jails.3 About six in ten of these individuals were not convicted and awaiting court action; the remaining four in ten were sentenced or convicted offenders awaiting sentencing.4 Given the shorter terms of jail inmates compared to prisoners, there is rapid churn among the jail population. Between July 2012 and June 2013, an estimated 11.7 million people were admitted to local jails and, on average, jails experienced a weekly turnover rate of 60%.5 The jail population is concentrated in large jails (that have an average daily population of 1,000 or more inmates), which house nearly half (48%) of all jail inmates but only account for 6% of all jail jurisdictions.6 An additional 4.8 million adults were under community supervision as of the end of 2012, and about 4.1 million adults entered and exited community supervision over the course of 2012.7 About 80% of adults under community supervision are on probation, while the remainder is on parole.
Table 1: Overview of the Criminal Justice Involved Population
Prisoners
Number of Prisoners as of December 31, 2012
1,570,397
Number of Admissions of Sentenced Prisoners during 2012
609,781
Number of Releases of Sentenced Prisoners during 2012
637,411
Jail Inmates
Number of Inmates in Local Jails as of June 2013
731,208
Number of Persons Admitted to Local Jails, July 2012-June 2013
11,700,000
Weekly Turnover Rate, week ending June 30, 2013
60%
Adults Under Community Supervision
Number Under Community Supervision as of December 31, 2012
4,781,300
Number Entering Community Supervision during 2012
2,544,400
Number Exiting Community Supervision during 2012
2,585,900
Sources: Bureau of Justice Statistics, Prisoners in 2012, Trends in Admissions and Releases, 1991-2012, U.S. Department of Justice, December 2013; Bureau of Justice Statistics, Jail Inmates at Midyear 2013 Statistical Tables, U.S. Department of Justice, May 2014, and Bureau of Justice Statistics, Probation and Parole in the United State, 2012, U.S. Department of Justice, Revised April 22, 2014. See sources for methodology and notes.
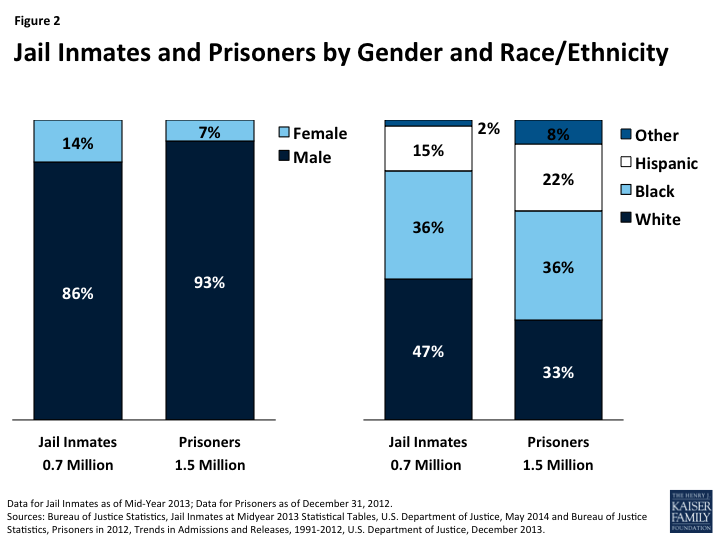
Adult males of color make up the majority of the incarcerated population. As of 2013, 99% of jail inmates were adults and 86% were male. Just over half of the jail population (53%) was people of color, including more than a third who were Black (36%) and 15% who were Hispanic (Figure 2).8 Among prisoners, more than nine in ten are male (93%) and two-thirds (66%) are people of color.9 These patterns reflect higher incarceration rates among people of color compared to Whites. Incarceration rates for Black men are over six times higher than the rate for White men and nearly two and half times higher than the rate for Hispanic men.10 American Indians also have higher rates of incarceration compared to Whites.11
Figure 2: Jail Inmates and Prisoners by Gender and Race/Ethnicity
People involved with the criminal justice system are generally low-income and uninsured. Overall, data on the income and insurance status of people moving into and out of the criminal justice system are limited. However, survey data from 2002 show that nearly six in ten jail inmates reported monthly income of less than $1,000 prior to their arrest.12 Data also suggest that the population is largely uninsured. For example, a survey of San Francisco county jails found that about 90% of people who enter county jails have no health insurance.13 Another survey of inmates returning to the community from Illinois jails found that more than eight in ten were uninsured after returning to the community at 16 months post-release.14
The incarcerated population has significant physical and mental health needs. Chronic disease is prevalent among the population with higher rates of tuberculosis, HIV, Hepatitis B and C, arthritis, diabetes, and sexually transmitted disease compared to the general population.15 Over half of prison and jail inmates have a mental health disorder, with local jail inmates experiencing the highest rate (64%).16 These disorders include mania, major depression, and psychotic disorders.17 Prisoners and jail inmates who have a mental health disorder are more likely than those without a disorder to have been homeless in the year prior to their incarceration, less likely to have been employed prior to their arrest, and more likely to report a history of physical or sexual abuse. Moreover, the majority of inmates with a mental health disorder also have a substance or alcohol use disorder.18
Individuals moving into and out of the criminal justice system also face a variety of social challenges. Poverty, unemployment, lower education levels, housing instability, and homelessness are all more prevalent issues among criminal justice-involved population than the general population.19 This population also generally has higher rates of learning disabilities and lower rates of literacy.20
Health Care for Incarcerated Individuals
Correctional facilities are required to provide health services to incarcerated individuals, but many inmates go without needed care. The provision of health care varies significantly across states and types of correctional facilities. Some larger prisons have infirmaries on-site, and many prisons hire independent doctors or contract with private or hospital staff to provide care, with the majority of prisons creating a hybrid system. In jails, health care is primarily provided through contracts with local health care providers, such as public hospitals or other safety-net providers, who come to the jails to provide services. As with large prisons, some large jails have on-site primary care, pharmacy, and mental health and substance abuse centers. Even though these services are available, data show that many inmates go without needed health care while incarcerated. For example, a 2009 study found that, among inmates with a persistent medical problem, approximately 14% of federal inmates, 20% of state inmates, and 68% of local jail inmates did not receive a medical examination while incarcerated.21 About two thirds of prison inmates and less than half of jail inmates who had previously been treated with a psychiatric medication had taken medication for a mental condition since incarceration.22
States have been facing rising costs in prison health care spending. As of 2011, state spending on correctional health care was about $7.7 billion, accounting for about a fifth of total prison expenditures.23 Between 2007 and 2011, correctional health care spending rose in 41 states, with a median growth rate of 13 percent.24 This growth reflects a combination of an increase in the prison population and higher per-inmate expenses due to an aging inmate population, the prevalence of physical and mental health needs, and challenges in delivering health care in prisons, such as distances from hospitals and providers.25 However, in most states, spending peaked before fiscal year 2011 and has been declining since then due, in part, to a reduction in state prison populations.26
Medicaid has historically played a very limited role in covering inmate health care costs. Prior to the ACA, Medicaid eligibility was limited to low-income people who fell into certain groups, including children, pregnant women, parents of dependent children, and elderly and disabled adults. Overall, eligibility for non-disabled, non-elderly adults was very limited, with adults without dependent children generally excluded from the program and income eligibility limits for parents remaining very low in most states.27 As such, many inmates historically could not qualify for Medicaid since they did not fit into one of the categorical eligibility categories. Even for inmates who do qualify for Medicaid, federal law prohibits Medicaid payment for most health care services provided to individuals while incarcerated under a policy known as the “inmate exclusion” (see Box 1). Given these limitations, previously, few states pursued Medicaid financing for eligible prisoners’ health care services.28
Box 1: The Medicaid Inmate Exclusion Policy.Federal Medicaid law prohibits the payment of federal Medicaid matching funds for the cost of any services provided to an “inmate of a public institution,” except when the individual is a “patient in a medical institution.”29.This policy applies to both adults in jails or prisons as well as to youth involuntarily detained in a state or local juvenile facility.This policy does not prohibit individuals from being enrolled in Medicaid while incarcerated; however, even if they are enrolled, Medicaid will not cover the cost of their care, except for care received as an inpatient in a hospital or other medical institution..Because individuals may remain enrolled, states can suspend, rather than terminate, Medicaid coverage for inmates to accommodate the inmate exclusion. However, suspension and termination policies vary across states.
The ACA and the Criminal Justice-Involved Population
The ACA offers new opportunities to increase health coverage among individuals transitioning back into the community from prisons and jails. The ACA established new coverage options by expanding Medicaid eligibility to nearly all adults with incomes at or below 138% FPL ($16,105 for an individual in 2014). The federal government will cover 100% of the cost of coverage for individuals made newly eligible as a result of this expansion, phasing down to a 90% federal match as of 2020. The ACA also created new Health Insurance Marketplaces with premium tax credits available for moderate income individuals. In addition to these coverage expansions, the ACA also requires all states to implement streamlined, coordinated enrollment processes to connect eligible individuals to health coverage.
The ACA coverage expansions provide new coverage options for many individuals who interact with the criminal justice system. Although as enacted in the ACA, the Medicaid expansion would occur in all states, the Supreme Court ruling on the ACA effectively made the expansion a state option. As of August 2014, 28 states are implementing the expansion.30 In states expanding Medicaid to low-income adults, many individuals who interact with the criminal justice system are newly eligible for the program. Moreover, in all states, some individuals being released from prison and jail may qualify for coverage under the new Marketplaces established by the ACA (see Box 2). However, in states not implementing the Medicaid expansion, many poor uninsured adults did not gain a new coverage option and will likely remain uninsured. While the coverage expansions increase coverage options for individuals transitioning through the criminal justice system, targeted outreach and enrollment efforts will be key for translating these new options into increased coverage, particularly since the population faces a broad range of enrollment barriers such as lack of knowledge about coverage options and lower literacy and education levels.31
Box 2: Medicaid and Marketplace Enrollment Policies for Incarcerated Individuals.Medicaid. Individuals incarcerated in jail or prison may enroll in Medicaid while incarcerated. However, Medicaid will not pay for most medical care for individuals while they are housed in jail or prison due to the federal inmate exclusion policy..Marketplace coverage. Individuals may not purchase coverage through the Marketplace while serving a term in prison or jail. (This bar on purchasing coverage does not extend to individuals in jail or prison who are pending disposition of charges—i.e., being held but not yet convicted of a crime.) Individuals are provided a 60-day special enrollment period that begins upon discharge from jail or prison. During this time, they may enroll in coverage even if it is outside the Marketplace open enrollment period. However, because this special enrollment period does not begin until the time of release, they will likely experience a gap in coverage between the time of discharge and completion of enrollment in coverage. After the 60-day special enrollment period, individuals are not eligible to purchase coverage through the Marketplace until the next regular open enrollment period or unless they qualify for a different special enrollment period..Source: “Health coverage for incarcerated people,” at https://www.healthcare.gov/incarceration/
Correctional facilities can play a key role in connecting eligible individuals to coverage and care to facilitate their reintegration back into the community. Correctional facilities can help connect eligible individuals to coverage by providing outreach and education about coverage options as well as direct enrollment assistance either through staff or by bringing in external enrollment assisters. Providing this assistance within jails may be challenging since there is often limited time to connect individuals with resources or support community re-entry given the short-terms of jail inmates. However, several states and localities have already launched initiatives to enroll individuals into coverage and facilitate connections to community providers as individuals transition back into the community (see Box 3).
Increased coverage among the criminal justice-involved population may lead to improved access to care and broader benefits, including reduced recidivism rates. As noted, individuals transitioning into and out of prisons and jails have significant physical and mental health needs. Upon release from prison and jail, individuals are often uninsured, making it difficult to access stable sources of care in the community to address these needs. Expanding health insurance to these individuals will likely facilitate their ability to access needed care and manage their ongoing conditions. Improved connections to services and better management of health conditions may also contribute to reduced rates of recidivism, particularly among individuals with mental health and substance abuse disorders. For example, in Michigan, rates of recidivism fell following implementation of an initiative that links newly released prisoners to a medical home in the community, helps them access needed medications and primary and specialty care, and assists them in obtaining their medical records upon release.32 In addition, studies in Florida and Washington found that people with severe mental illness who were enrolled in Medicaid at jail release were more likely to access community mental health and substance abuse services than those without Medicaid, and that 12 months after release, Medicaid enrollees had 16% fewer detentions and stayed out of jail longer than those who either were not enrolled or had been enrolled for a shorter time.33
Box 3: Connecting Individuals to Coverage and Care to Support Community Re-Entry.Application Assistance in Cook County Jail. Cook County Health and Hospital System (CCHHS) partnered with Cook County Sheriff’s Office (CCSO) and a non-profit organization, Treatment Alternatives for Safe Communities (TASC), to screen detainees entering Cook County Jail for eligibility for CountyCare, the county’s Medicaid expansion program. By using information gathered at intake, TASC employees are able to validate identity and meet application requirements onsite. As of April 1, 2014, approximately 3,845 people received coverage after starting an application in jail and there is a 94% approval rate for applications submitted from Cook County Jail.34.Connections Correctional Health Care Services in Delaware. Connections is a community based not-for-profit organization that provides behavioral health care in all of the Delaware Department of Corrections facilities. Through a partnership with Community Oriented Correctional Health Services (COCHS), Connections is maximizing continuity of care by connecting individuals in correctional facilities with providers in the community. The system brings providers into the facilities that the inmate can also connect with for care after being released. Approximately 25,000 inmates cycle through Delaware’s correctional facilities annually and, on average, Connections works with about 7,000 prisoners per day.35
Expanding health coverage among the criminal justice-involved population may contribute to offsetting savings for states. Although the Medicaid inmate exclusion policy limits Medicaid payments for most health care services provided to individuals while incarcerated in prison or jail, Medicaid reimbursement is available for care provided to eligible individuals admitted to an inpatient facility, such as a hospital, nursing home, or psychiatric center. Prior to the ACA, only a few states had pursued Medicaid reimbursement for these services given the limited share of the incarcerated population that could qualify for Medicaid. However, those that did pursue federal matching dollars for inmate inpatient services demonstrated state savings.36 The Medicaid expansion offers greater potential savings to states from reimbursement for inpatient services provided to incarcerated individuals, since a larger share of the incarcerated population may qualify for Medicaid and because the federal government is providing states an enhanced federal matching rate for newly eligible adults. Several states have projected substantial state savings from obtaining Medicaid reimbursement for inpatient care provided to prisoners.37 Increased coverage among the formerly incarcerated population as they return to the community may also contribute to other state and local savings through reductions in uncompensated care and savings in other indigent care programs.
Conclusion
Individuals moving into and out of the criminal justice population are a low-income population with significant physical and mental health needs. Historically, this population has had high uninsured rates and very limited access to Medicaid coverage given the program’s limited eligibility for adults prior to the ACA. The ACA’s Medicaid expansion and Marketplaces, coupled with targeted outreach and enrollment efforts, provide opportunities to increase coverage among this population that should help to improve their ability to access needed care and contribute to greater stability in their lives and reduced rates of recidivism. States expanding Medicaid may also reduce spending for their incarcerated population and achieve other state and local savings stemming from gains in coverage through Medicaid and the Marketplaces among formerly incarcerated individuals who are returning to the community.
Appendix
Appendix Table 1: Criminal Justice-Involved Population by State
State
State and Federal Prisoners, 2012
Local Jail Inmates Held on Average Day, 2011
Adults Under Community Supervision, 2012
United States
1,570,397
722,737
4,781,300
Alabama
32,431
15,333
66,600
Alaska*
5,633
73
9,100
Arizona
40,080
13,467
79,900
Arkansas
14,654
7,189
52,600
California
134,534
71,781
387,000
Colorado
20,462
11,781
89,300
Connecticut*
17,530
—
50,500
Delaware*
6,914
—
16,200
DC
3,011
13,700
Florida
101,930
57,959
245,400
Georgia
55,457
44,559
462,500
Hawaii*
5,831
—
23,800
Idaho
7,985
3,718
35,500
Illinois**
49,348
20,666
152,000
Indiana
28,831
17,342
131,300
Iowa
8,733
4,099
34,300
Kansas
9,682
7,236
22,100
Kentucky
22,110
18,252
68,900
Louisiana
40,172
31,022
70,100
Maine
2,108
1,322
7,000
Maryland
21,522
12,423
110,300
Massachusetts
11,308
10,326
70,800
Michigan
43,636
16,541
197,700
Minnesota
9,938
6,537
114,200
Mississippi
22,319
10,601
37,600
Missouri
31,247
11,520
76,100
Montana
3,609
1,035
10,800
Nebraska
4,705
3,406
15,600
Nevada**
12,883
7,083
16,700
New Hampshire
2,790
2,063
6,300
New Jersey
23,225
15,280
129,900
New Mexico
6,727
8,297
26,500
New York
54,210
29,793
154,000
North Carolina
37,136
18,288
99,900
North Dakota
1,512
1,111
5,200
Ohio
50,876
17,788
271,500
Oklahoma
25,225
8,654
27,800
Oregon
14,840
5,872
60,000
Pennsylvania
51,125
36,290
279,100
Rhode Island*
3,318
—
24,300
South Carolina
22,388
11,970
40,500
South Dakota
3,650
1,505
10,000
Tennessee
28,411
24,104
77,600
Texas
166,372
66,604
515,000
Utah
6,962
7,194
14,400
Vermont*
2,034
—
7,000
Virginia
37,044
27,313
53,900
Washington
17,271
12,988
97,200
West Virginia
7,070
3,882
10,600
Wisconsin
22,600
13,965
64,600
Wyoming
2,204
1,494
5,900
*Prisons and jails form one integrated system. Data for prisoners include total jail and prison populations. Jail data reported for Alaska are for 14 locally operated jails. **Data for prisoners are imputed estimates.Data source: Bureau of Justice Statistics National Prisoner Statistics Program, Deaths in Custody Reporting Program, and Annual Probation Survey and Annual Parole Survey.
Endnotes
James Stephan and Georgette Walsh, Census of Jail Facilities, 2006 (Washington, DC: US Department of Justice, Office of Justice Programs, Bureau of Justice Statistics, December 2011), http://bjs.gov/content/pub/pdf/cjf06.pdf and National Association of Counties, County Intelligence Connections (CIC) database, 2012. Some states operate unified prison and jail systems; in these states, the state Department of Corrections oversees both the prisons and jails in the state. See Barbara Krauth, A Review of the Jail Function within State Unified Corrections Systems (Longmont, CO: LIS, Inc., US Department of Justice, National Institute of Corrections Information Center, September 1997), http://nicic.gov/library/014024↩︎
E. Ann Carson and Daniela Golinelli, Prisoners in 2012: Trends in Admissions and Releases, 1991-2012 (Washington, DC: US Department of Justice, Office of Justice Programs, Bureau of Justice Statistics, December 2013), http://www.bjs.gov/content/pub/pdf/p12tar9112.pdf. ↩︎
Todd D. Minton and Daniela Golinelli, Jail Inmates at Midyear 2013 – Statistical Tables (Washington, DC: US Department of Justice, Office of Justice Programs, Bureau of Justice Statistics, May 2014), http://www.bjs.gov/content/pub/pdf/jim13st.pdf. ↩︎
Laura M. Maruschak and Thomas P. Bonczar, Probation and Parole in the United States, 2012, (Washington, DC: US Department of Justice, Office of Justice Programs, Bureau of Justice Statistics, Revised April 22, 2014) http://www.bjs.gov/content/pub/pdf/ppus12.pdf↩︎
Todd D. Minton and Daniela Golinelli, Jail Inmates at Midyear 2013, op cit. ↩︎
E. Ann Carson and Daniela Golinelli, Prisoners in 2012, op cit. ↩︎
Todd Minton, Jails in Indian Country, 2011 (Washington DC: US Department of Justice, Office of Justice Programs, Bureau of Justice Statistics, September 2012), http://www.bjs.gov/content/pub/pdf/jic11.pdf↩︎
Wang EA, White MC, Jamison R, Goldenson J, Estes M, Tulsky JP. Discharge planning and continuity of health care: findings from the San Francisco County Jail. Am J Public Health. 2008;98(12):2182–4. ↩︎
National Institute of Corrections, “Solicitation for a Cooperative Agreement—Evaluating Early Access to Medicaid as a Reentry Strategy,” Federal Register 76, no. 129 (2011): 39438-39443; Ingrid Binswanger, Nicole Redmiond, and LeRoi Hicks, “Health disparities and the criminal justice system: an agenda for further research and action,” Journal of Urban Health 89, no. 1 (2012): 98–107; and Laura Maruschak, Medical Problems of Prisoners (Washington, DC: US Department of Justice, Office of Justice Programs, Bureau of Justice Statistics, April 2008), http://www.bjs.gov/content/pub/pdf/mpp.pdf. ↩︎
Doris James and Lauren Glaze, Mental health problems of prison and jail inmates, (Washington, DC:US Department of Justice, Office of Justice Programs, Bureau of Justice Statistics, September 2006), http://www.bjs.gov/content/pub/pdf/mhppji.pdf↩︎
Kamala Mallik-Kane and Christy Visher, Health and prisoner reentry: how physical, mental, and substance abuse conditions shape the process of reintegration, (Washington, DC: Urban Institute, Justice Policy Center, February 2008), http://www.urban.org/UploadedPDF/411617_health_prisoner_reentry.pdf↩︎
Caroline Wolf Harlow, Education and Correctional Populations, (Washington, DC: US Department of Justice, Office of Justice Programs, Bureau of Justice Statistics, January 2003), http://www.bjs.gov/content/pub/pdf/ecp.pdf↩︎
Wilper AP, Woolhandler S, Boyd JW, Lasser, KE, McCormick D, Bor DH, et al. The health and health care of US prisoners: results of a nationwide survey. American Journal of Public Health. 2009; 99(4):666-72. ↩︎
Judith Solomon, The Truth about Health Reform’s Medicaid Expansion and People Leaving Jail (Washington, DC: Center on Budget and Policy Priorities, June 2014), http://www.cbpp.org/files/6-25-14health.pdf↩︎
Vondie Woodbury and Peter Sartorius, Michigan Pathways Project links ex-prisoners to medical services, contributing to a decline in recidivism (Rockville, MD: Agency for Healthcare Research and Quality, August 2013), http://www.innovations.ahrq.gov/content.aspx?id=2134↩︎
Joseph Morrissey et al, “Medicaid Enrollment and Mental Health Service Use Following Release of Jail Detaineees with Severe Mental Illness,” Psychiatric Services 57, no. 6 (2006): 809-815 and “Joseph Morrissey et al, “The Role of Medicaid Enrollment and Outpatient Service Use in Jail Recidivism Among Persons with Severe Mental Illness,” Psychiatric Services 58, no. 6 (2007): 794–801. ↩︎
Personal communication with Cook County Health and Hospital Systems, April 2014. ↩︎
Analysis of 15 States and D.C. Also Finds Changes Vary Across States and Insurers
Results Suggest Consumers Should Shop Carefully When Open Enrollment Begins November 15
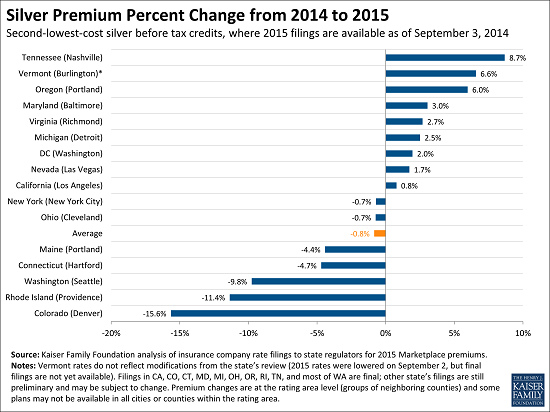
MENLO PARK, Calif. — An early look at the cost of health insurance in 16 major cities finds that average premiums for the benchmark silver plan – the one upon which federal financial help under the Affordable Care Act to consumers is based – will decrease slightly in 2015. The new study from the Kaiser Family Foundation analyzes premiums in the largest cities in 15 states and the District of Columbia where information from rate filings is available.
Premiums for the second-lowest cost silver plan for individuals will fall by an average of 0.8 percent from current levels in these cities when open enrollment begins on Nov. 15, according to the study. The analysis finds that the premium for the second-lowest-cost silver plan is decreasing in 7 of the 16 areas studied – but also that changes in average premiums will vary considerably across areas. They range from a decline of 15.6 percent in Denver, Colorado (to $211 per month), to an increase of 8.7 percent in Nashville, Tennessee (to $205 per month). In both cases premiums are for a 40-year-old nonsmoker, before taking into account any tax credit. It is important to note that rate changes may be different in different rating areas in these states.
“There is variation, but so far, premium increases in year two of the Affordable Care Act are generally modest,” said Drew Altman, Kaiser’s President and CEO. “Double digit premium increases in this market were not uncommon in the past,” Altman added.
At least two insurers will offer coverage through the marketplaces in the major city in each of the 15 states studied and D.C. Most areas will have five or more insurers, and three will have 10 or more. The study finds that insurer participation generally held stable or increased in all of the cities, with the exception of Portland, Oregon, where the number of participating insurers decreased from 10 to 8.
Modest changes in premiums would be a boon for the federal budget, but for consumers the picture is more complex
The second-lowest-cost silver plan in each state is closely watched because it is the benchmark that helps determine how much assistance eligible individuals (those with incomes from 100 percent to 400 percent of the poverty level) can receive in the form of federal tax credits to help them buy coverage.
If early trends hold and average premiums for the benchmark silver plans decline across the country, the federal government could end up paying out less than expected in tax credit subsidies overall for 2015. Lower benchmark silver plan premiums would mean savings for taxpayers.
For Marketplace consumers, however, the implications are more complicated. On the one hand, the availability of tax credits can cushion eligible individuals from having to pay more even in areas where premiums will rise. The analysis finds, for example, that in nearly all of the 16 areas studied, a single 40-year-old with income of $30,000 a year would pay 0.8 percent less in premiums in 2015 than in 2014 to enroll in the second-lowest-cost silver plan, after taking tax credits into account.
On the other hand, even people who receive federal financial help may face large premium increases if they simply re-enroll in the same plan in 2015, since in many cases the lower-cost plans in 2015 will no longer be among the low-cost offerings next year. This is because people receiving tax credits must pay the full difference in premium between the plan they choose and the second-lowest-cost silver plan in their area. In 12 of the 16 cities, at least one of the insurers that had offered one of the two lowest-cost silver plans in 2014 is no longer offering a low-cost silver plan in 2015.
“Consumers should go into the open enrollment period prepared to shop for the best deal all over again,” said Kaiser Senior Vice President Larry Levitt, co-executive director of the Foundation’s Program for the Study of Health Reform and Private Insurance. “You could end up paying more if your insurer is no longer offering one of the low-cost plans, so you should look carefully at your options.”
For bronze-level plans, which cover about 60 percent of enrollees’ health expenses on average, the analysis finds that the premium for the lowest-cost bronze option across the marketplaces is increasing an average of 3.3 percent in 2015. Here again changes vary across areas, from a decline of 15.7 percent in the premium (to $196 per month) for the lowest-cost bronze plan available in Hartford, Conn., to a premium increase of 13.3 percent (to $165 per month) for such a plan in Baltimore. Bronze plans are the least expensive option someone can choose to satisfy the ACA’s requirement to have coverage.
Areas studied, methodology
The analysis provides state-by-state estimates of premiums and premium changes for the lower-cost bronze plan and the two lowest-cost silver plans available through ACA marketplaces in Los Angeles, Denver, Hartford, Conn., Washington, D.C., Portland, Maine, Baltimore, Detroit, Las Vegas, Nev., New York City, Cleveland, Portland, Ore., Providence, R.I., Nashville, Burlington, Vt., Richmond, Va., and Seattle. The report shows lower-cost plan premiums in 2015 and 2014, before and after federal tax credits, for a 40-year-old single adult who is a nonsmoker and earns $30,000 a year. It also compares 2015 and 2014 marketplace premiums for such plans, after factoring in tax credits, for a 25-year-old individual, a family of four with two 40-year-old adults and two kids, and a retired couple of 60-year-olds.
In his latest column for The Wall Street Journal’s Think Tank, A Perilous Gap In Health Insurance Literacy, Drew Altman discusses how progress in expanding coverage requires greater attention to the problem of health insurance literacy.
All previous columns by Drew Altman are available online.
Larry Levitt’s September 2014 post looks at the challenges and potential priorities for the new CEO of the federal health insurance marketplace in advance of the start of the Affordable Care Act’s second open enrollment period, which begins November 15. The post is now available at The JAMA Forum.
Other contributions to The JAMA Forum are also available.
The Kaiser Family Foundation has launched a new interactive tool designed to provide the latest data on the U.S. government’s global health budget in an easy-to-access form.
The U.S. Global Health Budget Tracker lets users follow the budget from the President’s budget request through the appropriations process in Congress, as well as see trends over time. Data are provided for global health program areas (e.g., HIV, TB, family planning/reproductive health) by Agency (e.g., USAID, CDC) and by major initiative (e.g., PEPFAR). The tracker contains final budget data dating back to fiscal year 2006.
On Thursday, September 11 at 1 p.m. ET, the Foundation hosted an interactive web briefing with Vice President and Director of Global Health and HIV Policy Jennifer Kates; Director of the U.S. Global Health Budget Project Adam Wexler; and Global Health Policy Analyst Allison Valentine, discussed the tracker and demonstrate how to use it to analyze funding data.
Watch an archived version of the web briefing here.
In his latest column for The Wall Street Journal’s Think Tank, Drew Altman explains why Senator Mark Pryor’s new campaign ad features the Affordable Care Act’s protections for people with pre-existing medical conditions, the somewhat forgotten “mega provision” of the law.
All previous columns by Drew Altman are available online.