KFF designs, conducts and analyzes original public opinion and survey research on Americans’ attitudes, knowledge, and experiences with the health care system to help amplify the public’s voice in major national debates.
Over the last several decades, states have been working to rebalance their long-term services and supports (LTSS) systems by devoting a greater proportion of Medicaid spending to home and community-based services (HCBS) instead of institutional care.1 Rebalancing efforts are driven by beneficiary preferences for HCBS, the fact that HCBS are typically less expensive than comparable institutional care, and states’ community integration obligations under the Americans with Disabilities Act and the Olmstead decision.2 While most states continue to rely on § 1915(c) waivers to expand beneficiary access to Medicaid HCBS, a significant number of states (13 in FY 2014 and 16 in FY 2015) report that incentives built into their managed LTSS programs are expected to increase beneficiary access to HCBS.3 As a result, measuring LTSS rebalancing is an important means of determining the extent to which Medicaid managed LTSS programs are achieving their intended goals. This fact sheet provides a brief overview of quality measures related to LTSS rebalancing; it is not an exhaustive review of quality measures in this area. Table 1 summarizes some of the existing measures, with specific examples provided in Tables 2, 3, and 4. A companion issue brief summarizes key themes from a roundtable discussion of issues related to the assessment of rebalancing in capitated Medicaid managed LTSS programs.4
Some existing quality measures focus on the extent of community integration experienced by people with LTSS needs. These measures generally survey individual beneficiaries by asking them to report on factors such as their level of satisfaction with where they currently live, their ability to choose where they live, the degree of control they have over their daily activities, the amount of community involvement they have in their work and leisure activities, and whether they are receiving adequate services to support their needs (Table 2). One of the more long-standing sets of these measures, dating to 1997, is the National Core Indicators (NCI).5 The NCI presently are used in 39 states in programs that serve people with developmental disabilities; one NCI domain focuses on individual outcomes, including community inclusion. More recently, the NCI-Aging and Disabilities has been developed to survey seniors and people with physical disabilities about similar issues. The NCI-Aging and Disabilities survey was piloted in three states in 2014, and the year one survey will take place in 2015.6
Some Medicaid managed LTSS programs include measures related to LTSS rebalancing. For example, several of the capitated financial alignment demonstrations for dual eligible beneficiaries7 require states to report on the number or percentage of beneficiaries living in institutional or community-based settings, those transitioning between institutional and community-based settings, and those experiencing decreases in personal care hour authorizations (Table 3). Some of these measures are specified in the memoranda of understanding between the Centers for Medicare and Medicaid Services (CMS) and the states that authorize the demonstrations, while others are still to be determined in the three-way contracts between CMS, the state, and the health plans. As illustrated in Table 3, these measures vary among the states. In most of these demonstrations, one or two of these measures is included in the subset of measures used to determine whether health plans can earn back their quality withhold funds. Although LTSS rebalancing is not among CMS’s § 1915(c) HCBS waiver quality measures,8 CMS’s 2013 guidance requires states to have a “comprehensive quality strategy” in Medicaid managed LTSS waivers. 9 Reporting requirements related to LTSS rebalancing are included in a few states’ managed LTSS demonstrations (Table 4). In addition, the evaluation of Kansas’ § 1115 managed LTSS demonstration must assess whether the demonstration reduces the percentage of beneficiaries in institutions by providing additional HCBS and the impact of including LTSS in the capitated benefit, with a subfocus on HCBS. CMS also has awarded Testing Experience and Functional Assessment Tools grants to states to use health information technology to develop HCBS quality measures.10
Measuring LTSS rebalancing remains a gap in assessing HCBS quality, with work to develop these measures continuing. In August 2014, the National Quality Forum (NQF) Measure Applications Partnership “emphasiz[ed] that new and improved measures are needed to evaluate community integration/inclusion and participation” for dual eligible beneficiaries and identified this area as among the “high priority measure gaps.”11 NQF is accepting nominations in late 2014 for a multi-stakeholder committee to create a conceptual framework, conduct an environmental scan, identify gaps, and recommend measure development efforts as part of its two-year Quality Measurement for HCBS project.12
Table 1: Examples of Quality Measures Related to LTSS Rebalancing and Community Integration
Type of Measure
Type of Information Collected
Beneficiary surveys
Beneficiary’s level of satisfaction with current living arrangement
Beneficiary’s ability to choose where she lives
Beneficiary’s degree of control over her daily activities
Beneficiary’s amount of community involvement in work and leisure activities
Whether beneficiary is receiving adequate services to support her needs
Numeric reporting requirements
Number or percentage of beneficiaries living in institutional or community-based settings
Number or percentage of beneficiaries transitioning between institutional and community-based settings
Number or percentage of beneficiaries experiencing decreases in personal care hour authorizations
Looking Ahead
As additional states express interest in implementing managed LTSS programs, the design, use, and interpretation of quality measures related to LTSS rebalancing will be an important aspect of evaluating these programs. Although some measures in this area exist, LTSS measures generally are not as well developed as those for care provided in clinical settings, and work is continuing in this area. Along with measuring the extent to which beneficiaries are served in community-based settings as opposed to institutions, it also is important to assess whether the services provided in community-based settings are adequate to support beneficiary needs. Along with evaluating whether and how community integration is achieved, additional areas in which quality measures important to people who use LTSS could be further developed include those related to beneficiary satisfaction, quality of life, and disability accessibility. Quality measures play an important role in ensuring that information is available to adequately assess whether HCBS programs, including managed LTSS, are achieving their intended goals.
Table 2: Selected Quality Measures Related to Community Integration
Source
Year
Measures
National Core Indicators (for people with developmental disabilities)
In use since 1997; currently used in 39 states
Proportion of people who report that they would like to live somewhere else
Proportion of people who make choices about their everyday lives, including community job, day activity, home
Proportion of people who report having been provided options about where to live, work, and go during the day (e.g., number of homes visited)
Proportion of people who regularly participate in everyday integrated activities in their communities
Proportion of people who have a job in the community
National Core Indicators – Aging and Disabilities
Piloted in 3 states in 2014; year 1 survey in 2015
Do services meet needs (no, some services/some needs, yes); what additional services are needed?
Would person prefer to live somewhere else (no, yes); what prevents person from living somewhere else?
Would person have to live somewhere else without current services (no, maybe/not sure, yes, don’t know)
Where would person like to move (own home/apt., assisted living, NF)
Has person participated in some social activity in last 30 days inside or outside home? If not, why?
Does person get to do things outside of home when wants to? If not, why?
Does person feel as independent as they can be? (no, in-between, yes)
Agency for Healthcare Research and Quality Environmental Measure Scan
2007
Participants reporting unmet need for community involvement
Satisfaction with community activities
Proportion of people who participate in everyday integrated activities in their communities
People live in communities
Proportion of people who participate in integrative community activities
University of California, San Francisco Center for Personal Assistance Services Selected Inventory of Quality-of-Life Measures for LTSS Participant Experience Surveys
2012
Satisfaction with living arrangement (e.g., do you like where you’re living now?)· Choice in living arrangement (e.g., did you choose to live in the community instead of living in an institution?)
Control over transportation and leaving the house (e.g., can you plan a trip or decide when to go out?)
Control over leisure activities (e.g., who decides how you spend your free time?)
Control over other daily activities (e.g., who decides your daily schedule?)
Satisfaction with amount of social contact (e.g., I would like more companionship or contact with other people: strongly agree, agree, neither agree nor disagree, disagree, strongly disagree)
Satisfaction with extent of social network (e.g., in general, how would you rate your satisfaction with your social activities and relationships? Excellent, very good, good, fair, poor)
Satisfaction with use of time (e.g., overall are you satisfied or dissatisfied with the way you are spending your life these days?)
Satisfaction with level of activity (e.g., how satisfied are your with your level of activity? Very dissatisfied, dissatisfied, neither satisfied nor dissatisfied, satisfied, very satisfied)
Roles, fulfillment, meaning (e.g., I do paid or unpaid work or activities that give me a role in life: strongly agree, agree, neither agree nor disagree, disagree, strongly disagree)
Satisfaction with extent of participation (e.g., are you as socially active as you’d like to be – like participating in community activities?)
Quality or nature of participation (e.g., is there anything you want to do outside your home that you don’t do now?)
Membership in community (e.g., I feel that I am a part of my community. Would you say that statement is true, mostly true, mostly false, or false?)
Number of beneficiaries moving from institutional to waiver services*, community to waiver services, community to institutional care, and waiver to institutional care (excluding institutional stays ≤90 days)
MA
Percent of beneficiaries with LTSS needs who have LTSS coordinator*
Documented discussion of beneficiary rights and choice of providers
MI
Percent of enrollees with LTSS needs who have an LTSS Supports Coordinator
Number of enrollees who lived outside NF during current measurement year as proportion of enrollees who lived outside NF during previous year
NY
Number of NF certifiable beneficiaries who lived outside NF during the measurement year as proportion of NF certifiable participants who lived outside NF during previous year*
Number of beneficiaries who did not reside in NF >100 continuous days in a year as a proportion of total number of beneficiaries in plan
Number of participants who were discharged to community setting from NF and who did not return to NF during current year as proportion of number of beneficiaries who resided in NF during previous year (>100 continuous days)
Percent of beneficiaries who reside in NF, wish to return to community and were referred to preadmission screening team or Money Follows the Person
OH
Number of beneficiaries who did not reside in NF as proportion of total number of beneficiaries in health plan (>100 continuous day stay)*
Number of beneficiaries who lived outside NF during current year as proportion of beneficiaries who lived outside NF during previous year (>100 continuous day stay)*
Number of beneficiaries who were discharged to community setting from NF and did not return to NF during current year as proportion of number of beneficiaries who resided in NF during previous year
Number of beneficiaries who were in NF during current year, previous year or combination of both years who were discharged to community setting for at least 9 months during current year as proportion of number of enrollees who resided in NF during current year, previous year or combination of both years (100+ days)
SC
Percent of enrollees newly approved or eligible for HCBS with waiver care plan jointly approved by waiver case manager, state, and health plan and included in overall care plan within 30 days of waiver enrollment; and percent of enrollees already receiving HCBS with waiver care plan included in overall care plan within 30 days of health plan enrollment*
Health plan has work plan and systems in place to ensure smooth transitions among hospitals, NF and community*
Percent of enrollees eligible for HCBS with a waiver care plan within specified timeframes; and percent of enrollee waiver care plans that contain documented discussion of care goals within specified timeframes*
Percent of enrollees who transition to and from hospitals, NF and community; proportion of those who transition among settings who return to an institutional or community setting; and percent of care transitions recorded and transmitted to plan care coordinator*
Number of enrollees transitioning from institutional care to waiver services, community to waiver services, community to institutional care, and waiver services to institutional care (excluding institutional stays of less than 90 days)
Number and percent of all enrollees referred to LTSS, NF and HCBS
Percent of enrollees who require HCBS as indicated by care assessment and care plan and receive services within 90 days of enrollment
Percent of enrollees receiving HCBS who
experience decrease in authorization of attendant care or companion service hours, compared across demonstration years
experience decrease or increase in authorization of personal care or respite care hours, compared across demonstration years
experience decrease in HCBS authorization
Number of enrollees who use assisted living, other congregate housing, and independent living options
TX
Two LTSS measures to be determined*
NF/HCBS measure to be determined
VA
Health plan has established work plan and systems in place for ensuring smooth transitions to and from hospital, NF and community*· Percent of beneficiaries who transition to and from hospital, NF, and community*
Percent of waiver beneficiaries who:
experience decrease in authorization of personal care hours
experience increase in authorization of personal care hours
Number of beneficiaries moving from institutional care to waiver services, community to waiver services, community to institutional care, and waiver services to institutional care (> 90 day stay)
Number and percent of all new enrollees who have LOC indicating need for institutional or waiver services
Number and percent of waiver beneficiaries who:
have service plans adequate and appropriate to their needs and personal goals as indicated in assessment
received services of the type specified in service plan
received services in the scope specified in service plan
received services in the amount specified in service plan
received services for the duration specified in service plan
received services in the frequency specified in service plan
records contain appropriately completed and signed form that specifies that choice was offered between institutional and waiver services; and that choice was offered among waiver services
records document that choice of waiver providers was provided to beneficiary
WA
Number of members moving from institutional to waiver services; community to waiver services; community to institutional services, and waiver to institutional services*
HCBS services are delivered in accordance with individualized care plan, including type, scope, amount, duration and frequency*
Enrollee report of personal care hours noted in eligibility tool and what was authorized
Enrollee report of DME requests documented in eligibility tool and those that were authorized/provided
Medicaid is an important source of health insurance coverage for seniors and non-elderly people with disabilities who rely on the program for essential long-term services and supports (LTSS) to assist with activities of daily living and maintain their independence in the community. Although the program has an historical bias toward funding institutional care, states have been working to rebalance their LTSS systems by devoting a greater percentage of spending to home and community-based services (HCBS). There is increasing state interest in managed long-term services and supports (MLTSS) delivery systems, and states indicate that incentives in MLTSS programs are expected to increase beneficiary access to HCBS. To explore issues related to how rebalancing progress in capitated Medicaid MLTSS programs is measured, the Kaiser Commission on Medicaid and the Uninsured convened a roundtable meeting on November 13, 2014 with a group of federal and state officials and other experts.
Key issues related to measuring performance in rebalancing identified by the roundtable participants include:
Including and using existing measures to assess current MLTSS programs.
Formulating a strategy for how MLTSS will further rebalancing and including detailed measures to assess progress are important parts of state implementation of MLTSS programs. Because beneficiaries presently are receiving services through MLTSS, it is important to assess current MLTSS programs’ impact on rebalancing. In addition to yielding insights on the performance of existing MLTSS programs, rebalancing measures may help to inform more standardized approaches to assessing system performance.
Further developing measures to assess MLTSS programs’ effect on rebalancing.
While some measures exist, rebalancing remains a current gap in assessing MLTSS quality, and states are interested in further developing this area. Additional work on measures is needed to both assess the extent of rebalancing and evaluate the quality of HCBS provided, including the development of uniform or standardized measures to consistently assess the extent of rebalancing and evaluate HCBS quality in a way that allows meaningful comparison by stakeholders. Performance measures also can assess the impact on beneficiaries of delivery systems that integrate LTSS with medical services. A set of core rebalancing measures could facilitate comparisons across states and health plans, although barriers to their development would have to be addressed.
Using MLTSS performance measures to examine beneficiary functioning and account for the diversity of the population with LTSS needs and the settings in which services are provided.
Unlike clinical measures, rebalancing measures focus on beneficiary functioning and therefore require a different approach to data collection, measurement, and reporting for health plans. Rebalancing measures also need to account for the diverse needs and preferences among beneficiaries who rely on LTSS. For accurate comparison, it is important that measures are risk adjusted to account for differences in populations served by health plans that may impact rebalancing performance. In addition to tracking where services are provided, performance measures can account for differences in the degree of community integration offered by various settings.
Basing MLTSS performance measures on data that is available at the individual service level, accurate, and transparent to stakeholders.
Health plan data at the individual service level, allowing for adjustments to measures impacted by different populations served, is a key part of assessing rebalancing. Data collection systems that are designed to capture information relevant to rebalancing are important to inform MLTSS performance measures. Data is most useful if it is transparent to beneficiaries and other stakeholders.
Employing MLTSS performance measures to hold health plans and states accountable for achieving program goals and inform policymakers responsible for overseeing and funding these programs.
State and federal policymakers can use performance measures to monitor and evaluate MLTSS programs and ensure that public dollars are being spent to achieve the program’s intended goals. Measures should clearly define the processes and outcomes for which health plans will be held accountable to achieve. Data from MLTSS performance measures can be an important factor in an era of federal and state budget pressures and potential cuts.
Conclusion
Although work is needed to further develop MLTSS performance measures, there also is a need to assess rebalancing progress now, to determine whether current MLTSS programs are achieving their intended goals. Challenges in assessing rebalancing in MLTSS programs include the diversity of the population receiving LTSS; how to define what is being measured; different reporting requirements associated with different authorities authorizing MLTSS and HCBS; determining the services for which health plans are accountable; health plans’ learning curve in moving from a medical model to meeting beneficiary’s functional needs and supporting beneficiary choice, independence and community integration; ensuring the availability of data about services provided by health plans; and the speed at which capitated MLTSS programs are implemented. Revised Medicaid managed care regulations expected to be issued by CMS also may inform efforts to assess MLTSS programs. Continued focus in this area by federal and state policymakers and other stakeholders is important to evaluating the success of MLTSS programs in promoting LTSS rebalancing.
Introduction
Medicaid is an important source of health insurance coverage for seniors and non-elderly people with disabilities who rely on the program for essential long-term services and supports (LTSS) to assist with activities of daily living and maintain their independence in the community.1 Historically, the program has had a bias toward funding institutional care, as nursing facility services are required to be offered by all states that choose to participate in Medicaid, while most home and community-based services (HCBS) are provided at state option.2 Over the last several decades, states have been working to rebalance their LTSS systems by devoting a greater percentage of spending to HCBS instead of institutional services. These efforts are driven by a number of factors, including beneficiary preferences for HCBS, the typically lower cost of HCBS relative to comparable institutional care, states’ community integration obligations under the Americans with Disabilities Act and the Supreme Court’s Olmstead decision,3 and the new and expanded initiatives to expand Medicaid HCBS available to states through the Affordable Care Act.4
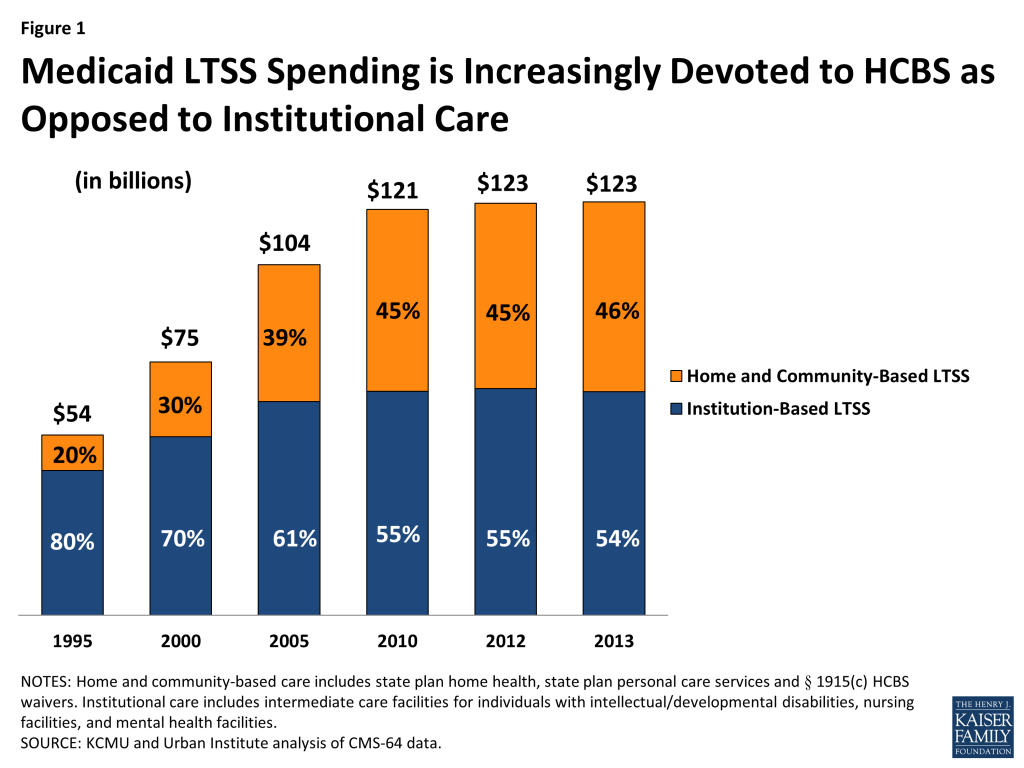
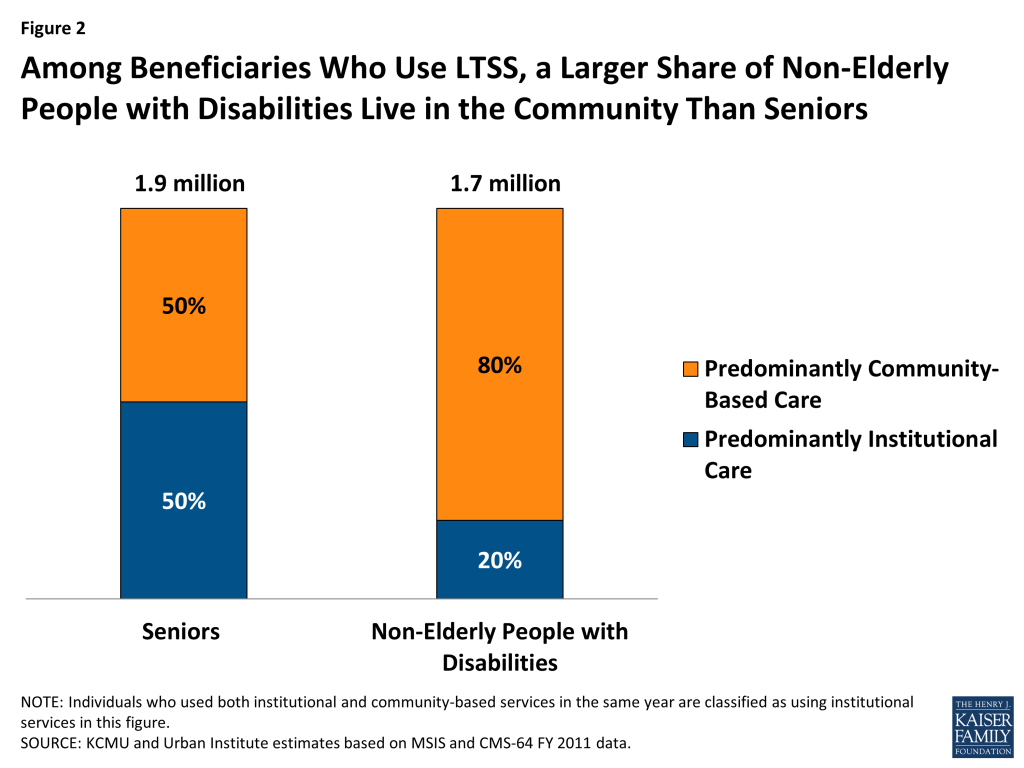
While the majority of Medicaid LTSS dollars still go toward institutional services, the national share of Medicaid LTSS spending on HCBS has more than doubled from 20 percent in 1995 to 46 percent in 2013 (Figure 1). (Notably, these data do not include LTSS provided through Medicaid MLTSS § 1115 waivers.) The extent of rebalancing varies by state and by beneficiary population. For example, non-elderly people with disabilities currently are more likely to receive LTSS in a community-based setting, while seniors are more likely to receive LTSS in an institutional setting (Figure 2).
Figure 1: Medicaid LTSS Spending is Increasingly Devoted to HCBS as Opposed to Institutional CareFigure 2: Among Beneficiaries Who Use LTSS, a Larger Share of Non-Elderly People with Disabilities Live in the Community Than Seniors
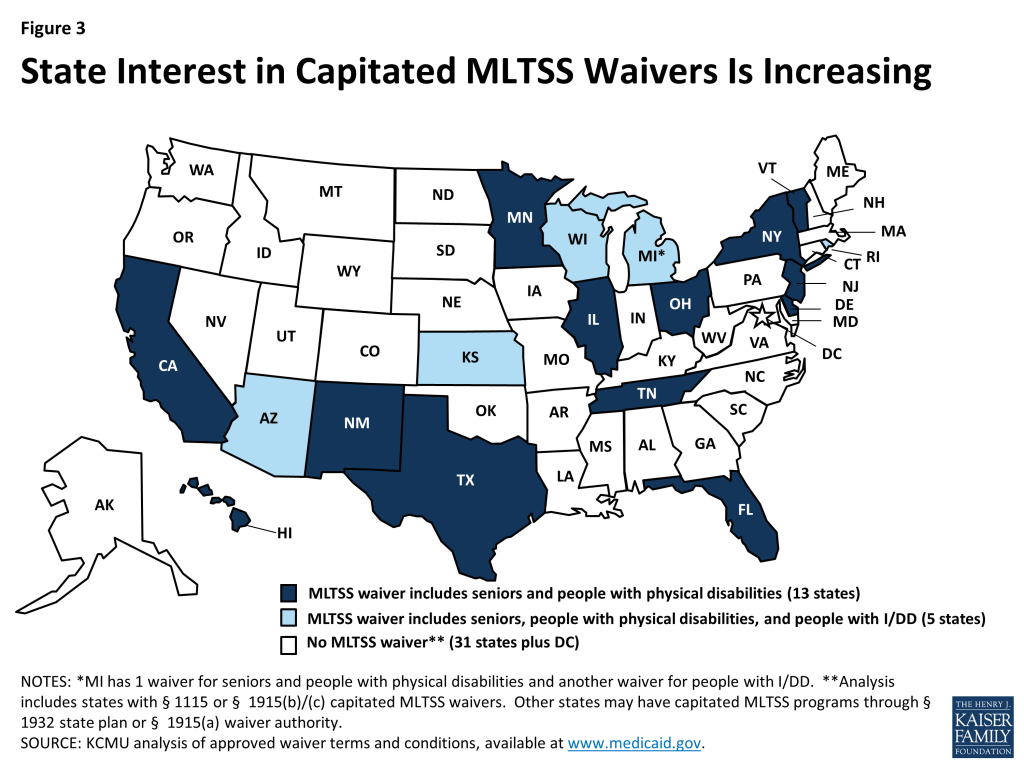
There is increasing state interest in LTSS delivery system reforms, including integrating LTSS with medical services and providing LTSS through managed care models, including capitated managed care organizations (MCOs). As of October 2014, 19 states had waivers under § 1115 or § 1915(b)/(c) for managed long-term services and supports (MLTSS) programs, most of which require beneficiaries to enroll in an MCO to receive services (Figure 3).5 Most of these waivers require MCOs to deliver a comprehensive set of benefits, including acute/primary care, behavioral health, nursing facility, and HCBS, and some operate with concurrent demonstration authority to integrate services and align financing for beneficiaries who are dually eligible for Medicare and Medicaid.6 Notably, there is variation among states in the amount of financial risk for nursing facility services embedded in the capitated rate paid to health plans. In addition to these waivers, other states are operating capitated MLTSS programs through § 1932 state plan authority or § 1915(a) waiver authority.
Figure 3: State Interest in Capitated MLTSS Waivers Is Increasing
A significant number of states (13 in FY 2014 and 16 in FY 2015) report that incentives built into their MLTSS programs are expected to increase beneficiary access to HCBS.7 While some measures to assess state progress in LTSS rebalancing exist, this area remains a gap in evaluating HCBS quality and determining whether MLTSS programs are achieving their intended goals. To explore issues related to how rebalancing in capitated Medicaid MLTSS programs is measured, the Kaiser Commission on Medicaid and the Uninsured convened a roundtable meeting on November 13, 2014 with a group of federal and state officials and other experts, including researchers, representatives from health plans, and beneficiary advocates. This issue brief summarizes the key issues related to measuring performance in rebalancing identified and discussed by the invited participants. A companion fact sheet provides a brief overview of LTSS rebalancing measures.8
Issue Brief
Key Issues
1. Existing performance measures can provide valuable information about rebalancing in current MLTSS programs, while additional measures are in development.
Formulating a strategy for how MLTSS will further rebalancing and including detailed measures to assess progress are important parts of state implementation of MLTSS programs.
Roundtable participants agreed that, while states are identifying LTSS rebalancing as a key objective in their MLTSS programs, managed care is not necessarily a panacea to achieve this goal. Participants noted that the intention of improving rebalancing alone is insufficient to ensure progress when states move from a fee-for-service (FFS) delivery system to MLTSS; instead, participants emphasized that states need a detailed strategy for how delivery system reforms will result in progress in LTSS rebalancing. Some health plans in newly implemented MLTSS programs are finding that beneficiaries who were not previously identified in the FFS system as needing an institutional level of care nevertheless have unmet LTSS needs. Without careful planning in program design, implementation, and assessment efforts, these beneficiaries may be underserved in the FFS system and remain underserved once they transition to MLTSS. In addition to yielding insights on the performance of existing MLTSS programs, rebalancing measures may help to inform more standardized approaches to assessing system performance. The speed at which MLTSS programs are implemented also was noted as a challenge in designing and implementing rebalancing measures, which can be an afterthought or deferred instead of being part of the development of the overall MLTSS program, if adequate time is not devoted to these efforts.
Because beneficiaries presently are receiving services through MLTSS, it is important to assess current MLTSS programs’ impact on rebalancing.
Because beneficiaries are being enrolled and receiving services in MLTSS programs now, roundtable participants emphasized the need to use existing measures to evaluate rebalancing progress without waiting for additional measures to be developed. Absent nationally validated measures, which will take time to be tested and implemented, states and health plans can use some of the available measures to assess rebalancing in current MLTSS programs so that beneficiaries and policymakers know what progress is being made. Participants suggested that states and health plans first focus on core rebalancing measures, such as the number of beneficiaries and amount of spending in nursing facilities vs. home and community-based settings, and then move to assessing beneficiary quality of life, which is a more complex inquiry. Examples of existing measures in capitated MLTSS programs cited by participants include:
the number of beneficiaries receiving long-term care services in nursing facilities and in home and community-based settings both annually and at a point-in-time;
spending on services in nursing facilities and in home and community-based settings;
the average per-person cost of care in nursing facilities and in home and community-based settings;
the number of beneficiaries discharged from a nursing facility who do not return; and
the success of nursing facility diversion efforts.9
For accurate comparison when assessing spending, it is important that measures are risk adjusted to account for differences in populations served by health plans that may impact rebalancing performance. Participants also noted that MLTSS programs must build in financial incentives for health plans and provider payment reforms to achieve the desired outcomes identified in measures. For example, global budgets that include both institutional and HCBS can provide fiscal incentives to promote HCBS. Other potential sources of information about the effects of MLTSS on rebalancing include independent ombudsman programs, assessments of health plan network adequacy, and service denial or termination appeals.
2. Further development of performance measures to assess the effect of MLTSS programs on rebalancing is needed.
Rebalancing measures are a current gap in assessing MLTSS quality, and states are interested in further developing this area.
Roundtable participants agreed that, in most states, sufficient measures do not currently exist to determine whether progress on rebalancing is occurring. MLTSS programs typically have many clinical measures and only a handful of measures relevant to LTSS, and some managed care programs do not include any LTSS measures. However, states are interested in further developing LTSS measures, especially those related to assessing beneficiaries’ quality of life. For example, 18 states will participate in the expansion of the National Core Indicators (NCI), first developed for people with I/DD, by using the new NCI-Aging and Disability measures to survey seniors and people with physical disabilities in 2015. There is a waiting list for additional states to participate in the NCI-Aging and Disability survey in 2016. Additional work on measures is needed to both assess the extent of rebalancing and evaluate the quality of HCBS provided, including the development of uniform or standardized measures to consistently assess the extent of rebalancing and evaluate HCBS quality in a way that allows meaningful comparison by stakeholders.
MLTSS measure development is needed to both assess the extent of rebalancing and evaluate the quality of HCBS provided.
In addition to measuring rebalancing progress, roundtable participants emphasized the importance of also assessing the quality of HCBS, including outcome measures, and beneficiary quality of life. Participants identified a range of measures, including where money is spent, where beneficiaries are being served, and quality of life, and observed that measures should encompass this entire continuum. For example, health plans may be able to report on the number of institutional to community transitions but also need to assess whether a beneficiary’s functional needs have been addressed. Participants pointed out that focusing solely on the number of beneficiaries served in a particular setting, while important, does not provide sufficient information to fully evaluate HCBS quality. Participants also noted that looking at spending alone is insufficient as most home health and nursing facility services are short-term, and it is important to look at where beneficiaries are receiving long-term HCBS. Other measures are needed to identify factors that make institutional to community transitions difficult, the extent to which beneficiaries are able to self-direct their services, and the number of people waiting to access HCBS, even if a state already is spending a high percentage of its LTSS funding in the community. Participants also recommended that common definitions, such as what constitutes a reduction in services, are needed to ensure that measures are applied uniformly. Participants emphasized that measures should not only focus on what is working but also should be designed to reveal barriers to accessing care and should identify actionable items so that system improvements can result.
Performance measures can assess the impact on beneficiaries of delivery systems that integrate LTSS with medical services.
Many states are using MLTSS programs to integrate LTSS with physical health services, and participants discussed the potential value of these efforts in terms of improving care coordination and reducing health disparities though increased utilization of preventive health care services by people with disabilities. MLTSS performance measures could be designed to assess program progress and the impact on beneficiaries in these areas. One participant suggested identifying the key activities that are viewed as resulting in an integrated MLTSS model, such as care coordination, and then measuring the impact of those elements.
A set of core rebalancing measures could facilitate comparisons across states and health plans, although barriers to their development would have to be addressed.
Participants noted that CMS funds Medicaid HCBS under various authorities with different reporting requirements and pointed to the need for a core set of measures for capitated MLTSS programs across states to facilitate federal and state evaluations of programs and beneficiaries’ ability to compare health plans when making enrollment choices. However, participants also observed that there is a lack of national consensus on the need for a core set of measures and what those measures should include. Participants also identified the difficulty in setting a national benchmark standard for core measures, and one participant cautioned that having a core set of measures could risk using the lowest common denominator as the standard to attain, given the current extent of variation in rebalancing across states and beneficiary populations to date. The lack of standardization in IT systems across states to collect data and the lack of consensus on service definitions and coding are additional issues to be addressed.
3. MLTSS performance measures examine beneficiary functioning and need to account for the diversity of the population with LTSS needs and the settings in which services are provided.
Unlike clinical measures, rebalancing measures focus on beneficiary functioning and therefore require a different orientation for health plans.
Roundtable participants agreed that health plans face a learning curve when moving from applying clinical measures related to medical conditions to those that assess beneficiaries’ functioning in the community. MTLSS was described as “very unfamiliar territory” for many health plans, involving new stakeholders, services, and provider types and requiring a different approach to data collection, measurement, and reporting. MCOs may be accustomed to defining their enrollees by utilization of medical services or medical diagnosis and may need to develop their ability to include the role of functioning, environment and supports to promote beneficiary choice, independence and community integration in assessing performance. Participants emphasized the importance of orienting health plans to how to best support beneficiaries with functional tasks in home and community-based settings as opposed to the clinical medical model with which plans may be more familiar when serving relatively healthy populations without LTSS needs. For example, participants pointed out that health plans are accustomed to relying on medical necessary definitions when authorizing services, which often do not translate well to the HCBS context which instead centers on a care plan to address a beneficiary’s functional needs. Participants also suggested that serving beneficiaries who need LTSS also may require changes in how MCOs interact with enrollees, such as offering in-person meetings and in-home assessments, in addition to telephone calls.
Rebalancing measures need to account for the diverse needs and preferences among beneficiaries who rely on LTSS.
Many beneficiaries who need LTSS have complex needs, and the types and extent of needs may vary within and across different subpopulations. This is underscored by the person-centered planning requirements in CMS’s recent HCBS regulations, which focus on whether services are reflective of an individual beneficiary’s needs. For example, seniors with dementia often need services that differ in intensity and duration from people with other types of disabilities. The 2014 NCI- Aging and Disability pilot study revealed that seniors and non-elderly people with disabilities had different responses about how they prefer to spend their day. Consequently, roundtable participants agreed that MLTSS measures must account distinctly for the range of needs and preferences within the overall population of beneficiaries with LTSS needs.
In addition to tracking where services are provided, performance measures also can account for differences in the degree of community integration offered by various settings.
Roundtable participants highlighted the need for measures to capture the variation in home and community-based settings and the degree of integration available to beneficiaries in different settings in the community. For example, beneficiaries can experience different degrees of independence and community access when they receive services in their own apartment as opposed to a group home. Participants agreed that measures should assess not only whether beneficiaries are served in the community but also whether they are in the setting that affords them the fullest extent of community integration and independence, such as measures related to social activity and engagement.
4. Meaningful MLTSS performance measures are based on data that is available, accurate, and transparent to stakeholders.
Health plan data at the individual service level is a key part of assessing rebalancing.
Roundtable participants expressed caution about avoiding the “black box” of managed care and emphasized the need for states to require health plans to collect and provide encounter and utilization data to inform assessments of whether MLTSS programs are meeting their goal of rebalancing. States engaged in MLTSS emphasized the importance of contract provisions that require health plans to provide encounter data by type of service and by level of care. Participants identified a need for states to ensure that health plans are collecting and reporting data relevant to rebalancing, such as the types and amount of services funded and any service reductions during transitions to managed care. Participants emphasized the need to examine data at the individual service level, such as the number of personal care hours authorized, when assessing whether MLTSS programs are meeting their goals of rebalancing and ensuring that services are provided in an amount that is sufficient to meet beneficiary needs.
Data collection systems that are designed to capture information relevant to rebalancing are important to inform MLTSS performance measures.
Roundtable participants pointed out that data collected by states and health plans must be relevant to measures and outcomes related to rebalancing. If health plans are asked to take on new tasks through MLTSS programs, such as care coordination or nursing facility diversion or transition initiatives, then new codes must be used to reflect the services that plans are providing to support beneficiaries in the community. Participants also noted that electronic health records need to incorporate information about LTSS, especially in delivery systems that seek to integrate LTSS with physical and behavioral health services, and that measures must be tested at the health plan level to ensure that plans have the appropriate systems in place and the capacity to capture accurate information. Data systems must be able to capture information that includes beneficiary functioning, socialization, quality of life, and caregiver-related issues, in addition to medical information.
Data is most useful if it is transparent to beneficiaries and other stakeholders.
Roundtable participants underscored that information about health plan performance should be transparent to beneficiaries, in addition to rating plans on issues that are important to beneficiaries, such as rebalancing. Performance measures were described as “report cards” for beneficiaries to use to evaluate health plans and inform their enrollment choices, based on the plan’s performance. Participants also noted that some states do not include any rebalancing measures in their MLTSS programs, with the result that beneficiaries lack this important information when making plan choices. The availability and transparency of data about MLTSS programs at the state level also is important so that stakeholders have access to relevant reliable information to assess whether the program is achieving its intended goals.
5. Clear expectations about what states and health plans are accountable for achieving and enforceable standards are important factors in assessing whether MLTSS promotes rebalancing.
MLTSS performance measures can be a means of holding health plans and states accountable for achieving program goals.
Roundtable participants uniformly agreed that states must monitor and evaluate their MLTSS programs to ensure that public dollars are being spent to achieve the program’s intended goals. Participants noted that states should clearly define the processes and outcomes for which health plans will be held accountable to achieve and use performance measures aimed at assessing those goals. An important related part of these efforts is ensuring that health plans collect and make available encounter and utilization data relevant to MLTSS performance measures.
MLTSS performance measures can inform policymakers responsible for overseeing and funding these programs.
While roundtable participants did not want to focus on rebalancing solely as a source of cost savings, some pointed out that demonstrating that rebalanced LTSS systems provide more efficient services over time can be an important factor in an era of federal and state budget pressures and potential cuts. States are focused on increasing beneficiary access to HCBS as a means of improving beneficiaries’ quality of life and not solely as a cost-saving measure. At the same time, states are using savings from decreased institutional services to fund additional HCBS and serve more beneficiaries in the community. In the absence of measures based on data, states and health plans are left with anecdotes to demonstrate the outcomes produced by care delivery system reforms, which may be less compelling than information about the value and outcomes of MLTSS programs based on data from performance measures.
Conclusion
Although work is needed to further develop MLTSS performance measures, there also is a need to assess rebalancing progress now, to determine whether current MLTSS programs are achieving their intended goals. Challenges in assessing rebalancing in MLTSS programs include the diversity of the population receiving LTSS; how to define what is being measured; different reporting requirements associated with different authorities authorizing MLTSS and HCBS; determining the services for which health plans are accountable; health plans’ learning curve in moving from a medical model to meeting beneficiary’s functional needs and supporting beneficiary choice, independence and community integration; ensuring the availability of data about services provided by health plans; and the speed at which capitated MLTSS programs are implemented. Revised Medicaid managed care regulations expected to be issued by CMS also may inform efforts to assess MLTSS programs. Continued focus in this area by federal and state policymakers and other stakeholders is important to evaluating the success of MLTSS programs in promoting LTSS rebalancing.
The Kaiser Commission on Medicaid and the Uninsured acknowledges Judy Feder of Georgetown University and Molly O’Malley Watts of Watts Health Policy Consulting for moderating the roundtable discussion and thanks the participants for sharing their time and expertise.
In his latest column for The Wall Street Journal‘s Think Tank, Drew Altman explores whether Secretary Burwell’s announcement this week about Medicare’s payment reform initiative is another sign that the public sector is becoming the engine driving payment and delivery reform.
All previous columns by Drew Altman are available online.
New Kaiser Survey Finds Eleven Million Newly Insured Adults As of Mid-December, But Nearly Half Who Remained Uninsured One Year After Full Implementation of the Affordable Care Act Were Eligible for Medicaid or Marketplace Tax Credits
Many Of The Remaining Uninsured Say They Didn’t Seek Coverage or Considered It Too Expensive, While Others Were Told (Or Believed) They Were Not Eligible
About 11 million adults had become newly insured under the Affordable Care Act by mid-December 2014, according to a new national survey of more than 10,000 adults by the Kaiser Family Foundation. Nearly half of the approximately 30 million adults who remained uninsured were eligible for assistance under the law, based on their survey responses, but many reported that they had not sought coverage. And among those who did seek coverage, many believed they had been found ineligible or considered the coverage offered too expensive.
The new survey report, Adults who Remained Uninsured at the End of 2014, is the first in a series of analyses that will draw upon the findings of the comprehensive Kaiser survey, which focuses on low- and moderate-income adults and was conducted between September 2 and December 15, 2014. The Foundation conducted a similar survey in 2013, before full the implementation of the ACA health insurance marketplaces and the expansion of Medicaid in many states.
Based on their answers to the new survey, 48 percent of the roughly 30 million adults remaining uninsured at the end of 2014 were eligible for assistance under the law, including 30 percent who were eligible for marketplace tax credits and 18 percent who were eligible for Medicaid. And yet they did not get coverage. Among the key reasons why, according to this eligible-but-uninsured group:
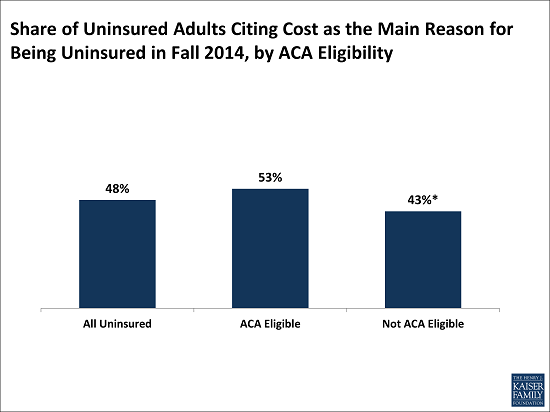
Cost, or the perception of it, was a big barrier. Fifty-three percent of the uninsured who are eligible for help under the ACA perceived the cost of health insurance in general as prohibitive, citing cost as the main reason they don’t have coverage.
Many did not explore the new coverage options and financial assistance available under the ACA, perhaps reflecting a lack of awareness or perceptions about cost. A majority (59%) of the eligible but still uninsured say that they did not try to get health insurance from either their state marketplace, healthcare.gov, or their state Medicaid agency in 2014.
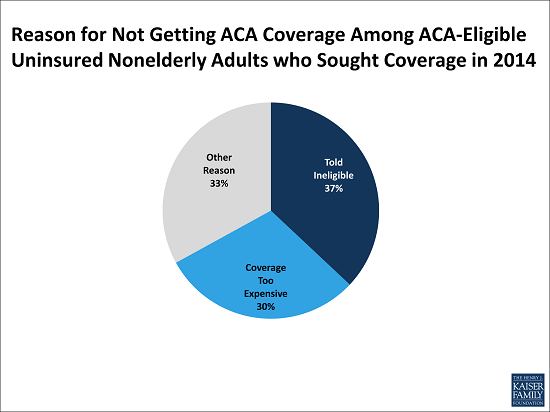
Confusion about eligibility played a role. Among the uninsured who were eligible, and who sought coverage, 37 percent say they were told they were ineligible for it. While it is possible that they were ineligible at the time they applied, it is likely that these people received incorrect information or misinterpreted information they were given.
Although much attention was paid to technical difficulties during the initial 2014 ACA open enrollment period, website glitches and other logistical issues in applying for coverage do not appear to be a leading reason why people went without insurance in 2014. Only 20 percent of the remaining uninsured overall said they did not have coverage because they had an application still pending (12%) or because they didn’t finish the application (8%).
“The findings show how important it is to come up with more effective strategies, in person, online and elsewhere, for educating people about their eligibility for coverage and financial assistance under the law,” said Rachel Garfield, a senior researcher for the Foundation who is leading the survey project and is the lead author of the new report.
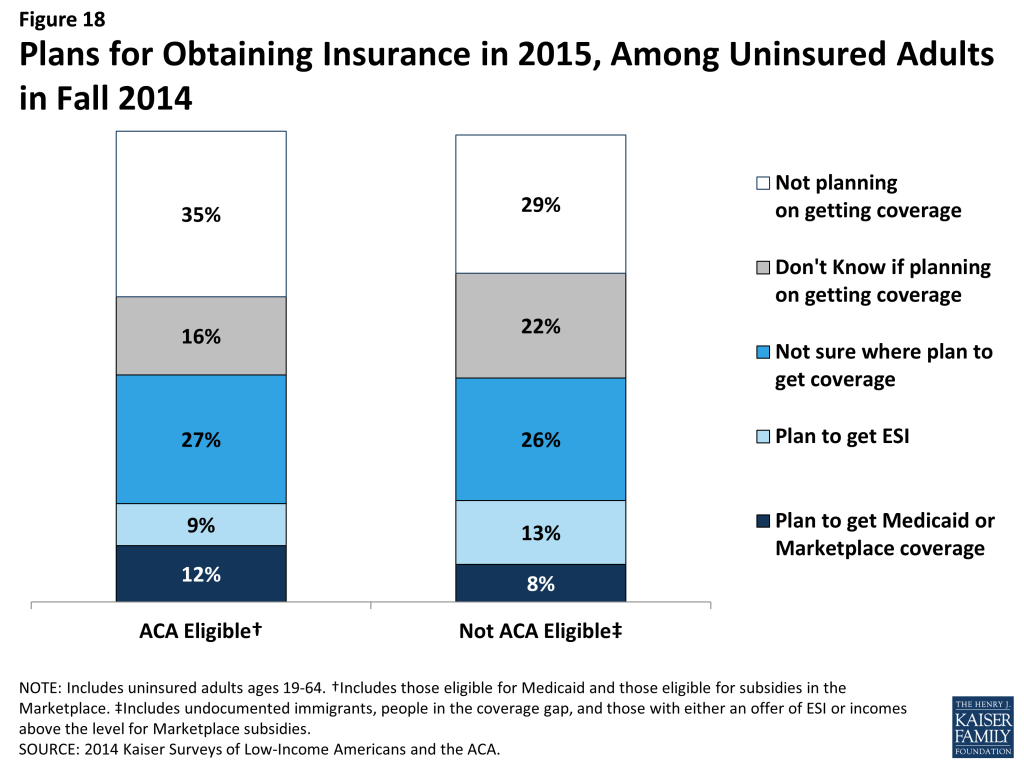
Of the uninsured adults who are eligible for help under the ACA, about half indicate that they plan to get health insurance from some source in 2015. The open enrollment period for coverage in the ACA marketplaces closes on February 15, 2015 for most people. Those eligible can enroll in Medicaid throughout the year.
The survey also finds that about half of the roughly 30 million remaining uninsured adults are ineligible for any assistance under the law. Many are low-income, including the nearly 4 million adults in the “coverage gap” — those living in states that have not expanded Medicaid who earn too much to qualify for their state’s current Medicaid program but not enough to get ACA marketplace subsidies. Also ineligible for assistance under the law are millions of uninsured who have an offer of coverage through their employer that they do not take up, are undocumented immigrants, or have incomes above 400 percent of the poverty level and do not qualify for subsidies to make coverage more affordable.
“No matter how well the ACA works, there are still substantial numbers of uninsured people with no affordable option for health coverage, ” said Diane Rowland, Executive Vice President of the Foundation and Executive Director of the Foundation’s Kaiser Commission on Medicaid and the Uninsured.
The full survey report, including additional detail on the survey methods, is available online at kff.org.
In January 2014, the major coverage provisions of the Affordable Care Act (ACA)—including the expansion of Medicaid eligibility and the availability of subsidized coverage through Health Insurance Marketplaces— went into effect. As the first year of new coverage under the ACA comes to a close and the end of the second open enrollment period nears, there is great interest in understanding why some people continue to lack coverage and in reaching out to the eligible uninsured. This report, based on the 2014 Kaiser Survey of Low-Income Americans and the ACA, profiles the nonelderly adult population that remained uninsured as of Fall 2014. The survey of 10,502 non-elderly adults was fielded between September 2 and December 15, 2014, with the majority of interviews (70%) conducted prior to November 15, 2014 (the start of open enrollment for 2015 Marketplace coverage; Medicaid enrollment is open throughout the year). Additional detail on the survey methods is available in the methods appendix available on line.While millions have enrolled in coverage under the ACA, many remain uninsured. Though much attention was paid to difficulties with the application and enrollment process during the 2014 open enrollment period, logistical issues in applying for coverage do not appear to be a leading reason why people went without insurance in 2014. Rather, lack of awareness of new coverage options and financial assistance appear to be a major barrier. When asked in their own words, uninsured adults were most likely to name cost as the main reason they don’t have coverage, and this pattern held even among those who appear to be currently eligible for low-cost or free coverage under the ACA. In addition, most uninsured adults (63%) say that they did not try to get health insurance from either their state Marketplace, healthcare.gov, or their state Medicaid agency in 2014. Some who did not seek coverage were ineligible for assistance, but the pattern of the majority not seeking coverage holds even among those who are now likely eligible for help. Thus, despite the availability of subsidies for Marketplace coverage and comprehensive Medicaid coverage, misperceptions about cost or lack of awareness are barriers to reaching some eligible uninsured.Further, gaps in eligibility or confusion about eligibility are evident among uninsured adults. Among those who did try to get ACA coverage, the most common reason people gave for not obtaining that coverage was that they were told they were ineligible (41%). Notably, many people who appear to be eligible for some type of assistance say someone told them they were ineligible. While it is possible that they were ineligible at the time they applied, it is likely that these people received incorrect information or misinterpreted information they were given. For people who may be eligible but were told they were not, more accurate or easily understood information about the availability of coverage is particularly important. In addition, some who were told they were ineligible encountered difficulty with the application process or paperwork.Lastly, costs—or perceptions of costs— continue to pose a barrier to coverage according to the survey. Nearly three in ten (29%) uninsured adults who applied for ACA coverage said they did not obtain that coverage because they believed it was too expensive. Many who cited cost barriers were ineligible for financial assistance under the ACA and would have faced the full cost of Marketplace coverage. However, more than four in ten who cited cost as a reason for not enrolling in coverage were eligible for financial assistance. Many appear to be eligible for tax subsidies, but they may have still found Marketplace coverage to be unaffordable even with subsidies.Those who remained uninsured in Fall 2014 still have substantial health needs, as they were more likely than those who took up coverage to rate their health as fair or poor but less likely to have a diagnosed condition or take a prescription on a regular basis. Still, few uninsured indicated plans to seek ACA coverage in 2015. Even among those likely eligible, only about half of uninsured adults indicate that they plan to get health insurance from any source in 2015, and few who do plan to get coverage identified Medicaid or Marketplace coverage as their goal.The survey results underscore the importance of reaching the eligible uninsured with information about their eligibility for coverage and the availability of affordable coverage, both comprehensive Medicaid coverage and subsidized marketplace coverage. While Marketplace enrollment closes on February 15, 2015 for most people, Medicaid coverage is available throughout the year. Thus, ongoing efforts to let the eligible uninsured know about the availability of Medicaid coverage will remain important.
Issue Brief
Introduction
In January 2014, the major coverage provisions of the Affordable Care Act (ACA) went into effect. These provisions include the expansion of Medicaid in states that opted to expand their programs and the creation of Health Insurance Marketplaces where people can purchase coverage on their own. Medicaid coverage is available to most adults in expansion states with incomes at or below 138% of poverty (about $33,000 for a family of four in 2014), and premium tax credits for coverage purchased in the Marketplace are available for most people with incomes up to 400% of poverty (between $23,850 and $95,400 for a family of four in 2014). Together, these provisions have the promise of substantially improving the availability and affordability of insurance coverage in the United States. While many have already enrolled in coverage and renewed their coverage for 2015, open enrollment for 2015 Marketplace coverage continues until February 15, 2015, and Medicaid coverage is available to eligible individuals throughout the year.
To help understand the early impact of the ACA, the Kaiser Family Foundation is conducting a series of comprehensive surveys of the low and moderate income population. The 2013 Kaiser Survey of Low-Income Americans and the ACA, fielded prior to the start of open enrollment for 2014 ACA coverage, provided a baseline snapshot of health insurance coverage, health care use and barriers to care, and financial security among insured and uninsured adults at the starting line of ACA implementation.1 In Fall 2014, we conducted a second wave of the Kaiser Survey of Low-Income Americans and the ACA to understand how these factors have changed under the first year of the law’s main coverage provisions. The survey of 10,502 nonelderly adults was fielded between September 2 and December 15, 2014, with the majority of interviews (70%) conducted prior to November 15, 2014 (the start of open enrollment for 2015 Marketplace coverage; Medicaid enrollment is open throughout the year). Additional detail on the survey methods is available in the methods appendix available on line.
While millions have enrolled in coverage under the ACA, many remain uninsured. Based on the survey findings, approximately 11 million nonelderly adults were newly insured, meaning they reported that they obtained health coverage in 2014 and were uninsured before that coverage started. However, a large share, equaling about 30 million people, reported that they were uninsured as of the date of the interview. Some of these people are ineligible for ACA coverage, either because of their immigration status or because their state did not expand Medicaid. Others may be eligible but either do not know of the new coverage options or have had difficulty navigating the enrollment process. Still others may have opted not to take up coverage for a variety of reasons, such as affordability or personal preferences.
This report, based on the 2014 Kaiser Survey of Low-Income Americans and the ACA, profiles the adult population that remained uninsured as of Fall 2014. It describes the characteristics of this population, examines why they lack insurance coverage and reasons for not enrolling in ACA coverage, and provides information on the coverage options available to the remaining uninsured and their plans for obtaining coverage in 2015. Future reports will provide information about those who gained coverage in 2014 and their experience with the health care system as well as highlight the experiences of the low-income population in California and Missouri.
Understanding Who Remains Uninsured
In many ways, the population that lacked insurance coverage in Fall 2014 resembled the population that has historically lacked coverage as well as the population that gained coverage in 2014. For example, they are similar with respect to age, work status, and income. As in the past, most uninsured adults work but lack access to coverage through a job. While most uninsured adults have lacked coverage for a long time, some have lost coverage since January 2014, an indication that coverage transitions still pose a challenge. Notably, the remaining uninsured population reports poorer health status than the group that gained coverage.
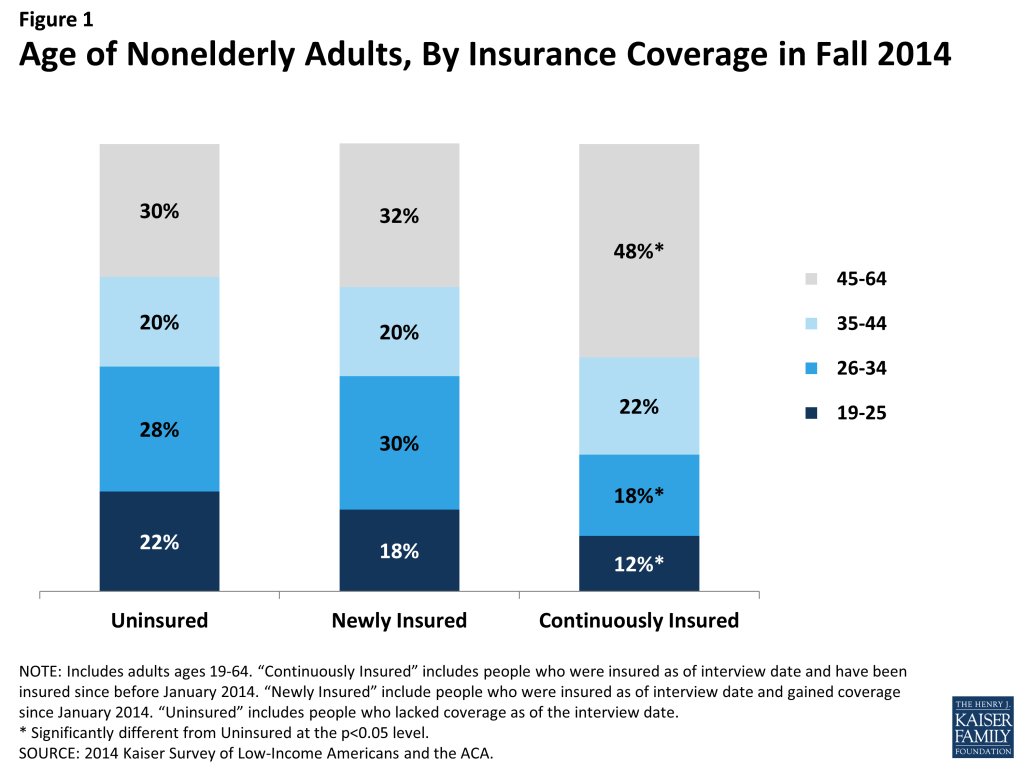
The remaining uninsured are no more likely to be “young invincibles” than those who gained coverage in 2014. Adults who were uninsured late in 2014 were of similar age distribution as adults who gained coverage in 2014. However, both the uninsured and the newly insured populations were younger than the group of adults who were continuously insured. About a fifth of the uninsured (22%) and newly insured (18%) population were young adults, ages 19 through 25, compared to just 12 percent of the continuously insured (Figure 1). Half of the uninsured and about half of the newly insured were under age 35, compared to just 30 percent of the continuously insured. This pattern reflects the fact that those who lacked coverage prior to 2014 were more likely to be young, since younger adults have looser ties to employment and lower incomes.
Figure 1: Age of Nonelderly Adults, By Insurance Coverage in Fall 2014
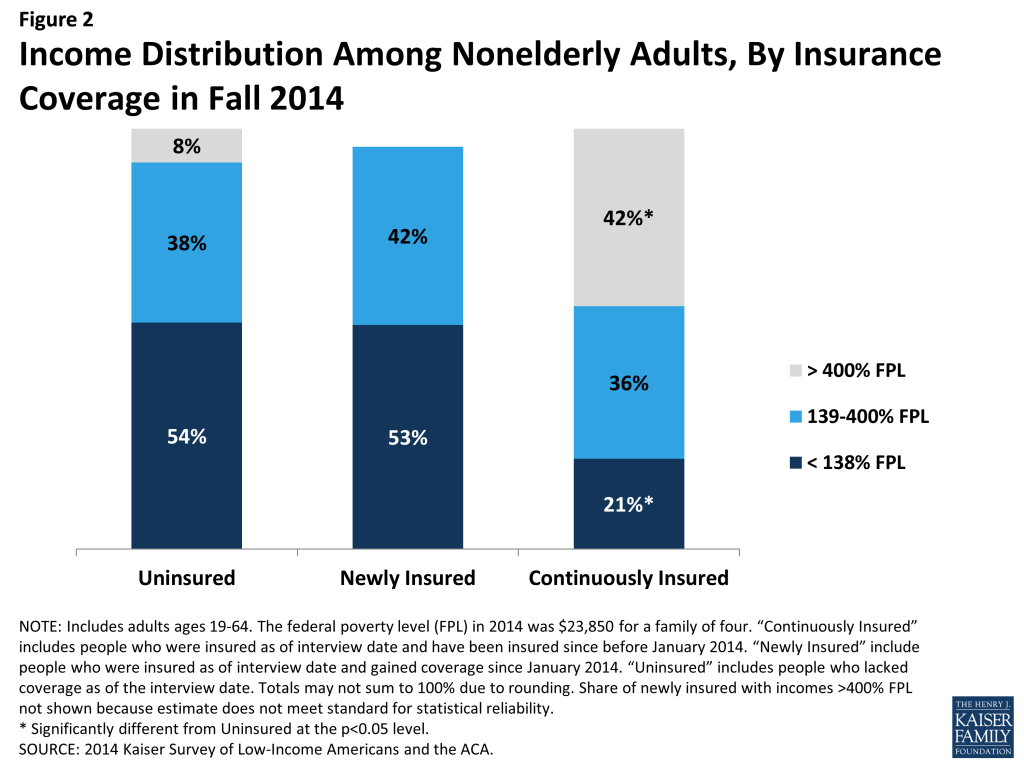
More than half of the remaining uninsured population has family income at or below 138% of poverty, the income range for the Medicaid expansion. More than half of uninsured adults (54%) have family incomes at or below 138% of poverty, or $32,913 for a family of four (Figure 2). Nearly one in four (38%) has family incomes in the range for tax credits (139 to 400% of poverty). This distribution is similar to the newly-insured population. In contrast, the continuously insured population is significantly less likely than either the uninsured or newly insured to be low-income and significantly more likely to be higher income (greater than 400% of poverty). This pattern reflects the longstanding association between having low income and lacking health coverage. Provisions in the ACA aim to make coverage more affordable for low and middle income families.
Figure 2: Income Distribution Among Nonelderly Adults, By Insurance Coverage in Fall 2014
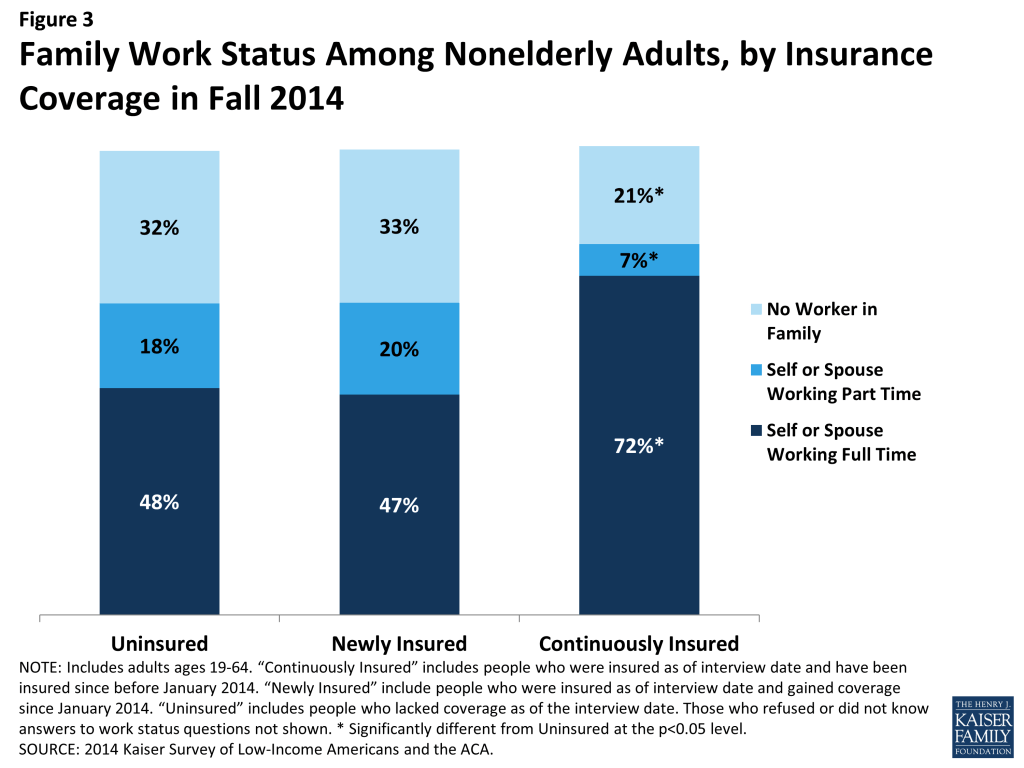
A majority of the remaining uninsured are in a family with at least one worker. Two-thirds of uninsured adults are in a family in which either they or their spouse is working (Figure 3). Nearly half (48%) are in a family with a full-time worker. This distribution is similar to that among the newly-insured population; however, those who have been continuously insured since before 2014 are significantly more likely to be in a family with a full-time or part-time worker. This pattern reflects the historical ties between work and health insurance, since most people who had coverage before the ACA obtained that coverage through a job.
Figure 3: Family Work Status Among Nonelderly Adults, by Insurance Coverage in Fall 2014
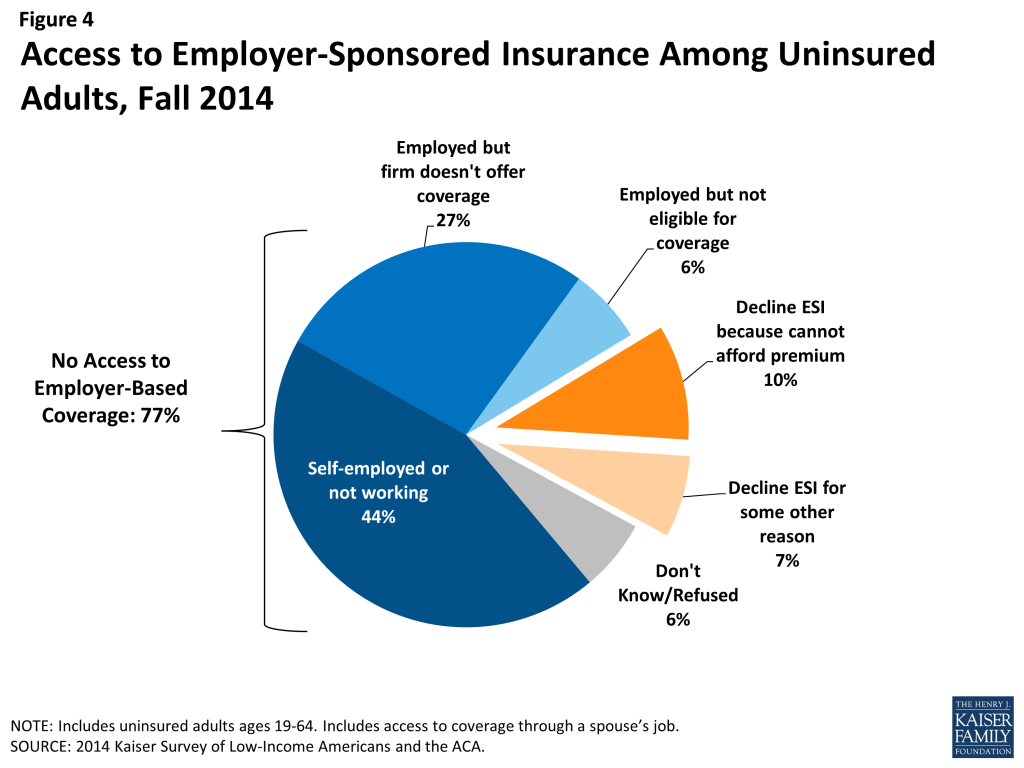
Access to employer-based coverage is limited among uninsured adults. Very few uninsured adults have access to coverage through their or a spouse’s job, either because they are self-employed or not in a working family (44%), or because their employer does not offer coverage (27%) or coverage for which they are eligible (6%) (Figure 4). Some uninsured adults do have access to coverage through their or a spouse’s job, but most who do report that this coverage in unaffordable to them. Many uninsured adults work for an employer who will not be required to offer coverage under the ACA because they have fewer than 50 workers. With new coverage provisions in place as of 2014, there were more options for health insurance outside employment, particularly for people in states that expanded Medicaid.
Figure 4: Access to Employer-Sponsored Insurance Among Uninsured Adults, Fall 2014
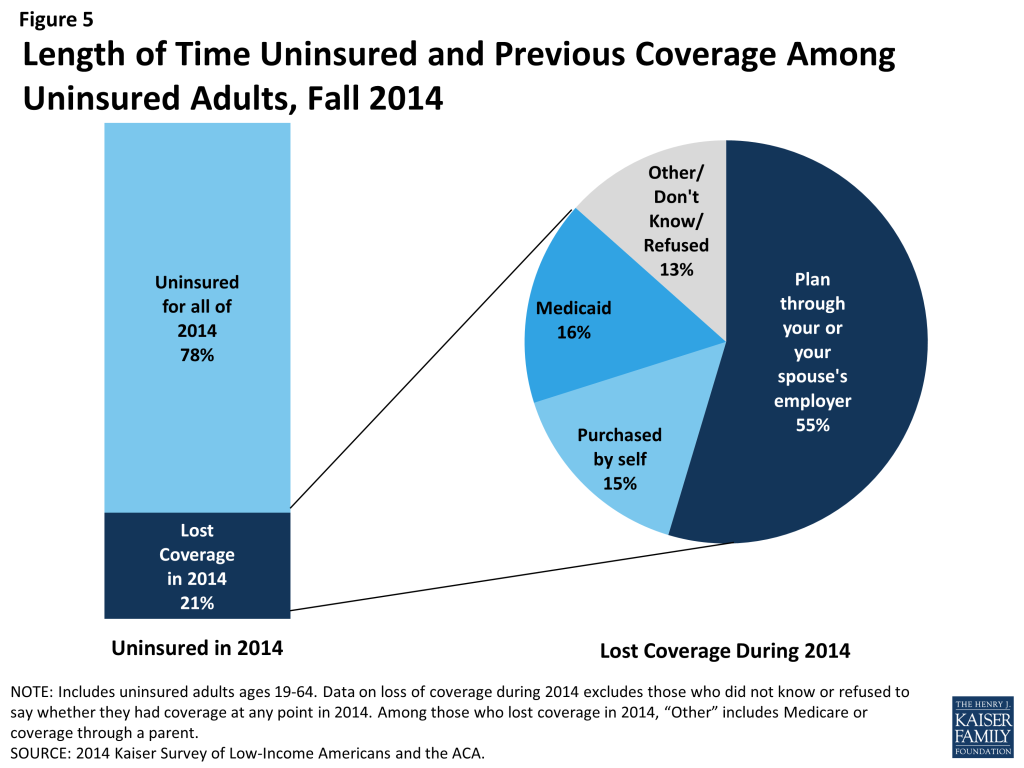
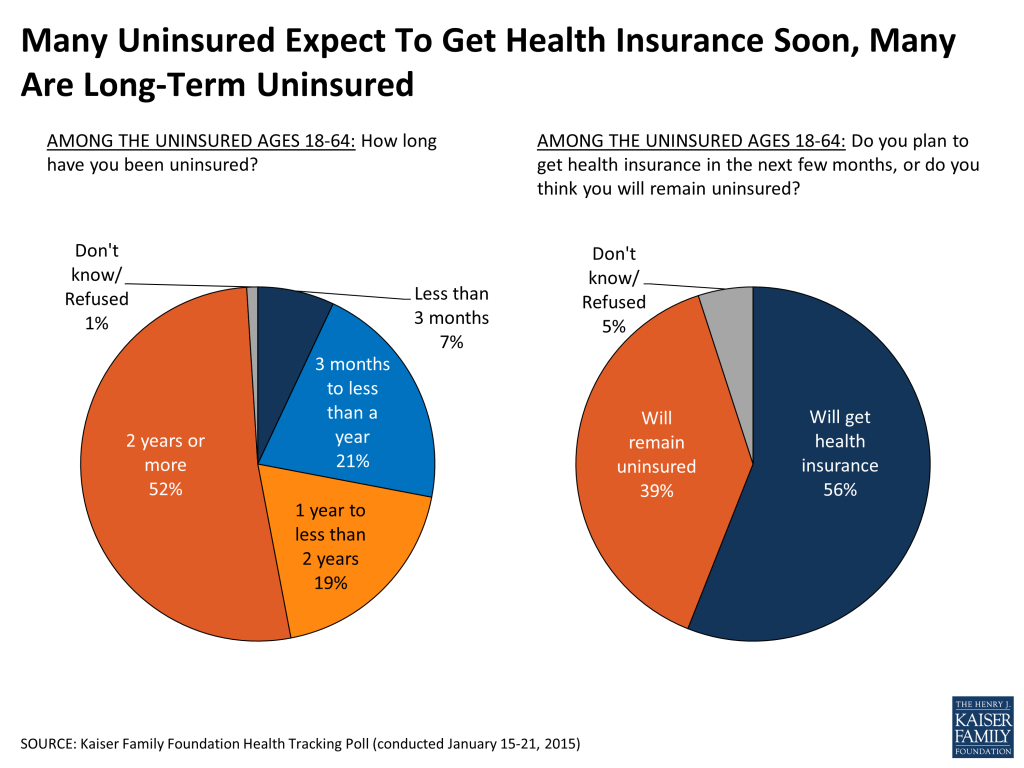
Coverage transitions remain a challenge to continuous coverage. As in the past, lack of coverage remains a long-term issue for most: nearly eight in ten uninsured adults report that they had lacked coverage for all of 2014. However, about one in five actually had coverage at some point in 2014 but lost that coverage (Figure 5). This pattern is similar to that seen in the past: millions of people gain, lose, or change their health coverage throughout the year, and for some, these transitions lead to spells of uninsurance. As in the past, most who lost coverage in 2014 indicated that they lost employer-based coverage. One in six who lost coverage in 2014 reported that they lost Medicaid, and about the same share reported that they lost non-group coverage. As adopted, the ACA envisioned a continuum of coverage with various coverage options available as people’s circumstances changed (such as job loss or income change). However, coverage transitions remain a challenge for some.
Figure 5: Length of Time Uninsured and Previous Coverage Among Uninsured Adults, Fall 2014
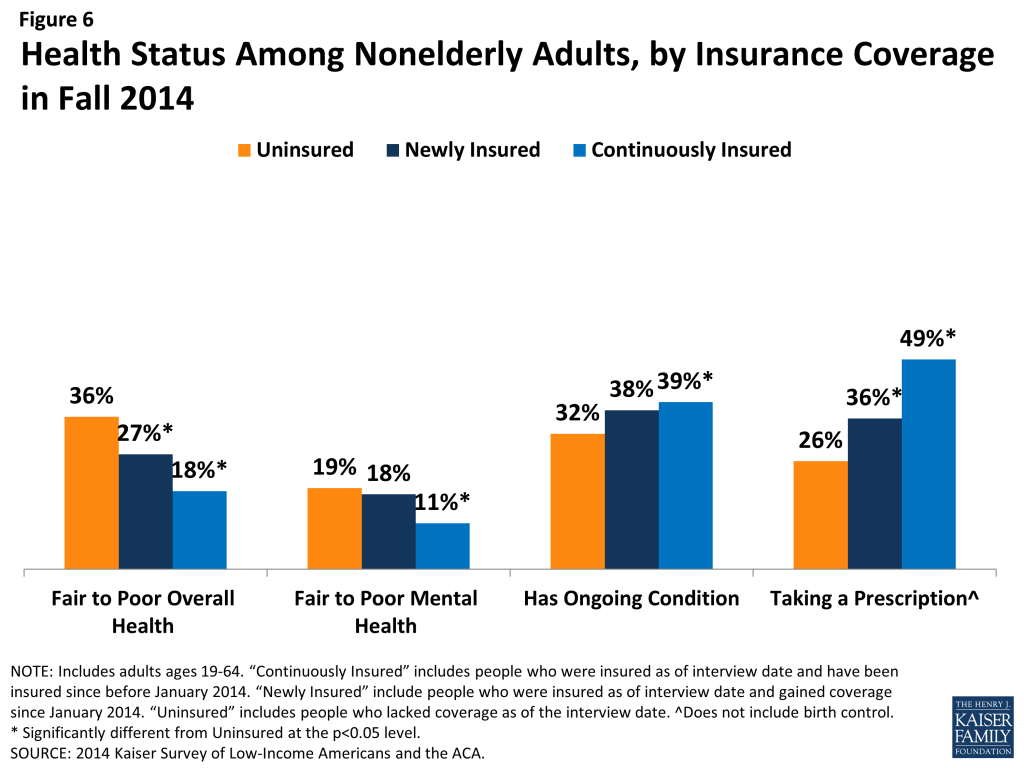
Uninsured adults are more likely than those with coverage to say their health is fair or poor but are less likely to have a diagnosed medical condition. More than a third of uninsured adults (36%) rate their overall health as fair or poor, a higher share than the newly-insured or continuously insured (Figure 6). Nearly a fifth (19%) report their mental health is fair or poor, a share about equal to the newly insured but higher than the continuously insured. These findings refute the idea that those who have coverage are more likely to be in poor health or feel they need medical services. However, those who have coverage are more likely than the remaining uninsured to report being under care for a chronic condition. Adults who are continuously insured are more likely than the uninsured to say that they have an ongoing medical condition that requires regular care. Similarly, both the newly insured and continuously insured are more likely than the uninsured to say they take a prescription on a regular basis. These patterns may reflect the fact that uninsured individuals are more likely than insured to have undiagnosed illnesses,2 and people with insurance coverage are more likely to receive regular and specialty care.3
Figure 6: Health Status Among Nonelderly Adults, by Insurance Coverage in Fall 2014
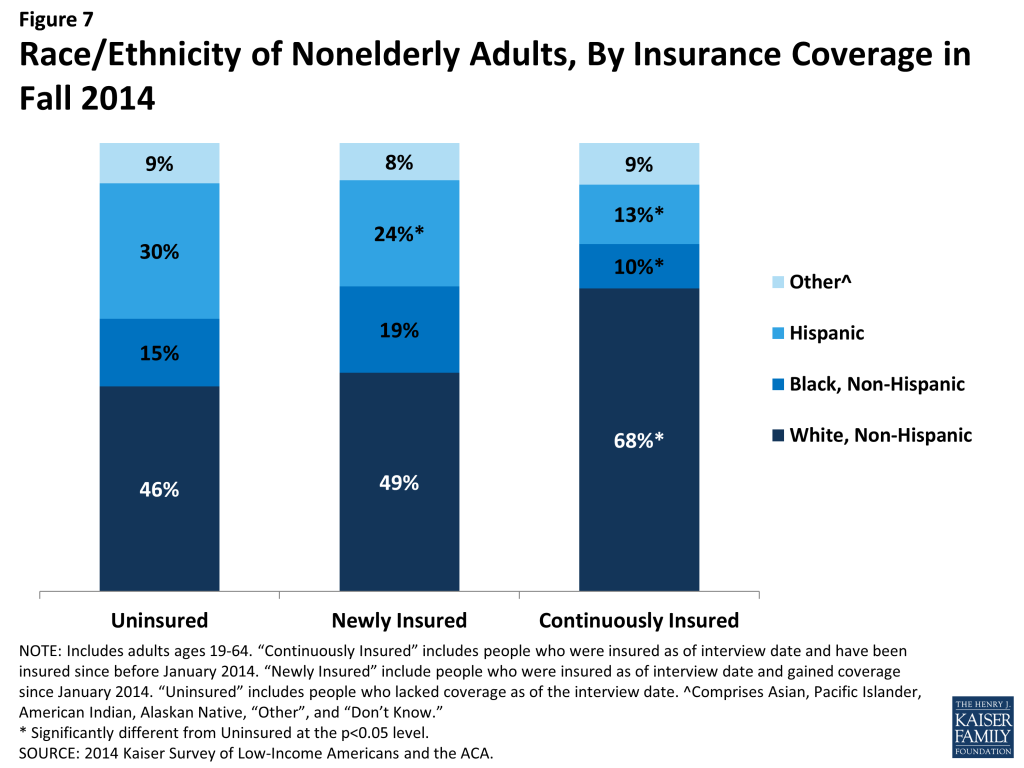
Hispanics are disproportionately represented among the remaining uninsured population. Reflecting historical patterns of the uninsured being more likely to be people of color than the insured, the remaining uninsured and the newly insured are both less likely than the continuously insured to be White, Non-Hispanic (Figure 7). However, the remaining uninsured population is more likely to be Hispanic than either the newly insured or continuously insured population: 30% of the remaining uninsured population is Hispanic, a share significantly higher than among the newly insured or continuously insured. This pattern likely reflects a combination of factors, including language barriers, immigration barriers, and work status.
Figure 7: Race/Ethnicity of Nonelderly Adults, By Insurance Coverage in Fall 2014
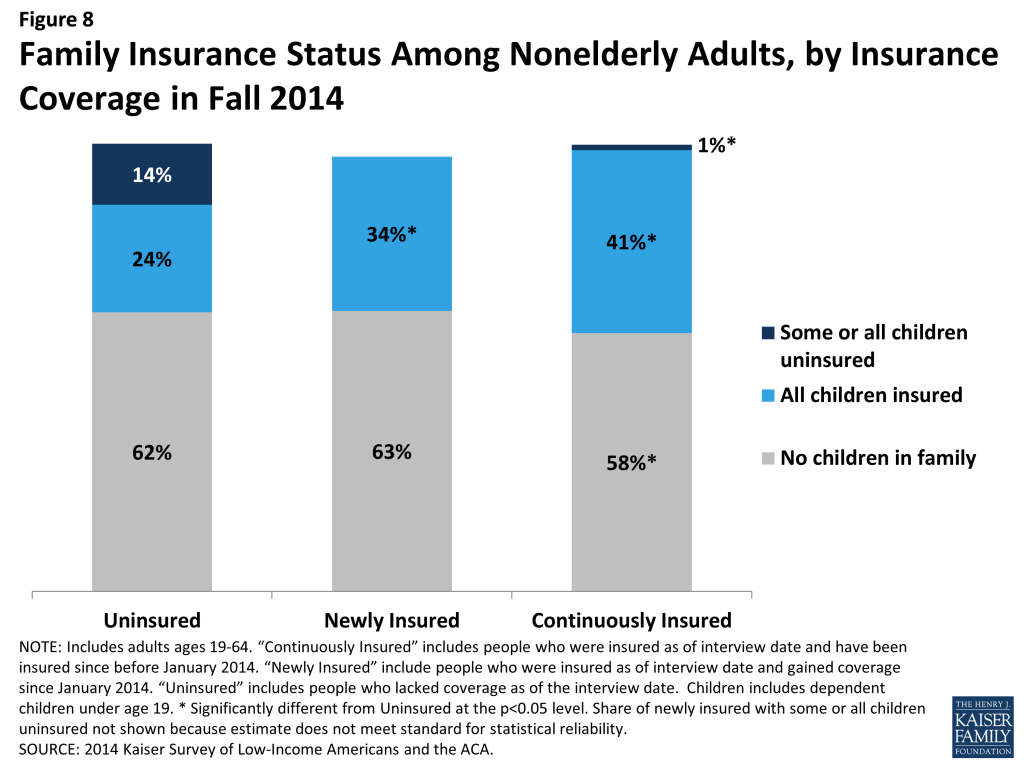
Adults who remain uninsured are more likely than those with coverage to have uninsured children. The majority of uninsured children are eligible for coverage under the ACA: Medicaid and the Children’s Health Insurance Program (CHIP) are available to most children in low-income families, and children may be covered along with their parents in Marketplace coverage. Research has found that parent coverage in public programs is associated with higher enrollment of eligible children.4 Coverage patterns in 2014 support this finding: While uninsured adults are as likely as the newly insured to be parents, they are much more likely to have a child who lacks insurance coverage than the newly insured (Figure 8). Among continuously insured adults, a smaller share are parents, but among those who do have children nearly all have children with insurance coverage.
Figure 8: Family Insurance Status Among Nonelderly Adults, by Insurance Coverage in Fall 2014
Connecting the Eligible Uninsured to Coverage
Though much attention was paid to the difficulties with the application and enrollment process during the 2014 open enrollment period, logistical issues in applying for coverage do not appear to be a leading reason why people went without insurance in 2014. Rather, lack of awareness of new coverage options and financial assistance appear to be a major barrier. In addition, gaps in eligibility or confusion about eligibility are evident among the remaining uninsured. As of Fall 2014, uninsured adults were largely uncertain about whether they will seek coverage in 2015 or where they will get it, and only a small share of those eligible say they plan to seek ACA coverage.
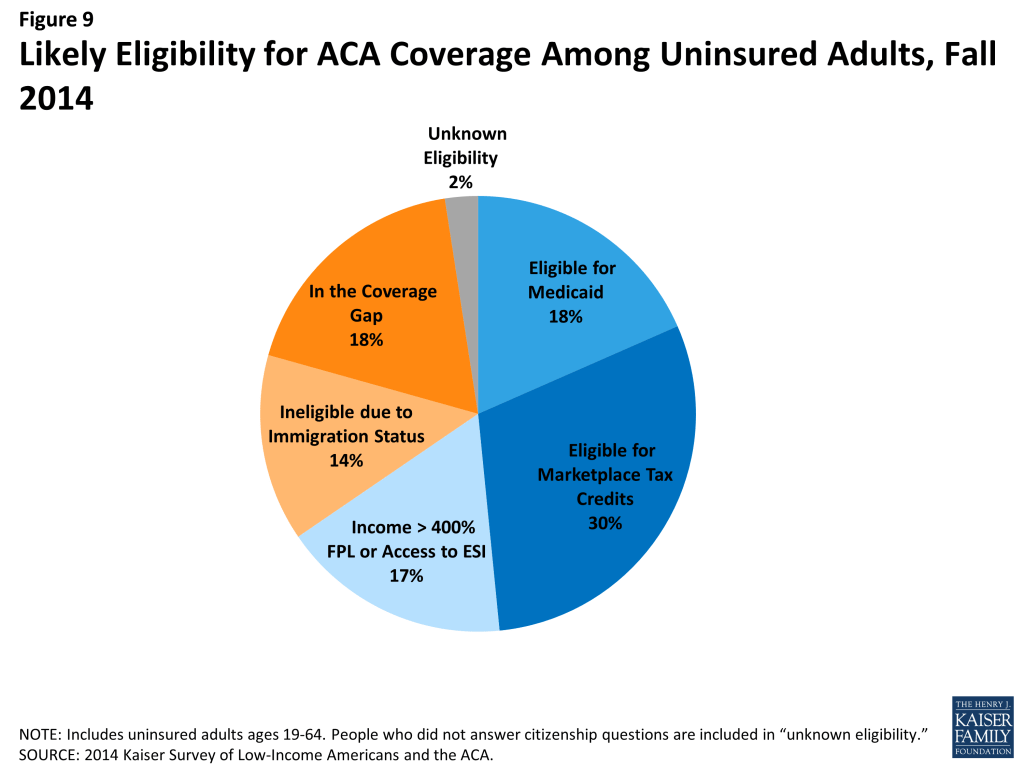
About half of adults who remained uninsured at the end of 2014 are likely eligible for assistance under the ACA. Based on family income, state of residence, citizenship status, parent status, and access to employer coverage, analysis indicates that 48% of uninsured adults may be eligible for Medicaid coverage (18%) or premium tax credits to purchase Marketplace coverage (30%) (Figure 9). Still, many adults are likely ineligible based on their immigration status (14%) or because they live in a state that has not expanded Medicaid and fall into the “coverage gap” (18%). The remainder either has incomes above the range for premium tax credits (but could still purchase unsubsidized coverage through the Marketplace) or has access to employer-based coverage.
Figure 9: Likely Eligibility for ACA Coverage Among Uninsured Adults, Fall 2014
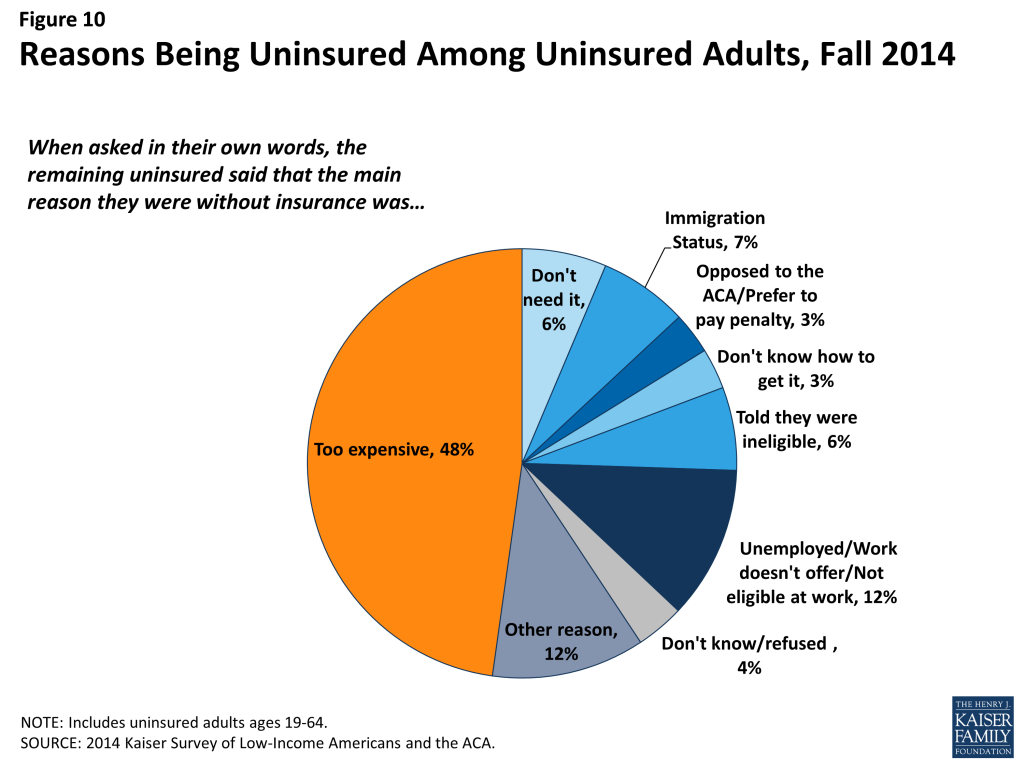
Cost remains a major barrier to coverage. While the ACA aimed to make coverage for affordable, for many—particularly those in non-expansion states—the cost of coverage still poses a problem. The main reason that adults say they lack coverage is cost, with nearly half (48%) of the uninsured saying that they are uninsured because coverage is too expensive (Figure 10). Many also cite limitations on eligibility for coverage, such as immigration status (7%) or being told they are ineligible (6%). A very small share (3%) says they are uninsured because they are either opposed to the ACA or prefer to pay the penalty. Notably, compared to the uninsured before the ACA, uninsured adults in Fall 2014 were less likely to name job-related barriers as a reason for lacking coverage: 12% of uninsured adults named a job-related reason for lacking coverage in 2014, compared to 32% in 2013 (data not shown).
Figure 10: Reasons Being Uninsured Among Uninsured Adults, Fall 2014
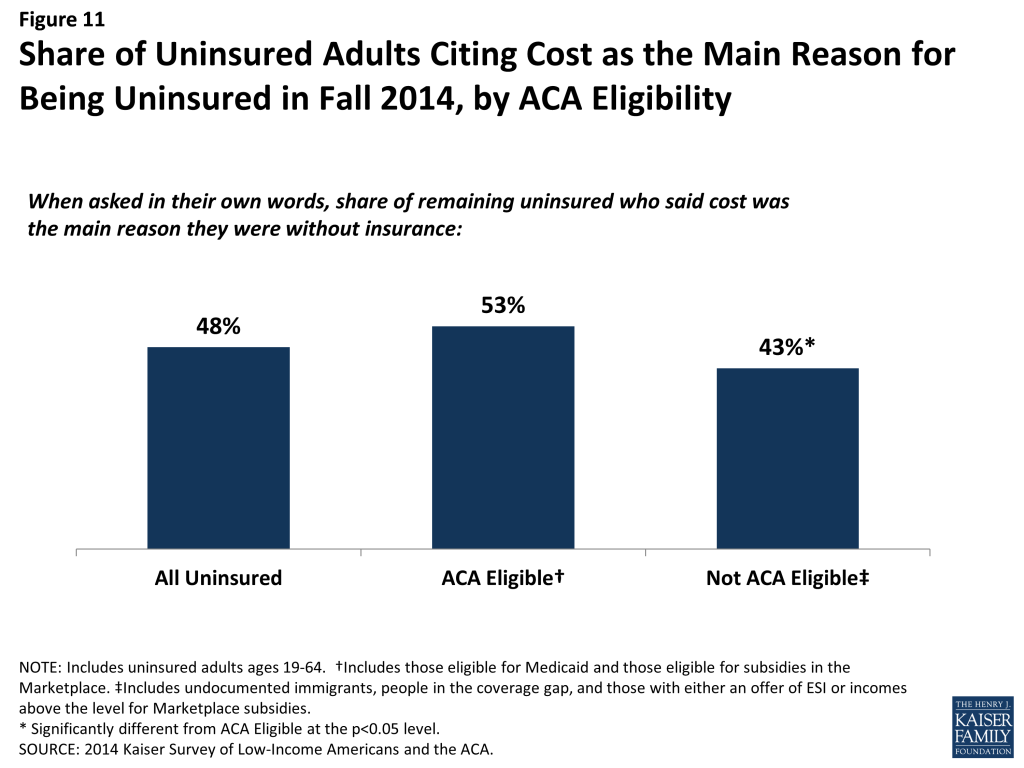
Despite the availability of low-cost or zero premium coverage, a majority of eligible adults still perceive insurance to be too expensive. When asked why they lacked insurance coverage, more than half of adults who appear to be eligible for assistance volunteered that coverage was too expensive (Figure 11). Under the ACA, most of these individuals are eligible for either free or subsidized (through Medicaid or Marketplace subsidies) coverage. Most who cited cost as a reason for not having coverage did not seek ACA coverage (discussed in more detail below), indicating that the availability of financial assistance to offset the cost of coverage is not getting through to them. A smaller share of people who are not eligible for help under the ACA cited cost as a reason for being uninsured; people in this group were more likely to cite other reasons as the main reason for being uninsured, such as ineligibility due to immigration status.
Figure 11: Share of Uninsured Adults Citing Cost as the Main Reason for Being Uninsured in Fall 2014, by ACA Eligibility
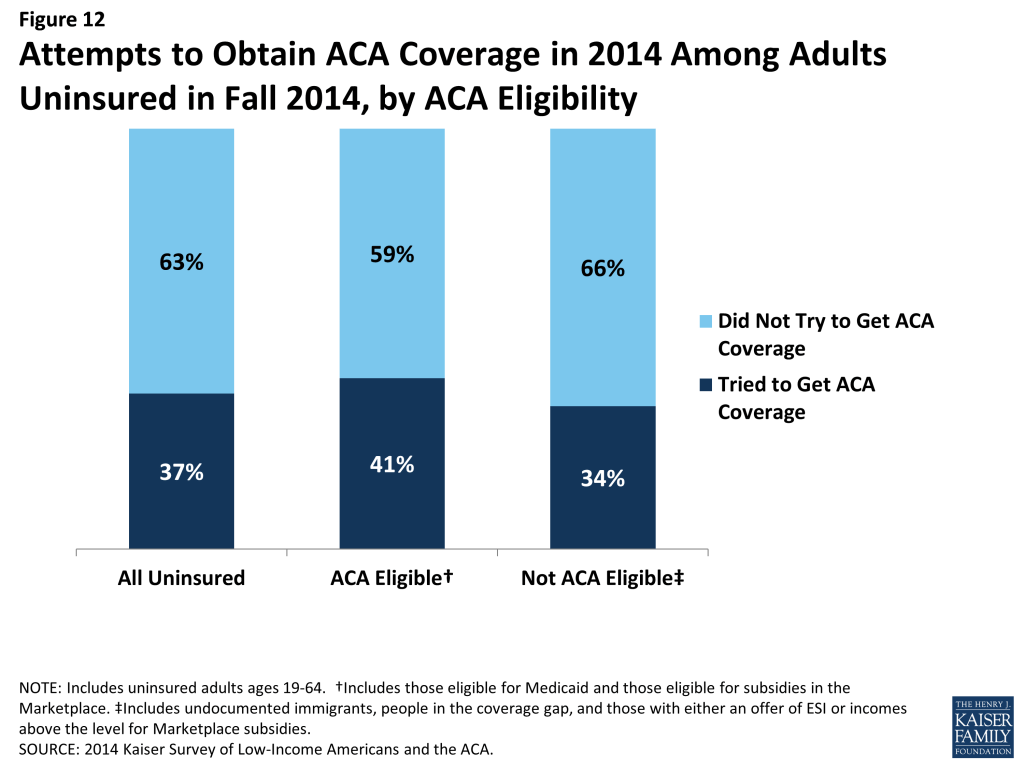
Most adults who were uninsured in Fall 2014 had not tried to get ACA coverage. Nearly two-thirds (63%) of uninsured adults did not try to get coverage from either their state Medicaid program, their state’s health care Marketplace or Healthcare.gov (Figure 12). This share does not vary significantly by whether the adult appears to be eligible for financial help through Medicaid or the Marketplace.
Figure 12: Attempts to Obtain ACA Coverage in 2014 Among Adults Uninsured in Fall 2014, by ACA Eligibility
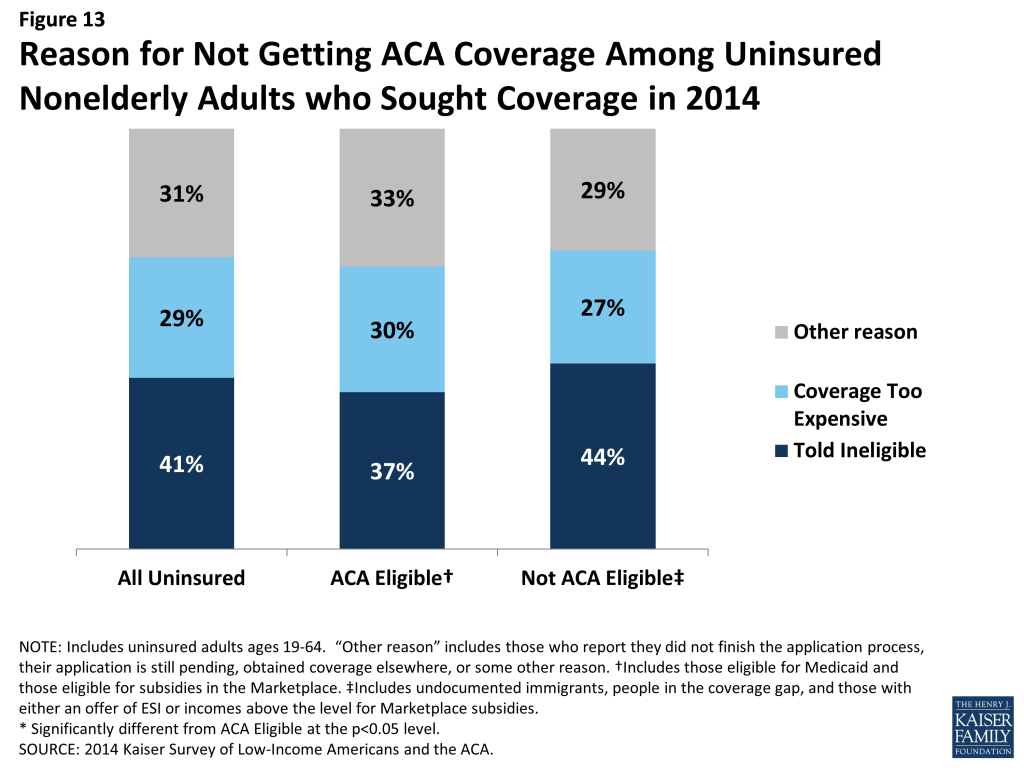
Gaps in eligibility or confusion about eligibility are evident among the uninsured who sought ACA coverage. Among those who did try to get ACA coverage, the most common reason people gave for not having ACA coverage was that they were told they were ineligible (41%) (Figure 13). This pattern holds among those who appear eligible for financial help under the ACA and those who do not. Of particular note is that many (37%) people who say they sought ACA coverage in 2014 and appear to be eligible for some type of assistance as of the time of the survey say they were told they were ineligible when they applied for ACA coverage. It is possible that these people were ineligible at the time they applied and have subsequently become eligible. However, this situation is unlikely in expansion states, which provide ACA options across the income spectrum. These individuals may have been told they were ineligible for a certain type of ACA coverage and not another, or they may have received misinformation or misinterpreted information. It is not surprising that many (44%) who sought coverage but appear to be ineligible for Marketplace or Medicaid coverage as of the time of the survey also say they were told they were ineligible when they applied. People who appear ineligible also cited other reasons for not having coverage, including cost (since they would have faced the full cost of coverage), having a pending application (and thus not yet being told they are ineligible), finding other coverage (that they subsequently lost), or never completing the application process.
Figure 13: Reason for Not Getting ACA Coverage Among Uninsured Nonelderly Adults who Sought Coverage in 2014
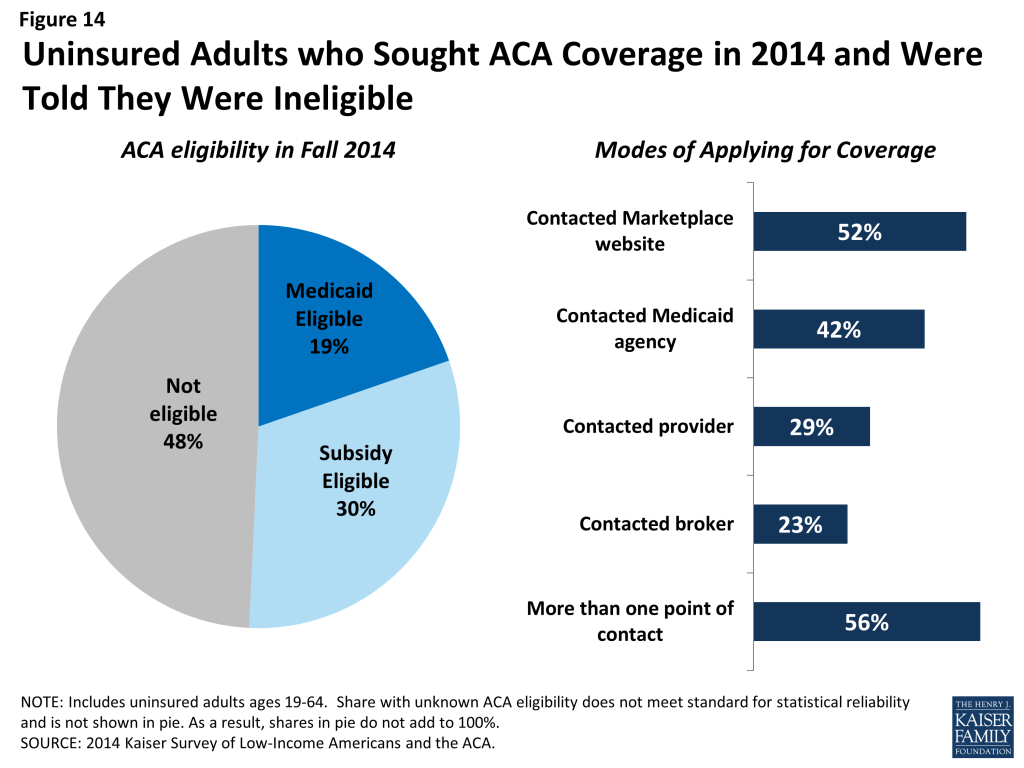
Looking at just the group of uninsured adults that sought ACA coverage and were told they were ineligible, about half appear to be eligible for Medicaid or Marketplace subsidies as of the time of the survey (Figure 14). As discussed above, there are several possible reasons why they may say they were told they are ineligible. Notably, many report that they had direct contact with either their state Marketplace/ healthcare.gov or their state Medicaid agency, and more than half say they tried more than one mode of applying.
Figure 14: Uninsured Adults who Sought ACA Coverage in 2014 and Were Told They Were Ineligible
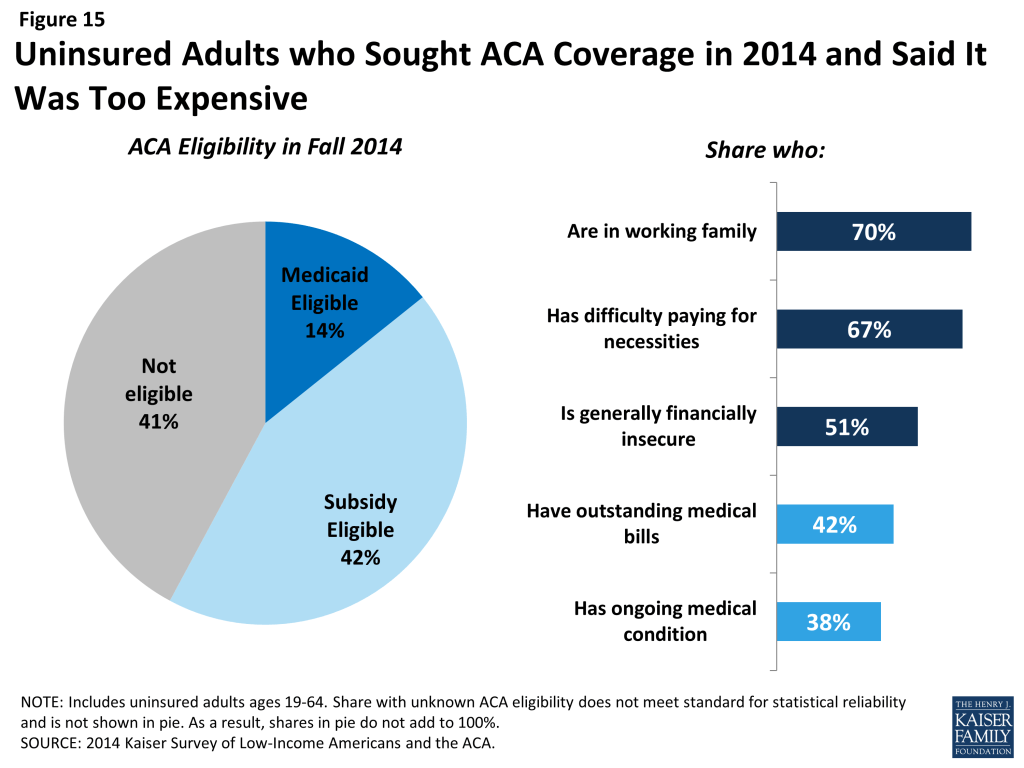
Many uninsured adults who applied for ACA coverage say the coverage offered was unaffordable. Nearly three in ten (29%) uninsured adults who sought ACA coverage said they did not enroll because the coverage was too expensive (Figure 13, previous page). Among those who cited cost as a reason for not having ACA coverage, four in ten were ineligible (41%) for financial assistance under the law. These individuals would face the full cost of coverage in the Marketplace and likely found unsubsidized coverage unaffordable. However, 42% of those who said they did not obtain ACA coverage due to cost appear to be eligible for Marketplace subsidies (Figure 15). Marketplace subsidies are based on income, with those at the lower end of the income spectrum receiving larger subsidies. Still, some people may find the share they were asked to pay too costly to take up the coverage. A small share of those who said the coverage was too costly appear to be eligible for Medicaid, even though only a handful of states charge premiums to adults in Medicaid.5 These people may have shopped for Marketplace coverage and perceive it to be too costly, they may have received incorrect or misinterpreted information on Medicaid coverage, or their eligibility may have changed between the time they sought coverage and completed the survey. When looking at the characteristics of people who cited cost, it is clear that many have precarious financial situations and many face medical expenses (Figure 15). Thus, efforts to provide accurate information to these individuals about the availability of low-cost coverage to help with medical expenses may lead them to enroll.
Figure 15: Uninsured Adults who Sought ACA Coverage in 2014 and Said It Was Too Expensive
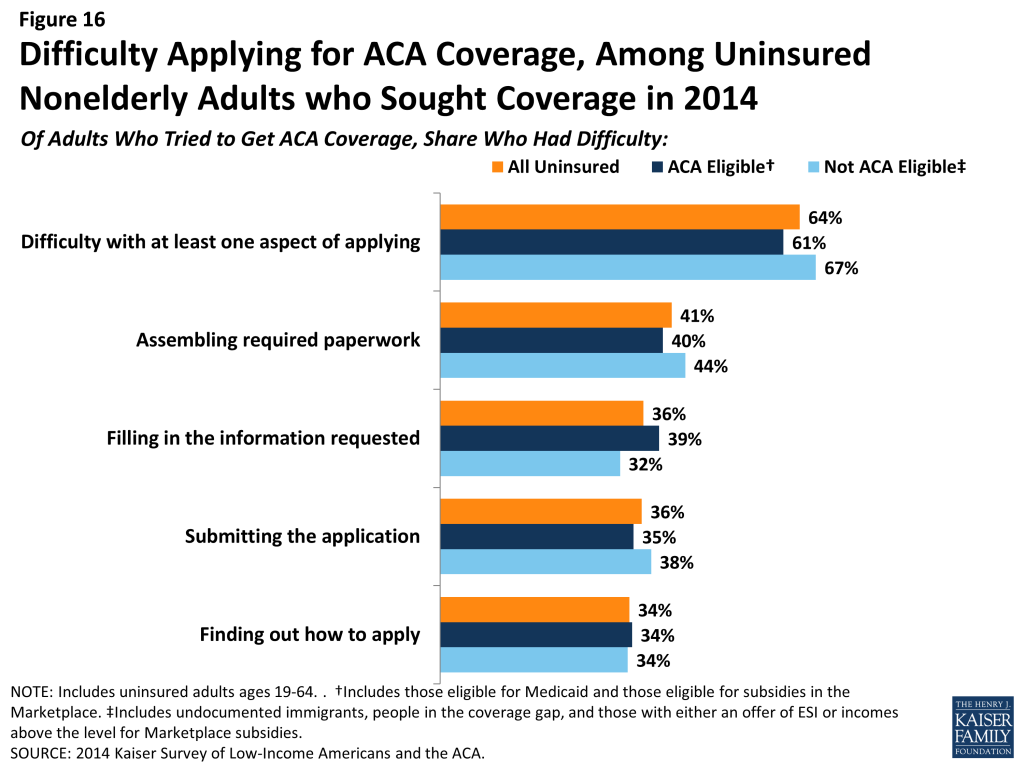
While most uninsured adults did not cite application problems as the main reason for not enrolling in ACA coverage, many did encounter difficulties with the application process. Compared to reasons of ineligibility or cost, smaller shares said that they didn’t get coverage due to problems with the application process, such as still having a pending application (12%) or not completing the application process (8%) (data not shown). Still, when asked directly about their experience applying, most (64%) did say they found at least one aspect of the application process difficult (Figure 16). No single aspect stands out as the most difficult: more than one in four (41%) reported difficulty assembling the required paperwork, and more than a third reported difficulty filling in the information requested (36%), submitting the application (36%), or finding out how to apply (34%). There were no statistically significant differences in rates of difficulty between those who appear to be eligible or ineligible for assistance under the ACA.
Figure 16: Difficulty Applying for ACA Coverage, Among Uninsured Nonelderly Adults who Sought Coverage in 2014
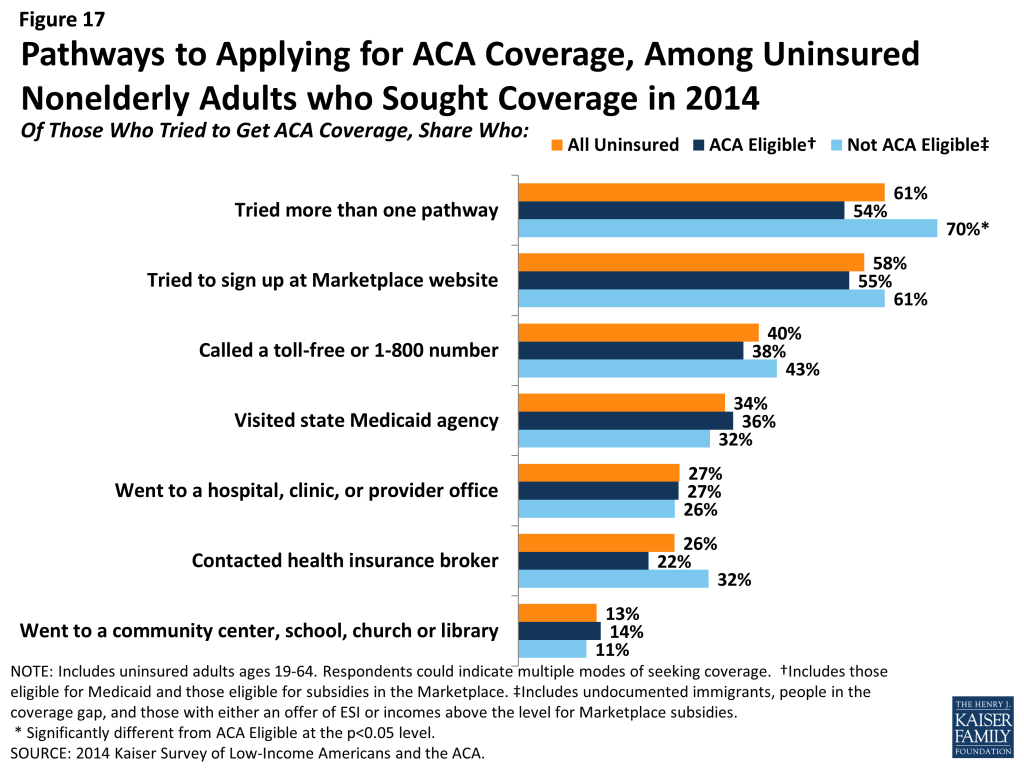
Among those who tried to get ACA coverage, most reported trying multiple avenues, and most tried to get coverage directly from the state or federal government. While the ACA envisioned a streamlined, “no wrong door” application and enrollment process, most uninsured adults who sought ACA coverage in 2014 said they pursued multiple pathways to coverage. More than six in ten (61%) tried more than one pathway, and those who appear to be ineligible were more likely to try multiple pathways (Figure 17). The most common ways that the uninsured who sought ACA coverage did so was by contacting their state marketplace or healthcare.gov (58%). Four in ten reported that they called a toll-free number to get help, more than a third (34%) visited their state Medicaid agency. While many uninsured adults pursued other avenues for getting coverage—such as going to a provider for help (27%) or contacting a health insurance broker (26%)—much smaller shares indicated that they went community agencies, schools, churches, or libraries (13%).
Figure 17: Pathways to Applying for ACA Coverage, Among Uninsured Nonelderly Adults who Sought Coverage in 2014
Even among those likely eligible, few uninsured adults have plans to obtain ACA coverage. Only about half of uninsured adults who appear to be eligible for help under the ACA indicate that they plan to get coverage in 2015, and few who do plan to get coverage identified Medicaid or Marketplace coverage as their goal (Figure 18). Rather, higher shares indicate that they will get coverage elsewhere, don’t know where they will get coverage, or plan to get coverage through a job. Further, some who do not appear to be eligible for assistance indicate that they plan to get Medicaid or Marketplace coverage.
Figure 18: Plans for Obtaining Insurance in 2015, Among Uninsured Adults in Fall 2014
Policy Implications
As the first year of new coverage under the ACA comes to a close and the end of the second open enrollment period nears, there is great interest in understanding why some people continue to lack coverage and in reaching out to the eligible uninsured. Findings from the 2014 Kaiser Survey of Low-Income Americans and the ACA provide key lessons for ongoing efforts to extend health coverage in the United States.
Despite the availability of low-cost or free coverage, perceptions of cost or lack of awareness of assistance are barriers to reaching some eligible uninsured. When asked in their own words, uninsured adults were most likely to name cost as the main reason they don’t have coverage, and this pattern held even among those who appear to be currently eligible for low-cost or free coverage under the ACA. In addition, most eligible uninsured adults say that they did not try to get health insurance from either their state Marketplace, healthcare.gov, or their state Medicaid agency in 2014, and few indicated plans to obtain ACA coverage in 2015. Ongoing efforts to inform the eligible uninsured of new options for low-cost coverage will be essential to continuing the decline in the number of uninsured Americans.
While ACA application problems were not a leading reason why people went without coverage, many uninsured adults reported difficulty applying. Nearly two-thirds of uninsured adults who sought ACA coverage said they had some difficulty with finding out how to apply, filling in the information, assembling the paperwork, or submitting the application. While the ACA envisioned a streamlined, “no wrong door” application and enrollment process, most people who sought ACA coverage in 2014 said they pursued multiple pathways to coverage. There was much attention to application difficulties in 2014, many of which have been addressed for 2015 open enrollment. However, people who had difficulty applying may be less likely to seek coverage again.
Many who applied for ACA assistance still found the coverage unaffordable. While it is not surprising that people ineligible for financial assistance said coverage was too costly, many who do appear eligible still said the coverage was too expensive. While premium subsidies are based on a sliding scale, it appears that many still find the coverage unaffordable. It is unclear whether people felt the premiums were unaffordable or whether they felt that the coverage as a whole—including premiums, deductibles, and cost sharing—was unaffordable. Additional work is needed to understand whether affordability provisions in the ACA are sufficient to enable lower-income people to take up coverage.
Gaps in eligibility and complex eligibility rules may prevent many uninsured adults from gaining coverage. About half of remaining uninsured adults do not appear to be eligible for financial assistance under the ACA, either because of their immigration status, because their state did not expand Medicaid, or because they have an offer of ESI or incomes above the limit for premium subsidies, and many remaining uninsured are working for firms that will not be required to offer coverage under the ACA because they have fewer than 50 workers. However, even among those who are eligible for ACA coverage, many say they were told they were ineligible. It is unclear whether these individuals were ineligible at the time they applied, received wrong information, misinterpreted information, or only sought one type of ACA coverage. However, it is likely that complex eligibility rules for different types of assistance contributed to confusion over eligibility. In addition, while the ACA envisioned a continuum of coverage with various coverage options available as people’s circumstances changed (such as job loss or income change), one in five uninsured adults actually lost coverage in 2014. Some of these people fall into eligibility gaps, and some were eligible but did not obtain ACA coverage. Thus, coverage transitions remain a challenge to keeping coverage.
Appendix
2014 Kaiser Survey of Low-Income Americans and the ACA: Methods
The 2014 Kaiser Survey of Low-Income Americans and the ACA, conducted by the Kaiser Family Foundation (KFF) in Fall 2014, examines health insurance coverage, health care use and barriers to care, and financial security among insured and uninsured adults across the income spectrum, with a focus on populations targeted for coverage expansions under the Affordable Care Act (ACA). The survey captures experiences a year after open enrollment began for health coverage through the ACA and builds on a similar baseline survey conducted in summer 2013.6 The 2014 survey includes a national sample as well as two state-specific samples in California (conducted with support from the Blue Shield of California Foundation (BSCF)) and Missouri (conducted with support from the Missouri Foundation for Health (MFH)). Costs for the national survey were paid by KFF.
The survey was designed and analyzed by researchers at KFF, with feedback on the California and Missouri state-specific components from BSCF and MFH, respectively. Social Science Research Solutions (SSRS) collaborated with KFF researchers on sample design and weighting; SSRS also supervised the fieldwork.
The survey was conducted by telephone from September 2 through December 15, 2014 from representative random samples of California and Missouri residents between the ages of 19-64, along with respondents from the remaining 48 states and the District of Columbia. In total, 10,502 interviews were completed; of these, 4,555 were with respondents living in California, 1,864 with respondents in Missouri, and 4,083 with respondents from other states. Computer-assisted telephone interviews (CATI) conducted by landline (5,105) and cell phone (5,397) were carried out in English and Spanish by SSRS.
The study was designed to oversample lower- and middle-income populations in order to have more statistical power in describing the views and experiences of these groups. To efficiently reach lower-income respondents, the sample in each state was stratified based on the estimated income level of geographic areas within California and Missouri as well as within the remaining states. This process was done separately for the landline and cell phone sampling frames. For the landline sample, strata were defined based on the median income within telephone exchanges; for the cell phone sample, strata were defined based on the household income associated with the billing rate-center to which the cell phone number is linked. The exact criteria for distinguishing between the strata in the cell phone sample varied from state to state. In addition, 481 interviews (217 on landline and 264 on cell phone) were conducted with respondents who were previously interviewed by SSRS as part of omnibus surveys of the general public and indicated they were ages 19-64, resided in the appropriate geography for the sample (if part of one of the state samples), and reported annual income of less than $25,000. These previous surveys were conducted with nationally representative, random-digit-dial landline and cell phone samples. Landline and cell phone samples were provided by Marketing Systems Group.
Screening for the survey involved verifying that the respondent (or another member of the household for the landline sample) met the criteria of: 1) being 19-64 years old; and 2) providing income information that allowed them to be classified by family income. People who did not know or refused to report their income or family size were excluded from the survey. Respondents were classified by family income as a share of the federal poverty level (FPL) based on their family size and total annual gross income.7 Poverty level groups included income < 138% of FPL (the income range for the Medicaid expansion), income of 139-400% FPL (the income range for Marketplace tax credits), and income above 400% of FPL (eligible only for unsubsidized coverage). For the landline sample, if two or more people met the criteria, a respondent was randomly selected by the CATI program. Selected respondents were asked to confirm their state of residence.
A multi-stage weighting approach was applied to ensure an accurate representation of the various income groups ages 19 to 64. The weighting process involved corrections for sample design as well as sample weighting to match known demographics of the target populations in order to correct for systematic non-response along these parameters. The base weight accounted for the oversamples used in the sample design, as well as the likelihood of non-response for the re-contact sample, number of eligible household members for the landline sample, and a correction to account for the fact that respondents with both a landline and cell phone have a higher probability of selection. Demographic weighting parameters were based on population estimates for the 19-64 year old poverty-level population in each state based on the U.S. Census Bureau’s 2013 American Community Survey (ACS). The weighting parameters for each poverty-level group within the two state-specific samples and the remaining national sample were: age, education, race/ethnicity, presence of own child in the household, marital status, and region. All statistical tests of significance account for the effect of weighting.
The margin of sampling error (including the design effect) for national estimates, state estimates and state-by-poverty-level estimates are shown in Table A. For the national sample, the margin of sampling error is plus or minus 2 percentage points for both the low- and moderate-income groups. For the remaining uninsured, the margin of sampling error is plus or minus 4 percentage points. For results based on other subgroups, the margin of sampling error may be higher. Sample sizes and margin of sampling errors for other subgroups are available by request. In reporting results, any estimate with a relative standard error (standard error divided by the point estimate) greater than 30 percent or based on a sample less than 100 is considered unreliable and not reported. Note that sampling error is only one of many potential sources of error in this or any other survey.
In analyzing results, we often categorize respondents according to insurance coverage or eligibility for insurance coverage. We classify anyone who indicated that they did not have any form of health insurance or health plan at the time of the interview as “Uninsured.” People who indicate coverage through their own employer, a spouse’s employer, or a parent’s employer are classified as having employer coverage. People who indicate Medicaid coverage, either alone or in conjunction with Medicare, are classified as having Medicaid. People who indicate that they purchased their coverage through their state Marketplace or healthcare.gov are classified as having Marketplace coverage. People who indicate that they purchase their coverage directly from an insurance company but did not purchase coverage through their state Marketplace or healthcare.gov are classified as “Private Nongroup.” People with other sources of coverage, including Medicare, VA, school-based coverage, or an unidentifiable source are classified as “Other.” In asking about both Medicaid and Marketplace coverage, state-specific program names were used, corresponding to the respondent’s state of residence. In some cases, we recoded coverage type based on verbatim responses, other information in the survey, or call backs to confirm type of coverage.
We use information on when coverage began to classify people into categories of “newly insured” or “continuously insured.” Newly insured individuals are those who indicate that they have insurance coverage, that their coverage started on or after January 2014, and that they were uninsured before that coverage started. Continuously insured people are those who indicate that they have insurance coverage and had insurance coverage since before January 2014.
Last, we assess uninsured respondents’ likely eligibility for coverage under the ACA based on family income as a share of poverty, state of residence, immigration status and length of time in the United States, parent status, and availability of coverage through an employer. We define undocumented immigrants as those who reported 1) they were born outside the United States, 2) are not a citizen, 3) did not have a green card when they arrived in the United States, and 4) have not received a green card or become a permanent resident since arriving. This measure may be subject to error in several ways. First, it relies on self-reporting, and respondents have an incentive not to reveal unlawful immigration status. Second, those that did not answer all questions in the series of immigration status items (84 respondents) were not able to be categorized as undocumented and were therefore included; if they are in fact undocumented, then the results may differ slightly. Third, a small number of people may have a legal status besides permanent residency or green card (such as refugees, asylees or other humanitarian immigrants). Unfortunately, due to time constraints, the survey was not able to fully explore all of these immigration pathways.
Table A: Number of Respondents and Margin of Sampling Error for National and State-Specific Samples
Wilper AP, Woolhandler S, Lasser KE, McComick D, Bor DH, Himmelstein DU. Hypertension, diabetes, and elevated cholesterol among insured and uninsured US adults. Health Affairs. 2009;28(6):w1151-9. ↩︎
Coverage Matters: Insurance and Health Care, Committee on the Consequences of Uninsurance, Board on Health Care Services, Institute of Medicine, National Academy Press, 2001. ↩︎
Sommers BD. “Insuring children or insuring families: do parental and sibling coverage lead to improved retention of children in Medicaid and CHIP?” J Health Econ. 2006 Nov;25(6):1154-69. Epub 2006 Jun 5. ↩︎
In capturing family size, we include all members of the respondents’ immediate family, including themselves, spouse (if married), and any dependents, as well as parents if the respondent is a dependent. These groupings mimic “health insurance units” that are used to determine eligibility for Medicaid and Marketplace coverage. ↩︎
In January 2015, Tennessee released a proposed amendment to its current Section 1115 demonstration to implement the Affordable Care Act’s (ACA) Medicaid expansion. The two-year demonstration would cover newly eligible adults – parents from 103-138% of the federal poverty level (FPL, up to $16,242 per year for an individual in 2015) and childless adults from 0-138% of the federal poverty level – an estimated 200,000 beneficiaries.1 The ACA provides 100% federal matching funds for newly eligible adults through December 31, 2016, decreasing to a 95% match on January 1, 2017. Tennessee hospitals will fund the state’s costs of the Medicaid expansion through an increased state assessment on hospitals. To be implemented, the waiver amendment, called Insure Tennessee, would need to be approved by the Centers for Medicare and Medicaid Services (CMS) following the state public comment period, which ends February 8, 2015, and a federal public comment period. The proposal would also need state legislative approval. Tennessee’s Governor has called a special legislative session to consider the amendment on February 2, 2015.2
If implemented on January 1, 2016, the waiver amendment would:
Expand Medicaid coverage to newly eligible adults ages 21-64 primarily through capitated Medicaid managed care organizations (MCOs) already operating in the state. Under the Healthy Incentives Plan, most newly eligible adults would receive an Alternative Benefits Package consisting of the same benefits as provided to other Medicaid beneficiaries. MCOs would administer health savings accounts in which newly eligible adults would accrue credits by participating in certain designated healthy behaviors. These credits could then be used to decrease premiums and co-payments. Tennessee seeks waiver authority to require monthly premiums up to 2% of income (approximately $20 per month) for newly eligible adults from 100-138% FPL and would impose copays within existing limits in federal regulations. Tennessee proposes disenrolling beneficiaries for failing to pay premiums for 60 days and reserved the right to seek waiver authority for a lock-out period before these individuals could re-enroll based on CMS’s decision on Indiana’s pending lock-out request. CMS subsequently did approve a six-month lock-out after disenrollment for failure to pay premiums for individuals from 100-138% FPL who are not medically frail in Indiana;
Offer newly eligible adults with access to employer-sponsored insurance (ESI) the option of receiving premium assistance through a defined contribution from the state toward ESI.3 Under the Volunteer Plan, the amount of the state’s contribution is still to be determined but is expected to cover the beneficiary’s share of premiums and may partially cover the ESI plan deductible and copays. After the employer and state contributions, Tennessee would require newly eligible adults receiving premium assistance for ESI to pay all remaining premium, deductible, and co-payment costs and seeks to waive the 5% out of pocket cost-sharing cap in federal Medicaid law for these beneficiaries. Tennessee would seek separate § 1916(f) waiver authority for this cost-sharing pilot program. Tennessee proposes waiving wrap-around coverage for Medicaid benefits not offered through ESI (including non-emergency medical transportation) and also seeks wavier authority to permit appeals of coverage decisions to be determined through ESI plans and not the Medicaid state fair hearing process;
Enroll individuals ages 19 and 20 into the regular TennCare Medicaid managed care program and provide them with all TennCare benefits, including Early and Periodic Screening, Diagnosis, and Treatment;
Waive 3 months retroactive eligibility for all newly eligible adults.
To date, CMS has approved Medicaid expansion waivers in five other states (Arkansas, Iowa, Indiana, Michigan and Pennsylvania).4 Some provisions in Tennessee’s proposal are similar to provisions approved in other waivers, such as premiums of 2% of income for beneficiaries between 100-138% FPL (equivalent to Marketplace premiums for this group) and healthy behavior incentives administered through health savings accounts. Like Michigan and some populations in Iowa, Tennessee is choosing to expand Medicaid through its existing, well-established capitated managed care delivery system, administered by private health plans. If granted, Tennessee’s § 1916(f) waiver of the 5% cost-sharing cap for beneficiaries who choose to receive premium assistance for ESI would be unique. In addition to Tennessee, Utah has a proposal pending at the state level. New Hampshire has a waiver application pending with CMS. Table 1 describes the major elements of Tennessee’s proposed amendment to their Section 1115 demonstration.
Would cover approximately 200,000 newly eligible adults.Healthy Incentive Plan: most newly eligible adults ages 21-64 would be covered through existing capitated Medicaid managed care plans. Those who participate in healthy behavior activities can accrue credits in health savings accounts to reduce premiums and co-payments.Volunteer Plan: individuals with access to ESI could choose to receive a defined contribution from the state toward ESI costs.Newly eligible adults ages 19 and 20 would be enrolled in Tennessee’s existing Medicaid managed care program, TennCare, and receive full benefits including EPSDT.
Duration:
1/1/16 to 12/31/17
Coverage Groups:
Covers newly eligible adults ages 19-64 (parents with incomes 103-138% FPL and childless adults with incomes 0-138% FPL).
Financial Eligibility:
Seeks waiver authority to require newly eligible adults receiving institutional or home and community-based long-term services and supports (LTSS) to contribute their monthly income toward the cost of LTSS, less a personal needs and spousal maintenance allowance.5 This would treat these beneficiaries the same as previously eligible beneficiaries receiving LTSS.
Enrollment:
State will provide options counseling to assist beneficiaries with access to ESI with choosing between premium assistance for ESI and Medicaid managed care. Individuals receiving premium assistance for ESI can move into Medicaid managed care at any time. Individuals wishing to move from Medicaid managed care to premium assistance for ESI need to do so during the ESI’s open enrollment period or when an event triggers a special enrollment period.
Premiums:
Healthy Incentives Plan: individuals from 100-138% FPL enrolled in Medicaid managed care will pay premiums equal to 2% of their income (approximately $20 per month). (State seeks waiver authority for premiums for those from 100-150% FPL.) State also proposes disenrolling beneficiaries for failure to pay premiums for 60 days and reserved the right to request waiver authority for a lock-out period before such individuals could re-enroll, based on CMS’s decision on Indiana’s pending lock-out request. CMS subsequently approved a six month lock-out after disenrollment for failure to pay premiums for individuals from 100-138% FPL who are not medically frail in Indiana.Volunteer Plan: individuals choosing to receive premium assistance for ESI would be responsible for any portion of the ESI premium not covered by the state’s defined contribution.6 Employers must cover at least 50% of the premium costs, and the amount of the state’s defined contribution is still to be determined.
Co-Payments:
Healthy Incentives Plan: individuals from 100-138% FPL enrolled in Medicaid managed care would have copays in amounts under existing law, including $75 per inpatient admission, $4 for outpatient services, and $8 for non-emergency use of the emergency room. All beneficiaries are subject to pharmacy copayments of $1.50 for generic drugs and $3 for brand name drugs.Volunteer Plan: individuals choosing to receive premium assistance for ESI would be responsible for all ESI plan deductibles and co-payments remaining after the employer and state’s contributions. State seeks separate § 1916(f) waiver of the 5% cap on Medicaid cost-sharing for these beneficiaries.
Health savings accounts:
Healthy Incentives Plan: individuals enrolled in Medicaid managed care will be provided with a Healthy Incentives for Tennesseans (HIT) health savings account, administered by the MCO. The account will be pre-loaded at the beginning of coverage with an unspecified “small sum,” and individuals may earn additional credits by engaging in state-specified healthy behaviors and participating in initiatives such as an annual health risk assessment or certain population-based health programs.Individuals may apply account credits to offset premiums and copayments and will receive a quarterly statement with account activity. The accounts will have a maximum balance that can be accrued. Once account funds are exhausted, the beneficiary is responsible for all premiums and copays up to the cost-sharing cap of 5% of quarterly income. Any account credits remaining at the end of the year can roll over to the next year.For beneficiaries below 100% FPL (who are not subject to premiums and most copays), the state proposes deducting from their HIT accounts the amount that they would have paid if they were subject to the copays that apply to beneficiaries above 100% FPL. These beneficiaries could then use any remaining HIT account funds at the end of the year for reimbursement for out-of-pocket expenditures for certain items not covered by TennCare, such as over-the-counter drugs and dental care.
Delivery System and Benefits:
Healthy Incentive Plan: individuals ages 21-64 would receive an Alternative Benefits Plan that includes the same benefits covered by Tennessee’s existing Medicaid benefit package for adults. Benefits would be delivered through existing capitated MCOs.Volunteer Plan: individuals who choose premium assistance for ESI would be limited to the benefits covered by the ESI plan. State seeks waiver of responsibility to provide wrap-around coverage for any services covered by Medicaid but not available in the ESI plan, including non-emergency medical transportation.Individuals ages 19 and 20 would be enrolled in Medicaid managed care and would receive full benefits, including EPSDT.
Appeals:
Volunteer Plan: for beneficiaries who choose to receive premium assistance for ESI, state seeks waiver authority to have coverage appeals determined through the ESI plan appeals process and not the Medicaid state fair hearing process
Financing:
The ACA provides 100% federal matching funds for newly eligible adults through December 31, 2016, decreasing to a 95% match on January 1, 2017. Tennessee hospitals will fund the state’s costs of the Medicaid expansion through an increased state assessment on hospitals.
Next Steps:
Waiver amendment is open for state-level public comment until Feb. 8, 2015. State must get state legislative approval (special session called by the Governor for February 2, 2015), submit proposal to CMS, allow for federal 30 day public comment period, and obtain federal approval of the waiver amendment.
The state estimates that approximately 54% of the newly eligible population are either currently working or have worked within the past year and might have access to ESI. Insure Tennessee Proposal (January 2015), available at http://www.tn.gov/tenncare/pol-notice.html. ↩︎
Pennsylvania’s new governor, Tom Wolf, has indicated that he is planning to expand the state’s existing Medicaid program through a State Plan Amendment rather than use the§ 1115 waiver approved in August 2014. ↩︎
CMS has determined that the current post-eligibility treatment of income regulations do not apply to beneficiaries subject to the MAGI financial methodology. However, CMS also has determined that the statute provides the agency with authority to expand these rules to MAGI beneficiaries who receive LTSS, and for equity reasons, CMS is considering future rule-making in this area. CMS State Medicaid Director Letter #14-001 RE: Application of Liens, Adjustments and Recoveries, Transfer-of-Asset Rules, and Post-Eligibility Income Rules to MAGI Individuals (Feb. 21, 2014), available at http://www.medicaid.gov/Federal-Policy-Guidance/Downloads/SMD-14-001.pdf. ↩︎
State will: 1) pay beneficiary’s employer or insurer directly for beneficiary’s share of premium; 2) pay provider directly for beneficiary’s share of deductibles and co-payments; and/or 3) reimburse beneficiary for premiums, deductibles, and/or co-payments. State is finalizing the operational details with input from employers. ↩︎
The Kaiser Health Policy News Index is designed to help journalists and policymakers understand which health policy-related news stories Americans are paying attention to, and what the public understands about health policy issues covered in the news. In the midst of the Affordable Care Act’s (ACA’s) second open enrollment period, health policy news fails to capture the attention of majority of the public. Not surprisingly, Americans’ attention is drawn to international news headlines, such as the attack on the French satirical newspaper, Charlie Hebdo, efforts to recover the AirAsia jetliner, and non-health, domestic news, such as the police conflict in New York and President Obama’s decision to restore diplomatic relations with Cuba.
Attention To The News
The first Kaiser Health Policy News Index of the new year finds only small shares of the American public paying attention to health policy news stories. Instead, the most closely followed stories this month were the conflict in New York City between police and the mayor following the fatal shooting of two police officers (67 percent), the Islamist terrorist attack on the French satirical newspaper, Charlie Hebdo, (64 percent), efforts to recover the AirAsia jetliner that crashed off the coast of Indonesia (59 percent), and President Obama’s decision to restore U.S. diplomatic relations with Cuba (54 percent). Although the lead up to the mid-term election and the results themselves garnered quite a bit of attention, the public appears to have lost interest in the new Congress, as 3 in 10 (30 percent) report tracking media coverage of the new Republican Congressional agenda for 2015. Further down on the public’s news radar are the following recent health policy stories: a bill passed by House Republicans to change the definition of full-time employees under the health care law’s employer requirement (27 percent), the health care law’s second open enrollment period (25 percent), the reversal of an FDA rule that banned gay and bisexual men from donating blood (22 percent), and controversy over an expensive new drug to treat Hepatitis C (15 percent).
Figure 1
The ACA’s Second Open Enrollment Period
Although few report closely following health policy stories this month, a majority of Americans, both those who say they followed news about the ACA’s open enrollment period and those who do not, are aware of major provisions of the law. For example, over 6 in 10 know that the law creates health insurance exchanges where small businesses and individuals who don’t get coverage through their employers can shop for insurance and that the law provides financial help for low- and moderate-income Americans who don’t get insurance through their jobs to help them purchase coverage.
While a majority of public may report knowing that the health care law creates these exchanges, they are less confident in how much they know about them. Those who report closely following the news about the ACA’s open enrollment period are more likely to report that they know at least something about the marketplace (43 percent) than those who report not following this story as closely (26 percent). When it comes to details of the marketplaces, equally large shares of those following the news and those not following it correctly report that people who get insurance through the exchanges have a choice between private health plans (62 percent each).
Additionally, those who report closely following news of open enrollment are slightly more likely than those not following the news to be aware of the February 2015 deadline for individuals to enroll in coverage (22 percent vs. 13 percent), but still the vast majority of both groups are unsure of the deadline to sign up.
Figure 2
Attention To And Knowledge Of The Proposed Change To Defining Full-Time Workers
In the first week of the new Republican Congress, the House passed a bill that is now under consideration in the Senate that would redefine a full-time worker under the health care law’s employer requirement from one who works at least 30 hours a week to one who works 40 hours a week. The public is not particularly engaged in this story, as only about a quarter (27 percent) report following it in the news. After being told about the proposed change, four in ten say they oppose the definition change, while about a quarter (26 percent) say they support it and a third (33 percent) don’t know enough to say. In line with the American public as a whole, equal shares of those who followed the media coverage of this bill and those who did not oppose the change (41 percent and 40 percent, respectively). However, those who report following the story closely are more likely to support the change than those who say they did not closely follow the news coverage (36 percent compared to 22 percent), while those who did not follow the story are more likely to say that they do not know enough to say (37 percent compared to 21 percent, respectively).
Figure 3
NOTE: These questions were asked as part of the January 2015 Kaiser Health Tracking Poll. For more results from that survey, including methods, see: Kaiser Health Tracking Poll: January 2015.
Kaiser Health Tracking Poll: January 2015 Findings
With the Supreme Court set to hear the King v. Burwell case in March, the latest Kaiser Health Tracking Poll finds that a majority of the public says they have heard nothing at all about the case. In an initial reaction to what Congress or states using the federal marketplace should do if the Supreme Court rules that financial help to buy health insurance is only available to people in states with state-run marketplaces, nearly two-thirds of the public says Congress should pass a law making subsidies available to eligible people in all states, and a majority of the public in states using healthcare.gov would want their state to create its own marketplace. As Congress considers legislation to change the employer requirement under the law, more of the public says they oppose changing the full-time worker definition under the ACA from 30 to 40 hours a week than say they support it and about a third remain unsure, but opinion can be swayed after hearing some of the other side’s argument. With less than a month left in this year’s open enrollment period, most uninsured are unaware of the deadline to enroll and a substantial share remains unaware of the financial assistance available to help eligible people buy insurance.
The Public’s Views Of King V. Burwell And Exchanges
The U.S. Supreme Court will hear a case, King v. Burwell, in March about whether the health care law says people in all states can be eligible for financial help from the government to buy health insurance or if financial help is only available to those in states with state-run marketplaces. At this point, over half of the public (56 percent) says they have heard nothing at all about this case, while an additional 3 in 10 say they have heard only a little. Fewer than 1 in 5 say they have heard at least something about the case (14 percent).
Figure 1
If the Supreme Court rules that financial assistance is only available in states with state-run marketplaces, nearly two-thirds of the public says that Congress should take action so that people in all states can be eligible for financial help to purchase health insurance. Majorities of Democrats and independents say they would support Congressional action, while Republicans are more divided. And, although the Supreme Court’s decision would have significant implications for many people in states using the federal exchange, their views are similar to those of people living in states with their own marketplace.1
Figure 2
In lieu of Congressional action, states may decide to operate their own exchanges; a move that over half (59 percent) of people living in the federal and partnership marketplace states say they would support should the Supreme Court rule to only allow subsidies in state-run marketplace states. A majority of Democrats (61 percent) and independents (63 percent) as well as about half of Republicans (51 percent) living in these states say they would support state action.
Figure 3
As the Supreme Court prepares to hear the case, roughly a third (34 percent) of adults in states with the federal or partnership marketplaces are aware that their state uses the federal marketplace, while 4 in 10 (39 percent) believe that their state operates its own exchange and another 28 percent don’t know. In contrast, most people in states operating their own exchange (63 percent) are aware that theirs is a state-run marketplace, while about 17 percent think their state uses the marketplace operated by the federal government, and 19 percent say they don’t know.
Figure 4
A New Republican Congress
What’s Next With The Law
With the new Republican-majority Congress taking their seats on Capitol Hill this month, the public remains divided on what they would like Congress to do with the health care law. Nearly 1 in 3 (32 percent) say they would like Congress to repeal the law entirely and 14 percent say they would like the law scaled back. In addition, 19 percent say they want to move forward as is and nearly a quarter (23 percent) say they would prefer to see Congress expand the law. As with opinion of the law overall, opinion sharply diverges by political party.
Figure 5
When asked what they think will happen with the health care law in 2015 now that Republicans control both the U.S. House and Senate, Republicans, Democrats and independents have a similar outlook for the year. Across parties, most believe the law will undergo major (31 percent) or minor changes (32 percent). Relatively few say it will be repealed entirely (12 percent) and another 21 percent say the law will continue as is.
Figure 6
As policymakers and the public consider what’s next with the ACA, over 6 in 10 (63 percent) Americans say that Republicans in Congress do not have an agreed-upon alternative to the law, including majorities of Republicans (52 percent), Democrats (74 percent) and independents (64 percent). Less than 1 in 6 (14 percent) say Republicans do in fact have an agreed-upon alternative and roughly a quarter (23 percent) say they don’t know.
Figure 7
Proposals To Change The ACA
Changing The ACA’s Definition Of A Full-Time Worker
Currently, the ACA requires employers with 100 or more workers to offer health insurance to employees working 30 or more hours per week or pay a fine. Earlier this month, the U.S. House passed a bill that would require these employers to offer health benefits only to employees working 40 or more hours per week and the Senate is considering similar legislation. A plurality of the public opposes this change (40 percent), while about a quarter (26 percent) say they support it and about a third say they don’t know enough to say. Democrats and independents are more likely to say they oppose rather than support the change, while Republicans lean in the opposite direction.
However, opinion on this proposal changes after people hear an argument from the other side. After those opposed to the proposal were provided the statement that “low- and moderate-income employees who don’t work enough hours to get health insurance at work could get financial help from the government to buy their own coverage in the health care law’s marketplace,” support for the proposal increases from 26 percent to 41 percent.
Conversely, when those who support the change are told “this change would increase the federal budget deficit and lead more employers to reduce hours for some full-time workers so they wouldn’t be required to offer them health insurance,” opposition to the proposal increases from 4 in 10 (40 percent) to about half (51 percent).
Figure 8
Repealing The Medical Device Tax
Some lawmakers in Congress, including both Republicans and Democrats, support repealing a provision of the ACA that taxes the manufacturers of medical devices such as artificial joints and pacemakers in order to help pay for other parts of the law, including Medicaid expansion and subsidy assistance. When asked to weigh in on repealing the tax, 3 in 10 say they support it and half as many (15 percent) say they oppose it. However, the majority (54 percent) says they don’t know enough to say whether they support or oppose repealing the medical device tax.
Figure 9
Most Say Proposed Changes Largely Political
The public is doubtful that lawmakers in Congress are proposing changes to the ACA in an effort to improve the law. More than twice as many say that when lawmakers propose changes they are doing so more because they are trying to gain political advantage than say they are doing so because they think it will improve the law (63 percent vs. 29 percent). Republicans are divided, while large majorities of both Democrats and independents feel that lawmakers suggest changes in an effort to gain political advantage.
Figure 10
Views Of The ACA In The New Year
Intensity Gap Remains Wide
Overall views of the law haven’t changed in the past few months and continue to tilt negative. Forty-six percent of the public say they have an unfavorable opinion of the law while 40 percent say they favor the law. There continues to be a wide gap in views by party identification, and Republicans are almost twice as likely to say they feel “very unfavorable” toward the law than Democrats are to say they feel “very favorable” (61 percent vs. 35 percent). A plurality of the public (40 percent) say their impression of the law is based mostly on what they’ve seen in the media, while smaller shares say it’s based on their own experience (28 percent) or what they’ve heard from friends and family (21 percent).
Figure 11
Continue Debate Or Move On
After more than five years of debate about the health care law, the public is split on whether the conversation should continue. Half say they think it is important for the country to continue the debate over the health care law while 45 percent say they are tired of hearing about it and that the country should focus more on other issues. A majority of Republicans say the debate should continue, while a majority of Democrats feel the country should focus on other issues. Independents mirror the public at large.
Figure 12
Perceptions of ACA’s Personal Impact
Nearly 6 in 10 say the health care law has not directly impacted their family, but, as previous Kaiser polls have shown, more say they have been hurt by the law than say they have been helped. These perceptions vary by political party, with more Democrats saying they’ve been helped and more Republicans saying they’ve been hurt. Independents fall roughly in the middle, but more say they have been hurt than say they’ve been helped.
Figure 13
The Uninsured As Open Enrollment Nears Its Close
As open enrollment under the ACA comes to a close next month, 17 percent of the uninsured are aware that the deadline to enroll is February 15. Most of the uninsured (60 percent) say they don’t know the deadline, 11 percent give a date outside of the enrollment period and 13 percent say the deadline has already passed or there is no deadline. Though few uninsured (12 percent) report being contacted about the health care law, about 4 in 10 uninsured (41 percent) say they have sought out more information about the law over the past few months; predominantly through the internet (24 percent), including healthcare.gov specifically (9 percent).
Figure 14
Over 4 in 10 uninsured (44 percent) say they have enough information to understand how the health care law will impact them. A similar share (42 percent) are aware that financial assistance is available to help low- and moderate-income people buy health insurance. And while 56 percent of the uninsured are aware that the law developed marketplaces where people can shop for health plans, only about 1 in 5 uninsured (22 percent) say they know at least something about these marketplaces.
Figure 15
A little over half of the uninsured (56 percent) expect to get health insurance in the next few months, while 4 in 10 (39 percent) say they think they will continue to go without health insurance. For many uninsured, going without health coverage has been a long-term situation; 52 percent say they’ve been uninsured for 2 years or more.
Figure 16
Kaiser Health Tracking Poll: January 2015 Methodology
This Kaiser Health Tracking Poll was designed and analyzed by public opinion researchers at the Kaiser Family Foundation (KFF). The survey was conducted January 15-21, 2015, among a nationally representative random digit dial telephone sample of 1,503 adults ages 18 and older, living in the United States, including Alaska and Hawaii (note: persons without a telephone could not be included in the random selection process). Computer-assisted telephone interviews conducted by landline (751) and cell phone (752, including 450 who had no landline telephone) were carried out in English and Spanish by Princeton Data Source under the direction of Princeton Survey Research Associates International (PSRAI). Both the random digit dial landline and cell phone samples were provided by Survey Sampling International, LLC. For the landline sample, respondents were selected by asking for the youngest adult male or female currently at home based on a random rotation. If no one of that gender was available, interviewers asked to speak with the youngest adult of the opposite gender. For the cell phone sample, interviews were conducted with the adult who answered the phone. KFF paid for all costs associated with the survey.
The combined landline and cell phone sample was weighted to balance the sample demographics to match estimates for the national population using data from the Census Bureau’s 2013 American Community Survey (ACS) on sex, age, education, race, Hispanic origin, nativity (for Hispanics only), and region along with data from the 2010 Census on population density. The sample was also weighted to match current patterns of telephone use using data from the January-June 2014 National Health Interview Survey. The weight takes into account the fact that respondents with both a landline and cell phone have a higher probability of selection in the combined sample and also adjusts for the household size for the landline sample. All statistical tests of significance account for the effect of weighting.
The margin of sampling error including the design effect for the full sample is plus or minus 3 percentage points. Numbers of respondents and margins of sampling error for key subgroups are shown in the table below. For results based on other subgroups, the margin of sampling error may be higher. Sample sizes and margins of sampling error for other subgroups are available by request. Note that sampling error is only one of many potential sources of error in this or any other public opinion poll. Kaiser Family Foundation public opinion and survey research is a charter member of the Transparency Initiative of the American Association for Public Opinion Research.
Group
N (unweighted)
M.O.S.E.
Total
1,503
±3 percentage points
Party Identification
Democrats
455
±5 percentage points
Republicans
405
±6 percentage points
Independents
455
±5 percentage points
Insurance Status
Uninsured, ages 18-64
149
±9 percentage points
Insured, ages 18-64
922
±4 percentage points
Marketplace Type
State-run marketplaces
455
±5 percentage points
Federal/ Partnership marketplaces
1048
±4 percentage points
Opinion of ACA
Favorable
583
±5 percentage points
Unfavorable
726
±4 percentage points
ACA Next Steps
Expand/Move forward with implementation
595
±5 percentage points
Repeal/ Scale back
743
±4 percentage points
Followed News- ACA’s 2nd Open Enrollment
Followed story closely
396
±6 percentage points
Did not follow story closely
1093
±3 percentage points
Followed News- Proposed Definition Change of Full Time Employee
Followed story closely
442
±5 percentage points
Did not follow story closely
1049
±4 percentage points
Endnotes
States with State-run marketplaces: CA, CO, CT, DC, HI, ID, KY, MA, MD, MN, NY, RI, VT, and WA. States with Federal/ Partnership marketplaces: AL, AK, AR, AZ, DE, FL, GA, IA, IL, IN, KS, LA, ME, MI, MO, MS, MT, NE, NC, ND, NH, NJ, NM, NV, OH, OK, OR, PA, SC, SD, TN, TX, UT, VA, WI, WV, and WY. ↩︎
Majority of Public Says Congress Should Act to Close Gaps if the Supreme Court Bars Financial Help for Purchasing Insurance in States Relying on healthcare.gov; Most in Potentially Affected States Want Their State To Set Up Its Own Marketplace if Needed
Views Mixed on Changes to Definition of Full-Time Work For Employer Mandate, with More Opposed than Supportive, And a Third Saying They Don’t Know Enough to Say
Public Remains Divided Over Next Steps for the Affordable Care Act, Though Most Expect Major or Minor Changes under GOP Congress this Year
Though few Americans are paying attention to the pending Supreme Court case over whether the health care law says that people in all states can get financial help to buy health insurance, most say they would want Congress and their state to act to fix potential gaps should the Supreme Court rule in favor of the plaintiffs, the January Kaiser Health Tracking Poll finds.
The Supreme Court is set to hear arguments this March in the King v. Burwell case, which addresses whether low- and moderate-income residents in the 37 states relying on the federal healthcare.gov marketplace are eligible for tax credits to purchase insurance, or whether such assistance can only go to residents of states with their own state-run marketplaces. More than 13 million people in potentially affected states could lose subsidies in 2016 depending on the Supreme Court’s ruling.
In an initial reaction to what Congress should do if the Supreme Court limits this financial assistance to residents in states with state-based marketplaces, nearly two thirds of the public (64%) say Congress should pass a law making subsidies available in all states. Majorities of Democrats and independents favor such action, along with 40 percent of Republicans. In comparison, 27 percent would oppose Congress taking such action.
In addition, a majority (59%) of residents in the healthcare.gov states say they would want their state to act to operate its own exchange if the Supreme Court limits the financial assistance to eligible residents in states with state-run exchanges. This view prevails among majorities of Democrats (61%), independents (63%) and Republicans (51%) across the potentially affected states. In comparison, 29 percent of residents in these states, including 34 percent of Republicans, would oppose such a step.
The poll finds few people are paying attention to the King v. Burwell case at this time. More than half the public (56%) says they have heard “nothing at all” about the case, and another three in 10 say they have heard “only a little.” Just 14 percent say they have heard “some” or “a lot” about the case.
With a new Republican majority controlling both houses of Congress, the public remains divided on what they would like Congress to do next with the Affordable Care Act (ACA) overall. About a third (32%) say they favor repeal, another 14 percent would like the law scaled back, 19 percent want the law to move forward as is, and nearly a quarter (23%) would like to see the law expanded. As with views of the law overall, opinions diverge sharply by political party.
When asked what they think will happen this year with the ACA, Republicans, Democrats and independents have similar expectations. Across parties, most believe it will undergo major (31%) or minor (32%) changes, while relatively few (12%) say it will be repealed entirely. About one in five (21%) say they expect the law to continue as is.
The House this month already passed one bill that would change the ACA’s definition of full-time work from 30 hours per week to 40 hours per week. The threshold is important because the ACA requires large employers to offer health benefits to full-time workers.
When asked about this change, more oppose it (40%) than support it (26%), while a third (33%) say they don’t know enough about it to say. However, the poll finds opinion on this change is somewhat fluid, with some people on both sides changing their view when presented with some of the other side’s argument.
Other findings from the poll include:
A majority (54%) says they don’t know enough about a medical device tax included in the ACA to say whether they support or oppose repealing it, as some lawmakers have proposed. Among those with an opinion, twice as many favor repeal (30%) as oppose it (15%).
Most see lawmakers’ proposals to change the ACA as an attempt to gain political advantage (63%) rather than to improve the law itself (29%). Large majorities of Democrats and independents feel this way, while Republicans are divided.
The public’s overall views on the ACA haven’t changed in the past few months, with slightly more viewing the law unfavorably (46%) than favorably (40%), with wide gaps by party identification. Republicans are almost twice as likely to say they feel “very unfavorable” toward the law than Democrats are to say they feel “very favorable” (61% v. 35%).
This month’s Kaiser Health Policy News Index finds fewer than 3 in ten report paying attention to recent health policy news stories; considerably less than the shares who report following national and international news stories such as tension between the police and the mayor in New York City (67%) and the Charlie Hebdo attack in Paris (64%).
The latest tracking poll was designed and analyzed by public opinion researchers at the Kaiser Family Foundation and was conducted from January 15-21, 2015 among a nationally representative random digit dial telephone sample of 1,503 adults ages 18 and older. Interviews were conducted in English and Spanish by landline (751) and cell phone (752). The margin of sampling error is plus or minus 3 percentage points for the full sample. For results based on other subgroups, the margin of sampling error may be higher.
In his latest column for The Wall Street Journal’s Think Tank, Drew Altman discusses a new Blue Cross Blue Shield Association report on “extreme price variation” in health care services and the limits of consumer information as a solution to the problem.
All previous columns by Drew Altman are available online.