Adults who Remained Uninsured at the End of 2014
Executive Summary
In January 2014, the major coverage provisions of the Affordable Care Act (ACA)—including the expansion of Medicaid eligibility and the availability of subsidized coverage through Health Insurance Marketplaces— went into effect. As the first year of new coverage under the ACA comes to a close and the end of the second open enrollment period nears, there is great interest in understanding why some people continue to lack coverage and in reaching out to the eligible uninsured. This report, based on the 2014 Kaiser Survey of Low-Income Americans and the ACA, profiles the nonelderly adult population that remained uninsured as of Fall 2014. The survey of 10,502 non-elderly adults was fielded between September 2 and December 15, 2014, with the majority of interviews (70%) conducted prior to November 15, 2014 (the start of open enrollment for 2015 Marketplace coverage; Medicaid enrollment is open throughout the year). Additional detail on the survey methods is available in the methods appendix available on line.While millions have enrolled in coverage under the ACA, many remain uninsured. Though much attention was paid to difficulties with the application and enrollment process during the 2014 open enrollment period, logistical issues in applying for coverage do not appear to be a leading reason why people went without insurance in 2014. Rather, lack of awareness of new coverage options and financial assistance appear to be a major barrier. When asked in their own words, uninsured adults were most likely to name cost as the main reason they don’t have coverage, and this pattern held even among those who appear to be currently eligible for low-cost or free coverage under the ACA. In addition, most uninsured adults (63%) say that they did not try to get health insurance from either their state Marketplace, healthcare.gov, or their state Medicaid agency in 2014. Some who did not seek coverage were ineligible for assistance, but the pattern of the majority not seeking coverage holds even among those who are now likely eligible for help. Thus, despite the availability of subsidies for Marketplace coverage and comprehensive Medicaid coverage, misperceptions about cost or lack of awareness are barriers to reaching some eligible uninsured.Further, gaps in eligibility or confusion about eligibility are evident among uninsured adults. Among those who did try to get ACA coverage, the most common reason people gave for not obtaining that coverage was that they were told they were ineligible (41%). Notably, many people who appear to be eligible for some type of assistance say someone told them they were ineligible. While it is possible that they were ineligible at the time they applied, it is likely that these people received incorrect information or misinterpreted information they were given. For people who may be eligible but were told they were not, more accurate or easily understood information about the availability of coverage is particularly important. In addition, some who were told they were ineligible encountered difficulty with the application process or paperwork.Lastly, costs—or perceptions of costs— continue to pose a barrier to coverage according to the survey. Nearly three in ten (29%) uninsured adults who applied for ACA coverage said they did not obtain that coverage because they believed it was too expensive. Many who cited cost barriers were ineligible for financial assistance under the ACA and would have faced the full cost of Marketplace coverage. However, more than four in ten who cited cost as a reason for not enrolling in coverage were eligible for financial assistance. Many appear to be eligible for tax subsidies, but they may have still found Marketplace coverage to be unaffordable even with subsidies.Those who remained uninsured in Fall 2014 still have substantial health needs, as they were more likely than those who took up coverage to rate their health as fair or poor but less likely to have a diagnosed condition or take a prescription on a regular basis. Still, few uninsured indicated plans to seek ACA coverage in 2015. Even among those likely eligible, only about half of uninsured adults indicate that they plan to get health insurance from any source in 2015, and few who do plan to get coverage identified Medicaid or Marketplace coverage as their goal.The survey results underscore the importance of reaching the eligible uninsured with information about their eligibility for coverage and the availability of affordable coverage, both comprehensive Medicaid coverage and subsidized marketplace coverage. While Marketplace enrollment closes on February 15, 2015 for most people, Medicaid coverage is available throughout the year. Thus, ongoing efforts to let the eligible uninsured know about the availability of Medicaid coverage will remain important.
Issue Brief
Introduction
In January 2014, the major coverage provisions of the Affordable Care Act (ACA) went into effect. These provisions include the expansion of Medicaid in states that opted to expand their programs and the creation of Health Insurance Marketplaces where people can purchase coverage on their own. Medicaid coverage is available to most adults in expansion states with incomes at or below 138% of poverty (about $33,000 for a family of four in 2014), and premium tax credits for coverage purchased in the Marketplace are available for most people with incomes up to 400% of poverty (between $23,850 and $95,400 for a family of four in 2014). Together, these provisions have the promise of substantially improving the availability and affordability of insurance coverage in the United States. While many have already enrolled in coverage and renewed their coverage for 2015, open enrollment for 2015 Marketplace coverage continues until February 15, 2015, and Medicaid coverage is available to eligible individuals throughout the year.
To help understand the early impact of the ACA, the Kaiser Family Foundation is conducting a series of comprehensive surveys of the low and moderate income population. The 2013 Kaiser Survey of Low-Income Americans and the ACA, fielded prior to the start of open enrollment for 2014 ACA coverage, provided a baseline snapshot of health insurance coverage, health care use and barriers to care, and financial security among insured and uninsured adults at the starting line of ACA implementation.1 In Fall 2014, we conducted a second wave of the Kaiser Survey of Low-Income Americans and the ACA to understand how these factors have changed under the first year of the law’s main coverage provisions. The survey of 10,502 nonelderly adults was fielded between September 2 and December 15, 2014, with the majority of interviews (70%) conducted prior to November 15, 2014 (the start of open enrollment for 2015 Marketplace coverage; Medicaid enrollment is open throughout the year). Additional detail on the survey methods is available in the methods appendix available on line.
While millions have enrolled in coverage under the ACA, many remain uninsured. Based on the survey findings, approximately 11 million nonelderly adults were newly insured, meaning they reported that they obtained health coverage in 2014 and were uninsured before that coverage started. However, a large share, equaling about 30 million people, reported that they were uninsured as of the date of the interview. Some of these people are ineligible for ACA coverage, either because of their immigration status or because their state did not expand Medicaid. Others may be eligible but either do not know of the new coverage options or have had difficulty navigating the enrollment process. Still others may have opted not to take up coverage for a variety of reasons, such as affordability or personal preferences.
This report, based on the 2014 Kaiser Survey of Low-Income Americans and the ACA, profiles the adult population that remained uninsured as of Fall 2014. It describes the characteristics of this population, examines why they lack insurance coverage and reasons for not enrolling in ACA coverage, and provides information on the coverage options available to the remaining uninsured and their plans for obtaining coverage in 2015. Future reports will provide information about those who gained coverage in 2014 and their experience with the health care system as well as highlight the experiences of the low-income population in California and Missouri.
Understanding Who Remains Uninsured
In many ways, the population that lacked insurance coverage in Fall 2014 resembled the population that has historically lacked coverage as well as the population that gained coverage in 2014. For example, they are similar with respect to age, work status, and income. As in the past, most uninsured adults work but lack access to coverage through a job. While most uninsured adults have lacked coverage for a long time, some have lost coverage since January 2014, an indication that coverage transitions still pose a challenge. Notably, the remaining uninsured population reports poorer health status than the group that gained coverage.
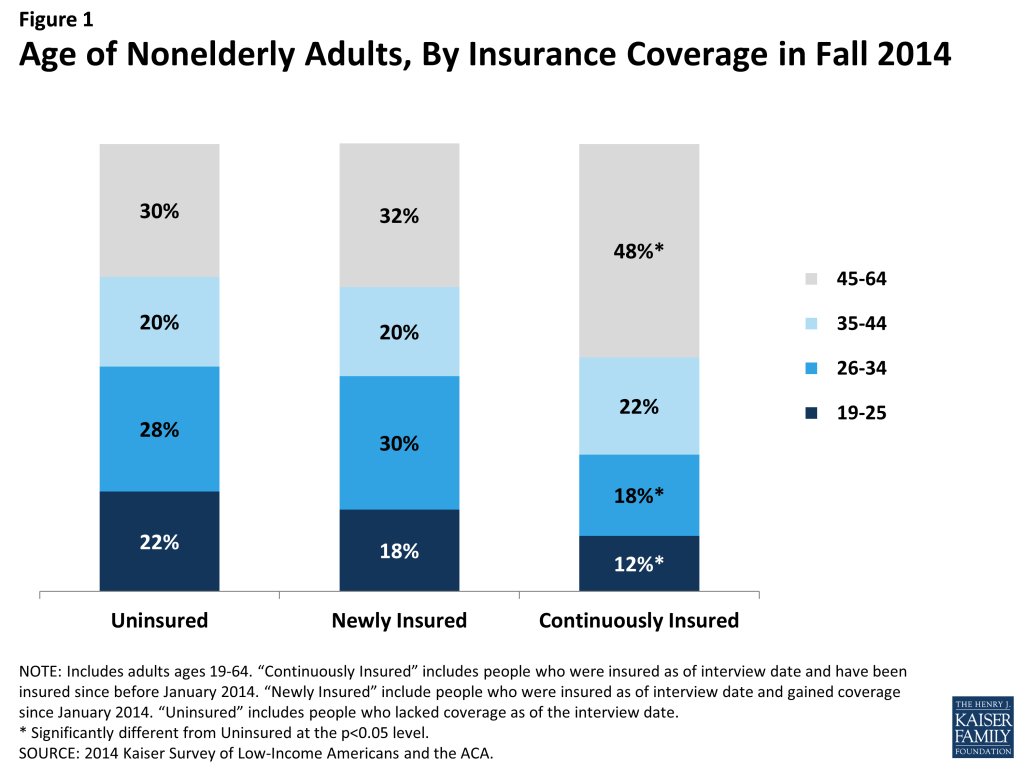
The remaining uninsured are no more likely to be “young invincibles” than those who gained coverage in 2014. Adults who were uninsured late in 2014 were of similar age distribution as adults who gained coverage in 2014. However, both the uninsured and the newly insured populations were younger than the group of adults who were continuously insured. About a fifth of the uninsured (22%) and newly insured (18%) population were young adults, ages 19 through 25, compared to just 12 percent of the continuously insured (Figure 1). Half of the uninsured and about half of the newly insured were under age 35, compared to just 30 percent of the continuously insured. This pattern reflects the fact that those who lacked coverage prior to 2014 were more likely to be young, since younger adults have looser ties to employment and lower incomes.
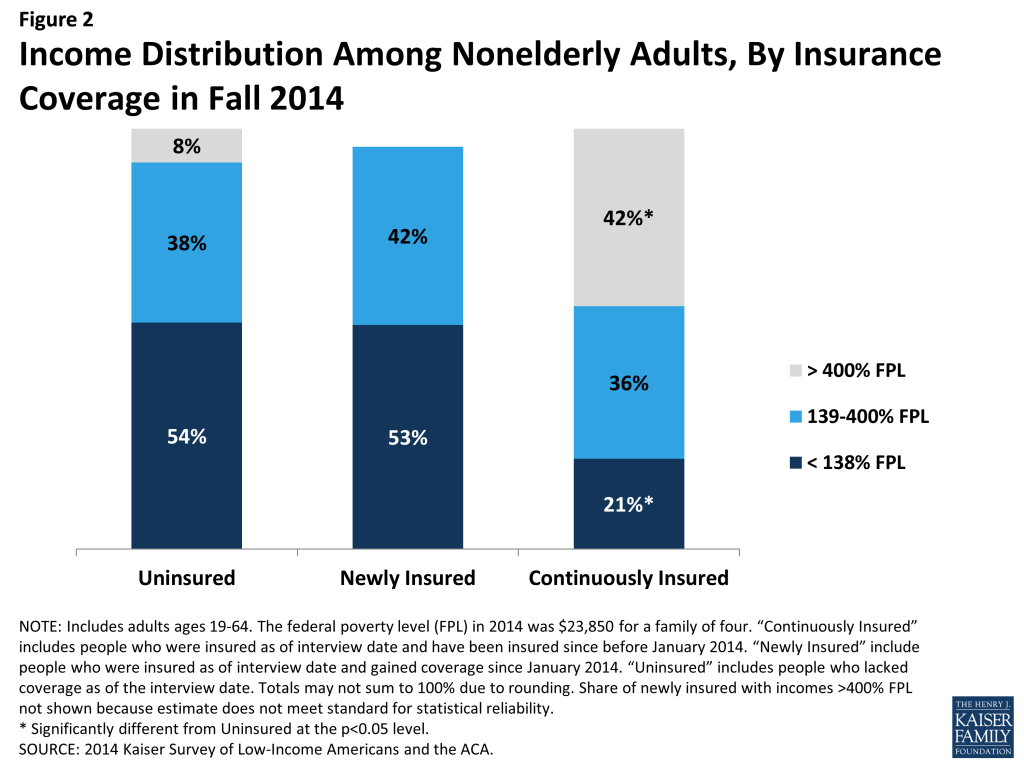
More than half of the remaining uninsured population has family income at or below 138% of poverty, the income range for the Medicaid expansion. More than half of uninsured adults (54%) have family incomes at or below 138% of poverty, or $32,913 for a family of four (Figure 2). Nearly one in four (38%) has family incomes in the range for tax credits (139 to 400% of poverty). This distribution is similar to the newly-insured population. In contrast, the continuously insured population is significantly less likely than either the uninsured or newly insured to be low-income and significantly more likely to be higher income (greater than 400% of poverty). This pattern reflects the longstanding association between having low income and lacking health coverage. Provisions in the ACA aim to make coverage more affordable for low and middle income families.
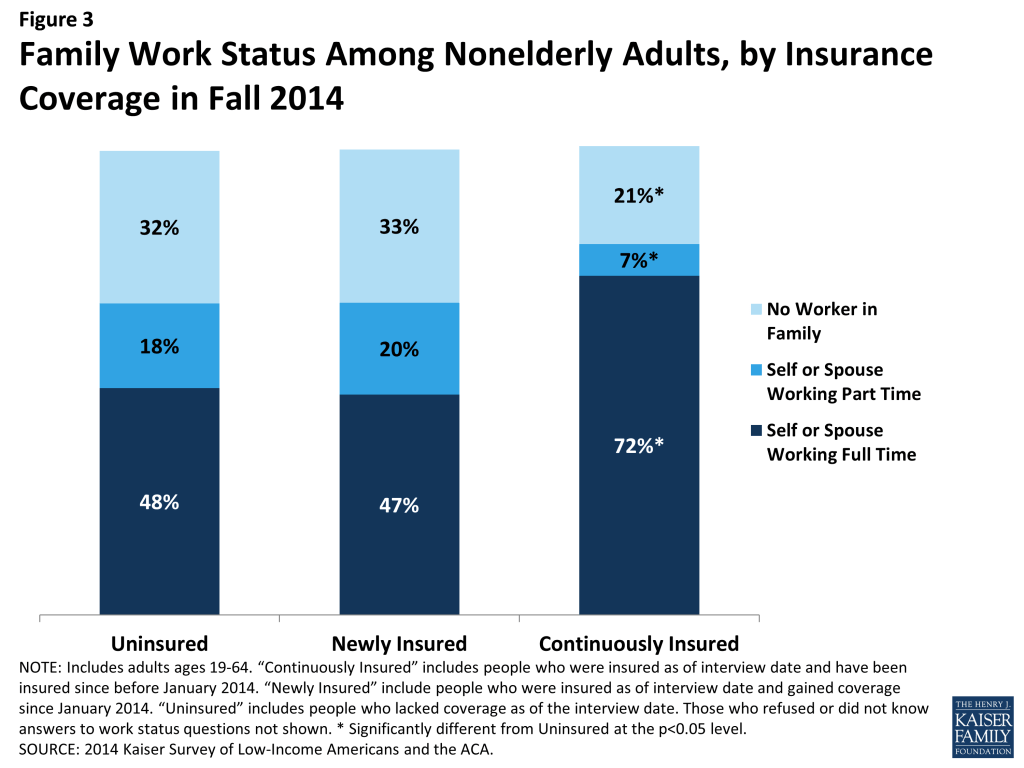
A majority of the remaining uninsured are in a family with at least one worker. Two-thirds of uninsured adults are in a family in which either they or their spouse is working (Figure 3). Nearly half (48%) are in a family with a full-time worker. This distribution is similar to that among the newly-insured population; however, those who have been continuously insured since before 2014 are significantly more likely to be in a family with a full-time or part-time worker. This pattern reflects the historical ties between work and health insurance, since most people who had coverage before the ACA obtained that coverage through a job.
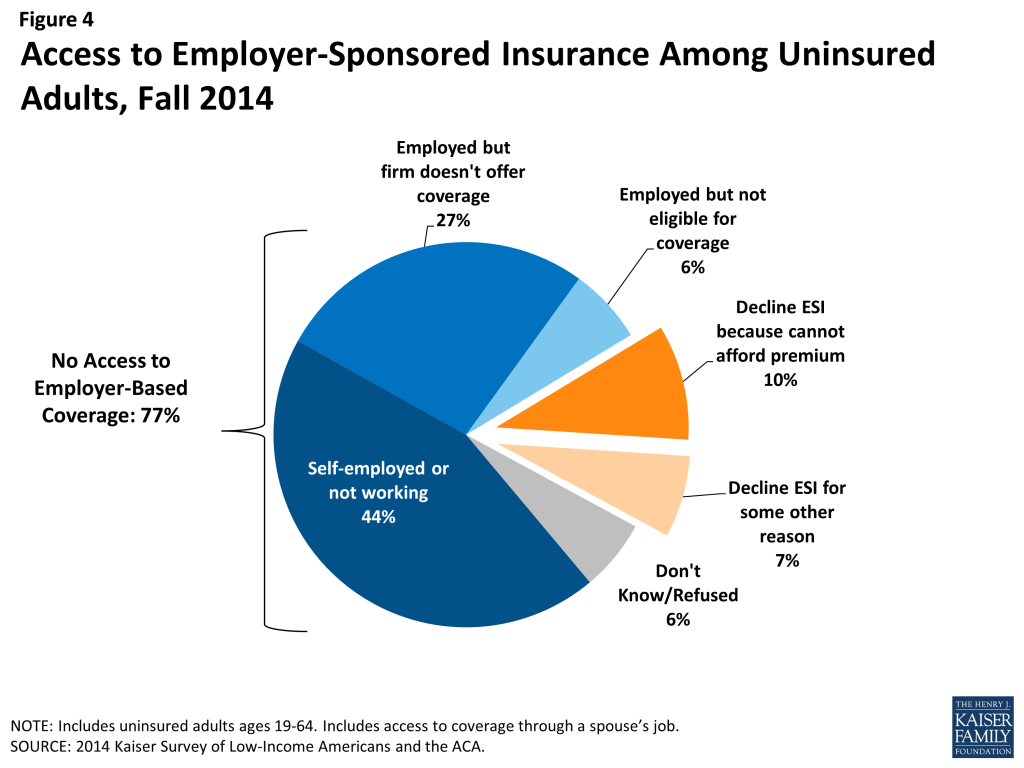
Access to employer-based coverage is limited among uninsured adults. Very few uninsured adults have access to coverage through their or a spouse’s job, either because they are self-employed or not in a working family (44%), or because their employer does not offer coverage (27%) or coverage for which they are eligible (6%) (Figure 4). Some uninsured adults do have access to coverage through their or a spouse’s job, but most who do report that this coverage in unaffordable to them. Many uninsured adults work for an employer who will not be required to offer coverage under the ACA because they have fewer than 50 workers. With new coverage provisions in place as of 2014, there were more options for health insurance outside employment, particularly for people in states that expanded Medicaid.
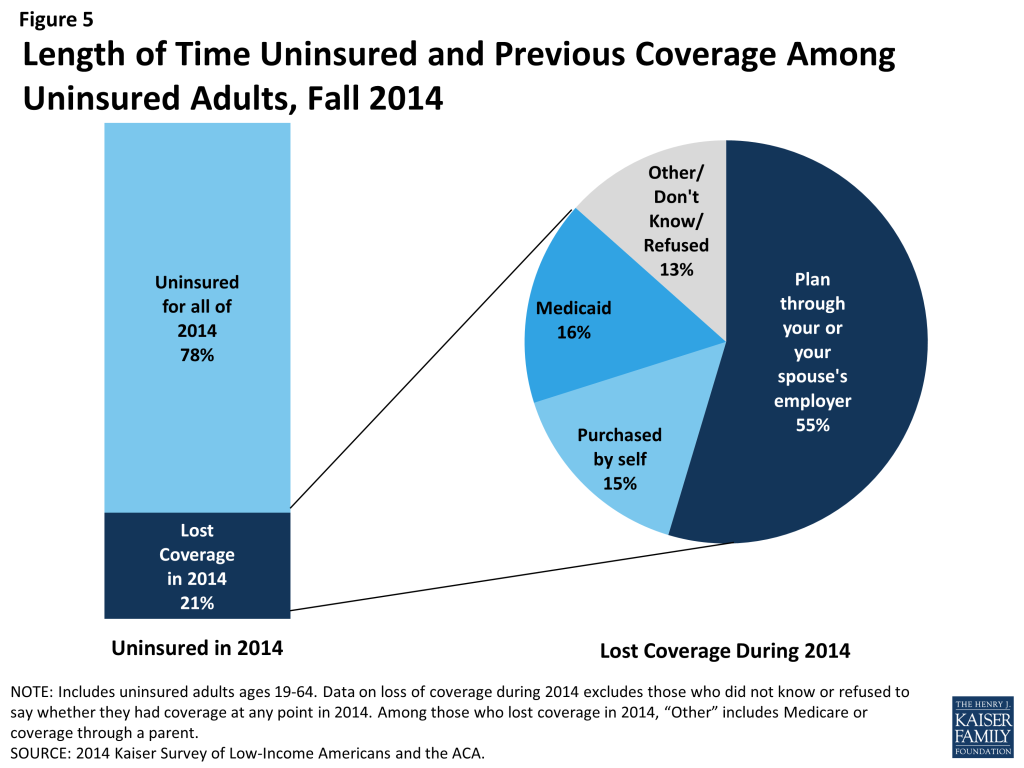
Coverage transitions remain a challenge to continuous coverage. As in the past, lack of coverage remains a long-term issue for most: nearly eight in ten uninsured adults report that they had lacked coverage for all of 2014. However, about one in five actually had coverage at some point in 2014 but lost that coverage (Figure 5). This pattern is similar to that seen in the past: millions of people gain, lose, or change their health coverage throughout the year, and for some, these transitions lead to spells of uninsurance. As in the past, most who lost coverage in 2014 indicated that they lost employer-based coverage. One in six who lost coverage in 2014 reported that they lost Medicaid, and about the same share reported that they lost non-group coverage. As adopted, the ACA envisioned a continuum of coverage with various coverage options available as people’s circumstances changed (such as job loss or income change). However, coverage transitions remain a challenge for some.
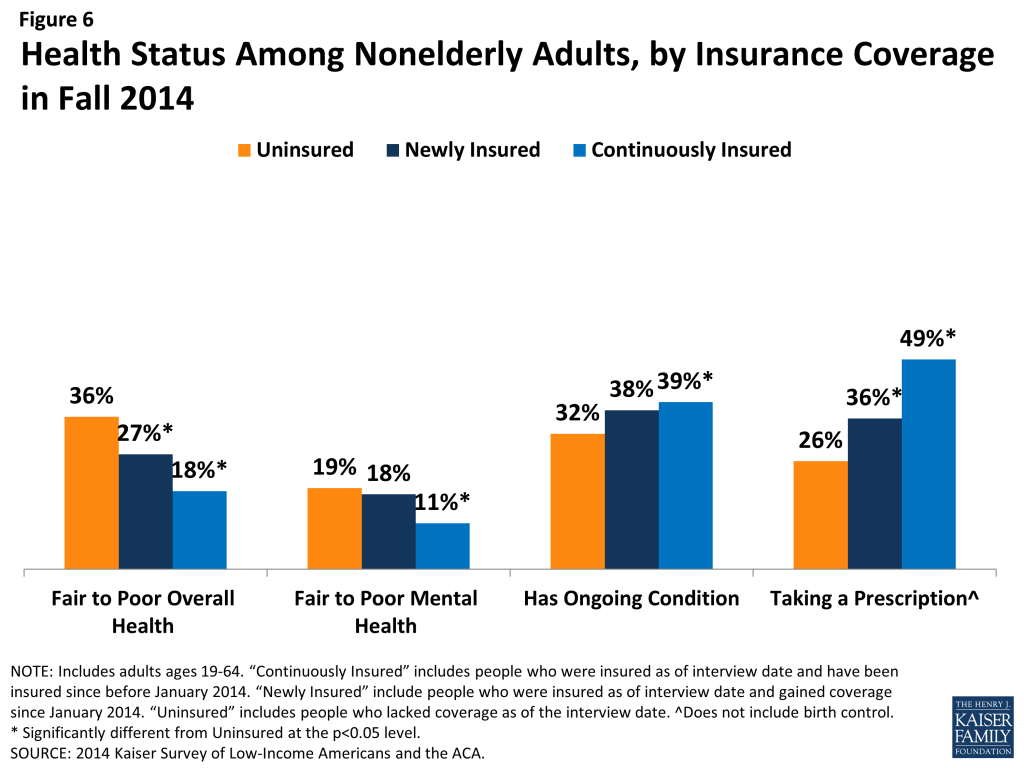
Uninsured adults are more likely than those with coverage to say their health is fair or poor but are less likely to have a diagnosed medical condition. More than a third of uninsured adults (36%) rate their overall health as fair or poor, a higher share than the newly-insured or continuously insured (Figure 6). Nearly a fifth (19%) report their mental health is fair or poor, a share about equal to the newly insured but higher than the continuously insured. These findings refute the idea that those who have coverage are more likely to be in poor health or feel they need medical services. However, those who have coverage are more likely than the remaining uninsured to report being under care for a chronic condition. Adults who are continuously insured are more likely than the uninsured to say that they have an ongoing medical condition that requires regular care. Similarly, both the newly insured and continuously insured are more likely than the uninsured to say they take a prescription on a regular basis. These patterns may reflect the fact that uninsured individuals are more likely than insured to have undiagnosed illnesses,2 and people with insurance coverage are more likely to receive regular and specialty care.3
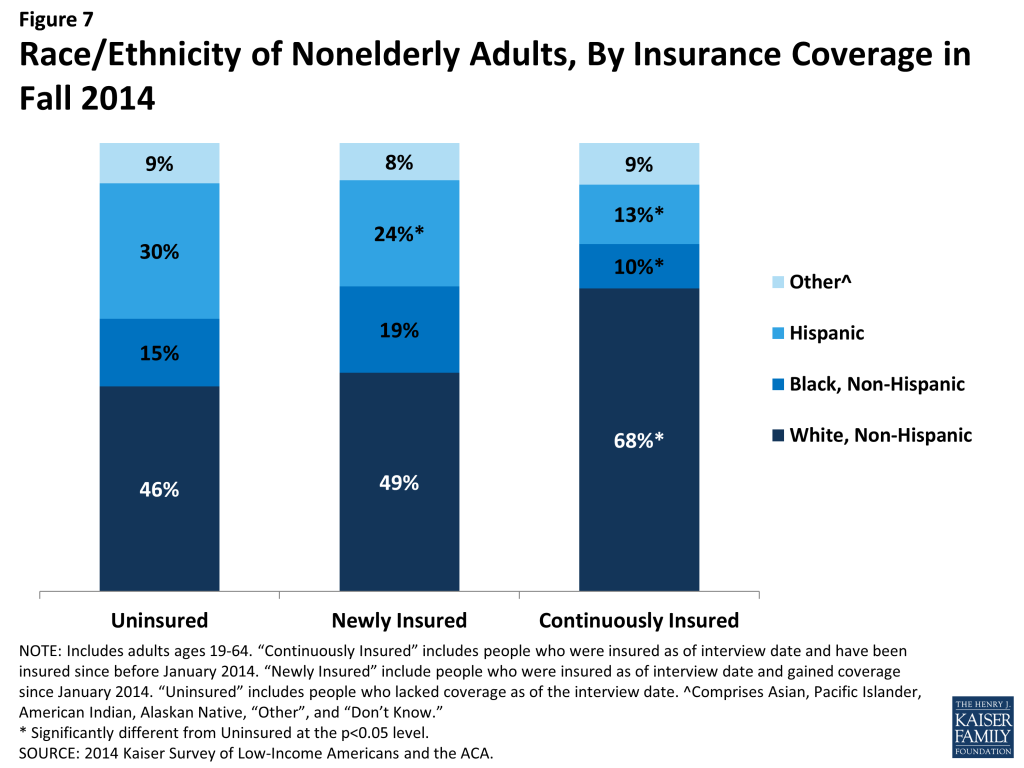
Hispanics are disproportionately represented among the remaining uninsured population. Reflecting historical patterns of the uninsured being more likely to be people of color than the insured, the remaining uninsured and the newly insured are both less likely than the continuously insured to be White, Non-Hispanic (Figure 7). However, the remaining uninsured population is more likely to be Hispanic than either the newly insured or continuously insured population: 30% of the remaining uninsured population is Hispanic, a share significantly higher than among the newly insured or continuously insured. This pattern likely reflects a combination of factors, including language barriers, immigration barriers, and work status.
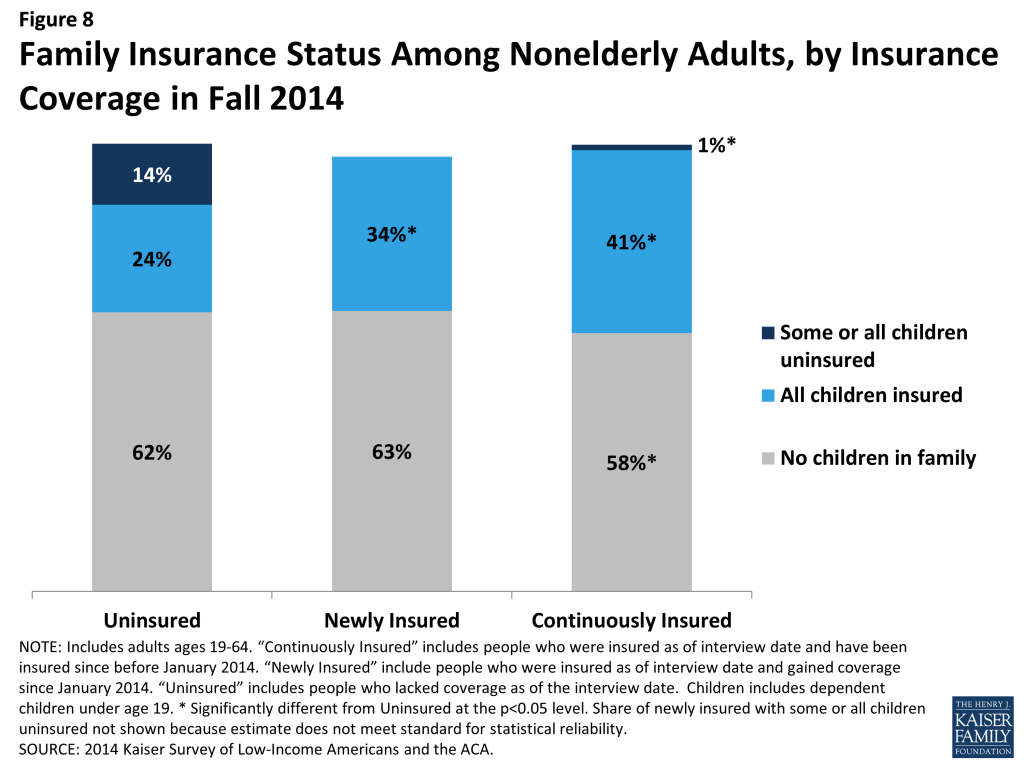
Adults who remain uninsured are more likely than those with coverage to have uninsured children. The majority of uninsured children are eligible for coverage under the ACA: Medicaid and the Children’s Health Insurance Program (CHIP) are available to most children in low-income families, and children may be covered along with their parents in Marketplace coverage. Research has found that parent coverage in public programs is associated with higher enrollment of eligible children.4 Coverage patterns in 2014 support this finding: While uninsured adults are as likely as the newly insured to be parents, they are much more likely to have a child who lacks insurance coverage than the newly insured (Figure 8). Among continuously insured adults, a smaller share are parents, but among those who do have children nearly all have children with insurance coverage.
Connecting the Eligible Uninsured to Coverage
Though much attention was paid to the difficulties with the application and enrollment process during the 2014 open enrollment period, logistical issues in applying for coverage do not appear to be a leading reason why people went without insurance in 2014. Rather, lack of awareness of new coverage options and financial assistance appear to be a major barrier. In addition, gaps in eligibility or confusion about eligibility are evident among the remaining uninsured. As of Fall 2014, uninsured adults were largely uncertain about whether they will seek coverage in 2015 or where they will get it, and only a small share of those eligible say they plan to seek ACA coverage.
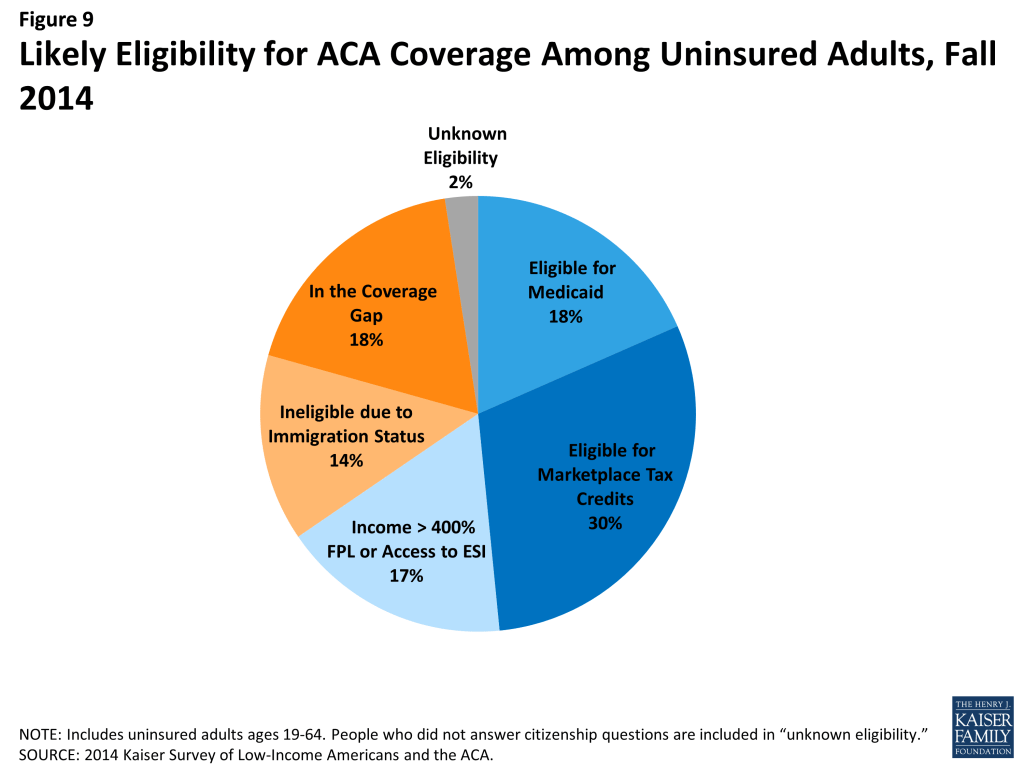
About half of adults who remained uninsured at the end of 2014 are likely eligible for assistance under the ACA. Based on family income, state of residence, citizenship status, parent status, and access to employer coverage, analysis indicates that 48% of uninsured adults may be eligible for Medicaid coverage (18%) or premium tax credits to purchase Marketplace coverage (30%) (Figure 9). Still, many adults are likely ineligible based on their immigration status (14%) or because they live in a state that has not expanded Medicaid and fall into the “coverage gap” (18%). The remainder either has incomes above the range for premium tax credits (but could still purchase unsubsidized coverage through the Marketplace) or has access to employer-based coverage.
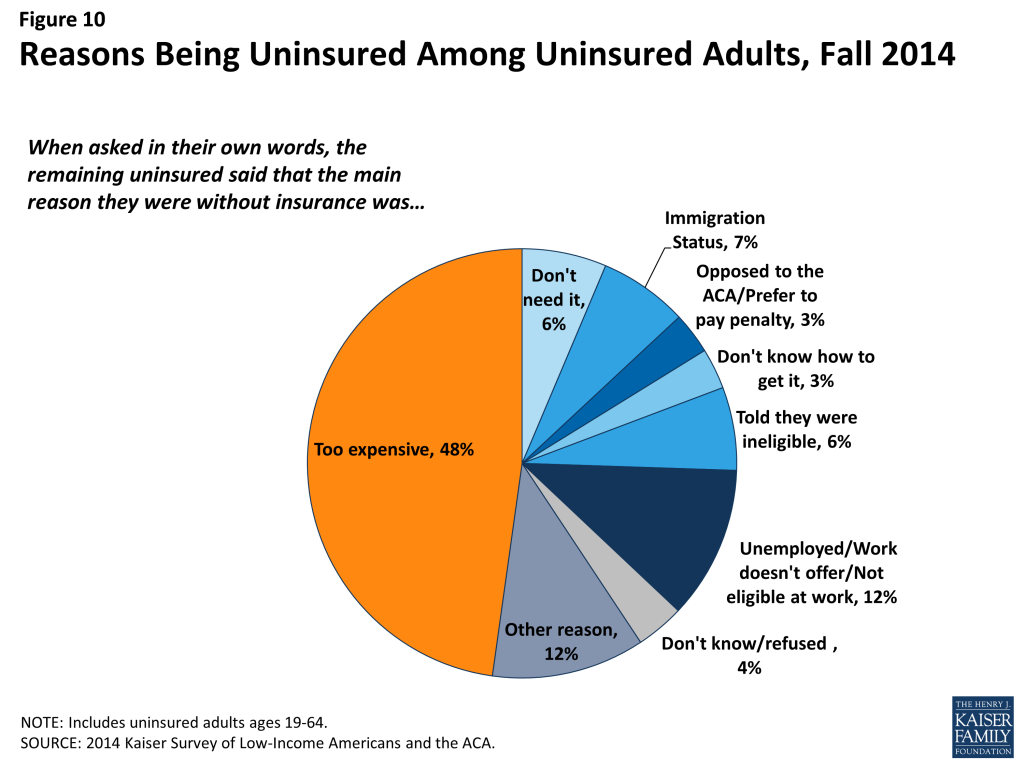
Cost remains a major barrier to coverage. While the ACA aimed to make coverage for affordable, for many—particularly those in non-expansion states—the cost of coverage still poses a problem. The main reason that adults say they lack coverage is cost, with nearly half (48%) of the uninsured saying that they are uninsured because coverage is too expensive (Figure 10). Many also cite limitations on eligibility for coverage, such as immigration status (7%) or being told they are ineligible (6%). A very small share (3%) says they are uninsured because they are either opposed to the ACA or prefer to pay the penalty. Notably, compared to the uninsured before the ACA, uninsured adults in Fall 2014 were less likely to name job-related barriers as a reason for lacking coverage: 12% of uninsured adults named a job-related reason for lacking coverage in 2014, compared to 32% in 2013 (data not shown).
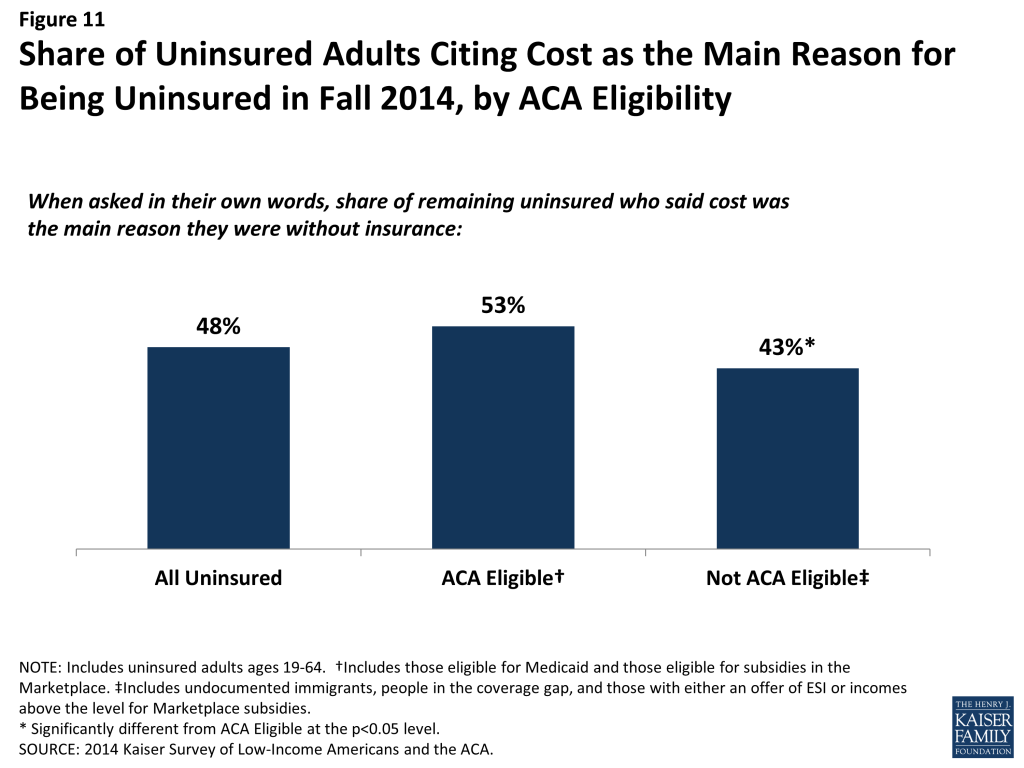
Despite the availability of low-cost or zero premium coverage, a majority of eligible adults still perceive insurance to be too expensive. When asked why they lacked insurance coverage, more than half of adults who appear to be eligible for assistance volunteered that coverage was too expensive (Figure 11). Under the ACA, most of these individuals are eligible for either free or subsidized (through Medicaid or Marketplace subsidies) coverage. Most who cited cost as a reason for not having coverage did not seek ACA coverage (discussed in more detail below), indicating that the availability of financial assistance to offset the cost of coverage is not getting through to them. A smaller share of people who are not eligible for help under the ACA cited cost as a reason for being uninsured; people in this group were more likely to cite other reasons as the main reason for being uninsured, such as ineligibility due to immigration status.
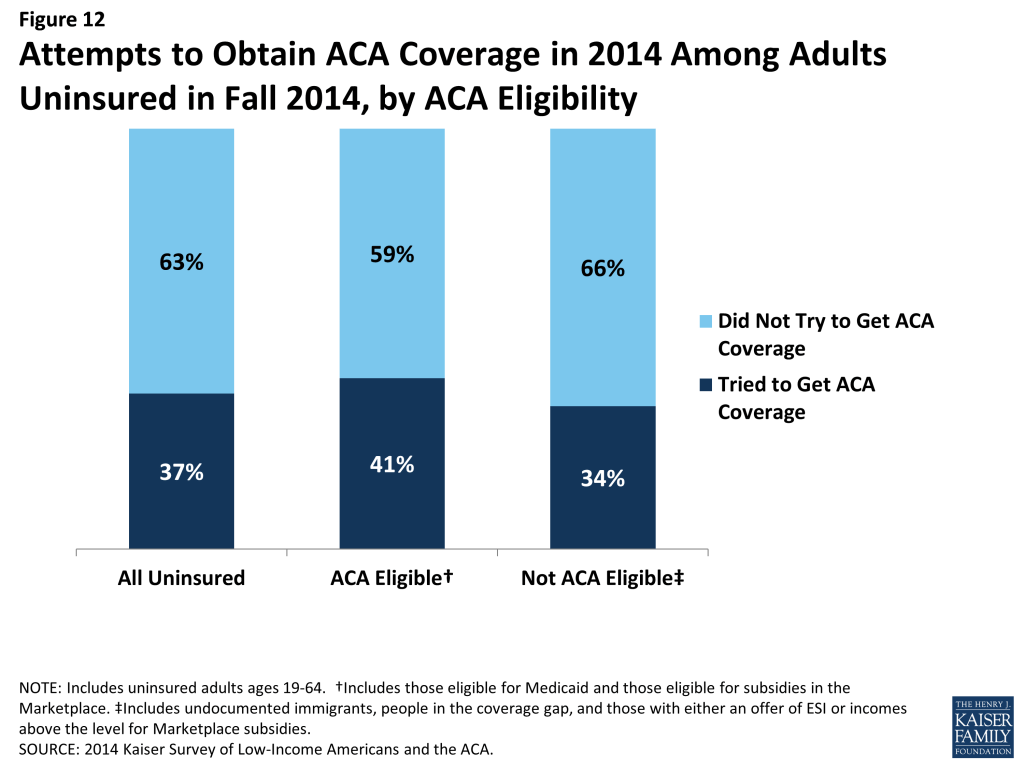
Most adults who were uninsured in Fall 2014 had not tried to get ACA coverage. Nearly two-thirds (63%) of uninsured adults did not try to get coverage from either their state Medicaid program, their state’s health care Marketplace or Healthcare.gov (Figure 12). This share does not vary significantly by whether the adult appears to be eligible for financial help through Medicaid or the Marketplace.
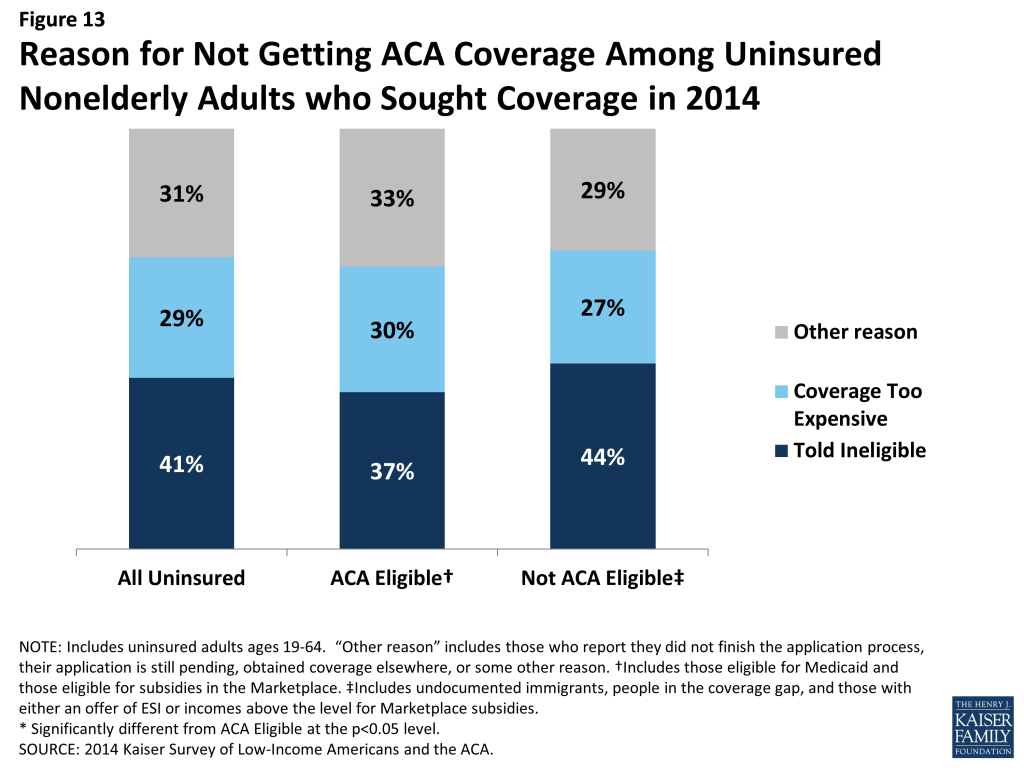
Gaps in eligibility or confusion about eligibility are evident among the uninsured who sought ACA coverage. Among those who did try to get ACA coverage, the most common reason people gave for not having ACA coverage was that they were told they were ineligible (41%) (Figure 13). This pattern holds among those who appear eligible for financial help under the ACA and those who do not. Of particular note is that many (37%) people who say they sought ACA coverage in 2014 and appear to be eligible for some type of assistance as of the time of the survey say they were told they were ineligible when they applied for ACA coverage. It is possible that these people were ineligible at the time they applied and have subsequently become eligible. However, this situation is unlikely in expansion states, which provide ACA options across the income spectrum. These individuals may have been told they were ineligible for a certain type of ACA coverage and not another, or they may have received misinformation or misinterpreted information. It is not surprising that many (44%) who sought coverage but appear to be ineligible for Marketplace or Medicaid coverage as of the time of the survey also say they were told they were ineligible when they applied. People who appear ineligible also cited other reasons for not having coverage, including cost (since they would have faced the full cost of coverage), having a pending application (and thus not yet being told they are ineligible), finding other coverage (that they subsequently lost), or never completing the application process.
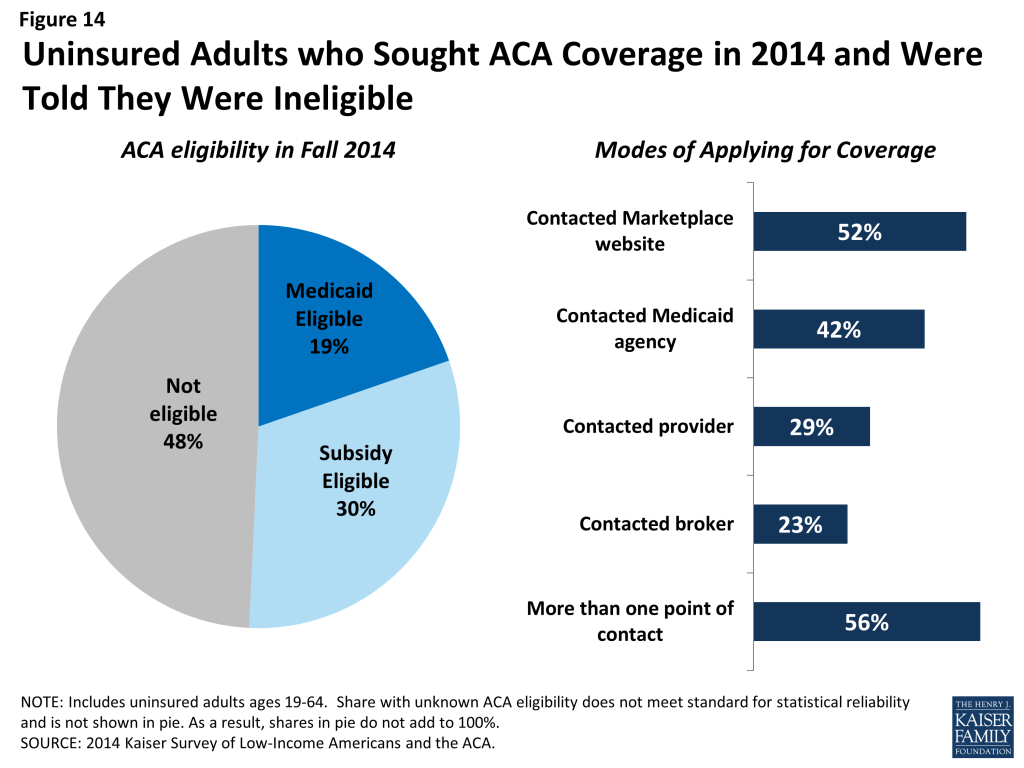
Looking at just the group of uninsured adults that sought ACA coverage and were told they were ineligible, about half appear to be eligible for Medicaid or Marketplace subsidies as of the time of the survey (Figure 14). As discussed above, there are several possible reasons why they may say they were told they are ineligible. Notably, many report that they had direct contact with either their state Marketplace/ healthcare.gov or their state Medicaid agency, and more than half say they tried more than one mode of applying.
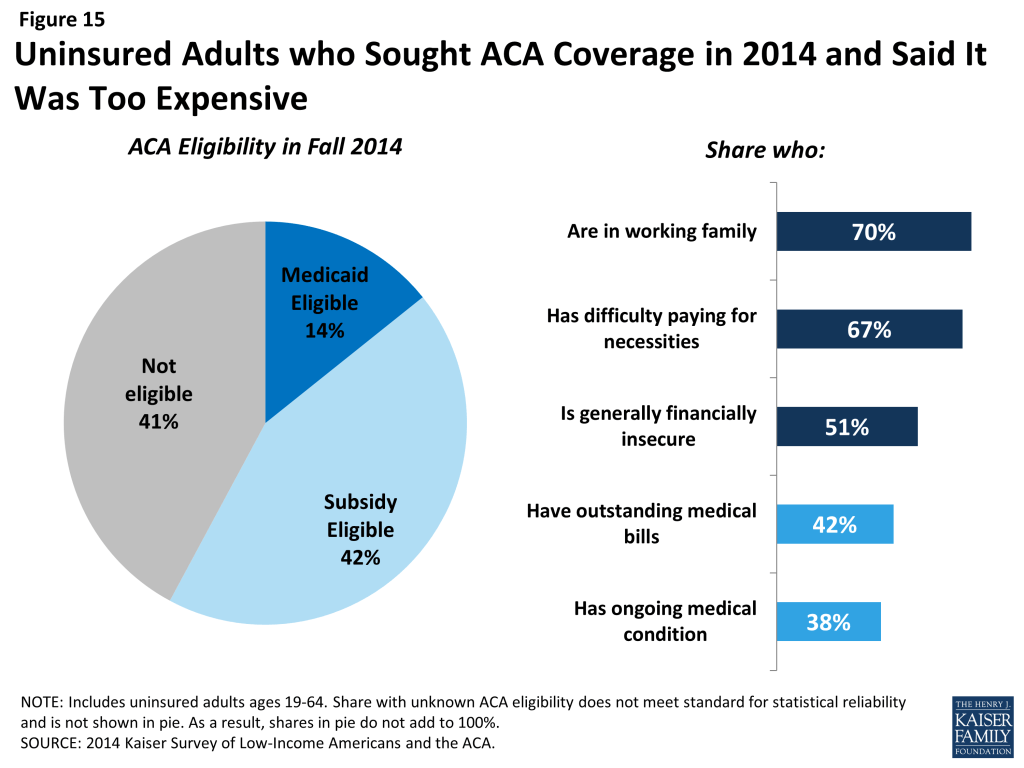
Many uninsured adults who applied for ACA coverage say the coverage offered was unaffordable. Nearly three in ten (29%) uninsured adults who sought ACA coverage said they did not enroll because the coverage was too expensive (Figure 13, previous page). Among those who cited cost as a reason for not having ACA coverage, four in ten were ineligible (41%) for financial assistance under the law. These individuals would face the full cost of coverage in the Marketplace and likely found unsubsidized coverage unaffordable. However, 42% of those who said they did not obtain ACA coverage due to cost appear to be eligible for Marketplace subsidies (Figure 15). Marketplace subsidies are based on income, with those at the lower end of the income spectrum receiving larger subsidies. Still, some people may find the share they were asked to pay too costly to take up the coverage. A small share of those who said the coverage was too costly appear to be eligible for Medicaid, even though only a handful of states charge premiums to adults in Medicaid.5 These people may have shopped for Marketplace coverage and perceive it to be too costly, they may have received incorrect or misinterpreted information on Medicaid coverage, or their eligibility may have changed between the time they sought coverage and completed the survey. When looking at the characteristics of people who cited cost, it is clear that many have precarious financial situations and many face medical expenses (Figure 15). Thus, efforts to provide accurate information to these individuals about the availability of low-cost coverage to help with medical expenses may lead them to enroll.
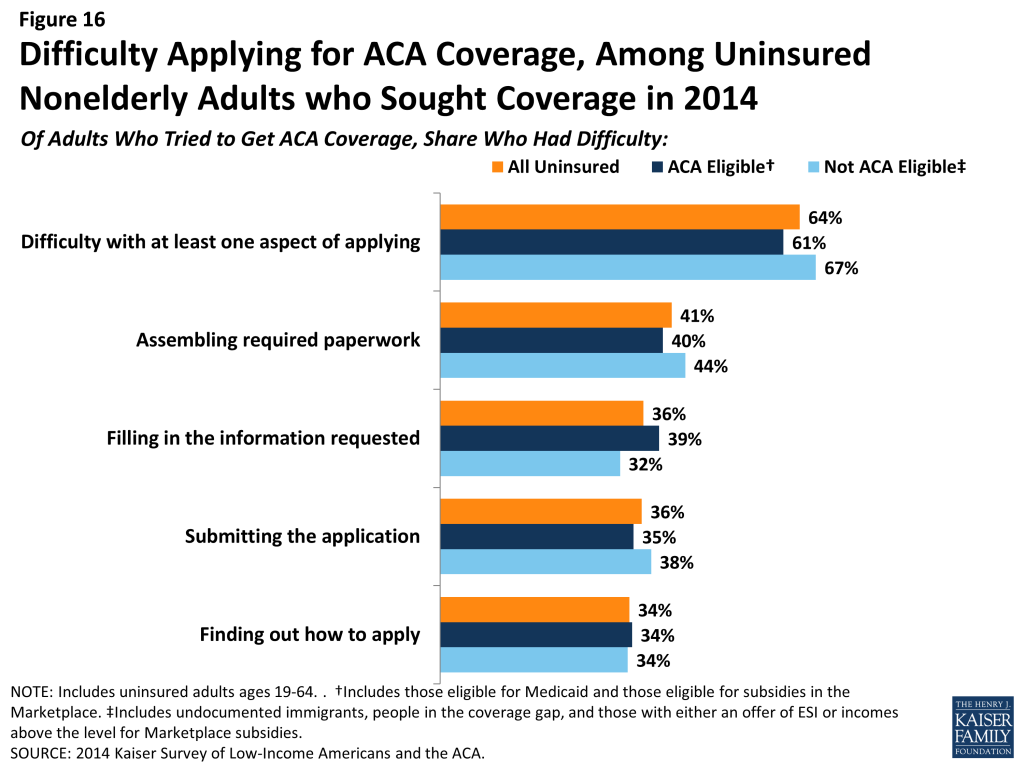
While most uninsured adults did not cite application problems as the main reason for not enrolling in ACA coverage, many did encounter difficulties with the application process. Compared to reasons of ineligibility or cost, smaller shares said that they didn’t get coverage due to problems with the application process, such as still having a pending application (12%) or not completing the application process (8%) (data not shown). Still, when asked directly about their experience applying, most (64%) did say they found at least one aspect of the application process difficult (Figure 16). No single aspect stands out as the most difficult: more than one in four (41%) reported difficulty assembling the required paperwork, and more than a third reported difficulty filling in the information requested (36%), submitting the application (36%), or finding out how to apply (34%). There were no statistically significant differences in rates of difficulty between those who appear to be eligible or ineligible for assistance under the ACA.
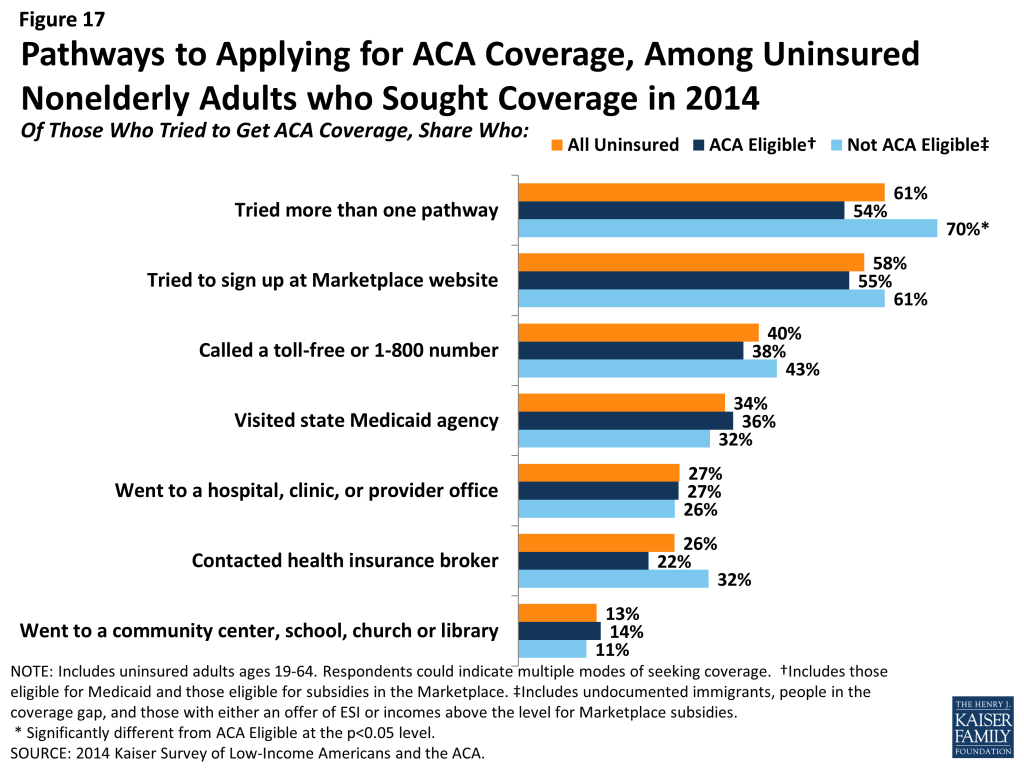
Among those who tried to get ACA coverage, most reported trying multiple avenues, and most tried to get coverage directly from the state or federal government. While the ACA envisioned a streamlined, “no wrong door” application and enrollment process, most uninsured adults who sought ACA coverage in 2014 said they pursued multiple pathways to coverage. More than six in ten (61%) tried more than one pathway, and those who appear to be ineligible were more likely to try multiple pathways (Figure 17). The most common ways that the uninsured who sought ACA coverage did so was by contacting their state marketplace or healthcare.gov (58%). Four in ten reported that they called a toll-free number to get help, more than a third (34%) visited their state Medicaid agency. While many uninsured adults pursued other avenues for getting coverage—such as going to a provider for help (27%) or contacting a health insurance broker (26%)—much smaller shares indicated that they went community agencies, schools, churches, or libraries (13%).
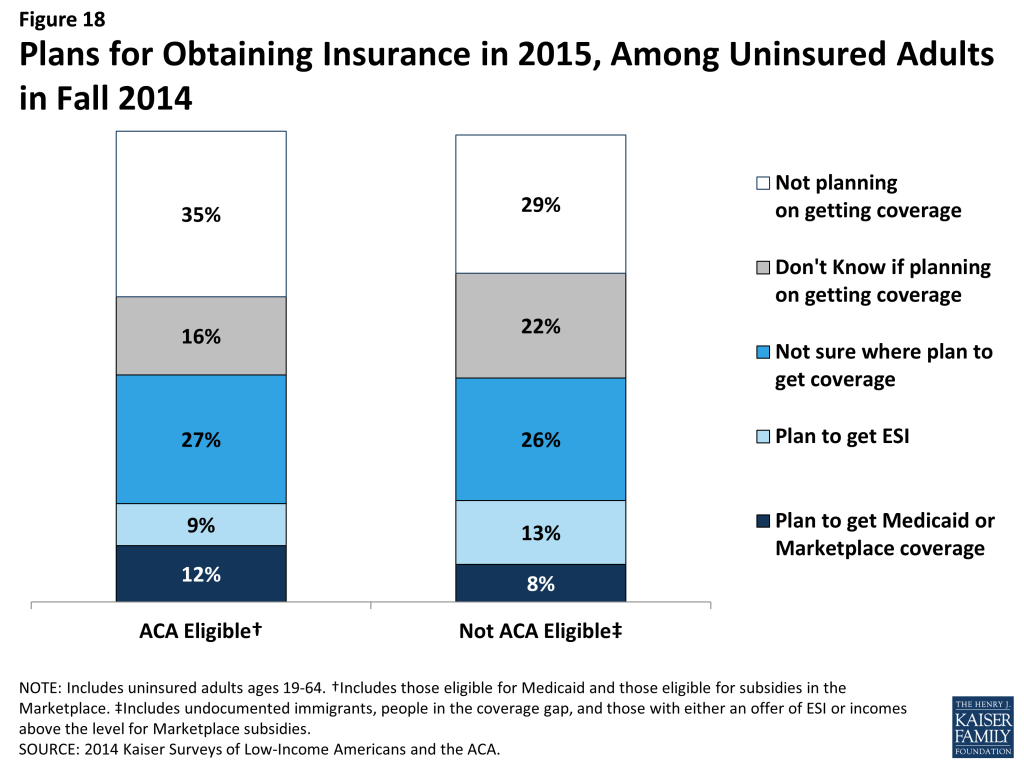
Even among those likely eligible, few uninsured adults have plans to obtain ACA coverage. Only about half of uninsured adults who appear to be eligible for help under the ACA indicate that they plan to get coverage in 2015, and few who do plan to get coverage identified Medicaid or Marketplace coverage as their goal (Figure 18). Rather, higher shares indicate that they will get coverage elsewhere, don’t know where they will get coverage, or plan to get coverage through a job. Further, some who do not appear to be eligible for assistance indicate that they plan to get Medicaid or Marketplace coverage.
Policy Implications
As the first year of new coverage under the ACA comes to a close and the end of the second open enrollment period nears, there is great interest in understanding why some people continue to lack coverage and in reaching out to the eligible uninsured. Findings from the 2014 Kaiser Survey of Low-Income Americans and the ACA provide key lessons for ongoing efforts to extend health coverage in the United States.
Despite the availability of low-cost or free coverage, perceptions of cost or lack of awareness of assistance are barriers to reaching some eligible uninsured. When asked in their own words, uninsured adults were most likely to name cost as the main reason they don’t have coverage, and this pattern held even among those who appear to be currently eligible for low-cost or free coverage under the ACA. In addition, most eligible uninsured adults say that they did not try to get health insurance from either their state Marketplace, healthcare.gov, or their state Medicaid agency in 2014, and few indicated plans to obtain ACA coverage in 2015. Ongoing efforts to inform the eligible uninsured of new options for low-cost coverage will be essential to continuing the decline in the number of uninsured Americans.
While ACA application problems were not a leading reason why people went without coverage, many uninsured adults reported difficulty applying. Nearly two-thirds of uninsured adults who sought ACA coverage said they had some difficulty with finding out how to apply, filling in the information, assembling the paperwork, or submitting the application. While the ACA envisioned a streamlined, “no wrong door” application and enrollment process, most people who sought ACA coverage in 2014 said they pursued multiple pathways to coverage. There was much attention to application difficulties in 2014, many of which have been addressed for 2015 open enrollment. However, people who had difficulty applying may be less likely to seek coverage again.
Many who applied for ACA assistance still found the coverage unaffordable. While it is not surprising that people ineligible for financial assistance said coverage was too costly, many who do appear eligible still said the coverage was too expensive. While premium subsidies are based on a sliding scale, it appears that many still find the coverage unaffordable. It is unclear whether people felt the premiums were unaffordable or whether they felt that the coverage as a whole—including premiums, deductibles, and cost sharing—was unaffordable. Additional work is needed to understand whether affordability provisions in the ACA are sufficient to enable lower-income people to take up coverage.
Gaps in eligibility and complex eligibility rules may prevent many uninsured adults from gaining coverage. About half of remaining uninsured adults do not appear to be eligible for financial assistance under the ACA, either because of their immigration status, because their state did not expand Medicaid, or because they have an offer of ESI or incomes above the limit for premium subsidies, and many remaining uninsured are working for firms that will not be required to offer coverage under the ACA because they have fewer than 50 workers. However, even among those who are eligible for ACA coverage, many say they were told they were ineligible. It is unclear whether these individuals were ineligible at the time they applied, received wrong information, misinterpreted information, or only sought one type of ACA coverage. However, it is likely that complex eligibility rules for different types of assistance contributed to confusion over eligibility. In addition, while the ACA envisioned a continuum of coverage with various coverage options available as people’s circumstances changed (such as job loss or income change), one in five uninsured adults actually lost coverage in 2014. Some of these people fall into eligibility gaps, and some were eligible but did not obtain ACA coverage. Thus, coverage transitions remain a challenge to keeping coverage.
Appendix
2014 Kaiser Survey of Low-Income Americans and the ACA: Methods
The 2014 Kaiser Survey of Low-Income Americans and the ACA, conducted by the Kaiser Family Foundation (KFF) in Fall 2014, examines health insurance coverage, health care use and barriers to care, and financial security among insured and uninsured adults across the income spectrum, with a focus on populations targeted for coverage expansions under the Affordable Care Act (ACA). The survey captures experiences a year after open enrollment began for health coverage through the ACA and builds on a similar baseline survey conducted in summer 2013.6 The 2014 survey includes a national sample as well as two state-specific samples in California (conducted with support from the Blue Shield of California Foundation (BSCF)) and Missouri (conducted with support from the Missouri Foundation for Health (MFH)). Costs for the national survey were paid by KFF.
The survey was designed and analyzed by researchers at KFF, with feedback on the California and Missouri state-specific components from BSCF and MFH, respectively. Social Science Research Solutions (SSRS) collaborated with KFF researchers on sample design and weighting; SSRS also supervised the fieldwork.
The survey was conducted by telephone from September 2 through December 15, 2014 from representative random samples of California and Missouri residents between the ages of 19-64, along with respondents from the remaining 48 states and the District of Columbia. In total, 10,502 interviews were completed; of these, 4,555 were with respondents living in California, 1,864 with respondents in Missouri, and 4,083 with respondents from other states. Computer-assisted telephone interviews (CATI) conducted by landline (5,105) and cell phone (5,397) were carried out in English and Spanish by SSRS.
The study was designed to oversample lower- and middle-income populations in order to have more statistical power in describing the views and experiences of these groups. To efficiently reach lower-income respondents, the sample in each state was stratified based on the estimated income level of geographic areas within California and Missouri as well as within the remaining states. This process was done separately for the landline and cell phone sampling frames. For the landline sample, strata were defined based on the median income within telephone exchanges; for the cell phone sample, strata were defined based on the household income associated with the billing rate-center to which the cell phone number is linked. The exact criteria for distinguishing between the strata in the cell phone sample varied from state to state. In addition, 481 interviews (217 on landline and 264 on cell phone) were conducted with respondents who were previously interviewed by SSRS as part of omnibus surveys of the general public and indicated they were ages 19-64, resided in the appropriate geography for the sample (if part of one of the state samples), and reported annual income of less than $25,000. These previous surveys were conducted with nationally representative, random-digit-dial landline and cell phone samples. Landline and cell phone samples were provided by Marketing Systems Group.
Screening for the survey involved verifying that the respondent (or another member of the household for the landline sample) met the criteria of: 1) being 19-64 years old; and 2) providing income information that allowed them to be classified by family income. People who did not know or refused to report their income or family size were excluded from the survey. Respondents were classified by family income as a share of the federal poverty level (FPL) based on their family size and total annual gross income.7 Poverty level groups included income < 138% of FPL (the income range for the Medicaid expansion), income of 139-400% FPL (the income range for Marketplace tax credits), and income above 400% of FPL (eligible only for unsubsidized coverage). For the landline sample, if two or more people met the criteria, a respondent was randomly selected by the CATI program. Selected respondents were asked to confirm their state of residence.
A multi-stage weighting approach was applied to ensure an accurate representation of the various income groups ages 19 to 64. The weighting process involved corrections for sample design as well as sample weighting to match known demographics of the target populations in order to correct for systematic non-response along these parameters. The base weight accounted for the oversamples used in the sample design, as well as the likelihood of non-response for the re-contact sample, number of eligible household members for the landline sample, and a correction to account for the fact that respondents with both a landline and cell phone have a higher probability of selection. Demographic weighting parameters were based on population estimates for the 19-64 year old poverty-level population in each state based on the U.S. Census Bureau’s 2013 American Community Survey (ACS). The weighting parameters for each poverty-level group within the two state-specific samples and the remaining national sample were: age, education, race/ethnicity, presence of own child in the household, marital status, and region. All statistical tests of significance account for the effect of weighting.
The margin of sampling error (including the design effect) for national estimates, state estimates and state-by-poverty-level estimates are shown in Table A. For the national sample, the margin of sampling error is plus or minus 2 percentage points for both the low- and moderate-income groups. For the remaining uninsured, the margin of sampling error is plus or minus 4 percentage points. For results based on other subgroups, the margin of sampling error may be higher. Sample sizes and margin of sampling errors for other subgroups are available by request. In reporting results, any estimate with a relative standard error (standard error divided by the point estimate) greater than 30 percent or based on a sample less than 100 is considered unreliable and not reported. Note that sampling error is only one of many potential sources of error in this or any other survey.
In analyzing results, we often categorize respondents according to insurance coverage or eligibility for insurance coverage. We classify anyone who indicated that they did not have any form of health insurance or health plan at the time of the interview as “Uninsured.” People who indicate coverage through their own employer, a spouse’s employer, or a parent’s employer are classified as having employer coverage. People who indicate Medicaid coverage, either alone or in conjunction with Medicare, are classified as having Medicaid. People who indicate that they purchased their coverage through their state Marketplace or healthcare.gov are classified as having Marketplace coverage. People who indicate that they purchase their coverage directly from an insurance company but did not purchase coverage through their state Marketplace or healthcare.gov are classified as “Private Nongroup.” People with other sources of coverage, including Medicare, VA, school-based coverage, or an unidentifiable source are classified as “Other.” In asking about both Medicaid and Marketplace coverage, state-specific program names were used, corresponding to the respondent’s state of residence. In some cases, we recoded coverage type based on verbatim responses, other information in the survey, or call backs to confirm type of coverage.
We use information on when coverage began to classify people into categories of “newly insured” or “continuously insured.” Newly insured individuals are those who indicate that they have insurance coverage, that their coverage started on or after January 2014, and that they were uninsured before that coverage started. Continuously insured people are those who indicate that they have insurance coverage and had insurance coverage since before January 2014.
Last, we assess uninsured respondents’ likely eligibility for coverage under the ACA based on family income as a share of poverty, state of residence, immigration status and length of time in the United States, parent status, and availability of coverage through an employer. We define undocumented immigrants as those who reported 1) they were born outside the United States, 2) are not a citizen, 3) did not have a green card when they arrived in the United States, and 4) have not received a green card or become a permanent resident since arriving. This measure may be subject to error in several ways. First, it relies on self-reporting, and respondents have an incentive not to reveal unlawful immigration status. Second, those that did not answer all questions in the series of immigration status items (84 respondents) were not able to be categorized as undocumented and were therefore included; if they are in fact undocumented, then the results may differ slightly. Third, a small number of people may have a legal status besides permanent residency or green card (such as refugees, asylees or other humanitarian immigrants). Unfortunately, due to time constraints, the survey was not able to fully explore all of these immigration pathways.
| Table A: Number of Respondents and Margin of Sampling Error for National and State-Specific Samples | ||
| N | Margin of Sampling Error | |
| U.S. Total | 10,502 | +/- 2 percentage points |
| U.S. ≤ 138% FPL | 4,295 | +/- 3 percentage points |
| U.S. 139%-400% FPL | 4,826 | +/- 3percentage points |
| U.S. >400% | 1,381 | +/- 4 percentage points |
| California Total | 4,555 | +/- 2 percentage points |
| CA ≤ 138% FPL | 2,044 | +/- 3 percentage points |
| CA 139% – 400% FPL | 2,003 | +/- 3 percentage points |
| CA >400% | 508 | +/- 5 percentage points |
| Missouri Total | 1,864 | +/- 3 percentage points |
| MO ≤ 138% FPL | 751 | +/- 5 percentage points |
| MO 139% – 400% FPL | 801 | +/- 5 percentage points |
| MO >400% | 312 | +/- 7 percentage points |
Endnotes
- Garfield, R. R. Licata, and K. Young. The Uninsured at the Starting Line: Findings from the 2013 Kaiser Survey of Low-Income Americans and the ACA. February 2014. Available at: https://modern.kff.org/uninsured/report/the-uninsured-at-the-starting-line-findings-from-the-2013-kaiser-survey-of-low-income-americans-and-the-aca/. ↩︎
- Wilper AP, Woolhandler S, Lasser KE, McComick D, Bor DH, Himmelstein DU. Hypertension, diabetes, and elevated cholesterol among insured and uninsured US adults. Health Affairs. 2009;28(6):w1151-9. ↩︎
- Coverage Matters: Insurance and Health Care, Committee on the Consequences of Uninsurance, Board on Health Care Services, Institute of Medicine, National Academy Press, 2001. ↩︎
- Sommers BD. “Insuring children or insuring families: do parental and sibling coverage lead to improved retention of children in Medicaid and CHIP?” J Health Econ. 2006 Nov;25(6):1154-69. Epub 2006 Jun 5. ↩︎
- Brooks, T., J. Touschner, S. Artiga, J. Stephens, and A. Gates. Modern Era Medicaid: Findings from a 50-State Survey of Eligibility, Enrollment, Renewal, and Cost-Sharing Policies in Medicaid and CHIP as of January 2015. January 2015. Available at: https://modern.kff.org/medicaid/report/modern-era-medicaid-findings-from-a-50-state-survey-of-eligibility-enrollment-renewal-and-cost-sharing-policies-in-medicaid-and-chip-as-of-january-2015/. ↩︎
- Garfield, R. R. Licata, and K. Young. The Uninsured at the Starting Line: Findings from the 2013 Kaiser Survey of Low-Income Americans and the ACA. February 2014. Available at: https://modern.kff.org/uninsured/report/the-uninsured-at-the-starting-line-findings-from-the-2013-kaiser-survey-of-low-income-americans-and-the-aca/. ↩︎
- In capturing family size, we include all members of the respondents’ immediate family, including themselves, spouse (if married), and any dependents, as well as parents if the respondent is a dependent. These groupings mimic “health insurance units” that are used to determine eligibility for Medicaid and Marketplace coverage. ↩︎