KFF designs, conducts and analyzes original public opinion and survey research on Americans’ attitudes, knowledge, and experiences with the health care system to help amplify the public’s voice in major national debates.
In his latest column for The Wall Street Journal‘s Think Tank, Drew Altman and guest co-author Dana Goldman examine hospital productivity gains, and what they may mean for hospitals’ ability to absorb spending reductions.
All previous columns by Drew Altman are available online.
In his latest column for The Wall Street Journal‘s Think Tank, Drew Altman examines the variation among states beneath the national Affordable Care Act’s Marketplace enrollment numbers released by the U.S. Department of Health and Human Services.
All previous columns by Drew Altman are available online.
In his latest column for The Wall Street Journal‘s Think Tank, Drew Altman discusses why high health care prices are a problem for consumers, but not a cause of renewed growth in health spending.
All previous columns by Drew Altman are available online.
Under the Affordable Care Act (ACA), Medicaid was intended to play a key role in efforts to reduce the number of uninsured by expanding eligibility to nearly all low income adults with incomes at or below 138% FPL ($16,242 per year for an individual in 2015), but the Supreme Court ruling on the ACA’s constitutionality effectively made the expansion a state option. As of February 2015, 29 states including DC have adopted the expansion and in upcoming months, a number of other states will be debating whether to implement the expansion as governors release budgets for state fiscal year 2016 and state legislatures convene. An estimated 14 million uninsured adults would meet the Medicaid eligibility requirements (based on income, immigration status, and age) if all states had implemented the Medicaid expansion. The estimated 14 million includes adults who were eligible but not enrolled under pre-ACA rules in all states, those made newly eligible in expansion states, and in non-expansion states those in the coverage gap and those with incomes between 100-138% FPL who may now have access to tax credits in the marketplace.One aspect of the uninsured population that could gain Medicaid coverage that is poorly understood is their attachment to the workforce. As additional states consider whether to implement the expansion, some have raised pursuing waiver authority to tie Medicaid eligibility for adults under the expansion to work requirements. This fact sheet profiles uninsured adults who could gain Medicaid coverage under the ACA by their relationship to the workforce and job-based coverage.
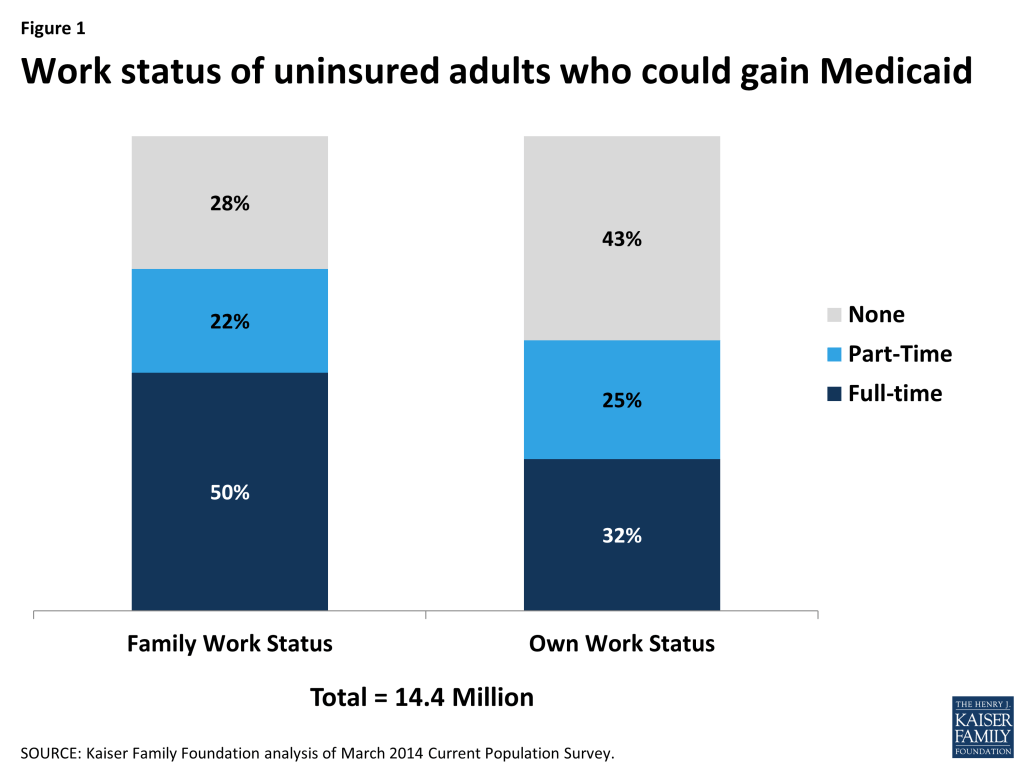
Most uninsured adults who could gain Medicaid coverage are already working or in a family with a worker. Nearly three out of four (72%) of the uninsured adults who could gain Medicaid coverage live in a family with at least one full-time or a part time worker and more than half (57%) are working full or part-time themselves. (Figure 1) Among the 14 million uninsured adults who could gain Medicaid coverage men and women are evenly split and older adults (ages 46-64) account for nearly one-third (32%). About half live in states that adopted the expansion and half in states not implementing the expansion. (Table 1)
Figure 1: Work status of uninsured adults who could gain Medicaid
Most working uninsured adults who would be eligible for Medicaid are employed by small firms or in industries with low ESI offer rates. Most uninsured adults who would be eligible for the Medicaid expansion work in firms and industries that often have limited employer-based coverage options. The majority of workers in this group (52%) work for small firms with less than 50 employees that will not be subject to ACA penalties for not offering coverage (Figure 2). Further, many firms do not offer coverage to part-time workers. A majority of workers targeted for the Medicaid expansion also work in industries with historically low insurance rates, such as the agriculture and service industries. Since the Medicaid expansion was designed to reach low-income adults left out of the employer-based system, it is not surprising that among those who work, most are unlikely to have access to health coverage through a job.
Figure 2: Work characteristics of uninsured adults who could gain Medicaid coverage
Of the uninsured who could gain Medicaid coverage who were not working, most report major impediments in their ability to work. Nearly one in three (29%) reported that they were taking care of home or family; 20% reported they were looking for work; 18% were in school; 17% were ill or disabled; 10% were retired, and 6% had another reason. This is consistent with data that show that fewer women compared to men (53% compared to 60%) and fewer of those in the 46-64 age range compared to younger adults (47% compared to 62% ages 26-45 and 60% ages 19-25) are working. Women are more likely than men to care for family and older adults are more likely to have health reasons that would make it difficult to work. (Figure 3)
Figure 3: Main reasons for not working among uninsured adults who could gain Medicaid coverage
In negotiations over the Medicaid expansion, a few states have been interested in using waiver authority to tie Medicaid eligibility to programs. Federal law does not allow for work requirements in Medicaid, and HHS has stated that waivers that condition Medicaid eligibility on work would not be approved because they do not further the purposes of the program, which are to provide health coverage. However, proposals that include a referral to work programs (without a condition of Medicaid eligibility) could be approved. New Hampshire has proposed a work referral program and other states like Indiana and Utah are considering state-run work search and training programs that are separate from the Medicaid expansion. Data show that most uninsured who could gain coverage are working or in a family with a worker. Medicaid offers a source of coverage to fill in the gaps faced by low-income workers in low-wage jobs where affordable coverage in the workplace is out of reach and for many who face impediments to work.
Table 1: Uninsured Nonelderly Adults Who Could Gain Medicaid Coverage
All
Exapansion States
Non-Expansion States
Overall weighted N
14,442,754
7,194,309
7,248,446
Family Work Status
Multiple full-time workers in family
1,640,583
11%
33,142
12%
807,441
11%
One full-time worker in family
5,607,318
39%
2,671,425
37%
2,935,893
41%
Only part-time workers in family
3,152,435
22%
1,697,283
24%
1,455,152
20%
No workers in family
4,042,418
28%
1,992,458
28%
2,049,960
28%
Gender
Male
7,255,044
50%
3,743,080
52%
3,511,964
48%
Female
7,187,710
50%
3,451,228
48%
3,736,482
52%
Age
19-25
3,509,957
24%
1,664,956
23%
1,845,001
25%
26-45
6,256,073
43%
3,140,116
44%
3,115,957
43%
46-64
4,676,724
32%
2,389,237
33%
2,287,488
32%
Own Work Status – Not Working All Last Year
6,266,796
43%
3,148,695
44%
3,118,101
43%
Gender
Male
2,894,012
46%
1,523,602
48%
1,370,410
44%
Female
3,372,784
54%
1,625,093
52%
1,747,691
56%
Age
19-25
1,404,817
22%
631,705
20%
773,113
25%
26-45
2,394,229
38%
1,229,340
39%
1,164,889
37%
46-64
2,467,749
39%
1,287,650
41%
1,180,100
38%
Main reason you did not work last year?
Ill or disabled
1,047,296
17%
470,778
15%
576,518
18%
Retired
648,434
10%
357,884
11%
290,550
9%
Taking care of home or family
1,838,079
29%
877,212
28%
960,867
31%
Going to school
1,123,197
18%
556,228
18%
566,970
18%
Could not find work
1,249,918
20%
693,972
22%
555,946
18%
Other
359,872
6%
192,622
6%
167,250
5%
Own Work Status – Working Anytime Last Year
8,175,958
57%
4,045,614
56%
4,130,345
57%
Full-Time or Part-Time Status
Full-time
4,615,103
56%
2,149,396
53%
2,465,708
60%
Part-time
3,560,855
44%
1,896,218
47%
1,664,637
40%
Firm size
<50 workers
4,219,835
52%
2,075,003
51%
2,144,832
52%
50-99 workers
545,877
7%
279,391
7%
266,486
6%
100+ workers
3,410,246
42%
1,691,219
42%
1,719,027
42%
Gender
Male
4,361,032
53%
2,219,478
55%
2,141,554
52%
Female
3,814,926
47%
1,826,136
45%
1,988,790
48%
Age
19-25
2,105,140
26%
1,033,251
26%
1,071,889
26%
26-45
3,861,843
47%
1,910,776
47%
1,951,068
47%
46-64
2,208,975
27%
1,101,587
27%
1,107,388
27%
Industry
Agriculture / Service
3,778,333
46%
1,749,997
43%
2,028,336
49%
Professional / Public Administration
1,329,765
16%
679,514
17%
650,251
16%
Education / Health Services
1,053,044
13%
557,305
14%
495,740
12%
Manufacturing
869,977
11%
448,386
11%
421,591
10%
Other
1,144,838
14%
610,412
15%
534,426
13%
NOTE: Industry classifications: Agriculture/Service includes agriculture, construction, leisure and hospitality services, wholesale and retail trade. Education/Health Services includes education and health services. Professional/Public Administration includes finance, professional and business services, information, and public administration. Manufacturing includes mining, manufacturing, utilities, and transportation.SOURCE: Kaiser Family Foundation analysis of March 2014 Current Population Survey
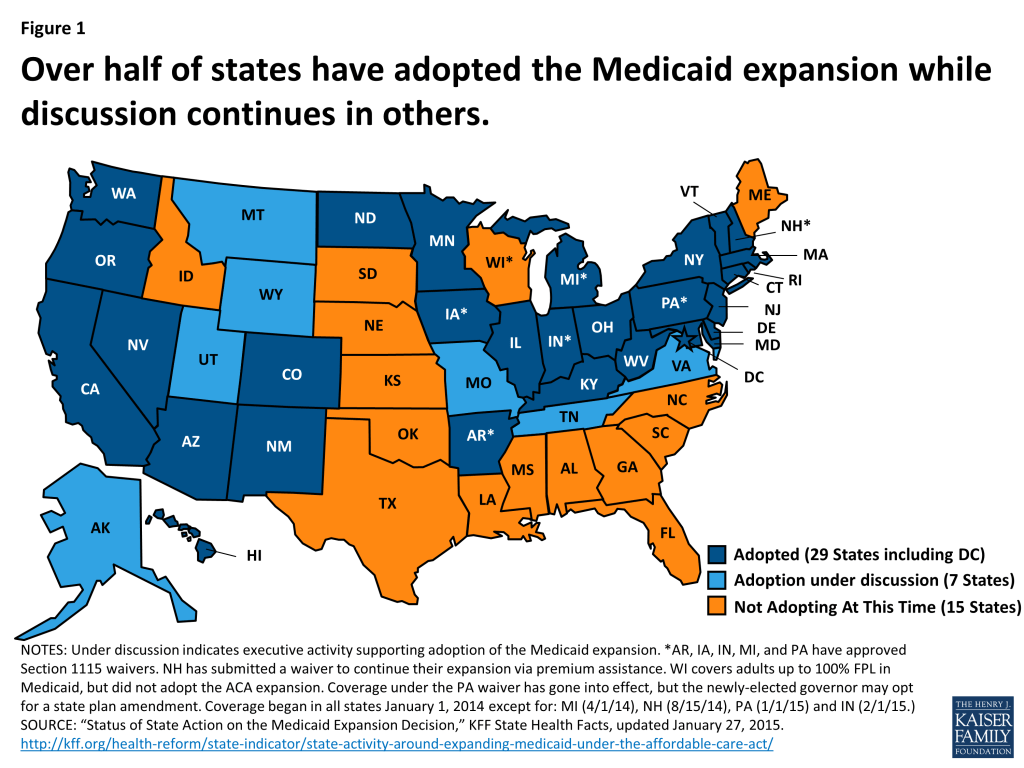
As enacted, the Affordable Care Act (ACA) broadened Medicaid’s role, making it the foundation of coverage for nearly all low-income Americans with incomes up to 138 percent of the federal poverty level (FPL) ($16,242 per year for an individual in 2015). However, the Supreme Court ruling on the ACA effectively made the decision to implement the Medicaid expansion an option for states. For those that expand, the federal government will pay 100 percent of Medicaid costs of those newly eligible for Medicaid from 2014 to 2016. The federal share gradually phases down to 90 percent in 2020, where it remains well above traditional federal medical assistance percentage (FMAP) rates. As of January 2015, 29 states (including the District of Columbia) adopted the Medicaid expansion, though debate continues in other states.1 (Figure 1) State lawmakers have had different responses to the Medicaid expansion. While it does not cover how every state has enacted the Medicaid expansion, this fact sheet highlights some of the different actions state lawmakers have taken in response to the Medicaid expansion. Each state’s circumstances are unique; the actions taken by one state may not apply to another state’s circumstances.
Figure 1: Over half of states have adopted the Medicaid expansion while discussion continues in others.
Overview of the Processes Required to Adopt the Medicaid Expansion
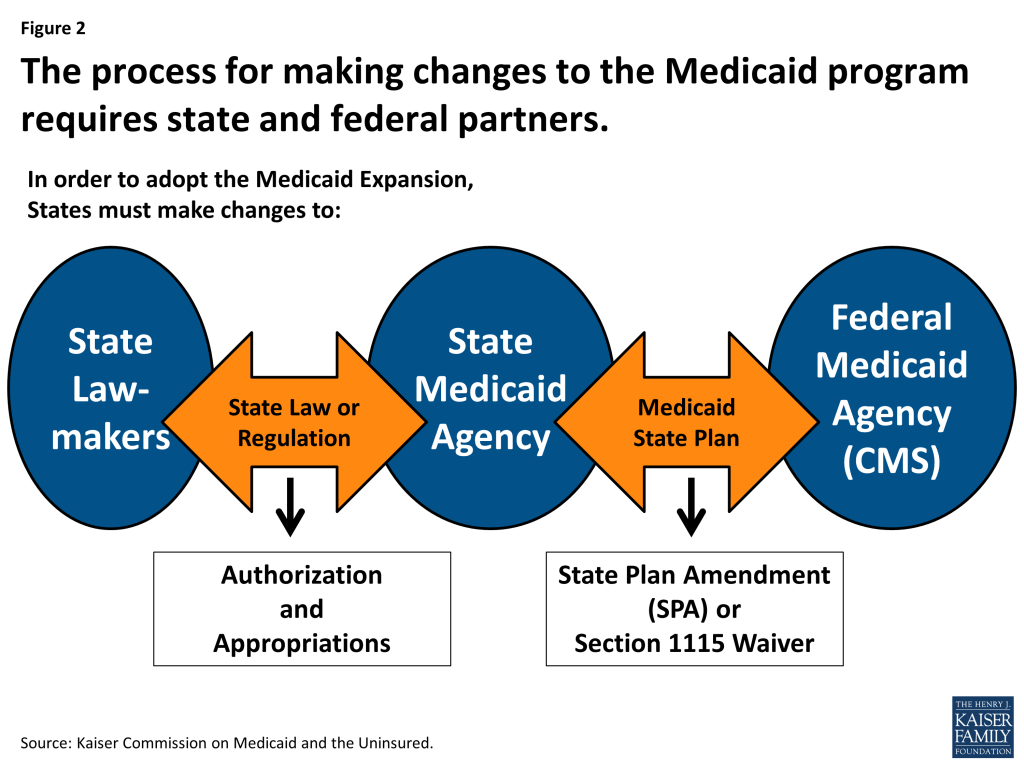
Medicaid is a jointly-operated program; state Medicaid agencies must work with Federal partners to adopt the Medicaid expansion. The relationship between the state Medicaid agencies and the Centers for Medicare and Medicaid Services (CMS), the federal agency administering the Medicaid program, is governed by a document called a Medicaid state plan. A Medicaid state plan describes how each state will operate its program, which is submitted to and approved by CMS. To make a change in its Medicaid program, such as adopting the Medicaid expansion, the state Medicaid agency must submit and receive CMS approval of either a state plan amendment (SPA), which is used to make program changes that are allowed under current law, or less commonly a waiver request, which is negotiated agreement involving changes to the operation of the state’s program that are not allowed under federal Medicaid law.2 (Figure 2) To date, 24 of the 29 states that have adopted the Medicaid expansion have done so through filing a SPA; only five states have received Section 1115 waiver approval to implement the ACA Medicaid expansion.3
Figure 2: The process for making changes to the Medicaid program requires state and federal partners.
However, before working with federal partners, state Medicaid agencies often must work with state lawmakers to obtain authorization and appropriations before implementing the Medicaid expansion. (Figure 2) In order to make changes to Medicaid policy, such as expanding eligibility under the Medicaid expansion, states must work with lawmakers (governors and/or legislatures) to make changes to either state laws and/or state regulations. Each state has different rules about which kinds of Medicaid policy changes, if any, can be authorized through changes in regulation (and therefore by agencies at the direction of the governor) or must be made through changes to state law or statute (and therefore require legislative approval.) For example, some states require state legislative action before state plan amendments or Section 1115 waiver requests can be submitted by the state Medicaid agency to CMS for federal approval and others do not. States also vary on whether legislative action is required to authorize changes to Medicaid benefits, cost-sharing and other types of Medicaid policy changes.4 This varies, at least in part, on how the Medicaid program was incorporated into state statute when the state originally enacted the program decades ago and the changes to rules and regulations enacted in the years since. In addition to authorization, state Medicaid agencies must also work with state lawmakers to obtain appropriations to fund the Medicaid policy change(s). Some states require legislative action to appropriate federal dollars as well as state dollars; others do not.
Examples of State Lawmaker Responses to Medicaid Expansion
State lawmakers play a key role in determining if and how their state may adopt the Medicaid expansion. Both Republican and Democratic state lawmakers have responded in differing ways to the Medicaid expansion; responses have also changed over time. The following sections walk through some of the different ways state lawmakers have responded to the Medicaid expansion.
Standard Legislative Process
Many of the states that have adopted the Medicaid expansion have done so through the standard legislative process – legislation was passed authorizing the Medicaid expansion (either through a stand-alone bill or as part of budget legislation.) For example, Minnesota5 and Maryland6 passed legislation during their 2013 regular legislative sessions to enact the Medicaid expansion. Other states, such as New York7 and New Mexico8 , included the Medicaid expansion as part of budget bills passed in 2013. In each of these states, the Governor and legislature supported the Medicaid expansion. The standard legislative process has also worked in some states where adopting the Medicaid expansion was initially supported by one branch but not the other. For example, in Arizona, Governor Brewer strongly supported adopting the Medicaid expansion; after lobbying legislators and building public support, legislators passed the state’s budget with the Medicaid expansion.9
While Section 1115 waivers require additional steps to obtain federal approval, the legislative process remains largely the same at the state level. The majority of states that have adopted the Medicaid expansion to date have done so within federal rules and options to receive the associated enhanced federal matching funds for newly eligible, in other words, through SPAs. However, a limited number of states have obtained or are seeking approval through Section 1115 waivers to implement the expansion in ways that extend beyond the flexibility provided by the law.10 While Section 1115 waivers require additional steps to obtain federal approval, the process at the state level may be largely the same at the state level as if the state were adopting the expansion through a SPA. For example, lawmakers in Iowa, New Hampshire and Michigan approved legislation adopting the Medicaid expansion through their standard legislative process. While the legislation outlined their alternative Medicaid expansion requests and conditioned approval on federal waiver approval within a set timeframe, the legislatures delegated development and submission of the final waiver proposal to the state Medicaid agencies. More recently, governors in some states, such as Utah and Tennessee, have instead started negotiations with CMS officials to develop a waiver proposal that is likely to be approved at the federal level. Once a preliminary agreement in principle has been reached, these governors have now started working with their legislatures to obtain their approval before formally submitting the request to CMS.
One branch of government can stop adoption of the Medicaid expansion. State Lawmakers have differed on their support or opposition to the Medicaid expansion. In states such as Missouri and Virginia, Governors Nixon and McAuliffe have also both expressed strong support for the Medicaid expansion, initiating statewide campaigns for adoption of the expansion in their respective states. However, each of these Governors has faced strong opposition from their respective state legislatures; Medicaid expansion has not been adopted in either state at this time. Sometimes, even one body of the state legislature has stopped passage of state legislation adopting the Medicaid expansion. For example, in Florida, Governor Rick Scott announced his support of adopting the Medicaid expansion in February 2013.11 The Senate passed legislation that adopted an alternative Medicaid expansion proposal; however, strong opposition in the House of Representatives prevented final passage of the legislation. 12 In other cases, governor opposition to adoption of the expansion has prevented action. For example, in Maine, the legislature has passed multiple bills authorizing the Medicaid expansion, but each has been vetoed by Governor LePage; override votes have fallen short of the two-thirds majority vote needed each time.13
Some states have enacted laws prohibiting Medicaid expansion without legislative approval. While most states have adopted the Medicaid expansion after agreement has been reached by both governors and state legislatures, some legislatures have sought to ensure that legislative approval is required before adoption of the Medicaid expansion can take effect. In March 2013, Governor McCrory of North Carolina signed legislation that prevented any department, agency or institution of the state from expanding eligibility under the ACA Medicaid expansion in North Carolina unless directed to do so by the General Assembly.14 Similar stand-alone legislation was also passed in other states such as Georgia15 and Tennessee.16 Legislatures in other states, such as Virginia, have included language requiring legislative approval before implementing the Medicaid expansion in state budgets.17 Similar legislation that would prohibit the Governor or executive agencies from implementing the Medicaid expansion without legislative approval is under consideration in Montana.18
Alternative Processes
In a few select cases, the Medicaid expansion has been adopted through executive action. While enactment of the Medicaid expansion involved the legislature in most states, at least two states enacted the Medicaid expansion through executive order – Kentucky and West Virginia. In May 2013, Governor Beshear of Kentucky and Governor Tomblin of West Virginia issued executive orders enacting the Medicaid expansion in their states.
The need to appropriate federal funds has also raised some challenges in states seeking adoption of the Medicaid expansion. As part of state budget processes, some states require that all funding be appropriated, including that from federal funds. For example, after the Arkansas legislature approved authorizing language for the Medicaid expansion (the Private Option)19 , the state legislature also had to pass legislation to appropriate the federal dollars that fund the Private Option; all appropriations in Arkansas require a three-fourths majority vote in each chamber, a higher threshold than in most states. 20 Other states delegate appropriation authority in select cases to other government bodies. For example, in Ohio, some spending decisions are delegated to the state’s Controlling Board. The role of the board is to “provide a mechanism for handling limited day-to-day adjustments needed in the state budget,” without requiring the full legislature to meet; over time its role has been also to provide greater legislative oversight of executive action.21 After Ohio’s budget for SFYs 2014-2016 passed in June 2013 without appropriations for the Medicaid expansion, the Ohio Medicaid Director submitted a request that the Controlling Board approve the appropriation of federal funds for the Medicaid expansion. The Controlling Board approved the appropriation in October 2013.22
Some states have passed legislation that created taskforces or study groups to further examine the issue of Medicaid expansion and make a recommendation to the legislature. For example, as part of a compromise deal reached by the Governor and the legislature in 2013, Virginia established the Medicaid Innovation and Reform Commission (MIRC); this committee was charged with monitoring the development of Medicaid reform proposals, such as the expansion of managed care among others. If the MIRC determined that specific Medicaid cost-reduction and efficiency benchmarks had been met, it could then vote to implement the Medicaid expansion.23 However, the committee was later eliminated as part of the FY 2015-2016 budget passed the following year. Additional legislation establishing study groups or taskforces to examine the Medicaid expansion and broader Medicaid reforms has previously been enacted in a number of states, such as Wyoming; this taskforce recently recommended the SHARE plan, an alternative Medicaid expansion proposal. As in other states, the recommendation of the taskforce is not binding and still requires legislative approval in addition to Governor support before being adopted.
In a few instances, state lawmaker actions adopting the Medicaid expansion have been challenged in court. For example, the executive orders adopting the Medicaid expansion and enacting the state’s Marketplace – kynect – in Kentucky were challenged in court. Eventually the judge upheld the executive order based on existing state law that gave the Secretary of Health and Family Services authority “to take advantage of all federal funds that may be available for medical assistance…the secretary…may by regulation comply with any requirement that maybe imposed or opportunity that may be presented by federal law.”24 A court case has also been brought in Arizona, where state legislators are challenging the budget legislation that enacted the Medicaid expansion. Part of this legislation called for the implementation of a new hospital provider fee to fund state costs of the Medicaid expansion. According to the plaintiffs, which include the State Senate President, Senator Biggs, the fee is a tax, which under Arizona’s constitution, requires two-thirds majority to approve as opposed to the simple majority that approved the legislation. After the State Supreme Court ruled that the plaintiffs had standing to bring the lawsuit, the case has been referred back to Maricopa County Superior Court.25
While discussed in some states, no state has included a ballot initiative on the adoption of the Medicaid expansion. For example, in Montana, supporters of the Medicaid expansion sought to include a ballot initiative on the state’s 2014 ballot. If approved by voters in the state, it would have expanded eligibility under the Medicaid expansion; additional legislative action would have been needed to appropriate the funding. However, the initiative failed to collect enough signatures and was not included on the ballot.26
Conclusion
State lawmaker responses to the Medicaid expansion have differed across states. Most states adopted the Medicaid expansion through the standard legislative process after gaining the support of both branches of state government; however a few states have adopted the Medicaid expansion through alternative processes. Each state’s circumstances are unique; the actions taken by one state may not apply to another state’s circumstances.
H.B. 0228, Maryland General Assembly 2013 Regular Session (enacted 2013.) http://mgaleg.maryland.gov/webmga/frmMain.aspx?pid=billpage&stab=01&id=hb0228&tab=subject3&ys=2013RS.
The House Fiscal and Policy Note for this bill indicates that there is “no legal requirement that Maryland enact legislation to participate in the Medicaid expansion…however, all previous expansions of the Maryland Medicaid program have been done through legislation.”
Department of Legislative Services, Fiscal and Policy Note Revised: Maryland Health Progress Act of 2013 (House Bill 228.) (Maryland General Assembly,) 2013. http://mgaleg.maryland.gov/2013RS/fnotes/bil_0008/hb0228.pdf. ↩︎
After a long protracted debate over the state’s budget bill around the Medicaid expansion, legislators in Virginia passed a budget bill without appropriations for the Medicaid expansion that also included an amendment, proposed by Senator Stanley, to prevent the governor from implementing the expansion on his own authority without legislative approval. Governor McAuliffe signed the budget legislation, but used his line-item veto authority to remove the Stanley amendment along with other items. However, the Speaker of the House later ruled that the line-item veto of the Stanley amendment was outside the Governor’s authority as it did not delete the entire line item but only a portion; the line item in question related to the appropriation for the state’s entire Medicaid program. After the General Assembly voted and approved other line-items vetoes, the budget became law with the Stanley amendment intact.
Laura Snyder, Kathleen Gifford, Eileen Ellis and Jenna Walls, Putting Medicaid in the Larger Budget Context: An In-Depth Look at Four States in FY 2014 and 2015. (Kaiser Family Foundation,) October 2014. https://modern.kff.org/medicaid/issue-brief/putting-medicaid-in-the-larger-budget-context-an-in-depth-look-at-four-states-in-fy-2014-and-2015/. ↩︎
Medicaid Innovation and Reform Commission, “About the Commission”, (Virginia General Assembly.) Accessed August 2014. http://mirc.virginia.gov/about.html. ↩︎
In the years leading up to the Affordable Care Act (ACA), Medicaid programs were influenced by several factors, including enrollment growth related to the Great Recession, fiscal pressures and changes in program financing, and preparation and early implementation of some ACA provisions. This paper presents data on Medicaid spending during the period of these changes, the first half of which we refer to as the “recessionary period”, and the second half of which we refer to as the “post-recessionary period”. We use administrative data to first examine overall spending trends and trends by service type. We then draw on additional data to analyze per enrollee spending growth during this period, both by service type and by eligibility group, to understand what drove Medicaid spending. Key findings include:
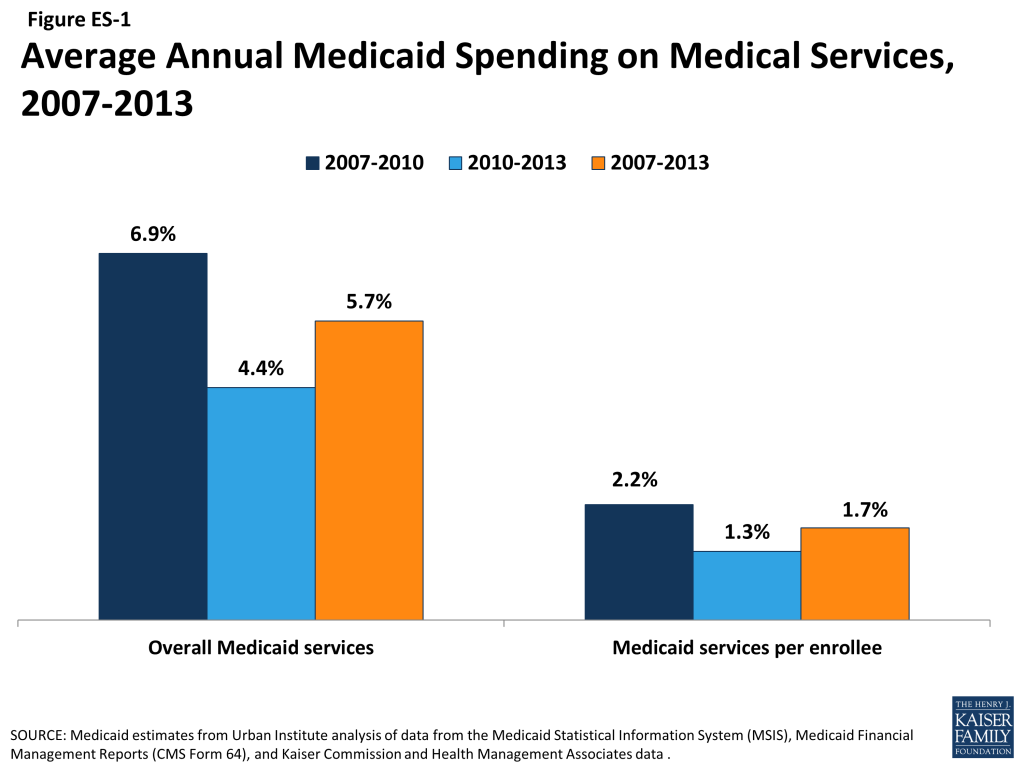
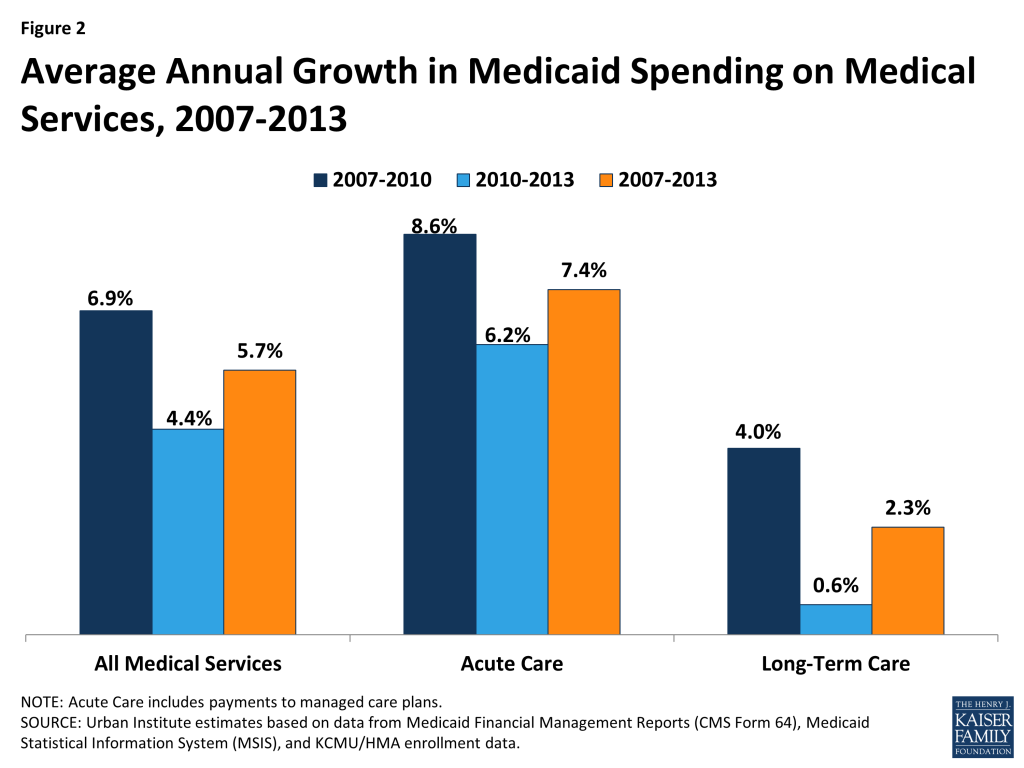
Overall, spending on medical services in Medicaid increased by an average annual rate of 5.7 percent over the 2007-2013 period, with average annual spending growth higher during the recessionary period (6.9 percent from 2007-2010) and slowing during the post-recessionary period (4.4 percent from 2010-2013).
Figure ES-1: Average Annual Medicaid Spending on Medical Services, 2007-2013
Overall Medicaid spending is a function of both the number of people served by the program and what the program spends for each person enrolled. On a per enrollee basis, Medicaid spending growth grew by an average annual rate of just 1.7 percent between 2007 and 2013. During the recessionary period, 2007 to 2010 (when overall spending growth was nearly 7 percent), per enrollee spending grew by just 2.2 percent. Average annual growth per enrollee fell to 1.3 percent from 2010 to 2013.
Enrollment growth among families was a major driver of Medicaid spending growth during the recession. While enrollment among families grew by 7.2 percent a year from 2007 to 2010, spending per enrollee grew by only 4.4 percent. From 2010 to 2013, enrollment growth among families slowed to 3.1 percent a year and per enrollee spending was still about 4 percent, leading overall spending growth for families to slow.
Between 2007 and 2013, both overall and per enrollee acute care spending grew faster than long-term care spending. This difference reflects enrollment trends, since low-income families gaining Medicaid coverage during the recession are more likely to use acute care services than other types of services. It also reflects particularly slow growth in long-term care spending related to state rebalancing efforts, slow growth in enrollment among the disabled and elderly, and shifts in some long-term care services to managed care.
Both overall and per enrollee Medicaid spending growth for prescription drugs and institutional long-term care have slowed substantially or declined from 2007 to 2013, while payments to managed care increased over this period. These patterns likely reflect policy decisions in some states to shift provision of prescription drugs or long-term services and supports into managed care contracts. They also may reflect policy choices to increase manufacturer rebates for prescription drugs and “rebalance” long-term care to less expensive community-based services.
Compared to other benchmarks, Medicaid spending growth has been low from 2007 to 2013. Growth in per enrollee Medicaid spending on medical services was lower than that for national health expenditures per capita, the consumer price index for medical care, and per enrollee spending for private health insurance.
Issue Brief
Introduction
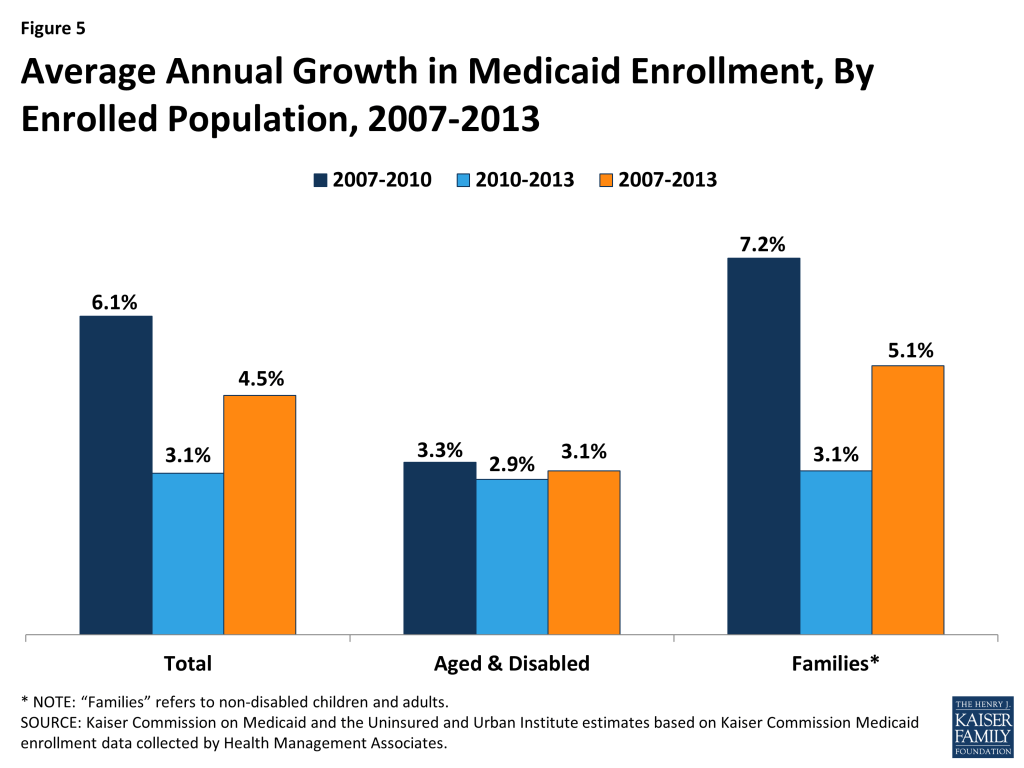
Medicaid spending in recent years has been influenced by several forces. Most notably, the “Great Recession” that began in December 2007 and officially ended in June 2009 led millions of people to lose income and gain Medicaid eligibility during that time. Between 2007 and 2010, unemployment grew from 4.6% to 9.6%, and both real median household income and real per capita income dropped.1 As millions of Americans lost income and health benefits due to job losses during this period, many turned to the Medicaid program to provide health coverage for themselves and their families. Medicaid enrollment grew by more than 8 million between 2007 and 2010, an average annual growth rate of 6.1%.2 Growth was primarily among low-income families (average annual growth of 7.2%) versus people with disabilities and seniors (average annual growth of 3.3%). Since 2010, the economy has been slowly recovering, and enrollment growth has slowed, with average annual growth for both families and the aged and disabled at about 3 percent. Still, many low-income people continue to feel the lingering effects of the recession. The unemployment rate was still 7.4% in 2013 (higher than pre-recession levels), and real median household income continues to be below pre-recession levels.
A related factor affecting Medicaid spending during this time was changes in program financing. During economic downturns, states have difficulty balancing increased demand for assistance from programs like Medicaid with the decline in state tax revenues. In response, Congress has twice passed temporary increases to the federal matching rates (the share of Medicaid costs that the federal government pays) to help support states during economic downturns, most recently in 2009 as part of the American Recovery and Reinvestment Act (ARRA). The ARRA-enhanced matching rates provided states with over $100 billion in total funds over 11 quarters, ending in June 2011. To be eligible for the ARRA funds, states could not restrict eligibility or tighten enrollment procedures in Medicaid or CHIP. The increased federal funds resulted in declines in the level of state spending for Medicaid for the first time in the program’s history.
With the economy continuing to improve, Medicaid enrollment growth across the country slowed considerably in 2012 and 2013. Over those two years, average spending also slowed, but the end of the ARRA enhanced match rates in June 2011 shifted state spending patterns as states tried to mitigate the loss of federal dollars in 2012. This resulted in a dip in spending in 2012 that also affected the annual growth rate for 2013.
Fiscal and budget pressures on Medicaid programs continued to lessen as the economic and fiscal conditions improved in 2013. This allowed some states to implement more program restorations such as increases in provider rates and benefit enhancements, which had not been considered for a number of years. Also in 2013, work was underway to prepare for the ACA coverage provisions set to go into effect in January 2014. While the full effects of these changes are expected to appear in later spending data, there may be some limited effects on spending in 2013. For example, some states such as California and Colorado, which had expanded coverage to childless adults and parents early, saw increased Medicaid enrollment among these populations in the lead up to January 2014, increasing Medicaid enrollment at a time when enrollment trends elsewhere were slowing.3
This paper presents data on Medicaid spending trends during the period of these changes. We use administrative data on Medicaid spending to first examine overall spending trends and trends by service type. We then draw on additional data to analyze per enrollee spending growth during this period, both by service type and by eligibility group, to understand what drove patterns in Medicaid spending. Because year-to-year spending may fluctuate for reasons such as one-time data reporting issues or large policy shifts within a single state (such as a waiver program), we examine spending trends over multiple years: FFY 2007 to 2010, which we refer to as the “recessionary period,” and FFY 2010 to 2013, the “post-recessionary period.”4 A detailed explanation of the data and methods for this analysis is provided in the appendix at the end of this report.
Medicaid Spending Growth by Service Category, 2007-2013
Total Medicaid spending grew from $330.3 billion in 2007 to $454.0 billion in 2013 (Table 1). Focusing on only medical services (i.e., excluding payments to Medicare, disproportionate share hospital (DSH), adjustments and administrative expenses), spending increased from $292.7 billion in 2007 to $407.1 billion in 2013.
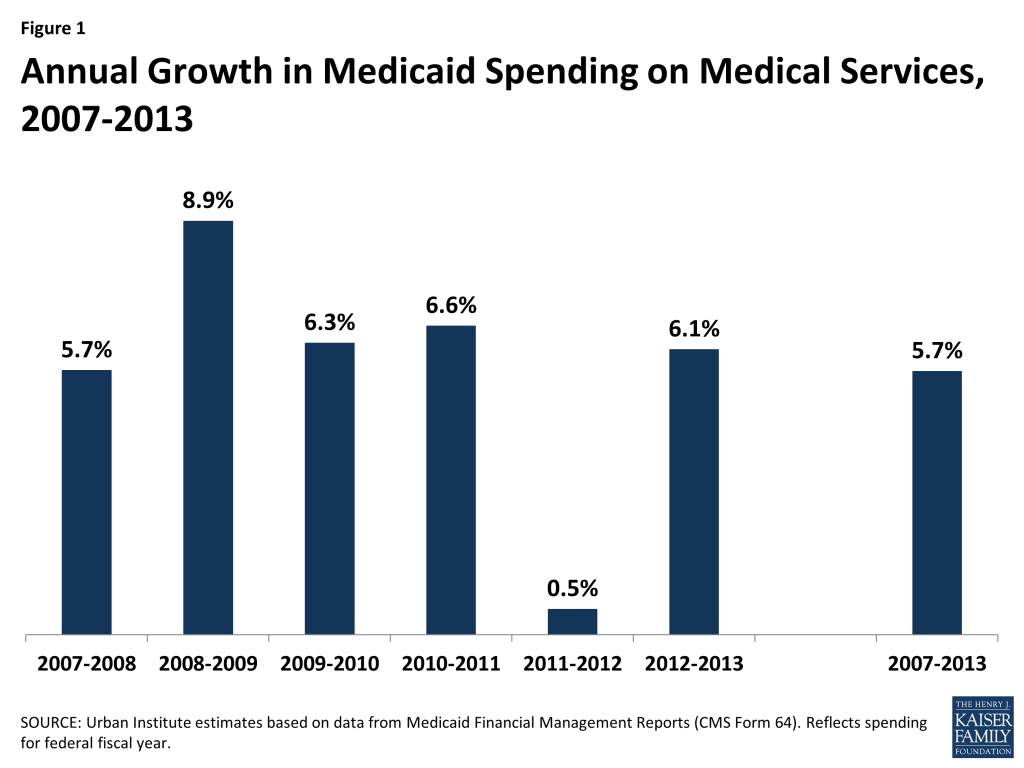
As shown in Figure 1, spending on medical services in Medicaid increased by an average annual rate of 5.7 percent over the 2007-2013 period. Medicaid spending growth peaked at the height of the economic recession (8.9% from 2008 to 2009). This pattern reflects the counter-cyclical nature of Medicaid, which expands during economic downturns due to rising enrollment. As the economy slowly improved between 2009 and 2011, spending growth slowed.
Figure 1: Annual Growth in Medicaid Spending on Medical Services, 2007-2013
Annual spending growth rates for 2012 and 2013, however, are largely affected by the end of the ARRA enhanced match rates in June 2011. States notably shifted their spending patterns in 2012 to mitigate the loss of federal dollars. This shift resulted in nearly flat spending growth in 2012 (0.5%) and an uptick in 2013 (6.1 %.) However, average spending growth over the two year period was lower than previous years, reflecting declining enrollment growth during this period.
Looking at the entire recessionary period (2007-2010)5 , Medicaid spending on medical services grew at an average annual rate of 6.9 percent, compared to 4.4 percent from 2010 to 2013 (Figure 2). Acute care spending grew at a faster rate than long-term care spending. Acute care spending growth was highest during the recessionary period (8.6 percent from 2007-2010 compared to 6.2 percent from 2010 to 2013). Again, this pattern reflects economic trends, since low-income families gaining Medicaid coverage during the recession are more likely to rely on Medicaid for acute care services than for other types of services.
Figure 2: Average Annual Growth in Medicaid Spending on Medical Services, 2007-2013
Acute Care
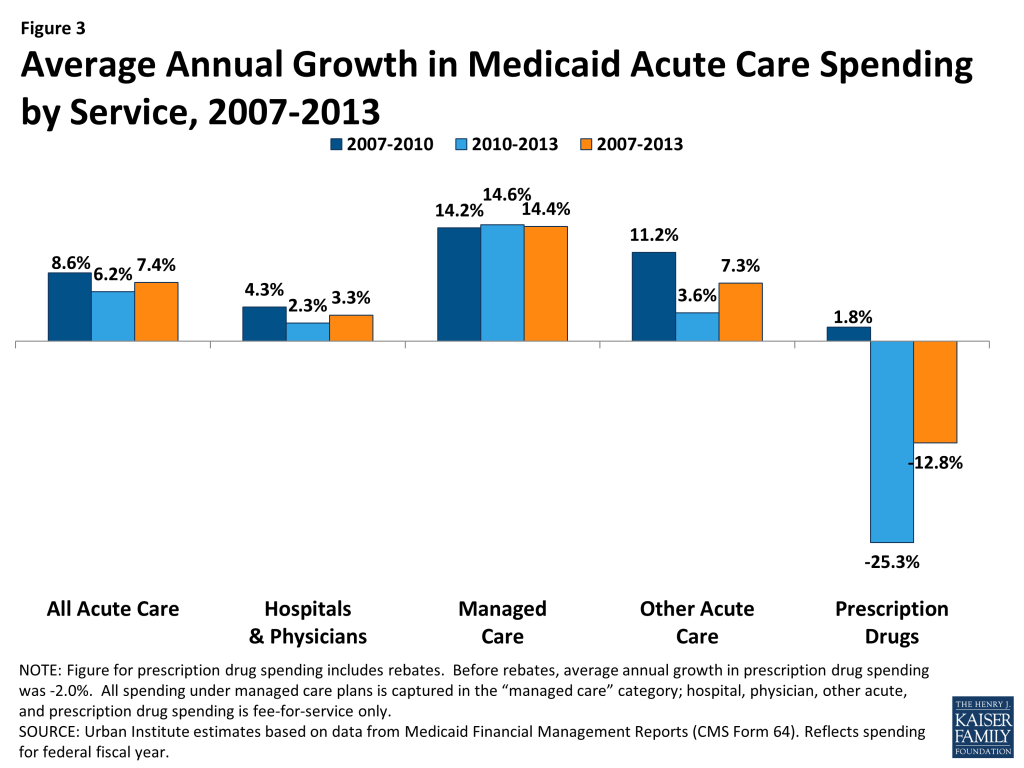
Medicaid acute care spending grew from $185.3 billion in 2007 to $284.0 billion in 2013, an average annual growth rate of 7.4 percent. Spending growth differed across categories of acute care spending (Figure 3).
Figure 3: Average Annual Growth in Medicaid Acute Care Spending by Service, 2007-2013
Hospitals and Physicians. Spending on hospitals and physicians increased from $82.3 billion in 2007 to $99.8 billion in 2013, an average annual increase of 3.3 percent. Annual growth was slightly higher during the recessionary period (4.3 percent from 2007 to 2010) than in the post-recessionary period (2.3 percent from 2010 to 2013). Annual growth in spending for this category fluctuated over the period, although some of this pattern could be due to data reporting issues as category definitions changed. Spending in this category was also likely affected by changes in provider reimbursement. During the Great Recession, states turned to provider rate cuts to control costs, just as they did during the economic downturn from 2001 to 2004. As part of an annual survey of Medicaid programs, more states reported provider rate restrictions than increases, including inpatient hospitals and physicians in state fiscal years 2010 through 2012.6 Fluctuations in spending were also affected by changes in a few large states whose hospital spending may have been influenced by one-time factors such as waiver payments.
Managed Care. Within acute care, the fastest-growing category of spending was Medicaid payments to managed care organizations, which increased from $60.7 billion in 2007 to $136.2 billion in 2013.7 The average annual increase in payments to managed care organizations was 14.4 percent during this period, and average annual growth was similarly high during both the recessionary and post-recessionary periods (14.2 percent from 2007 to 2010 and 14.6 percent from 2010 to 2013). This category of spending includes capitated payments by Medicaid to managed care plans for the delivery of benefits to Medicaid enrollees. Plans include both comprehensive plans as well as limited benefit plans that provide just a subset of services such as behavioral health or dental care. Unfortunately, the data do not enable us to determine what managed care plans paid for specific services or providers. The growth in spending on managed care reflects overall Medicaid enrollment growth as well as more services being provided and new populations being covered through managed care.
Other Acute Care. Other acute care spending, which includes dental, other practitioners, abortions, sterilization, PACE programs, emergency services for undocumented aliens, and other care services, grew from $26.3 billion in 2007 to $40.2 billion in 2013, an average annual growth rate of 7.3 percent. Other acute care growth was higher from 2007 to 2010 (11.2 percent) than in the post recessionary period (3.6%). This pattern may reflect particularly high spending in 2010 that resulted from changes in data reporting that shifted some spending from other categories into to the “other acute” care category.
Prescription Drugs. Net Medicaid spending on prescription drugs dropped from $15.0 billion in 2007 to $6.6 billion in 2013, an average annual growth rate of -12.8 percent.8 Prescription drug spending was nearly flat during the recessionary period (average annual growth rate of 1.8 percent from 2007 to 2010) then decreased at a particularly fast rate in the post-recessionary period (average annual growth of -25.3 percent from 2010 to 2013). This negative growth rate is likely due to states shifting prescription drugs into managed care as well as increases in drug rebates. As part of the Medicaid drug benefit, manufacturers provide rebates to the state and federal government. Between 2007 and 2013, rebates accounted for a growing share of gross Medicaid drug spending.9 Further, starting in 2010 with the passage of the ACA, prescription drugs paid for under Medicaid managed care became eligible for rebates, leading many states to shift drug spending into managed care.10 Prescription drug spending has also been a target for many state cost control actions, which may have contributed to slow spending during this period.11
Long-Term Care
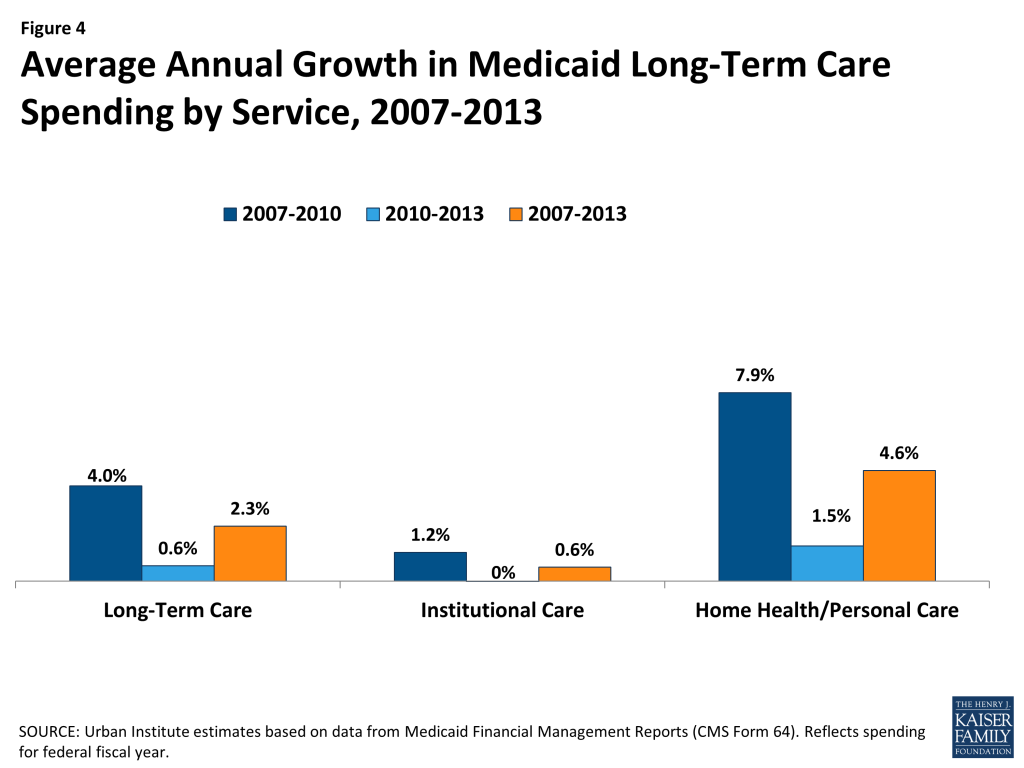
Over the period from 2007 to 2013, total long-term care expenditures increased from $107.4 billion in 2007 to $123.0 billion in 2013, an average annual growth of 2.3 percent. Spending growth was particularly low in the post-recessionary period (2010-2013), growing by an average annual rate of less than 1 percent (Figure 4).
Figure 4: Average Annual Growth in Medicaid Long-Term Care Spending by Service, 2007-2013
Long-term care includes a range of services that we categorize into two main components: (i) institutional long-term care, such as care provided in nursing facilities and intermediate care facilities for the intellectually and developmentally disabled (ICF-I/DD), and (ii) home health and personal care, which includes home and community-based services. Slow growth in Medicaid long-term care spending was driven by slow growth in institutional care, which grew at an average annual rate of just 1.2 percent from 2007 to 2010 and was flat from 2010 to 2013. With an average annual growth rate of 4.6 percent over the 2007 to 2013 period, spending on home health and personal care grew slightly faster than institutional services. These patterns may reflect state efforts to “rebalance” the provision of long-term care services by shifting resources from institutional to community-based care. The slow growth in institutional service spending may also reflect slow enrollment of elderly and disabled beneficiaries during this period, since this is the population most likely to use nursing home care. Additionally, in recent years, an increasing number of states have incorporated long-term care services as part of their managed care programs, and as a result, long-term care spending is increasingly being captured within managed care spending.
Non-Service Spending
Non-service Medicaid spending includes payments to Medicare programs (e.g. premiums, deductibles, and some cost sharing for dual eligible beneficiary enrollment in Medicare Part A and Part B), disproportionate share hospital (DSH) spending, program administration, and adjustments. Between 2007 and 2013, payments to Medicare increased at an average annual rate of 5.0 percent, DSH grew by 1.0 percent, and administration by 5.7 percent (Table 1). Both payments to Medicare and DSH grew more slowly in the post-recessionary period (2.6 percent and -2.3 percent, respectively) than the recessionary period (7.4 percent and 4.4 percent, respectively). For Medicare payments, this pattern reflects an increase in Medicare Part B premiums in 2010 and then a decrease in premiums in subsequent years. For DSH, the pattern likely reflects policy changes in a few large states that led to declines in DSH spending. Medicaid administration spending grew more quickly between 2010 and 2013 (average annual growth of 8.5 percent) than between 2007 and 2010 (2.9 percent). This pattern may indicate increased state administrative activity to prepare for ACA implementation, activity related to the implementation of major payment and delivery system reforms, or a post-recessionary rebound from tight administrative spending during the fiscal crisis.
Medicaid Spending Growth Per Enrollee, 2007-2013
Medicaid spending is a function of both the number of people served by the program and what the program spends for each person enrolled. Even if spending for each person covered by Medicaid remains stable, growth in the number of people covered by the program will lead to spending growth. As mentioned above, Medicaid enrollment grew between 2007 and 2013, particularly during the recession as people lost jobs and income. Between 2007 and 2013, Medicaid enrollment grew by an average annual rate of 4.5 percent. Growth was particularly high during the recessionary period, 2007 to 2010, when it grew by 6.1% on average. As Figure 5 shows, recession-related enrollment growth was concentrated among families, while enrollment growth among the aged and disabled was relatively steady at around 3 percent through the entire 2007 to 2013 period. In this section, we examine spending per enrollee, which enables us to understand trends in Medicaid spending adjusting for this enrollment growth.
Figure 5: Average Annual Growth in Medicaid Enrollment, By Enrolled Population, 2007-2013
Per Enrollee Spending Growth by Service
These estimates adjust spending per enrollee to control for the effect of the changing composition of Medicaid enrollment, as described in Appendix A. The growth rate in spending per enrollee for a specific service reflects the growth rate of the spending on that service divided by the enrollment growth rate, where the enrollment growth rate is weighted to reflect increases in enrollment in proportion to the use of that specific service among a particular type of enrollee. For example, enrollment growth of the aged and individuals with disabilities, rather than that of families, predominantly affects the growth of institutional long-term care use. Thus, when calculating the spending per enrollee of institutional long-term care, the growth rate of enrollment is weighted to reflect that each aged or disabled enrollee contributes more to long-term care spending than a non-disabled, non-elderly enrollee.
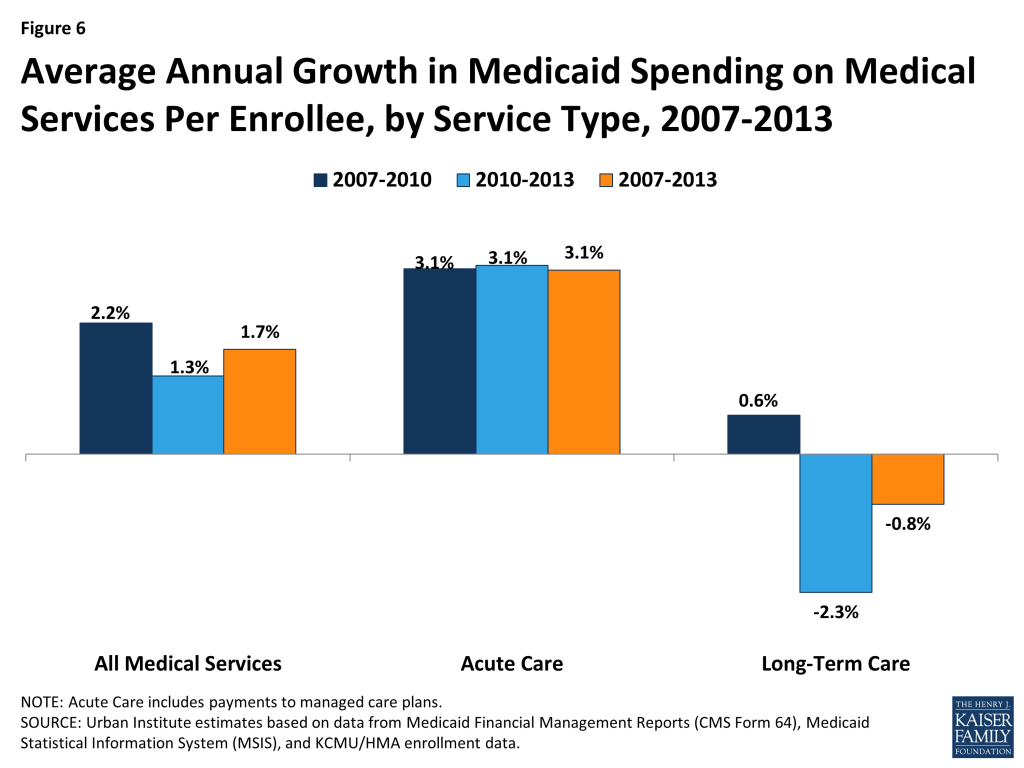
Medicaid spending growth per enrollee was slower over the 2007 to 2013 period than overall spending growth. Per enrollee spending grew by an average annual rate of just 1.7 percent over this period (Figure 6 and Table 2). During the recessionary period, 2007 to 2010 (when overall spending growth was nearly 7 percent), per enrollee spending grew by just 2.2 percent. Average annual growth per enrollee fell to 1.3 percent from 2010 to 2013. Acute care spending per enrollee grew at a average annual rate of 3.1 percent over the 2007 to 2013 period, while long-term care spending per enrollee fell during the period by -0.8 percent.
Figure 6: Average Annual Growth in Medicaid Spending on Medical Services Per Enrollee, by Service Type, 2007-2013
Within acute care, per enrollee spending growth varied across service categories, similarly to overall spending growth (Table 2). Specifically, per enrollee spending on managed care and other acute care grew the fastest on average, while prescription drug spending per enrollee dropped, particularly from 2010 to 2013. Within long-term care, institutional care spending per enrollee declined by an average of 2.5 percent a year (Table 2). Community-based long-term care spending per enrollee grew by an average of 4.4 percent from 2007 to 2010 but then dropped to an average of 1.4 percent from 2010 to 2013.
Per Enrollee Spending Growth by Eligibility Category
This section examines spending growth per enrollee from 2007 to 2013 by eligibility categories of families (non-disabled adults and children) and seniors and people with disabilities. As in the previous section, these estimates are adjusted for changes in enrollment composition and differential mix of service use across eligibility groups, described in more detail in Appendix A. In short, the analysis uses the 2007 MSIS data to calculate baseline spending by eligibility group; it then uses eligibility group-specific spending growth rate estimates to calculate subsequent years’ spending by eligibility group. These spending growth rate estimates are weighted to account for different mix of service use among different eligibility groups. Because total spending in this analysis is calculated using growth rates applied to the 2007 levels, total spending differs slightly from the estimates in previous figures.
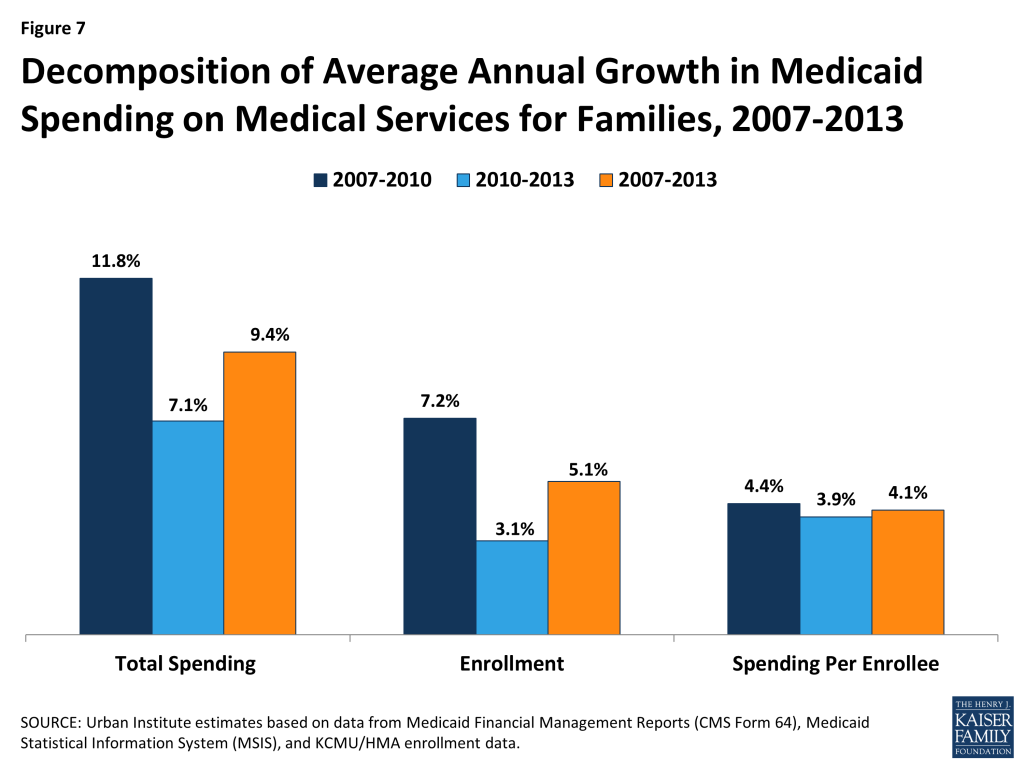
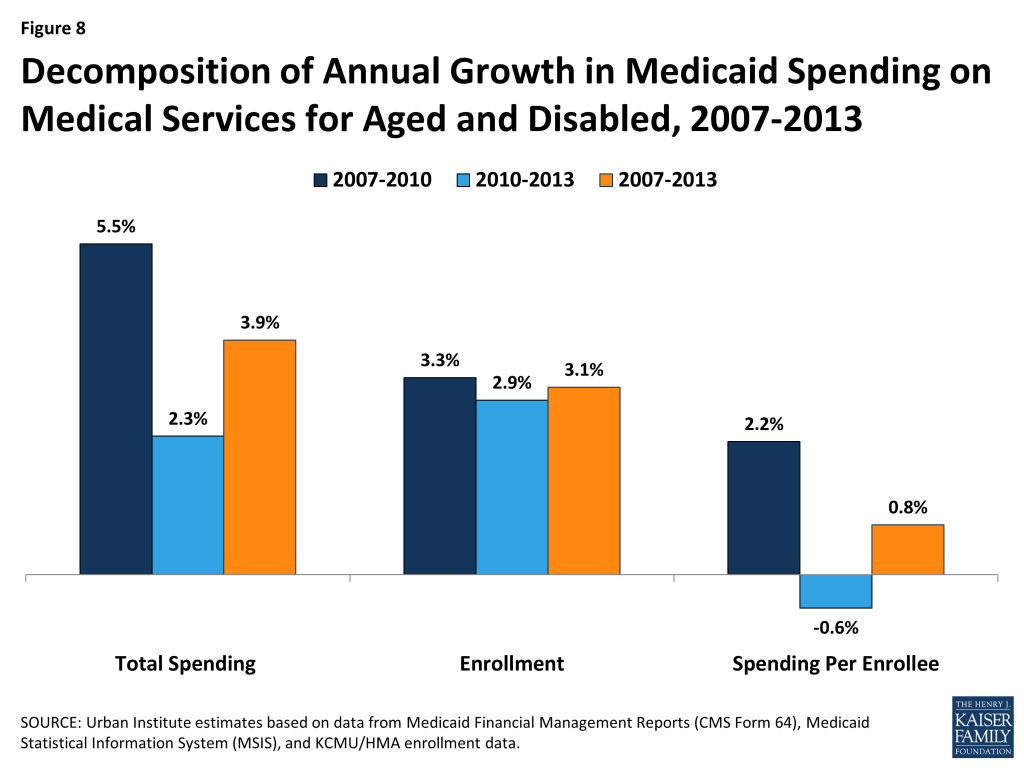
As Figure 7 and 8 show, for families, total spending patterns follow enrollment patterns over the 2007 to 2013 period, peaking during the recessionary period (2007-2010) as enrollment grew during that time. On a per enrollee basis, spending growth for families was relatively stable for the entire 2007 to 2013 period at about four percent. In contrast, total spending patterns for the aged and disabled follow per enrollee spending patterns during the period. For this group, enrollment growth was relatively flat at about three percent on average, while per enrollee spending decreased from 2010 to 2013.
Figure 7: Decomposition of Average Annual Growth in Medicaid Spending on Medical Services for Families, 2007-2013Figure 8: Decomposition of Annual Growth in Medicaid Spending on Medical Services for Aged and Disabled, 2007-2013
For eligibility groups, these patterns also relate to spending patterns for the service types most frequently used by those eligibility groups. For example, for families, who use Medicaid primarily for acute care services, per enrollee spending growth was stable throughout the period (about 4 percent on average), similar to per enrollee acute care spending. For seniors and people with disabilities—the primary users of long-term care in Medicaid—per enrollee spending growth mirrored long-term care trends: growth was nearly flat over the 2007 to 2013 period, growing at just 0.8 percent on average per year, with a drop in per enrollee spending seen in the latter half of the period.
Discussion
From 2007 to 2013, Medicaid spending on medical services grew by an average annual rate of 5.7 percent, with acute care growing faster than long-term care. Spending growth was higher during the recession, 2007 to 2010 (6.9 percent average growth) and slowed somewhat post-recession, 2010 to 2013 (4.4 percent average growth). On a per enrollee basis, however, spending grew more slowly, and long-term care spending actually declined.
This analysis leads to several key observations about Medicaid spending leading up to the ACA:
Recession-related enrollment of families was a key driver of Medicaid spending between 2007 and 2013. Total Medicaid spending growth increased at the height of the recession. However, the analysis reveals that most of this growth was driven by increases in enrollment, particularly among families, rather than growth in spending per enrollee. Total spending for families increased by 9.4 percent on average from 2007 to 2013, with spending growth particularly high (on average, 11.8 percent) during the recession, 2007 to 2010 (Table 3). However, this growth was largely driven by enrollment, which grew quickly between 2007 and 2010. Per enrollee spending for families grew at a steady rate (around 4%) throughout the period during and after the recession.
These findings indicate that enrollment is a major driver of Medicaid spending patterns, particularly for families. Medicaid enrollment is affected by changes in economic cycles. When the economy does poorly, people not only lose their jobs, but also their access to employer-based health insurance. At the same time, they experience decreases in income that make them eligible for Medicaid under existing eligibility criteria. As a result, during the recession, Medicaid enrollment increased. Enrollment in Medicaid was also affected during this period by protections against eligibility restrictions and increased federal funding included in the American Recovery and Reinvestment Act and by decisions to expand Medicaid eligibility in some states.
Medicaid spending growth has slowed substantially or declined in recent years for prescription drugs and institutional long-term care. Medicaid spending on prescription drugs declined from 2007 to 2013, likely due to both shifting these costs into managed care contracts and recouping an increasing share of drug spending through manufacturer rebates. Further, overall Medicaid spending growth for long-term care was low from 2007 to 2013. Low cost growth in combination with lower but steady rates of enrollment growth for the aged and disabled resulted in a decline in per enrollee spending for long-term care (Table 2). This pattern may reflect low per enrollee spending among people who use these services, driven in part by the shift from institutional to community-based services, which are less expensive.12 States were also increasing their use of managed long term care during the post-recessionary period, which also may have contributed to lower overall spending growth as well as the decline in per enrollee spending for long-term care.13
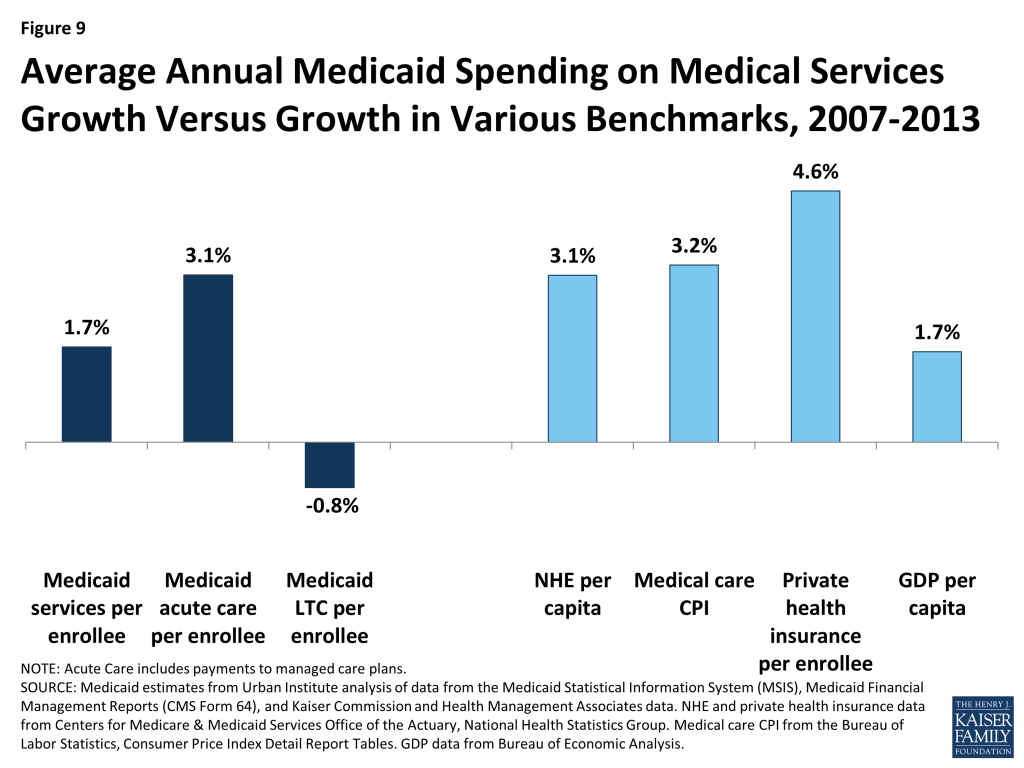
Compared to other benchmarks, Medicaid spending growth per enrollee has been low from 2007 to 2013. On a per enrollee basis, growth in Medicaid spending during this period was slower than growth by other purchasers (Figure 9). Overall per enrollee Medicaid spending on medical services increased by an average of 1.7 percent per year from 2007 to 2013, while national health expenditures per capita increased on average by 3.1 percent annually and the consumer price index (CPI) for medical care (an indicator of the change in prices of medical care) increased by an average of 3.2 percent annually. Comparing growth in Medicaid acute care spending per enrollee to that for private health insurance (which provides primarily acute care benefits), Medicaid spending growth was below that in the private sector, which grew at an average annual rate of 4.6 percent over the period. Medicaid spending on medical services per enrollee grew at the same rate as GDP per capita; while Medicaid acute care spending was higher than GDP per capita, it was on par with the medical care CPI, indicating that it purchases relatively expensive goods.
Figure 9: Average Annual Medicaid Spending on Medical Services Growth Versus Growth in Various Benchmarks, 2007-2013
This KCMU issue brief was prepared by Rachel Garfield, Robin Rudowitz, Katherine Young, and Laura Snyder of the Kaiser Family Foundation and Lisa Clemans-Cope, Emily Lawton, and John Holahan of the Urban Institute.
Tables
Table 1: National Medicaid Expenditures, by Spending Category and Year, FY 2007-2013
Expenditure Category
Expenditures (in billions)
Average Annual Growth Rate
2007
2008
2009
2010
2011
2012
2013
2007-2010
2010-2013
2007-2013
Total Spending
330.3
350.9
377.4
400.1
425.8
429.2
454.0
6.6%
4.3%
5.4%
Total Medical Services
292.7
309.3
336.7
357.8
381.5
383.6
407.1
6.9%
4.4%
5.7%
Acute Care1
185.3
196.2
216.5
237.1
258.5
260.9
284.0
8.6%
6.2%
7.4%
Hospitals & Physicians2
82.3
82.6
90.3
93.3
103.6
95.2
99.8
4.3%
2.3%
3.3%
Medicaid Managed Care2
60.7
70.1
80.5
90.5
101.8
117.5
136.2
14.2%
14.6%
14.4%
Other Acute Care2,3
26.3
27.2
28.8
36.2
37.1
38.4
40.2
11.2%
3.6%
7.3%
Prescription Drugs
15.0
15.3
15.7
15.8
14.7
8.6
6.6
1.8%
-25.3%
-12.8%
Prescribed Drugs Excluding Rebates
22.4
23.7
25.5
27.3
29.8
23.2
19.8
6.9%
-10.2%
-2.0%
Prescription Drug Rebates2
(7.3)
(8.4)
(9.8)
(11.5)
(15.1)
(14.7)
(13.2)
16.2%
4.6%
10.3%
Long-Term Care
107.4
113.0
120.2
120.7
123.0
122.7
123.0
4.0%
0.6%
2.3%
Institutional Long-Term Care2
64.3
66.0
68.2
66.6
68.1
67.4
66.5
1.2%
0.0%
0.6%
Home Health/Personal Care2,4
43.1
47.0
52.0
54.1
55.0
55.2
56.5
7.9%
1.5%
4.6%
Medicare Payments2,5
11.0
11.8
12.0
13.7
15.0
14.5
14.8
7.4%
2.6%
5.0%
DSH
15.4
17.7
17.7
17.6
17.3
17.1
16.4
4.4%
-2.3%
1.0%
Inpatient Hospital – DSH
13.0
14.4
14.7
14.7
14.3
14.3
13.4
4.2%
-2.9%
0.6%
Mental Health Facility – DSH
2.5
3.3
3.0
2.9
2.9
2.7
2.9
5.3%
0.4%
2.8%
Medical Services Adjustments6
(5.2)
(5.5)
(7.3)
(6.9)
(7.5)
(8.0)
(7.1)
9.4%
1.1%
5.2%
Administration7
16.4
17.6
18.3
17.9
19.5
22.1
22.8
2.9%
8.5%
5.7%
SOURCE: Urban Institute estimates based on data from Medicaid Financial Management Reports (HCFA/CMS Form 64). Annual expenditures reflect nominal spending for the federal fiscal year.1. The “Acute Care” total here includes EPSDT screening spending, which amounted to $0.9B, $1.0B, $1.2B, $1.3B, $1.3B, $1.2B, and $1.3B in FFY 2007, 2008, 2009, 2010, 2011, 2012, and 2013, respectively.2. The CMS-64 was revised beginning with FFY 2010 data, and beginning that year, this category may not be comparable to that of previous years.3. Includes dental, other practitioners, abortion, sterilization, PACE programs, emergency services for undocumented aliens, and other care services.4. Includes home health services, home- and community-based waiver services, personal care, and related services.5. Includes premiums paid for those dually eligible for Medicaid and Medicare as well as Medicare deductibles and coinsurance for Qualified Medicare Beneficiaries (QMBs).6. Includes collections for overpayments.7. Includes immigration status verification system, preadmission screening, family planning, nurse aide training, external quality review, and enrollment broker costs.
Table 2: Annual Growth in Spending Per Enrollee by Type of Service, FY 2007 – 2013
Annual Growth Rate
Average Annual Growth Rate
Service Category
2007-2008
2008-2009
2009-2010
2010 – 2011
2011-2012
2012-2013
2007-2010
2010-2013
2007-2013
Medical Services
2.7%
3.0%
0.8%
2.2%
-2.4%
4.3%
2.2%
1.3%
1.7%
Acute Care
2.8%
3.4%
3.1%
4.2%
-1.9%
7.0%
3.1%
3.1%
3.1%
Hospitals & Physicians
-2.5%
2.7%
-2.6%
6.3%
-10.7%
3.0%
-0.8%
-0.7%
-0.8%
Medicaid Managed Care
12.0%
6.9%
5.3%
7.5%
12.2%
14.0%
8.0%
11.2%
9.6%
Other Acute Care1
0.3%
0.0%
18.8%
-1.8%
0.7%
2.8%
6.0%
0.5%
3.2%
Prescription Drugs
-1.2%
-2.9%
-4.6%
-11.3%
-43.3%
-24.2%
-2.9%
-27.5%
-16.1%
Long-Term Care
2.6%
2.6%
-3.2%
-1.9%
-3.4%
-1.4%
0.6%
-2.3%
-0.8%
Institutional Long-Term Care
0.0%
-0.4%
-5.8%
-1.7%
-4.0%
-3.0%
-2.1%
-2.9%
-2.5%
Home Health/Personal Care2
6.3%
6.7%
0.2%
-2.2%
-2.6%
0.5%
4.4%
-1.4%
1.4%
SOURCE: Urban Institute estimates based on data from Medicaid Financial Management Reports (HCFA/CMS Form 64), Medicaid Statistical Information System (MSIS), and KCMU/HMA enrollment data. Expenditures reflect nominal spending and exclude payments made under CHIP, Medicare premiums paid by Medicaid for persons eligible for both programs, Disproportionate Share Hospital (DSH) payments, administrative costs, and accounting adjustments. FY 2010 Medicaid Statistical Information System data was used for the proportion of each service category that is represented by the aged/disabled or families. Due to lack of availability of FY 2010 MSIS data for Idaho, FY 2009 Idaho MSIS data adjusted to the given state’s 2010 CMS-64 expenditures was used.1. Includes dental, other practitioners, abortion, sterilization, PACE programs, emergency services for undocumented aliens, and other care services. Other care services could not be calculated separately from other acute care services due to data limitations.2. Includes home health services, home- and community-based waiver services, personal care, and related services.
Table 3. Average Annual Changes in Enrollment and Medicaid Expenditures on Medical Services by Eligibility Group, FFY 2007 – 2013
Average Annual Growth Rate
2007
2008
2009
2010
2011
2012
2013
2007-2010
2010-2013
2007-2013
Total Spending ($ Billions)
All Enrollees
$293
$312
$342
$366
$390
$394
$414
7.7%
4.2%
6.0%
Families1
$99
$107
$123
$138
$152
$156
$169
11.8%
7.1%
9.4%
Aged & Disabled
$194
$205
$219
$228
$239
$238
$245
5.5%
2.3%
3.9%
Enrollment (Millions)
All Enrollees
42.4
43.7
47.1
50.5
53.0
54.4
55.3
6.1%
3.1%
4.5%
Families1
30.0
31.0
34.0
36.9
38.8
39.8
40.5
7.2%
3.1%
5.1%
Aged & Disabled
12.4
12.7
13.1
13.6
14.1
14.6
14.8
3.3%
2.9%
3.1%
Spending Per Enrollee
All Enrollees
$6,909
$7,150
$7,249
$7,245
$7,371
$7,234
$7,486
1.6%
1.1%
1.3%
Families1
$3,286
$3,462
$3,606
$3,734
$3,904
$3,919
$4,187
4.4%
3.9%
4.1%
Aged & Disabled
$15,708
$16,171
$16,678
$16,769
$16,891
$16,280
$16,478
2.2%
-0.6%
0.8%
SOURCE: Urban Institute estimates based on data from Medicaid Financial Management Reports (HCFA/CMS Form 64), Medicaid Statistical Information System (MSIS), and KCMU/HMA enrollment data. Expenditures reflect nominal spending and exclude payments made under CHIP, Medicare premiums paid by Medicaid for persons eligible for both programs, Disproportionate Share Hospital (DSH) payments, administrative costs, and accounting adjustments. Total spending levels and growth rates differ from those presented in previous tables because the data source and method used to calculate total spending are different. Total spending reflects sums of spending by eligibility group which is calculated by taking the 2007 MSIS spending level for each eligibility group and applying the corresponding growth rates. FY 2010 Medicaid Statistical Information System data was used for the proportion of total spending for an eligibility group that is represented by a particular service. Due to lack of availability of FY 2010 MSIS data for Idaho, FY 2009 MSIS data for this state adjusted to the given state’s 2010 CMS-64 expenditures was used. This method is described in more detail in Appendix A. Growth rates for CPI-U Medical Care come from the Bureau of Labor Statistics, Consumer Price Index Detail Report Tables, Annual Average Indexes 2007 – 2013, Table 1A. Consumer Price Index for All Urban Consumers (CPI-U): U.S. city average, by expenditure category and commodity and service group (1982-84=100, unless otherwise noted), http://www.bls.gov/cpi/cpi_dr.htm.1. The term “families” is used to refer to non-disabled children and adults.
Appendix: Data Sources And Methods
Data Sources
Because no existing Medicaid data source includes current spending data, current enrollment data, and detailed data on spending per enrollee, we combine data from three sources for this analysis.
CMS-64. The main source for spending data is the Medicaid Financial Management Reports (Form 64) from the Center for Medicare and Medicaid Services (CMS) for federal fiscal years 2007 to 2013, which are used to obtain aggregate spending. These data are available by state and spending category. At this time, the CMS-64 does not report enrollment or spending by eligibility group. However, in the new future, it will report total enrollment, as well as enrollment for the new adult eligibility group.
Beginning with FY 2010 data, the CMS-64 used new spending categories, which aim both to capture additional spending categories (e.g., those related to provisions under health reform) and to increase consistency across states in how certain types of spending (e.g., “other practitioner”) are classified. To compare the FY 2010 data to previous years, we relied on an updated crosswalk of spending categories from CMS to map the new categories to the previous years’ categories. This crosswalk allows us to examine trends over time, but it is possible that some services shifted categories in some states as a result of this change.
The net expenditure for prescription drugs in Medicaid reflects both the cost of the drug/dispensing fee as well as the rebate received from the drug manufacturer. Drug manufacturers are required to pay these rebates to the federal and state governments for outpatient prescription drugs as a condition of Medicaid coverage for the drug. In most cases, we report net drug expenditures (that is, outlays after accounting for rebates), which represent total program spending for prescription drugs. The rebates effectively lower the price that Medicaid pays for prescription drugs. In some cases, specified in the text, we also report spending for prescription drugs excluding rebates.
Medicaid Enrollment. Data on enrollment come from a survey of all 50 states and the District of Columbia conducted by Health Management Associates (HMA) for the Kaiser Commission on Medicaid and the Uninsured (KCMU). These data provide point in time enrollment for June of each year. Total enrollment data were reported for all states and the District of Columbia for two main groups: 1) aged and individuals with disabilities; and 2) child, parent, and other non-aged, non-disabled adult enrollment (throughout the report referred to simply as “family enrollment”).
MSIS. A third data source, the Medicaid Statistical Information System (MSIS), provides detailed, individual level spending and enrollment data stratified by service type and eligibility group. Data from the 2010 MSIS14 are used to estimate spending growth by eligibility group.
Analytic Approach
Accurately estimating per enrollee spending growth rates requires data that can link spending to enrollment groups. This is because simply dividing the total change in spending by the total change in enrollment would bias the estimate of the growth in spending per enrollee. Overall, for the time period of this analysis, spending would be biased downward because of the faster enrollment among less expensive family beneficiaries relative to the aged and disabled. This bias could be even more pronounced among subsets of services. For example, since families account for only a small share of long-term care spending, enrollment growth among families is not likely to affect long-term care spending.
Unfortunately, the CMS-64 does not enable us to stratify Medicaid spending growth for families versus the aged/disabled because CMS-64 data do not associate spending with eligibility groups. Therefore, the analysis presented in this paper draws on the Medicaid Statistical Information System (MSIS), to estimate spending per enrollee growth by eligibility group. MSIS provides detailed individual-level spending and enrollment data stratified by service type and eligibility group, but it is not available for the more recent years in this analysis. We use the 2010 MSIS, as well as the 2007 MSIS, the year corresponding with the start of the time period in this analysis.
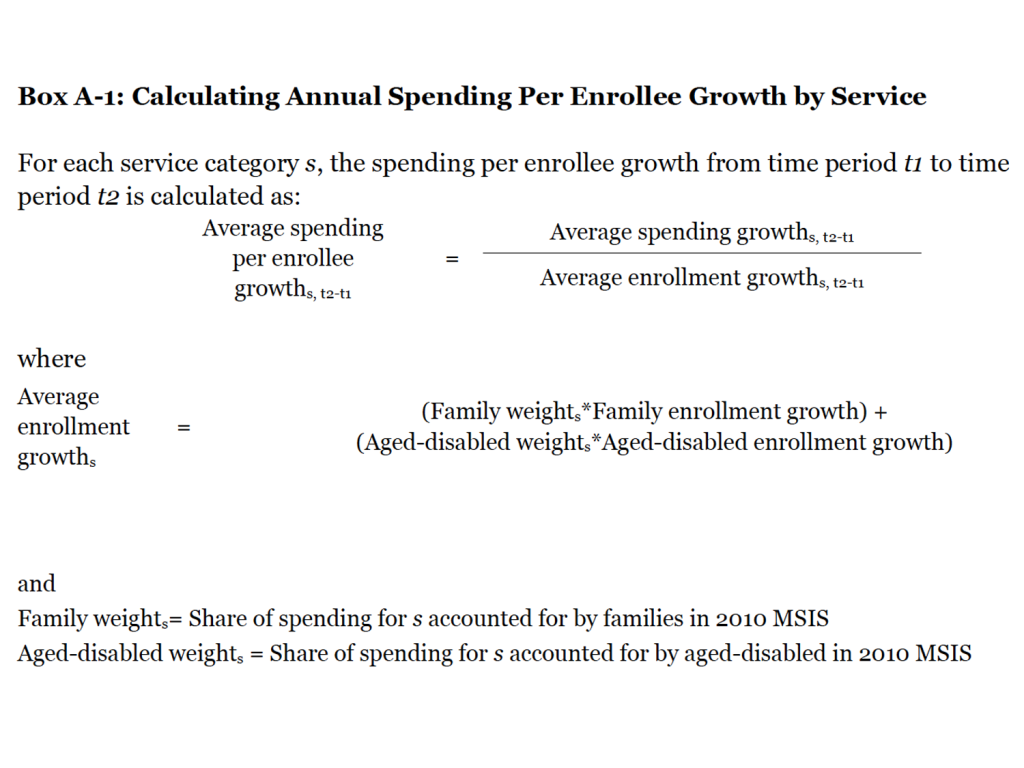
The MSIS is incorporated into the per enrollee estimates in two ways. First, we use the 2010 MSIS data to estimate annual spending per enrollee growth by service in a way that accounts for differences in service use across eligibility groups. To do this, we use MSIS to calculate service-specific annual enrollment growth rates by obtaining service-specific weights for families versus the aged and disabled beneficiaries. These weights are equal to the share of Medicaid spending for each service that each eligibility group generates using the 2010 MSIS. Then, for each service category, we calculate a weighted average of the enrollment growth for the two eligibility groups. For example, the 2010 MSIS indicates that families account for 47 percent of spending on hospitals and physicians, while the aged and disabled beneficiaries account for 53 percent. Thus, we calculate the hospital and physician-specific enrollment growth by weighting the family enrollment growth by 0.47 and enrollment growth for the aged and disabled beneficiaries by 0.53. Finally, we divide the annual spending growth for each service by the weighted annual enrollment growth for each service to calculate the annual spending per enrollee growth for each service (see Box A-1).
Box A-1: Calculating Annual Spending Per Enrollee Growth by Service
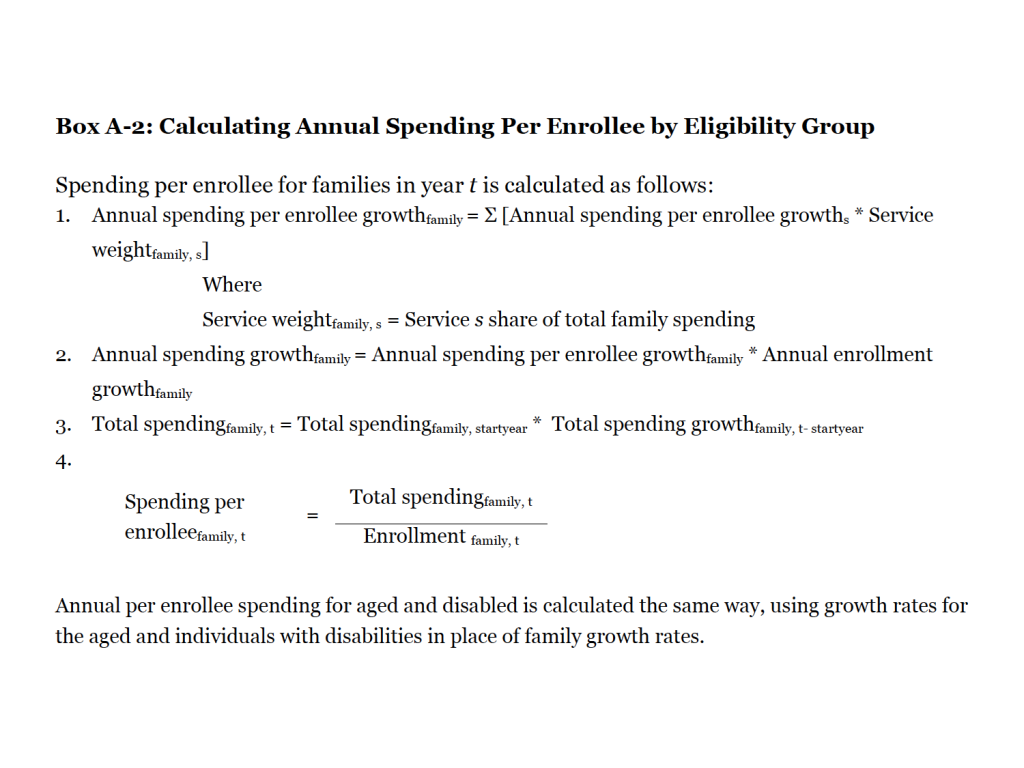
Second, we used MSIS data to estimate annual spending per enrollee growth by eligibility group in a way that similarly accounts for differences in service use across eligibility groups. This analysis enables us to deconstruct total spending growth from year to year into increases in enrollment and increases in spending per enrollee by eligibility group. First, we use the 2007 MSIS to establish baseline spending by eligibility group. Then, to calculate the annual spending per enrollee growth by eligibility group, we weight the annual growth in spending per enrollee for each service by the importance of that service to the specific eligibility group and then aggregate across all services (step 1 in Box A-2). For each eligibility group, we then multiply the annual spending per enrollee growth estimate times the annual enrollment growth. This gives us the annual spending growth rate for each eligibility group (step 2 in Box A-2). Finally, we apply these rates to baseline spending by eligibility group calculated using 2007 MSIS data (step 3 in Box A-2). The spending totals and rates of growth calculated using this method are shown in Table 3 and differ from the spending growth in Figure 5 and Table 1 because the data source and method used to calculate total spending are different. Total spending in Table 3 reflects sums of spending by eligibility group calculated by taking the 2007 MSIS spending level for each eligibility group and applying the corresponding growth rates calculated using data from Medicaid Financial Management Reports (HCFA/CMS Form 64), Medicaid Statistical Information System (MSIS), and KCMU/HMA enrollment data.
Box A-2: Calculating Annual Spending Per Enrollee by Eligibility Group
Endnotes
Unemployment data from Bureau of Labor Statistics: Current Population Survey, Labor Force Statistics. Income data from U.S. Census Bureau, Current Population Survey, Annual Social and Economic Supplements. ↩︎
The CMS-64 includes a category of spending for payments to managed care plans for delivery of benefits to Medicaid enrollees. We classify these payments as acute care spending since the majority of managed care plans in Medicaid cover acute care (versus long-term care) benefits. ↩︎
Although outside the time-frame of this analysis, it is worth noting that in January 2006, prescription drug services and spending for beneficiaries dually eligible in Medicare and Medicaid moved from Medicaid to Medicare Part D. ↩︎
Effective in 2010, the ACA included provisions to increase the base federal rebate, including increasing the federal rebate on most brand name drugs from 15.1% of the drug average manufacturer price (AMP) to 23.1% of AMP. ↩︎
Due to lack of availability of FY 2010 MSIS data for Idaho, FY 2009 MSIS data for this state adjusted to the given state’s 2010 CMS-64 expenditures was used. 2011 MSIS data is available for use, but because data is missing in several states, and because of remaining data quality issues, we opted to use the FY 2010 MSIS. ↩︎
In September 2013, the Centers for Medicare and Medicaid Services approved Arkansas’ Section 1115 demonstration to implement the Affordable Care Act’s (ACA’s) Medicaid expansion by using Medicaid funds as premium assistance to purchase coverage in Marketplace Qualified Health Plans (QHPs) for newly eligible adults.1 The demonstration covers parents from 17-138% of the federal poverty level (FPL, up to $16,242 per year for an individual in 2015) and childless adults from 0-138% FPL. As of January 2014, Arkansas’ demonstration:
Expands Medicaid by purchasing Marketplace QHP coverage for all newly eligible adults.
Requires newly eligible adults to enroll in Marketplace QHPs to receive Medicaid services.
Provides services that are outside the QHP benefit package, such as Early Periodic Screening Diagnosis and Treatment for 19 and 20 year olds, free choice of family planning provider, and non-emergency medical transportation, through the state’s Medicaid fee-for-service delivery system.
In December 2014, CMS approved an amendment to Arkansas’ demonstration, based on changes required by state legislation.2 Previously, Arkansas’ demonstration included cost-sharing at Medicaid state plan amounts at the point-of-service for beneficiaries from 100-138% FPL. As of January 2015, Arkansas’ amended demonstration:
Establishes health savings accounts to which non-medically frail beneficiaries from 50-138% FPL make monthly income-based contributions, ranging from $5 to $25 per month, to be used for co-payments and co-insurance. These contributions are not a condition of Medicaid eligibility.
Imposes cost-sharing at the point-of-service at state plan amounts for beneficiaries above 100% FPL who do not make monthly account contributions.
Arkansas also sought waiver authority to limit non-emergency medical transportation (NEMT) to 8 trip legs per year for non-medically frail beneficiaries. Instead, the state will establish a prior authorization process for NEMT for newly eligible adults (which does not require waiver authority).
Other states expanding or seeking to expand Medicaid through Marketplace premium assistance include Iowa (optional for those from 101-138% FPL) and New Hampshire (pending waiver application would change expansion from direct coverage in the state’s Medicaid program to Marketplace premium assistance beginning January 2016). Additional details about Arkansas’ demonstration are included in Table 1.
Uses Medicaid funds to pay Marketplace QHP premiums for all newly eligible adults statewide (estimated 200,000) under the ACA’s Medicaid expansion..Waiver amendment establishes monthly cost-sharing contributions to health savings accounts for beneficiaries from 50-138% FPL and imposes cost-sharing at state plan amounts at the point-of-service for beneficiaries from 101-138% FPL who do not make monthly account contributions. Account contributions are not a condition of Medicaid eligibility.
Duration:
9/27/13 to 12/31/16.Eligibility effective 1/1/14
Demonstration Goals:
Cites promoting continuity of care, increasing access to care, and increasing Marketplace QHP enrollment.
Coverage Groups Subject to Premium Assistance:
Newly eligible parents ages 19-64 between 17-138% FPL, and newly eligible adults without dependent children ages 19-64 between 0-138% FPL..Anticipates amending waiver in 2015 or 2016 to add parents at or below 17% FPL and children (not included in current demonstration approval).
Enrollment:
QHP enrollment required for demonstration beneficiaries.
Populations Exempt from Premium Assistance:
People who are medically frail are exempt from premium assistance and have choice of FFS coverage of same ABP offered to new adult group or an ABP that includes Medicaid state plan benefit package..Those determined medically frail after QHP enrollment can be disenrolled from premium assistance and reassigned to other Medicaid coverage.. Identified through state-established process. Waiver application describes 12 question online screening assessment, including health self-assessment, living situation, assistance with ADLs/IADLs, acute and psychiatric overnight hospital stays, and number of physician, physician extender or mental health professional visits..People with “exceptional medical needs” as identified through screening assessment, American Indian/Alaska Natives, pregnant women, and dual eligible beneficiaries also are exempt from premium assistance enrollment.
QHP Choice and Auto-Assignment:
Beneficiaries choose between at least 2 silver level Marketplace QHPs. If beneficiaries do not choose a plan, they will be automatically assigned to one..Beneficiary choice among all silver level plans in geographic area that offer only EHB..30 days to change QHP after auto-assignment..Auto-assignment based on target minimum market share of demonstration beneficiaries in each QHP in region.
Premiums:
State pays monthly premiums directly to QHPs..Beneficiaries are not responsible for any premium costs.
Cost-Sharing and Health Savings Accounts:
No cost-sharing for beneficiaries below 50% FPL..Beneficiaries from 50-138% FPL will make monthly contributions, no greater than 2% of income, to health savings (“Independence”) accounts. Monthly contributions are $5 for beneficiaries 50-100% FPL, $10 for those from 101-115% FPL, $17.50 for those from 116-129% FPL, and $25 for those over 130-133% FPL..The state will fund the account to cover beneficiaries’ QHP co-payment and co-insurance obligations beyond Medicaid state plan limits, and a third party administrator will facilitate payments to providers. Beneficiaries will receive a credit or debit card to access account funds to pay co-payments and co-insurance to providers..Cost-sharing is not a condition of Medicaid eligibility and is limited to 5% of monthly or quarterly income..No cost-sharing for beneficiaries who are exempt under federal Medicaid law, including those who are medically frail and those with exceptional medical needs as determined through the Arkansas health care screening questionnaire..Beneficiaries from 101-138% FPL who fail to make monthly account contributions are responsible for Medicaid state plan level co-payments and co-insurance at the point of service, and providers can deny services for failure to pay cost-sharing..Beneficiaries from 50-100% FPL who fail to make monthly account contributions will use their account debit/credit card to pay providers for co-payments and co-insurance and will be billed by the third-party administrator for co-payments at Medicaid state plan amounts for services received. If there are insufficient account funds to cover the bill and it remains unpaid, these beneficiaries will incur a debt to the state, unless the beneficiary self-attests to financial hardship..Beneficiaries who make at least 6 non-consecutive monthly account contributions in a calendar year receive account credits that can be used to offset future QHP premiums (after enrollment in the Medicaid private option ends), employee contributions to ESI, or Medicare premiums (for those over age 64). The credits will be distributed as cash once the beneficiary is no longer eligible for Medicaid as a new adult, if the beneficiary continues to reside in Arkansas. For each month that they make a timely account contribution, beneficiaries accrue the lesser of their monthly contribution amount or $15, regardless of the amount of co-payments or co-insurance charged to the card. Credits are capped at $200 and must be used within 2 years of accrual..Account contributions begin after CMS approval of the state’s Independence Account protocol, and an initial account contribution is required prior to the end of the 2nd month after QHP coverage is effective.
Benefits:
QHP benefits package:
QHPs provide services in the state’s Medicaid Alternative Benefits Package (ABP) for newly eligible adults..ABP is the same as Medicaid state plan benefits package.
Federally qualified and rural health centers (FQHC/RHC):
Beneficiaries will have access to at least 1 QHP that contracts with at least one FQHC/RHC.Waiver application indicates that state will develop an alternative FQHC/RHC payment methodology that moves from FFS per visit payments to those that account for service intensity and reduction in the uninsured. If unable to do so timely, state reserves right to seek waiver of FQHC/RHC reimbursement rules.
Prescription drugs:
Limited to the QHP formulary. Prior authorization within 72 hours instead of 24 hours.
Family planning providers:
State covers out-of-network family planning providers on FFS basis.
Wrap-around benefits:
Provided on a FFS basis (non-emergency medical transportation and EPSDT)..State to establish prior authorization process for non-emergency medical transportation.
Retroactive coverage:
Provides 3 months’ coverage prior to application date on FFS basis.
Appeals:
Demonstration enrollees use the state fair hearing process for all appeals. (AR has approved SPA delegating Medicaid fair hearings for medical necessity and coverage issues for the new adults to state department of insurance.3 )
Financing:
Estimates that the cost of covering the demonstration population will be the same with the waiver as without the waiver: $118 million in CY 2014, $126.4 million in CY 2015, and $135.4 million in CY 2016.
Cost-Effectiveness:
May use state-developed tests of cost-effectiveness for premium assistance that differ from those otherwise permissible.
Oversight:
State Medicaid agency and state insurance departments will enter into MOU or agreement with QHPs regarding enrollment, payment of premiums and cost-sharing reductions, reporting and data requirements, notices, and audits.
Status:
Demonstration approved 9/27/13 and amendment approved 12/31/14..Within 6 months of implementation and annually thereafter, state must hold forum for public comment.
Evaluation:
State submitted draft evaluation design approved by CMS.4 Evaluation shall be conducted by an independent entity.
Reporting:
State must submit quarterly and annual reports to CMS.
Charts Examine Savings from Subsidies at Stake in U.S. Supreme Court Case
Cost-sharing subsidies under the Affordable Care Act can substantially reduce deductibles and other cost sharing for people with low incomes purchasing coverage in the federally-facilitated insurance marketplace serving 37 states, a new analysis by the Kaiser Family Foundation finds. These government subsidies, which are also available in plans sold on state-run marketplaces, are different from premium tax credits. Both are at stake in the King v. Burwell case, the lawsuit which the U.S. Supreme Court will hear in March in which the federal government’s authority to provide financial assistance to people who buy insurance in federally-operated ACA marketplaces is being challenged.
The health law requires insurers to offer enrollees with lower incomes variants of their standard silver plans with lower levels of cost sharing. People with incomes less than or equal to 150 percent of the federal poverty level can enroll in a plan with a 94 percent actuarial value; people with incomes between 150 and 200 percent of the FPL can get a plan with an 87 percent actuarial value, and people with incomes between 200 and 250 percent of the FPL can get a plan with a 73 percent actuarial value. A higher actuarial value means less cost sharing. Standard silver plans have an actuarial value of 70 percent.
In a new brief and collection of 36 charts, the Foundation compares cost sharing across standard silver plans and their variants in federally-facilitated ACA marketplaces, examining average deductibles and out-of-pocket limits, as well as copayments and coinsurance for hospital stays, physician visits, emergency room visits, and prescription drugs.
The comparisons show how average cost sharing declines for lower-income enrollees. Among the findings:
In an accompanying analysis with 65 charts, the Foundation examines cost sharing for plans across metal levels (platinum, gold, silver and bronze) for ACA marketplaces in 37 states. The analysis finds considerable variation in plan design, noting that plans offered in the same state and within the same metal level may have very different cost-sharing structures and still reach the same actuarial value.
Private insurance plans typically require some form of cost sharing (also called out-of-pocket costs) when enrollees receive a health care service covered by their plan. These expenses, which are in addition to the amount an enrollee spends on his or her monthly premium, come in a variety of forms:
Copayments: set dollar amounts for covered services (e.g. $20 per general physician visit);
Coinsurance: a percentage of the allowed cost covered services (e.g. 20% of the allowed cost for a specialist visit);
Deductibles: set dollar amounts that enrollees must pay before their plan starts to cover the service or a group of services (e.g. $200 drug deductible before drug coverage begins);
And, often, some combination thereof.
Insurers use cost sharing to keep down monthly premiums in a couple of ways. First, cost sharing can directly offset premiums by transferring some of the overall costs from monthly payments to payments at the time medical care is used. A second way cost sharing has a downward effect on premiums is by decreasing the amount of health care enrollees use: when a charge is required at the point of care, people tend to utilize fewer services.
Cost sharing can also lead to unexpected costs for some enrollees and can be difficult to decipher when shopping for plans or reviewing medical bills. Although the Affordable Care Act (ACA) requires significantly greater standardization and transparency for individual market coverage than existed before the law went into effect, the answer to the main question on many enrollees’ minds – ‘How much will I spend on health care?’ – is not always straightforward.
This brief shows the cost sharing in plans sold to individuals through Healthcare.gov, with a focus on the variation in the ways plans may set cost sharing for services, such as physician visits, prescription drugs, and hospital stays.
Changes to Cost-Sharing under the Affordable Care Act
The ACA requires new private plans sold to individuals to standardize their coverage and the information they provide to enrollees in a variety of ways:
New plans (both on and off of the Marketplace) must cover at least a basic set of services called Essential Health Benefits (though cost sharing may apply to these services, this provision helps limit out-of-pocket costs by ensuring that a minimum set of services are covered).
Certain preventive services, such flu shots and mammograms, must be covered without cost sharing.
The ACA also sets out-of-pocket limits (which are caps on the amount of annual cost sharing that enrollees may be charged for covered services that are received from in-network providers). In addition, the law does away with annual limits on coverage a plan may pay out.
New plans are now standardized into “metal” tiers – bronze, silver, gold, and platinum – ranging from most to least potential exposure to out-of-pocket costs. The metal tiers are based on a concept called actuarial value, which is the percent of total costs for all enrollees’ covered services that are paid for by the insurer, on average, as opposed to those costs paid for by enrollees. For example, a bronze plan has an actuarial value of approximately 60%, meaning that the insurer expects to pay for 60% of total costs associated with covered medical services, and that – as a group – the enrollees would pay for the remaining 40% of total costs through their combined copayments, coinsurance, and deductibles.
Cost-sharing reductions are available to low-to-moderate income Marketplace enrollees. These cost-sharing subsidies, unlike the more widely known premium tax credit, are only available to people who have incomes between 100 and 250 percent of poverty, and who enroll in a silver plan through the Marketplace. The subsidies work by increasing the actuarial value of a silver plan to be 73, 87, or 94 percent, depending on income. For the lower-income recipients of these subsidies, their out-of-pocket maximums for silver plans will resemble those of gold or platinum plans. (Although the ACA originally called for out-of-pocket maximums to be lowered for enrollees with incomes between 250 and 400 percent of poverty, this was unable to be achieved in combination with the prescribed actuarial value requirements and was changed during the regulatory process.)
An important note is that each of these changes to cost sharing from the ACA, including the calculation of actuarial value, only applies to services offered by in-network providers. Insurers may require enrollees to pay significantly more for out-of-network providers, and plans are not required to offer a cap on expenses enrollees may incur for out-of-network care. Some plans offered on the marketplaces may have limited networks, which only include a limited number of hospitals or physicians in the network.
The ACA requires insurers to make publically available a consumer-friendly, standardized document called a Uniform Summary of Benefits and Coverage (SBC). The SBC summarizes each product’s required cost sharing for in-network and out-of-network services, and is intended to be standardized in a way that allows people shopping for a plan to make “apples-to-apples” comparisons.
Cost-Sharing in Marketplace Plans
Even with this move toward standardization, Marketplace plans still vary quite a bit. Plans offered in the same state and within the same metal level may have very different cost-sharing structures. This is in part because there are many ways plans can set cost sharing and still achieve a given actuarial value.
Example of Variation in Marketplace Cost-Sharing:–A silver level plan in Pennsylvania has a $4,500 deductible, $10 copays for physician visits and no cost-sharing after the deductible for inpatient care.–Another plan in Pennsylvania has no deductible but a $50 copay for physician visits and a 50% coinsurance for inpatient care.–Both plans have an actuarial value of approximately 70%, but the same person may fair very differently in one plan than the other, depending on his or her health care needs in a given year.
This analysis looks at the variation in Marketplace products offered in 2015 within and across metal levels. As the source of the data is Healthcare.gov, this analysis is limited to plans sold to individuals in the 37 states with a federally facilitated or partnership Marketplace (including New Mexico, Oregon and Nevada). The data were de-duplicated so that each unique product was only counted once per state, and we excluded child-only and catastrophic plans. (Catastrophic plans are essentially identical in their cost-sharing structures). We do not include cost-sharing reduction plans in this analysis; we will be looking at those plans in a separate brief.
The analysis relies on data downloaded through Healthcare.gov. In the course of doing this analysis, we found instances where the summary descriptions of cost sharing did not necessarily match information in the plan brochures and SBCs. We did not attempt to verify each description and did not alter any of the information from the downloaded file, which means that some of the plans may be misclassified for certain cost sharing provisions.
Deductibles
Aside from the premium, deductibles are one of the main features that consumers look to when shopping for a health plan. The majority of bronze plans and many silver plans have what are called “combined” deductibles, meaning that there is a single deductible for both medical services and prescription drugs. The plan typically will not begin covering most medical or prescription services until the deductible has been met (though many health plans do not apply the deductible toward certain services).
Medical and Prescription Drug Deductibles
Most silver, gold, and platinum plans, however, have separate medical and drug deductibles (or, in some cases, have no deductible for prescriptions). Enrollees in plans with separate deductibles will begin to receive payment towards their prescriptions once they meet their prescription deductible (or immediately if there is no deductible) even if they have not yet met their medical deductible. Conversely, if an enrollee in one of these plans meets their medical deductible, the plan would then start covering medical services even if the enrollee had not yet reached the drug deductible. In plans with separate medical deductibles, the average bronze deductible is $5,372 and the average platinum deductible is $418 (including many plans with $0 medical deductibles).
Many silver plans with separate deductibles (54 percent) and most gold and platinum plans with separate drug deductibles (61 and 69 percent, respectively) have $0 drug deductibles and therefore begin to pay toward prescriptions immediately. The average prescription drug deductible amounts (including plans with a deductible of zero dollars) range from $133 in platinum plans to $465 in bronze plans.
Separate Drug Deductibles
Inpatient Facility Stays
Most plans have some form of cost sharing that applies when an enrollee enters the hospital as an inpatient. This can be one of the more confusing areas of cost sharing, primarily due to the interaction between the cost sharing for the hospitalization and any general medical deductible the plan may have. Some plans are fairly clear: an enrollee must meet the general medical deductible before any costs for a hospitalization are covered, after which the enrollee may have no additional cost sharing or may have to pay a portion of any costs above the deductible amount. In these arrangements, coinsurance is the most typical form of additional cost sharing.
Other plans are more complicated. Some plans do not apply the general medical deductible to inpatient hospital stays, but have a separate deductible or sizeable copayment that applies to the hospital stay. A copayment may be per stay (i.e., on payment per admission) or it may be assessed for each day of the stay, typically up to a maximum number of days (e.g. $600 per day for up to three days). The patient then often must pay a portion of the additional costs above their separate deductible or copayment, typically in the form of coinsurance. In addition, there are plans that only apply a coinsurance percentage to inpatient hospital stays.
Inpatient Facility Cost Sharing
In the charts, plans with coinsurance and copayment amounts include plans that apply a general medical deductible to inpatient hospital and those that do not because we are unable to separate the cases accurately.
Inpatient Physician Services
In many plans, enrollees are required to pay a percentage of the cost of physician services that they receive in a hospital through coinsurance. In many of these cases the enrollee must first meet the general medical deductible and then pay a portion of the additional costs through coinsurance.
In a large share of plans, the cost sharing for inpatient physician services is the same as for inpatient facility services, for example, each may require the enrollee to pay a coinsurance rate after the general medical has been met. Differences generally occur in plans that have a copayment for inpatient hospital services; in these plans the cost sharing for inpatient physician services may to be coinsurance or no charge, and the enrollee may need to first meet the general medical deductible.
Inpatient Physicians Cost Sharing
Physician Office Visits
Most plans require enrollees to pay cost sharing when they visit a physician’s office, other than certain preventive care visits where cost sharing is prohibited. Most plans require a copayment when enrollees have a primary care or specialist office visit. Coinsurance is much more common among bronze plans (24%) than in within the other metal levels.
Many plans require enrollees to first meet the general medical deductible before any payment is made toward office visits. Some plans will pay toward a small number of (e.g., 3) office visits before an enrollee has met the general medical deductible, but then do not make payments towards additional office visits until after the general medical deductible has been met. Many of these plans require that the enrollee pay a copayment toward the cost of the limited number of covered visits before the deductible has been met, and to pay coinsurance towards the cost of visits that occur after the deductible has been met.
Specialist and Primary Care Physician Office Visits
Emergency Room Visits
There is a mix of cost-sharing approaches for emergency room visits, which in some ways resemble the cost sharing for inpatient hospital stays. Many plans use either a copayment or coinsurance, and in some of these cases there is no coverage until after the general medical deductible has been met. Other plans have both a copayment and coinsurance for an emergency room visit; in some of these plans the general medical deductible does not apply, but enrollees must pay a specified copayment and coinsurance for a portion of the costs above the copayment.
Emergency Room Cost Sharing
Prescription Drugs
As mentioned above, plans also vary in how deductibles apply to prescription drugs. Some plans apply the general medical deductible to prescriptions, which means that no payments are made for prescriptions until an enrollee has met his or her medical deductible. Other plans have a different (generally lower) deductible that applies specifically to prescriptions, while some have no deductible and begin paying toward prescriptions right away. Bronze plans are more likely to have a general medical deductible that includes prescriptions while plans in the other three metal levels are more likely to have separate prescription drug deductibles (or no deductible for prescriptions).
Most health plans in three or four different groupings, or tiers. The tiers reflect where the drug is on the health plan’s drug list, or formulary. Most plans have at least three tiers: generic drugs, preferred brand-named drugs, and non-preferred brand-named drugs. Many plans also have a fourth tier for specialty drugs (e.g., injectable drugs).
Prescription Drug Cost Sharing
The amount and type of cost sharing within plans varies across these drug tiers. Generally, enrollees face lower cost sharing for generic and preferred brand-named drugs and higher cost sharing for non-preferred brand-named drugs and specialty drugs. Plans will have different cost-sharing requirements for drugs on different tiers either to encourage enrollees to use lower cost alternatives or to pass on more of the cost of some drugs. There are plans with copayments and plans with coinsurance in each drug tier; copayments are more common for generic drugs. Some plans have no additional cost sharing once an enrollee meets the applicable deductible.
The level of cost sharing also varies across the metal tiers of plans: for example copays are likely to be higher in bronze plans than in more expensive plans for each of the drug tiers (in plans that require copayments, the average copayment amount for preferred brand-named drugs is $63 for bronze plans, $47 for silver plans, $37 for gold plans, and $28 for platinum plans).
Out-of-Pocket Maximums
An out-of-pocket maximum is the maximum dollar amount that an enrollee is required to spend on covered services received from network providers in a year. After an enrollee meets the out-of-pocket maximum, the plans pays 100% of covered services. Health plans sold in the Marketplace must have an out-pocket maximum for in-network services of no more than $6,600 for an individual plan and $13,200 for a family plan. Almost all plans offered on the exchange have a combined out-of-pocket maximum for medical and prescription drugs. Twenty-eight percent of Bronze plans and 22% of Silver plans have an out-of-pocket maximum for single coverage at the $6,600 limit.
Out-of-Pocket Maximums
Discussion
Many provisions of the Affordable Care Act, including the requirement that plans cover essential health benefits and limits on out-of-pocket maximums, have increased standardization among health plans. Plans also are now required to meet specific actuarial value targets known to consumers through the plan’s metal level. Even with these provisions, there is still considerable variation in the design of plans being offered on the federal marketplace, and plans in the same metal level may have significantly different cost sharing for the same service in the same area. Plans may take very different approaches and still reach the same actuarial value: for example, some plans have large deductibles with little cost sharing after the deductible has been met while others have no or small deductibles but require patients to pay a substantial percentage of the cost at the point of service through high coinsurance rates. Other plans are in the middle, having both deductibles and meaningful copayment or coinsurance requirements.
Given the difference in plans, enrollees may prefer some plans designs over other designs, based on their health needs and the types of services they feel they may use. Enrollees also need to think about how they would pay for the required cost sharing should they become seriously ill; in other words, can they afford to pay the maximum out-of-pocket amount required by their plan. It is important that enrollees consider the cost of using their plan as well as the premium when they are shopping for coverage.
Methods
Data were downloaded from the Data.Healthcare.gov 2015 QHP Landscape file, “Health plan information for individuals and families” on [January 26, 2015]. Plans analyzed include those offered in 2015 in the 37 states using Healthcare.gov (which includes federally facilitated and partnership Marketplaces, including Oregon, New Mexico and Nevada).
Child-only and catastrophic plans were removed, and the remaining unique records (those with identical plan marketing names and cost-sharing structures) were collapsed by state, thereby removing duplications where the same plans are offered in multiple counties within the state. The analysis does not include variations on cost sharing made available through cost-sharing reductions for lower income enrollees and Native Americans.
The analysis relies on data downloaded through Healthcare.gov. In the course of doing this analysis, we found instances where the summary descriptions of cost sharing did not necessarily match information in the plan brochures and SBCs. We did not attempt to verify each description and did not alter any of the information from the downloaded file, which means that some of the plans may be misclassified for certain cost-sharing provisions.
Averages are simple averages and not weighted by enrollment as plan-level enrollment data are not publicly available.