Evolving Picture of Nine Safety-Net Hospitals: Implications of the ACA and Other Strategies

Authors: Teresa Coughlin, Sharon Long, Rebecca Peters, Robin Rudowitz, and Rachel Garfield
Published: Apr 30, 2015

Executive Summary

Safety-net hospitals are an integral part of the U.S. health care landscape, providing care to some of the nation’s most medically vulnerable populations, including Medicaid enrollees and the uninsured. These hospitals also provide high cost services such as trauma and burn care to all populations and serve as training centers for medical professionals. With the implementation of the Affordable Care Act (ACA), the U.S. health care system is rapidly changing, and safety-net hospitals need to make major adjustments to survive in the post-reform environment.

This brief draws on interviews with executives at nine safety-net hospital systems and examines how their hospitals have fared since major coverage provisions of the ACA came into effect in January 2014. The brief also examines new and ongoing strategies that the hospitals are adopting in the face of a quickly changing health care environment.  While acknowledging the importance of the ACA, executives at each system in the study noted that other non-ACA related factors have also shaped how their hospitals fared over the last year.  The hospitals in the study were:  Cook County Health and Hospital System (CCHHS); Denver Health (Denver Health); Harris Health System (Harris Health); New York City Health and Hospitals Corporation (HHC); Parkland Health and Hospital System (Parkland); Santa Clara Valley Health and Hospital System (SCVHHS); San Francisco General Hospital (SFGH); University Medical Center of Southern Nevada (UMC), and Virginia Commonwealth University Health System (VCU).  These hospitals participated in two earlier related studies1  that examined how the systems were preparing for health care reform.  Findings as reported by hospital executives include the following:

Changes in patient mix and financing were tied to state decisions about implementation of the Medicaid expansion for most hospitals.  The study hospitals are operating in very different environments in terms of the extent to which the ACA has been embraced by their state. Some of the study hospitals located in states that implemented the ACA Medicaid expansion (CCHHS, Denver Health, SFGH, and SCVHHS) reported substantial increases in Medicaid charges and declines in self-pay and charity care charges.   HHC and UMC also saw increases in Medicaid charges and declines in self-pay, although these shifts were less pronounced. For HHC in New York, the state was already covering most of the ACA Medicaid target population prior to reform. And in Clark County where UMC is located, a local indigent care fund was paying Medicaid rates for inpatient services it provided to the uninsured before health reform. So although UMC reported   an increase in Medicaid-insured patients, it has not experienced a significant change in overall revenue.

Study hospitals in states not implementing the Medicaid expansion (Harris Health, Parkland and VCU) did not experience large changes driven by increased coverage under the ACA, although VCU had gains related to long-term strategic investments to expand commercial business.   Denver Health also had gains in commercial revenue related to long-term strategic planning. Hospital executives at each of the nine systems commented that as of fall 2014 they have not cared for many individuals who had purchased coverage through the Marketplace. In New York, executives at HHC noted that they expected that enrollees in its qualified health plans (QHPs) would eventually result in increased demand for services; however, given that  a relatively small share of more than one million patients HHC has system-wide, this uptick had not yet been observed  in 2014.

Systems were implementing an array of strategies to retain and attract newly insured patients, including efforts to improve the patient experience and to change the perception of safety-net hospitals.  As more of the uninsured gain health insurance (primarily through Medicaid in states that have opted to implement the expansion), executives acknowledged that they were now competing with other hospitals for those newly insured patients. Efforts to retain and attract newly-insured patients included reducing waitlists, expanding system capacity, modifying hospital infrastructure, marketing the hospital, and engaging employees to better interact with patients.  Executives were mixed on the extent to which they were trying to attract newly insured Marketplace enrollees.  All hospitals except UMC, SFGH and CCHHS either had a QHP on the Marketplace or had contracts with QHPs.

In direct response to the ACA as well as broader market changes, systems were implementing delivery system changes to expand primary care, integrate care and broaden access.  Several of the systems were increasing capacity by partnering with providers “beyond their own walls.” For example, several hospitals were opening up additional primary care clinics, broadening community-based physician networks, and partnering with neighborhood federally qualified health centers (FQHCs), mental health and dental facilities.  Hospitals in California, Texas and New York were or were planning to use Section 1115 Medicaid DSRIP (Delivery System Incentive Programs) to help build a more integrated system and expand capacity.

Executives reported on a number of on-going financing strategies to maximize Medicaid waiver funds (largely 1115 waivers, including DSRIP), to diversify revenues, reduce costs and maximize collections. Hospitals in three study states (California, Texas and New York) were benefitting from funding tied to DSRIP. Illinois’s Section 1115 Waiver allowed CCHHS to create a program to expand Medicaid to the newly eligible ACA population before 2014.   Hospitals were also working to improve efficiency or to optimize billing and collection procedures.

Looking ahead, executives at the study hospitals had mixed outlooks for their systems that were not always aligned to state decisions about the ACA.  For example, despite operating in a state not implementing the Medicaid expansion, VCU leadership was perhaps the most positive, maintaining its strategy to diversify its revenue streams, developing niche service lines and expanding its service area, solidly positioning VCU in its health care market for the near term. Other hospitals, particularly those in states expanding Medicaid, were more optimistic about the opportunities afforded by the new coverage under the ACA.  However, several hospitals in states not implementing the Medicaid expansion (including Harris Health and Parkland) as well as some hospitals in expansion states (like SFGH and UMC) had more concerns about the future.

Despite having different outlooks for their futures, there was considerable consistency across leadership at the nine study hospitals in the challenges they anticipate facing in the future.  Some of these challenges include concerns about maintaining or growing their market share with newly insured patients, adequacy of Medicaid reimbursement and the implications of impending Medicaid disproportionate share hospital (DSH) cuts and of sustainability of Medicaid DSRIP waivers.  More broadly, executives were concerned about satisfying their mission to care for the remaining uninsured (including undocumented immigrants) at the same time when they question long-term political and public support for the safety net in a post-reform world.  Despite challenges, one executive noted that safety-net hospitals that had moved toward systems of health care were in a strong position to deliver care in line with the ACA’s focus on population health and social determinants of health.


Issue Brief

Introduction

Safety-net hospitals are an integral part of the US health care landscape, providing care to some of the nation’s most medically vulnerable populations, including Medicaid enrollees and the uninsured. These hospitals also provide high cost services such as trauma and burn care for the broader community, and many serve as training centers for medical professionals. With the implementation of the Affordable Care Act (ACA), the country’s health care system is rapidly changing, and safety-net hospitals need to make major adjustments to survive in the post-reform environment.

As enacted, the ACA expanded Medicaid eligibility to nearly all low-income individuals with incomes at or below 138 percent of poverty ($16,105 per year for an individual in 2014).  This expansion was intended to be the foundation of coverage for low-income Americans and to fill in historical gaps in Medicaid eligibility for adults. Premium tax credits for coverage in newly established Marketplaces are available to provide coverage to people with moderate incomes. The Supreme Court ruling on the ACA effectively made the decision to implement the Medicaid expansion an option for states. For states that expand Medicaid, the federal government will pay 100 percent of Medicaid costs of those newly eligible for Medicaid from 2014 to 2016.  The federal share phases down to 90 percent by 2020 and thereafter, well above traditional federal matching rate in every state. States that do not implement the ACA Medicaid expansion generally have limited Medicaid eligibility for adults and adults with incomes below poverty are not eligible for financial assistance to purchase coverage in the Marketplace.  As a result, in states that do not expand Medicaid, many adults will fall into a “coverage gap” of having incomes above Medicaid eligibility limits but below the lower limit for Marketplace premium tax credits.

The ACA presents opportunities, challenges and uncertainties for safety net hospitals and health care systems.  Coverage expansions under the ACA via premium tax credits for moderate income individuals and through Medicaid in states adopting the ACA Medicaid expansion provide a major opportunity for safety net systems to gain new reimbursement for patients who previously were uninsured.  At the same time, safety-net providers face challenges and uncertainties due to competition for newly insured patients, low Medicaid reimbursement, and federal reductions in supplemental payments to hospitals for uncompensated care through Medicare and Medicaid DSH payments.   Even with the ACA coverage expansions, an estimated 23 million individuals will remain uninsured in 2019 because some states will not implement the Medicaid expansion, many will remain ineligible for coverage due to immigration status, and some who are eligible will not take up coverage. 2   The uninsured will likely turn to safety net institutions for care, and executives at safety net systems have questions about whether they will have adequate resources to care for the residual uninsured population.

This brief examines how nine safety-net hospitals and their associated health care systems have fared in the months since major coverage provisions of the ACA came into effect in January 2014. The brief also examines new and on-going strategies that hospitals are adopting in the face of a quickly changing health care environment.  While acknowledging the importance of the ACA, executives at each of the nine systems highlighted that other non-ACA related factors have also shaped the how their hospitals fared over the last year.

Study Methods

Between September and October 2014, researchers from the Urban Institute and the Kaiser Commission on Medicaid and the Uninsured conducted semi-structured telephone interviews with executives at the nine-safety net hospitals. These hospitals had participated in two earlier related studies,3  where we examined how the systems were preparing for health care reform. In the interviews for this analysis, researchers collected information about the hospitals’ experiences since January 2014. The interview protocol included questions about changes in finances and patient mix in the wake of reform, strategies the hospitals were pursuing in response to the ACA or other factors (e.g., changes in state policies, local financing or the local health care market), and challenges and opportunities that hospital leadership see for their hospitals going forward. 

Background on Study Hospitals

Table 1 shows basic information on the nine study hospitals and their associated systems. While all are large, urban, academic medical centers, the systems vary considerably in terms of facility size, ranging from UMC with one acute care hospital and seven urgent care clinics to HHC with 11 acute care hospitals and more than 70 primary care clinics.

Table 1:  Study Hospitals and Associated Facilities
Hospital / Health System NameAcute Care HospitalsPrimary Care ClinicsOther
Cook County Health and Hospital System (CCHHS)216 (ambulatory care centers)Infectious disease center, correctional health facility, public health department
Denver Health (Denver Health)194 dental care clinics, 17 school-based health centers
Harris Health System (Harris Health)321(including 5 school based health centers)6 same-day clinics, and 5 specialty outpatient centers
New York Health and Hospitals Corporation (HHC)1170+5 long-term care facilities, 6 multi-specialty diagnostic and treatment centers, home health agency, ACO
Parkland Health and Hospital System (Parkland)11212 school-based health centers
Santa Clara Valley Health and Hospital System (SCVHHS)185 same-day clinics, public health department, correctional facility health center, healthcare for the homeless clinic program
San Francisco General Hospital (SFGH)1261 rehab hospital, public health department
University Medical Center of Southern Nevada (UMC)167 urgent care clinics
Virginia Commonwealth University Health System (VCU)320 specialty inpatient/outpatient clinics

Among our study hospitals, all but one of the systems (UMC) has an affiliated Medicaid managed care plan. Further, four of the systems (Denver Health, Harris Health, HHC, and SCVHHS) developed a QHP that was on the Marketplace in 2014.

Table 2:  Study Hospital Characteristics Related to Medicaid and the Health Plans
Health SystemCity, StateMedicaid ExpansionSystem-SponsoredMedicaid ManagedCare PlanQHP on Marketplace
CCHHSChicago, IllinoisYesYesNo
Denver HealthDenver, ColoradoYesYesYes
Harris HealthHouston, TexasNoYesYes
HHCNew York City, New YorkYesYesYes
ParklandDallas, TexasNoYesNo
SCVHHSSan Jose, CaliforniaYesYesYes
SFGHSan Francisco, CaliforniaYesYesNo
UMCLas Vegas, NevadaYesNoNo
VCURichmond, VirginiaNoYesNo

Study Results

Consistent with the different environments in which the hospitals operate, hospitals had varied experiences during 2014 with regard to financing and patient mix.  In addition, as documented in earlier reports,4  the nine study hospitals pursued a range of strategies to prepare for reform and to bolster financial performance.  Some of these strategies were directly tied to the ACA; others were tied to broader efforts to improve performance.  For example, strategies to maintain existing patients or expand market share are tied closely to new coverage opportunities under the ACA whereas changes in delivery systems, financing and IT strategies, while often tied in part to the ACA, also reflect broader market changes.  Thus, while acknowledging the importance of the ACA, executives at each system in the study noted that other non-ACA related factors have also shaped the how their hospitals fared over the last year.

What changes in patient mix and financing did study hospitals experience?

Most study hospitals located in states that implemented the ACA Medicaid expansion reported substantial increases in Medicaid charges and declines in self-pay and charity care charges.  Most study hospitals located in states that implemented the ACA Medicaid expansion (CCHHS, Denver Health, SFGH, SCVHHS, and UMC) reported substantial increases in Medicaid charges and declines in self-pay and charity care charges, a category typically associated with care for the uninsured. HHC also experienced increases in Medicaid charges and declines in charity care charges, although these changes were more modest. These findings are consistent with other reports.5  Although UMC has seen an uptick in Medicaid insured patients and a decline in self-pay and charity care patients, this trend has not been accompanied by significant increases in Medicaid revenue (see below).

While data were not available for all systems, from the 2nd quarter of 2013 to the 2nd quarter of 2014, Denver Health reported that Medicaid as a percent of total charges across the hospital system grew by 17 percentage points, increasing from 35 percent to 52 percent while self-pay charges dropped by 14 percentage points. Similarly, SCVHHS reported that Medicaid as a percent of total charges across the hospital system grew by 18 percentage points, increasing from 42 percent to 60 percent, while self-pay charges fell by 21 percentage points.  Similar shifts in Medicaid and self-pay patient mix were reported by CCHHS and SFGH.  Executives at CCHHS noted that 2014 was the first time where more than half of the patients were insured as a result of coverage expansions in the ACA (mostly Medicaid).  While there were shifts in payer mix and revenue, none of these hospitals experienced major increases in overall volume of care that were attributed to the ACA. Hospital executives noted that the shifts in payer mix were preliminary and that other changes might become apparent after more time had passed.

HHC experienced modest changes in the share of Medicaid, self-pay and charity care discharges between the 2nd quarter of 2013 and the 2nd quarter of 2014. Medicaid discharges increased by slightly, going from 59.3 percent to 61.7 percent.  At the same time, uninsured discharges decreased slightly from 9.3 percent to 6.8 percent. Comparable shifts were observed in the outpatient setting. HHC executives attributed these relatively modest changes to the fact that ACA Medicaid coverage gains were small in New York since the state had comparatively generous Medicaid eligibility standards before health reform. HHC executives further noted that many uninsured in New York are undocumented and not eligible for coverage under the ACA.  HHC leadership also noted that a broader focus on delivery system reform efforts have resulted in declines in inpatient hospital and emergency room use along with a corresponding drop in hospital revenue.

Overall, UMC has experienced an increase in Medicaid patient volume and, to a lesser extent, revenue since January 2014. The increase, however,  has been somewhat tempered by the fact that some new Medicaid enrollees are being drawn to other preferred providers that also contract with the state’s recently implemented Medicaid managed care program. UMC leadership also noted that reimbursement from Medicaid managed care plans matched the county reimbursement it had received from the indigent care program prior to the ACA, resulting in relatively flat Medicaid revenues.

Study hospitals in non-expansion states did not report significant changes in Medicaid or uninsured patient volume or revenue.  As expected and also consistent with other reports,6  study hospitals in non-expansion states (Harris Health, Parkland, and VCU) did not report significant changes in Medicaid or uninsured patient mix or charges over the past year that they attributed to the ACA.

Hospital executives at each of the nine systems commented that as of fall 2014, they have not cared for many individuals who had purchased coverage through the Marketplace.   Various explanations were offered including: a short observation period; sluggish Marketplace enrollment because the tax penalty for forgoing insurance in 2014 was not sufficiently high to compel individuals; hospitals’ charity care policies, which effectively discourage individuals from purchasing insurance coverage (e.g., Denver Health, Harris Health, Parkland), and decisions not to establish a QHP plan to attract enrollees given their limited focus on the private market prior to the ACA (e.g., CCHHS, SFGH).

VCU, Denver Health and SCVHHS were pursuing new service lines, but did not attribute these changes to the ACA.  VCU attributed recent volume growth to its long-term business strategy to expand its service area and service lines, with a particular focus on developing niche markets to serve the commercially insured patients. Similarly, in an effort to diversify its revenue stream, Denver Health has also pursued the commercial insurance market in recent years, posting strong increases in revenues and volume from commercial payers. SCVHHS has been similarly developing specialty care services to serve commercially insured individuals, including oncology and maternal & child health services.

What strategies did study hospitals implement to maintain and attract newly insured patients?

As uninsured individuals gain health insurance (primarily through Medicaid in states that have opted to implement the expansion), executives acknowledged that they are finding themselves in the unfamiliar position of having to compete with other hospitals for “their” patients.

Hospital executives reported that they were implementing an array of strategies to help improve the patient experience.  CCHHS, for example, is introducing a call center in 2015 so that patients can more easily schedule appointments. Denver Health has recently implemented a number of strategies to optimize admission and utilization patterns to improve inpatient flow and bed capacity, and, for their outpatient clinics, to help reduce the patient waitlist. For example, it opened a ten-bed transitional unit designed for longer stay patients preparing for post-acute care, which made available ten beds for patients with more acute conditions. Denver Health has also expanded inpatient and outpatient operations by hiring staff and expanding operating hours. Executives estimate that Denver Health’s outpatient clinic waitlist has been cut in half due, in part, to these measures.  SCVHHS and Harris Health also reported initiatives aimed at expanding capacity and bolstering patient experience.

Systems were also working to change the perception of safety-net hospitals.  Executives reported efforts to change the culture of safety-net hospitals to try to shift away from being perceived as the hospital only for the low-income and uninsured to one that serves the community at large. This work pre-dated health reform, but continues to be a top priority for executives at each of the systems.  These efforts entail physical modifications and undertaking efforts to advertise and market the hospital.  CCHHS, for example, recently hired community outreach and patient experience staff to attract new patients and to improve the community’s perception of the system. In 2015, SFGH and Parkland will each be opening new hospitals and SCVHHS will open a new bed building. Executives at each of these institutions hoped that the new facilities would help enhance the patient experience as well as improve public perceptions of their institutions.

Efforts to shift the culture of safety-net hospitals also involve engaging employees in how they care for and interact with patients. As SCVHHC realizes new revenues from the ACA enrollees, executives said that they have adjusted compensation packages for front-line workers to help improve employee morale. VCU has recently changed its compensation package for physicians (who are employed by the system) to provide significant incentives for performance. In a similar strategy to improve performance, HHC recently consolidated its physician contracts from several independent medical school affiliation contracts to contracting with one large physician group while maintaining only two of its affiliation contracts.

A major ACA-related decision hospital systems had to make was the extent to which they were going to participate in the Marketplace and try to attract Marketplace enrollees. To participate in the Marketplace, hospitals could develop their own QHP for enrollees to choose, operate as a participating provider in the network for another QHP or do both.  The Marketplace provides an opportunity to retain and bring new patients and revenue to the hospital, especially for systems that have their own QHP. Hospital executives at each of the nine systems, however, expressed some concerns that the Marketplace and QHPs were new and untested in 2014 and felt there was some risk and uncertainty in participating since patient healthcare needs were not known.  In addition, even though each of the study systems (but UMC) has an affiliated Medicaid managed care plan, most safety net systems lack experience with commercial health insurance products.  Executives noted that putting up a QHP for the Marketplace entailed considerable development time, effort and resources for most systems as well as a change in state law for some.

The nine systems examined adopted very different strategies in their approach to the Marketplace. HHC actively pursued Marketplace enrollees, both through its own managed care plan and through contracts with other QHPs. HHC’s QHP enrolled 56,062 individuals – the largest number among all New York QHPs. Denver Health, Harris Health, and SCVHHS also developed a QHP but only achieved modest enrollment. Some of the low enrollment, however, was purposeful. Executives said they were uncertain about the overall risk profile of the Marketplace population and that they worried about getting a disproportionate share of high-risk enrollees.

Denver Health, Harris Health, Parkland, SCVHHS, and VCU all contracted with QHPs.  Despite having a Medicaid managed care plan, VCU elected not to offer a QHP on the Marketplace. According to VCU executives, the rationale behind this decision was that by putting up its own QHP it system would be competing with insurers that the system was to trying to get commercial business from, a situation they wanted to avoid.

While also having Medicaid managed care plans both SFGH and CCHHS did not develop a QHP and also did not contract with any QHPs in 2014.  Executives cited concerns about risk selection and a decision to focus on Medicaid expansion enrollees (rather than Marketplace enrollees) as reasons.

What delivery system reforms are study hospitals pursuing?

The study hospitals had undertaken a number of delivery system reforms both in the months leading up to – and continuing through – ACA implementation. Many of these changes focused on increasing primary care, providing integrated care and expanding access.  A number of study hospitals were operating in states where they were able to pursue delivery system reforms as part of Medicaid waivers (often DSRIP) and a few were in states making major shifts to Medicaid managed care.

A major way the systems increased capacity in 2014 was to partner with providers “beyond their own walls.” Nearly all of the study hospitals provided examples of how they were partnering with other community providers. For example, CCHHS recognized the strain that the early Medicaid expansion population placed on its system and, in response, made efforts to ramp up its primary care capacity. It contracted with FQHCs, mental health and dental facilities in the area.  Through its 2011 Section 1115 Medicaid DSRIP waiver, Harris Health has opened up several primary care clinics, adding some 50,000 primary care encounters in 2014. Executives highlight that this expansion has had a “downstream impact” and the system has experienced a volume increase in specialty care referrals, outpatient procedures and inpatient hospital care.

Similarly, motivated in part by its success in garnering a sizable number of QHP enrollees and the need to expand capacity, as well as its recently approved Section 1115 Medicaid DSRIP waiver, HHC broadened its community-based physician network and pursued collaborative relationships with providers outside its system.

SCVHHS is also looking to change its delivery systems by building several “neighborhood” clinics. While having been long focused on community-based care, SCVHHS executives explained that the system is “going down one level further” and opening smaller clinics that will serve as satellites to SCVHHS’s larger clinics. Given the geographic reach of its system and the diverse population it serves, SCVHHS leadership felt having clinics in neighborhoods would more effectively serve patients, providing patients easier access as well as building a strong community connection for the system.

In 2014 the San Francisco Department of Health, which SFGH is part of, launched an effort to develop an integrated delivery model akin to the Kaiser Health Plan. But instead of including community providers, the effort focuses on building a network across department providers including SFGH, a rehab hospital, primary care and behavioral health clinics. As part of this endeavor, certain administrative functions, such as human resources and contracting, are also being centralized.

More broadly, VCU recently purchased a hospital to help free up capacity in its main hospital to treat more medically complex patients and to also diversify its revenue streams (see below). Eighty miles to the south of VCU’s flagship hospital in Richmond Virginia, the newly acquired hospital is closer to where many of VCU’s patients live.  Apart from buying a hospital, VCU has recently extended its service region by deploying its workforce into other hospitals in outlying communities as a way to reach new markets.

Some study hospitals were further developing IT systems to better communicate with community partners and to improve quality of care.  While executives at VCU noted that they had well-operating IT systems and were not undertaking new initiatives in this area, others reported new IT efforts to support their larger aims. After launching an integrated electronic health record (EHR), Denver Health, HHC and SCVHHS were moving to an Epic-based IT system.  Leadership at these hospitals explained that this switch would enable them to better communicate with their community partners, many of whom also use Epic-based systems, and thus will help improve patient quality of care and facilitate population health management.  CCHHS has nearly completed implementation of an EHR, a system which allows for some transfer of patient data and care plans for providers within its own network; however, only limited information sharing is available with outside providers at this point. Parkland is leveraging its existing IT system to better support integration with community partners and social services – specifically, it is developing a program to electronically share certain health information with community based organizations that provide social services to Parkland patients.

Leadership at two of the hospitals (SFGH and UMC) acknowledged that their IT is not meeting their needs.  SFGH, for example, has yet to implement an integrated EHR, with executives noting that they had not capitalized on Meaningful Use funding opportunities. SFGH leadership worries that the lack of an integrated EHR will limit the system in the future. UMC also does not have a fully integrated EHR, and is navigating funding challenges that impede IT expansion efforts.

What financing strategies are study hospitals using?

Executives noted undertaking several financial strategies in the wake of reform and in response to local market conditions.  Leadership at each institution described efforts aimed at cost reduction as well as strategies to help them compete in their respective markets.

Tapping Medicaid revenues through Section 1115 waivers (primarily DSRIP) continues to be a major financing strategy for several of the systems. Since 2010, California, New York and Texas have each received Section 1115 waivers that include DSRIP initiatives that have provided significant funding to Harris Health, HHC, Parkland, SFGH, and SCVHHS.  Executives at each of these systems commented on the importance of DSRIP funds in preparing for reform and to help transform how they deliver health care.  New York’s DSRIP waiver was most recently approved and implementation is underway.  While recognizing the importance of the funding and objectives of the waiver, HHC executives expressed some concerns that DSRIP funding is contingent upon meeting certain targets and there are no guarantees.  Illinois’s Section 1115 waiver allowed CCHHS to begin covering the ACA expansion population early, bringing Medicaid revenues to the system for this population.

Several of the study hospitals are also looking at ways to diversify their revenue sources to reduce their dependence on government funding.  Denver Health, SCVHHS and VCU were the most explicit about strategies designed to grow new revenue streams with the aim of expanding their business and local market share. VCU has perhaps been the most aggressive in this regard, with a particular focus on building up commercial revenue. As of the second quarter of 2014, nearly half (46 percent) of VCU’s system charges came from private payers.  A major way VCU has been able to bring in commercial payers is by pursuing medically complex patients, on which executives note the system makes 85 percent of its margin, and by developing “niche” service lines such as transplants, an artificial heart program, oncology and pediatric subspecialties. Most recently, VCU added neurological and musculosketal rehabilitation services.

For the other two systems looking to diversify their revenues and expand business, Denver Health has been trying to bring more county employees into its health plan whereas SCVHHS is looking to expand its Medicare revenue, a patient group that leadership acknowledges as having difficulty retaining once they qualify for Medicare. To that end, SCVHHS is expanding its services to include sub- and post-acute care and long-term care services.  Similar to VCU, SCVHHC also has been gradually making investments in specialty care services. Long a regional center for burn, trauma and rehabilitative services, SCVHHC has recently added oncology to the list. In addition, building off its high quality scores on maternal and child health care services, in 2014 SCVHHS launched a Women’s and Children’s Center as a way to draw new patients to its system. Finally,   UMC is pursuing new technology and specialized equipment, such as robotic surgery, to enhance its efforts to attract more surgical subspecialists to the medical staff.

Cost reduction and optimizing collections continue to be financial strategies most study hospitals were pursuing.  While pushing forward on its long-standing Lean management program, Denver Health, for example, has also conducted a staffing productivity evaluation and restructured staff to reduce costs and improve efficiency.  The reorganization included the addition of a Chief Acceleration Office to help the system respond more quickly and adeptly deal with emerging issues.  In addition, Denver has recently established two strategy committees – one that is focused on a five-year plan while the other is focused on implementing an annual plan.

SFGH, within the last two years and HHC, seven years ago, started using Lean and other strategies to optimize efficiency and financial structures throughout their systems. In addition, HHC is seeking FQHC status for its clinics and has pushed to make optimal use of providers by pursuing Level 3 PCMH for its clinics and revamping physician contracts as discussed above. HHC also eliminated about 1500 fulltime staff positions as a cost-saving measure.  While not aimed at improving operational efficiency, as mentioned, UMC closed clinics and laid off staff to improve operational efficiency as well as address a reduction in patient volume and revenue in 2014.

The hospitals are also taking action to optimize financial collection processes. For example, Parkland has focused on improving its revenue cycle over the past six months and has seen some uptick in payments from commercial insurers as a result.  CCHHS has worked to optimize billing procedures and other collection procedures.  It has also worked to improve its revenue cycle by reducing its accounts receivable.

In an effort to improve its difficult financial situation, UMC plans to develop a robust academic relationship with the soon to be established University of Las Vegas School of Medicine. With the anticipated addition of the local medical school affiliation, UMC hopes that an academic program centered around UMC on its home turf (Las Vegas) coupled with developing strategic relationships with physicians will draw more business to the system.

Some systems were restructuring charity care policies given other available coverage options.  Several systems (e.g., Denver Health, Harris Health, Parkland) have long-standing indigent care programs where patients with incomes under a certain threshold are offered free or discounted health care services. Given availability of new coverage in the Marketplace, executives were rethinking these policies.  Hospitals are discussing ways to transition individuals who qualify for Marketplace coverage from receiving benefits from charity programs.  In 2014, SCVHHS, for example, adjusted its indigent care program so that cost sharing starts for individuals with incomes above 138 percent of the federal poverty limit, the income cutoff for the ACA Medicaid expansion population.  Harris Health maintained its charity care policies in 2014 but recently proposed an option to encourage qualifying individuals in its indigent care program to purchase coverage through the Marketplace, aided by premium support from local foundations.  Parkland has altered its financial assistance categories to incentivize people to gain coverage through the Marketplace while providing some income-based financial support for cost-sharing.  In addition, patients with incomes above 100 percent of poverty who do not purchase Marketplace coverage will be responsible for modest cost-sharing if they receive services through Parkland’s indigent care program.  Hospitals acknowledged that changing their indigent care policy is a tough issue for local decision-makers. Many charity care programs have been in place for decades making it difficult to reduce eligibility and support.

Looking Ahead

Executives at the study hospitals had mixed outlooks for their systems going forward into 2015. CCHHS, Denver Health, HHC, SCVHHS and VCU executives were optimistic about the near future given the myriad of changes with the ACA.  Despite operating in a state not implementing the Medicaid expansion, VCU leadership was perhaps the most positive, maintaining its strategy to diversify its revenue streams, developing niche service lines and expanding its service area, solidly positioning VCU in its health care market for the near term. Optimism among executives at CCHHS, HHC, Denver Health and SCVHHS was tied to a great extent to their systems’ performance under health reform. As one executive put it, the ACA has given them the “revenue oxygen” to have a fighting chance in the changing health care market. Further, over the next couple years, many of these hospitals hope to realize even more ACA-related revenues by enrolling more Marketplace-covered individuals in their system health plans or building stronger ties with commercial QHPs.

In contrast, despite enrolling a sizable number of ACA Medicaid beneficiaries in its health plan in 2014, leadership at SFGH were less sanguine about the future. Executives expressed some concern about how SFGH has positioned itself in the post-reform market and worry that this may affect its long-term ability to continue being a leading safety net system.  Even though Nevada implemented the ACA Medicaid expansion, UMC has not benefitted from increased Medicaid revenues, since the new ACA Medicaid related income stream has only replaced funding from the pre-existing county indigent care program. With the recent change in its local medical school affiliation, however, UMC executives hope it can improve its current very challenging financial situation over time.

Parkland and Harris Health executives expressed concern about the future, particularly related to Texas’s decision not to take up the ACA Medicaid expansion since many of their patients would qualify for coverage that would have brought new revenue to their systems.  Further, owing to a change in state policy, Parkland and Harris Health have seen recent reductions in their Medicaid DSH payments. In addition, Harris Health has experienced a drop in local tax support revenue and expects further reductions in the future. Maintaining that they are already low-cost providers, Parkland and Harris Health executives worry that they will have to reduce services and programs unless some financial relief is provided.

Despite having different outlooks for their futures, there was considerable consistency across leadership at the nine study hospitals in the challenges they anticipate facing in the future.  These include concerns about maintaining/growing market share with newly insured patients; concerns about adequacy of Medicaid reimbursement levels; implications of federal cuts in Medicaid DSH; the financial implications of Section 1115 Medicaid waivers, and concerns about continued political and public support for the safety net in a post-reform world. Hospital executives also universally asserted they would continue to satisfy their mission to care for the uninsured.  One interviewee shared the sentiment widespread among the study hospitals that “providing safety net services is who we are and what we do”. That said, they acknowledged the very difficult challenge of balancing the safety net mission with the realities of the emerging health care market is not easy, especially as the share of the population without coverage shrinks, leaving a larger share of undocumented immigrants as the core uninsured.  Despite challenges, one executive noted that safety-net hospitals that had moved toward systems of health care were in a strong position to deliver care in line with the ACA’s focus on population health and social determinants of health.

This issue brief was prepared by Teresa A. Coughlin, Sharon K. Long, and Rebecca Peters of the Urban Institute and Robin Rudowitz and Rachel Garfield of the Kaiser Family Foundation’s Commission on Medicaid and the Uninsured (KCMU).

The authors express their appreciation to hospital executives that participated in the interviews for this report.

Endnotes

  1. Coughlin TA, Long SK, Sheen E, Tolbert J. 2012. How five leading safety-net hospitals are preparing for the challenges and opportunities of health care reform. Health Affairs. 8(2012):1690-1697.u00a0 Coughlin TA, Long SK, Peters R, Arguello R. 2014. Strategies in 4 safety-net hospitals to adapt to the ACA. Washington, DC: The Kaiser Commission on Medicaid and the Uninsured. ↩︎
  2. Elmendorf DW. CBOu2019s analysis of the major health care legislation enacted in March 2010: statement before the Subcommittee on Health, Committee on Energy and Commerce, US House of Representatives, ↩︎
  3. Coughlin TA, Long SK, Sheen E, Tolbert J. 2012. How five leading safety-net hospitals are preparing for the challenges and opportunities of health care reform. Health Affairs. 8(2012):1690-1697.u00a0 Coughlin TA, Long SK, Peters R, Arguello R. 2014. Strategies in 4 safety-net hospitals to adapt to the ACA. Washington, DC: The Kaiser Commission on Medicaid and the Uninsured. ↩︎
  4. u00a0u00a0Coughlin TA, Long SK, Sheen E, Tolbert J. 2012. How five leading safety-net hospitals are preparing for the challenges and opportunities of health care reform. Health Affairs. 8(2012):1690-1697. Coughlin TA, Long SK, Peters R, Arguello R. 2014. Strategies in 4 safety-net hospitals to adapt to the ACA. Washington, DC: The Kaiser Commission on Medicaid and the Uninsured. ↩︎
  5. See for example, DeLeire T, Joynt K and R McDonald. 2014. Impact of Insurance Expansion on hospital uncompensated care costs in 2014. Department of Health and Human Services, Office of Assistant Secretary for Planning and Evaluation, September 24. ↩︎
  6. Ibid. ↩︎
Medicaid Expansion, Health Coverage, and Spending: An Update for the 21 States That Have Not Expanded Eligibility

Authors: Matthew Buettgens, John Holahan, and Hannah Recht
Published: Apr 29, 2015

Issue Brief

Summary

Ever since the Supreme Court ruled in June 2012 that states could effectively choose whether or not to accept the Affordable Care Act’s expansion of Medicaid eligibility, that choice has been one of the most prominent and often one of the most contentious issues for states. In this report, we provide new projections of the impact of Medicaid expansion on health coverage, Medicaid enrollment, and costs in states that have not expanded Medicaid. We find that if the 21 states that have not expanded Medicaid as of April 2015 were to do so:

  • The number of nonelderly people enrolled in Medicaid would increase by nearly 7 million, or 40 percent.
  • 4.3 million fewer people would be uninsured.
  • There would be $472 billion more federal Medicaid spending from 2015 to 2024.
  • States would spend $38 billion more on Medicaid from 2015 to 2024.
  • Savings on reduced uncompensated care would offset between 13 and 25 percent of that additional state spending.
  • States would be able to realize other types of budgetary savings if they expanded Medicaid that are not included in this report.

Introduction

A central goal of the Affordable Care Act (ACA) is to significantly reduce the number of uninsured by providing affordable coverage options through Medicaid and new Health Insurance Marketplaces. As enacted, the ACA would expand Medicaid for nearly all low-income Americans with incomes up to 138 percent of poverty ($16,242 per year for an individual in 2015). However, the Supreme Court ruling on the ACA effectively made the decision to implement the Medicaid expansion an option for states. For those that expand, the federal government will pay 100 percent of Medicaid costs of those newly eligible from 2014 to 2016.1  The federal share gradually phases down to 90 percent in 2020 and remains at that level thereafter. The state’s standard FMAP applies to services for those that were previously eligible for Medicaid. There is no deadline for states to adopt the expansion; however, the federal match rates are tied to specific years.

As of April 2015, 21 states have not expanded Medicaid. These decisions will have enormous consequences for health coverage for the low-income population. In states that do not implement the Medicaid expansion, millions of low-income adults that could have gained Medicaid will remain ineligible for the program. A small number of these people may be eligible for tax credits to purchase private coverage, but the majority will be left without an affordable coverage option.

As of the time of writing, the Medicaid expansion issue continues to be debated in a number of state legislatures. The most recent state to adopt the Medicaid expansion was Montana. The expansion in Montana requires federal waiver approval to be implemented. To inform state decisions about expanding Medicaid, we estimate the coverage and cost impact if these states opted to implement the Medicaid expansion.

In this report, we provide state-level estimates of Medicaid enrollment and the number of uninsured in 2016, both with and without Medicaid expansion, for the 21 states that have not expanded eligibility. We also provide estimates of Medicaid and uncompensated care spending for the period 2015 to 2024. Our spending estimates include acute care for the nonelderly, care for the elderly, and long-term care. Because Medicaid and CHIP are funded by the federal and state governments in partnership, we estimated both the federal and state shares of spending. We used the Health Insurance Policy Simulation Model-American Community Survey (HIPSM-ACS) to estimate the effects of the ACA.2  This paper updates estimates from 2012 and 2013.3  We have made a number of important updates since the older reports:

  • State expansion decisions are as of April 2015. The previous update from July 2013 included 27 states that had not adopted the expansion. Since that time, Indiana, Michigan, Montana, New Hampshire, Ohio and Pennsylvania have adopted the expansion.
  • The current 10-year budget window is 2015-2024. Federal matching rates under the ACA vary by year, so years included affect how total spending is divided into federal and state shares.
  • We account for changes in state eligibility rules other than ACA Medicaid expansion since 2011. For example, in 2014, Wisconsin extended eligibility of childless adults to 100 percent FPL and lowered the eligibility threshold for parents from 200 percent to 100 percent FPL.
  • We use final ACA regulations on Medicaid eligibility determination and the income thresholds based on modified adjusted gross income that are now used to determine eligibility for most Medicaid beneficiaries.
  • We updated pre-ACA Medicaid enrollment and spending for the non-elderly, along with spending on the elderly and long-term care from the latest available MSIS (2012 or 2011, depending on the state).
  • The model is based on three years (2009-2011) of the American Community Survey (ACS) pooled together. This survey has a much greater sample size than the Current Population Survey used in our earlier model, improving state-level estimates of the characteristics and costs of enrollees.
  • The survey data were aged to 2015-2024 using the latest Census projections. Projections available at the time the work was done on the earlier paper were still based on the 2000 Census, not the 2010 Census. Since Census does not produce state-level population projections, we used our own projections for the largest states, based on Census population estimates through 2013.
  • Cost growth projections incorporate estimates of actual growth from 2011-2013, which was lower than historical trends.

This report focuses exclusively on Medicaid funding. Children covered through Title XXI Medicaid programs funded through the Children’s Health Insurance Program (CHIP) are not included in our estimates.

The ACA requires states to maintain eligibility standards for children until 2019. After that, states can cut back eligibility for both Medicaid and CHIP to 138 percent of the FPL. In this report, we assume that states maintain eligibility levels for children past 2019.

About HIPSM

The Health Insurance Policy Simulation Model (HIPSM) is a sophisticated microsimulation model that is used to estimate the impacts of health reforms and to inform state and national policy design choices. HIPSM has been used to assist state and federal governments with ACA implementation and analysis of policy options under the ACA.  The core data in the model are from the Census Bureau’s American Community Survey, an annual survey of 3 million U.S. residents.  Census Bureau population projections are used to produce estimates through 2024.  Health care use and spending are estimated for each individual for different insurance types based on data from the Medical Expenditure Panel Survey-Household Component.  The cost of covering an individual in Medicaid varies according to health status, age, previous coverage, state of residence, and other characteristics.  We incorporated state-specific trends in Medicaid costs using data from the Medicaid Statistical Information System, adjusting for the differences in health care costs between adults eligible with and without Medicaid expansion.

We model eligibility status for Medicaid, the Children’s Health Insurance Program and subsidized coverage in the Marketplaces, and then use the HIPSM to simulate the decisions of employers, families, and individuals to offer or enroll in health insurance coverage.  Not everyone who is eligible for Medicaid enrolls in the program.  HIPSM estimates take-up of Medicaid based on an individual’s characteristics, such as income, age, health status, and current coverage, rather than applying a uniform participation rate across the population.  The model is calibrated so that overall take-up rates are comparable to findings in the empirical economics literature.4 

Results

Increases in Medicaid Enrollment

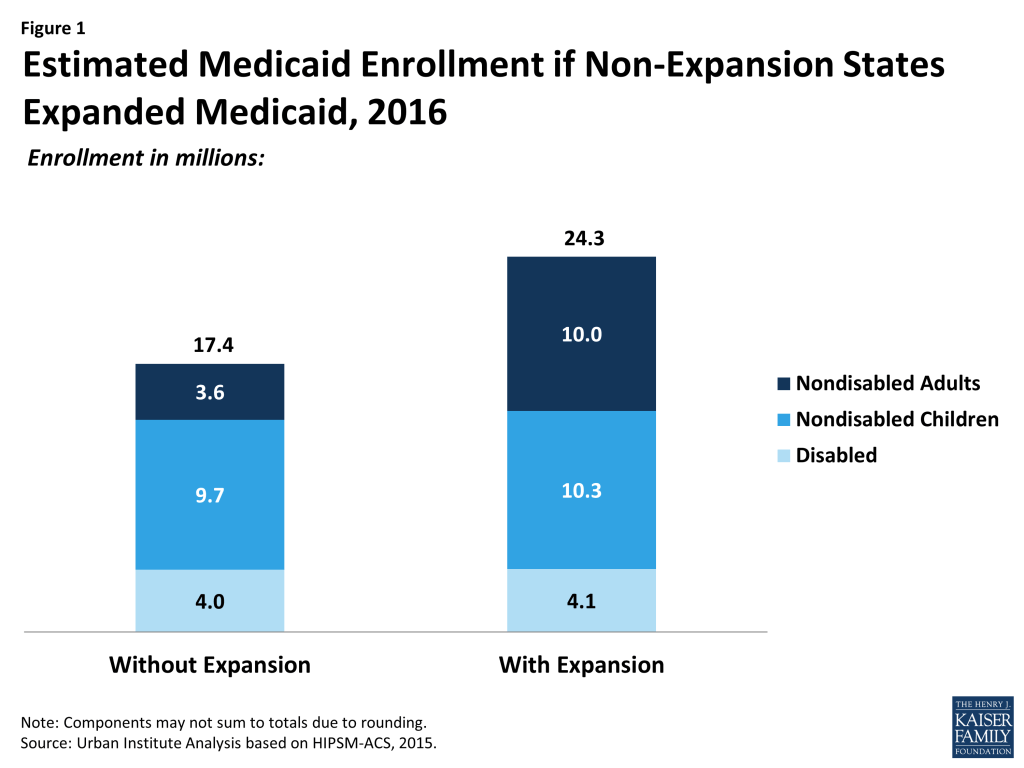
With no change in state expansion decisions, we estimate that in 2016, 17.4 million nonelderly people will be enrolled in Medicaid in the 21 states that have not expanded Medicaid eligibility (Figure 1). Were these states to expand Medicaid, enrollment would increase by 40 percent to 24.3 million. Those gaining eligibility under expansion would all be nondisabled nonelderly adults, so the increase in enrollment would be concentrated in that group (from 3.6 million to 10.0 million). However, more than 525,000 more children would also be covered. Although children do not gain eligibility under expansion, the expansion of coverage to parents is expected to make them more likely to enroll their children.

Figure 1: Estimated Medicaid Enrollment if Non-Expansion States Expanded Medicaid, 2016

There are considerable differences between states in the extent to which enrollment would grow under expansion (Figure 2 and Table 1). Important state-specific factors that affect enrollment growth under expansion include the underlying income distribution, Medicaid eligibility rules before the ACA, the share of the population who are immigrants, and the availability of employer-sponsored insurance to low-income working families. Three states would see increases in Medicaid enrollment of 50 percent or more: Idaho, Texas, and Kansas. Fourteen states would see enrollment grow between 30 and 50 percent. The smallest rates of growth would occur in states such as Wisconsin that have already extended Medicaid eligibility for adults (both parents and childless adults) beyond what was required by law. In Wisconsin, for example, adults are already eligible up to 100 percent of the FPL through a state plan amendment and under a Section 1115 waiver.

Figure 2: Estimated Change in Medicaid Enrollment if Non-Expansion States Expanded Medicaid, 2016

Decreases in the Number of Uninsured People

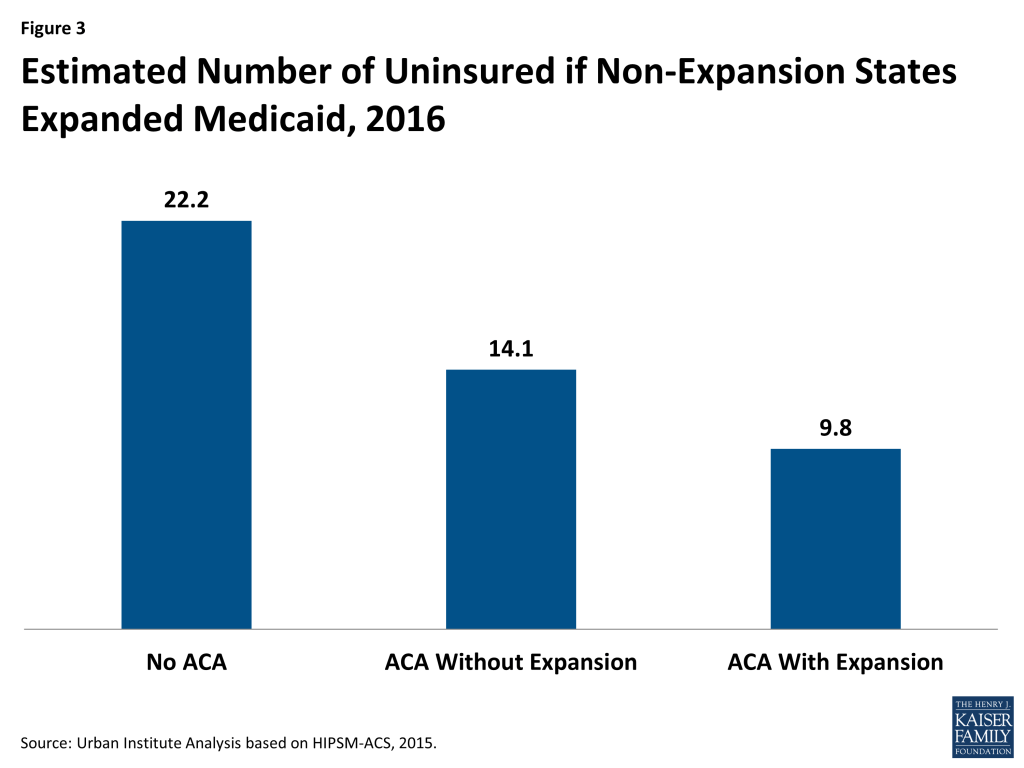
Although our focus is on the difference in the number of uninsured with or without Medicaid expansion, this difference should be understood in the context of the total number of uninsured people in these states. We estimate that if the ACA had never been implemented, 22.2 million people would be uninsured in 2016 in the 21 states that have not expanded Medicaid (Figure 3). The ACA, even without Medicaid expansion, is expected to reduce the number of uninsured to 14.1 million, a decrease of 37 percent. Were all of these states to expand Medicaid, the number of uninsured would decline further to 9.8 million, a decrease of 56 percent from the number without the ACA.

Figure 3: Estimated Number of Uninsured if Non-Expansion States Expanded Medicaid, 2016

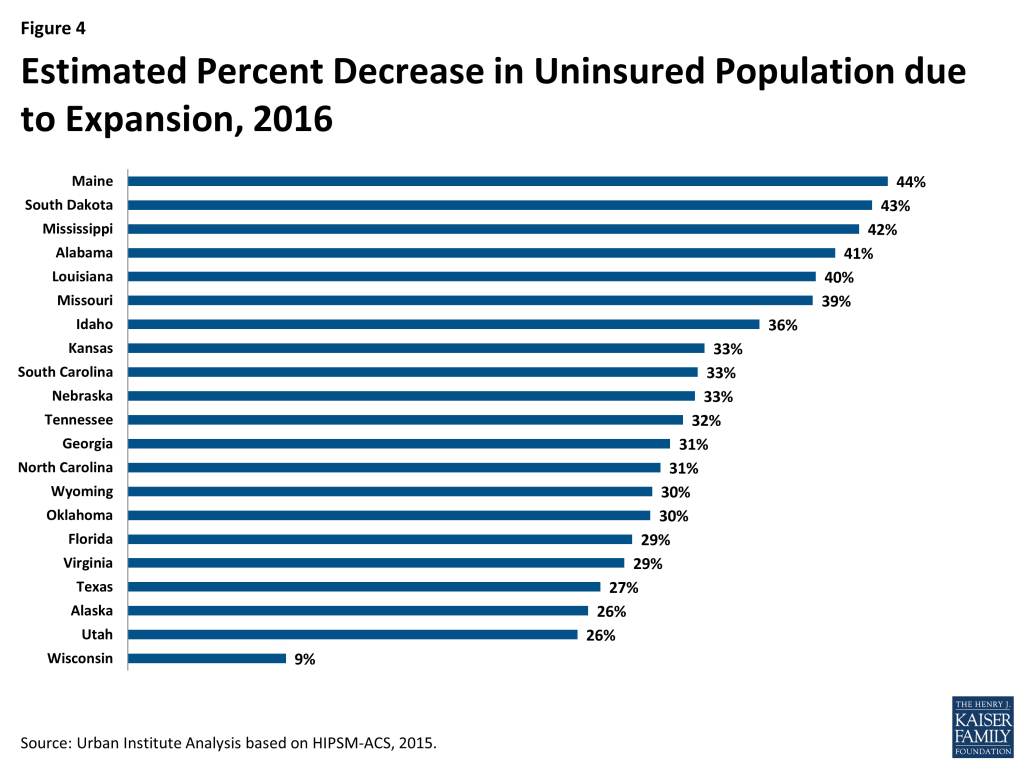
Six states would see their uninsured populations reduced by about 40 percent or more if they implemented the Medicaid expansion (Figure 4 and Table 2): Maine, South Dakota, Mississippi, Alabama, Louisiana, and Missouri. The only state that would see a reduction in the uninsured of less than 25 percent would be Wisconsin. As mentioned above, Wisconsin already covers adults up to 100 percent of the FPL under Medicaid under a Section 1115 waiver.

Figure 4: Estimated Percent Decrease in Uninsured Population due to Expansion, 2016

Medicaid Spending

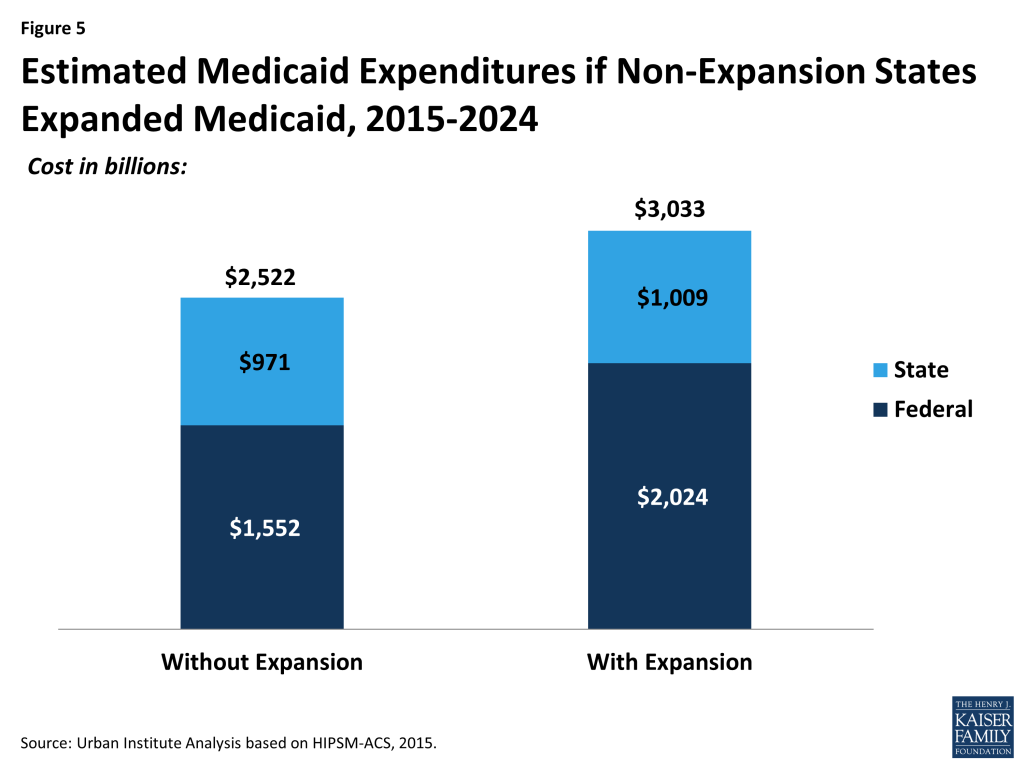
We estimate that from 2015 to 2024, the Medicaid programs in the 21 non-expansion states would spend $2,552 billion with no change in their expansion status, with $1,552 billion funded by the federal government and $971 billion funded by the states (Figure 5). This spending figure includes acute care for the nonelderly as well as care for the elderly and long-term care. Were these states to expand Medicaid, federal Medicaid spending from 2015 to 2024 would rise by 30% while state spending would rise by 4%.

Figure 5: Estimated Medicaid Expenditures if Non-Expansion States Expanded Medicaid, 2015-2024

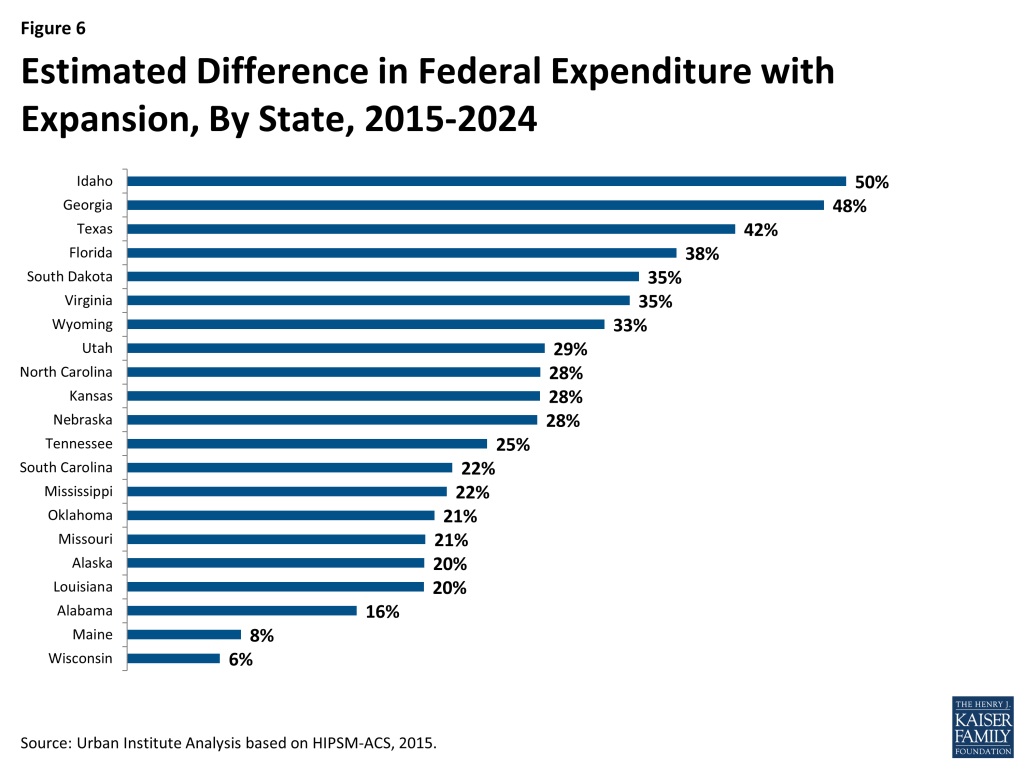
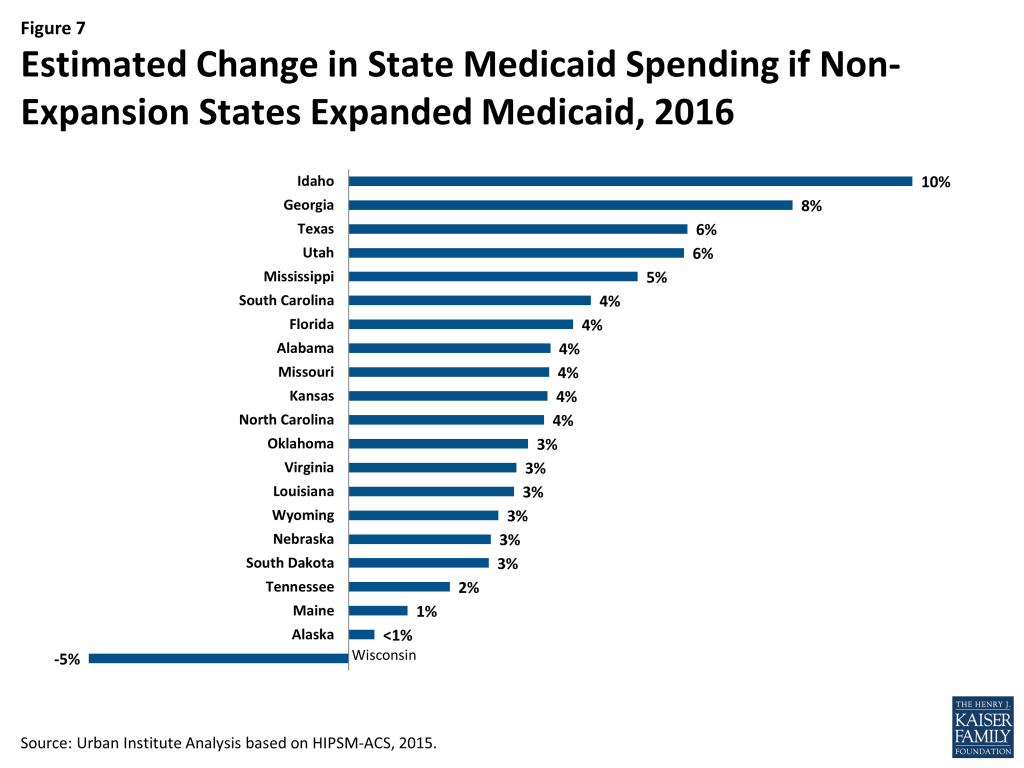
Not surprisingly, the states that would see the largest increases in enrollment with expansion would also see some of the largest increases in the federal and state Medicaid spending (Figure 6 and 7 and Table 3). Idaho and Georgia would see increases of 50 and 48 percent in federal spending and 10 and 8 percent in state spending, respectively. Wisconsin would see a much smaller increase in federal spending for Medicaid and actually spend less in state funding if it were to expand Medicaid. That is because Wisconsin already covers some people who would be considered newly eligible if the state were to expand Medicaid. The federal government would pay a much higher share of the costs of those people than they currently do. Wisconsin would see its state spending on Medicaid decline by nearly 5 percent if the state were to expand eligibility.

It is important to keep in mind that Medicaid expansion affects state budgets in other ways than the amount spent on the care of those enrolled. States can realize savings in other areas that offset these increases. We discuss some of these savings in more detail below.

Figure 6: Estimated Difference in Federal Expenditure with Expansion, By State, 2015-2024
Figure 7: Estimated Change in State Medicaid Spending if Non-Expansion States Expanded Medicaid, 2016

Reductions in Uncompensated Care

As discussed above, if all states were to expand Medicaid, there would be 4.3 million fewer uninsured people in 2016. Fewer uninsured people would lead to lower spending on uncompensated health care.  A recent study found that, in 2013, those uninsured for a full year paid for an average of 30 percent of their care themselves, while the remaining 70 percent of health care expenditures were uncompensated.5  Based on this research, we estimate that between 2015 and 2024, uninsured people in states not expanding Medicaid would consume $266 billion in uncompensated care under current Medicaid policy decisions. Were these states to expand Medicaid, the amount of uncompensated care over this period would fall to $185 billion.

The authors of the study cited above also estimated that, overall, 24 percent of uncompensated care was funded by state and local governments. State and local savings on uncompensated care could be difficult to realize. State and local funding of uncompensated care is often very complex, and it will likely be difficult politically to reduce payments to providers. We estimated potential state and local government savings assuming that they could realize savings of between 25 percent and 50 percent of the reduction in the state and local share of uncompensated care provided. Under these assumptions, we estimate that states would see between $5 and $10 billion in uncompensated care savings over the next 10 years. (Table 4)

Discussion

If the 21 states that have not expanded Medicaid were to do so, 4.3 million more people would have health coverage in 2016. Many of the states that have decided against Medicaid expansion are those who would gain the most. This applies when examining the impact of expansion on the uninsured, increases in federal Medicaid funding, or reductions in uncompensated care. Wisconsin would spend less on Medicaid if it expanded eligibility, even without taking into account any other sources of state savings. Most other expansion states would see state Medicaid spending increase by 2 to 6 percent. We estimate that Idaho and Georgia would see larger percent increases. These increases do not accurately reflect the overall impact of Medicaid expansion on the state budget. Reduced costs for uncompensated care are one of several sources of savings that would help to mitigate that increase in state costs. Assuming that states only realize 25 to 50 percent of the reduction in their share of uncompensated care, those savings would offset 13 to 25 percent of the total increase in state Medicaid spending due to expansion. In addition, states could realize other types of budgetary savings and increases in revenue if they expanded Medicaid that are not included in this report.

While this report provides estimates of the coverage and fiscal effects of Medicaid expansion, there are data and analysis that support the estimates. The latest data from CMS show that as of January 2015, 70.0 million people were enrolled in Medicaid or CHIP. Between summer 2013 and January 2015, there was a net increase of nearly 11.2 million people enrolled in Medicaid and CHIP among the 49 states reporting data for both periods. Most of this growth was in large states in the West that implemented the Medicaid expansion. States that expanded Medicaid experienced significantly greater net Medicaid and CHIP enrollment growth between summer 2013 and January 2015 than states that have not expanded. Nationally, total Medicaid and CHIP enrollment grew by 19% between summer 2013 and January 2015. States that implemented the Medicaid expansion experienced over three times greater enrollment growth compared to states where the Medicaid expansion is not in effect (26% vs. 8%).6  States that have not implemented the Medicaid expansion are also experiencing increases in enrollment due to simplified and streamlined enrollment systems as well as outreach and enrollment efforts for enrollment in Marketplace coverage that have resulting in higher Medicaid participation among those already eligible.

Similarly, several surveys that have shown notable increases in health coverage in 2014 under the ACA, particularly among states that have expanded Medicaid.7  The decision not to adopt the Medicaid expansion has already begun to create inequities in coverage between states.

In making decisions about expansion, states are also considering fiscal implications. This paper does not attempt to assess the overall impact of Medicaid expansion on state budgets. Our analysis is limited to effects that can be estimated on a 50-state basis. Medicaid expansion has many other, highly significant state fiscal consequences that cannot be quantified without state-specific information. If those factors were taken into account, the state budget effects of expansion would be much more favorable than what we show above.

Numerous studies where a combination of public and private research has examined fiscal effects in all relevant categories—that is, state costs from increased Medicaid enrollment, state savings from increased federal match for current beneficiaries, state savings on non-Medicaid health care costs, and state revenue effects of expansion—have shown that, on balance, Medicaid expansion would help, not hurt state budgets over a multi-year period extending well beyond 2016. Recent state budget projections from expansion states confirm this analysis. Washington State has projected net savings of $79.0 million in state fiscal year 2014 and $258.7 million in 2015 due to expansion.8  Analysis by Deloitte estimated that Kentucky would spend $919.1 million less between state fiscal years 2014 and 2021 due to Medicaid expansion.9  These reports point to savings both within and outside state Medicaid programs (in areas such as mental health spending and corrections) as well as increases in revenue resulting in net fiscal savings to states as a result of implementing the expansion. The Kentucky report also points to increases in jobs as a result of the Medicaid expansion.

There is also evidence that the ACA is already having an impact on health care provided to the uninsured. A number of reports are finding that hospitals in Medicaid expansion states showed overall declines in self-pay and charity care, while hospitals in non-expansion states showed no change beyond normal variation.10  Hospitals, however, are also likely to see some reductions in federal reimbursement from Medicare and Medicaid DSH as well as reductions in future increases to Medicare fee-for-service hospital payments that were included in the ACA. Medicaid DSH reductions were originally scheduled to go into effect beginning in FY 2014 but have been delayed to 2018. Hospitals in states that do not implement the Medicaid expansion will face these reductions without also seeing increases in Medicaid revenue from additional coverage.

States account for a number of factors in making decisions about adopting the Medicaid expansion; however, based on this analysis we conclude that the economic case for Medicaid expansion for state officials is extremely strong.

This brief was prepared by Matthew Buettgens, John Holahan, and Hannah Recht of the Urban Institute.

Tables

Table 1: Medicaid Enrollment in 2016 (Thousands)
 Medicaid Enrollment without ExpansionMedicaid Enrollment with Expansion  Difference
 DisabledNon-disabled AdultsNon-disabled ChildrenTotalDisabledNon-disabled AdultsNon-disabled ChildrenTotalTotalChangePercent Change
Total4,0403,6279,72717,3954,0869,99710,25324,3366,94140%
Alabama2301433467182324083711,01129341%
Alaska1832651151857651412522%
Florida6255261,4592,6106321,6391,5273,7981,18846%
Georgia3222218241,3673277988742,00063346%
Idaho41231051684211411527110361%
Kansas73411552707416216940513550%
Louisiana2131854598572154744751,16430836%
Maine74757922874134802876026%
Mississippi1729129655917428531577521639%
Missouri1981484167622014414461,08832643%
Nebraska3832112181381051182618044%
North Carolina3373257591,4203418117861,93751736%
Oklahoma12012435660112231737381221135%
South Carolina16918338373517142440099526035%
South Dakota201861992057651424243%
Tennessee3023096031,2133035846181,50529224%
Texas6844442,3013,4296941,9942,4575,1461,71750%
Utah43671532634417916839112849%
Virginia1851444297581874384571,08332543%
Wisconsin1664853279771665403291,034576%
Wyoming11114163113543892642%
Source: Urban Institute Analysis based on HIPSM-ACS, 2015.
Table 2: Number of Uninsured in 2016 (Thousands)
Number of UninsuredWithout ExpansionNumber of UninsuredWith ExpansionDifferencePercent Difference
Total14,0579,789-4,267-30%
Alabama436259-177-41%
Alaska6648-17-26%
Florida2,5871,837-750-29%
Georgia1,249860-389-31%
Idaho161103-59-36%
Kansas233156-77-33%
Louisiana488295-193-40%
Maine9252-40-44%
Mississippi332192-139-42%
Missouri485294-191-39%
Nebraska12887-42-33%
North Carolina1,021709-313-31%
Oklahoma422295-127-30%
South Carolina490330-160-33%
South Dakota5833-25-43%
Tennessee562383-179-32%
Texas4,0762,969-1,107-27%
Utah263195-68-26%
Virginia628448-179-29%
Wisconsin233212-21-9%
Wyoming4632-14-30%
Source: Urban Institute Analysis based on HIPSM-ACS, 2015.
Table 3: Medicaid Expenditures, 2015-2024  ($ Billions)
 Federal ExpendituresState Expenditures
 ACA Without ExpansionACA With ExpansionDifferencePercent DifferenceACA Without ExpansionACA With ExpansionDifferencePercent Difference
Total1,551.5 2,023.6 472.1 30%970.8 1,009.0 38.24%
Alabama56.265.08.916%26.327.31.04%
Alaska14.117.02.920%14.114.20.10%
Florida206.9285.278.338%145.0151.16.04%
Georgia99.5147.347.848%51.455.64.28%
Idaho20.831.110.350%8.29.10.910%
Kansas29.437.88.428%22.323.10.84%
Louisiana74.790.015.320%47.849.31.53%
Maine27.029.12.18%16.817.00.21%
Mississippi58.070.712.822%21.422.51.15%
Missouri87.2105.117.921%53.455.32.04%
Nebraska19.625.15.528%16.216.60.43%
North Carolina146.6188.341.728%76.279.02.84%
Oklahoma53.064.311.221%29.830.81.03%
South Carolina67.682.815.222%28.229.51.34%
South Dakota9.212.53.235%8.08.20.23%
Tennessee101.0126.025.025%53.754.71.02%
Texas305.7433.8128.142%215.2228.713.56%
Utah26.033.57.529%11.011.70.76%
Virginia67.090.223.235%67.069.12.13%
Wisconsin75.880.74.86%52.650.0-2.5-5%
Wyoming6.28.22.033%6.26.30.23%
Source: Urban Institute Analysis based on HIPSM-ACS, 2015.
Table 4: State Spending on Uncompensated Care, 2015-2024  ($ Millions)
 ACA without ExpansionACA with ExpansionPotential State Savings due to Expansion
   Low (25%)High (50%)
Total63,87044,4254,8619,723
Alabama2,1131,184232464
Alaska4242514387
Florida12,5458,5989871,974
Georgia5,2473,510434868
Idaho7495515099
Kansas1,24885099199
Louisiana2,0041,257187373
Maine59436557115
Mississippi1,5691,064126253
Missouri3,3932,010346691
Nebraska6284763876
North Carolina5,4063,641441883
Oklahoma2,3711,582197394
South Carolina1,7431,254122244
South Dakota2442021021
Tennessee2,6721,843207415
Texas14,85911,0559511,902
Utah1,3751,02687174
Virginia3,0892,289200400
Wisconsin1,3121,2082652
Wyoming2842081938
Source: Urban Institute Analysis based on HIPSM-ACS, 2015.

Endnotes

  1. Beginning in 2014, the higher FMAP for newly-eligible Medicaid beneficiaries is available for non-elderly, non-disabled adults with incomes up to 138% FPL who would not be eligible for Medicaid under the rules that a state had in place on December 1, 2009. A few states had already expanded coverage to parents and childless adults up to 100% FPL or to higher income levels across the state at the time the ACA was passed. Costs related to these populations qualify for the “expansion” or “transition” FMAP instead. In recognition of these states already provided coverage at these higher Medicaid eligibility levels, these states can receive a phased-in increase in their federal matching rate for adults without dependent children under age 65 beginning on January 1, 2014 so that by 2019 it will equal the enhanced matching rate available for newly-eligible adults. In addition, expansion states that do not have any newly-eligible Medicaid beneficiaries because they already covered people up to 138% FPL or higher (e.g. Massachusetts) also receive a temporary (January 1, 2014 through December 31, 2015) 2.2 percentage point increase in their federal matching rate for all populations. For more information on how claiming works for the Medicaid expansion, please see the following brief: Robin Rudowitz, Understanding How States Access the ACA Enhanced Medicaid Match Rates. (Washington, DC: Kaiser Family Foundation,) September 2014. https://modern.kff.org/medicaid/issue-brief/understanding-how-states-access-the-aca-enhanced-medicaid-match-rates/. ↩︎
  2. More information about methodology can be found at “Further Methodological Information for ‘Tax Preparers Could Help Most Uninsured Get Covered,’” accessed May 7, 2014, http://www.urban.org/health_policy/health_care_reform/taxfilingmethodology.cfm  and Urban Institute. “The Urban Institute’s Health Microsimulation Capabilities,” Washington, DC: Urban Institute, 2010, http://www.urban.org/publications/412154.html. ↩︎
  3. John Holahan, Matthew Buettgens, and Stan Dorn, The Cost of Not Expanding Medicaid, (Washington, DC; The Kaiser Commission on Medicaid and the Uninsured; July 2013) https://modern.kff.org/medicaid/report/the-cost-of-not-expanding-medicaid/;  John Holahan, Matthew Buettgens, Caitlin Carroll, Stan Dorn, The Cost and Coverage Implications of the ACA Medicaid Expansion: National and State-by-State Analysis, Kaiser Commission on Medicaid and the Uninsured, November 2012, https://modern.kff.org/health-reform/report/the-cost-and-coverage-implications-of-the/ ↩︎
  4. Matthew Buettgens (2011) HIPSM Methodology. The Urban Institute, Washington, DC. http://www.urban.org/research/publication/health-insurance-policy-simulation-model-hipsm-methodology-documentation ↩︎
  5. Teresa A. Coughlin, John Holahan, Kyle Caswell, and Megan McGrath (2014) Uncompensated Care for the Uninsured in 2013: A Detailed Examination. The Urban Institute. Washington, DC.  https://modern.kff.org/uninsured/report/uncompensated-care-for-the-uninsured-in-2013-a-detailed-examination/ ↩︎
  6. Samantha Artiga, Robin Rudowitz, Alexandra Gates and Laura Snyder, Recent Trends in Medicaid and CHIP Enrollment as of January 2015: Early Findings from the CMS Performance Indicator Project (Washington, DC; The Kaiser Commission on Medicaid and the Uninsured; March 2015).  https://modern.kff.org/medicaid/issue-brief/recent-trends-in-medicaid-and-chip-enrollment-as-of-january-2015-early-findings-from-the-cms-performance-indicator-project/ ↩︎
  7. Sharon K. Long, Michael Karpman, Genevieve M. Kenney, Douglas Wissoker, Nathaniel Anderson and Stephen Zuckerman (2015) “QuickTake: Taking Stock: Health Insurance Coverage under the ACA as of December 2014.” The Urban Institute, Washington, DC; HHS/ASPE (2015) Health Insurance Coverage and the Affordable Care Act. http://aspe.hhs.gov/health/reports/2015/uninsured_change/ib_uninsured_change.pdf. ↩︎
  8. Stan Dorn, Norton Francis, Robin Rudowitz, and Laura Snyder (2015) “The Effects of the Medicaid Expansion on State Budgets: An Early Look in Select States.” Kaiser Commission on Medicaid and the Uninsured. http://files.kff.org/attachment/issue-brief-the-effects-of-the-medicaid-expansion-on-state-budgets-an-early-look-in-select-states ↩︎
  9. Dorn, et al. “The Effects of the Medicaid Expansion on State Budgets: An Early Look in Select States.”  https://modern.kff.org/medicaid/issue-brief/the-effects-of-the-medicaid-expansion-on-state-budgets-an-early-look-in-select-states/ ↩︎
  10. Department of Health and Human Services, Office of the  Assistant Secretary for Planning and Evaluation, “Insurance Expansion, Hospital Uncompensated Care and the Affordable Care Act,” March 23, 2015,  http://aspe.hhs.gov/health/reports/2015/MedicaidExpansion/ib_UncompensatedCare.pdf; Teresa A. Coughlin, Sharon K. Long, Rebecca Peters, Robin Rudowitz and Rachel Garfield. Evolving Picture of Nine Safety-Net Hospitals:  Implications of the ACA and Other Strategies. (Washington, DC: Kaiser Commission on Medicaid and the Uninsured), April 2015, https://modern.kff.org/health-reform/issue-brief/evolving-picture-of-nine-safety-net-hospitals-implications-of-the-aca-and-other-strategies/.   Peter Cunningham, Rachel Garfield, Robin Rudowitz. How Are Hospitals Faring Under the Affordable Care Act? Early Experiences from Ascension Health.  (Washington, DC: Kaiser Commission on Medicaid and the Uninsured), April 2015, https://modern.kff.org/health-reform/issue-brief/how-are-hospitals-faring-under-the-affordable-care-act-early-experiences-from-ascension-health; Colorado Hospital Association. “Impact of Medicaid Expansion on Hospital Volumes.” ACA Center for Health Information and Data Analytics.  June 2014. http://www.cha.com/Documents/Press-Releases/CHA-Medicaid-Expansion-Study-June-2014.aspx. ↩︎
News Release

New Analysis Finds US Individual Insurance Market Grew 46 Percent in First Full Year of Affordable Care Act

Published: Apr 29, 2015

A new analysis from the Kaiser Family Foundation finds that the nation’s individual insurance market grew 46 percent to 15.5 million people in the first year plans could be purchased through the Affordable Care Act’s marketplaces, which offer premium assistance to low- and moderate-income people.

Four states — California, Florida, Texas and Georgia — accounted for almost half of the enrollment growth. In six states, the number of people covered in the individual market increased by more than 75 percent: Arkansas, Florida, Georgia, Maine, New York and Rhode Island.

The state-level analysis, Data Note: How Has the Individual Insurance Market Grown Under the Affordable Care Act?, drew from recently-submitted 2014 filings by insurers to state insurance departments, and compared enrollment from December 2013 to December 2014.

For the latest on health reform, follow Kaiser Family Foundation Senior Vice President Larry Levitt on Twitter: @larry_levitt

News Release

Few Consumers Use Information on Health Provider Quality or Price

Published: Apr 27, 2015

In his latest column for The Wall Street Journal’s Think Tank, Drew Altman discusses new poll findings showing very small numbers of consumers are using provider quality and price information.

All previous columns by Drew Altman are available online

Health Insurance Coverage in 2013: Gains in Public Coverage Continue to Offset Loss of Private Insurance

Authors: Laura Skopec, John Holahan, and Megan McGrath
Published: Apr 21, 2015

Executive Summary

Executive Summary

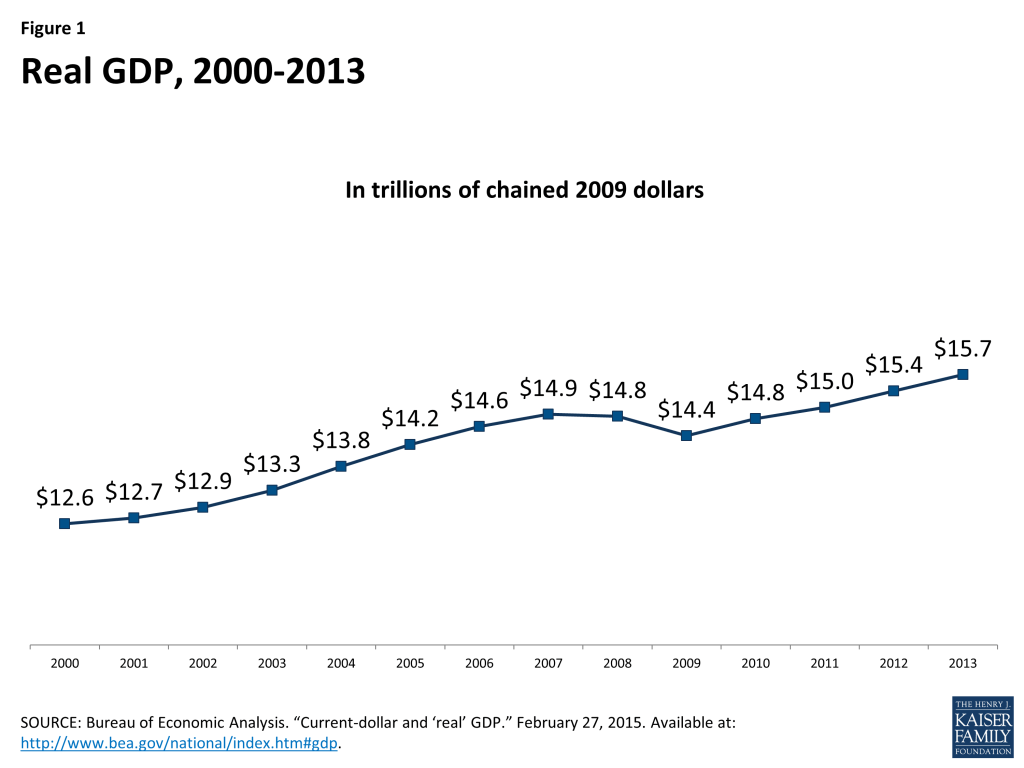
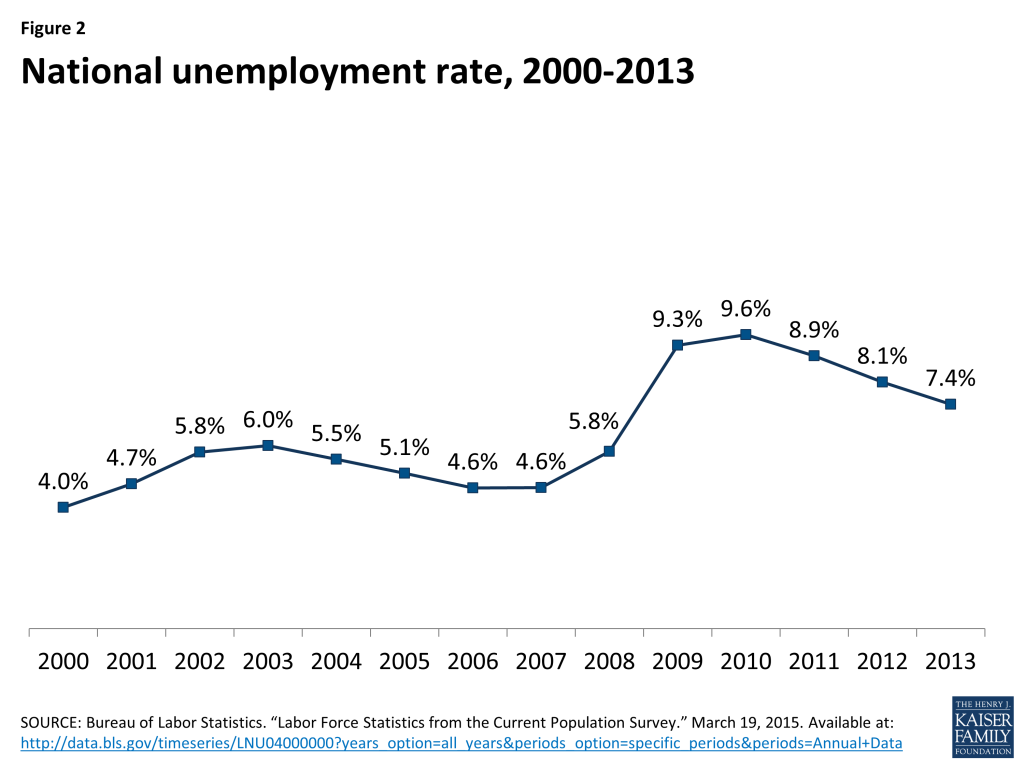
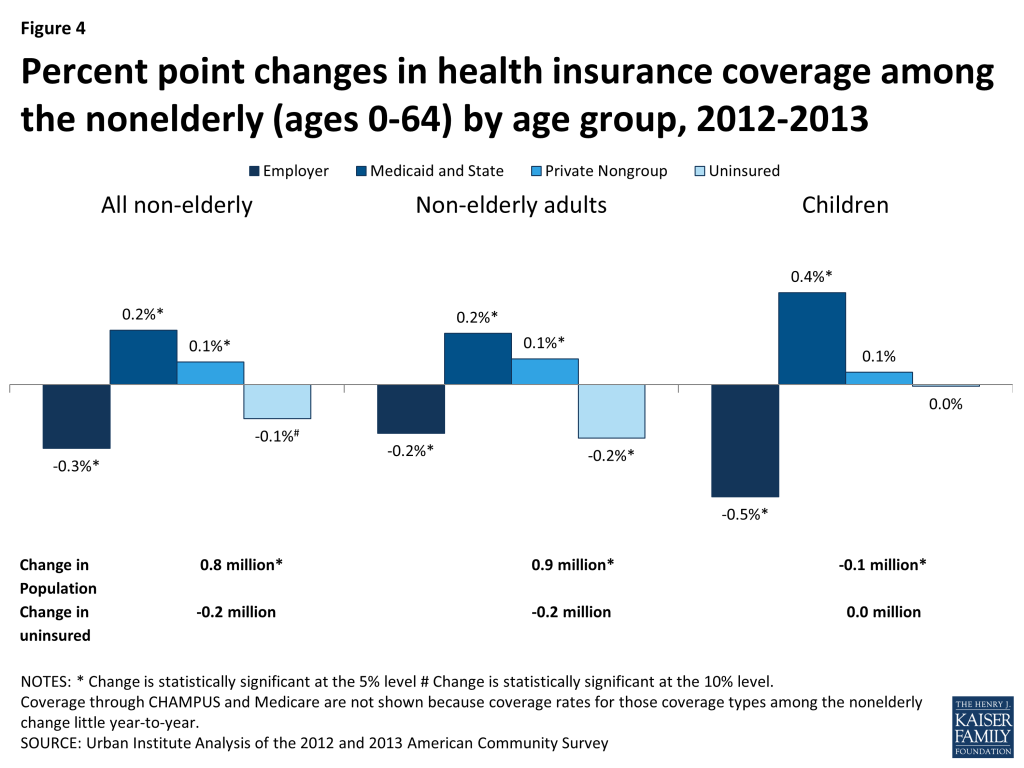
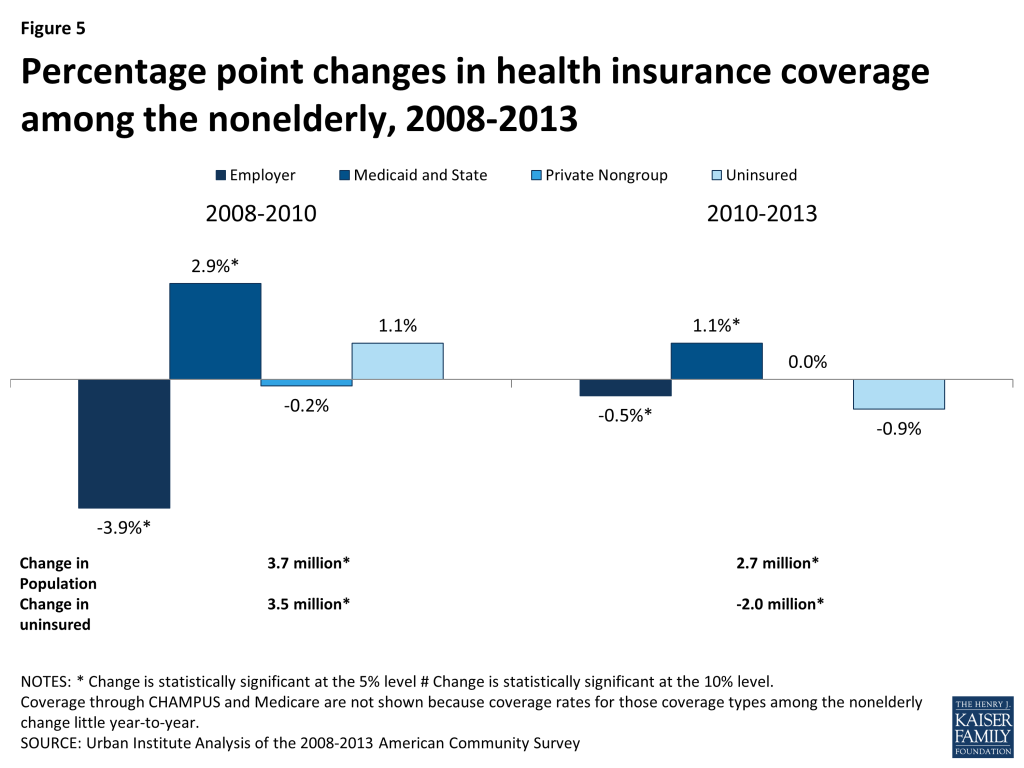
Since the Great Recession peaked in 2010, the economic picture has steadily improved, and in 2013, GDP increased relative to 2012 and the unemployment rate fell but remained fairly high at 7.4 percent. In addition, the uninsured rate decreased slightly (0.1 percentage point) in 2013, continuing the trend from 2011 and 2012. Despite these improvements, rates of coverage through employer sponsored insurance have declined since 2010, though more slowly in recent years than at the height of the recession. Gains in coverage since 2010 have been largely due to increases in coverage through public programs such as Medicaid and the Children’s Health Insurance Program (CHIP).

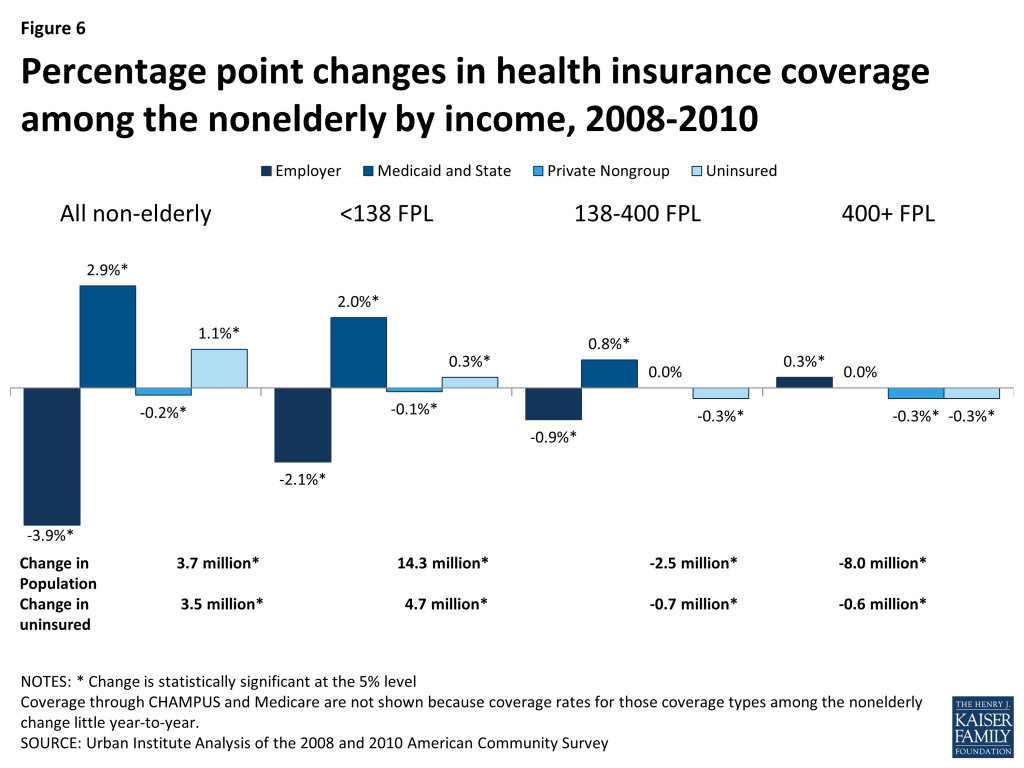
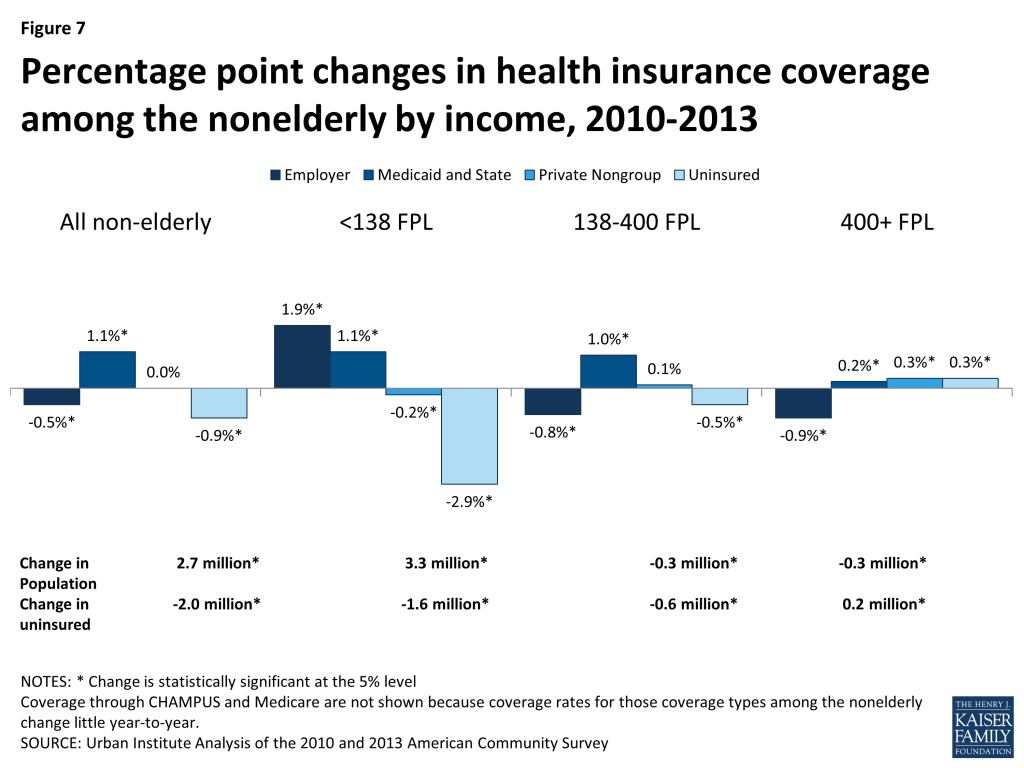
Population changes also affected insurance coverage patterns between 2008 and 2013. The only income group with net population growth between 2008 and 2013 was families at or below 138 percent of poverty, which grew by 17.6 million. In contrast, the population with family incomes above 400 percent of poverty shrank by 8.3 million. There were also fewer workers in 2013 (138.0 million) than in 2008 (140.4 million), with a low point of 133.1 million workers in 2010.  In addition, national population growth between 2008 and 2013 was concentrated in the South and West, which gained 4.3 million and 1.9 million people, respectively. These regions tend to have lower rates of employer coverage and lower Medicaid eligibility thresholds for adults.

It is important to understand the effect of these population shifts and economic forces on coverage to assess the impact of the ACA. Many of the health insurance coverage expansions in the ACA went into effect on January 1, 2014, making 2013 the final baseline year against which to measure coverage changes under the ACA. Though 2013 is not a perfect baseline (several smaller coverage expansions under the ACA went into effect in 2010, including allowing dependents to stay on their parents’ plan until age 26, and a handful of states fully or partially expanded eligibility for their Medicaid programs in 2010 or 2011), understanding trends in coverage during the recession and recovery will help disentangle the effects of the ACA on health insurance coverage from demographic and economic factors.

In this brief, we examine coverage patterns for the nonelderly population from 2008 through 2013 using data from the American Community Survey. While prior research on this topic has frequently relied on the Census Bureau’s March Supplement to the Current Population Survey (CPS), long planned improvements to the insurance questions for that survey resulted in a break in trend between the 2013 CPS and the 2014 CPS, which collected data on coverage in 2012 and 2013, respectively. Therefore, in order to examine trends from 2008 to 2013, we focused our analysis on the American Community Survey.

Overview, Data And Methods

Overview

The economy has steadily improved since the Great Recession peaked in 2010, but recovery in employment and household income has lagged behind GDP growth. While real GDP recovered to its 2007 high by 2011, the unemployment rate declined but remained high through 2013 (7.4 percent), and median household income continued to decline through 2012. The recession accelerated the long-standing decline in employer-sponsored health insurance (ESI),1  and through 2013 most of the recovery in the uninsured rate was due to increased enrollment in public insurance, primarily Medicaid and the Children’s Health Insurance Program (CHIP). For adults, coverage through Medicare and military healthcare programs also increased slightly between 2010 and 2013, though not as substantially as Medicaid and CHIP coverage. With the exception of young adults ages 19 to 25, who are able to remain on their parents’ health plan until age 26 under the Affordable Care Act (ACA), ESI coverage rates for adults and children continued to decrease between 2010 and 2013. These declines in ESI coverage are partly attributable to changes in population characteristics among the nonelderly, including an increase in the number of low-income families, population growth in low-ESI regions, and workforce growth in low-ESI industries.

Data and Methods

This brief uses data from the American Community Survey (ACS), an annual survey conducted by the Census Bureau and designed to be representative at the national and state level. The public microdata sample for the ACS contains 1.9 million observations annually, making it by far the largest of the federal surveys. The ACS contains data on income, health insurance, demographics, work status, and industry sufficient to allow analyses of the differences in insurance coverage patterns across various populations. In addition, the very large sample size allows for state-level trend analyses (not included here).

Prior issue briefs in this series used the Current Population Survey Annual Social and Economic Supplement (CPS) to describe trends in health insurance coverage.2  However, long planned improvements to the insurance questions for that survey resulted in a break in trend between the 2013 CPS and the 2014 CPS, which collected data on coverage in 2012 and 2013, respectively.3  This brief therefore focuses on trends from 2008 to 2013 using the ACS. While the ACS has a significantly larger sample size than the CPS, it also has a few disadvantages. First, the income information in the CPS is much more detailed than that collected in the ACS, and income data from the CPS is therefore the source of official estimates of poverty in the United States.4  Second, the ACS does not collect data on employer size, so this brief does not present trends in ESI coverage by firm size.

This analysis uses the ACS iPUMS files created by the Minnesota Population Center, which have consistent variable definitions over time and include constructed variables on family relationships and income that are used to create Health Insurance Units (HIU)5  and calculate HIU income as a percent of the FPL.6  In addition, the Urban Institute has developed a series of logical coverage edits to the ACS designed to correct for known inaccuracies in survey-based estimates of health insurance coverage.7  In particular, the ACS over-represents private non-group coverage relative to other surveys and under-represents Medicaid and CHIP coverage among children relative to administrative data.8  These logical coverage edits reassign coverage types for respondents when other information collected in the ACS, such as receipt of Supplemental Nutrition Assistant Program (SNAP) or other public assistance, implies that a respondent’s coverage has likely been misclassified.9  Finally, all individuals reporting multiple health insurance types have been assigned to a single primary insurance type using a hierarchy, which further corrects for over-reporting of private non-group coverage. The hierarchy used for all analyses in this brief is as follows: employer-sponsored insurance, Medicaid or CHIP, military health care or Medicare, private non-group insurance, or uninsured.

Issue Brief

Continued Economic Recovery

Figure 1: Real GDP, 2000-2013 (in trillions)

Most economic indicators suggest continued recovery since the peak of the recession in 2009 and 2010. Real GDP fell from $14.9 trillion in 2007 to $14.4 trillion in 2009 but recovered starting in 2010 to hit $15.7 trillion in 2013 (Figure 1). The unemployment rate increased from 4.6 percent in 2007 to peak at 9.6 percent in 2010, falling back to 7.4 percent in 2013 (Figure 2). The most recent data (February 2015) suggest that the unemployment rate has now recovered to 2008 levels (5.6 percent).10 

Real median household income and real per capita income also fell between 2008 and 2010 and have shown less recovery than other economic indicators. Median household income continued to fall between 2010 and 2012 and increased only $180 between 2012 and 2013, not a statistically significant change. Similarly, real per capita income remains more than $1,500 below its 2006 peak (Figure 3).

Figure 2: National unemployment rate, 2000-2013


Figure 3: Real median household income and per capita income, 2000-2013

 Changes in Health Insurance Coverage from 2012 to 2013

As the economy continued to improve between 2012 and 2013, the uninsured rate fell by 0.1 percentage point and the number of uninsured Americans fell by 200,000 (Figure 4). The decrease in the uninsured rate was entirely among nonelderly adults and was primarily due to increases in public coverage. From 2012 to 2013, the ESI coverage rate declined 0.3 percentage points, leading to 300,000 fewer people with ESI, while Medicaid and Children’s Health Insurance Program (CHIP) coverage increased by 0.2 percentage points, or 700,000 people. The reduction in ESI and increase in Medicaid and CHIP coverage rates were more prominent among children than nonelderly adults. In addition, nearly all of the reduction in the number of uninsured was among non-Hispanic whites below 138 percent of the FPL (data not shown). Finally, private non-group coverage increased by 0.1 percentage points among nonelderly adults, all of which was due to an increase of non-group coverage among young adults (young adult data not shown). The additional 200,000 young adults with non-group coverage may reflect young adults staying on their parents’ non-group plan until age 26 or, potentially, misreporting of October through December 2013 enrollment in the Marketplaces for 2014.11  Because the changes in insurance coverage from 2012 to 2013 were small overall, the remainder of this brief will focus on trends in insurance coverage from 2008 to 2013.

Figure 4: Percent point changes in health insurance coverage among the nonelderly (ages 0-64) by age group, 2012-2013

 Changes in Coverage among the Nonelderly Population, 2008-2013

Figure 5 shows the changes in health insurance coverage that occurred during the recession and recovery for the nonelderly population (under age 65).  The Great Recession began in December 2007 and ended in June 2009, making 2010 the first full year since 2007 in which GDP did not decline.12  Therefore, 2010 is used as the break point between the recession and recovery throughout this brief. From 2008 to 2010, the ESI coverage rate fell from 61.0 percent to 57.1 percent. At the end of this period, 8.2 million fewer nonelderly adults and children had ESI coverage. In addition, 500,000 fewer people had private non-group coverage at the end of this period. Some of these coverage losses were offset by gains in public coverage. The Medicaid coverage rate increased from 15.3 percent to 18.2 percent during this period, resulting in 8.1 million additional people with Medicaid coverage. In addition, military (CHAMPUS) and Medicare coverage increased by 0.3 percent (data not shown).13  In total, the uninsured rate grew from 16.8 percent to 17.9 percent, meaning 3.5 million more people were uninsured in 2010 than in 2008.

Between 2010 and 2013, as the economy began to improve, the uninsured rate began to fall. In 2013, the uninsured rate had fallen to 16.9 percent, still slightly above the level of 2008. Most of the gains in insurance coverage during the economic recovery came from public coverage sources. Between 2010 and 2013, there was a 1.1 percentage point increase in Medicaid and CHIP coverage,14  resulting in 3.5 million additional people covered by the Medicaid program. While this increase in Medicaid coverage may reflect, in part, the early Medicaid expansions undertaken in 2010 and 2011 by four states (California, Connecticut, the District of Columbia, and Minnesota), those early expansions alone did not affect a large enough population to account for the entire increase in Medicaid coverage.15  From 2010 to 2013, ESI coverage declined another 0.5 percentage points, from 57.1 percent to 56.6 percent.

Figure 5: Percentage point changes in health insurance coverage among the nonelderly, 2008-2013

 Changes in Coverage by Income

Figure 6: Percentage point changes in health insurance coverage among the nonelderly by income, 2008-2010

Between 2008 and 2010, the entirety of the net increase in the number of uninsured was due to loss in coverage among those with family incomes below 138 percent of the FPL (Figure 6). Increases in Medicaid coverage made up for much of the loss of ESI in this income group, and the uninsured rate among this group increased by only 0.3 percentage points. However, the size of the population with income below 138 percent of the FPL swelled by 14.3 million, leading to 4.7 million more low-income Americans uninsured. In contrast, both the income group between 138 to 400 percent FPL and the income group above 400 percent FPL shrank between 2008 and 2010, and there were 1.3 million fewer uninsured Americans in these income groups in 2010 than in 2008.

As shown in Figure 7, the uninsured rate for those with family incomes below 138 percent of the FPL declined as the economy improved between 2010 and 2013, leading to 1.6 million fewer uninsured Americans in this income group. Only those with incomes below 138 percent of the FPL showed a net gain in ESI coverage between 2010 and 2013, though the ESI coverage rate for that group remained low at 20.8 percent (compared to 18.9 percent in 2010).

Figure 7: Percentage point changes in health insurance coverage among the nonelderly by income, 2010-2013

ESI coverage declined from 64.6 percent to 63.8 percent for those with incomes between 138 and 400 percent of the FPL, and from 88.1 percent to 87.2 percent for those with incomes above 400 percent of the FPL between 2010 and 2013. The loss of ESI was offset by gains in Medicaid among the middle income group, and the uninsured rate fell 0.5 percentage points for that group. The highest income group showed a 0.3 percent increase in the uninsured rate, meaning an additional 200,000 people with incomes above 400 percent of the FPL were uninsured. Overall, there were 2 million fewer uninsured Americans in 2013 than in 2010 due to increases in Medicaid coverage among those with incomes below 400 percent of the FPL and increases in ESI among those with incomes below 138 percent of the FPL, who had the largest ESI losses during the Great Recession.

Changes in Coverage by Age

The health insurance coverage patterns for children, young adults, and adults differ from 2008 to 2013. The uninsured rate for nonelderly adults was more than double that for children throughout this period, in part because Medicaid and CHIP have higher income eligibility limits for children. In addition, the ACA provision allowing young adults to stay on their parents’ plan until the age of 26 led to significant gains in ESI coverage among this population beginning in 2010 that were not shared by older adults.16  Given these different policy contexts, we examined coverage changes from 2008 to 2013 separately for each of these age groups.

All Nonelderly Adults

Figure 8: Percentage point changes in health coverage among the nonelderly by income, 2008-2010

From 2008 to 2010, there was a 3.9 percentage point decrease in the ESI coverage rate for nonelderly adults and a 1.7 percentage point increase in Medicaid and other state coverage (Figure 8). In total, the uninsured rate for nonelderly adults increased by 2.0 percentage points, and 4.4 million more nonelderly adults were uninsured. All of the increase in the number of uninsured was among adults in families with income at or below 138 percent of the FPL (4.9 million). The number of nonelderly adults in families with incomes above 400 percent of the FPL shrank significantly, by 5.7 million, and this group saw a small decrease in the uninsured rate of 0.3 percentage points between 2008 and 2010.

Figure 9: Percentage point changes in health insurance coverage among the nonelderly by income, 2010-2013

Between 2010 and 2013, the overall ESI coverage rate for nonelderly adults was nearly stable, and the uninsured rate declined by 1 percentage point in part due to increases in public coverage. However, there was significant variation by income group. Nonelderly adults below 138 percent of the FPL saw a 3.0 percentage point gain in ESI coverage and a 1.2 percentage point gain in Medicaid and CHIP coverage, leading to a 4.0 percentage point reduction in the uninsured rate for that income group. In contrast, ESI coverage for those with incomes above 400 percent of the FPL continued to decline, leading to a 0.3 percentage point increase in the uninsured rate for that group.

Young Adults

Figure 10: Percentage point changes in health insurance coverage among nonelderly adults by age, 2008-2010

Beginning in September 2010, the ACA required most health plans to allow children to stay on their parents’ plan as a dependent until age 26. Between 2008 and 2010, this age group lost ESI coverage at a rate similar to the rest of the adult population (Figure 10). However, the trend for young adults diverged significantly from other nonelderly adults from 2010 to 2013 (Figure 11). While other age groups continued to lose ESI coverage, albeit more slowly than between 2008 and 2010, young adults had large gains in ESI coverage. Between 2010 and 2013, 2.6 million young adults gained ESI coverage, a 6.7 percentage point increase in the ESI coverage rate (Figure 11). Young adults did not gain Medicaid and CHIP coverage as quickly as other age groups in this time period.

Figure 11: Percentage point changes in health insurance coverage among nonelderly adults by age, 2010-2013

These gains for young adults created a near-stabilization of ESI coverage rates between 2010 and 2013 for all nonelderly adults. For other adult groups, however, ESI coverage losses continued, resulting in 700,000 adults ages 26 to 64 losing ESI coverage between 2010 and 2013. Similarly, nearly all of the decrease in the uninsured rate and number uninsured seen among nonelderly adults between 2010 and 2013 was among young adults. While the ACA policy had the intended effect of decreasing the uninsured rate among young adults, it masked a continued trend of loss in ESI coverage among other age groups.

Children

The pattern of coverage for children under age 19 is different from that of adults, primarily due to greater access to Medicaid and CHIP coverage. During the recession, children were more likely to lose access to ESI than adults. Between 2008 and 2010, the ESI coverage rate for children fell 4.2 percentage points, from 54.7 percent to 50.5 percent (Figure 12). Most of this loss of ESI was among low-income children and was more than made up for by increases in Medicaid and CHIP coverage. The Medicaid and CHIP coverage rate for children increased from 31.7 percent to 37.5 percent in this time period, meaning 4.6 million additional children were covered in those programs, 4.5 million of whom had family incomes below 138 percent of the FPL. Overall, the uninsured rate for children actually declined during the recession, from 9.2 percent to 8.0 percent, and 1 million fewer children were uninsured in 2010 than in 2008.

Figure 12: Percentage point changes in health insurance coverage among children, 2008-2013

The economic recovery from 2010 to 2013 showed a similar pattern for children (Figure 12). The ESI coverage rate among children continued to fall, from 50.5 percent in 2010 to 49.1 percent in 2013. This continued reduction in ESI coverage was spread across all income groups. However, this loss of ESI coverage was more than made up for by continued gains in Medicaid and CHIP coverage, which increased from 37.5 percent in 2010 to 39.8 percent in 2013. Overall, 800,000 fewer children were uninsured in 2013 than in 2010, 700,000 of whom had with family incomes below 138 percent of the FPL. The uninsured rate for children with family incomes above 400 percent of the FPL increased 0.3 percentage points between 2010 and 2013, largely due to losses of ESI coverage in that income group (data not shown).

The increases in Medicaid and CHIP coverage rates for children seen during the Great Recession and recovery have reduced the disparity in the uninsured rate among children by income (Figure 13). In 2008, children in families with income of less than 138 percent of the FPL had an uninsured rate of 13.8 percent, versus 2.6 percent for those in families with incomes above 400 percent of the FPL. By 2013, the uninsured rate for low-income children was down to 8.9 percent, compared to 2.4 percent for higher-income children.

Figure 13: Trend in the uninsured rate among children, 2008-2013

 Changes in Coverage by Other Demographic Characteristics

There are two important demographic trends in the United States that affect health insurance coverage among the nonelderly. First, racial and ethnic minority populations have grown. Between 2008 and 2013, the non-Hispanic White population shrank by 5.4 million people, while the Hispanic population grew by 6.4 million people. The non-Hispanic Black population also grew by 1.5 million people during this time period, and other racial and ethnic groups also grew by 3.8 million people.17  Hispanics and non-Hispanic Blacks have lower rates of ESI and higher uninsured rates than non-Hispanic Whites, so increases in the size of these populations tend to increase the uninsured rate and the number of uninsured. Second, the US population has shifted geographically. The Northeast and Midwest saw almost no population growth between 2008 and 2013, while the South and West grew by 4.3 million people and 1.9 million people, respectively. On average, the South and West have lower ESI coverage rates and higher uninsured rates than the Northeast and Midwest. In addition, states that have not expanded Medicaid under the ACA are concentrated in these regions, which will exacerbate the regional disparities in uninsured rates in 2014.

Race and Ethnicity

Between 2008 and 2010, non-Hispanic Blacks and Hispanics had more substantial reductions in ESI coverage than non-Hispanic Whites (Figure 14). While some of this disparity was made up by increases in public coverage, overall 2.3 of the 3.5 million people who lost coverage between 2008 and 2010 were people of color. The increases in the uninsured rate were concentrated among low-income people of all racial and ethnic groups. Non-Hispanic Whites over 400 percent of the FPL fared best during the recession, experiencing an increase in the ESI coverage rate and 400,000 fewer uninsured (data not shown).

Figure 14: Percentage point changes in health insurance coverage by race and ethnicity, 2008-2010

As the economy recovered between 2010 and 2013, the uninsured rate fell for all racial and ethnic groups, largely due to increases in public coverage (Figure 15). Hispanics saw the largest percentage point decrease in the uninsured rate, from 32.2 percent in 2010 to 29.7 percent in 2013. This is due to increases in both public coverage and ESI coverage among the Hispanic population.

Figure 15: Percentage poing changes in health insurance coverage by race and ethnicity, 2010-2013

Between 2008 and 2013, the gap in the uninsured rate between non-Hispanic whites and Hispanics narrowed, from 19.6 percentage points in 2008 to 17.1 percentage points in 2013 (Figure 16). Most of this narrowing was due to increases in the Medicaid coverage rate for Hispanics, from 24.2 percent in 2008 to 29.8 percent in 2013, a gain of 4.4 million Hispanic Medicaid enrollees  (Figures 14 and 15). Despite these gains, the uninsured rate for Hispanics remained more than double that for non-Hispanic Whites in 2013. The gap in the uninsured rate between non-Hispanic Whites and non-Hispanic Blacks remained virtually unchanged, narrowing by only 0.2 percentage points.

Figure: Trends in the insurance rate by race and ethnicity, 2008-2013

 Geographic Region

The effects of the recession and recovery on health insurance coverage were not consistent across the country, as shown in Figures 17 and 18. Between 2008 and 2010, the Midwest saw the largest losses of ESI coverage, from 66.3 percent to 61.9 percent, and the largest increase in the uninsured rate, from 12.9 percent to 14.2 percent (Figure 17). The Northeast fared the best in the early years of the recession, with only 400,000 additional uninsured. This was due, in part, to slightly larger percentage point gains in Medicaid coverage in the Northeast, which traditionally has higher income thresholds for adults and children than the South or West.

Figure 17: Percentage point changes in health insurance coverage by region, 2008-2010

During the recovery, the Northeast saw the largest continued reduction in ESI coverage, resulting in approximately 500,000 fewer Northeast residents with ESI in 2013 than in 2010 (Figure 18). The South and West saw the largest percentage point decreases in the uninsured rate (1.1 percent), largely due to gains in public coverage. In addition, population shifts between regions continued between 2010 and 2013, with the Midwest experiencing a net population loss, the Northeast experiencing no net change in population, and the South and West each increasing in population by a million or more people.

Figure 18: Percentage point changes in health insurance coverage by region, 2010-2013

The effect of the recovery between 2010 and 2013 on insurance coverage also differed substantially by state (see Appendix A, Table 7 for uninsured rates by state). Overall, the uninsured rate declined in 39 states and increased in 12 states between 2010 and 2013. Oregon had largest percentage point decrease in the uninsured rate (2.3 percentage points), while Alaska had the highest percentage point increase (1.2 percentage points). In all but 4 states, the Medicaid and CHIP coverage rate increased between 2010 and 2013. Montana had the largest percentage point increase in Medicaid coverage (3.7 percentage points), and Alaska had the largest decline (1.8 percentage points). Finally, ESI coverage rates increased in 17 states and declined in 34 states. Wyoming had the largest increase in ESI at 3.2 percentage points, and Connecticut had the largest decline at 3.3 percentage points.

Changes in Coverage among Workers

Figure 19: Percentage point changes in health insurance coverage among workers, by industry, 2008-2010

Between 2008 and 2010, the total number of workers aged 18 to 64 declined from 140.4 million to 133.1 million. Overall, between 2008 and 2010, workers experienced a decline in ESI coverage from 72.4 percent to 70.8 percent, which translates to a loss of ESI coverage for 7.5 million workers (Figure 19). This ESI loss was partially mitigated by increases in Medicaid coverage for low-income workers, but overall the uninsured rate for workers rose 0.9 percentage points. More workers in “low ESI” industries lost ESI than those in “high ESI” industries (4.6 million and 2.8 million, respectively).18  From 2008 to 2010, the low ESI industries saw a larger decline in the number of workers than high ESI industries (4.4 million and 2.9 million, respectively). Because of the decline in the number of workers, the total number of uninsured workers was flat between 2008 and 2010 despite an increase in the uninsured rate.

Figure 20: Percentage point changes in health insurance coverage among workers, by industry, 2010-2013

Between 2010 and 2013, the number of workers recovered from 133.1 million to 138.0 million. This increase was concentrated in low ESI industries, which grew by 4.2 million workers between 2010 and 2013. The rate of ESI coverage among all workers also continued to decline between 2010 and 2013, dropping from 70.8 percent to 70.2 percent in that time period (Figure 20). The decline in the ESI coverage rate was more substantial for high ESI industries, where the ESI coverage rate fell by 0.8 percentage points. Workers in high ESI industries saw an increase in the uninsured rate between 2010 and 2013, and 200,000 more were uninsured. Workers in low ESI industries, conversely, had a 0.6 percentage point reduction in the uninsured rate between 2010 and 2013 due to increases in Medicaid coverage. However, because of the population growth in low ESI industries, there were 400,000 more workers in low ESI industries without health insurance in 2013 than in 2010.


Conclusion

Conclusion

The coverage provisions of the ACA that went into effect on January 1, 2014 were primarily designed to increase health insurance coverage among low-to middle-income adults. These provisions include both the establishment of Health Insurance Marketplaces to provide subsidized private non-group health insurance and, in 28 states and the District of Columbia, an expansion of Medicaid eligibility to adults up to 138 percent of the FPL. The 2013 American Community Survey does not capture these expansions, though it does capture early expansions of Medicaid by four states and the expansion of dependent coverage to young adults. Despite capturing some of the early coverage expansions under the ACA, the 2013 ACS serves as a final, albeit imperfect, baseline against which to measure the coverage shifts resulting from the major coverage expansions in the ACA. In addition, the 2013 ACS provides the opportunity to clarify trends in coverage during the economic recovery that preceded the major ACA coverage expansions.

The Great Recession led to a significant increase in the uninsured rate and accelerated the decline in ESI coverage, particularly among those with incomes below 138 percent of the FPL. Since 2010, the recovery has steadily improved uninsured rates, but ESI coverage has continued to decline, albeit at a slower rate, for children and adults aged 26 and older. Adults aged 19 to 25 experienced significant growth in ESI from 2010 to 2013 due to the ACA policy allowing young adults to continue receiving insurance through their parents’ plan until age 26. In addition, most of the growth in employment between 2010 and 2013 was in low ESI industries, and the average ESI coverage rate in those industries was 20 percentage points below that for high ESI industries in 2013 (63.2 percent and 83.2 percent, respectively).

The increases in the uninsured rate during the Great Recession occurred mostly among low-income families, and the reductions in the uninsured rate during the recovery have primarily been through growth in Medicaid and CHIP. Coverage for children, in particular, was stabilized by growth in Medicaid and CHIP enrollment that offset losses in ESI coverage. While adult enrollment in Medicaid grew by 2.6 percentage points between 2008 and 2013, the effect was less pronounced than the 8.1 percentage point growth for children, likely due to lower eligibility levels for adults than for children.

As the ACA is fully implemented, ESI will remain the largest source of insurance coverage for Americans. However, much of the growth in coverage under the ACA is expected to come from Medicaid enrollment and increases in private non-group health insurance coverage purchased through the Health Insurance Marketplaces. It is therefore important to continue to track trends in ESI coverage alongside coverage gains in Medicaid and private non-group health insurance under the ACA to fully understand the effects of the ACA on health insurance coverage.

This issue brief was prepared by Laura Skopec, John Holahan, and Megan McGrath of the Urban Institute.


Appendices

TABLE 1: CHANGE IN HEALTH INSURANCE COVERAGE AMONG THE NONELDERLY BY INCOME, 2008-2013
Coverage distribution within income categoryChange, 2008-2010 Coverage distribution within income categoryChange 2010-2013
 20082010Percentage point changeChange in millions of people2013Percentage point changeChange in millions of people
All incomes (millions of people)261.4265.1  3.7a267.8  2.7a
Employer61.0%57.1%-3.9%*-8.2a56.6%-0.5%*0.3 
Medicaid and State15.3%18.2%2.9%*8.1a19.3%1.1%*3.5a
CHAMPUS/Medicare2.4%2.6%0.3%*0.8a2.8%0.2%*0.6a
Private Non-group4.5%4.2%-0.2%*-0.5a4.3%0.0% 0.2b
Uninsured16.8%17.9%1.1%*3.5a16.9%-0.9%*-2.0a
Less than 138% FPL71.685.9  14.3a89.2  3.3a
Employer21.0%18.9%-2.1%*1.2a20.8%1.9%*2.3a
Medicaid and State41.6%43.6%2.0%*7.7a44.7%1.1%*2.4a
CHAMPUS/Medicare3.0%2.9%-0.1%0.4a3.1%0.2%*0.2a
Private Non-group3.3%3.2%-0.1%*0.4a3.0%-0.2%*-0.1a
Uninsured31.0%31.4%0.3%*4.7a28.4%-2.9%*-1.6a
138 to 400% FPL99.697.1 -2.5a96.7 -0.3 
Employer65.5%64.6%-0.9%*-2.5a63.8%-0.8%*-1.0a
Medicaid and State9.3%10.1%0.8%*0.6a11.1%1.0%*0.9a
CHAMPUS/Medicare2.6%3.0%0.4%*0.3a3.3%0.3%*0.3a
Private Non-group4.7%4.6%0.0%-0.2a4.7%0.1% 0.1 
Uninsured17.9%17.6%-0.3%*-0.7a17.1%-0.5%*-0.6a
400% FPL and above90.282.2 -8a81.9 -0.3 
Employer87.9%88.1%0.3%*-6.8a87.2%-0.9%*-1.0a
Medicaid and State1.2%1.2%0.0%-0.1a1.4%0.2%*0.2a
CHAMPUS/Medicare1.6%1.9%0.3%*0.1a2.0%0.1%*0.1a
Private Non-group5.2%4.9%-0.3%*-0.7a5.1%0.3%*0.2a
Uninsured4.2%4.0%-0.3%*-0.6a4.3%0.3%*0.2a
SOURCE: Analysis of the Urban Institute’s Health Policy Center’s American Community Survey (ACS) Medicaid/CHIP Simulation Model based on data from the Integrated Public Use Microdata Series (IPUMS) from 2010 and 2013.NOTE: Excludes persons aged 65 and older and those in the Armed Forces. Estimates reflect an adjustment for the misreporting of coverage on the ACS.* Indicates change in percent of people is statistically significant (at the 95% confidence level).# Indicates change in percent of people is statistically significant (at the 90% confidence level)a Indicates change in numbers of people is statistically significant  (at the 95% confidence level).b Indicates change in numbers of people is statistically significant (at the 90% confidence level).
Table 2: Change in Health Insurance Coverage among Nonelderly Adults by Income, 2008-2013
Coverage distribution within income categoryChange, 2008-2010 Coverage distribution within income categoryChange 2010-2013
 20082010Percentage point changeChange in millions of people2013Percentage point changeChange in millions of people
All incomes (millions of people)183.0186.5  3.5a189.9  3.4a
Employer63.7%59.9%-3.9%*-5.0a59.7%-0.1% 1.8a
Medicaid and State8.3%10.1%1.7%*3.5a10.9%0.9%*2.0a
CHAMPUS/Medicare2.7%3.0%0.3%*0.7a3.3%0.3%*0.6a
Private Non-group5.2%5.0%-0.2%*-0.1b5.0%0.0% 0.1a
Uninsured20.0%22.0%2.0%*4.4a21.0%-1.0%*-1.1a
Less than 138% FPL45.054.9  9.9a58.3  3.5a
Employer23.6%21.5%-2.2%*1.1a24.5%3.0%*2.5a
Medicaid and State26.4%27.4%1.0%*3.2a28.6%1.2%*1.6a
CHAMPUS/Medicare4.1%3.9%-0.2%*0.3a4.1%0.2%*0.3a
Private Non-group4.5%4.4%-0.1%*0.4a4.1%-0.4%*-0.1a
Uninsured41.3%42.8%1.5%*4.9a38.7%-4.0%*-0.9a
138 to 400% FPL68.668.0  -0.6a68.2  0.2 
Employer65.8%64.7%-1.2%*-1.2a64.6%-0.1% 0.1 
Medicaid and State4.2%4.7%0.6%*0.4a5.1%0.4%*0.3a
CHAMPUS/Medicare2.8%3.3%0.5%*0.3a3.7%0.3%*0.2a
Private Non-group5.6%5.6%0.0% 0.0 5.6%0.1% 0.1 
Uninsured21.6%21.7%0.1% -0.1 21.0%-0.7%*-0.4a
400% FPL and above69.363.6  -5.7a63.4  -0.3 
Employer87.7%87.8%0.1% -4.9a87.0%-0.8%*-0.8a
Medicaid and State0.7%0.8%0.1%*0.0 0.9%0.1%*0.1a
CHAMPUS/Medicare1.6%1.9%0.3%*0.1a2.0%0.1%*0.1a
Private Non-group5.2%5.0%-0.2%*-0.5a5.3%0.3%*0.2a
Uninsured4.8%4.5%-0.3%*-0.4a4.8%0.3%*0.2a
SOURCE: Analysis of the Urban Institute’s Health Policy Center’s American Community Survey (ACS) Medicaid/CHIP Simulation Model based on data from the Integrated Public Use Microdata Series (IPUMS) from 2010 and 2013.NOTE: Excludes persons aged 65 and older and those in the Armed Forces. Estimates reflect an adjustment for the misreporting of coverage on the ACS.* Indicates change in percent of people is statistically significant (at the 95% confidence level).# Indicates change in percent of people is statistically significant (at the 90% confidence level)a Indicates change in numbers of people is statistically significant (at the 95% confidence level).b Indicates change in numbers of people is statistically significant (at the 90% confidence level).
Table 3: Change in Health Insurance Coverage among Nonelderly Adults by Age, 2008-2013
Coverage distribution within income categoryChange, 2008-2010 Coverage distribution within income categoryChange 2010-2013
 20082010Percentage point changeChange in millions of people2013Percentage point changeChange in millions of people
All nonelderly adults183.0186.5  3.5a189.9  3.4a
Employer63.7%59.9%-3.9%*-5.0a59.7%-0.1% 1.8a
Medicaid and State8.3%10.1%1.7%*3.5a10.9%0.9%*2.0a
CHAMPUS/Medicare2.7%3.0%0.3%*0.7a3.3%0.3%*0.6a
Private Non-group5.2%5.0%-0.2%*-0.1b5.0%0.0% 0.1a
Uninsured20.0%22.0%2.0%*4.4a21.0%-1.0%*-1.1a
Ages 19-2528.929.6  0.7a30.7  1.1a
Employer50.5%46.2%-4.2%*-0.9a53.0%6.7%*2.6a
Medicaid and State9.8%12.0%2.1%*0.7a12.1%0.1% 0.2a
CHAMPUS/Medicare1.6%1.9%0.3%*0.1a2.0%0.1%*0.1a
Private Non-group7.7%7.7%0.0% 0.1b7.5%-0.3%*0.0 
Uninsured30.4%32.2%1.8%*0.7a25.5%-6.7%*-1.7a
Ages 26-4581.480.6  -0.8a81.3  0.7a
Employer64.1%59.8%-4.3%*-4.0a58.7%-1.0%*-0.4a
Medicaid and State8.5%10.4%1.9%*1.5a11.4%1.0%*0.9a
CHAMPUS/Medicare1.5%1.7%0.2%*0.2a2.0%0.3%*0.2a
Private Non-group3.8%3.6%-0.2%*-0.2a3.6%0.0% 0.0 
Uninsured22.1%24.5%2.4%*1.7a24.2%-0.3%*-0.1 
Ages 46-6472.776.3  3.6a78.0  1.6a
Employer68.6%65.2%-3.4%*-0.1 63.4%-1.8%*-0.3a
Medicaid and State7.6%9.0%1.4%*1.3a10.0%1.0%*0.9a
CHAMPUS/Medicare4.4%4.8%0.4%*0.4a5.1%0.3%*0.3a
Private Non-group5.7%5.5%-0.2%*0.0 5.5%0.0% 0.1a
Uninsured13.6%15.5%1.9%*1.9a16.0%0.5%*0.6a
SOURCE: Analysis of the Urban Institute’s Health Policy Center’s American Community Survey (ACS) Medicaid/CHIP Simulation Model based on data from the Integrated Public Use Microdata Series (IPUMS) from 2010 and 2013.NOTE: Excludes persons aged 65 and older and those in the Armed Forces. Estimates reflect an adjustment for the misreporting of coverage on the ACS.* Indicates change in percent of people is statistically significant (at the 95% confidence level).# Indicates change in percent of people is statistically significant (at the 90% confidence level)a Indicates change in numbers of people is statistically significant (at the 95% confidence level).b Indicates change in numbers of people is statistically significant (at the 90% confidence level).
Table 4: Change in Health Insurance Coverage among Children by Income, 2008-2013
Coverage distribution within income categoryChange, 2008-2010 Coverage distribution within income categoryChange 2010-2013
 20082010Percentage point changeChange in millions of people2013Percentage point changeChange in millions of people
All incomes (millions of people)78.478.6  0.2a77.9  -0.7a
Employer54.7%50.5%-4.2%*-3.2a49.1%-1.5%*-1.5a
Medicaid and State31.7%37.5%5.8%*4.6a39.8%2.4%*1.6a
CHAMPUS/Medicare1.6%1.7%0.1%#0.1b1.8%0.1%*0.0b
Private Non-group2.8%2.3%-0.5%*0.0a2.4%0.0% 0.0 
Uninsured9.2%8.0%-1.2%*-1.0a7.0%-1.0%*-0.8a
Less than 138% FPL26.631.0 4.4a30.8  -0.2 
Employer16.6%14.3%-2.2%*0.0 13.7%-0.6%*-0.2a
Medicaid and State67.3%72.3%5.0%*4.5a75.4%3.1%*0.8a
CHAMPUS/Medicare1.1%1.1%0.1%#0.1a1.1%-0.1% 0.0 
Private Non-group1.3%1.0%-0.3%*0.0a0.9%-0.1%*0.0a
Uninsured13.8%11.3%-2.5%*-0.2a8.9%-2.3%*-0.7a
138 to 400% FPL30.929.1  -1.9a28.5  -0.5a
Employer64.7%64.5%-0.2% -1.3a61.9%-2.6%*-1.1a
Medicaid and State20.6%22.7%2.0%*0.2a25.3%2.7%*0.6a
CHAMPUS/Medicare2.2%2.3%0.0% 0.0 2.5%0.3%*0.1a
Private Non-group2.7%2.4%-0.3%*0.0a2.4%0.1% 0.0 
Uninsured9.7%8.2%-1.5%*-0.6a7.8%-0.4%*-0.2a
400% FPL and above20.918.6  -2.3a18.6  0.0 
Employer88.4%89.2%0.7%*-1.9a88.0%-1.2%*-0.2b
Medicaid and State2.6%2.5%0.0% -0.1a3.2%0.6%*0.1a
CHAMPUS/Medicare1.5%1.8%0.3%*0.0 1.8%0.0% 0.0 
Private Non-group4.9%4.4%-0.5%*0.0a4.7%0.2%*0.0a
Uninsured2.6%2.1%-0.5%*-0.1a2.4%0.3%*0.1a
SOURCE: Analysis of the Urban Institute’s Health Policy Center’s American Community Survey (ACS) Medicaid/CHIP Simulation Model based on data from the Integrated Public Use Microdata Series (IPUMS) from 2010 and 2013.NOTE: Excludes persons aged 65 and older and those in the Armed Forces. Estimates reflect an adjustment for the misreporting of coverage on the ACS.* Indicates change in percent of people is statistically significant (at the 95% confidence level).# Indicates change in percent of people is statistically significant (at the 90% confidence level)a Indicates change in numbers of people is statistically significant (at the 95% confidence level).b Indicates change in numbers of people is statistically significant (at the 90% confidence level).
Table 5: Change in Health Insurance Coverage among the Nonelderly by Race and Ethnicity, 2008-2013
Coverage distribution within income categoryChange, 2008-2010 Coverage distribution within income categoryChange 2010-2013
 20082010Percentage point changeChange in millions of people2013Percentage point changeChange in millions of people
White, non-Hispanic165.9162.9 -3.0a160.5-2.3a
Employer69.0%66.0%-3.0%*-7.0a65.5%-0.4%*-2.3a
Medicaid and State10.6%12.6%2.0%*3.0a13.4%0.8%*1.0a
CHAMPUS/Medicare2.5%2.8%0.3%*0.4a3.1%0.3%*0.4a
Private Non-group5.5%5.3%-0.2%*-0.5a5.3%0.0%-0.1
Uninsured12.4%13.3%0.9%*1.1a12.6%-0.7%*-1.4a
Black, non-Hispanic32.433.4  1.0a33.90.5a
Employer49.0%43.9%-5.1%*-1.2a43.7%-0.2%0.2b
Medicaid and State27.4%31.4%4.0%*1.6a32.3%0.9%*0.5a
CHAMPUS/Medicare2.9%3.3%0.4%*0.2a3.5%0.2%*0.1a
Private Non-group1.9%1.7%-0.2%*-0.1a1.7%0.1%0.0a
Uninsured18.7%19.7%1.0%*0.5a18.7%-1.0%*-0.2a
Hispanic43.647.3  3.7a50.02.7a
Employer40.4%36.2%-4.2%*-0.5a36.9%0.7%*1.3a
Medicaid and State24.2%28.2%4.0%*2.8a29.8%1.6%*1.6a
CHAMPUS/Medicare1.5%1.6%0.1%*0.1a1.7%0.1%*0.1a
Private Non-group2.0%1.8%-0.1%*0.02.0%0.1%*0.1a
Uninsured32.0%32.2%0.2%1.3a29.7%-2.6%*-0.4a
Other, non-Hispanic19.521.6 2.1a23.41.8a
Employer59.2%56.2%-2.9%*0.6a56.5%0.3%1.1a
Medicaid and State16.0%18.2%2.2%*0.8a19.0%0.8%*0.5a
CHAMPUS/Medicare2.2%2.3%0.1%0.1a2.4%0.1%#0.1a
Private Non-group5.5%5.4%-0.1%0.1a5.3%-0.1%0.1a
Uninsured17.2%17.9%0.7%*0.5a16.7%-1.2%*0.0 
SOURCE: Analysis of the Urban Institute’s Health Policy Center’s American Community Survey (ACS) Medicaid/CHIP Simulation Model based on data from the Integrated Public Use Microdata Series (IPUMS) from 2010 and 2013.NOTE: Excludes persons aged 65 and older and those in the Armed Forces. Estimates reflect an adjustment for the misreporting of coverage on the ACS.* Indicates change in percent of people is statistically significant (at the 95% confidence level).# Indicates change in percent of people is statistically significant (at the 90% confidence level)a Indicates change in numbers of people is statistically significant (at the 95% confidence level).b Indicates change in numbers of people is statistically significant (at the 90% confidence level).
Table 6: Change in Health Insurance Coverage among the Nonelderly by Region, 2008-2013
Coverage distribution within income categoryChange, 2008-2010 Coverage distribution within income categoryChange 2010-2013
 20082010Percentage point changeChange in millions of people2013Percentage point changeChange in millions of people
Northeast46.947.1 0.2a47.1 0.0a
Employer66.9%63.2%-3.7%*-1.6a62.2%-1.0%*-0.5a
Medicaid and State16.2%19.3%3.1%*1.5a20.5%1.2%*0.6a
CHAMPUS/Medicare1.4%1.5%0.1%#0.0a1.7%0.2%*0.1a
Private Non-group3.9%3.7%-0.2%*0.0a3.8%0.1%0.0
Uninsured11.6%12.3%0.8%*0.4a11.9%-0.5%*-0.2a
Midwest57.257.3 0.1a57.2-0.2a
Employer66.3%61.9%-4.5%*-2.5a61.5%-0.4%#-0.3a
Medicaid and State14.7%17.7%3.0%*1.7a18.7%1.0%*0.5a
CHAMPUS/Medicare1.7%1.9%0.2%*0.1a2.1%0.2%*0.1a
Private Non-group4.3%4.3%0.0%0.04.4%0.1%#0.1
Uninsured12.9%14.2%1.3%*0.8a13.3%-0.9%*-0.6a
South95.698.1 2.5a100.0 1.9a
Employer57.1%53.3%-3.9%*-2.4a52.9%-0.3%*0.7a
Medicaid and State15.2%17.9%2.7%*3.0a19.1%1.2%*1.5a
CHAMPUS/Medicare3.3%3.6%0.3%*0.4a3.9%0.2%*0.3a
Private Non-group4.2%4.0%-0.3%*-0.1a3.9%0.0%0.1
Uninsured20.2%21.3%1.1%*1.6a20.2%-1.1%*-0.7a
West61.762.6 0.9a63.61.0a
Employer57.7%54.1%-3.6%*-1.7a54.0%-0.1%0.5a
Medicaid and State15.5%18.4%2.8%*1.9a19.5%1.1%*0.9a
CHAMPUS/Medicare2.3%2.5%0.3%*0.2a2.7%0.2%*0.1a
Private Non-group5.5%5.1%-0.4%*-0.2a5.0%-0.1%0.0
Uninsured19.1%20.0%0.9%*0.7a18.9%-1.1%*-0.5a
SOURCE: Analysis of the Urban Institute’s Health Policy Center’s American Community Survey (ACS) Medicaid/CHIP Simulation Model based on data from the Integrated Public Use Microdata Series (IPUMS) from 2010 and 2013.NOTE: Excludes persons aged 65 and older and those in the Armed Forces. Estimates reflect an adjustment for the misreporting of coverage on the ACS.* Indicates change in percent of people is statistically significant (at the 95% confidence level).# Indicates change in percent of people is statistically significant (at the 90% confidence level)a Indicates change in numbers of people is statistically significant (at the 95% confidence level).b Indicates change in numbers of people is statistically significant (at the 90% confidence level).
Table 7: Change in Uninsurance among the Nonelderly by State, 2010-2013
Number and Share of State Population UninsuredChange, 2010-2013
 20102013Percentage point changeChange in millions of people
 Number UninsuredUninsured RateNumber UninsuredUninsured Rate
United States47.317.9%45.416.9%-0.9%*-2.0a
Alabama0.717.3%0.716.4%-0.8%#0.0a
Alaska0.119.3%0.120.5%1.2%0.0
Arizona1.119.7%1.120.6%0.9%*0.1a
Arkansas0.520.2%0.519.0%-1.2%#0.0b
California6.821.0%6.519.7%-1.3%*-0.3a
Colorado0.818.0%0.716.1%-1.9%*-0.1a
Connecticut0.310.5%0.311.0%0.5%0.0
Delaware0.111.8%0.111.8%0.0%0.0
DC0.09.1%0.07.7%-1.3%#0.0
Florida3.925.7%3.924.6%-1.1%*-0.1b
Georgia1.922.0%1.821.2%-0.8%*0.0
Hawaii0.18.9%0.18.6%-0.3%0.0
Idaho0.320.7%0.318.9%-1.8%*0.0b
Illinois1.815.8%1.614.5%-1.3%*-0.2a
Indiana0.916.9%0.916.1%-0.8%*0.0a
Iowa0.311.0%0.310.5%-0.4%0.0
Kansas0.415.8%0.414.6%-1.3%*0.0a
Kentucky0.717.7%0.617.0%-0.7%#0.0
Louisiana0.820.3%0.819.4%-1.0%*0.0b
Maine0.112.8%0.113.6%0.8%0.0
Maryland0.713.0%0.611.8%-1.2%*-0.1a
Massachusetts0.35.4%0.34.8%-0.6%*0.0a
Michigan1.214.6%1.113.2%-1.4%*-0.1a
Minnesota0.510.3%0.59.7%-0.5%0.0
Mississippi0.520.8%0.519.7%-1.1%#0.0a
Missouri0.815.4%0.815.4%0.1%0.0
Montana0.220.3%0.220.0%-0.3%0.0
Nebraska0.213.8%0.212.4%-1.4%*0.0a
Nevada0.625.5%0.623.5%-2.0%*0.0a
New Hampshire0.112.6%0.112.6%0.0%0.0
New Jersey1.115.2%1.215.5%0.3%0.0
New Mexico0.423.1%0.422.5%-0.6%0.0
New York2.313.8%2.112.7%-1.1%*-0.2a
North Carolina1.619.4%1.518.4%-1.0%*-0.1a
North Dakota0.111.9%0.112.3%0.3%0.0
Ohio1.414.1%1.312.9%-1.3%*-0.1a
Oklahoma0.721.9%0.720.3%-1.5%*0.0a
Oregon0.720.1%0.617.8%-2.3%*-0.1a
Pennsylvania1.312.2%1.211.7%-0.5%*-0.1a
Rhode Island0.114.1%0.114.1%0.0%0.0
South Carolina0.820.4%0.718.6%-1.8%*-0.1a
South Dakota0.114.0%0.114.7%0.6%0.0
Tennessee0.916.7%0.916.4%-0.3%0.0
Texas5.826.3%5.724.5%-1.7%*-0.2a
Utah0.417.1%0.414.9%-2.2%*0.0a
Vermont0.09.4%0.08.3%-1.1%0.0
Virginia1.014.6%1.014.3%-0.3%0.0
Washington0.916.3%1.016.5%0.2%0.0
West Virginia0.317.3%0.216.3%-0.9%0.0b
Wisconsin0.511.2%0.510.8%-0.4%0.0
Wyoming0.116.7%0.115.2%-1.6%0.0
SOURCE: Analysis of the Urban Institute’s Health Policy Center’s American Community Survey (ACS) Medicaid/CHIP Simulation Model based on data from the Integrated Public Use Microdata Series (IPUMS) from 2010 and 2013.NOTE: Excludes persons aged 65 and older and those in the Armed Forces. Estimates reflect an adjustment for the misreporting of coverage on the ACS.* Indicates change in percent of people is statistically significant (at the 95% confidence level).# Indicates change in percent of people is statistically significant (at the 90% confidence level)a Indicates change in numbers of people is statistically significant (at the 95% confidence level).b Indicates change in numbers of people is statistically significant (at the 90% confidence level).
Table 8: Change in Health Insurance Coverage among Workers by Industry, 2008-2013
Coverage distribution within income categoryChange, 2008-2010 Coverage distribution within income categoryChange 2010-2013
 20082010Percentage point changeChange in millions of people2013Percentage point changeChange in millions of people
All workers140.4133.1  -7.3a138.0 4.8a
Employer72.4%70.8%-1.6%*-7.5a70.2%-0.6%*2.6a
Medicaid and State4.3%4.9%0.6%*0.5a5.5%0.6%*1.1a
CHAMPUS/Medicare1.3%1.5%0.1%*0.1a1.6%0.2%*0.3a
Private Non-group4.8%4.7%-0.1%*-0.4a4.8%0.1%#0.3a
Uninsured17.2%18.1%0.9%*0.017.9%-0.2%*0.6a
High ESI industries50.247.3  -2.9a48.0 0.7a
Employer84.9%84.1%-0.8%*-2.8a83.2%-0.8%*0.2
Medicaid and State2.2%2.5%0.3%*0.1a2.8%0.3%*0.2a
CHAMPUS/Medicare1.2%1.5%0.3%*0.1a1.7%0.2%*0.1a
Private Non-group3.1%3.1%0.0%-0.1a3.2%0.1%*0.1a
Uninsured8.6%8.9%0.3%*-0.1a9.1%0.2%*0.2a
Low ESI industries90.285.8  -4.4a90.0 4.2a
Employer65.5%63.5%-2.0%*-4.6a63.2%-0.2%#2.4a
Medicaid and State5.4%6.2%0.8%*0.5a6.9%0.7%*0.9a
CHAMPUS/Medicare1.5%1.5%0.0%0.0b1.6%0.1%*0.2a
Private Non-group5.7%5.6%-0.1%#-0.3a5.6%0.0%0.2a
Uninsured22.0%23.2%1.3%*0.122.6%-0.6%*0.4a
SOURCE: Analysis of the Urban Institute’s Health Policy Center’s American Community Survey (ACS) Medicaid/CHIP Simulation Model based on data from the Integrated Public Use Microdata Series (IPUMS) from 2010 and 2013.NOTE: Excludes persons aged 65 and older and those in the Armed Forces. Estimates reflect an adjustment for the misreporting of coverage on the ACS.* Indicates change in percent of people is statistically significant (at the 95% confidence level).# Indicates change in percent of people is statistically significant (at the 90% confidence level)a Indicates change in numbers of people is statistically significant (at the 95% confidence level).b Indicates change in numbers of people is statistically significant (at the 90% confidence level).

Endnotes

  1. Blavin, F., Holahan, J., Kenney, G., and Chen, V. 2013. A Decade of Coverage Losses: Implications for the Affordable Care Act. The Urban Institute. Available at: http://www.urban.org/UploadedPDF/412514-Implications-for-the-Affordable-Care-Act.pdf. ↩︎
  2. Holahan, J. and McGrath, M. 2014. As the Economy Improves, the Number of Uninsured is Falling but not because of a Rebound in Employer Sponsored Insurance. Kaiser Family Foundation. Available at: https://modern.kff.org/uninsured/issue-brief/as-the-economy-improves-the-number-of-uninsured-is-falling-but-not-because-of-a-rebound-in-employer-sponsored-insurance/ ; Holahan, J. and McGrath, M. 2013. Reversing the Trend? Understanding the Recent Increase in Health Insurance Coverage among the Nonelderly Population. Kaiser Family Foundation. Available at: https://modern.kff.org/uninsured/issue-brief/reversing-the-trend-understanding-the-recent-increase-in-health-insurance-coverage-among-the-nonelderly-population/; and Holahan, J. and Chen, V. 2011. Changes in Health Insurance Coverage in the Great Recession, 2007-2010. Kaiser Family Foundation. Available at: https://modern.kff.org/medicaid/issue-brief/changes-in-health-insurance-coverage-in-the/. ↩︎
  3. O’Hara, B. and Medalia, C. 2014. CPS and ACS Health Insurance Estimates: Consistent Trends from 2009-2012. SEHSD Working Paper 2014-29. Available at: https://www.census.gov/hhes/www/hlthins/data/incpovhlth/2013/CPS_ACS_Trends.pdf ↩︎
  4. United States Census Bureau. Fact Sheet – Differences Between CPS ASEC and ACS. Available at: https://www.census.gov/hhes/www/poverty/about/datasources/factsheet.html. ↩︎
  5. The HIU is a unit of analysis for determining family income that more accurately reflects eligibility for public assistance than does analysis at the household level. The HIU includes members of a family who can be covered under one health insurance policy, such as the policyholder, spouse, children under age 19, and full-time students under age 23. The household, by contrast, may include other relatives or unrelated individuals. ↩︎
  6. Steven Ruggles, J. Trent Alexander, Katie Genadek, Ronald Goeken, Matthew B. Schroeder, and Matthew Sobek. Integrated Public Use Microdata Series: Version 5.0 [Machine-readable database]. Minneapolis: University of Minnesota, 2010. Further information on the creation of the ACS iPUMS files is available at: www.ipums.org. ↩︎
  7. For further details, see Lynch, V. Kenney, G.M., Haley, J., and Resnick, D. 2011. Improving the Validity of the Medicaid/CHIP Estimates on the American Community Survey: The Role of Logical Coverage Edits. Report to the U.S. Census Bureau. Available at: http://www.census.gov/hhes/www/hlthins/publications/Improving%20the%20 Validity%20of%20the%20Medicaid-CHIP%20Estimates%20on%20the%20ACS.pdf ↩︎
  8. Ibid and Haley, J.M., Lynch, V., and Kenney, G.M. 2014. The Urban Institute Health Policy Center’s Medicaid/CHIP Eligibility Simulation Model. The Urban Institute. Available at: http://www.urban.org/publications/413069. ↩︎
  9. Ibid ↩︎
  10. Bureau of Labor Statistics. “Labor Force Statistics from the Current Population Survey.” March 19, 2015. Available at: http://data.bls.gov/timeseries/LNS14000000. ↩︎
  11. The public use file of the American Community Survey does not include a postmark or interview date, so it is not possible to determine whether the 200,000 additional young adults with private non-group coverage enrolled before or after October 2013. ↩︎
  12. While 2007 may provide a better pre-recession measure, the ACS did not begin asking about health insurance until the 2008 survey year. Official recession dates from National Bureau of Economic Research. ↩︎
  13. Given the relative stability of and limited eligibility for military and Medicare coverage among the nonelderly population, this coverage is not shown throughout this brief. ↩︎
  14. This coverage type includes Medicaid, CHIP, and other state coverage programs for those with low incomes or a disability. ↩︎
  15. Sommers, B.D, Kenney, G.M., and Epstein, A.M. 2014. “New Evidence on the Affordable Care Act: Coverage Impacts of Early Medicaid Expanions.” Health Affairs 33(1): 78-87. ↩︎
  16. Sommers, B.D., Buchmueller, T., Decker, S.L., Carey, C., and Kronick, R. 2013. The Affordable Care Act Has Led to Significant Gains in Health Insurance and Access to Care for Young Adults. Health Affairs 32(1): 165-174. ↩︎
  17. The other group includes Asians, Pacific Islanders, American Indians, Alaska Natives, and anyone reporting two or more races. ↩︎
  18. High ESI industries are those with ESI coverage rates of more than 80 percent in 2012 and consist primarily of finance, manufacturing, information and communications firms. Low ESI industries had ESI coverage rates of less than 80 percent in 2012 and consist primarily of agriculture, construction, and wholesale and retail trade. ↩︎

Demonstrations to Improve the Coordination of Medicare and Medicaid for Dually Eligible Beneficiaries: What Prior Experience Did Health Plans and States Have with Capitated Arrangements?

Authors: Rivka Weiser and Marsha Gold
Published: Apr 21, 2015

Executive Summary

Individuals who are dually eligible for Medicare and Medicaid (“dually eligible beneficiaries”) constitute a diverse population with extensive and varied needs for services, requiring careful coordination of the benefits covered across the two programs. The Financial Alignment Initiative was developed by the Federal Coordinated Health Care Office in the Centers for Medicare and Medicaid Services (CMS) in an effort to work with states to improve the coordination of all Medicare and Medicaid covered benefits, and enhance the care provided to dually eligible beneficiaries.

Most states participating in the initiative are pursuing a capitated managed care model, which is the focus of this brief. In these capitated financial alignment demonstrations, health plans contract with the state and CMS (a three-way contract) to provide both Medicare and Medicaid benefits to dually eligible beneficiaries.  This brief reviews the demonstration projects established in 10 states — the nine states that had three-way contracts by December 2014 for capitated financial alignment demonstrations (California, Illinois, Massachusetts, Michigan, New York, Ohio, South Carolina, Texas, and Virginia), and one state that is administratively aligning Medicare and Medicaid (an administrative alignment demonstration) using its existing managed care model (Minnesota).   Five of these states’ demonstrations (California, Illinois, Massachusetts, Ohio, and Virginia), as well as the Minnesota administrative alignment demonstration, were operational as of December 2014.

This brief reviews the prior experience in states participating in the initiative and in the health plans in operating Medicare Advantage or Medicaid Managed Care (MMC) plans within the states, particularly those with financial alignment demonstrations currently underway.  The prior experience of states and health plans provides a foundation for understanding the existing infrastructure for implementing these demonstrations. States that are experienced in working with managed care plans, even if for other populations, are more likely to have expertise in setting capitation rates, negotiating terms for the contracts with plans, monitoring the quality of care, and overseeing the enrollment process. States’ prior experience may also be a proxy for how familiar beneficiaries and providers in the state are with similar capitated programs.   Health plans with prior experience in providing coverage for dually-eligible beneficiaries (or for those with just Medicare or Medicaid) are more likely to be familiar with the significant needs of this population, and the rules pertaining to various aspects of operating a plan (e.g., appeals and grievances, network requirements, enrollment procedures) and benefits that could ease implementation of the demonstration.

Key Findings

State Experience with MMC for Dually Eligible Beneficiaries and with Integrating Medicare and Medicaid. The 10 states participating in the demonstration using a capitated managed care model differ considerably in their prior experience in managing care for dually eligible beneficiaries. Four of the nine demonstration states (California, Massachusetts, New York, and Texas) provided some Medicaid services to dually eligible beneficiaries through capitated MMC and had programs that integrated Medicare and Medicaid services for dually eligible beneficiaries prior to the demonstration; the extent of experience differed across these states.  Massachusetts had a larger and more fully integrated program than the other three states. Five of the demonstration states (Illinois, Michigan, Ohio, South Carolina, and Virginia) did not previously contract with health plans to integrate Medicare and Medicaid benefits for dually eligible beneficiaries and dually eligible beneficiaries in these states were not enrolled in capitated MMC before these states began to develop their demonstrations.  Minnesota, which is implementing an administrative demonstration only, is building upon its prior program that integrated Medicare and Medicaid services for dually eligible beneficiaries.

Health Plans Participating in the Initiative. Twenty-nine health plans operated by 24 organizations participated in the five states with operational financial alignment demonstrations beginning in 2013 or 2014; another 38 health plans were scheduled to participate in the other state demonstrations beginning in 2015 (See Table ES-1 and Table ES-2 for a summary). Because health plan participation is not set until implementation begins, our analysis, conducted in the fall of 2014, focused most extensively on health plans in the five states with operational demonstrations at that time.

Health Plan Experience with Medicare Advantage and Medicaid Managed Care. Most, but not all, health plans in state demonstrations operational in 2014 had prior experience within the states with either Medicaid managed care and/or Medicare Advantage health plans of some type. Of the 29 health plans, seven had no previous in-state Medicaid enrollment (mostly in Illinois, in which organizations developed Medicaid plans at around the same time as the demonstration). Four of the 29 organizations had no in-state Medicare Advantage enrollment, though two of those had Medicare Advantage plans in other states.

Looking across all the participating states, most health plans (50 out of 67 plans) have some experience managing Medicare benefits in the state in which they would be operating a demonstration plan, either through regular Medicare Advantage plans or Special Needs Plans for dually eligible beneficiaries (D-SNPs). However, 17 of the health plans, some of which had Medicare Advantage plans in other states, have no in-state experience managing Medicare benefits. In particular, most of the demonstration plans in South Carolina and many of the plans in New York lack in-state Medicare experience.  In New York, this lack of experience may be attributable to the state’s selection of plans based on their experience managing long-term services and supports (LTSS) in Medicaid.  In South Carolina, enrollment in Medicare Advantage plans has historically been relatively low, and fewer organizations have any experience with Medicare Advantage relative to other states with higher Medicare Advantage enrollment. In states with prior enrollment of dually eligible beneficiaries in capitated MMC, the demonstrations are contracting with companies that also operate health plans in their existing Medicaid programs that serve dual eligible and/or include managed LTSS.

National Affiliations and Profit Status. Of the 29 plans in states with demonstrations that were operational before 2015, 10 were local (mainly in California and Massachusetts), 9 were affiliated with four national firms operating in more than one demonstration state (Centene, Humana, Molina, and Anthem), and 10 with other organizations.  Twelve operated on a nonprofit basis (all 10 local plans and two others — Blue Cross Blue Shield of Illinois and CareSource) and the other 17 on a for-profit basis.  In the four demonstration states beginning operations in 2015 (Michigan, New York, South Carolina, and Texas), the participating health plans are mostly operated by large, multi-state, for-profit organizations.  New York is the main exception as it has many local, nonprofit, provider-based plans that are also part of its Medicaid Managed Long Term Care (MLTC) program.

Plan Quality Ratings. Among demonstrations operational in 2014, plans in Massachusetts have high ratings for their Medicare and Medicaid product lines, whereas almost all of California’s health plans have relatively low Medicaid ratings.  Because of limited prior enrollment, there are few Medicaid quality ratings for Illinois health plans (with one exception).  The health plans participating in the Ohio and Virginia demonstrations generally have average quality ratings.

Discussion

The findings of this study suggest that in states and health plans engaged in capitated financial alignment demonstrations, there is considerable variation in the relevant prior experience brought to the demonstration. In some states, such as Massachusetts and California, plans participating in the demonstrations have had prior experience with dually eligible beneficiaries in both Medicare and Medicaid capitated arrangements.  However, in other states, plans, beneficiaries, and providers have had minimal exposure to capitated arrangements for Medicaid or Medicare. In these latter states, plans will need to ramp up the knowledge, provider networks, and infrastructure that will be needed to address the complex needs of dually eligible beneficiaries.  States with relatively little experience with capitated arrangements for Medicaid populations (including beneficiaries dually eligible for Medicare and Medicaid) may face greater challenges in setting payment rates, negotiating contracts with plans, and overseeing the care provided by plans in that state.  Health plans with relatively little experiences may face greater challenges in developing new provider networks, tailoring care management models for dually eligible beneficiaries, and providing integrated care for a high-need population through capitated arrangements.  Even in states with a fair amount of experience with managed care, some health plans are more oriented toward Medicaid’s low income families than with Medicare beneficiaries, which could pose challenges as these demonstrations get underway. How well all this is accomplished is important because the Financial Alignment Initiative seeks to improve care for dually eligible beneficiaries, a population widely recognized as having extensive needs that are challenging to address and not necessarily well addressed by the current health care system, with its division of benefits between Medicare and Medicaid.


Table ES-1: Comparison of Plan and State Experience Across States with Operational Financial Alignment Demonstration forDually Eligible Beneficiaries prior to January 2015
CaliforniaIllinoisMassachusettsOhioVirginia
Total Number of Plans108353
Number of plans with in-state experience managing Medicare benefits, including Medicare Advantage non-SNPs or D-SNPs9.3 non-SNPs;

9 D-SNPs

6.6 non-SNPs;

3 D-SNPs

3.2 non-SNPs;

3 D-SNPs

5.2 non-SNPs;

4 D-SNPs

2.2 non-SNPs;

1 D-SNPs

Number of plans with any in-state experience managing Medicaid benefits for dually eligible beneficiaries100300
Number of nonprofit plans61311
Number of plans affiliated with national firms operating demonstrations in 2+ states25052
Relative Medicaid quality ratingsLow(generally)Not available(generally)High(generally)Average (generally)Average(generally)
Relative Medicare quality ratings for D-SNPsAverage (generally)Not available (generally)High(generally)Not available (generally)Average (generally)
State Experience
Prior to demonstration, state contracted with health plans to provide some Medicaid benefits to dually eligible beneficiaries?YesNoYesNoNo
Prior to demonstration, state contracted with health plans to integrate Medicare and Medicaid benefits to dually eligible beneficiaries?YesNoYes,but only for seniorsNoNo
SOURCE: Authors’ analysis, 2015. See tables 3 through 7 for all data sources.
Table ES-2: Comparison of Plan and State Experience Across States With Financial Alignment Demonstrations forDually Eligible Beneficiaries Beginning in 2015
MichiganNew YorkSouth CarolinaTexas
Total Number of Plans72245
Number of plans with any in-state experience managing Medicare benefits, including Medicare Advantage plans and D-SNPs61515
Number of plans with any in-state experience managing Medicaid benefits for  dually eligible beneficiaries52205
Number of plans affiliated with national firms operating demonstrations in 2+ states2235
State Experience
Prior to demonstration, state contracted with health plans to provide some Medicaid benefits to dually eligible beneficiaries?No*YesNoYes
Prior to demonstration, state contracted with health plans to integrate Medicare and Medicaid benefits to dually eligible beneficiaries?NoYesNoYes
SOURCE: Authors’ analysis, 2015. See tables 3 through 7 for all data sources.NOTE: * Michigan began including some dually eligible beneficiaries in Medicaid managed care after the 2011 date of the CMS enrollment data used for this report, during the time Michigan was planning its demonstration.

Introduction

Individuals dually eligible for Medicare and Medicaid are a diverse population, with characteristics and care needs that create vulnerabilities and account for a disproportionate share of health care spending.1  About 40 percent are low-income, under age 65, and disabled, including a majority with significant mental health or substance abuse service needs, and many with extensive long-term services and supports (LTSS) needs. The others are low-income elderly individuals, many of whom have multiple chronic conditions or are frail, and may require LTSS.2  Many of these individuals have a diversity of needs and require complex care management that leverages a wide variety of services and provider types.

Medicare is the primary payer for acute care services required by dually eligible beneficiaries, whereas Medicaid provides additional benefits not covered by Medicare (primarily LTSS) and covers cost sharing and premiums associated with the Medicare program.3 ,4  Although effective care typically requires coordinating the benefits covered by these different programs, the means for doing so have been limited historically, with each program operating independently.5  Beneficiaries generally have received services paid on a fee-for-service basis, with no single entity responsible for seeing that services are coordinated appropriately to meet the needs of individual beneficiaries.

Existing Managed Care Options for Dually Eligible Beneficiaries

Medicare Advantage is the main managed care option within Medicare. Although all beneficiaries may enroll, there have been limited incentives for dually eligible beneficiaries to do so because they have typically received the extra benefits offered by Medicare Advantage plans (such as lower cost-sharing and limited benefits for vision and dental services) through Medicaid. To better serve their needs, the Medicare Modernization Act of 2003 allowed for the development of Dual Eligible Special Needs Plans (D-SNPs) that could be tailored to those dually eligible for Medicare and Medicaid. D-SNPs have recently been required to have contracts with state Medicaid agencies (in addition to Medicare) and coordinate delivery of Medicare and Medicaid benefits. However, states have little financial incentive to integrate benefits unless Medicaid LTSS are included in the benefit package because Medicaid coverage of acute care benefits is very limited for dually eligible beneficiaries).

Integration is less challenging for states with prior experience in aligning Medicare and comprehensive Medicaid benefits.  While most D-SNPs provide only Medicare benefits in their capitated benefit packages, Fully Integrated Dual Eligible (FIDE) SNPs are D-SNPs that coordinate Medicare and Medicaid services and contract with states to provide Medicaid services, including LTSS, on a risk basis. Demonstration states that have implemented FIDE SNPs (California, Massachusetts, Minnesota, and New York) have had more experience with integration for dually eligible beneficiaries than others, as discussed later in this brief.

Within Medicaid, comprehensive risk-based managed care is the broadest-based managed care program.6   Historically, these programs were developed to serve low-income families and children. However, programs have been expanded in some states to cover those eligible for Medicaid based on disability, and health plans have had to adjust their provider networks and care management tools to address this population’s needs. Typically, these programs have been restricted to Medicaid-only individuals because of the challenges in coordinating benefits across Medicare and Medicaid. When state Medicaid programs focused on managed care for dually eligible beneficiaries, they generally did so primarily to coordinate and limit cost growth in LTSS, which are state responsibilities.7 

The health plans participating in Medicare and Medicaid are not necessarily the same plans, and therefore health plans serving dually eligible beneficiaries may not already have experience serving members under each program.8  Medicare Advantage plans are more likely to have had experience in managing acute care benefits for both aged and disabled beneficiaries, whereas Medicaid health plans generally have managed benefits for low-income families and children and, in some states, acute care services and/or LTSS for adults with disabilities. Enrollment in health plans is voluntary in Medicare but can be mandated in Medicaid if states meet federal terms and conditions.

An Overview of the Financial Alignment Initiative

With the goal of better coordinating care financed by the Medicare and Medicaid programs for dually eligible beneficiaries, the Affordable Care Act authorized the creation of a new Medicare-Medicaid Coordination Office within the Centers for Medicare and Medicaid Services (CMS). Its goal is to enhance dually eligible beneficiaries’ access to benefits, simplify and make more consistent the requirements and processes used across the two programs, better coordinate the programs’ benefits, and enhance the quality and cost-effectiveness of care.9 

The Financial Alignment Initiative is one major strategy being pursued to achieve these goals. Under the initiative, states were solicited to participate in a partnership with the federal government to develop demonstrations to better align care for dually eligible beneficiaries across Medicare and Medicaid.10   States were provided with two basic models: a Capitated Managed Care Model and a Managed Fee-for-Service Model.11   The initial design of the financial alignment demonstrations was very ambitious, with the expectation that, by 2012 and 2013, a large number of states would be actively engaged in operational programs that served large numbers of individuals; this expectation generated some concern about the wide scope and rapid pace of change sought and the potential disruptions to services for vulnerable beneficiaries.12   Although 26 states initially expressed interest in some form of the demonstration involving either model, at least 11 later withdrew and the time frame for other states was delayed.13 

This brief focuses specifically on the capitated managed care model being pursued under the demonstration. The model involves contracting with health plans on a capitated basis to provide coordinated benefits across Medicare and Medicaid. Some experts believe that a managed care approach offers the greatest potential to modify fee-for-service incentives (which can incentivize provision of unnecessary services) and achieve better coordination of services and across benefits covered in different programs. Capitated payment, by its nature, focuses on the totality of care for people enrolled in the health plan. Conceptually, capitation provides incentives to manage  care in ways that prevent, where feasible, avoidable conditions or complications that can be expensive to treat and harmful to the health of the enrollee.  Because they are responsible for all the covered benefits received by this population, managed care plans  must develop provider networks and other policies that support adequate access to covered by their contracts with Medicare and Medicaid. Contracts with these payers in turn include requirements that plans must meet and stipulate processes of oversight. They typically also require reporting of performance metrics that reflect care for the populations they serve.  Such requirements are harder to implement in fee-for-service and are especially important in caring for the dual eligible population.

There are, however, also inherent risks that capitation’s financial incentives will lead to underservice and suboptimal care, particularly if contracts are signed with plans and associated providers that have limited experience in providing services for the dually eligible population. Their provider networks may not necessarily include the full range of specialized services that dually eligible beneficiaries are likely to require (such as specific types of substance abuse, mental health, and LTSS providers); also, care management tools developed for a healthier population may not be adequate for dually eligible beneficiaries. There are concerns regarding potential trade-offs between cost containment and quality of care, and the potential that dually eligible beneficiaries in the demonstration could be treated differently from other Medicare beneficiaries, particularly with regard to beneficiary choice, protections, and oversight.

States are using so-called “passive” enrollment for the demonstrations, notifying beneficiaries about their pending enrollment in a demonstration health plan but allowing them to opt out at any time (effective monthly) before or after enrollment. Beneficiaries may be passively enrolled in a plan that does not include all of their providers in its network. Therefore, in order to avoid service disruptions for beneficiaries in the demonstrations, it is particularly important that health plans’ provider networks match the needs and service patterns of the population. (Appendix A summarizes differences across the programs in more detail.)

The balance between risks and rewards to consumers and other stakeholders depends on the adequacy of the requirements in the managed care contracts that define the health plan’s responsibilities, the experience and quality of the health plans implementing them, and the effectiveness of shared oversight by the federal government and states. This brief does not examine the capacity of states and the federal government to oversee the demonstrations. However, capacity for demonstration oversight depends on a number of factors, including past experience with similar programs. State background is particularly important because the design of the financial alignment demonstration was structured to encourage states to design and tailor the demonstration to the needs of the state, and states have considerable responsibility (jointly with CMS) for both implementation and overseeing the way they work.14 

How Managed Care Contracts were Developed For The Demonstrations

The managed care models being implemented by states evolved through a multi-step process of negotiation, first between states and the federal government, and later between the federal government, states, and health plans. During the first half of 2012, states submitted proposals to CMS, and many also tentatively selected health plans at around the same time. CMS then negotiated individual memoranda of understanding (MOUs) with states, the first of which was signed with Massachusetts in August 2012. Based on the MOU, the federal government and the state then developed a three-way contract between CMS, the state Medicaid agency, and participating health plans, laying out  details of terms, requirements, and payment rates. The nature of this process influenced the final composition of participating health plans.

The development of these contracts and implementation of the demonstrations required harmonizing Medicare and Medicaid timelines and requirements in areas such as plan selection, provider network adequacy, quality oversight, and appeals processes. Reconciling these requirements contributed to delays and some attrition of participating states and health plans when agreement could not be reached on key terms. Additionally, the initiative generated national controversy about its scale and speed, and consumer advocacy groups and others expressed concern over various aspects of it, both nationally and in individual states.15  The delays allowed for time to address various complexities in demonstration development, but also caused uncertainty among providers, beneficiaries, and stakeholders about what would roll out and when.

In health plan interviews in 2012, plan executives expressed concerns over how well disparate requirements across the programs would be reconciled, and some noted that, although states were negotiating with the federal government, the plans had relatively little information available on key parameters, such as rates.16   Because many critical details important to health plans (such as payment rates and requirements) were not known at the start, some health plans that initially were selected later withdrew in the course of negotiations on the three-way contract.

Although all participating health plans were required to meet both Medicare and Medicaid requirements, the demonstration allows state Medicaid programs to “passively enroll” dually eligible beneficiaries into health plans that cover their Medicare benefits as long as beneficiaries can opt out at any time. Plans under a Medicare enrollment or marketing sanction are not eligible for any demonstration enrollment, and CMS rules prohibit companies with low past performance in Medicare Advantage from receiving passive enrollment in their demonstration health plans.17 

Report: The State Context Of The Demonstrations

Within the 10 states implementing health plan-based demonstrations, there are diverse levels and types of previous experience with relevant managed care and care coordination efforts (such as D-SNPs, capitated MMC for various populations, Medicaid managed long-term services and supports [MLTSS], and other Medicare/Medicaid integration efforts). States’ prior work in these areas can help in assessing state capacity to implement and oversee the demonstration, providing insight into why and how the state is implementing its demonstration, and what experience the health plans, beneficiaries, and providers in the state have regarding relevant capitated programs.

Focus of State Demonstrations

Table 1 summarizes selected characteristics and the current state of health plan-based demonstrations in 10 states — the nine state demonstrations that had three-way contracts for capitated financial alignment demonstrations by December 2014, and one state with an administrative alignment demonstration.18  All of the state demonstrations are focused on adults dually eligible for Medicare and Medicaid (only a very small percentage of dually eligible beneficiaries are children), but some limit eligibility by age or other conditions. Regarding age, Massachusetts’s demonstration includes only dually eligible beneficiaries under age 65 (the state already had an integrated program for dually eligible adults ages 65 and older), whereas both Minnesota’s and South Carolina’s demonstrations include only the elderly (65+). New York and Texas restrict eligibility to a subset of enrollees with specific LTSS requirements or use patterns, which mirror eligibility requirements in their existing related state MLTSS programs (Managed Long Term Care for New York and STAR+PLUS for Texas). Minnesota’s demonstration is unique, in that it aligns specific administrative functions within its existing program for dually eligible beneficiaries ages 65 and older, without financial alignment.

State demonstrations vary in their scope, reflecting in part the differences in the size and diversity of states and existing managed care programs. Whereas only two demonstrations are fully statewide (South Carolina and Minnesota), some other states include large numbers of counties that they tend to group into regions to facilitate management (Illinois, Michigan, Ohio, Virginia). In contrast, California, New York, and Texas are very large and diverse states that have chosen to focus their demonstrations on particular regions (seven counties mainly in southern California, seven counties in and around New York City, and six largely urban counties in Texas). Due to the urban focus of various states, the demonstrations cover many large population centers (such as Los Angeles, Chicago, Boston, Detroit, New York City, Houston, Dallas, and San Antonio). Given that both Medicare Advantage and MMC have higher penetration rates in urban areas,19  it is not surprising that many demonstrations melding the two programs also focus on key urban areas, which also are the areas where beneficiaries, including those dually eligible for Medicare and Medicaid, are more likely to live.

Table 1: Overview of State Dual Eligible Capitated/Administrative Alignment Demonstrations Approved by CMS
Population and AreaTime Line
State

Dually Eligible BeneficiariesTarget Populationa

Geographic Areaa

Memorandum of Understanding Dateb

Initial Enrollment Dateb

CAAdults7 counties3/20134/2014
ILAdults21 counties grouped into 2 regions2/20133/2014
MAAdults under 658 full and 1 partial counties8/201210/2013
MIAdults25 counties grouped into 4 regions4/20143/2015
MNcAdults 65+ enrolled in the Minnesota Senior Health Options programStatewide10/20139/2013
NYAdults who require particular types of LTSSd8 counties8/20131/2015
OHAdults29 counties grouped into 7 regions12/20125/2014
SCAdults 65+ who live in the community at the time of enrollmentStatewide10/20132/2015
TXAdults who qualify for Supplemental Security Income (SSI) or Medicaid waiver HCBS6 counties5/20143/2015
VAAdults104 localities grouped into 5 regions5/20134/2014
SOURCES:a Musumeci M, “Financial and Administrative Alignment Demonstrations for Dual Eligible Beneficiaries Compared: States with Memoranda of Understanding Approved by CMS,” Washington, DC: Henry J. Kaiser Family Foundation, July 2014. https://www.kff.org/medicaid/issue-brief/financial-alignment-demonstrations-for-dual-eligible-beneficiaries-compared/. See Appendix of Musumeci, 2014 for subpopulations excluded from each state’s demonstration.b Demonstration time lines from CMS financial alignment demonstration websites; Michigan updated time line from “Michigan Announces Implementation Timeline Change for MI Health Link.” November 2014. http://www.michigan.gov/mdch/0,4612,7-132-63157_64754-342151–,00.html; California updated geography from calduals.org, “Alameda and Orange County Updates.” November 14, 2014. http://www.calduals.org/2014/11/14/alameda-orange-county-updates/.NOTES: Washington state is excluded from the table because the state decided (in February 2015), not to pursue its previously planned capitated financial alignment demonstration due to health plan withdrawal. It has had a managed fee-for-service (MFFS) demonstration since 2013. Colorado also has a managed fee-for-service (MFFS) demonstration.c Minnesota’s demonstration is administrative only, with no financial alignment. Existing plans’ contracts were amended to include the terms of the demonstration.d New York is including adult dually eligible beneficiaries who receive facility-based LTSS, who are eligible for a Nursing Home Transition & Diversion home and community-based waiver services, or require more than 120 days of community-based LTSS.

Of the states with capitated financial alignment demonstrations, five had enrollment in 2014 (California, Illinois, Massachusetts, Ohio, and Virginia). However, enrollment has been slow to build relative to initial targets; only two states with capitated financial alignment demonstrations (Illinois and Ohio) had about 50 percent or more of their target population enrolled by March 2015 (see Table 2). In part, low enrollment reflects delays in the start of passive enrollment and, in some states (such as California), it reflects significant percentages of eligible beneficiaries opting out of enrollment.20  Four states with capitated financial alignment demonstrations (New York, Michigan, South Carolina, and Texas) began voluntary enrollment in early 2015.

The 10th state (Minnesota) is in a unique situation because it is building on its existing integration efforts through an administrative alignment demonstration. The demonstration integrates administration, oversight, and other features of its existing program involving separate Medicaid and D-SNP contracts for health plans (such as streamlining appeals and grievances, establishing state roles in oversight of the D-SNPs, and establishing processes for coordination of integrated member materials). Existing contracts in Minnesota’s integration program for dually eligible beneficiaries were modified to include the terms of the administrative alignment demonstration. Health plans continue to be paid separately by Medicare and Medicaid on a capitated basis, with no opportunity for the state and federal governments to share in savings (as there is in the capitated financial alignment demonstrations).21 

Table 2: Number of Dually Eligible Beneficiaries and Capitated/Administrative Demonstration Enrollment, by State
StateTotal (2010)a, dEstimated Eligible forDemonstrationbEnrolled in Demonstration(as of March 2015)c, ePercentage of EstimatedEligible Who Are Enrolled(as of March 2015)
CA1,253,000456,000133,40729%
IL346,000135,82563,57547%
MA249,00090,24017,75120%
MI287,000100,00000%
MN138,00036,00036,487f100%
NY796,000170,0006660%
OH332,000115,00066,82658%
SC152,00053,6001,5023%
TX654,000168,000350%
VA182,00078,60027,02934%
SOURCES:a Table 7 of MedPAC [Medicare Payment Advisory Commission] and MACPAC [Medicaid and CHIP Payment Access Commission], “Data Book: Beneficiaries Dually Eligible for Medicare and Medicaid,” January 2015. http://www.medpac.gov/documents/data-book/january-2015-medpac-and-macpac-data-book-beneficiaries-dually-eligible-for-medicare-and-medicaid.pdf?sfvrsn=2b Musumeci M, “Financial and Administrative Alignment Demonstrations for Dual Eligible Beneficiaries Compared: States with Memoranda of Understanding Approved by CMS,” Washington DC: Henry J. Kaiser Family Foundation, July 2014.c CMS Medicare Advantage Monthly Enrollment data, March 2015 (Monthly Enrollment by Plan for financial alignment demonstration states and SNP Comprehensive Report for Minnesota).NOTES:d Dually eligible beneficiaries receiving full or partial Medicaid benefits.e Monthly Medicare Advantage enrollment reports do not include data from plans that have fewer than 10 enrollees.f Minnesota’s demonstration is administrative only, with no financial alignment. Existing plans’ contracts were amendedto include the terms of the demonstration; thus, all beneficiaries in the existing FIDE SNPs are in the demonstration.

Previous Managed Care and Dual Eligible Experience in Demonstration States

Existing work highlights the generally limited experience nationally with managing care for dual eligible populations, and the limitations of statistics available to measure this background.22  In Table 3, we summarize available statistics on Medicare Advantage and MMC enrollment, both overall and for those dually eligible, by state.

Whereas most demonstration states have had considerable enrollment in Medicare Advantage and MMC in general, their experience varies, especially regarding dually eligible beneficiary enrollment in each program. Five of the demonstration states have had some dually eligible beneficiaries in capitated MMC that integrated Medicare and Medicaid services (California, Massachusetts, Minnesota, New York, and Texas), whereas five other states do not have this experience (Illinois, Michigan, Ohio, South Carolina, and Virginia). In Table 3, states are grouped according to whether they have previously enrolled dually eligible beneficiaries in capitated MMC. This particular grouping of states also is useful for examining other differences among these states and how they have implemented their demonstrations.

Among the five states with prior enrollment of dually eligible beneficiaries in capitated MMC, four had existing FIDE SNPs (California, Massachusetts, Minnesota, and New York).23  Two of these states (California and New York) have only limited FIDE SNP enrollment, though they also have other relevant in-state experience (to be discussed below). Additionally, Texas has a large managed care program with contractors that have both MMC and D-SNP plans, and coordinate between them. Importantly, this experience with dually eligible beneficiaries and integration impacts the landscape of health plans in a state. An earlier analysis found that, in 2010, these five states each had multiple companies within them that both offered D-SNP plans and had dually eligible beneficiaries in their MMC plans.24 

The other five demonstration states have had no prior enrollment of dually eligible beneficiaries in capitated MMC (Illinois, Michigan, Ohio, South Carolina, and Virginia). As discussed below, other indicators also indicate that most of these states had less demonstration-relevant experience, such as low D-SNP enrollment. Further, in an analysis of health plan experience in 2010, no companies in these states offered both MMC and Medicare Advantage health plans.25  However, some companies (including some of those operating demonstration health plans) have more recently entered both the Medicare and Medicaid markets in these states.

Relevant prior experience within all of these states is discussed in further detail below.

Table 3: Prior Enrollment in Medicare Advantage and Comprehensive Risk-Based Medicaid Managed Care, by State
 Enrollment of Medicare Enrollees in Medicare AdvantageEnrollment of Medicaid Enrollees in Comprehensive Risk-Based Medicaid Managed Care (2011)
 MA Penetration Rate (2004)aMA Penetration Rate (2014)aPercentage of Dually Eligible Beneficiaries in D-SNPs (2014)bPercentage of all Medicaid EnrolleescPercentage of Blind/Disabled Medicaid EnrolleesdPercentage of Dual Eligible Enrolleesc
National12%30%16%51%41%13%
States in which there is experience with dually eligible beneficiaries in Medicaid managed care
CA31%38%19%60%52%23%
MA16%20%12%33%42%6%
MN13%51%30%66%15%41%
NY17%35%22%76%66%1%
TX6%29%19%47%40%22%
States in which there is no prior experience with dually eligible beneficiaries in Medicaid managed care
IL4%16%1%8%12%0%
MI1%30%8%67%81%0%
OH12%38%5%75%63%0%
SC0%22%13%50%52%0%
VA1%15%1%58%63%0%
SOURCES:a Henry J. Kaiser Family Foundation, State Health Facts data. “Medicare Advantage Enrollees as a Percent of Total Medicare Population.” https://www.kff.org/medicare/state-indicator/enrollees-as-a-of-total-medicare-population/b Gold M, Jacobson G, Damico A, and Neuman T, “Medicare Advantage 2014 Spotlight: Enrollment Market Update.” Washington DC: Henry J. Kaiser Family Foundation, May 2014. https://www.kff.org/medicare/issue-brief/medicare-advantage-2014-spotlight-enrollment-market-update/c CMS. “2011 Medicaid Managed Care Enrollment Report: Summary Statistics as of July 1, 2011.” Includes managed care organization (MCO) and health information organization (HIO) enrollment.d Based on analysis by MACPAC of CMS Medicaid Statistical Information System (MSIS) data. Includes Medicaid enrollees who were blind or disabled, eligible for Medicaid only (not Medicare), and enrolled in an HMO for at least one month in 2011. These rates use a different methodology from the other columns in this table. Communication with MACPAC and analysis are on file with the authors.NOTES: All states except Illinois and Minnesota also had small numbers of dually eligible beneficiaries enrolled in PACE, up to 1% of dually eligible beneficiaries.Figures in bold reflect state penetration rates that are particularly low (5% or less for D-SNP or dual eligible enrollment and 10% or less for other penetration rates). Since the most recent 2011 data on MMC penetration, some states have had changes in their Medicaid programs that impact the data. For example, Illinois expanded its Integrated Care Program for aged, blind, and disabled Medicaid enrollees, and is transitioning other Medicaid enrollees to managed care. South Carolina transitioned more of its Medicaid program to MCOs (see South Carolina, “Managed Care Organizational Changes. Explanation of the Organizational Changes,” https://www.scdhhs.gov/press-release/managed-care-organizational-changes-explanation-organizational-changes). Additionally, Michigan began to enroll dually eligible beneficiaries in its capitated Medicaid managed care plans.

Medicare Advantage Experience

Demonstration states vary widely regarding the extent to which Medicare beneficiaries had participated in Medicare Advantage (see Table 3). Medicare Advantage penetration rates in 2014 varied from a low of 15 percent (Virginia) and 16 percent (Illinois) to a high of 51 percent (Minnesota) and 38 percent (California). It is difficult to assess Medicare Advantage penetration among people dually eligible for Medicare and Medicaid, as CMS does not provide data on enrollment among such beneficiaries in Medicare Advantage, either by health plan or state (though national Medicare Advantage penetration rates are lower among dually eligible beneficiaries than among those eligible for Medicare only).26  However, CMS does provide data on enrollment in D-SNPs, a Medicare Advantage program that has specific requirements oriented toward the needs of the dually eligible population. Nationwide, about 16 percent of dually eligible beneficiaries are enrolled in D-SNPs. State D-SNP enrollment signals health plan interest in dual eligible-focused product lines, state past work in contracting with Medicare plans and prior interest in developing integrated programs, and provider and beneficiary experience with managed care, all of which are highly relevant to understanding the demonstration-related background.

The five demonstration states with no previous enrollment of dually eligible beneficiaries in MMC also generally had lower D-SNP enrollment — especially Illinois, Ohio, and Virginia, which had 5 percent or fewer dually eligible beneficiaries enrolled in D-SNPs. Additionally, four of these five states (Illinois, Michigan, South Carolina, and Virginia) had very limited Medicare Advantage enrollments in 2004. This is important, because research generally shows that health plans more mature in their experience with Medicare Advantage tend to score higher on some quality metrics than newer health plans.27  Among the demonstration states, Illinois and Virginia stand out as having had particularly limited Medicare Advantage and D-SNP penetration. Among the states with previous enrollment of people dually eligible for Medicare and Medicaid in capitated MMC, all except Massachusetts had penetration rates near or above the national average for both Medicare Advantage and D-SNPs. California, Minnesota, and New York each have particularly high levels of enrollment in both Medicare Advantage and D-SNPs.

Medicaid Managed Care Experience

Not surprisingly, because of the state-based nature of the demonstrations, most states pursuing capitated models rely heavily on capitated managed care in their Medicaid program (9 of the 10 had managed care penetration rates of about 50% or more). Table 3 summarizes enrollment in comprehensive risk-based MMC by state, for all Medicaid enrollees, those with disabilities, and dually eligible beneficiaries. While capitated Medicaid managed care penetration rates are generally lower for those with disabilities than for the overall Medicaid population, all demonstration states have enrolled some individuals with disabilities in MMC. Notably, Illinois had particularly limited comprehensive risk-based MMC experience before developing its demonstration — for both Medicaid beneficiaries in general (8%) and those with disabilities (12%). Illinois currently is moving forward rapidly with implementing comprehensive risk-based managed care in Medicaid.

Previous enrollment of dually eligible beneficiaries in capitated MMC has been more limited in some of the demonstration states, and absent in half of them. Among participating states, Minnesota, California, and Texas have the most extensive enrollment, with penetration rates of 41 percent, 23 percent, and 22 percent, respectively; Massachusetts also has some enrollment of dually eligible beneficiaries ages 65 and over in parts of the state (6% penetration);28  and New York has a small program (with 1% penetration). Other states had no dually eligible beneficiaries enrolled in capitated MMC (Illinois, Michigan, Ohio, South Carolina, and Virginia). MMC enrollment of dually eligible beneficiaries means different things in different states. In some states, dually eligible beneficiaries are enrolled in Medicaid health plans to receive Medicaid benefits only. However, in other states, some integration of Medicare and Medicaid benefits occurred even before the demonstrations, as discussed next.

Experience with Specific Relevant Integration Programs

Given the focus of the demonstrations, experience with programs that integrate Medicare and Medicaid benefits and programs that manage long-term services and supports for those in Medicaid are particularly relevant. LTSS are the main services covered by Medicaid for dually eligible beneficiaries and are covered (to varying extents) under all states’ demonstrations. Historically, states’ experience in managing Medicaid LTSS under capitated managed care has been limited. However, more states have been implementing capitated MLTSS in Medicaid recently, though such programs can be challenging to implement and monitor.29  In Table 4, we summarize demonstration states’ existing programs to integrate care for dually eligible beneficiaries and/or provide LTSS under MMC plans; like Table 3, this table groups states according to their previous experience with enrolling dually eligible beneficiaries in capitated MMC.

States that had previous enrollment of dually eligible beneficiaries in capitated MMC also had at least some integration of care for them. Additionally, almost all demonstration states (except Illinois and Minnesota) had some enrollment in Program of All-inclusive Care for the Elderly (PACE).30  However, PACE enrollment was low in each state (no more than 1% of dually eligible beneficiaries). Aside from PACE, five of the demonstration states had pre-demonstration programs that integrated Medicare and Medicaid benefits for those dually eligible for both programs – some of them with full integration and others with some coordination between MMC plans and D-SNPs.

Table 4: State Experience with Integrating Medicare/Medicaid, Medicaid Managed Long-Term Services and Supports (MLTSS), and Demonstration Contracting, by State
Other Pre-Demonstration Program
 PACEaProgram NameIntegration of Medicare and MedicaidbMLTSSEnrollment (2012)cDemonstration limited to health plans in existing state program?
States in which there is experience with dually eligible beneficiaries in Medicaid managed care
CAdYesSCAN Connections at HomeFull integrationYes2,304Yes. Limited to Medicaid plans with contract in county (with exception of L.A. County).
CalOptima and Health Plan of San MateoeMedicaid contractors have D-SNPs and coordinateYes21,702
MAYesSenior Care Options (SCO)Full integrationYes21,785No requirement. However, all current participating plans are also in SCO.
MNNoMN Senior Care Plus (MSC+)Medicare not included, but Medicaid contractors expected to coordinate; all MSC+ plans participate in MSHOYes11,995Yes. Amended MSHO contracts to include terms of administrative demonstration.
MN Senior Health Options (MSHO)Full integrationYes36,128
NYYesMedicaid Advantage (MA) and Medicaid Advantage Plus (MAP)Full integrationIn MAP only9,203 (MA)2,956 (MAP)Plans were required to be approved as MLTC plans by 2013. Some plans did not have operational MLTC plans when they applied for demonstration.
Managed Long Term Care (MLTC)Medicare not included, but Medicaid contractors expected to coordinateYes45,417
TXYesSTAR+PLUSMedicaid contractors must have D-SNPs and coordinateYes400,790fYes. Limited to STAR+PLUS plans.
States in which there is no experience with dually eligible beneficiaries in Medicaid managed care
ILNoIntegrated Care Program (ICP)No dually eligible beneficiariesYes36,079No requirement. However, both existing ICP plans are also in the demonstration, and all demonstration plans became part of ICP expansion.
MIYesManaged Specialty Support & Services Program (MSS&S)Dually eligible beneficiaries included, but no integrationYes41,272
OHYes(None)
SCYes(None)
VAYes(None)
SOURCES:Saucier P, Kasten J, Burwell B, and Gold L, “The Growth of Managed Long-Term Services and Supports (MLTSS) Programs: A 2012 Update.” Truven Health Analytics. Prepared for CMS. 2012. http://www.medicaid.gov/medicaid-chip-program-information/by-topics/delivery-systems/downloads/mltssp_white_paper_combined.pdfNational Association of States United on Aging and Disability (NASUAD), “State Medicaid Integration Tracker.” January 1, 2015. http://www.nasuad.org/initiatives/tracking-state-activity/state-medicaid-integration-trackerStates’ MOUs with CMS and state procurement documents.NOTES:a All states with PACE had only small numbers of dually eligible beneficiaries enrolled, up to 1 percent.b Full integration means that contractors receive both Medicaid and Medicare capitation rates, and beneficiaries enroll in the same plan to receive both Medicare and Medicaid benefits (Saucier et al. 2012). The four state programs that fully integrate Medicare/Medicaid all now operate as FIDE SNPs (see “CMS SNP Comprehensive Report”). Other types of integration are as noted in Saucier et al. 2012.c From P. Saucier et al., California CalOptima and HPSM data from “CMS SNP Comprehensive Report,” March 2012. Illinois data as of February 2013, from Integrated Care Program website. https://www2.illinois.gov/HFS/PUBLICINVOLVEMENT/INTEGRATEDCAREPROGRAM/Pages/default.asp; New York MA and MAP data from New York’s “Medicaid Managed Care Enrollment Reports,” December 2012. https://www.health.ny.gov/health_care/managed_care/reports/enrollment/monthly/d California also is rolling out MLTSS within its Medicaid plans, concurrent with the financial alignment demonstration. See “DHCS Updates the CCI’s Timeline.” March 2014. http://www.calduals.org/2014/03/25/dhcs-updates-the-ccis-timeline/e The six County Organized Health System (COHS) plans in California manage custodial care in nursing facilities (described on page 56 of California’s demonstration proposal). Two of them, CalOptima and Health Plan of San Mateo, also have long-term experience with both MMC plans and D-SNPs; in 2006, they both had passive enrollment of dually eligible beneficiaries into their D-SNP product lines from their MMC plans. Enrollment numbers in the table reflect total D-SNP enrollment for these two plans in March 2014.f About 214,000 of STAR+PLUS enrollees were fully dually eligible, and about 43,000 of them also were enrolled in a SNP. Of the 43,000, about 17,000 were enrolled in the same health plan for both Medicaid and SNP (Texas Application for the Dual Eligibles Integrated Care Demonstration Project, 2012. http://www.cms.gov/Medicare-Medicaid-Coordination/Medicare-and-Medicaid-Coordination/Medicare-Medicaid-Coordination-Office/FinancialAlignmentInitiative/Downloads/TXProposal.pdf)
States with Full Integration Programs

Four demonstration states had programs that included full integration and MLTSS before launching their demonstrations (California, Massachusetts, Minnesota, and New York). Full integration contractors receive both Medicaid and Medicare capitation rates, and beneficiaries enroll in the same plan to receive both Medicare and Medicaid benefits.31  These four states represent four of the five states nationwide that had programs with both MLTSS and full integration as of 2012.32  While these four states have more experience in care integration than most other states nationwide, the scope of their programs and size of enrollment differs, with Massachusetts and Minnesota having substantially larger integrated programs than California and New York.

  • Massachusetts’s longstanding program, Senior Care Options, enrolls Medicaid beneficiaries ages 65 and older, including dually eligible beneficiaries. (The state’s demonstration focuses on adults under age 65, who may have different service needs, such as greater needs for behavioral health care).
  • Minnesota’s fully integrated program (Minnesota Senior Health Options) has essentially been converted into the state’s administrative alignment demonstration.
  • New York had small programs for integrating care for dually eligible beneficiaries (Medicaid Advantage and Medicaid Advantage Plus) and a larger program for Medicaid MLTSS (Managed Long Term Care), which it has been expanding.
  • California has SCAN Connections at Home, which originated as a social HMO but later became a FIDE SNP that operates through a single health plan (SCAN) in a limited geographic area.33  California is not employing the Medicare Advantage model used by SCAN in the demonstration or including SCAN as a demonstration health plan. Instead, it is building on its large MMC program by contracting with its existing Medicaid health plans, which served dually eligible beneficiaries before the demonstration. Concurrent with its demonstration roll-out, California also is placing MLTSS services under its Medicaid health plans.
States with Other Integration Programs

A few additional demonstration states had programs that partially integrated care for dually eligible beneficiaries by having the same contractors for both Medicaid and D-SNP, and coordination between the two. In the Texas STAR+PLUS program, health plans are required to have both MMC and D-SNP contracts in the most populous counties in their service areas, and to coordinate between the two. In California Medicaid’s County Organized Health Systems (COHS), MMC contractors cover nursing facility services, and two of the COHS plans have D-SNP experience dating back to 2006. These two plans (CalOptima and Health Plan of San Mateo) have coordinated MMC and D-SNP services for many enrollees, especially since their MMC enrollees were passively enrolled into their D-SNPs in 2006 (and therefore they had many of the same beneficiaries enrolled in both their Medicaid and D-SNP plans). CalOptima and Health Plan of San Mateo are both participating in California’s demonstration, although CalOptima’s demonstration plan enrollment has been delayed until later in 2015.

Other Demonstration States

All five of the states with no previous enrollment of dually eligible beneficiaries in capitated MMC were less advanced in their efforts to integrate care and/or manage LTSS – both key components of the demonstrations. The Illinois Integrated Care Program for Medicaid-only enrollees who are elderly, blind, or disabled began including MLTSS in 2013. Michigan Medicaid has a program with MLTSS for those with developmental and intellectual disabilities and serious mental illnesses, but it does not integrate care for enrollees who are also eligible for Medicare. The remaining three states had no prior integrated programs for dually eligible beneficiaries and no MLTSS (Ohio, South Carolina, and Virginia). However, some states (such as Illinois and South Carolina) are also implementing other, broader shifts toward capitated MMC, and the demonstration is providing a vehicle to do so for dually eligible individuals.

Health Plan Selection for Demonstrations

Some states allowed only organizations that already operated particular in-state health plans to participate in the demonstrations, whereas others opened demonstration participation to a much broader set of health plans (see Table 4). Not surprisingly, this distinction largely follows the level of related experience within states and among their health plans.

Most states with existing integration programs and dually eligible beneficiaries in MMC decided to limit demonstrations to health plans with at least some experience in related in-state programs. Four of the demonstration states directly linked their demonstration health plan selection to plans participating in other relevant state Medicaid programs (California, Minnesota, New York, and Texas). Whereas Texas and Minnesota are building from plans already participating in integrated programs (STAR+PLUS and Minnesota Senior Health Options, respectively), California and New York are drawing from health plans under contract with MMC generally. In California, Medicaid generally, and the demonstration specifically, have models that vary by county. One of these models – the two-plan model involving a public and private plan – required adaptation in Los Angeles after one of the two plans (L.A. Care) had low Medicare quality scores, making it ineligible to accept passively enrolled individuals. Thus, three additional plans were added in Los Angeles County: Anthem’s CareMore (a specialized unit with an active D-SNP in the county), Molina (with extensive Medicaid enrollment elsewhere in California and the nation), and Care1st (a provider-led organization with Medicare Advantage plans and a D-SNP in the county, a contract with L.A. Care, and a Medicaid plan in neighboring San Diego county).34  In New York, the demonstration was limited to plans that were certified for the state’s Managed Long Term Care program, though some demonstration health plans did not yet have operational MLTC plans when they applied for the demonstration in 2013.

In contrast, other states had procurements that allowed health plans with varying backgrounds to apply for the demonstrations. These states generally asked those health plans applying about their relevant experience (such as with Medicare, Medicaid, and dually eligible beneficiaries), and in some cases set some broad thresholds (for example, Ohio required that plans have an existing Medicare Advantage contract somewhere in the country). However, the states with broader procurements did not limit demonstration participation to particular existing in-state Medicaid health plans. In some cases, these states nonetheless are working with health plans that have previous in-state enrollment in Medicare, Medicaid, or MLTSS programs—even though a state had not set such enrollment as a threshold. The similar past experience of these health plans may have made states view them more favorably or the plans themselves may have been more interested than other plans in participating in the demonstration.

Report: Health Plan Background And Experience

Whereas the states and CMS structure the policies, procedures, and monitoring of the Initiative, much of the day-to-day work ultimately depends on health plan actions and competency (for example, via provider network development and the manner in which they promote quality and coordinate care). Because the demonstration health plans are melding the detailed requirements of both Medicare and Medicaid, and addressing the complex needs of dually eligible beneficiaries, their past experience is important, both in considering their regulatory experience and their familiarity with serving dually eligible beneficiaries.

Our analysis of health plans focuses on those in the five states that had enrolled beneficiaries in capitated financial alignment demonstrations by December 2014 (California, Illinois, Massachusetts, Ohio, and Virginia). A total of 29 health plans from 24 firms are participating in the demonstrations in those states; details on their prior experience and the quality ratings of plans operated by the same organizations are discussed in this section. Although additional states are opening enrollment in 2015, their health plans are not included here in detail, as the set of participating health plans may evolve during the launch of the demonstration (as it has in some other states). Brief information on health plans in these states also is provided in this section. Health plans in Minnesota’s administrative alignment demonstration also are not reviewed here in detail, as this demonstration adds only some administrative alignment functions to existing integrated contractors (which all had existing FIDE SNP and Medicaid contracts).

Experience of Participating Health Plans in Demonstration States Operational in 2014

Table 5 summarizes the key characteristics of the 29 health plans participating in the demonstration, including the prior experience they or their affiliated companies (those under the same parent company) have had in serving Medicare, Medicaid, or dual eligible enrollees within the state, as well as Medicare or Medicaid enrollees out of state. A few of the organizations operating demonstration health plans (Centene, Humana, Molina, and Anthem) have plans in more than one of these five states. These four companies accounted for 9 of the 29 plans in the demonstration. Ten of the health plans were local and had no Medicare or Medicaid enrollment out of state. The landscape of health plans varies by state, with Massachusetts and California including many local plans – all of which also have familiarity with dually eligible beneficiaries in MMC – and Illinois, Ohio, and Virginia including mainly national, for-profit plans.

Table 5: Selected Organizational Characteristics and Prior Experience of Capitated Demonstration Health Plans, by State
 Prior Medicare Advantage (MA) Enrollment in State (2014)aPrior Medicaid Managed Care (MMC) Enrollment in StateOut-of-State Experience
StateDemonstration Health Plan (Parent Organization, when Different)aTax StatusaNon-SNP MA EnrollmentDual SNP EnrollmentOther SNP EnrollmentdEnrollment (2012)bDual Eligibles in Medicaid Health Plan (2011)cMAMMC
CAAnthem Blue Cross, including CareMoreFor Profit72,9511,14120,289448,492YesYesYes
CalOptima (Orange County Health Authority)e, fNonprofit016,0140376,053YesNoNo
Care1st Health PlanFor Profit22,58413,545028,625YesYesYes
Community Health GroupNonprofit01,2160122,225YesNoNo
Health NetFor Profit116,47133,2843,972719,907YesYesYes
Health Plan of San MateoNonprofit08,747059,983YesNoNo
IEHP DualChoice (Inland Empire Health Plan)Nonprofit011,5590501,503YesNoNo
L.A. Care (Local Initiative Health Authority for L.A. County)Nonprofit06,9940997,719YesNoNo
Molina Healthcare of CaliforniaFor Profit08,4980201,440YesYesYes
Santa Clara Family Health Plan (Santa Clara County Health Authority)Nonprofit000116,644YesNoNo
ILAetna Better HealthFor Profit42,1440018,000gNoYesYes
BlueCross BlueShield of Illinois (Health Care Service Corp.)Nonprofit5,801000gYesYes
Cigna-HealthSpring CarePlan of IllinoisFor Profit12,2233,38500gYesYes
Health Alliance ConnectFor Profit12,570000gYesNo
Humana Health Plan, Inc.For Profit84,077212800gYesYes
IlliniCare Health (Centene)For Profit00017,800gNoYesYes
Meridian Complete (Caidan Enterprises)For Profit868107,300gNoYesYes
Molina Healthcare of IllinoisFor Profit0000gYesYes
MACommonwealth Care Alliance, Inc.Nonprofit05,35704,236YesNoNo
Fallon Total Care or Fallon HealthfNonprofit13,1923,685014,212YesNoNo
Tufts Health Plan — Network HealthNonprofit105,2151990124,174YesNoNo
OHAetna Better HealthFor Profit156,428000YesYes
Buckeye Health Plan (Centene)For Profit01,2840168,143NoYesYes
CareSourceNonprofit01,0760920,940NoNoYes
Molina Healthcare of OhioFor Profit05170262,932NoYesYes
UnitedHealthcare Community PlanFor Profit75,2678,3064,256122,630NoYesYes
VAAnthem HealthKeepersFor Profit4,1670584220,835NoYesYes
Humana Health Plan, Inc.For Profit120,1841,5297770YesYes
Virginia Premier CompleteCare (Virginia Commonwealth U. Health System Authority)Nonprofit000151,566NoNoNo
SOURCES:a Analysis of CMS Medicare Advantage enrollment and Landscape files, 2014.b CMS. “2012 Medicaid Managed Care Enrollment Report.” http://www.medicaid.gov/medicaid-chip-program-information/by-topics/data-and-systems/medicaid-managed-care/downloads/2012-medicaid-managed-care-enrollment-report.pdfc CMS. “2011 Medicaid Managed Care Enrollment Report.” http://www.medicaid.gov/medicaid-CHIP-Program-Information/By-Topics/Data-and-Systems/Downloads/2011-Medicaid-MC-Enrollment-Report.pdfNOTES: Table includes states with active enrollment in capitated financial alignment demonstrations as of December 2014. All health plan enrollment noted reflects that of in-state health plans operated by the same parent organization as the demonstration health plan. Previous Medicaid MMC enrollment reflects MCO and HIO enrollment only.Numbers in bold reflect the three largest health plans statewide in a given state’s product line (Medicare Advantage, D-SNP, other SNP, or MMC).d “Other SNP” experience reflects chronic condition SNP enrollment. The exceptions: part of Anthem’s (CA) enrollment and all of UnitedHealthcare’s (OH) enrollment is in institutional SNPs.e CalOptima’s D-SNP plan was sanctioned by CMS in January 2014 and CalOptima thus was not eligible for demonstration enrollment. As of November 2014, CalOptima’s D-SNP was again open for enrollment, though enrollment in its demonstration plan will begin no sooner than July 2015. http://www.calduals.org/2014/11/14/alameda-orange-county-updates /f Two health plans also have PACE plans with small numbers of enrollees – Fallon (MA) and CalOptima (CA).g In 2012, Aetna Better Health and IlliniCare were the only contractors for Illinois’s Integrated Care Program (ICP) (for elderly, blind, and disabled Medicaid-only enrollees). In its 2013 and 2014 expansion of ICP, Illinois also contracted with all of the financial alignment demonstration health plans as Medicaid-only plans for ICP. As of October 2014, each of the Illinois demonstration plans also had a few thousand Medicaid enrollees each in ICP. Illinois “Enrollment for Integrated Care Program (ICP).” http://www2.illinois.gov/hfs/PublicInvolvement/cc/Pages/ICPEnrollment.aspx)

Of the two states with previous enrollment of dually eligible beneficiaries in capitated MMC:

  • California is including 10 health plans in its demonstration, with a heavy base of local nonprofit plans, along with some for-profit plans with strong ties to the state. As discussed above, California allowed only its existing Medicaid plans in the demonstration counties to participate; thus, all plans have significant Medicaid enrollment. It is important to note that California previously did not generally include LTSS under its health plans (except in the COHS plans);35  the Medicaid plans’ experience with dually eligible beneficiaries thus was mostly with the minimal other services covered by Medicaid for dually eligible beneficiaries. California is phasing in MLTSS under its Medicaid health plans concurrent with the demonstration. All health plans except for one (Santa Clara Family Health Plan) also have D-SNP enrollment; three also have general Medicare Advantage product lines.
  • Massachusetts’s demonstration includes three local nonprofit plans that all participate in its integrated Senior Care Options (SCO) program. These plans have experience with Medicare/Medicaid integration, though the care needs of those in the demonstration (dually eligible beneficiaries who are under 65 and disabled) differ from the needs of those in SCO (elderly dually eligible beneficiaries). Though Massachusetts initially selected three additional health plans (which do not participate in SCO and are for-profit) for its demonstration, these plans withdrew, mainly citing concerns about the demonstration’s payment rates. This development left the three nonprofit health plans that have more specialized experience with dually eligible beneficiaries.36  One participating firm also has a large Medicare Advantage line.

Of the three states with no previous enrollment of dually eligible beneficiaries in capitated MMC:

  • Illinois’s demonstration includes eight health plans. Most plans in Illinois did not have in-state Medicaid enrollment when they first contracted for the demonstration. In general, the state had very low risk-based MMC penetration. Health plans related to two of the demonstration plans (Aetna and IlliniCare/Centene) were the contractors for the state Medicaid’s ICP, which began in 2011 for Medicaid-only beneficiaries who are elderly or disabled. However, as Illinois moved rapidly toward risk-based MMC and the recently expanded ICP, it contracted with all of its demonstration health plans for this expansion, which began slightly before the demonstration. These plans thus are developing in-state Medicaid experience at the same time as they begin the demonstration. Six of the health plans have at least some in-state Medicare experience, including two plans that are among the largest Medicare plans in the state.
  • Ohio is including five health plans in its demonstration; four of these have a large Medicaid presence in the state as well as D-SNPs. An additional health plan related to one of the state’s largest Medicare plans (Aetna) also is participating, though it does not have any in-state Medicaid enrollment.
  • Virginia’s demonstration includes three health plans, two of which are related to Medicaid plans that are among the largest in the state. One of the plans (Anthem) has a small number of Medicare enrollees in the state, while the other (Virginia Premier) is a local Medicaid plan with no Medicare experience. The third plan (Humana) operates one of Virginia’s largest in-state Medicare plans, though has no previous in-state Medicaid enrollment.

Almost all of the organizations operating health plans across these states have at least some in-state Medicare Advantage enrollment, though not necessarily enrollment in D-SNPs. The few organizations with no in-state Medicare experience are either local, state Medicaid-focused plans (Santa Clara Family Health Plan in California and Virginia Premier in Virginia) or national health plans with Medicare experience in other states (IlliniCare/Centene and Molina in Illinois). About one-third of the organizations have in-state enrollment in both regular Medicare Advantage and D-SNPs. The type of Medicare plans of organizations operating health plans varies by state in some cases; almost all of California’s plans have D-SNPs, whereas plans in Illinois primarily had regular Medicare Advantage. (As shown in Table 3, Illinois has very limited D-SNP enrollment.) A handful of organizations also have some enrollees in other SNP types (for people with chronic conditions or requiring an institutional level of care).

Almost all organizations also have significant in-state Medicaid experience that predated the demonstrations. The main exception is in Illinois – most organizations operating health plans in Illinois did not have such experience when they first contracted with the state. Only two other organizations across the other states had no in-state Medicaid enrollment, though those plans have large in-state Medicare Advantage market shares (Humana has 63% in Virginia and Aetna has 20% in Ohio);37  instead, they are building on significant local experience in Medicare.

Experience of Participating Health Plans in Demonstration States Beginning in 2015

Table 6 displays high-level information on the previous in-state experience of organizations operating health plans expected to be in the demonstration states that begin enrollment in 2015. As discussed above, these health plans are not discussed here in detail, as the specific participating health plans may still change.

In general, these states are contracting with national for-profit plans with the exception of New York, which is including many local nonprofit, provider-based health plans already in its MLTC program. New York and Texas both are building on existing in-state health plans for their demonstrations, but these plans’ backgrounds vary widely. All Texas plans have previous in-state Medicare (including D-SNP) and Medicaid enrollment. However, New York’s plans all have Medicaid experience (some of them only in MLTSS), but about one-third have no prior Medicare experience. Though New York’s plans have specialized experience in MLTSS, and some have it in integrated care (via Medicaid Advantage Plus), the lack of Medicare experience indicates that some will have a steep learning curve in that area. As for other 2015 states, health plans in Michigan and South Carolina have a range of backgrounds, with some lacking previous in-state Medicare and/or Medicaid enrollment (especially in South Carolina).

Table 6: Prior Experience of Capitated Demonstration Health Plans in Demonstration StatesPlanned to Begin Operations in 2015, by State
StateHealth PlansaHealth Plans’ Prior In-State Experienceb
MichiganAmeriHealth, CoventryCares, Fidelis SecureCare, Meridian Health Plan, Midwest Health Plan, Molina, Upper Peninsula Health PlanFive have Medicare and Medicaid experience, one has only Medicare, and one has neither.
New YorkBased on Managed Long Term Care plans:Aetna Better Health of New York, AgeWell, AlphaCare, Amerigroup, Archcare Community Life, Centerlight Healthcare, Centers Plan for Healthy Living, Elderplan, Elderserve Health, Fidelis Care of NY (NYS Catholic Health Plan), GuildNet, Managed Health (HealthFirst), Health Insurance Plan of Greater New York (HIP), Independence Care Systems, Integra, MetroPlus, Montefiore HMO, North Shore-LIJ Health System, Senior Whole Health, VillageCareMAX, VNS Choice, WellcareAll have MLTC experience, and some have other Medicaid experience (including eight that also have Medicaid Advantage Plus plans – see Table 4).Fifteen plans also have Medicare experience and seven plans do not.
South CarolinaAbsolute Total Care (Centene), Advicare, Molina, Select Health of South Carolina (AmeriHealth)One has only Medicaid experience, one has only Medicare, and two have neither.
TexasBased on STAR+PLUS health plans:Amerigroup, Cigna-Healthspring, Molina, Superior (Centene), UnitedHealthcareAll have prior Medicare and Medicaid plans.
SOURCES:a Musumeci M, “Financial and Administrative Alignment Demonstrations for Dual Eligible Beneficiaries Compared: States with Memoranda of Understanding Approved by CMS,” Washington DC: Henry J. Kaiser Family Foundation, July 2014. Update on New York: “FIDA Plans by Region.” https://www.health.ny.gov/health_care/medicaid/redesign/mrt_101.htmb Analysis of CMS Medicare Advantage enrollment and Landscape files, 2014; CMS. 2012 Medicaid Managed Care Enrollment Report. http://www.medicaid.gov/medicaid-chip-program-information/by-topics/data-and-systems/medicaid-managed-care/downloads/2012-medicaid-managed-care-enrollment-report.pdf; state and health plan websites.NOTES: Minnesota’s administrative demonstration, which modified existing contracts with FIDE SNPs in Minnesota Senior Health Options, includes Blue Plus, HealthPartners, Itasca Medical Care, Medica Health Plans, Metropolitan Health Plan, PrimeWest Health, South Country Health Alliance, and UCare Minnesota.

Available Information on Quality Ratings of Participating Health Plans

Given the complex needs of the dual eligible population, it is important to understand what is known about the quality of care provided by health plans participating in the demonstration. Quality ratings of the existing related Medicare and Medicaid plans can give insight into the infrastructure and culture that health plans bring to the demonstrations.

Table 7 summarizes data on available quality ratings for the existing in-state Medicare and Medicaid health plans related to demonstration plans, including both the Medicare Advantage star rating for the plan (general Medicare and D-SNP, when available) and Medicaid plan rankings by the National Committee on Quality Assurance (NCQA). The quality scores range from 1 to 5, with 5 being the highest. Medicare Advantage plans with 4 stars or more qualify for additional bonus payments, and NCQA highlights scores of 4 or 5 as being better across three performance categories.38  Medicare Advantage star ratings are assessed at the contract level, not the health plan level. Thus, unless a company offers only SNPs under its contract, the quality scores will reflect the overall performance of all health plans under a contract, not necessarily the performance of the D-SNP. For this reason, and because the metrics may not account for enrollee characteristics in D-SNPs, many believe that star ratings may unfairly disadvantage D-SNPs.39  It is also important to note that while LTSS are a key part of the demonstrations, the quality measures that states use for LTSS vary greatly and there is no standardized set of measures that allows for comparison in this brief.40 

The data show considerable diversity in scores, both across plans and states. Across the states, Massachusetts’ demonstration plans have consistently high quality scores, with two of the three plans scoring at the top of the ratings in Medicare and Medicaid, and the third, a specialized plan, scoring highly for its D-SNP offering. In contrast, and not surprising given its limited MMC experience, Illinois plans (with one exception) have no available Medicaid quality ratings. Only four of its contracted plans have Medicare quality ratings for in-state plans, including two with a rating for D-SNPs. (The ratings for these plans vary from 3.5 to 4.5.)

In Ohio and Virginia, all of the plans have ratings, but often just for one program (generally because they do not have a plan to be rated). Ohio’s five plans include three with MMC ratings, one of which also has a Medicare rating for D-SNPs, and two with only general Medicare Advantage ratings. Though there is variation by plan and element, these ratings tend to be about average (3 or 3.5), with plans worse on some dimensions (Centene’s Buckeye plan rated 2 on Medicaid prevention, CareSource’s 2.5 on D-SNP) and higher on others (CareSource with a 4 for consumer satisfaction and Molina with a 4 for treatment). In Virginia, two of the three plan ratings were average on two dimensions, but had a 4 for quality of treatment. The third, a Humana plan, did not have a Medicaid plan in the state and had average Medicare ratings (3.5).

Among these states, California stands out because of the relatively large number of plans with low MMC ratings from NCQA. Of the 10 participating plans, 8 had reported scores. Almost all have the lowest rating for consumer satisfaction (1); a few have below average ratings (1 or 2) for prevention or treatment. The D-SNP of the best performing Medicaid plan (CalOptima, a COHS health plan in Orange County) was sanctioned by CMS in January 2014 due to “widespread and systemic failures” that impacted its D-SNP enrollees’ access to care; for this reason, demonstration enrollment in that county has been delayed until at least July 2015.41  However, the D-SNP scores for California plans are better (mostly 3 and 3.5) than their Medicaid scores.

Table 7: Quality Ratings of In-State Health Plans Related to Demonstration Health Plans, by State
 Medicarea, cMedicaid – NCQAb, d
StateDemonstration Health Plan NameMedicare Advantage StarsD-SNP StarsOverall ScoreConsumer SatisfactionPreventionTreatmentNational Rank
CAAnthem Blue Cross, including CareMore4475133106
CalOptima (Orange County Health Authority)N/A3.58215429
Care1st Health Plan3.53.576123102
Community Health GroupN/A3.574222110
Health Net4470122119
Health Plan of San MateoN/A3.5NR
IEHP DualChoice (Inland Empire Health Plan)N/A373132112
L.A. Care (Local Initiative Health Authority for L.A. County)N/A37633399
Molina Healthcare of CaliforniaN/A37713395
Santa Clara Family Health Plan (Santa Clara County Health Authority)N/AN/ANR
ILAetna Better Health4N/ANR
BlueCross BlueShield of Illinois (Health Care Service Corp.)NRN/AN/A
Cigna-HealthSpring CarePlan of Illinois3.53.5N/A
Health Alliance Connect4.5N/AN/A
Humana Health Plan, Inc.44N/A
IlliniCare Health (Centene)N/AN/ANR
Meridian Complete (Caidan Enterprises)NRNR8545510
Molina Healthcare of IllinoisN/AN/AN/A
MACommonwealth Care Alliance, Inc.N/A4.5NR
Fallon Total Care or Fallon Health4.54.5875552
Tufts Health Plan – Network Health4.54.5875551
OHAetna Better Health3.5N/AN/A
Buckeye Health Plan (Centene)N/ANR7732398
CareSourceN/A2.57943366
Molina Healthcare of OhioN/ANR7933482
UnitedHealthcare Community Plan3.53.57833390
VAAnthem HealthKeepers3.5N/A7933473
Humana Health Plan, Inc.3.53.5N/A
Virginia Premier CompleteCare (Virginia Commonwealth U. Health System Authority)N/AN/A7933462
Key: 1 – 2 (Worse); 3 (Average); 4 – 5 (Better)SOURCES:a 2014 Medicare Star Ratings Data.b National Committee on Quality Assurance (NCQA). “Health Insurance Plan Rankings 2014–2015.” http://healthplanrankings.ncqa.org/2014/NOTES: Includes states with active enrollment in capitated financial alignment demonstrations as of December 2014. All health plan experience noted reflects that of in-state health plans operated by the same parent organization as the demonstration health plan.c Medicare Advantage stars: out of 5 stars; 5 = excellent; 4 = above average, 3 = average, 2 = below average, 1 = poor. N/A = organization has no in-state health plan. NR = not rated. For any organization with multiple plan ratings in a state (preferred provider organization (PPO) vs. health maintenance organization (HMO)), HMO ratings are shown, due to HMO similarity to the demonstration health plan product line. In cases in which an organization has more than one star-rated HMO in a state (Anthem in CA and Humana in IL), the rating for the larger plan is shown. For more information on the star rating system, see http://www.cms.gov/Medicare/Provider-Enrollment-and-Certification/CertificationandComplianc/FSQRS.htmld NCQA: 2014—2015. N/A = parent company has no in-state health plan. NR = not ranked. The overall score is out of 100, and the ranking is out of 136 nationally ranked plans. All ranked plans (and IlliniCare) also are NCQA accredited. More information on rankings is available at NCQA, Health Insurance Plan Rankings: Ranking Resources. http://www.ncqa.org/ReportCards/HealthPlans/HealthInsurancePlanRankings.aspxL.A. Care (CA) and CareSource (OH) Medicare plans received a Medicare Low Performing Icon for 2014. CalOptima’s D-SNP was sanctioned by CMS in January 2014.

Conclusion

Our analysis suggests that many of those engaged in the demonstrations (including states, health plans, and providers) will encounter a substantial learning curve. In some states, such as Massachusetts and Minnesota, the demonstrations are building on previous experience fully integrating care for dually eligible beneficiaries. Others (like California, New York, and Texas) have had some previous experience with integrating care, but on a more limited basis.

In all five of the states with prior enrollment of dually eligible beneficiaries in capitated MMC, the demonstrations are contracting with companies that also operate health plans in their existing Medicaid programs that serve dually eligible beneficiaries and/or include MLTSS (see Table 4). This experience is useful, but by itself does not necessarily translate into high-quality care. Our findings show that across and within states, the quality ratings of care in existing Medicare and Medicaid plans vary considerably. For example, health plans participating in the Massachusetts demonstration all score relatively high on available quality metrics, whereas performance is lower and less consistent in California. Additionally, even in some more experienced states, some health plans have considerable gaps in their experience that is relevant to the demonstration. California’s Medicaid health plans generally did not include MLTSS in the past, and many of New York’s demonstration health plans have managed Medicaid MLTSS only and lack experience with managing Medicare, or even acute care services under Medicaid.

The other five states implementing capitated financial alignment demonstrations (Illinois, Michigan, Ohio, South Carolina, and Virginia) have much less experience on which to build. They have no previous enrollment of dually eligible beneficiaries in capitated MMC, and generally also have low D-SNP penetration. Even more so than in experienced states, this means that the complexities of developing provider networks, tailoring care management models for dually eligible beneficiaries, and providing integrated care may be more challenging for these states and their health plans. The three of these states that began demonstrations in 2014 (Illinois, Ohio, and Virginia) have generally contracted with health plans with considerable experience in their state in either Medicare or MMC, but not necessarily both. These states, and some others with less experience, are relying mainly on national companies that may be able to bring their Medicare and/or Medicaid knowledge from other states to bear, even though the specifics of the context and environment may be different.

It remains unclear how the financial alignment demonstration will play out. As indicated above, state and health plan experience with related capitated and/or integrated programs is quite variable. Additionally, though many states were interested initially, fewer are actively pursuing demonstrations now. Also, some health plans have lost interest in the demonstration as its details have emerged. Enrollment in demonstrations has been delayed repeatedly, but enrollment reached about 310,000 across financial alignment demonstration states as of January 2015, and further enrollment is expected in 2015.

All of these facts, as well as the complexity of integration and the care needs of dually eligible beneficiaries, make effective federal oversight of the demonstration, when done in ways that complement state activity, very important in assuring beneficiary protections. Because the goal of the demonstrations is to integrate care across the spectrum of needs covered by Medicare and Medicaid, effective oversight must assess not only how well Medicare and Medicaid each work for enrollees, but how well they work together.  The Financial Alignment Initiative has the potential to provide valuable lessons on these issues.

Appendix

Appendix A: Reconciling Differences Between Medicare and Medicaid Requirements in the Demonstration

Unlike Medicare, which is a national program, MMC programs and requirements differ across states, though they are required to meet minimum federal Medicaid standards. Although in concept, participating demonstration health plans are required to meet both state Medicaid and Medicare requirements for managed care, some of these requirements are inconsistent or lead to duplication; the differences thus needed to be reconciled when creating the demonstrations. To identify and begin to address these inconsistencies, on January 25, 2012, CMS released initial guidance for comparing requirements across the programs; it followed up on March 29, 2012 with additional guidance on Medicare selection criteria.42 

Box 1 summarizes selected areas of inconsistency and how their reconciliation affected the way the demonstration is structured in several key areas, including the following:

  • Plan Choice. The demonstration allows state Medicaid programs to limit the plans that may participate, though Medicare must approve the participants as well. Plans under a Medicare enrollment or marketing sanction are not eligible, and past performance is considered in determining eligibility for passive enrollment.43 
  • Plan Payment. The capitated rates paid to health plans in the demonstration are an integrated Medicare-Medicaid payment that builds on approaches used in each program, but is distinct to the demonstration. Bids and benchmarks, an important feature of Medicare Advantage payments, are not used in the demonstration. Instead, Medicare rates reflect the origins of Medicare enrollees in the program (traditional Medicare, Medicare Advantage) and Medicare’s estimate of their baseline costs. In addition, withholds rather than bonuses are the main vehicle for quality rewards to plans. Using administered pricing and assumptions on savings, demonstration rates reflect historical costs in each program and proportionate allocation of savings between Medicare and Medicaid.44  Demonstration savings assumptions vary by state, based on federal-state negotiations.
  • Enrollment and Time Frame. Under the demonstration, dually eligible beneficiaries may be passively enrolled in a health plan as long as they are allowed to opt out of such enrollment at any time (effective monthly) and the plan meets Medicare and Medicaid performance standards. (In Medicare, all enrollment in Medicare Advantage is completely voluntary.) Time lines for enrollment vary by state and, at least initially, are not closely linked to the Medicare open enrollment time line.
  • Benefits. Participating health plans must meet all Medicare and Medicaid benefit requirements, filing an integrated benefit package for federal approval. Demonstration plans are not allowed to charge premiums or cost sharing for Medicare benefits. Medicare rules for Part D benefits apply, with plans required to have an approved formulary consistent with Part D requirements. Medicaid benefits for aged, blind, and disabled beneficiaries, including LTSS, must be provided.
  • Care Management. The demonstration health plans must have an approved Model of Care, covering topics such as care plans and risk assessments. This requirement is similar to those for Special Needs Plans, but such Models of Care are not required in regular Medicare Advantage. Demonstration plans are also required to have a Medication Therapy Management Program consistent with Medicare Part D.
  • Oversight on Adherence to Program Requirements. Although the intention is that participating plans meet both Medicare and Medicaid requirements in key programmatic areas — including marketing standards and review, network adequacy, fiscal solvency, quality assurance, consumer protection, and administrative and management — the demonstration is structured in ways that seek to avoid duplication of requirements and address inconsistencies on a flexible basis that is reflected in the MOUs and three-way contracts. Reconciling differences in marketing standards and appeals processes so they reflect the characteristics of the population served by the demonstration (low health literacy, disproportionately lower income, and more vulnerable than the average Medicare beneficiary) posed issues of particular concern.45  Joint federal and state contract management teams were created in each demonstration state in order to oversee the health plans. Medicare retains authority for oversight of Part D.

Perhaps recognizing the vulnerability of dually eligible beneficiaries and the scope of many state demonstrations, the initiative also has stronger up-front processes to review the adequacy of health plans before demonstrations go live than Medicare Advantage, in which enrollment generally builds gradually, and on a voluntary basis. This up-front process occurs in the demonstrations through readiness reviews conducted jointly by states and CMS, covering topics such as assessment processes, care coordination, systems, and provider credentialing and networks.46  From a Medicare program perspective, the demonstration allows more flexibility in how Medicare Advantage requirements are interpreted in areas such as marketing materials than does the regular Medicare Advantage program; this helps to facilitate alignment with Medicaid and individual state practices.

In part because of these unique features, and also to facilitate monitoring and reporting, CMS contracts separately for each plan in the demonstration, assigning a separate contract number for the legal entities associated with each demonstration plan – even if the firm already participates in Medicare Advantage. Enrollment is tracked separately and counted as part of the demonstration rather than as part of D-SNP or as a general Medicare Advantage plan.

At least initially, CMS also was flexible in establishing separate time lines for approval of the Medicare component of the demonstration plan. Once health plans are established, however, they are asked to follow time lines more consistent with the overall Medicare Advantage program.47  CMS posts a complete list of plan requirements, and the documents that underlie them, on its website.48 

Appendix Table 1: Selected Differences in Medicare Advantage and Medicaid Managed Care Requirements
Design IssueFederal Medicaid RequirementsMedicare Advantage RequirementsFinancial Alignment Demonstration Design
Plan SelectionStates can limit the number of health plans as long as two choices are offered if there is mandatory enrollment. They also can choose the time frame for selecting new plans.Plans are selected on an annual basis; all that meet specified requirements can participate.A joint federal-state selection process allows limits on the number of qualified plans. However, previous performance in Medicare and Medicaid is considered in approval.
Plan Payment Rates (Capitation)Must meet CMS actuarial soundness standards, but states have flexibility on aspects such as methods and use of risk corridors.Plans submit separate bids for Part C (A and B benefits) and Part D (pharmacy benefits) that are reviewed against federal benchmarks by county, using standardized rules and risk adjustments.Reflects government estimates of baseline spending in both programs and assumptions on anticipated savings, which are shared proportionally across Medicare and Medicaid.
Quality IncentivesAt state option.MA has quality “star” bonuses.No star bonuses but, at state option, plans can earn back withholds if they meet quality objectives. (All states so far have this feature.)
EnrollmentVoluntary or mandatory with CMS approval and at least one opportunity to change annually.Voluntary, with lock-in through the year, but dually eligible beneficiaries can change monthly, with limited exceptions. New dually eligible beneficiaries may be enrolled into zero-premium Part D plans randomly (although they may change plans).CMS, at state request, can approve passive enrollment with advance notice to beneficiary and option for “opt out” at any time (effective the first day of the following month).
Enrollment Effective DateNo federal requirements, so it varies by state. (States with lock-in must allow at least an annual change.)January 1 contract year starts with an open enrollment period from October 15—December 7. Dually eligible beneficiaries can change plans monthly, effective the first of the following month. A Medicare website helps beneficiaries identify the available plans and plan characteristics.The start dates for demonstrations are negotiated individually with each state. As the demonstration goes forward, CMS plans to review existing demonstration plans against Medicare standards annually (effective for the 2015 plan solicitation).
Model of Care RequirementsNone, though state contracts need to address primary care source, coordination, and (for special needs individuals) assessment and treatment.Required of Special Needs Plans (regular Medicare Advantage Plans are required only to coordinate care). Part D plans are required to have medication therapy management programs.Model of care requirements apply. Plans also must have an approved Medication Therapy Management Program consistent with Part D.
Oversight of  Access, Quality, Program Integrity, and Financial SolvencyIndividual states set requirements consistent with minimum federal standards for Medicaid.Medicare Advantage has uniform national requirements and an integrated oversight structure for the program.Oversight is consistent with the MOU but the three-way contract is the explicit statement of requirements that supplants it. The intent is that oversight be at least as rigorous as under Medicare Advantage, Part D, and relevant state programs. Medicare retains authority for oversight of Part D. CMS documents provide that a joint federal-state management team oversee the demonstrations.
SOURCES:Medicare and Medicaid requirements are the authors’ summary of analysis in Appendix 1 of CMS comparison of Medicare and Medicaid requirements (January 25, 2012). The last column reflects how these requirements ultimately were addressed as reflected in the March 29, 2012 CMS memorandum, review of three-way contract requirements, and authors’ knowledge of Medicare Advantage requirements.

Endnotes

  1. Young K, Garfield R, Musumeci M, Clemans-Cope L, and Lawton E, “Medicaid’s Role for Dual-Eligible Beneficiaries.” Washington, DC: Henry J. Kaiser Family Foundation, August 2013. http://modern.kff.org/medicaid/issue-brief/medicaids-role-for-dual-eligible-beneficiaries/; Jacobson G, Neuman P, and Damico A, “Medicare’s Role for Dual Eligible Beneficiaries.” Washington, DC: Henry J. Kaiser Family Foundation, April 2012. http://modern.kff.org/medicare/issue-brief/medicares-role-for-dual-eligible-beneficiaries/ ↩︎
  2. Ibid., and also Neuman P, Lyons B, Rentas J, and Rowland D, “Dx for a Careful Approach to Moving Dual-Eligible Beneficiaries into Managed Care Plans.” Health Affairs, 31, no.6 (2012):1186—1194. ↩︎
  3. Before Medicare was expanded through Part D (Prescription Drugs) in 2006 as a result of the Medicare Modernization Act of 2003, Medicaid also provided primary coverage for most prescription drugs. ↩︎
  4. For more information on Medicare and Medicaid options for dually eligible beneficiaries, see Medicaid and CHIP Payment and Access Commission, “Chapter 3: The Role of Medicare and Medicaid for a Diverse Dual Eligible Population” in Report to Congress, Washington DC: March 2013. http://www.macpac.gov/reports ↩︎
  5. Gold M, Jacobson G, and Garfield R, “There Is Little Experience and Limited Data to Support Policy Making on Integrated Care for Dual Eligibles.” Health Affairs, 31, no.6 (2012):1176—1185. ↩︎
  6. For additional detail on MMC options historically, see Medicaid and CHIP Payment Advisory Commission, “Report to Congress: The Evolution of Managed Care in Medicaid.” Washington DC: June 2011. http://www.macpac.gov/reports ↩︎
  7. For more information on Medicare and Medicaid options for dually eligible beneficiaries, see Medicaid and CHIP Payment and Access Commission, “Chapter 3: The Role of Medicare and Medicaid for a Diverse Dual Eligible Population” in Report to Congress, Washington DC: March 2013. http://www.macpac.gov/reports ↩︎
  8. Historically, health plans participating in Medicare managed care programs had to have a strong commercial presence in the market (the so called “50/50 rule,” initially designed as a quality enhancement feature). Although this requirement has been absent for some time, participants still tend to include firms with substantial commercial enrollment, particularly in group accounts. Medicaid health plans, in contrast, are more likely to specialize in the Medicaid line of business. Typically they have had experience in working with states and negotiating contracts with providers familiar with the usually lower payment rates offered by Medicaid versus Medicare as well as the special challenges of caring for those enrolled in Medicaid. Safety net and other so called “essential providers” tend to be more prominent in Medicaid health plan networks. Even though such differences are eroding over time as more commercial health plans enter the Medicaid market, Medicaid health plans still remain a separate “line of business” in such companies; whereas there may be more cross-fertilization across the different lines of business,  historically this has been limited. ↩︎
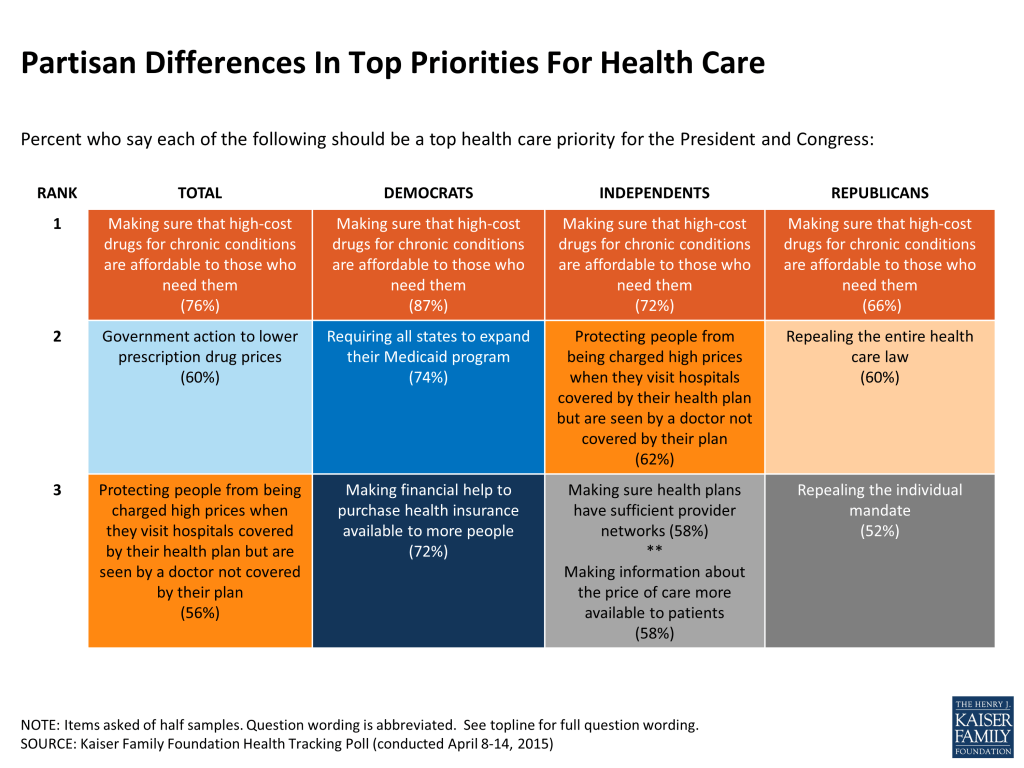
  9. “About the Office of Medicare and Medicaid Coordination.” http://www.cms.gov/Medicare-Medicaid-Coordination/Medicare-and-Medicaid-Coordination/Medicare-Medicaid-Coordination-Office/index.html ↩︎
  10. For additional details on the rationale for this program, see https://www.cms.gov/Medicare-Medicaid-Coordination/Medicare-and-Medicaid-Coordination/Medicare-Medicaid-Coordination-Office/FinancialAlignmentInitiative/FinancialModelstoSupportStatesEffortsinCareCoordination.html ↩︎
  11. CMS, State Medicaid Director Letter #11-008. “Re: Financial Models to Support State Efforts to Integrate Care for Medicare-Medicaid Enrollees.” July 2011.  http://downloads.cms.gov/cmsgov/archived-downloads/SMDL/downloads/financial_models_supporting_integrated_care_smd.pdf ↩︎
  12. For example, see Kaiser Commission on Medicaid and the Uninsured, “Financial Alignment Models for Dual Eligibles: An Update.” November 2011. https://modern.kff.org/health-reform/issue-brief/financial-alignment-models-for-dual-eligibles-an/; Kaiser Commission on Medicaid and the Uninsured. “An Update on CMS’s Capitated Financial Alignment Demonstration Model for Medicare-Medicaid Enrollees.” April 2012. https://modern.kff.org/medicaid/issue-brief/an-update-on-cmss-capitated-financial-alignment/ ↩︎
  13. National Association of States United on Aging and Disability (NASUAD), “State Medicaid Integration Tracker.” January 1, 2015. http://www.nasuad.org/initiatives/tracking-state-activity/state-medicaid-integration-tracker ↩︎
  14. Alternatively, the demonstration could have been based around Medicare Advantage requirements, perhaps building on existing programs for Special Needs Plans serving dually eligible beneficiaries. Both options require that Medicare and Medicaid requirements be aligned. However, the state-based focus gives more attention to state interests in long-term care, which accounts for most state spending for dually eligible beneficiaries. ↩︎
  15. Crowley J, Musumeci M, and Reaves E, “Development of the Financial Alignment Demonstrations for Dual Eligible Beneficiaries: Perspectives from National and State Disability Stakeholders.” Washington DC: Henry J. Kaiser Family Foundation, July 2013. https://modern.kff.org/medicaid/issue-brief/development-of-the-financial-alignment-demonstrations-for-dual-eligible-beneficiaries-perspectives-from-national-and-state-disability-stakeholders/ ↩︎
  16. Gold M, Wang W, and Jacobson G, “Medicare Health Plans and Dually Eligible Beneficiaries: Industry Perspectives on the Current and Future Market.” Washington DC: Henry J. Kaiser Family Foundation, May 2013. https://modern.kff.org/medicare/report/medicare-health-plans-and-dually-eligible-beneficiaries-industry-perspectives-on-the-current-and-future-market/ ↩︎
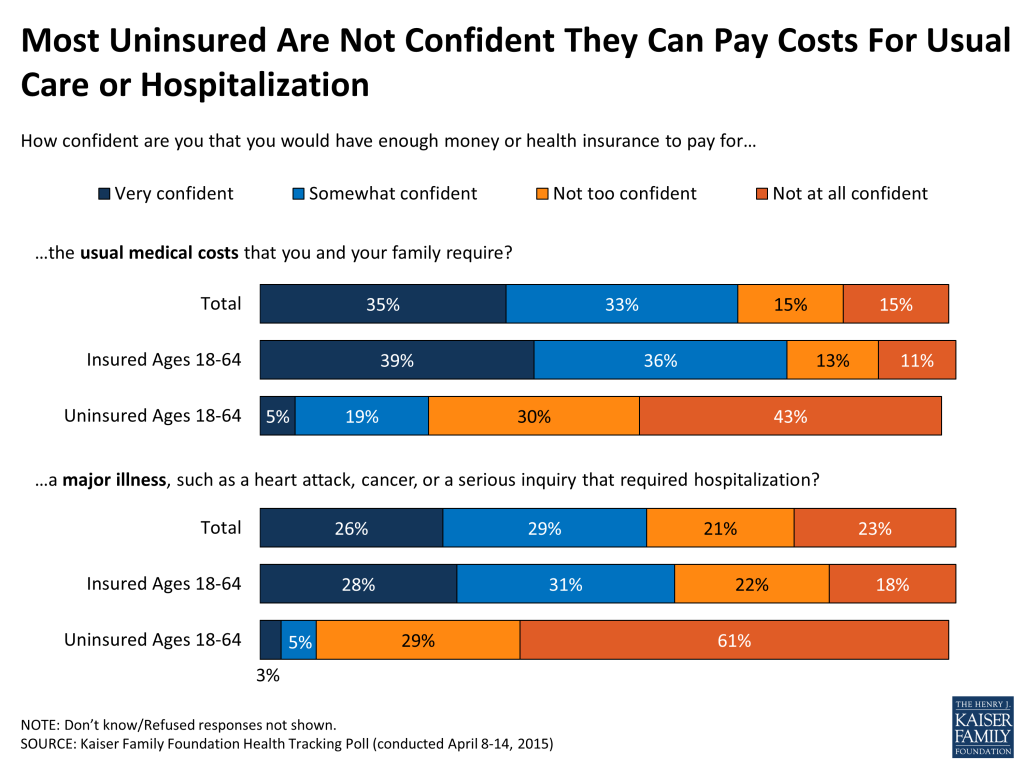
  17. This applies to demonstration plans under the same parent company as those with sanctions or low past performance. See CMS “Additional Guidance on the Medicare Plan Selection Process for Organizations Interested in Offering Capitated Financial Alignment Demonstration Plans in 2013.” March 2012. http://www.cms.gov/Medicare-Medicaid-Coordination/Medicare-and-Medicaid-Coordination/Medicare-Medicaid-Coordination-Office/FinancialAlignmentInitiative/Downloads/MarchGuidanceDocumentforFinancialAlignmentDemo.pdf ↩︎
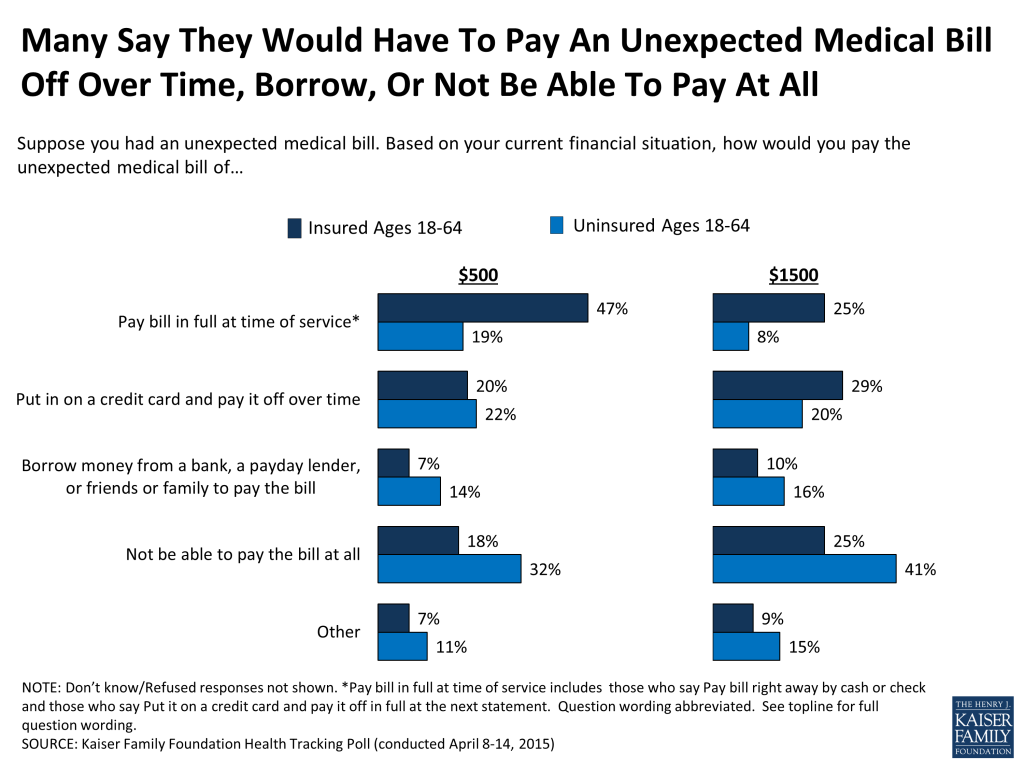
  18. Washington, which has had a managed fee-for-service financial alignment demonstration in most of the state since 2013, also had an MOU with CMS for a capitated financial alignment demonstration in two of its counties. After facing withdrawals by some of its health plans, the state decided in February 2015 not to proceed with a capitated demonstration (See: Washington State Healthcare Authority. “HealthPath Washington Capitated Model Cancelled,” February 2, 2015. http://www.hca.wa.gov/medicaid/Documents/HealthPathWALetter.pdf ). Regarding earlier issues related to Washington’s health plans, see “Regence Faulted for HealthPath Launch Delay,” Business Examiner, September 18, 2014. http://www.businessexaminer.com/blog/September-2014/Regence-faulted-for-HealthPath-launch-delay/ ↩︎
  19. For Medicare, see Gold M, Jacobson G, Damico A, and Neuman T, “Medicare Advantage 2014 Spotlight: Enrollment Market Update.” Washington DC: Henry J. Kaiser Family Foundation, May 2014. https://modern.kff.org/medicare/issue-brief/medicare-advantage-2014-spotlight-enrollment-market-update/; for Medicaid, see Howell E, Palmer A, and Adams F, “Medicaid and CHIP Risk-Based Managed Care in 20 States: Experiences Over the Past Decade and Lessons for the Future,” The Urban Institute, July 2012. http://www.urban.org/UploadedPDF/412617-Medicaid-and-CHIP-Risk-Based-Managed-Care-in-20-States.pdf ↩︎
  20. Gorn D, “What’s Behind High Opt-Out Rate Among Dual Eligibles in L.A. County?” California Healthline, December 4, 2014. http://www.californiahealthline.org/insight/2014/whats-behind-high-optout-rate-among-duals-in-los-angeles-county ↩︎
  21. Minnesota initially submitted a proposal for a capitated financial alignment demonstration. However, it decided not to pursue financial alignment, noting that the demonstration “would result in a significantly lower payment than Minnesota is now receiving for senior Medicare beneficiaries in current programs.” Minnesota Department of Human Services website, Update on Status of the Dual Demo, June 29, 2012. http://www.dhs.mn.gov/main/idcplg?IdcService=GET_DYNAMIC_CONVERSION&dID=141378 ↩︎
  22. Gold M, Jacobson G, and Garfield R, “There Is Little Experience and Limited Data to Support Policy Making on Integrated Care for Dual Eligibles.” Health Affairs, 31, no.6 (2012):1176–1185. ↩︎
  23. The four demonstration states with operating FIDE SNPs represent four of the six states nationwide with such experience as of 2014. (The other two states are Arizona and Wisconsin.) ↩︎
  24. Gold M, et al. 2012. ↩︎
  25. Gold M, et al. 2012. ↩︎
  26. See Exhibit 11 of MedPAC and MACPAC, “Data Book: Beneficiaries Dually Eligible for Medicare and Medicaid.” January 2015. ↩︎
  27. Gold M and Casillas G, “What Do We Know about Health Care Access and Quality in Medicare Advantage Versus the Traditional Medicare Program?”  Washington DC: Kaiser Family Foundation, November 2014. http://files.kff.org/attachment/what-do-we-know-about-health-care-access-and-quality-in-medicare-advantage-versus-the-traditional-medicare-program-report ↩︎
  28. Denominator includes full and partial dually eligible beneficiaries. Gold M, Jacobson G, Damico A, and Neuman T, “Medicare Advantage 2014 Spotlight: Enrollment Market Update.” Washington DC: Henry J. Kaiser Family Foundation, May 2014. https://modern.kff.org/medicare/issue-brief/medicare-advantage-2014-spotlight-enrollment-market-update/ ↩︎
  29. CMS, “Guidance to States Using 1115 Demonstrations or 1915(b) Waivers for Managed Long Term Services and Supports Programs.” May 2013. http://www.medicaid.gov/Medicaid-CHIP-Program-Information/By-Topics/Delivery-Systems/Downloads/1115-and-1915b-MLTSS-guidance.pdf ↩︎
  30. PACE is a fully integrated program that covers all Medicare services and a state’s Medicaid services. It is an option within Medicare in which state Medicaid programs can participate. To be eligible, a beneficiary must live in a PACE plan’s service area, be age 55 or older, require a nursing home level of care, and be able to live safely in the community. ↩︎
  31. Saucier P, Kasten J, Burwell B, and Gold L, “The Growth of Managed Long-Term Services and Supports (MLTSS) Programs: A 2012 Update.” Truven Health Analytics. Prepared for CMS, 2012. http://www.medicaid.gov/medicaid-chip-program-information/by-topics/delivery-systems/downloads/mltssp_white_paper_combined.pdf ↩︎
  32. Saucier P, et al. 2012. ↩︎
  33. For additional information on SCAN, see its application to participate in San Bernadino County under the demonstration. http://www.dhcs.ca.gov/provgovpart/Documents/Duals/RFS%20Applications/SCAN%20San%20bernardino.pdf . ↩︎
  34. California Department of Health Care Services, “Enrollment Strategy for Los Angeles County into Cal Medi-Connect Updated.” February 18, 2014. http://www.calduals.org/wp-content/uploads/2014/02/REVISED-LA-Enrollment-Strategy-2.19.14-2.0.pdf  Additionally, note that Blue Shield of California proposed in December 2014 to acquire Care1st Health Plan. See “Blue Shield of California To Enter Medi-Cal/Medicaid with Acquisition of Care1st.” December 8, 2014. https://www.blueshieldca.com/bsca/about-blue-shield/newsroom/care1st-acquisition-agreement-120814.sp ↩︎
  35. See pages 55—56 of California’s “Proposal to the Center for Medicare and Medicaid Innovation — Coordinated Care Initiative: State Demonstration to Integrate Care for Dual Eligible Beneficiaries.” May 31, 2012. http://www.cms.gov/Medicare-Medicaid-Coordination/Medicare-and-Medicaid-Coordination/Medicare-Medicaid-Coordination-Office/FinancialAlignmentInitiative/Downloads/CAProposal.pdf ↩︎
  36. Gutman J, “Three of Six Selected Plans Drop Out of Mass. Duals Demo After Pay Rates Finalized.” Medicare Advantage News, July 15, 2013. http://aishealth.com/archive/nman072513-01 ↩︎
  37. See appendices of Gold M, Jacobson G, Damico A, and Neuman T, “Medicare Advantage 2014 Spotlight: Enrollment Market Update.” Washington DC: Henry J. Kaiser Family Foundation, May 2014. https://modern.kff.org/medicare/issue-brief/medicare-advantage-2014-spotlight-enrollment-market-update/ ↩︎
  38. 4 and 5 correspond to being in the top one-third or top 10 percent of all health plans evaluated by NCQA. Methodology available at NCQA, “Health Insurance Plan Rankings 2014—2015 Methodology Overview.” July 2014. http://www.ncqa.org/Portals/0/Health%20Plan%20Rankings/2014/HPR2014_RankingsMethodologyOverview_Final_Update_7.30.14%20(1).pdf ↩︎
  39. CMS, “Request for Information – Data on Differences in Medicare Advantage (MA) and Part D Star Rating Quality Measurements for Dual-Eligible versus Non-Dual-Eligible Enrollees.” http://www.cms.gov/Medicare/Prescription-Drug-Coverage/PrescriptionDrugCovGenIn/Downloads/Request-for-Information-About-the-Impact-of-Dual-Eligibles-on-Plan-Performance.pdf; Weiss H, and Pescatello S, “Medicare Advantage: Stars System’s Disproportionate Impact on MA Plans Focusing on Low-Income Populations.” Health Affairs Blog, September 22, 2014. http://healthaffairs.org/blog/2014/09/22/medicare-advantage-stars-systems-disproportionate-impact-on-ma-plans-focusing-on-low-income-populations/ ↩︎
  40. Saucier P, et al. 2012. ↩︎
  41. January 2014 sanction letter: CMS, “Notice of Immediate Imposition of Intermediate Sanctions (Suspension of Enrollment and Marketing) for Medicare Advantage-Prescription Drug Plan Contract Number: Orange County Health Authority (CalOptima) (H5433).” January 24, 2014. http://www.cms.gov/Medicare/Compliance-and-Audits/Part-C-and-Part-D-Compliance-and-Audits/Downloads/CalOptima-Sanction-01-24-14.pdf; Update at calduals.org, “Alameda and Orange County Updates.” November 14, 2014. http://www.calduals.org/2014/11/14/alameda-orange-county-updates/ ↩︎
  42. These and other documents are available at the CMS Financial Alignment Initiative, Information and Guidance for Plans website, http://www.cms.gov/Medicare-Medicaid-Coordination/Medicare-and-Medicaid-Coordination/Medicare-Medicaid-Coordination-Office/FinancialAlignmentInitiative/InformationandGuidanceforPlans.html ↩︎
  43. See CMS, “Additional Guidance on the Medicare Plan Selection Process for Organizations Interested in Offering Capitated Financial Alignment Demonstration Plans in 2013.” March 2012. http://www.cms.gov/Medicare-Medicaid-Coordination/Medicare-and-Medicaid-Coordination/Medicare-Medicaid-Coordination-Office/FinancialAlignmentInitiative/Downloads/MarchGuidanceDocumentforFinancialAlignmentDemo.pdf ↩︎
  44. CMS, “Joint Rate-Setting Process for the Capitated Financial Alignment Model FAQs Updated August 9, 2013.” http://www.cms.gov/Medicare-Medicaid-Coordination/Medicare-and-Medicaid-Coordination/Medicare-Medicaid-Coordination-Office/Downloads/JointRateSettingProcess.pdf ↩︎
  45. For additional details on state programs for appeals and beneficiary protection, see https://modern.kff.org/medicaid/issue-brief/financial-alignment-demonstrations-for-dual-eligible-beneficiaries-compared/ ↩︎
  46. Details on the readiness reviews is available at http://www.cms.gov/Medicare-Medicaid-Coordination/Medicare-and-Medicaid-Coordination/Medicare-Medicaid-Coordination-Office/FinancialAlignmentInitiative/ReadinessReviews.html ↩︎
  47. CMS, “Capitated Financial Alignment Demonstration Medicare-Medicaid Plan Annual Requirements and Timeline for CY 2015.” January 2014. http://www.cms.gov/Medicare-Medicaid-Coordination/Medicare-and-Medicaid-Coordination/Medicare-Medicaid-Coordination-Office/FinancialAlignmentInitiative/Downloads/2015_CurrentMMPAnnualRequirements.pdf ↩︎
  48. Various documents containing CMS guidance for health plans are compiled on the CMS Financial Alignment Initiative, Information and Guidance for Plans website. http://www.cms.gov/Medicare-Medicaid-Coordination/Medicare-and-Medicaid-Coordination/Medicare-Medicaid-Coordination-Office/FinancialAlignmentInitiative/InformationandGuidanceforPlans.html ↩︎
News Release

At Tax Time, No Public Backlash Over Obamacare’s Individual Mandate

Published: Apr 21, 2015

As tax season closes, Drew Altman looks at why the ACA’s individual mandate and tax credit reconciliation process “passed their first major hurdles this tax season with no significant public backlash,” in his latest column for The Wall Street Journal’s Think Tank.

News Release

Americans’ Views on the Affordable Care Act Hold Steady, with 43% Now Viewing It Favorably and 42% Unfavorably

Published: Apr 21, 2015

Few Report Seeing Comparative Information about Health Care Prices and Quality, and Less Than 10% Use It

Pocketbook and Consumer Issues Top Public’s List of Priorities for the President and Congress, Ahead of Several ACA-Related Issues

This month’s Kaiser Health Tracking Poll finds public opinion on the health care law holding steady and closely divided. The share expressing a favorable view (43%) exceeds the share with an unfavorable view (42%) for the first time since November 2012, albeit by one percentage point, but the difference is within the survey’s margin of sampling error and is not statistically significant.

As in the past, this poll finds sharp partisan divisions, with most Democrats viewing the law favorably (70%), most Republicans viewing it unfavorably (75%), and independents in between (42% favorable, 46% unfavorable).

April_Poll_Chart_1_-_New

The poll also finds that, more than a year after the law’s major coverage provisions took effect, most Americans (56%) say it has had no direct impact on their families, with similar shares saying the law has helped (19%) or hurt (22%) them. These results are similar to last month but reflect a narrower gap than recorded in earlier polling.

This month’s poll asked about the availability and use of price and quality information when choosing health care providers.

Only a small share of the public say they have seen quality information about health insurance plans (15%), hospitals (13%) or doctors (10%) in the past 12 months — and even fewer report using that information (6% for plans, 4% for hospitals and 6% for doctors). Similarly, relatively few people report seeing and using price comparisons involving plans (18% saw, 9% used), hospitals (6% saw, 2% used) and doctors (6% saw, 3% used).

Five years after the ACA’s enactment, this month’s poll also probes the public’s health care priorities for the President and Congress going forward. Price and consumer issues topped the list ahead of several questions related to the ACA.

The public’s top health care priority overall (and across party lines) is making sure that high-cost drugs for chronic conditions, such as HIV, hepatitis, mental illness and cancer, are affordable to those who need them.  Three-quarters of the public (76%) say this is a “top priority,” including strong majorities of Democrats (87%), Republicans (66%) and independents (72%).

Majorities also identify a number of other price and consumer-related “top priorities” for the President and Congress ahead of several questions related to the ACA.  These top priorities include provider network protections and increased transparency related to the prices and quality of health care. Actions related to the ACA that Democrats or Republicans might favor such as expanding financial assistance to help people buy insurance or eliminating ACA mandates rank further down the public’s priority list.

There are, however, partisan differences in priorities, particularly around the ACA. Two items that build on the ACA rank as the second and third priorities for Democrats – requiring all states to expand their Medicaid programs (74%) and changing eligibility rules so more people are able to get financial help to purchase health insurance (72%). In contrast, the second and third ranked priorities for Republicans would reverse all or part of the ACA by repealing the entire law (60%) and repealing the individual mandate (52%). For independents, changes like provider network protections and price transparency rank second and third.

April_Poll_-_Chart_2_-_New

When asked directly about what Congress should do about the ACA, the public remains divided, largely driven by partisan divisions. Just under half want Congress to either expand what the law does (24%) or continue implementing it as is (22%), while about four in 10 want to see Congress either scale back the law (12%) or repeal it entirely (29%). These shares have remained relatively constant for nearly six months.

The latest tracking poll was designed and analyzed by public opinion researchers at the Kaiser Family Foundation and was conducted from April 8-14 among a nationally representative random digit dial telephone sample of 1,506 adults. Interviews were conducted in English and Spanish by landline (601) and cell phone (905). The margin of sampling error is plus or minus 3 percentage points for the full sample. For results based on other subgroups, the margin of sampling error may be higher.

Poll Finding

Kaiser Health Tracking Poll: April 2015

Authors: Bianca DiJulio, Jamie Firth, and Mollyann Brodie
Published: Apr 21, 2015

Kaiser Health Tracking Poll: April 2015

This month’s Kaiser Health Tracking Poll finds public opinion of the Affordable Care Act (ACA) continues to be almost evenly split, with 43 percent reporting a favorable view and 42 percent reporting an unfavorable view. The share with a favorable view exceeds the share with an unfavorable view for the first time since November 2012, albeit by one percentage point, and the difference is within the survey’s margin of sampling error and is not statistically significant.  When asked about health care priorities for the President and Congress, the change that comes out on top for Democrats, Republicans and independents alike is making sure that high-cost drugs for chronic conditions, such as HIV, hepatitis, mental illness and cancer, are affordable to those who need them, with three-quarters of the public (76 percent) saying this should be a top priority.  Sixty percent say that government action to lower prescription drug prices should be a top priority and majorities say things like provider network protections and increased transparency related to the prices and quality of health care should be top priorities. Other than high-cost prescription drugs, Democrats, Republicans and independents have different ideas of their top priorities in health care. In terms of the availability of price and quality information, fewer than 1 in 5 say they have seen any information comparing the quality or prices for hospitals, doctors, or health insurers in the past 12 months, and fewer than 1 in 10 report using these types of information.

The Public’s Views Of The ACA

Closely Divided On The Health Care Law

This month’s Kaiser Health Tracking Poll finds American’s opinion of the health care law closely divided, 43 percent say they have a favorable view of the law and 42 percent say they have an unfavorable view. Last month, opinion narrowed to the closest margin in over two years (41 percent favorable and 43 percent unfavorable), and now appears to be holding steady. This month, the share with a favorable view exceeds the share with an unfavorable view for the first time since November 2012, albeit by one percentage point, and the difference is within the survey’s margin of sampling error and is not statistically significant.

Figure 1

The public continues to view the law through a partisan lens, a dynamic that has persisted since the passage of the law in 2010. Most Democrats (70 percent) express a favorable view of the law, while most Republicans (75 percent) express an unfavorable view, and independents fall in between (42 percent favorable, 46 percent unfavorable).

Figure 2

The ACA’s Price Tag

Before the health care law went into effect, the independent Congressional Budget Office (CBO) projected how much it would cost the government to implement. In March, the CBO revised their original estimate and now expects the federal government will spend significantly less on the health care law than had been projected.1  This news went largely unnoticed by the public. Only 8 percent correctly answered that the law is now costing the government less than originally estimated, while half think that it is now costing more, 2 in 10 (18 percent) believe it is costing about the same as originally estimated, and a nearly quarter (23 percent) say that they don’t know.

Those with an unfavorable view of the health care law are more likely than those with a favorable view to say it is costing the government more than expected (71 percent versus 35 percent). Similar variation in opinion exists along party lines, with Republicans more likely to say the law is costing the government more than expected and Democrats more likely to say the law is costing the government less or about the same as expected.

Figure 3

Personal Impact Of The ACA

More than a year after the implementation of the health care law, a majority of Americans (56 percent) report that the law has had no direct impact on their families. Of those who do report being impacted, similar shares say the law has helped them (19 percent) as say it has hurt them (22 percent). Until last month, the Kaiser Health Tracking Poll consistently found that more of the public felt hurt by the law than helped.

Again, political party identification factors into the public’s perception of the law’s personal impact. Republicans are more likely to say the law has hurt them rather than helped them (38 percent vs. 5 percent), and Democrats are more likely to say the law has helped them rather than hurt them (32 percent vs. 8 percent).  Roughly 2 in 10 independents (18 percent) say the law has helped them and a quarter (25 percent) say it has hurt them.

Figure 4

What Should Congress Do Next About The ACA?

The public continues to be divided about what they would like to see Congress do next with the law. Just under half want Congress to either expand what the law does (24 percent) or continue implementing it as is (22 percent), while about 4 in 10 want to see Congress either scale back the law (12 percent) or repeal it entirely (29 percent). These shares have remained constant for nearly six months.

Figure 5

Health Care Priorities For The President and Congress

Now that the ACA is 5 years old and through its second open enrollment period, the April Kaiser Health Tracking Poll looked at what some of the public’s health care priorities are for the President and Congress going forward. When asked about many different aspects of health care delivery and the health care system, the issue that comes out on top for Democrats, Republicans and independents alike is making sure that high-cost drugs for chronic conditions, such as HIV, hepatitis, mental illness and cancer, are affordable to those who need them, with three-quarters of the public (76 percent) saying this is a top priority.  Sixty percent say that government action to lower prescription drug prices should be a top priority and majorities say things like provider network protections and increased transparency related to the prices and quality of health care should be top priorities.

Figure 6: “Top Health Care Priorities” for the President and CongressTotalDemocratsIndependentsRepublicans
Making sure that high-cost drugs for chronic conditions, such as HIV, hepatitis, mental illness and cancer, are affordable to those who need them76877266
Government action to lower prescription drug prices60685751
Protecting people from being charged high prices when they visit hospitals covered by their health plan but are seen by a doctor not covered by their plan56636244
Making sure health plans have sufficient provider networks55645843
Making information about the price of doctors’ visits, procedures, and tests, such as hip replacements and MRIs more available to patients55625843
Making information about what doctors and hospitals are covered under different health insurance plans more available54605546
Making information comparing the quality of health care provided by doctors and hospitals more available to patients54645347
Changing current eligibility rules so that financial help under the health care law to purchase health insurance is available to more people50724431
Requiring all states to expand their Medicaid program to cover more low-income, uninsured adults50744328
Making the notes doctors take about patients routinely available to patients45534039
Helping people with moderate incomes pay high out-of-pocket costs for medical care44524533
Repealing the requirement that employers with 100 or more workers pay a fine if they don’t offer health insurance39403637
Repealing the requirement that nearly all Americans have health insurance or else pay a fine37273752
Repealing the entire health care law36163760
Reducing the number of people that are able to get financial help from the government to purchase health insurance under the health care law to save the government money28272634
Eliminating a tax on the most expensive employer-sponsored health plans, also called Cadillac plans, that helps pay for the health care law26252727
Note: Items asked of half samples.

Beyond agreeing that high-cost prescriptions should be affordable to those who need them, Republicans, Democrats, and independents have different ideas of their top health care priorities for the President and Congress. The issues that rank second and third for Democrats build on the ACA – namely requiring all states to expand their Medicaid programs (74 percent of Democrats say this is a top priority) and changing the eligibility rules so that more people are able to get financial help to purchase health insurance under the health care law (72 percent of Democrats say this is a top priority). The second and third ranked top health care priorities for Republicans are also ACA related but include repealing the entire law (60 percent) and repealing the individual mandate (52 percent).  For independents, changes like provider network protections and price transparency rank second and third.

Figure 7

Personal Health Care Experiences And Perceptions

Few Report Comparing Plans, Hospitals, Or Doctors On Quality & Prices

Overall, 31 percent report seeing information comparing doctors, hospitals, and health insurance plans in the past 12 months. However, when asked more specifically if they have seen information comparing prices or quality across plans and providers, fewer than 1 in 5 say they have seen these types of information. Even fewer report actually using this information in making decisions about doctors, hospitals or health insurance plans.

Figure 8

Many Say Finding Cost Information Is Difficult

Not only do few say they have seen information comparing prices, many say it is difficult to find out how much medical treatments and procedures provided by different doctors or hospitals would cost. Nearly two-thirds (64 percent) say this is difficult, while a third say it is at least somewhat easy to find out how much medical treatments would cost. Three-quarters of the uninsured (76 percent) say it is difficult to find out this information.

Figure 9

Confidence And The Ability To Pay For Unexpected Health Care

Over half the public says they are at least somewhat confident that they have enough money or health insurance to pay for usual medical costs (68 percent) or for a major illness requiring hospitalization (55 percent), but still 3 in 10 (30 percent) say they are not confident they have enough to pay for usual medical costs and over 4 in 10 (44 percent) say they are not confident they could pay for care for a major illness or injury that required hospitalization.  The nonelderly uninsured are much more likely to say they are not confident they could pay than those under age 65 with insurance.

Figure 10

Given a hypothetical situation in which an unexpected medical bill cost $500, 45 percent of the public says they would be able to pay it in full, 20 percent says they would pay the bill by putting it on a credit card and paying it off over time, 7 percent say they would have to borrow money from a bank, friends, or family, and 20 percent say they would not be able to pay the bill at all. The nonelderly uninsured are more likely than the nonelderly insured to say they would not be able to pay the bill at all (32 percent vs. 18 percent) or that they would have to borrow money to pay the bill (14 percent vs. 7 percent).  When the cost of the unexpected medical bill is increased to $1,500, fewer people say they could pay it in full (26 percent) and more say they would have to pay it off over time (27 percent), borrow money (10 percent), or not be able to pay it at all (26 percent). Four in ten of the uninsured under age 65 (41 percent) say they would not be able to pay an unexpected medical bill of $1,500.

Figure 11

Some Insured Find Affording Premiums And Cost Sharing Difficult

Most nonelderly insured say it is easy to afford their deductible (57 percent), the cost of insurance (64 percent), and other cost sharing (71 percent). A third of those under age 65 with insurance (36 percent) say it is difficult to afford their deductible, 28 percent say it is difficult to afford the cost of health insurance each month, and 24 percent say it is difficult to pay for copays for doctor visits and prescription drugs.

Figure 12

Perception Remains That Personal Health Care Costs Are Increasing

Among nonelderly Americans with health insurance, about a quarter (24 percent) report that their health insurance premiums have been going up a lot lately and 22 percent say they have going up a little, while about 4 in 10 (39 percent) say they have been holding steady. In terms of deductibles and copayments, nearly a quarter (23 percent) say that these costs have been rising a lot and 16 percent say they have going up a little, while just over half (53 percent) say the cost of their deductibles and copayments has been holding steady.

Figure 13

Kaiser Health Tracking Poll: April 2015 Methodology

This Kaiser Health Tracking Poll was designed and analyzed by public opinion researchers at the Kaiser Family Foundation (KFF). The survey was conducted April 8-14, 2015, among a nationally representative random digit dial telephone sample of 1,506 adults ages 18 and older, living in the United States, including Alaska and Hawaii (note: persons without a telephone could not be included in the random selection process). Computer-assisted telephone interviews conducted by landline (601) and cell phone (905, including 529 who had no landline telephone) were carried out in English and Spanish by Princeton Data Source under the direction of Princeton Survey Research Associates International (PSRAI). Both the random digit dial landline and cell phone samples were provided by Survey Sampling International, LLC. For the landline sample, respondents were selected by asking for the youngest adult male or female currently at home based on a random rotation. If no one of that gender was available, interviewers asked to speak with the youngest adult of the opposite gender. For the cell phone sample, interviews were conducted with the adult who answered the phone. KFF paid for all costs associated with the survey.

The combined landline and cell phone sample was weighted to balance the sample demographics to match estimates for the national population using data from the Census Bureau’s 2013 American Community Survey (ACS) on sex, age, education, race, Hispanic origin, nativity (for Hispanics only), and region along with data from the 2010 Census on population density. The sample was also weighted to match current patterns of telephone use using data from the January-June 2014 National Health Interview Survey. The weight takes into account the fact that respondents with both a landline and cell phone have a higher probability of selection in the combined sample and also adjusts for the household size for the landline sample. All statistical tests of significance account for the effect of weighting.

The margin of sampling error including the design effect for the full sample is plus or minus 3 percentage points. Numbers of respondents and margins of sampling error for key subgroups are shown in the table below. For results based on other subgroups, the margin of sampling error may be higher. Sample sizes and margins of sampling error for other subgroups are available by request. Note that sampling error is only one of many potential sources of error in this or any other public opinion poll. Kaiser Family Foundation public opinion and survey research is a charter member of the Transparency Initiative of the American Association for Public Opinion Research.

GroupN (unweighted)M.O.S.E.
Total1,506±3 percentage points
Party Identification
   Democrats480±5 percentage points
   Republicans372±6 percentage points
   Independents469±5 percentage points
Insurance Status
   Uninsured, ages 18-64111±10 percentage points
   Insured, ages 18-64981±4 percentage points
Opinion of ACA
  Favorable656±5 percentage points
  Unfavorable668±4 percentage points
Half Samples
  Half Sample A726±4 percentage points
  Half Sample B780±4 percentage points

Endnotes

  1. Congressional Budget Office, Updated Budget Projections: 2015 to 2025 https://www.cbo.gov/publication/49973 ↩︎
Poll Finding

Kaiser Health Policy News Index: April 2015

Authors: Jamie Firth, Bianca DiJulio, and Mollyann Brodie
Published: Apr 21, 2015

The Kaiser Health Policy News Index is designed to help journalists and policymakers understand which health policy-related news stories Americans are paying attention to, and what the public understands about health policy issues covered in the news.

The health policy stories included in this month’s Kaiser Health Policy News Index were followed closely by about 4 in 10 Americans. Forty-one  percent report “very” or “fairly” closely following news about the proposed laws in various states placing restrictions on abortion, the potential impact of the U.S. Supreme Court case about the health care law on some states, and the impact of the health care law on filing taxes. A slightly smaller share (32 percent) report closely following another health policy story about Congressional efforts to avoid cutting Medicare payments to doctors, also known as the “doc fix”. By comparison, larger shares of the public report closely following non-health news than report closely following health policy news. Of the stories asked about this month, the one that garnered the most attention was coverage of the white police officer charged with the murder of an unarmed black man in South Carolina, closely followed by nearly three-quarters of the public (73 percent) – a story that was breaking as the survey began. Over half report closely following other stories, including the Germanwings plane crash in the French Alps (59 percent), a new religious freedom law in Indiana that allows business owners to refuse service to gay customers (54 percent), negotiations over Iran’s Nuclear Program (53 percent), and a terrorist attack by Islamic militants at a university in Kenya (53 percent). The only non-health story to receive less attention than the health stories this month was coverage of the Congressional Republican budget proposals, followed closely by just over a third of the public (35 percent).

Figure 1

Tax Season And The ACA

News about the impact of the health care law on filing taxes was one of the most closely followed health policy stories in this month’s News Index. Half of the public correctly answered that the health care law requires nearly all Americans to report their health insurance status on this year’s taxes or else pay a fine. Still, that leaves half of the public who incorrectly answered that the requirement took effect last year (14 percent), next year (18 percent), or who said that they don’t know when it takes effect (18 percent).1  Those who report closely following the news story about the impact of the health law on filing taxes were more likely than others to correctly say the requirement to report insurance status while filing taxes goes into effect this year (58 percent vs. 44 percent).

About half of the public (52 percent) correctly say that when someone gets financial help from the government to pay for their health insurance premium, it is possible that they could end up owing money to the government if their income or family size changes during the year. A quarter (26 percent) incorrectly say that people receiving financial help from the government would not end up owing money and about 2 in 10 (22 percent) say that they don’t know. Again, those following the story in the news are more likely to be aware of this (58 percent vs. 48 percent).

Figure 2

Complying with this new requirement seems to leave most Americans unfazed. Two-thirds (67 percent) say that it was “very” or “somewhat” easy to report their health insurance status on their taxes this year. Only 9 percent say it was “somewhat” or “very” difficult, and 11 percent are unsure if they reported their health insurance status or refused to answer the question. Thirteen percent say they had not filed their taxes yet or are not required to file taxes. More uninsured Americans report difficulty noting their health insurance status on their taxes than those with insurance. About 3 in 10 (28 percent) uninsured say that it was difficult for them to report their health insurance status, while only 5 percent of the insured say the same.

Figure 3


  1. This survey was in the field April 8-14th, just before the April 15th deadline to file taxes. ↩︎