KFF designs, conducts and analyzes original public opinion and survey research on Americans’ attitudes, knowledge, and experiences with the health care system to help amplify the public’s voice in major national debates.
Low-income California adults who gained insurance coverage in 2014 had an easier time accessing health care than those who were uninsured and increased financial protection from medical bills, according to a new Kaiser Family Foundation (KFF) report.
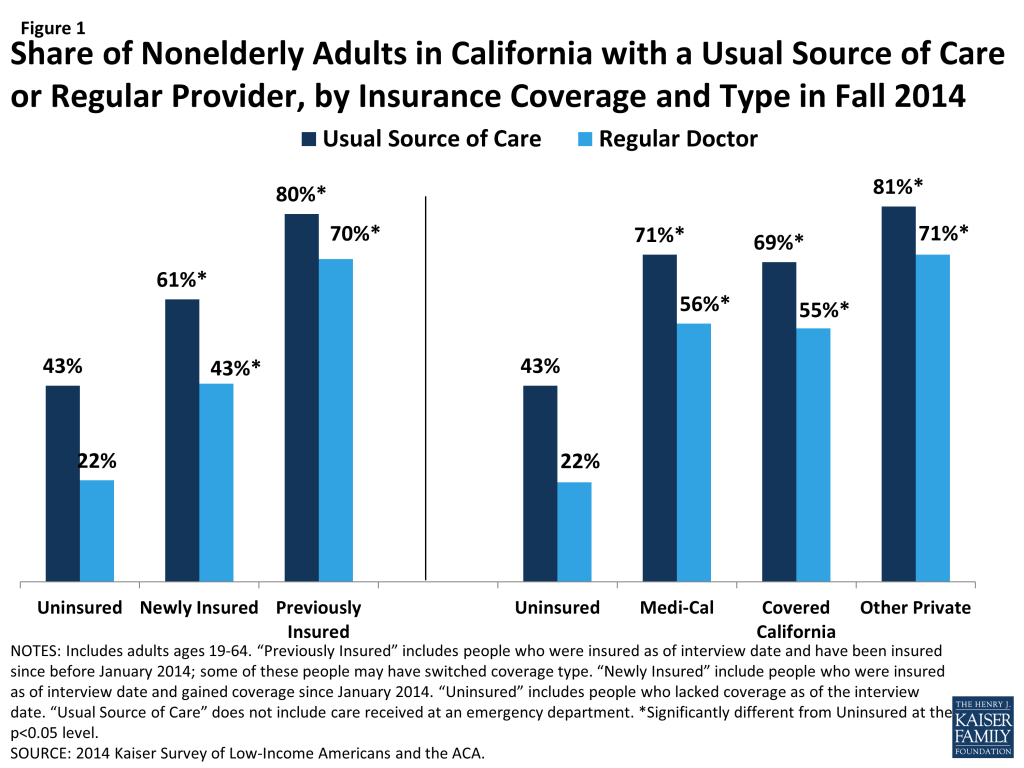
The report, funded by the Blue Shield of California Foundation and based on findings from the California sample of the 2014 Kaiser Survey of Low-Income Americans and the ACA, finds that newly-insured Californians were more likely to have a usual source of health care (61%) than the uninsured (43%), and that the newly-insured also were more likely to have used any medical services (58% vs. 45%). In addition, newly-insured adults reported lower rates of difficulty paying medical bills, and were less likely to say they worry about their ability to afford medical care in the future.
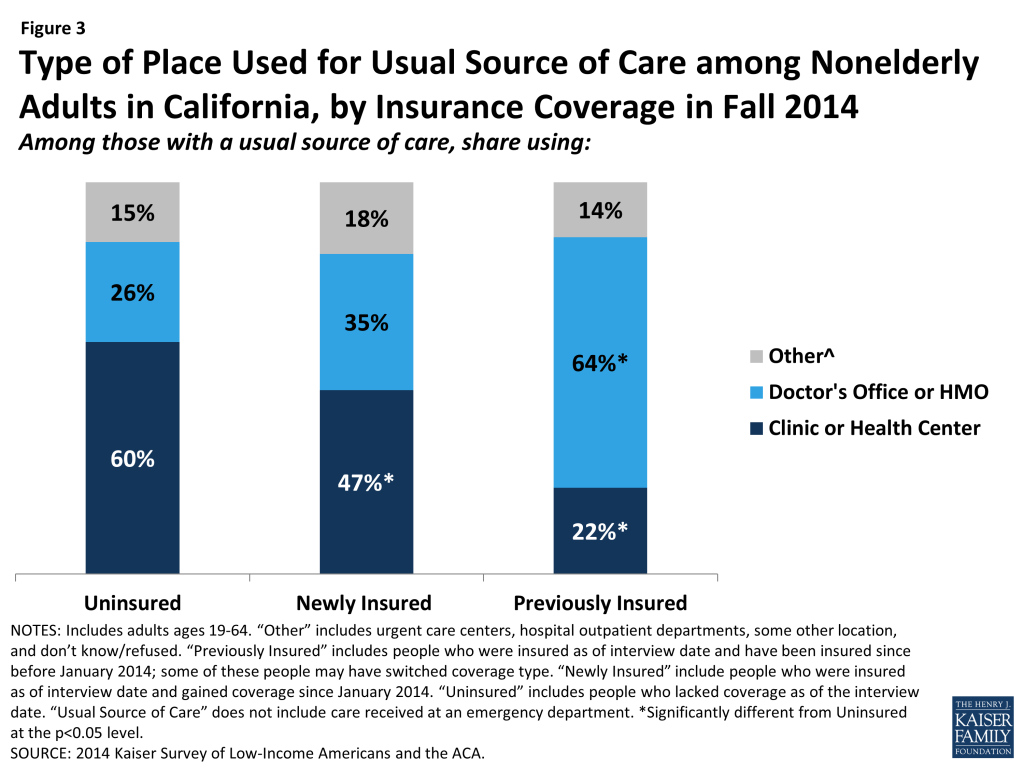
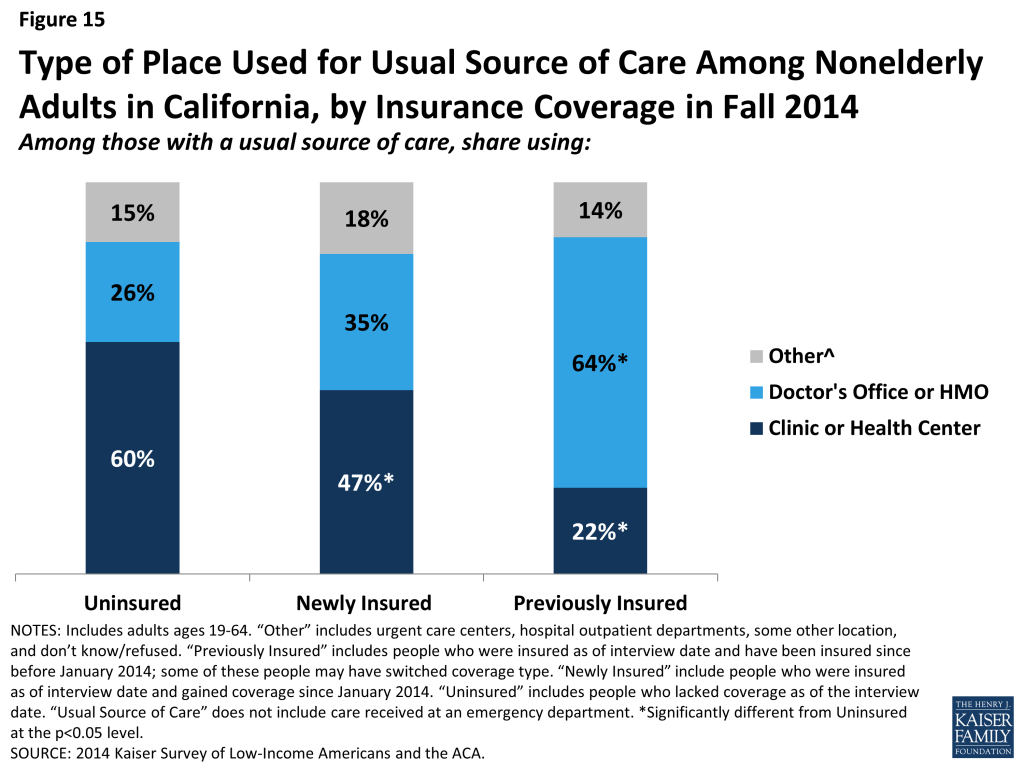
Clinics and health centers continue to be core providers for both populations: 47 percent of the newly-insured and 60 percent of the uninsured with a usual source of care say they use them rather than a doctor’s office or HMO.
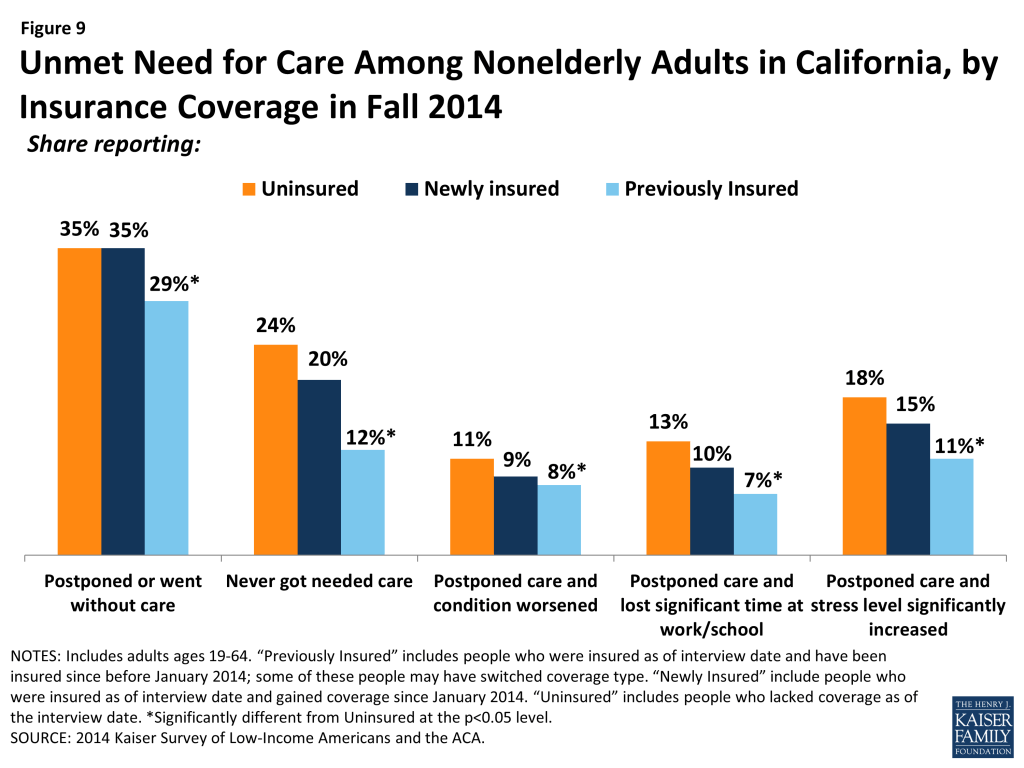
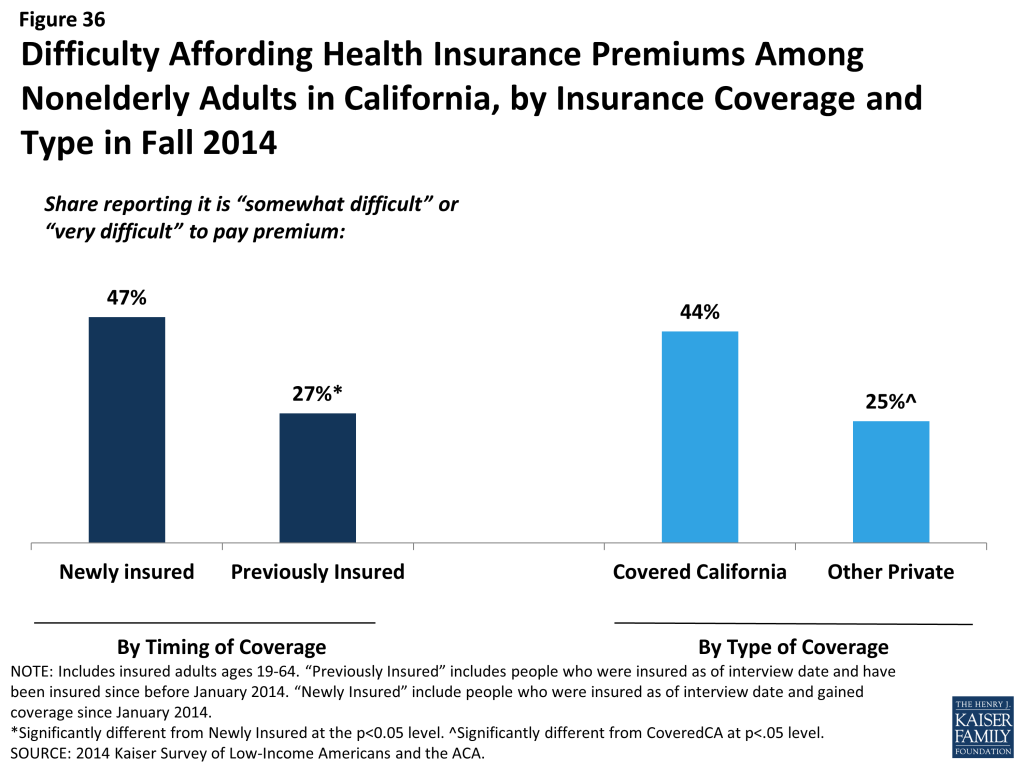
While the majority of newly-insured adults give their health plan “excellent” or “good” ratings, some newly-insured adults do report ongoing challenges. More than a third of newly-insured adults (35%) say they postponed or went without needed health care (versus 29% of those who were continuously insured), and nearly half (47%) said it was somewhat or very difficult to afford their monthly premium.
Between October 2013 and 2014, about 2.8 million people were determined eligible for Medi-Cal, which was expanded under the Affordable Care Act. During that period, roughly 1.7 million people applied and were determined eligible for enrollment in a private plan through Covered California, the state-run insurance marketplace created under the health law.
The new report examines who in the state gained coverage in 2014; who remained uninsured and why; how people view their coverage; and how coverage affects financial security and access to care. KFF and the Blue Shield of California Foundation co-sponsored a briefing and panel discussion about the findings, and how the California experience with the ACA has been going. You will be able to view an archived version of the webcast within the next week.
The survey, which included a state-representative sample of 4,555 California adults age 19-64, was conducted between Sept. 2 and Dec.15, 2014.
Under the ACA, millions of individuals have gained coverage through new provisions (which went into effect in January 2014) to expand Medicaid and provide premium tax credits for coverage purchased through Health Insurance Marketplaces. California is a bellwether state for understanding the impact of the ACA. The state’s sheer size and its high rate of uninsured prior to ACA implementation means that its experience in implementing the ACA has implications for national coverage goals. California was also an early and enthusiastic adopter of the ACA; the state implemented an early Medicaid expansion through its Low-Income Health Program (LIHP) and was the first to create a state-based Marketplace. In addition, coverage gains were substantial in the state, with 2.7 million people gaining Medi-Cal coverage and nearly 1.7 million people determined eligible for enrollment through Covered California between October 2013 and September 2014.1
While much attention has been paid to enrollment in new coverage options and changes in the uninsured over the past year, less is known about how this coverage has affected people’s ability to access the medical services they need. This report, based on findings from the California sample of the 2014 Kaiser Survey of Low-Income Americans and the ACA, funded by the Blue Shield of California Foundation, aims to understand the impact that gaining coverage has had on access to care for the “newly insured” adult population, with comparisons to the remaining uninsured as well as those who have had coverage since before 2014. The survey findings reinforce a large body of literature documenting that people with insurance are more likely to be linked to regular care, are less likely to postpone care when they need it, and have an easier time accessing services. The findings also provide insight into patterns of care among the newly insured and remaining uninsured. Additional detail on the survey method is available online.
Issue Brief
Usual Sources of Care
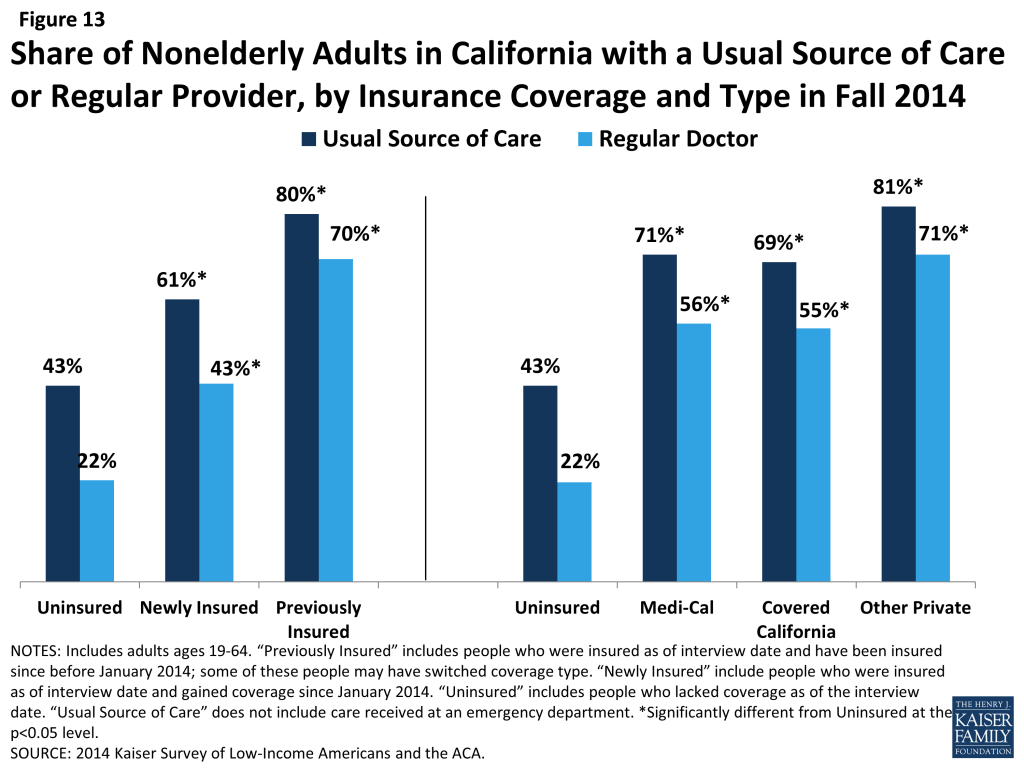
Adults who gained coverage are more likely to be linked to care than those who remained uninsured. Newly insured adults were more likely than those who remained uninsured in fall 2014 to have a usual source of care, or a place to go when they are sick or need advice about their health (not counting the emergency room); they were also more likely to have a regular doctor at their usual source of care. Previously insured adults were also more likely than the uninsured to have a regular site of care and regular provider. These findings hold across coverage type. Having a usual source of care or regular doctor is an indicator of being linked to the health care system and having regular access to services. These patterns reinforce a large body of research that finds that gaining coverage is associated with improved access to care. However, results also indicate that the newly insured are less likely than the previously insured to have a usual source of care or regular doctor. This finding may indicate that newly insured adults are still navigating the health care system and are not as settled into regular care as their previously insured counterparts. Compared to 2013, there was no change in the share of Medi-Cal enrollees who reported having a usual source of care or regular doctor, while uninsured adults in 2014 were less likely than those in 2013 to say they have a usual source of care (but not a regular doctor).2
Figure 1: Access to Care for the Insured and Remaining Uninsured: A Look at California During Year One of ACA Implementation
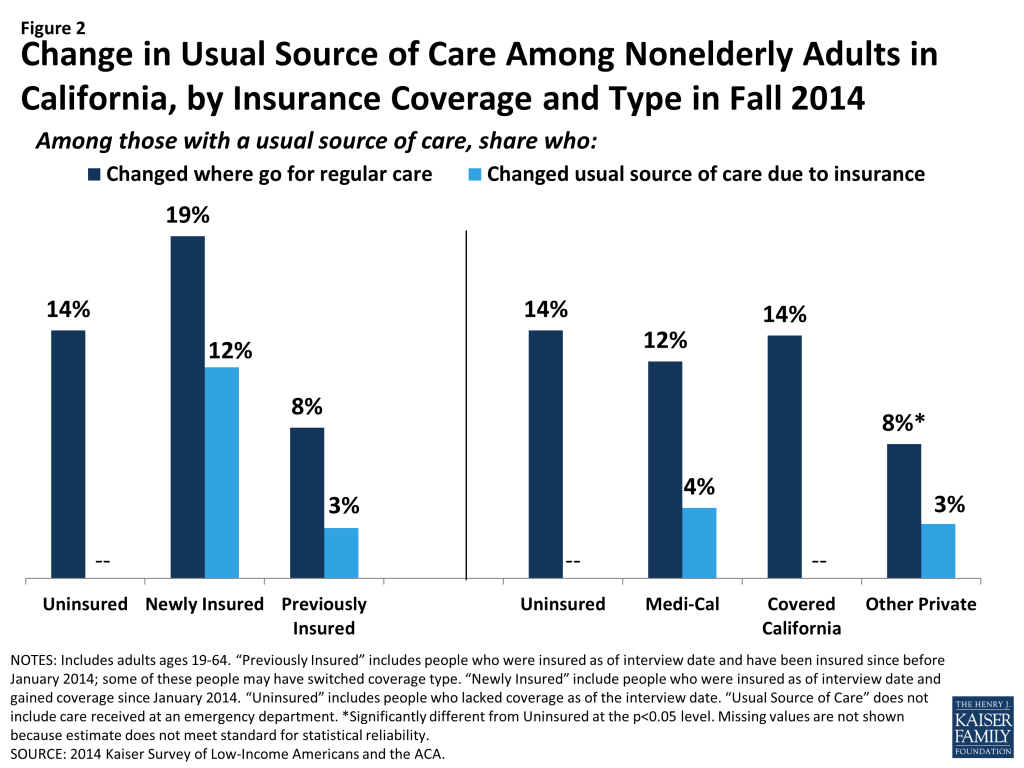
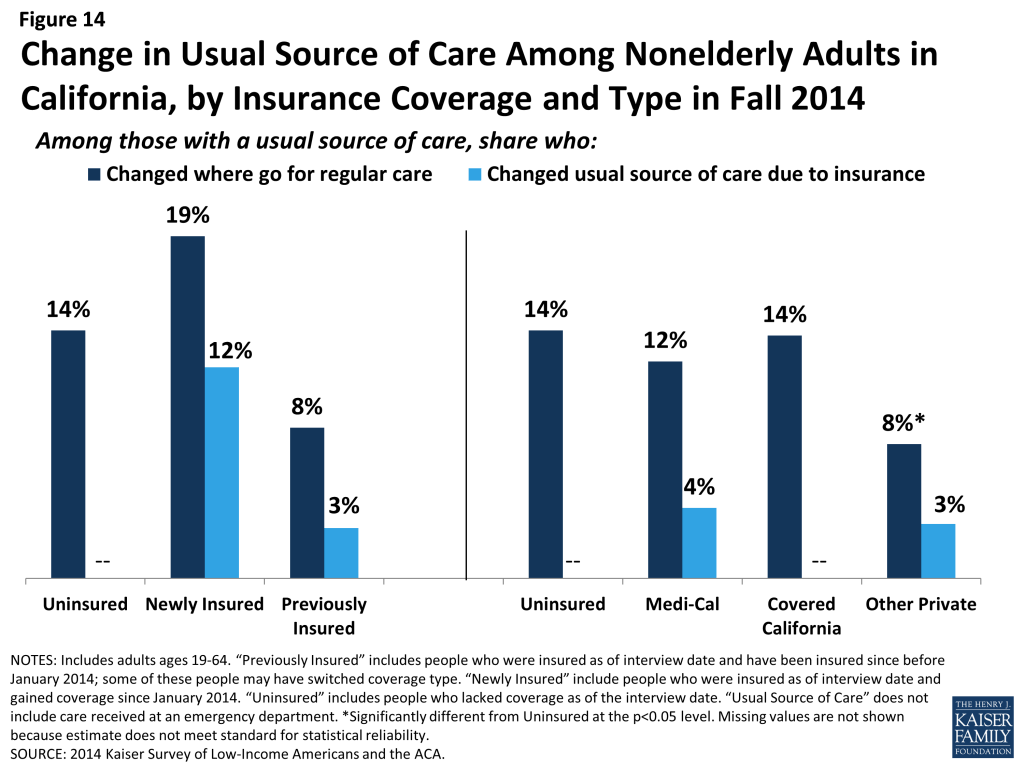
Newly insured adults were more likely to change where they usually go for care than their previously insured counterparts. Nearly a fifth (19%) of newly insured adults who have a usual source of care reported that they changed the place they usually go for care since gaining their coverage. Uninsured adults in 2014 were not significantly more likely to say they changed their usual source of care compared to uninsured adults in 2013, and there were no significant differences between the rates of uninsured and newly insured adults changing their usual source of care in 2014. However, newly insured adults in 2014 were more likely than previously insured adults to change their usual source of care. Most newly insured adults who changed their site of care reported that it was due to their insurance, a significantly higher rate than the previously insured. There were no significant differences in the likelihood of Medi-Cal or Covered California enrollees changing their usual source of care, and Medi-Cal enrollees in 2014 were no more likely than those in 2013 to say they changed where they usually go for care.
Figure 2: Change in Usual Source of Care Among Nonelderly Adults in California, by Insurance Coverage and Type in Fall 2014
Clinics remain an important source of care for both the uninsured and the newly insured. Both uninsured and newly insured adults with a usual source of care are most likely to use a clinic or health center for that care. In contrast, previously insured adults were most likely to use a doctor’s office or HMO as their usual source of care. Historically, clinics and health centers were crucial “safety net” providers for uninsured people, and the share of uninsured adults using clinics as their usual source of care was unchanged since 2013. Though some of the newly insured have changed their source of care, many continue to rely on these providers. According to policy experts from county health systems, this pattern may reflect lack of understanding of new health care options among the newly insured. Alternatively, it could reflect community health centers’ efforts to retain patients after helping them enroll in health coverage.
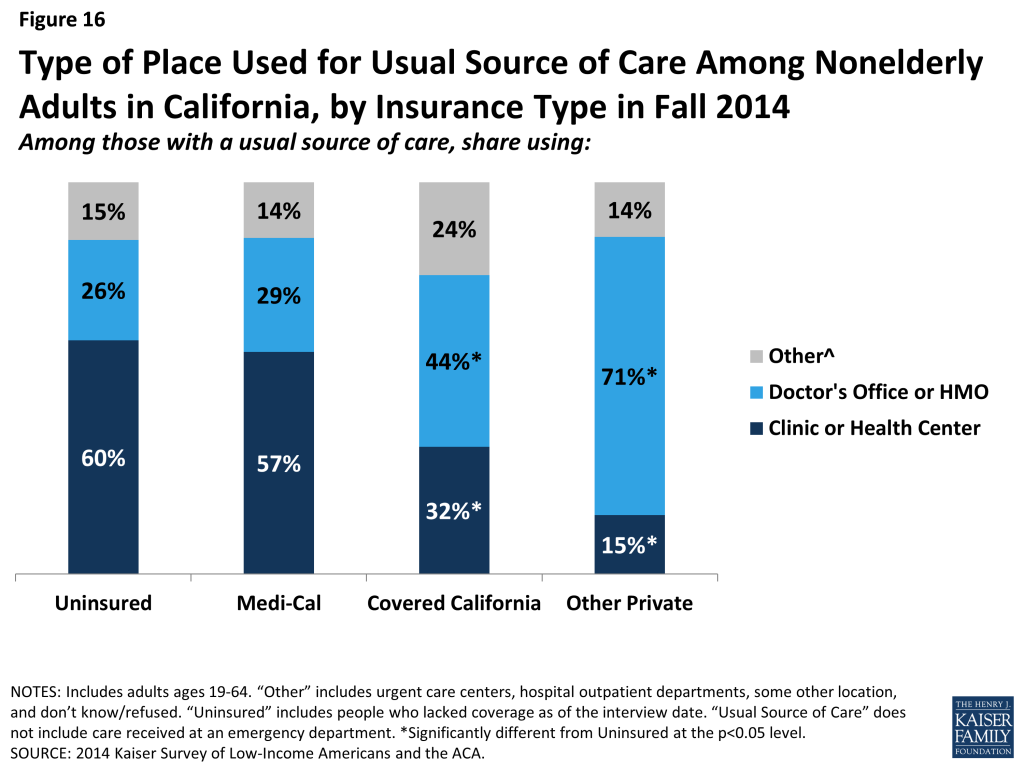
Figure 3: Type of Place Used for Usual Source of Care among Nonelderly Adults in California, by Insurance Coverage in Fall 2014Figure 4: Type of Place Used for Usual Source of Care Among Nonelderly Adults in California, by Insurance Type in Fall 2014
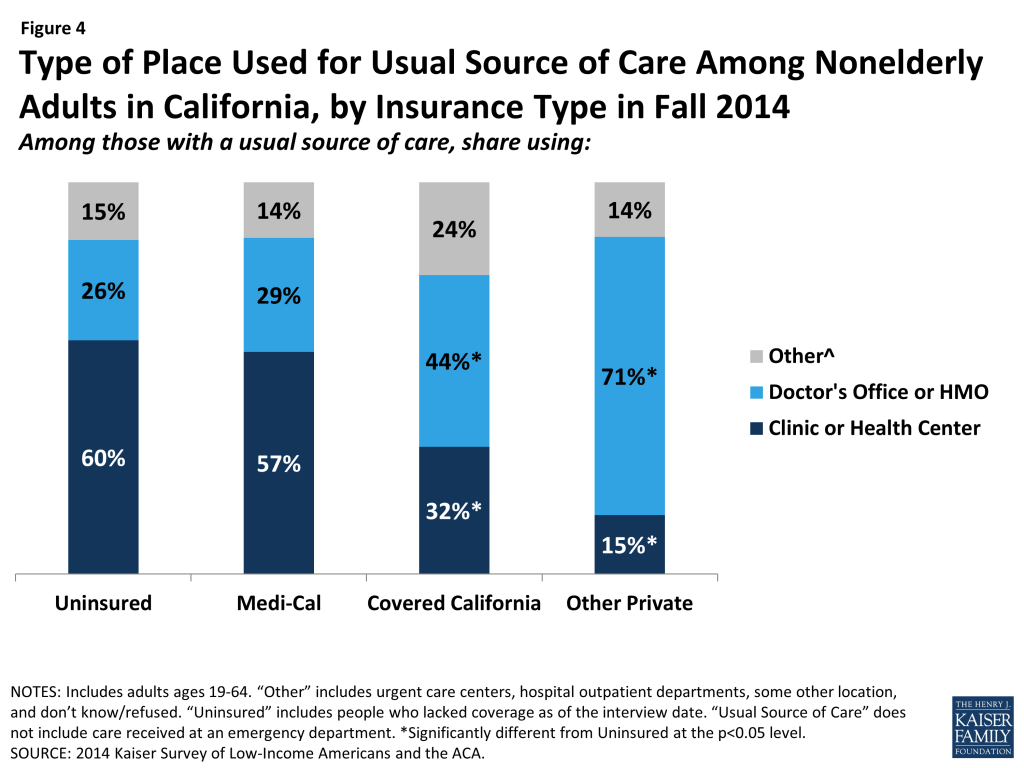
Comparing site of care by type of coverage reveals that those enrolled in Covered California (44%) or other private coverage (71%) were more likely than Medi-Cal enrollees (29%) to choose a doctor’s office as their usual source of care, with adults with other private coverage most likely to do so. Medi-Cal enrollees were most likely to use clinics or health centers for their usual care (57%). This pattern is in line with pre-ACA patterns, which showed that a plurality of adults with Medi-Cal used clinics or health centers for their regular care.3 Comparing the 2013 and 2014 surveys indicates that a significantly larger share of Medi-Cal adults with a usual source of care is relying on clinics. This change could indicate that, as uninsured adults gain Medi-Cal coverage, they still use the clinics and health centers that they relied on when they were uninsured.
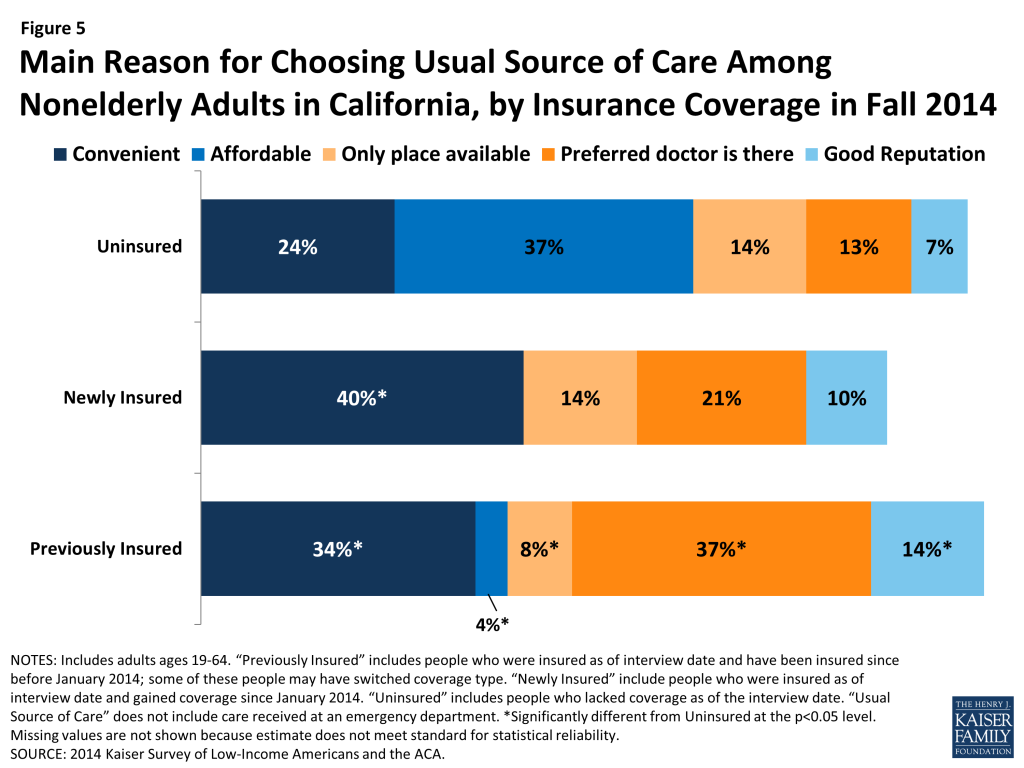
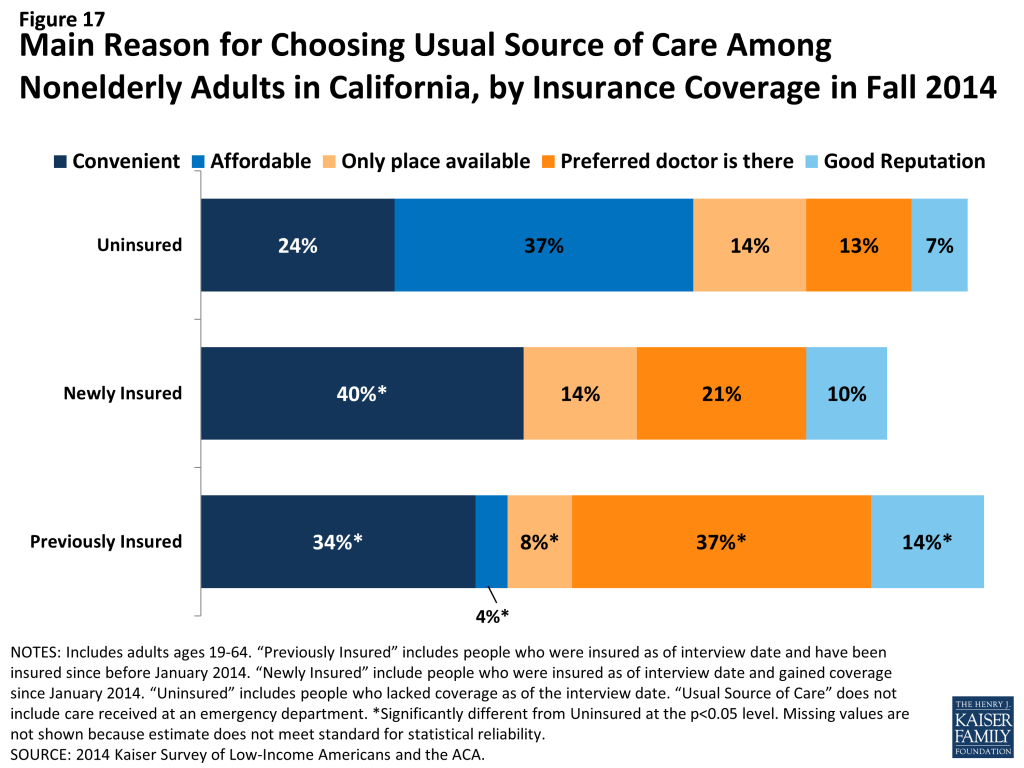
Uninsured adults are most likely to choose their site of care based on affordability, whereas newly insured adults are most likely to choose based on convenience. In the past, many uninsured adults reported that they chose their usual source of care because it was affordable, a pattern that is also seen among adults who were uninsured in 2014. More than a third (37%) of uninsured adults say they use their usual source of care because it is affordable, a share not significantly different than the uninsured in 2013 reported. In contrast, adults who gained coverage in 2014 were more likely to say they chose their usual source of care because it was convenient (40%). Previously insured adults were most likely to choose their site of care because their preferred provider is there (37%). As the newly insured establish relationships with a regular doctor at their usual source of care, it is possible that they too will begin to seek out routine care at a place where their preferred doctor is available.
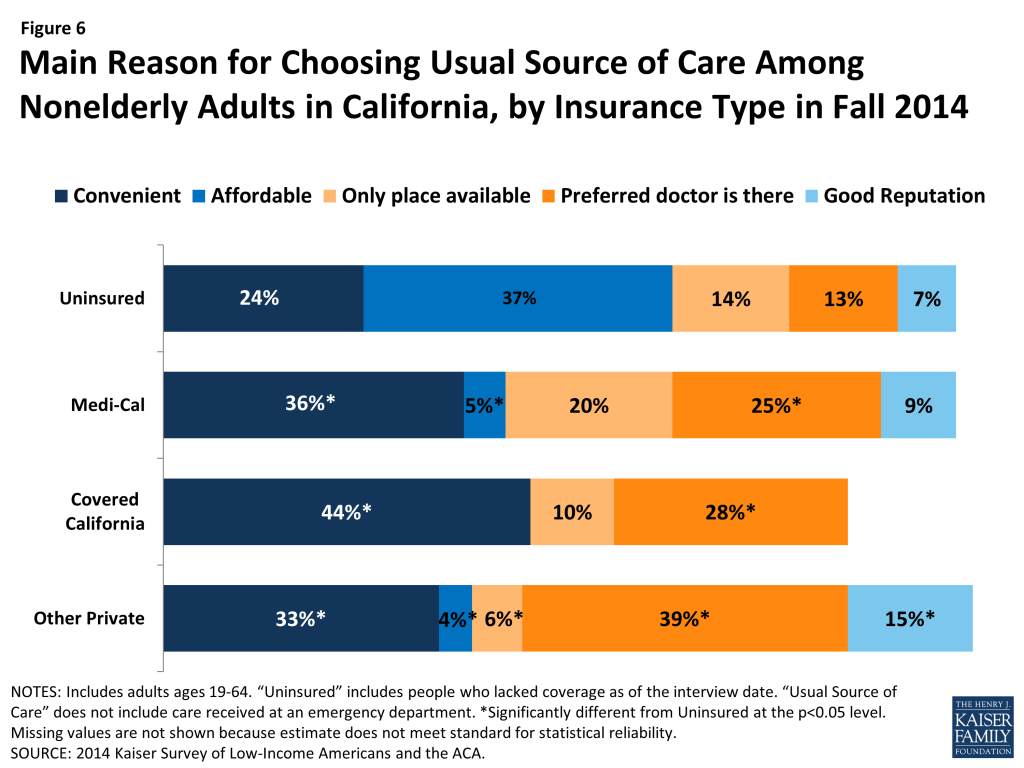
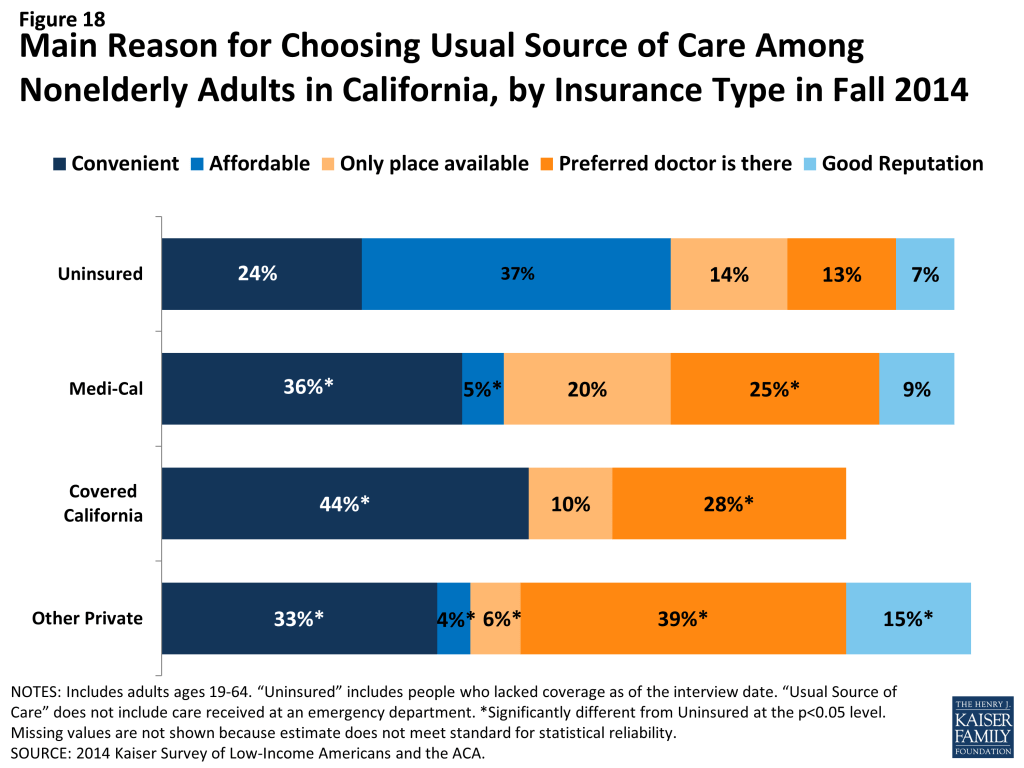
Figure 5: Main Reason for Choosing Usual Source of Care Among Nonelderly Adults in California, by Insurance Coverage in Fall 2014Figure 6: Main Reason for Choosing Usual Source of Care Among Nonelderly Adults in California, by Insurance Type in Fall 2014
Looking at reason for choosing site of care by coverage, Medi-Cal enrollees were more likely than those in Covered California and other private insurance to report choosing their usual source of care because it was the only place available. Ten percent of Covered California enrollees reported choosing their usual source of care because it was the only place available, compared with 20% of Medi-Cal enrollees and 6% of those with other private insurance. Though Medi-Cal managed care plans are held to state standards of network adequacy and patient access, experts report that low reimbursement rates make contracting with providers difficult, especially in rural areas. There was no change from 2013 to 2014 in the share of Medicaid enrollees who reported they chose their usual source of care because it is the only place available. According to a state Medicaid expert, long-standing federal and state standards of network adequacy have required managed care plans to grow their network to meet demand in the past and will continue to do so as needed.
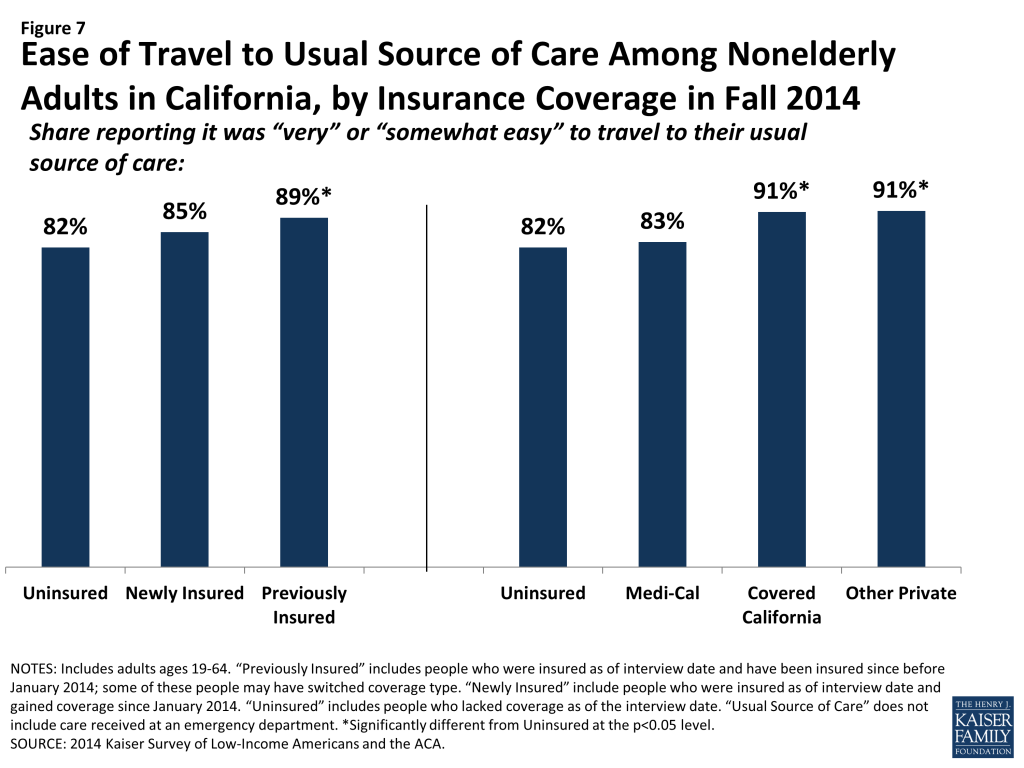
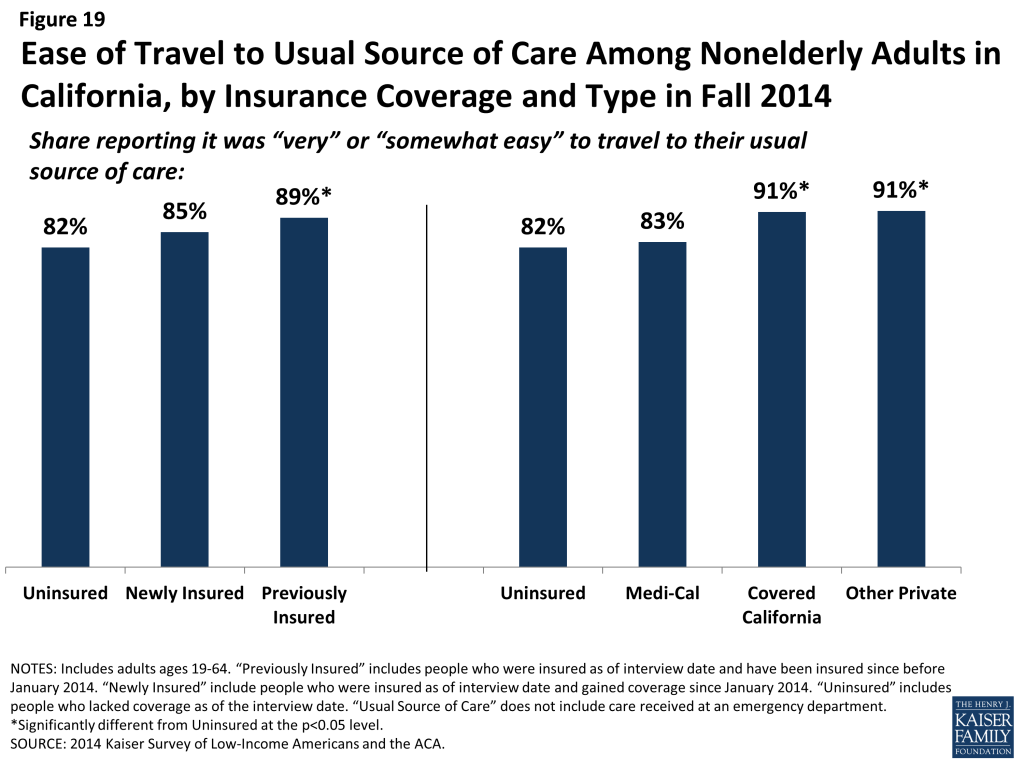
Uninsured adults and newly insured adults report greater difficulty than previously insured adults in traveling to their regular site of care. Among adults with a usual source of care, most report that it is “very easy” or “somewhat easy” to travel there. However, there was no significant difference in the share of newly insured and uninsured adults who reported ease in traveling to care, while previously insured adults were more likely than uninsured to report ease of traveling to care. Within types of coverage, adults with Covered California and other private coverage were more likely than the uninsured to say it was easy to travel to care. These patterns may reflect the need for the uninsured to find a source of care that is affordable, which may require farther travel. In addition, those with private coverage were also more likely than those with Medi-Cal to report ease of travel to their USC. Taken together, these findings also suggest that the difference may be due to lower provider density in areas where those with the lowest incomes live or the need for lower-income people to rely more heavily on public transit than their own vehicle. There was no change from 2013 to 2014 in the share of uninsured or Medi-Cal enrollees reporting difficulty traveling to their usual source of care.
Figure 7: Ease of Travel to Usual Source of Care Among Nonelderly Adults in California, by Insurance Coverage in Fall 2014
Translating Coverage to Care
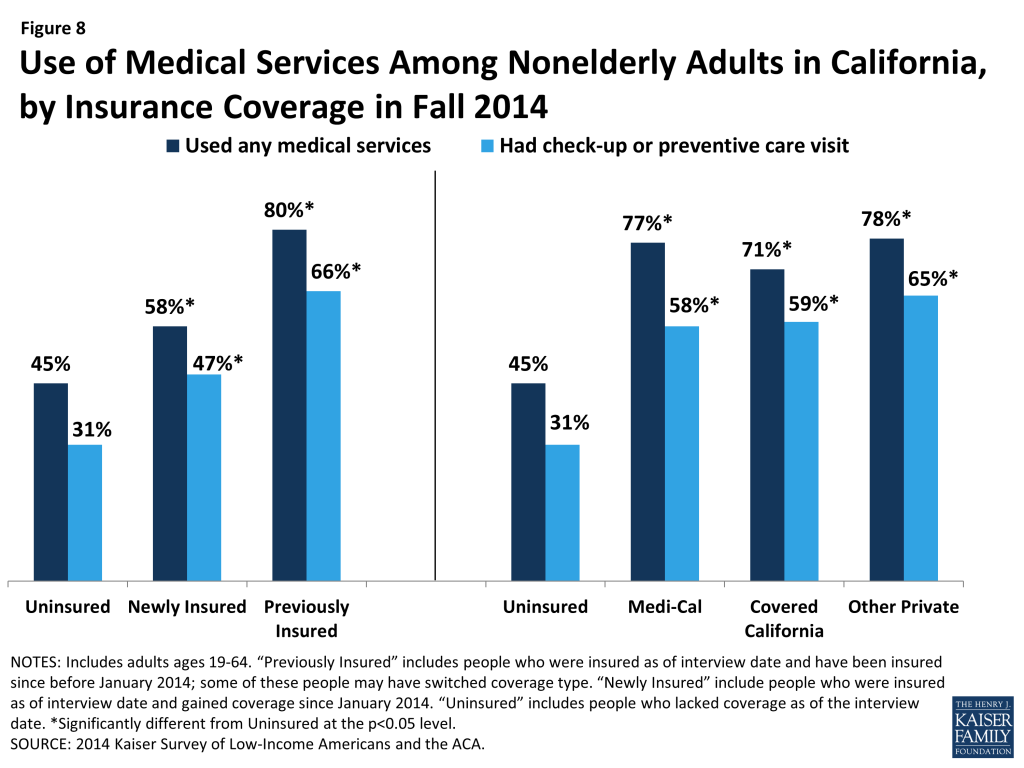
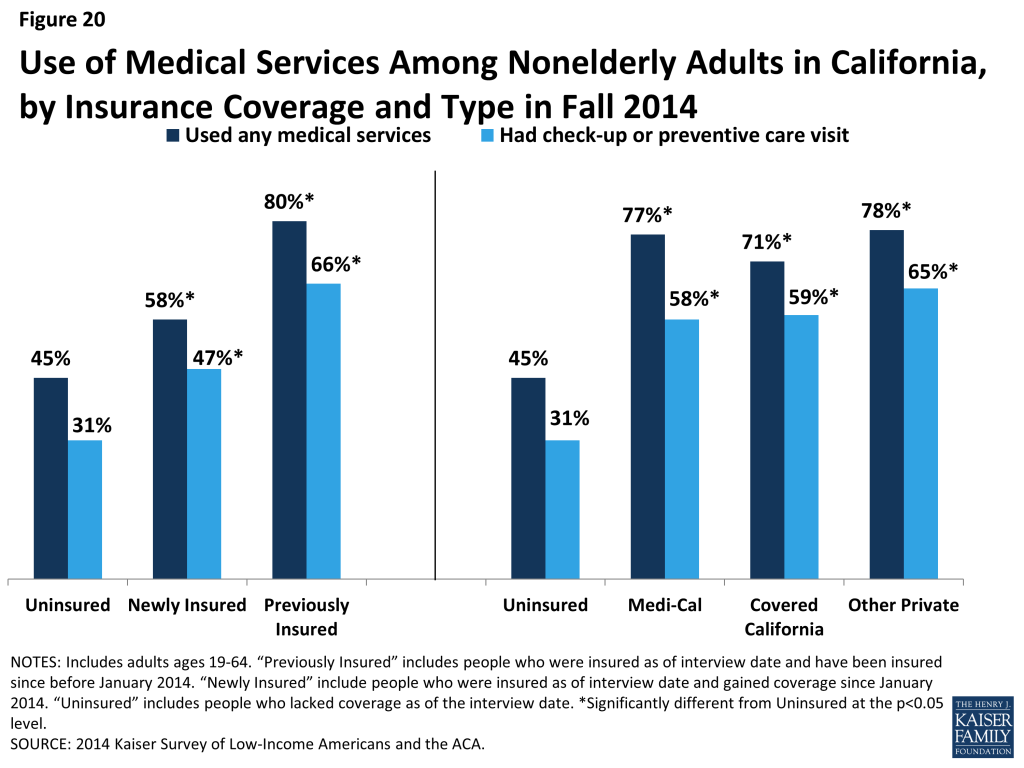
Mirroring patterns for being linked to care, adults with insurance coverage were more likely than the uninsured to have used medical services or received preventive care. More than half (58%) of adults who gained coverage in 2014 said that they used at least one medical service since gaining their coverage, and nearly half (47%) had received a preventive visit or check-up. These rates were significantly higher than those the uninsured reported for 2014 but were lower than the previously insured reported for 2014. There were no differences in the share of adults reporting visits by coverage type, with the exception of adults with other private coverage being more likely than adults with Medi-Cal to have a preventive visit. Again, these findings are not unexpected given the large body of research showing that people without insurance coverage are less likely to use care, including preventive care. Compared to 2013, Medi-Cal beneficiaries were less likely to report using care but no more or less likely to report using preventive care. Among uninsured adults, there were no changes in utilization rates between 2013 and 2014.
Figure 8: Use of Medical Services Among Nonelderly Adults in California, by Insurance Coverage in Fall 2014
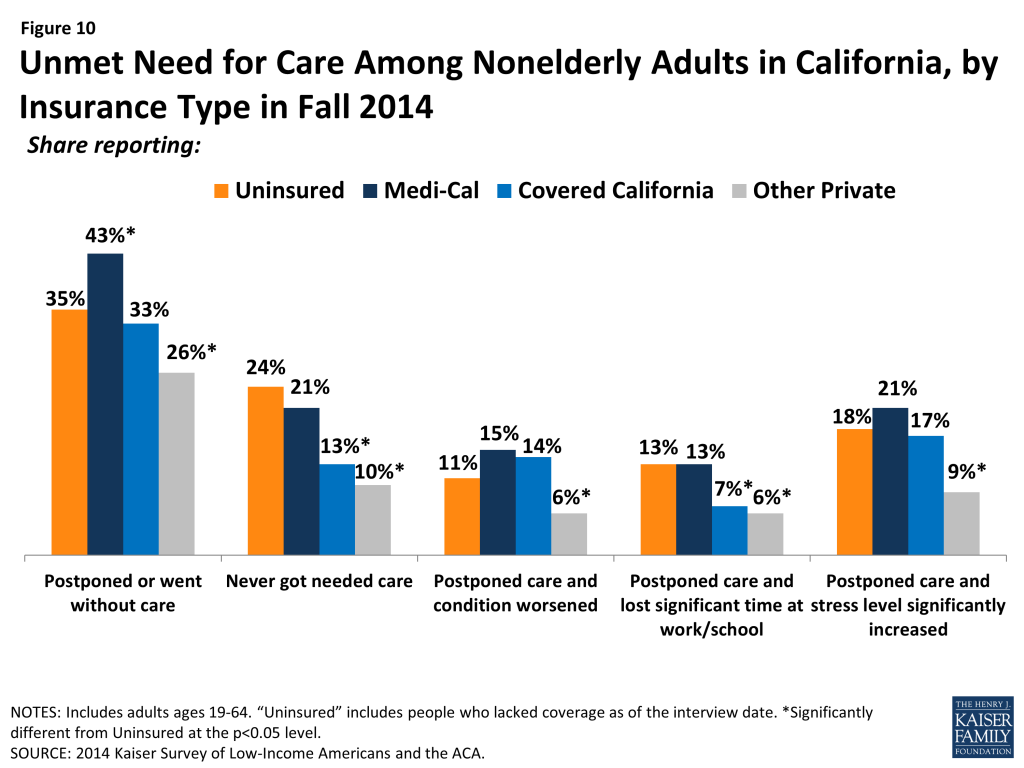
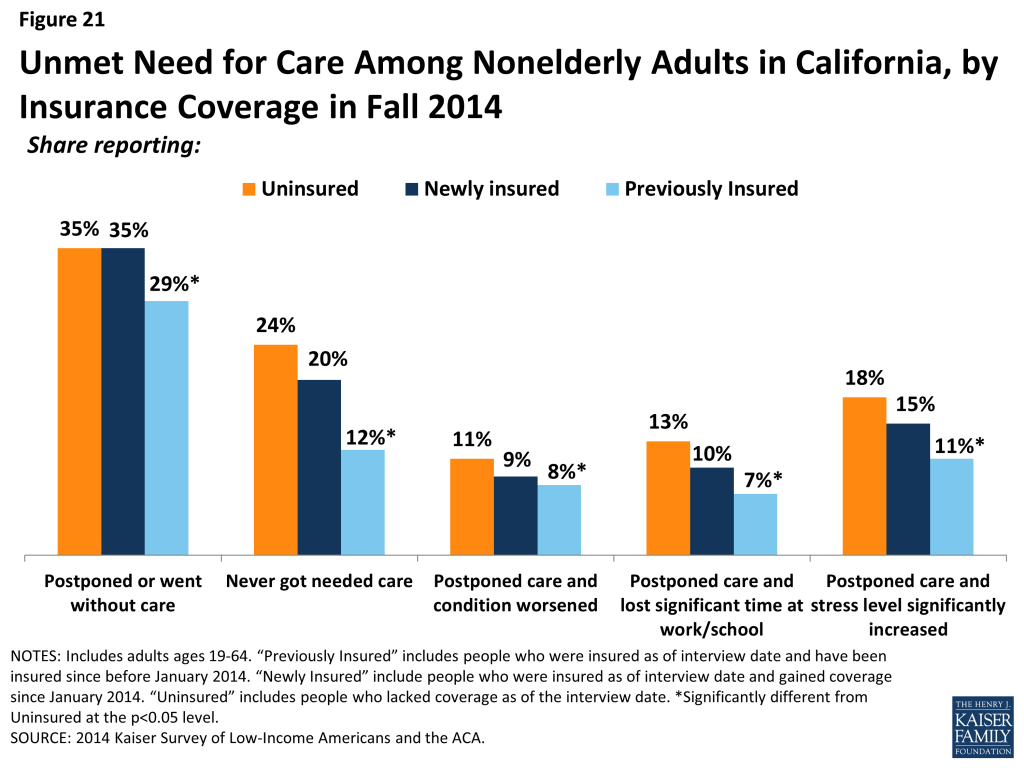
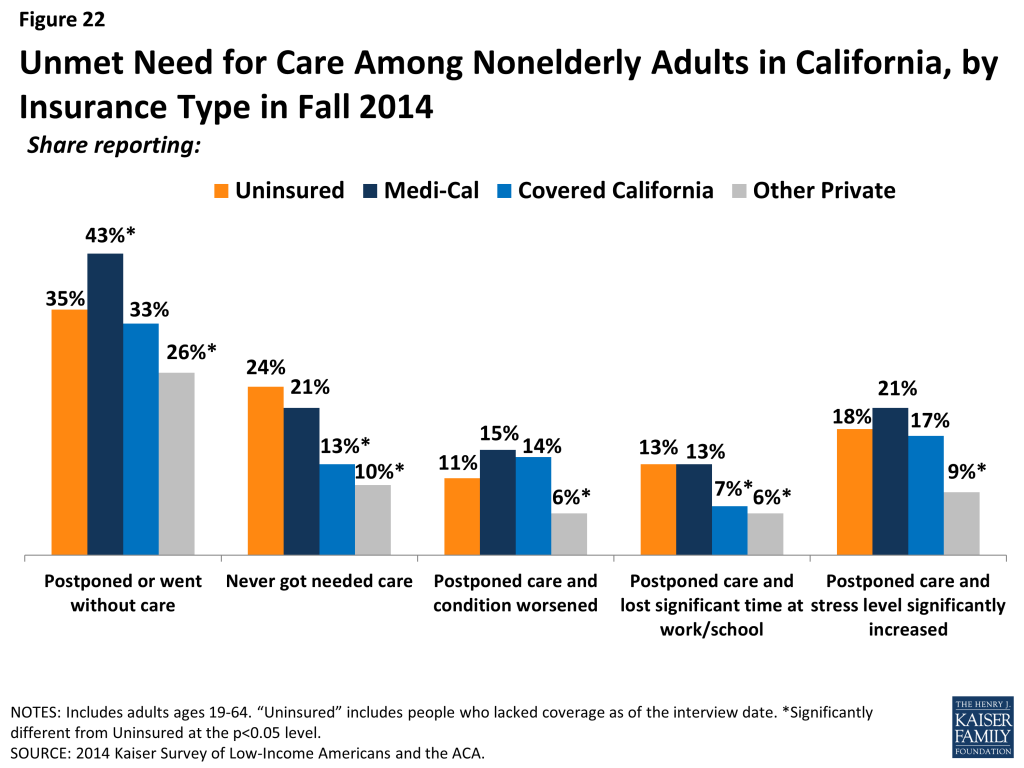
Still reflecting some unmet need, many newly insured adults reported postponing or delaying needed services. More than a third of newly insured adults (35%) reported that they postponed or went without needed care since gaining their coverage, the same share as the uninsured and a higher share than the previously insured. Similar patterns were seen for the shares reporting that they never received this care or that postponing care had negative consequences such as a condition worsening, loss of time at work or school, or substantial stress. When comparing these outcomes by type of coverage, similar patterns persist, though Covered California enrollees were less likely than uninsured adults or adults in Medi-Cal to say that they never received the care they needed or that postponing care led them to miss work or school. Notably, Medi-Cal enrollees were more likely than uninsured adults to report postponing needed care; this outcome may be due to Medi-Cal enrollees’ poorer health status and the greater frequency with which they may need complex services. People with a large number of complex needs may be more likely to encounter access barriers for some services than those with more limited needs. Compared to 2013, Medi-Cal enrollees in 2014 were no more likely to say they postponed care and were less likely to say that their condition worsened or their stress increased as a result of postponing care. The high rates of unmet need among the uninsured corroborate existing evidence that this group goes without needed care due to cost, though the uninsured in 2014 were less likely to postpone care than the uninsured in 2013. Among those who do have coverage, postponing care could be related to several factors, including difficulty finding a provider, problems navigating the health system and health insurance networks, misunderstanding of how to use coverage and when to seek care, or concerns about out-of-pocket costs.
Figure 9: Unmet Need for Care Among Nonelderly Adults in California, by Insurance Coverage in Fall 2014Figure 10: Unmet Need for Care Among Nonelderly Adults in California, by Insurance Type in Fall 2014
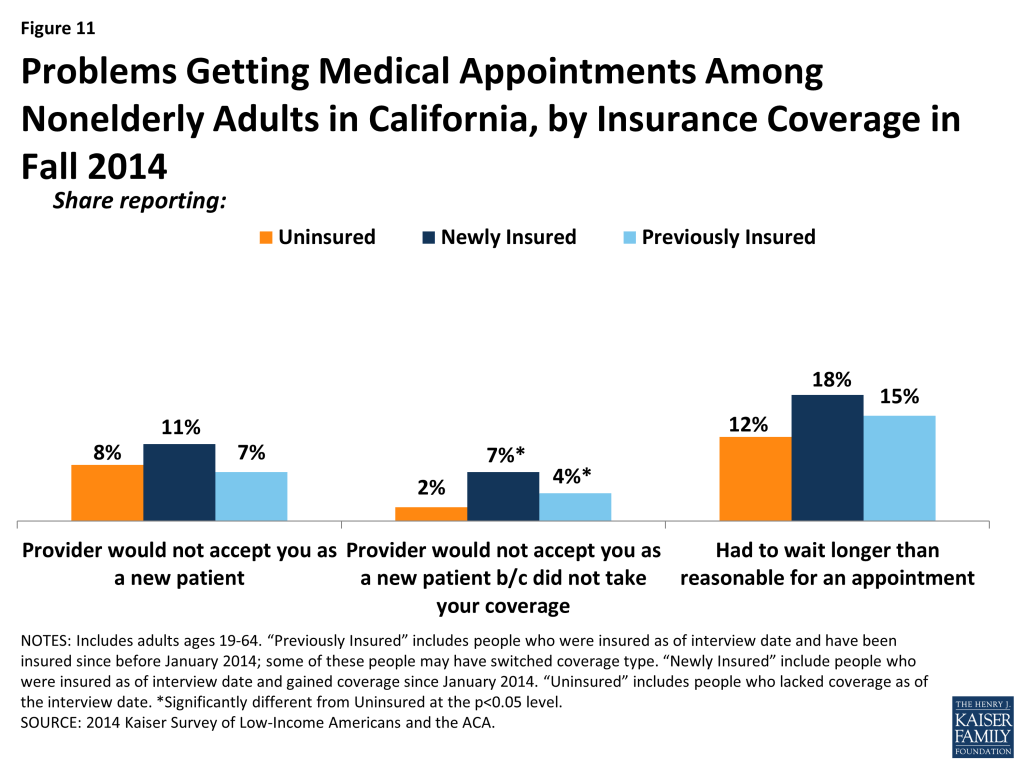
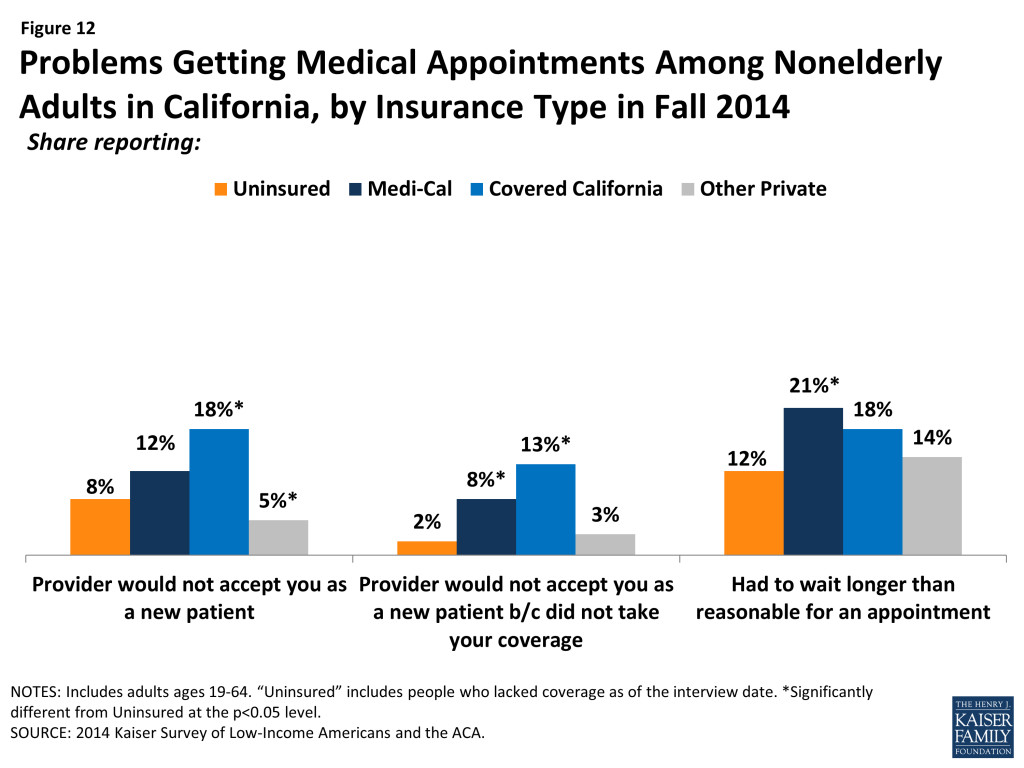
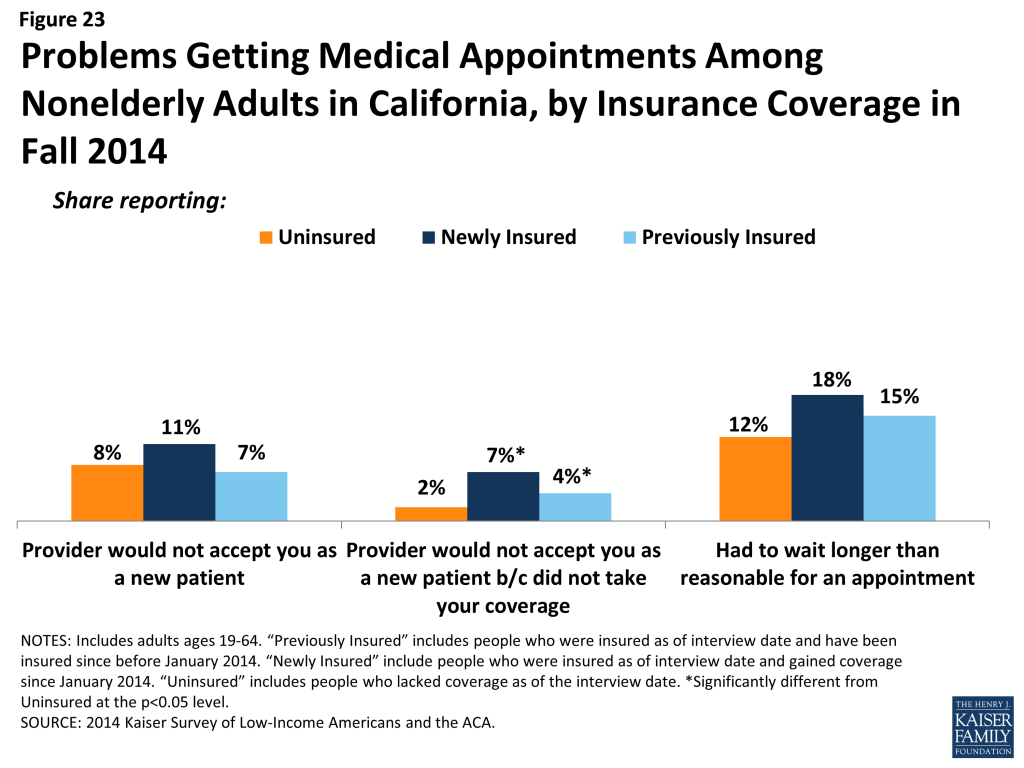
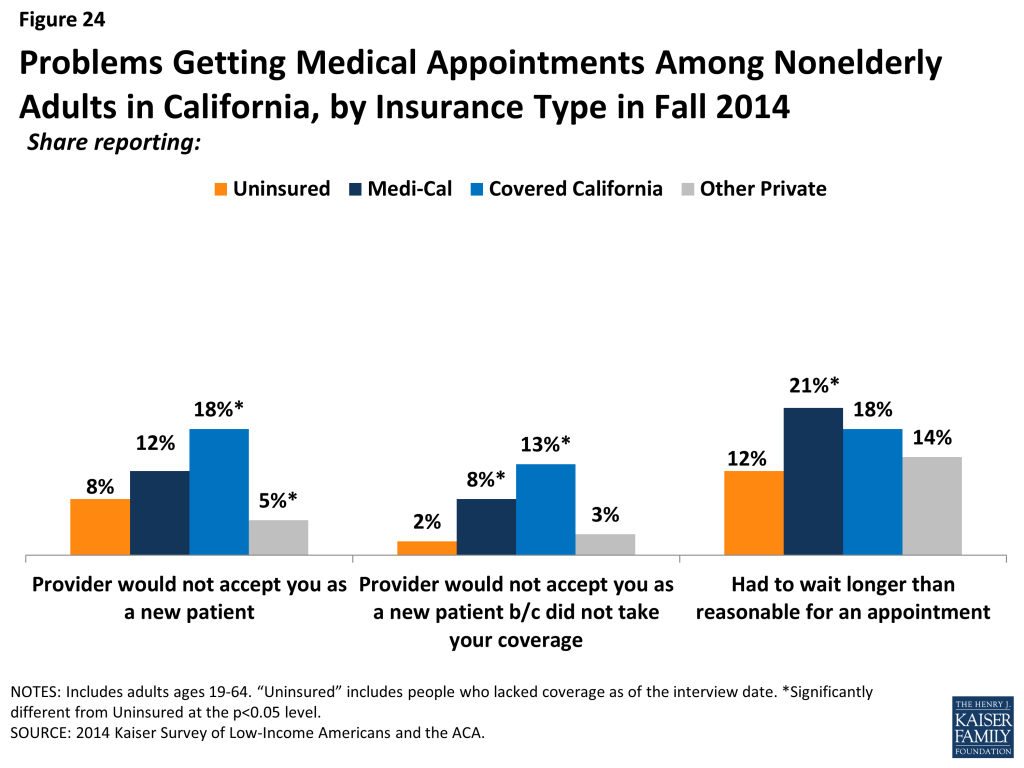
Though most adults did not report problems getting appointments, some insured adults say a provider would not take them as a patient due to coverage. Though a very small share (7%) of newly insured or previously insured (4%) adults reported this problem, both these groups were more likely than the uninsured to say a provider would not accept them as a patient due to coverage. The low rates of these problems among the uninsured (2%) likely reflect this group’s lower propensity to seek care, as detailed elsewhere, although uninsured adults in 2014 were more likely than those in 2013 to say they were told a provider would not take them as a patient. There were no significant differences in the share reporting not being taken as a new patient for any reason or reporting having to wait longer than they thought reasonable for an appointment. However, when examined by type of coverage, differences do emerge, with adults in Covered California or Medi-Cal being more likely to report being told that a provider would not take them as a patient than adults with other private coverage. Medi-Cal enrollees in 2014 were no more likely to say a provider would not take them as a patient than those in 2013. Like the forces underlying choice of usual source of care, these issues may reflect continuing problems with network adequacy, despite the existence of state standards for network adequacy and patient access.
Figure 11: Problems Getting Medical Appointments Among Nonelderly Adults in California, by Insurance Coverage in Fall 2014Figure 12: Problems Getting Medical Appointments Among Nonelderly Adults in California, by Insurance Type in Fall 2014
Provider Communication and Health Literacy
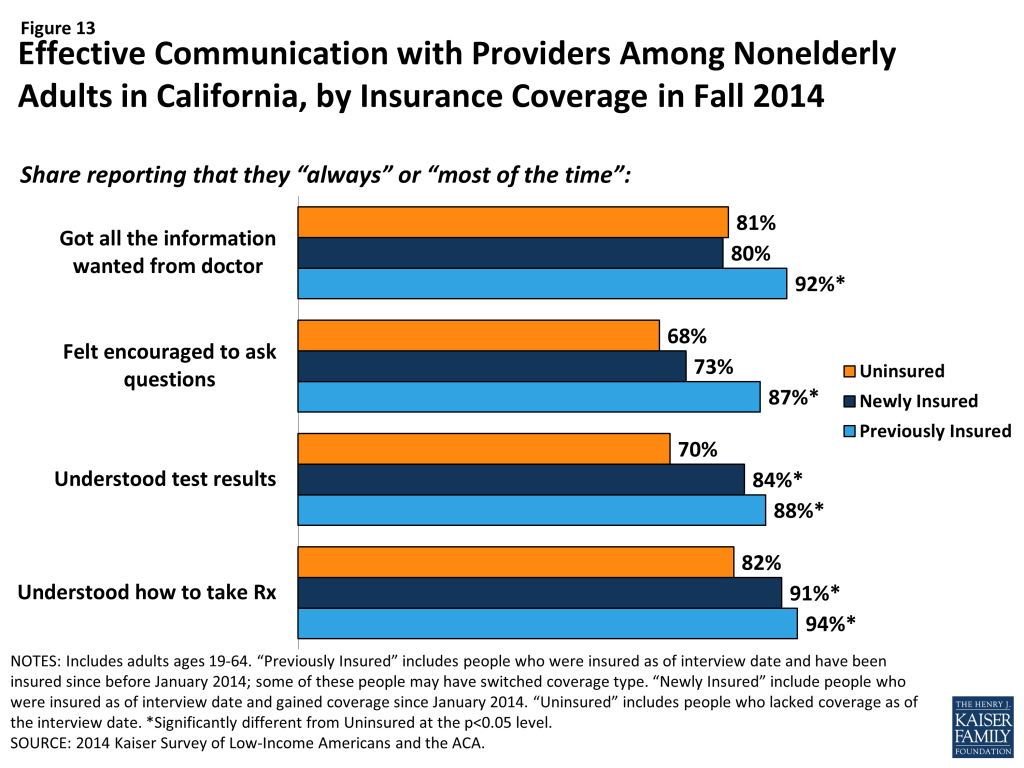
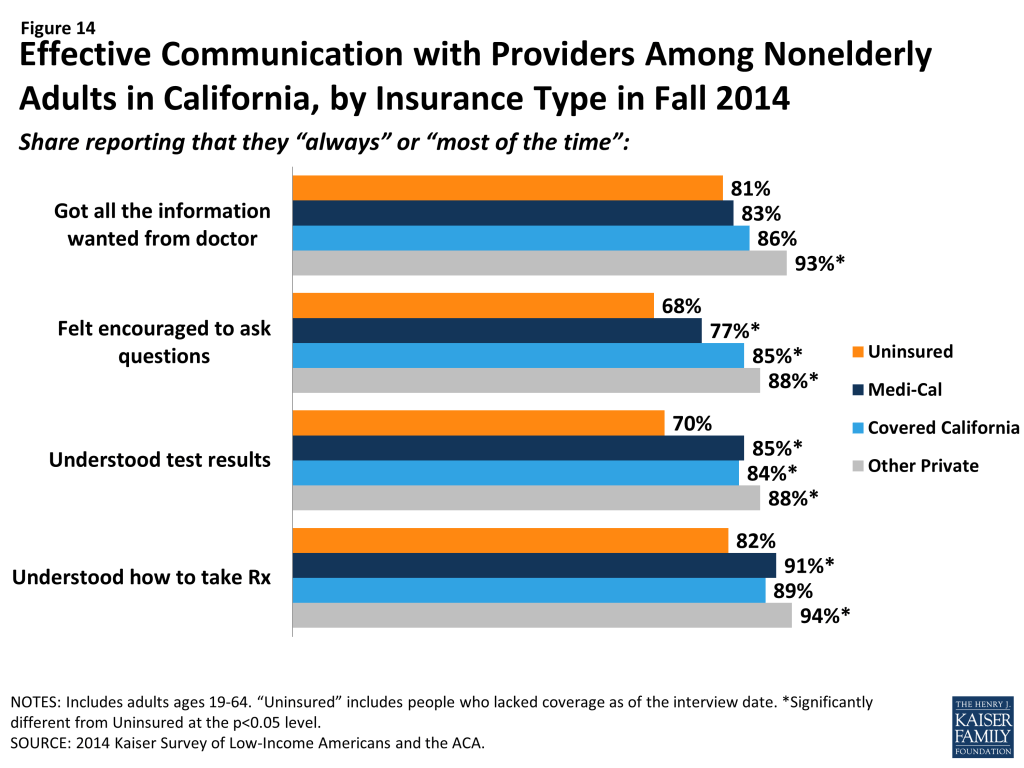
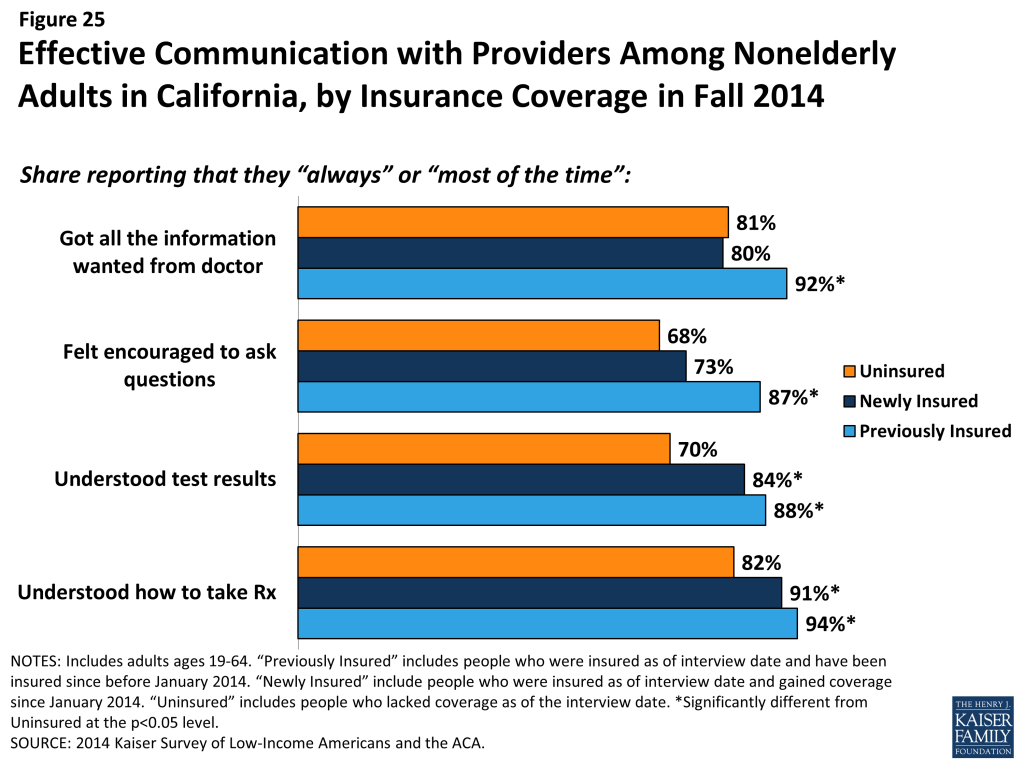
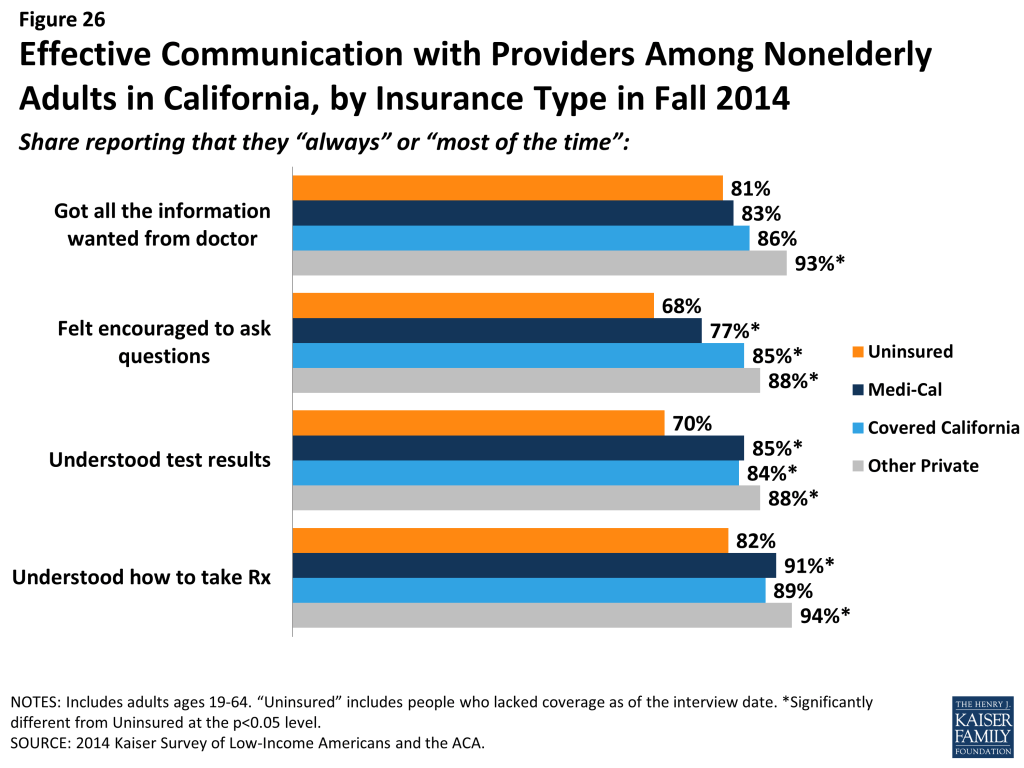
Among adults who received care, most adults across coverage types report effective communication with their providers about their care. Once people get into care, health literacy—or “patients’ ability to obtain, process, and understand the basic health information and services they need to make appropriate health decisions”4 —plays an important role in how that care affects health outcomes. Health literacy depends on a range of factors related to patients (e.g., engagement in care), providers (e.g., how the information is communicated), service setting (e.g., the length of time of the interaction), and the nature of the visit (e.g., the complexity of health information). Survey results reveal that both previously insured and newly insured both reported understanding their test results or how to take their medication either “always” or “most of the time” that they saw a provider in higher proportions than the uninsured. However, on outcomes of getting all the information you wanted from the provider or feeling encouraged to ask questions, the newly insured were no more likely than the uninsured to report experiencing these always or most of the time. Comparing results by coverage type reveals few differences, though Medi-Cal enrollees were less likely than adults with other private coverage to report getting all the information they wanted or feeling encouraged to ask questions. A statewide analysis of consumer ratings of doctor communication for all health plans found that Medi-Cal managed care plans received a “poor” rating relative to national benchmarks and thresholds, but ratings varied greatly across plans.5 This pattern may stem from income differences between the groups, since low-income Californians are less likely than higher-income Californians to give high ratings of communication with their provider, patient satisfaction, or patient engagement.6 Gaps in patient-satisfaction and engagement stem from low-income Californians reporting lower rates of feeling connected to the health care system or to seeing the same provider over time.7
Figure 13: Effective Communication with Providers Among Nonelderly Adults in California, by Insurance Coverage in Fall 2014Figure 14: Effective Communication with Providers Among Nonelderly Adults in California, by Insurance Type in Fall 2014
Policy Implications
Clinics and health centers remain core providers for the uninsured and will require ongoing support to serve this population. Though uninsured adults are less likely than insured to have a usual source of care, those that do are most likely to name a clinic or health center (versus doctor’s office, HMO, or other location). Many clinics offer services at greatly reduced cost or on a sliding scale relative to income, which makes them affordable options for the uninsured. Indeed, most uninsured adults said they chose their site of care based on affordability. California safety net providers are likely to play an ongoing, core role in serving the uninsured. However, experts note that these providers are also adapting to meet the changing health care environment in California, including becoming “providers of choice” to retain patients as they gain coverage and expanding primary care capacity to meet demand.
While some uninsured are able to navigate the system when they need care, most are not and face serious consequences as a result. Some uninsured people report that they receive regular care, preventive services, and can access care when they need to, but these individuals are the exception: survey results repeatedly indicate inferior access to care for people who lack insurance coverage compared to those who have coverage. In addition, the uninsured face negative financial consequences of having to pay out-of-pocket for care. Experts noted that access to care for the uninsured varies by region within the state. Some areas, particularly rural areas, have provider shortages for both insured and uninsured people. In addition, while some counties provide services to undocumented individuals, not all do, and those that do vary greatly in the scope of these services. Some local initiatives aim to address access barriers among the uninsured by providing insurance or insurance-like coverage, rather than just direct services, for low-income uninsured people. For example, Healthy San Francisco and My Health LA (MHLA) provide limited coverage for uninsured residents of San Francisco or LA county, respectively, regardless of immigration status. Programs such as these could increase access to health services for California’s uninsured and underinsured and could serve as models for other localities. Since people will continue to lack coverage under the ACA, planned efforts to deliver services to those who lack coverage when they need them may be necessary.
While gains in coverage have resulted in greater access to care for the newly insured, some newly insured adults still report access barriers. These barriers could be related to several factors, including difficulty finding a provider, problems navigating the health system and health insurance networks, misunderstanding of how to use coverage and when to seek care, or concerns about out-of-pocket costs. In discussing barriers to care among the newly insured, experts in the state frequently mentioned issues related to network adequacy. In Medi-Cal, low reimbursement rates have made it difficult to contract with providers in some cases, and the state is monitoring networks closely. In Covered California, experts noted that some plans established narrow networks to contain costs and added that some provider directories were inaccurate. Advocates in the state have pushed for legislation to address these issues, and in January 2015, the state issued an emergency regulation to address network issues in Covered California.8 In addition, the state is focusing on continuing delivery system transformation in Medi-Cal to provide better coordinated care for people. Under the proposed Section 1115 waiver renewal, the state aims to undertake efforts to integrate behavioral/physical health, increase attention to social determinants of health, redesign systems for ambulatory care, and coordinate care for high-need populations, among other initiatives.9
Under the ACA, millions of individuals have gained coverage through new provisions, effective as of January 2014, to expand Medicaid and provide premium tax credits for coverage purchased through Health Insurance Marketplaces. In California, coverage gains were substantial, with 2.7 million people gaining Medi-Cal coverage and nearly 1.7 million people determined eligible for enrollment through Covered California between October 2013 and September 2014.1 California is a bellwether state for understanding the impact of the ACA. The state’s sheer size and its high rate of uninsured prior to ACA implementation means that its experience in implementing the ACA has implications for national coverage goals. In addition, California was an early and enthusiastic adopter of the ACA; the state implemented an early Medicaid expansion through its Low-Income Health Program (LIHP) and was the first to create a state-based Marketplace.
While much attention has been paid to enrollment in new coverage options and changes in the uninsured over the past year, less is known about how this coverage has affected people’s lives. To help fill this gap, the Kaiser Family Foundation is conducting a series of comprehensive surveys of the low and moderate-income population. This report uses the California sample of the 2014 Kaiser Survey of Low-Income Americans and the ACA, funded by the Blue Shield of California Foundation, to examine Californian adults that gained coverage and remained uninsured in 2014. It also provides information on how the newly insured view their coverage and any problems they have encountered in using their coverage; how the remaining uninsured and newly insured fare with respect to access to medical care and financial burden; and why people in California continue to lack coverage and their plans for obtaining coverage in 2015. Additional detail on the survey methods is available online.
Background: ACA Implementation in California
Leading up to full implementation of the ACA and during the first year of major coverage expansions, California actively pursued opportunities to expand coverage for residents, conducted outreach and enrollment to bring people into new coverage options, and organized systems to deliver care. The state’s 2010 “Bridge to Reform” §1115 Medicaid Demonstration Waiver included early expansion of Medicaid in most counties through the Low-Income Health Program (LIHP), and in 2014, Medi-Cal coverage was expanded statewide to low-income citizens and legal immigrants. As of 2014, middle-income residents are eligible for premium subsidies to purchase coverage through Covered California. The state took steps to simplify and streamline enrollment such as automatically transitioning individuals from LIHP to Medi-Cal, creating a single online portal for Covered California and Medi-Cal applications, and adopting the Express Lane Enrollment Project to target adults and children enrolled in California’s Supplemental Nutrition Assistance Program. The state also invested heavily in outreach and enrollment efforts for both Medi-Cal and Covered California. These included statewide marketing campaigns, community mobilization and targeted efforts to reach vulnerable populations.
Despite all these efforts, the state—like all states—experienced outreach and enrollment challenges in 2014. Organizations and individuals in California cited a shortage of in-person assisters, problems with cultural and linguistic resources, technological issues with the Covered California website, and a Medi-Cal backlog, which led to delayed or abandoned applications. The agency received criticism for not doing more to reach hard-to-reach populations, particularly Hispanics and immigrants with Limited English Proficiency (LEP). These challenges notwithstanding, the state enrolled unexpectedly large numbers of people in 2014. In late 2014 and 2015, the state was taking action to address many of the challenges it faced during the first open enrollment period.
Who gained coverage and who remained uninsured?
Examining characteristics of the previously insured, newly insured and remaining uninsured are important to understanding who gained and who was left out of coverage in 2014 and targeting ongoing outreach.
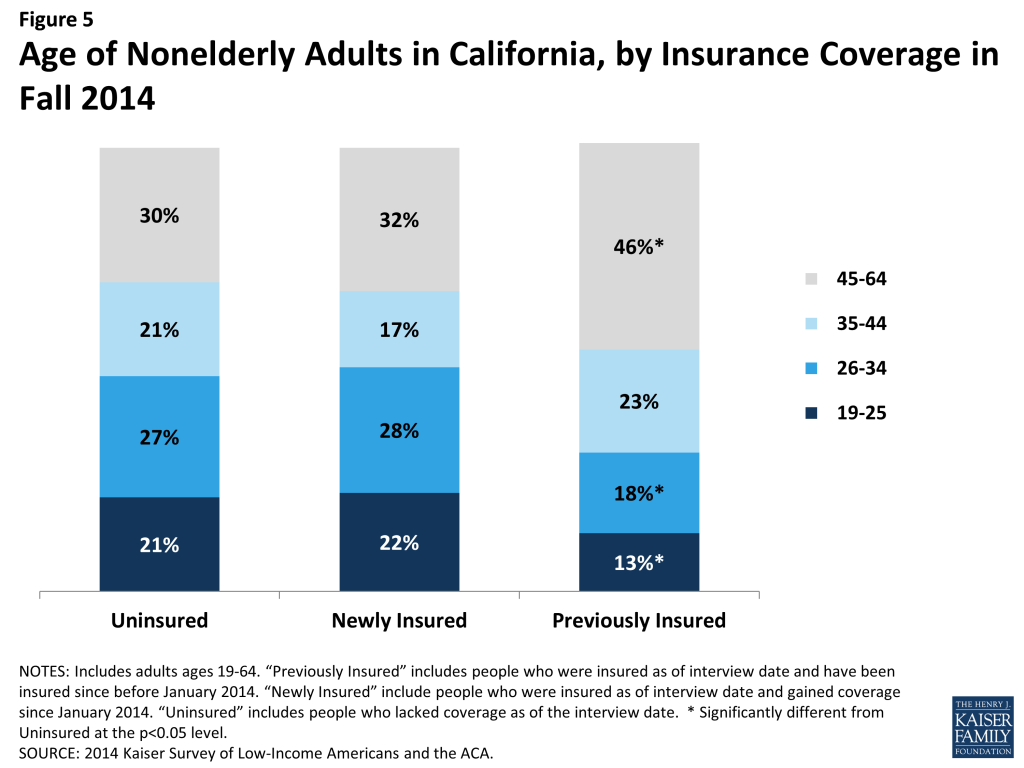
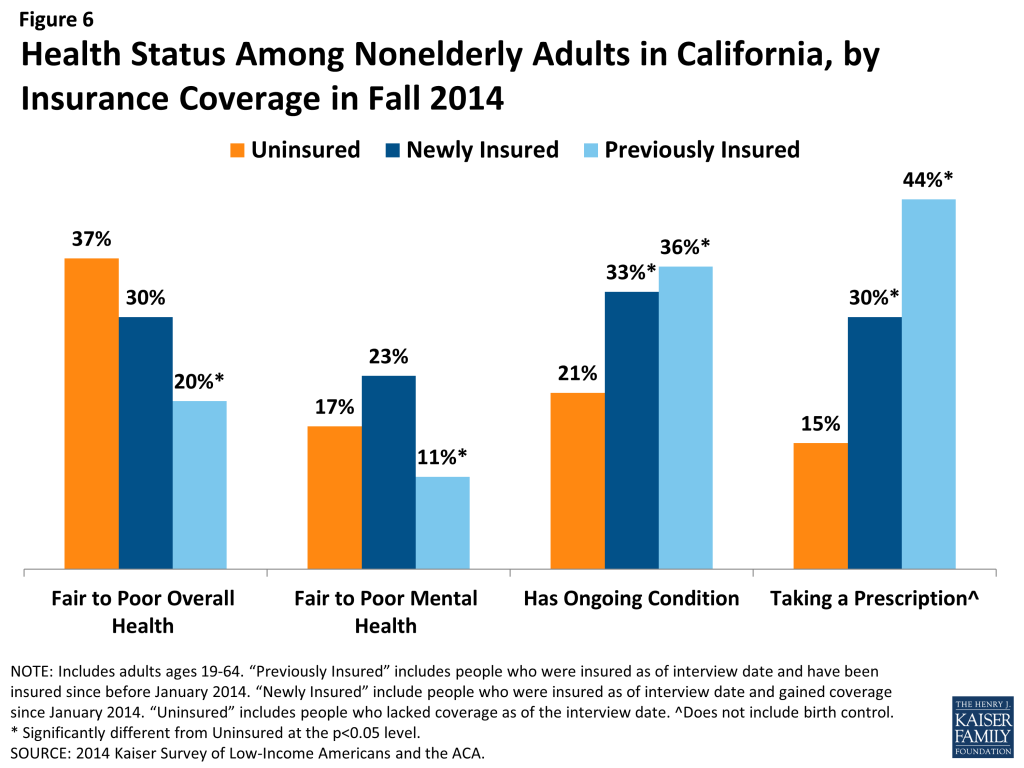
The newly insured and remaining uninsured populations resemble each other with respect to income, age, and health status and have different characteristics from the previously insured. The vast majority of newly insured (94%) and uninsured adults (86%) in California meet the income requirements for Medi-Cal or subsidies in Covered California (below 400% FPL), compared to just over half of the previously insured (57%). In addition, the share of uninsured (21%) and newly insured (22%) who are young adults (age 19-25) were about the same, while previously insured were less likely to be young adults (13%). While there are no significant differences in the share of uninsured (37%) and newly insured adults (30%) who say their health is fair or poor, uninsured adults are less likely than adults with coverage to have a diagnosed medical condition. These patterns indicate that older or sicker individuals did not disproportionately take up coverage in 2014.
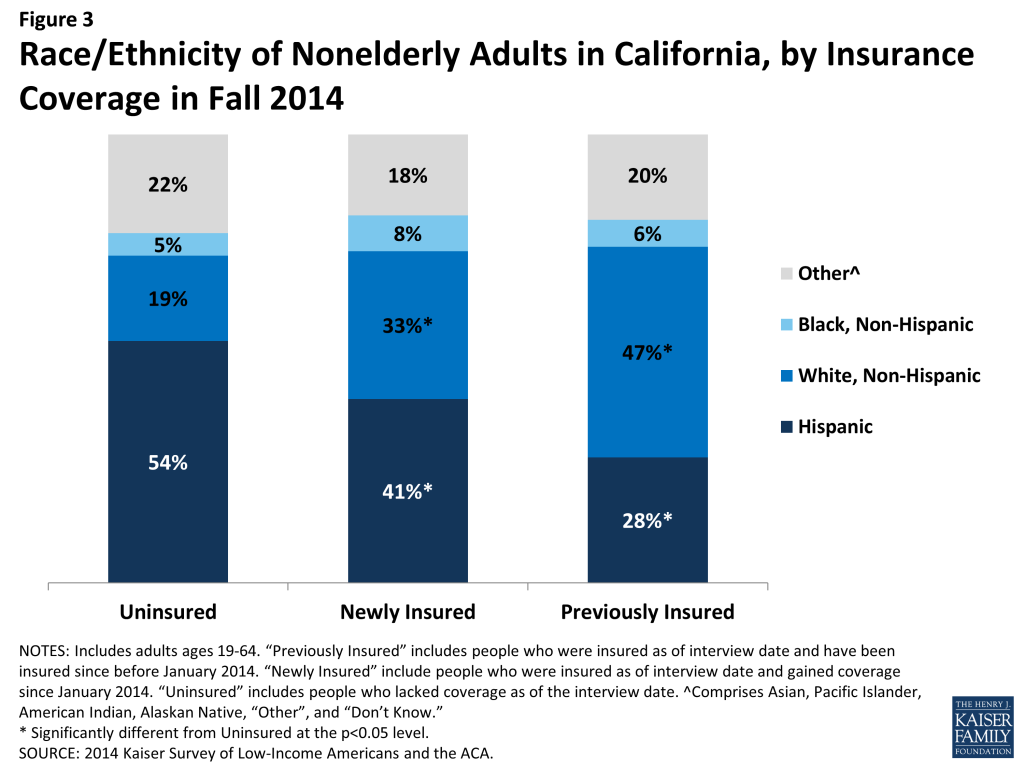
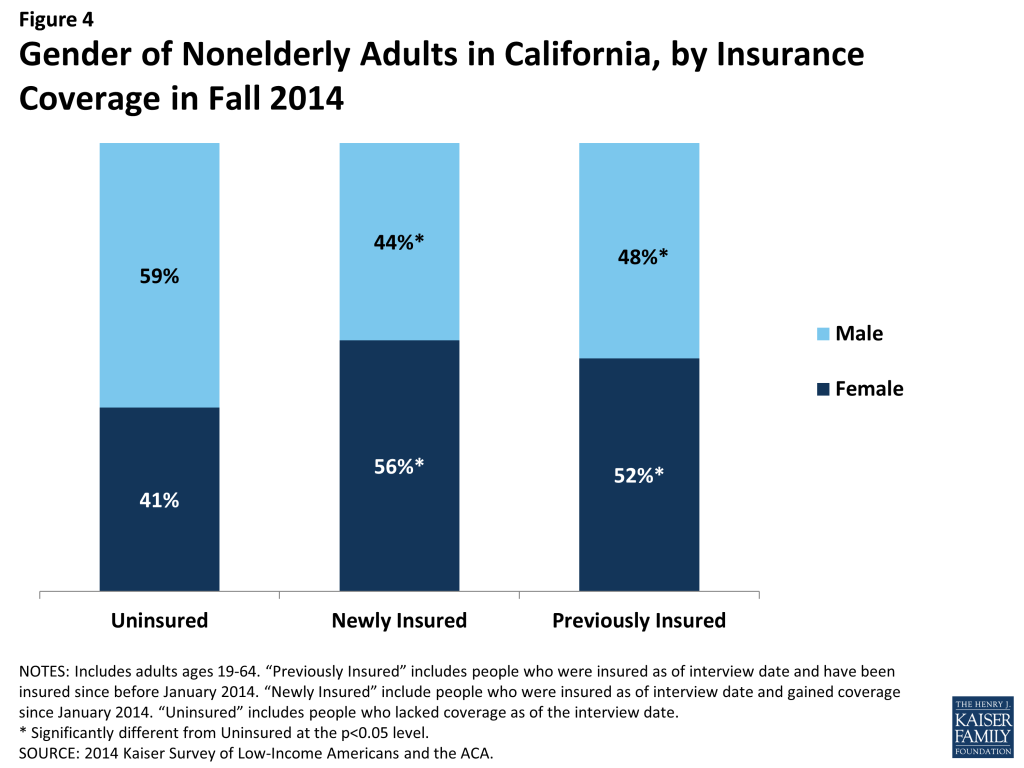
However, the insured and uninsured populations in California differ on some important factors, such as race/ethnicity, work status, gender and immigration status. Mirroring historical patterns and legal barriers to coverage, the remaining uninsured population is more likely than the insured to be Hispanic, to be male and to be undocumented. The high share of remaining uninsured who are Hispanic may reflect barriers in outreach to this population or eligibility limits based on immigration. Though most newly insured and uninsured adults are in a family with a full or part-time worker, the specific work profile differs between groups: newly insured adults are less likely than remaining uninsured adults to be in a family with a full-time worker (versus only a part-time worker). With new coverage provisions in place as of 2014, there were more options for health insurance outside employment, and groups traditionally left out of the employer based system—such as part-time workers or low-wage workers—had new avenues for coverage.
Who is covered by different programs in California?
Understanding the profile of the population covered by different types of insurance in the state is essential to designing effective health plans to serve their needs. With the expansion of Medi-Cal, the program grew to include individuals not traditionally covered by the program, which has changed the profile of the overall program in some ways. The profile of Covered California enrollees shows that the program is playing an essential role in covering groups that have been left out of coverage expansions in the past.
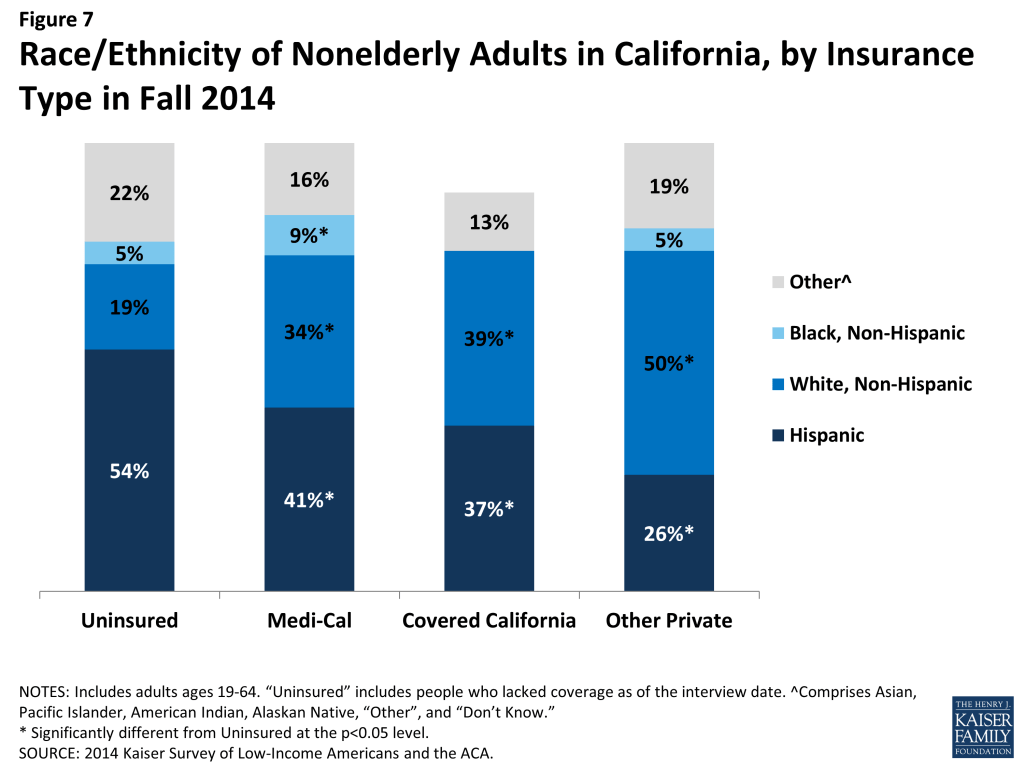
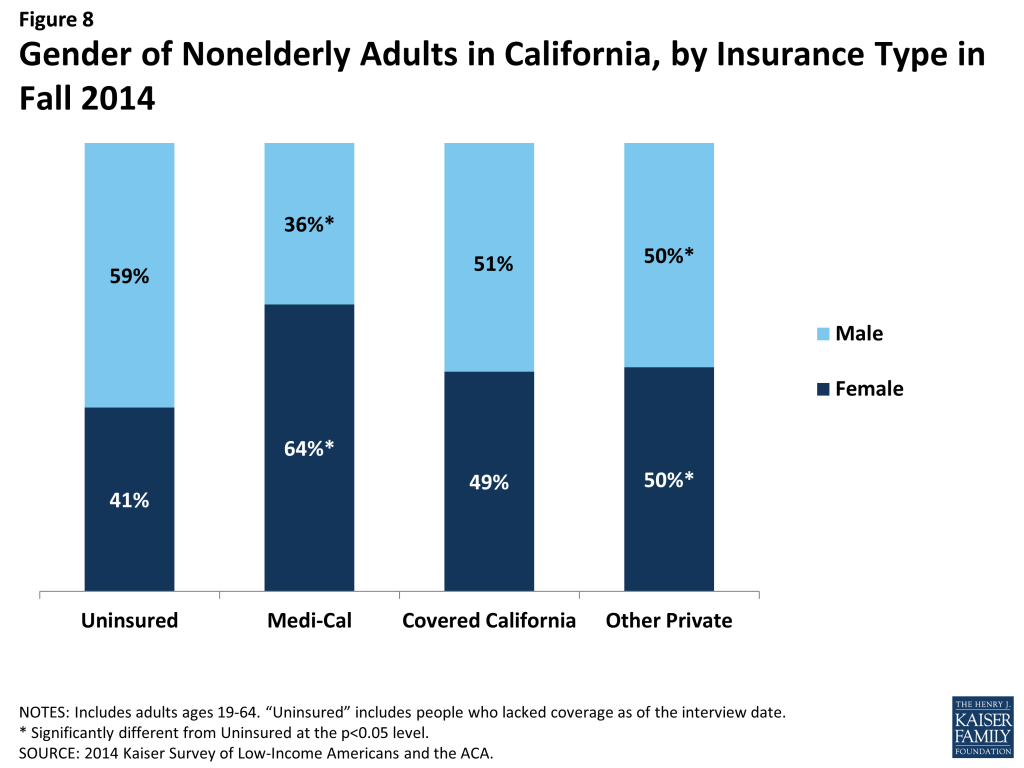
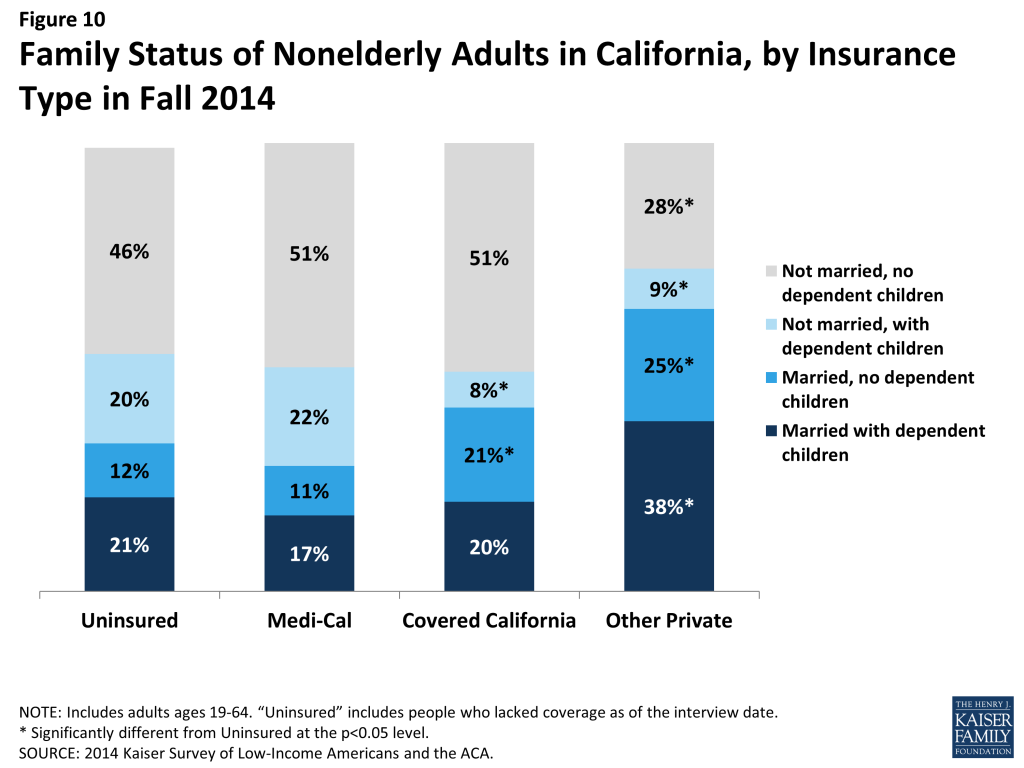
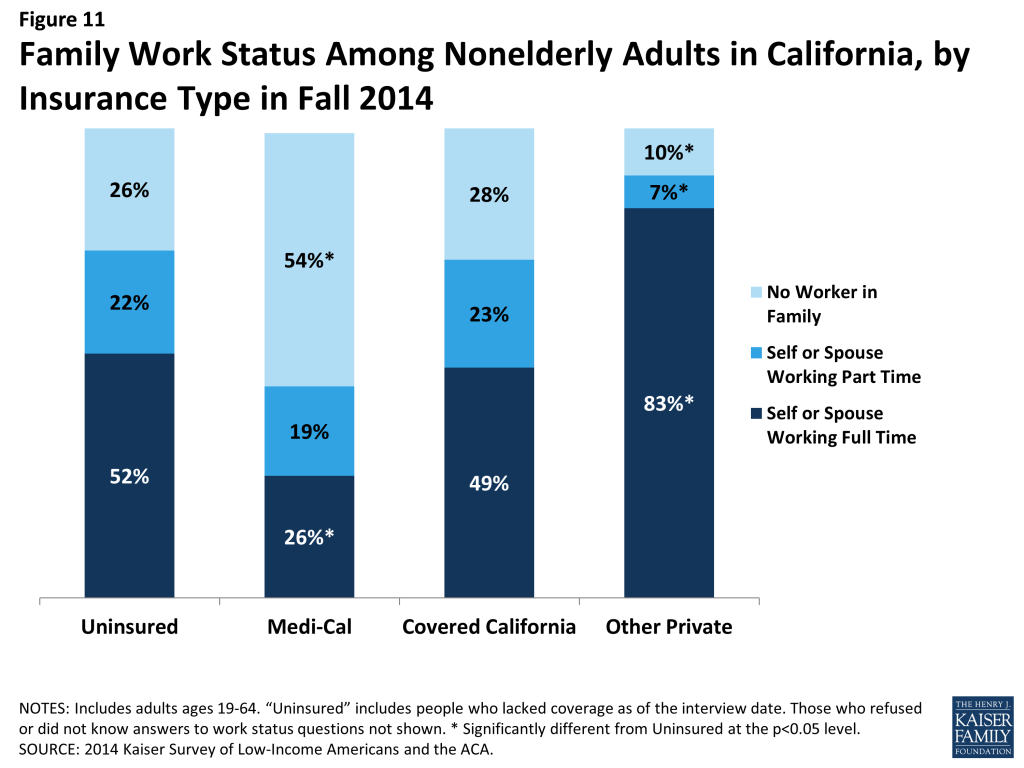
Medi-Cal and Covered California enrollees are more likely to be racially diverse, and are made up primarily of working adults without dependent children. Whereas half of those with other private insurance identify as White Non-Hispanic, two-thirds of Medi-Cal and 60% of Covered California enrollees identify as a person of color. Adults without dependent children have generally been excluded from public coverage and assistance in the past, but in 2014, 62% of adult Medi-Cal enrollees and 72% of adult Covered California enrollees did not have dependents. Further, about half of Medi-Cal and nearly three-quarters of Covered California adults are in a working family, though a larger share of adults in Covered California are in a family with a full-time (49% vs. 26%) or part-time (23% vs. 19%) worker. By gender, nearly two-thirds (64%) of adults covered by Medi-Cal are female, compared with about half of adults with Covered California or other private coverage.
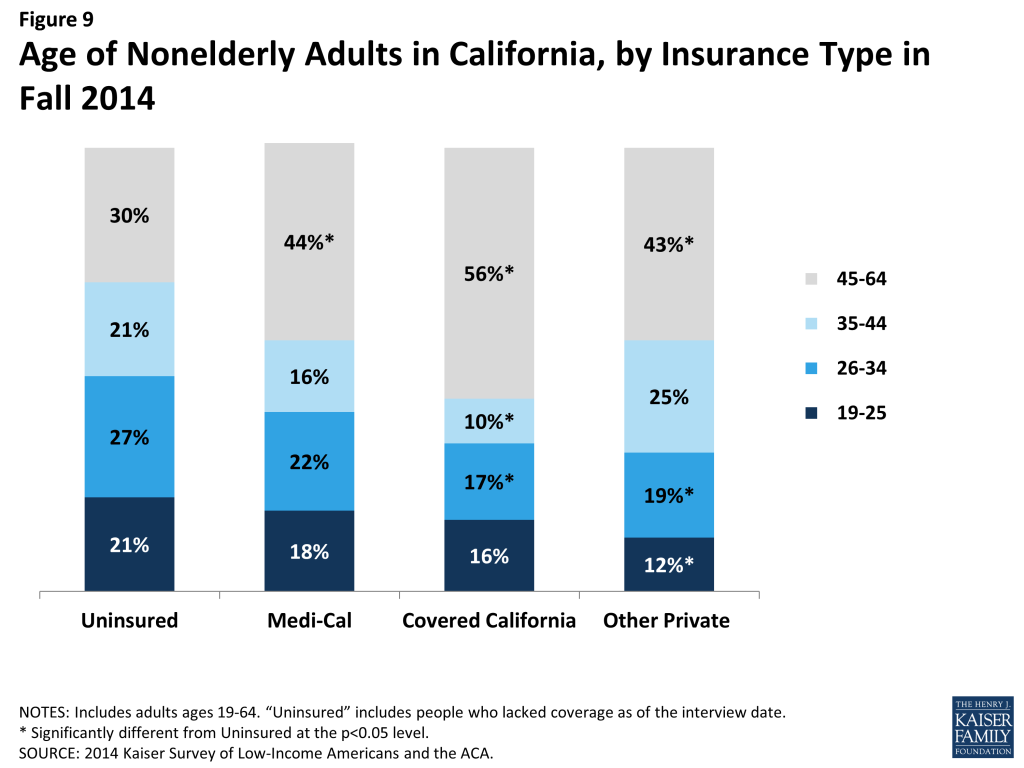
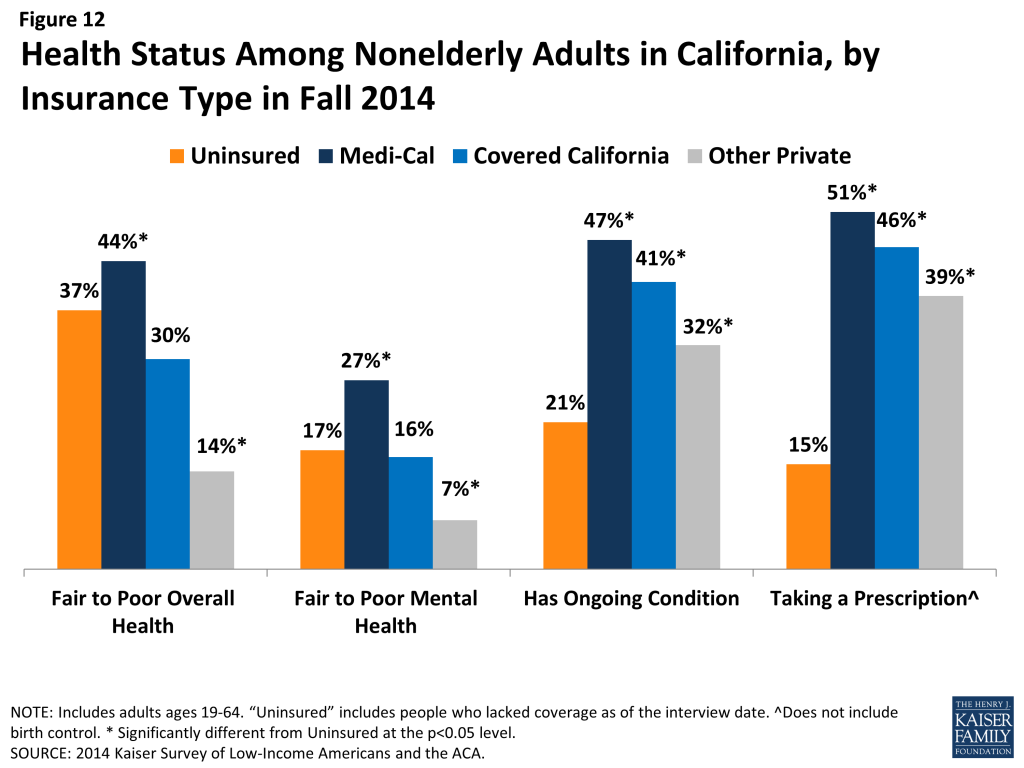
Though the adult Medi-Cal population is younger than that of other coverage groups, enrollees have poorer health status. Forty percent of adult Medi-Cal enrollees are under age 34, compared to about a third of Covered California adults and adults with other private coverage. Notably, more than half of adults enrolled in Covered California are over age 45. Nonetheless, Medi-Cal retains many of its traditional roles of serving many individuals with substantial health needs: In 2014, Medi-Cal beneficiaries were more likely than adults with other types of coverage to say their physical health or mental health was fair or poor and more likely to have an ongoing health condition.
What has happened to access to care for the insured and remaining uninsured?
The ultimate goal of expanding health insurance coverage is to help people access the medical services that they need. The survey findings reinforce a large body of literature showing that adults with coverage have better access to care than those who remain without coverage.
Newly insured adults were more likely to change where they usually go for care than their previously insured counterparts, but clinics remain an important source of care for newly insured adults. Newly insured adults were more likely than those who remained uninsured to have a usual source of care and a regular doctor at their usual source of care. Of those, nearly a fifth (19%) reported changing where they usually go for care since gaining coverage, and most said it was due to their insurance. These rates were higher than those among the previously insured. Still, both uninsured and newly insured adults with a usual source of care are most likely to use a clinic or health center for that care, compared with previously insured adults who were most likely to use a doctor’s office or HMO. When asked why they chose their site of care, more than a third (37%) of uninsured adults say they use their usual source of care because it is affordable, compared with 40% of newly insured who chose it because it was convenient.
Adults with insurance coverage were more likely than the uninsured to have used medical services or received preventive care. More than half (58%) of newly insured adults said that they used at least one medical service since gaining their coverage, and nearly half (47%) had received a preventive visit or check-up. Still reflecting some unmet need, more than a third of newly insured adults (35%) reported that they postponed or went without needed care, the same share as the uninsured. Among those who do have coverage, postponing care could be related to several factors, including difficulty finding a provider, problems navigating the health system and health insurance networks, misunderstanding of how to use coverage and when to seek care, or concerns about out-of-pocket costs.
Though most adults did not report problems getting appointments, adults with Covered California or Medi-Cal were more likely than those with other private coverage to say a provider would not see them due to coverage. Compared to only 3% of adults with other private coverage, 13% of adults with Covered California and 8% of adults with Medi-Cal say a provider would not take them as a patient because of their coverage. Medi-Cal enrollees also reported higher rates of long waits for appointments (21%) than those with other private coverage. Like the forces underlying choice of usual source of care, these issues may reflect continuing problems with network adequacy, despite the existence of state standards for network adequacy and patient access.
How do people view their coverage?
People’s views of their plan may affect not only their use of their coverage but also the likelihood that they re-enroll in coverage or change plans. Survey findings indicate that, while most people do not report problems with their plan, additional education may be needed to help newly insured people understand their coverage.
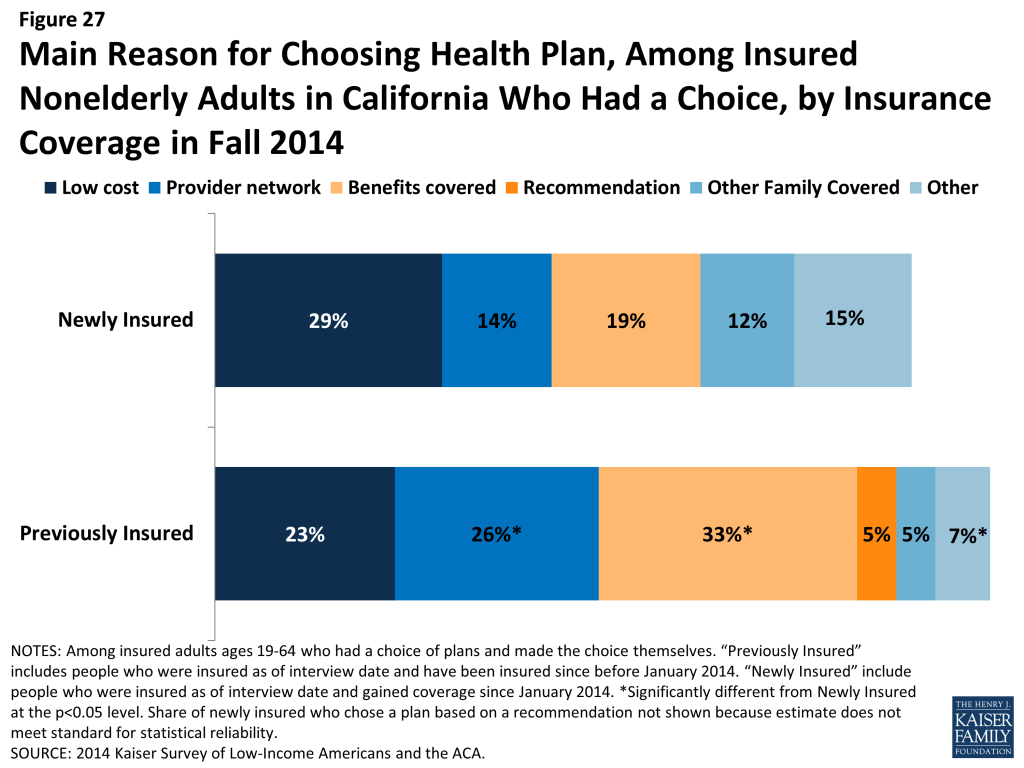
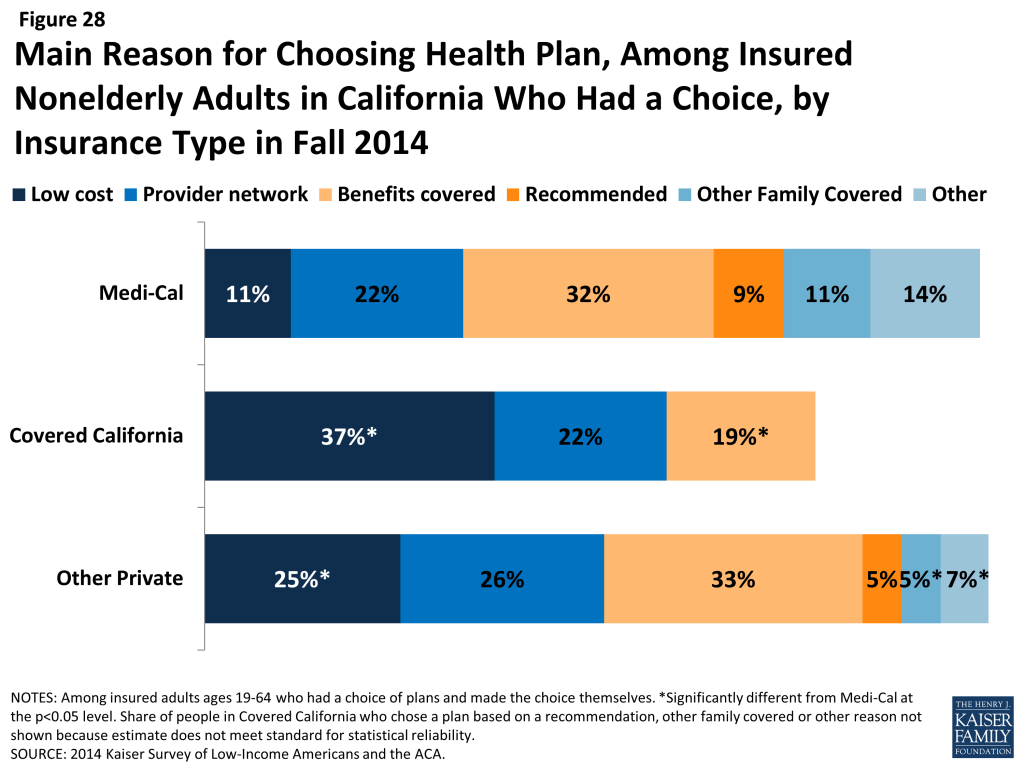
Newly insured adults were less likely to prioritize scope of coverage or provider networks in choosing their plan than previously insured adults. Less than a fifth (19%) of newly insured adults say they chose their plan because of the benefits covered, compared to 33% of previously insured adults, and only 14% say they chose their plan based on provider network (versus 26% of previously insured). Rather, newly insured adults were most sensitive to price when choosing their plan, with nearly a third saying they chose based on price. These patterns likely reflect regulations requiring similar scope of benefits across new plans and ongoing price sensitivity among low and middle income adults.
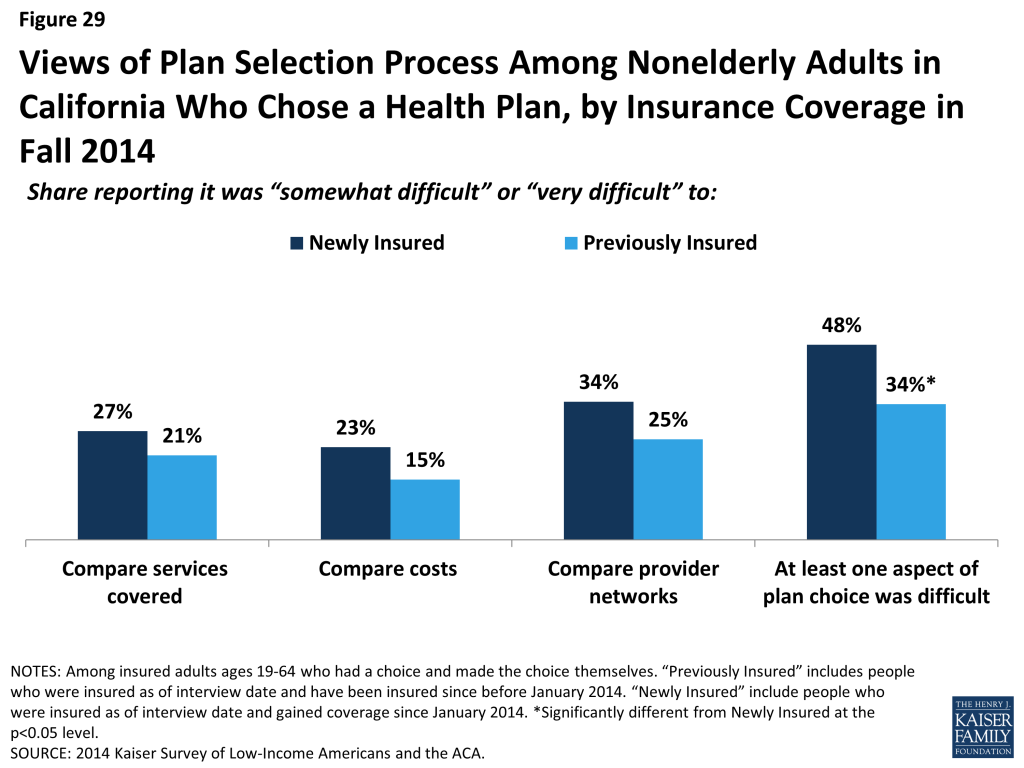
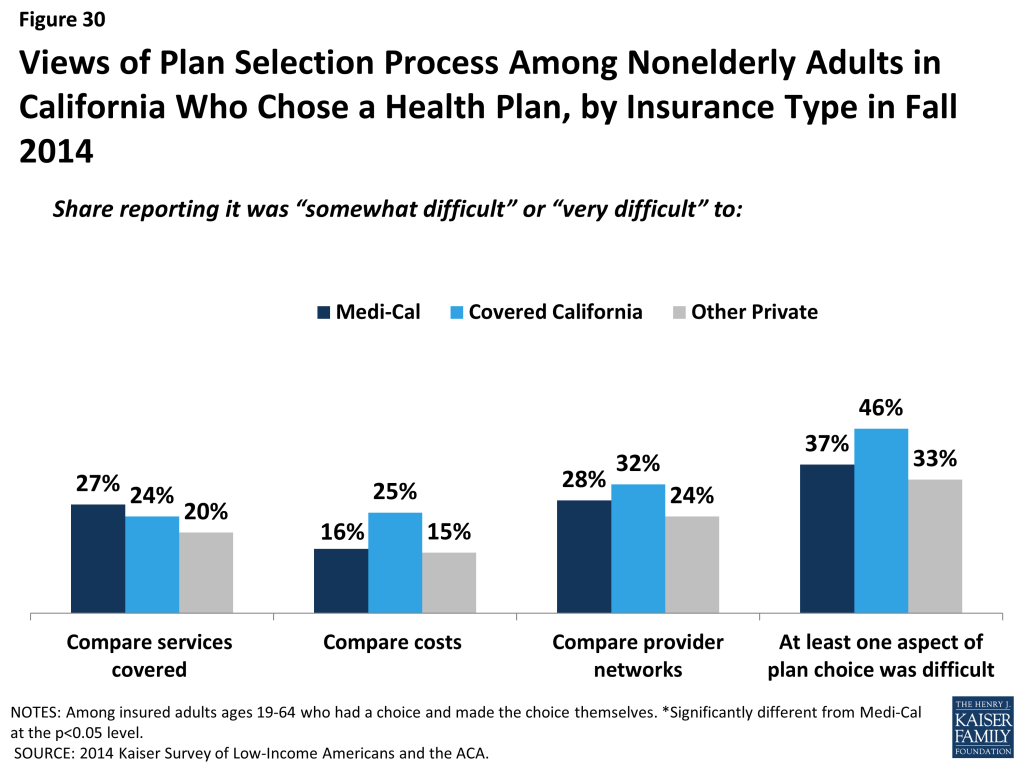
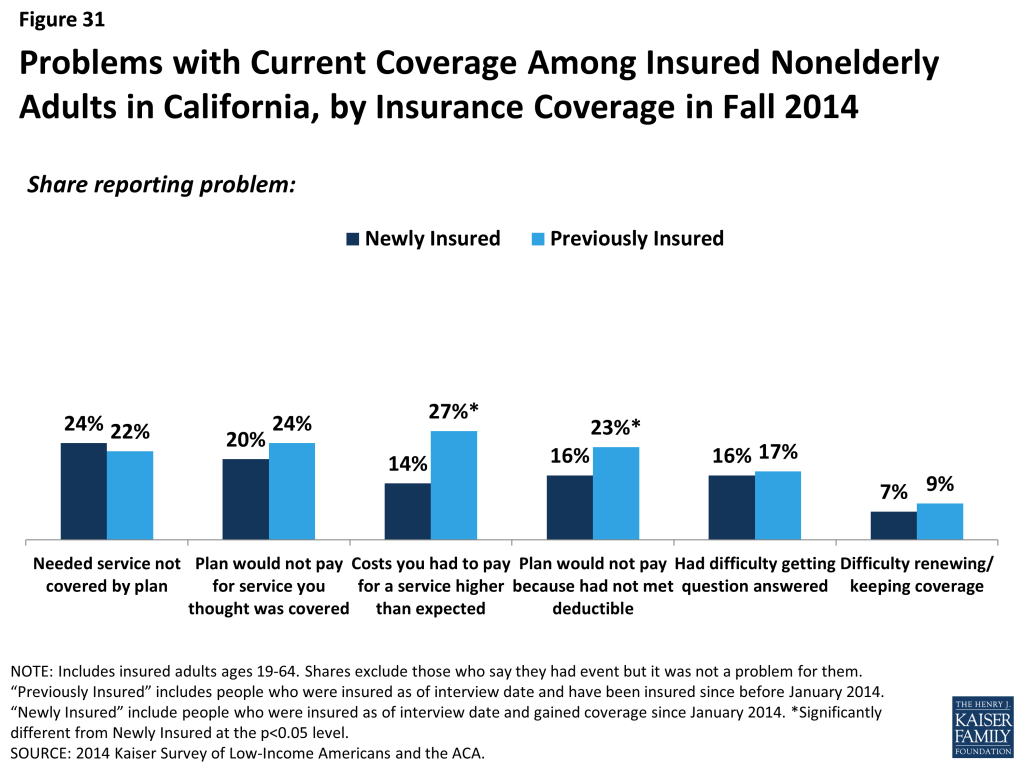
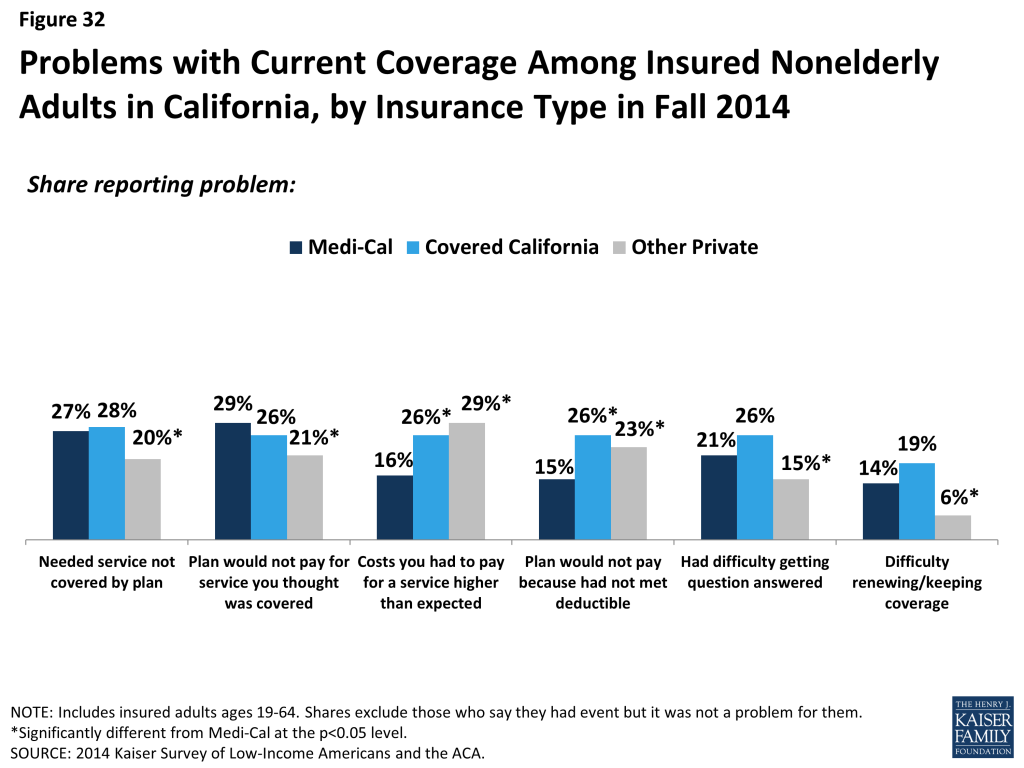
Across coverage groups, most insured adults did not report having difficulty with the plan selection process or other specific problems with their health plan. There were no significant differences across groups comparing services, costs, or provider networks across plans, though the newly insured were more likely than the previously insured to report at least one difficulty (48% versus 34%). When asked specifically if they encountered various problems with their coverage, such as scope of coverage, costs, or customer service, newly insured adults reported similar or lower rates than previously insured.
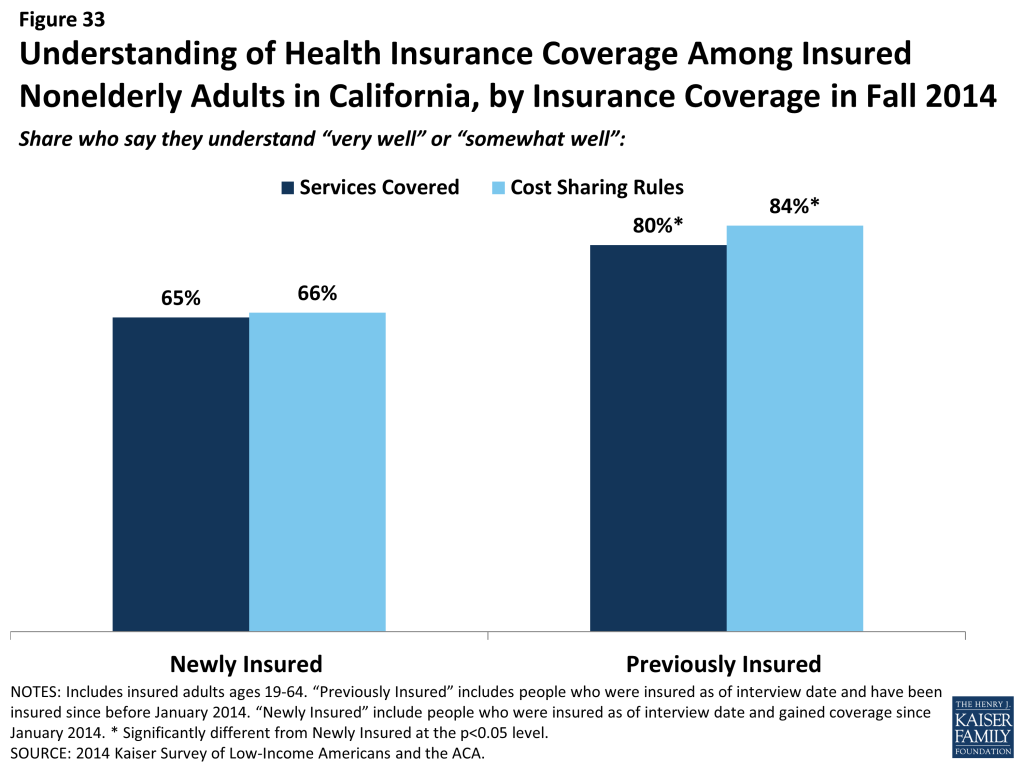
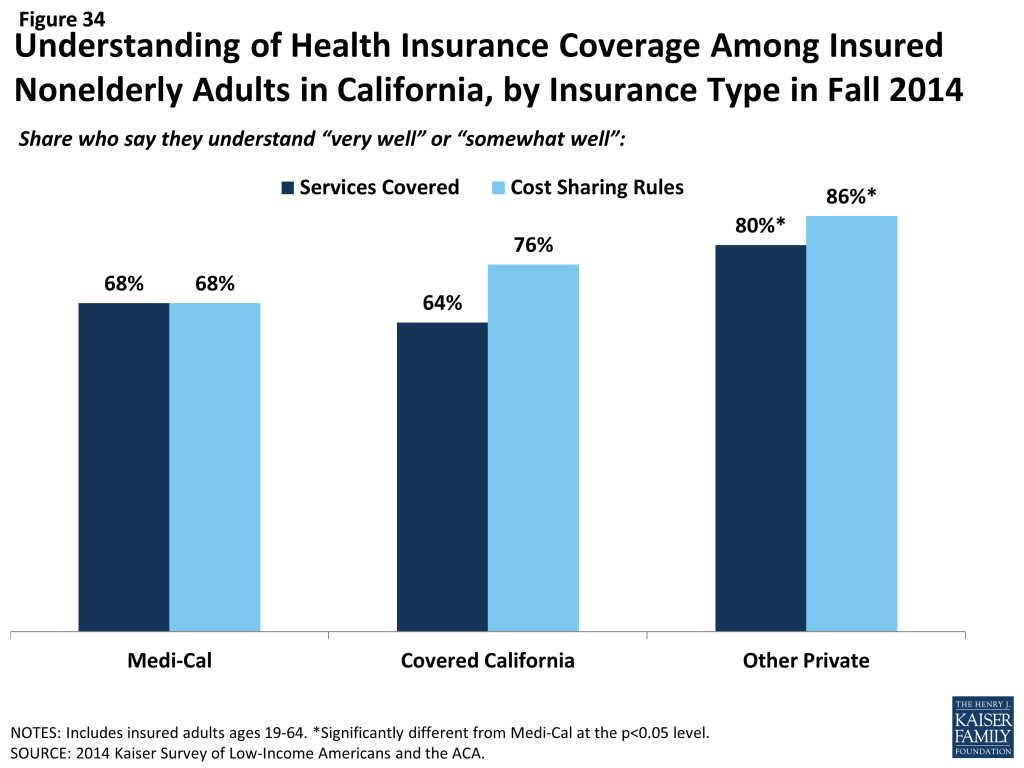
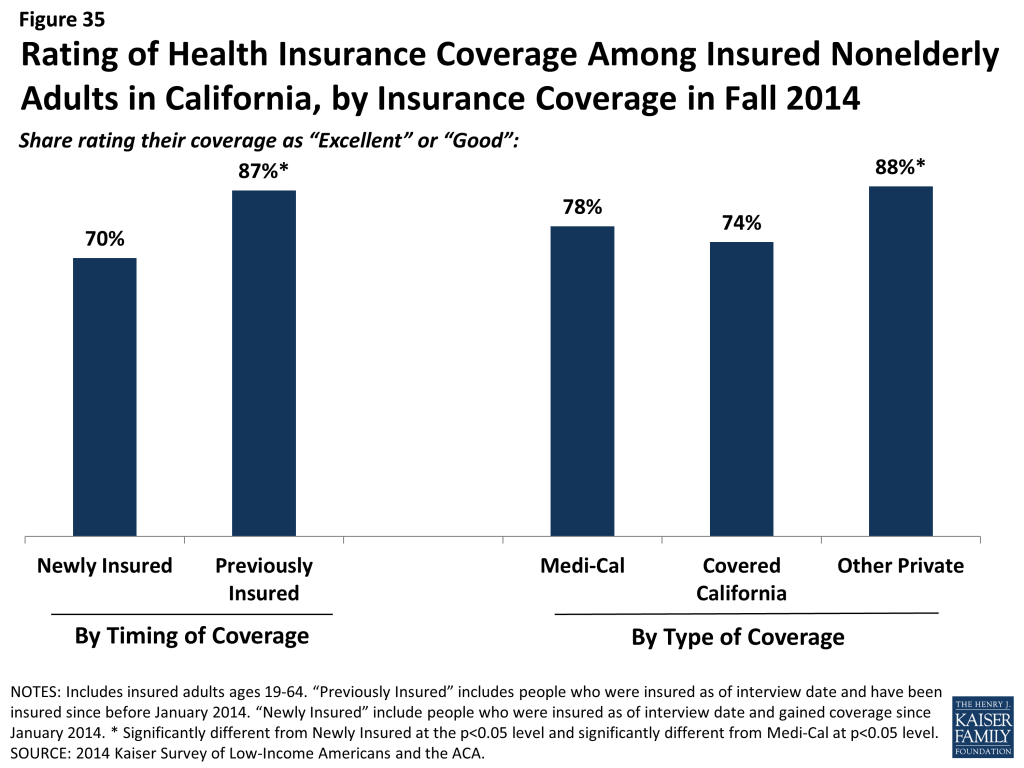
Newly insured adults were less likely than previously insured to understand the details of their plan and to give their health plan high ratings. Compared with the previously insured, newly insured adults were less likely to say they understand the services their plan covers (65% vs. 80%) or how much they would have to pay when they visit a health care provider (66% vs. 84%) “very well” or “somewhat well.” Though 70% of newly insured adults rate their coverage as “excellent” or “good” (versus “not so good” or “poor”), this rate was lower than that among previously insured adults (87%). It is possible that newly insured adults face challenges in understanding the complexity of insurance coverage, especially since many adults who were uninsured before the ACA reported that they had never had health insurance.
How does coverage affect financial security?
Health care costs can be a major burden for low-income families. Survey findings indicate that while coverage can ameliorate some of the financial challenges that low and moderate income adults face, many will continue to face financial challenges in other areas of their lives.
Many Covered California enrollees report difficulty paying their monthly premium. Nearly half of newly insured adults (47%) say it is somewhat or very difficult to afford their monthly premium, compared to just 27% of adults who were insured before 2014. Further, 44% of Covered California enrollees report difficulty paying their monthly premium, versus a quarter of adults with other types of private coverage.
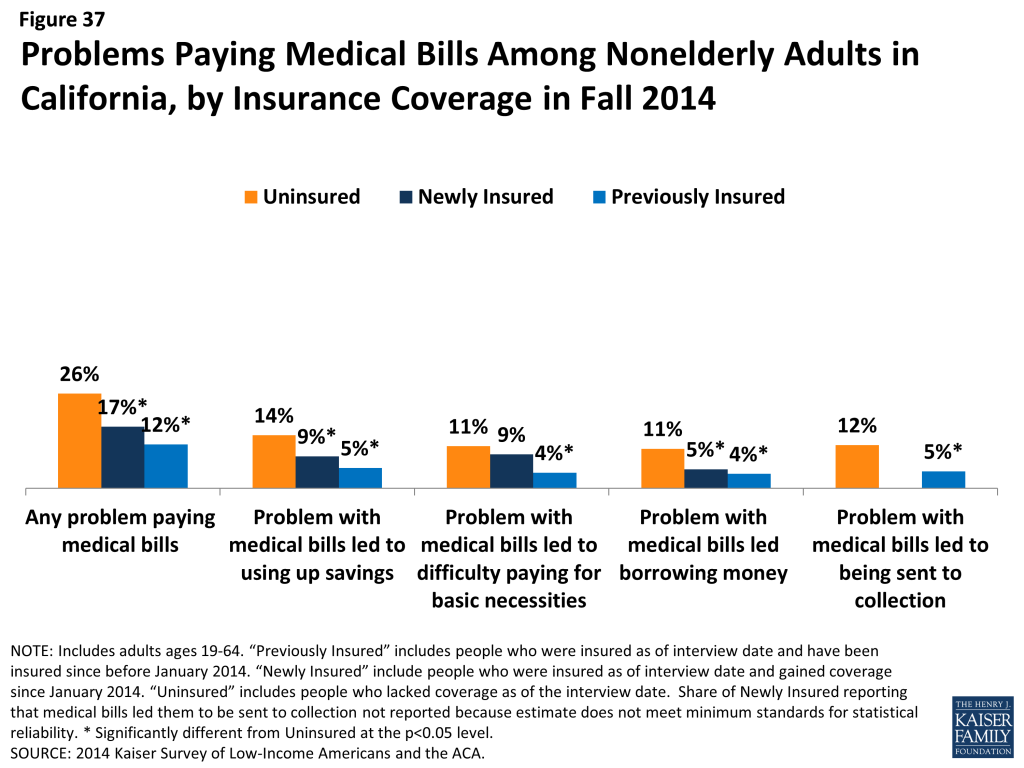
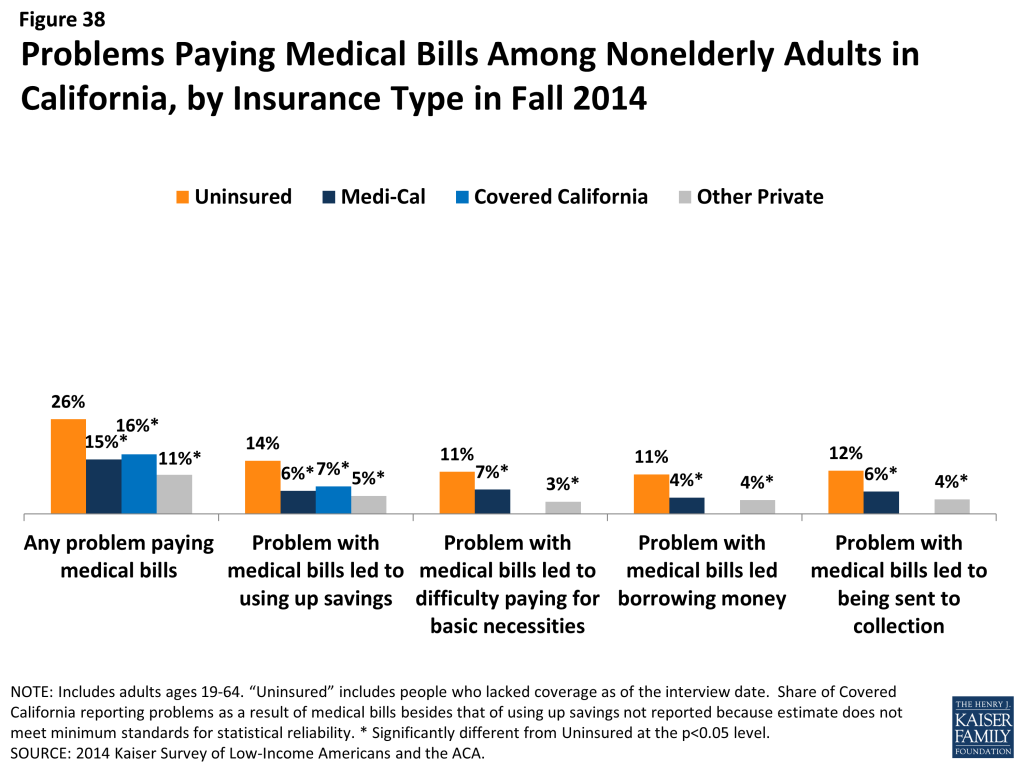
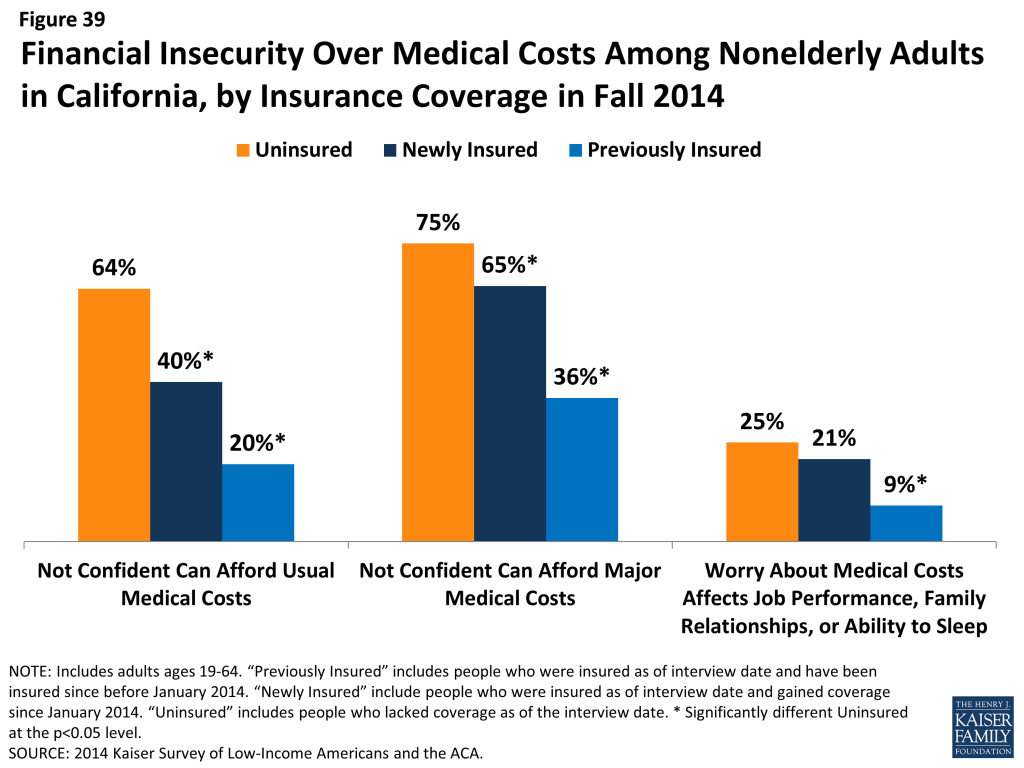
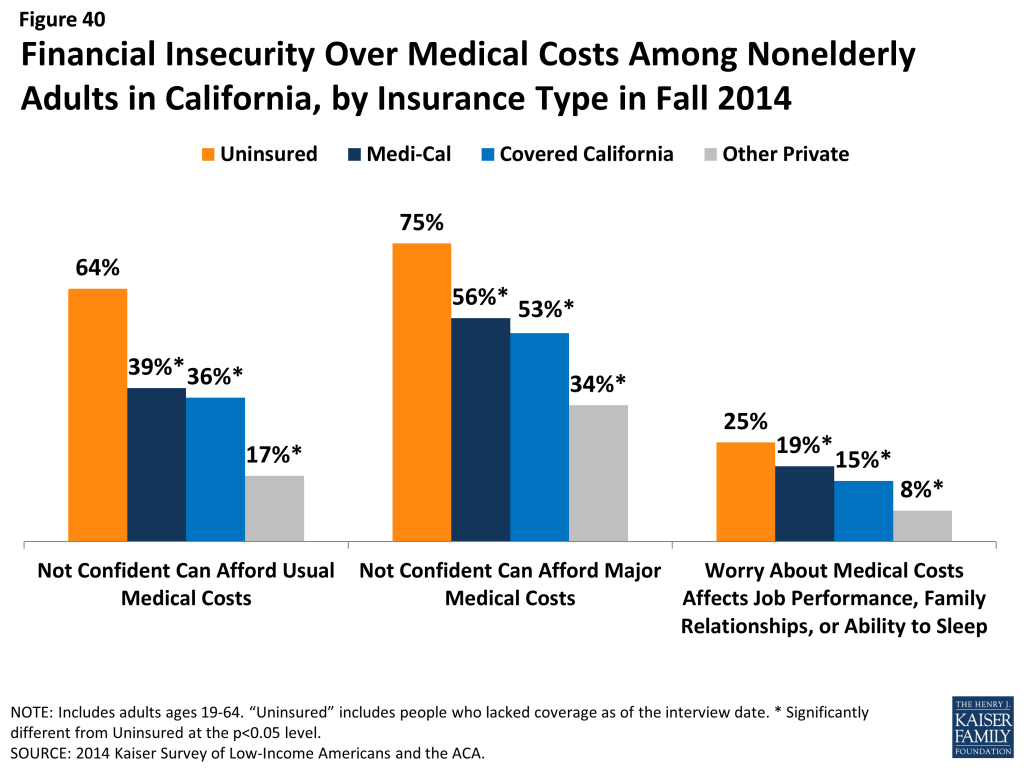
However, coverage does provide financial protection from medical bills and eases concern over affording medical care. Compared to the uninsured, both newly insured and previously insured adults report lower rates of difficulty paying medical bills and living with worry about their ability to afford medical care in the future.
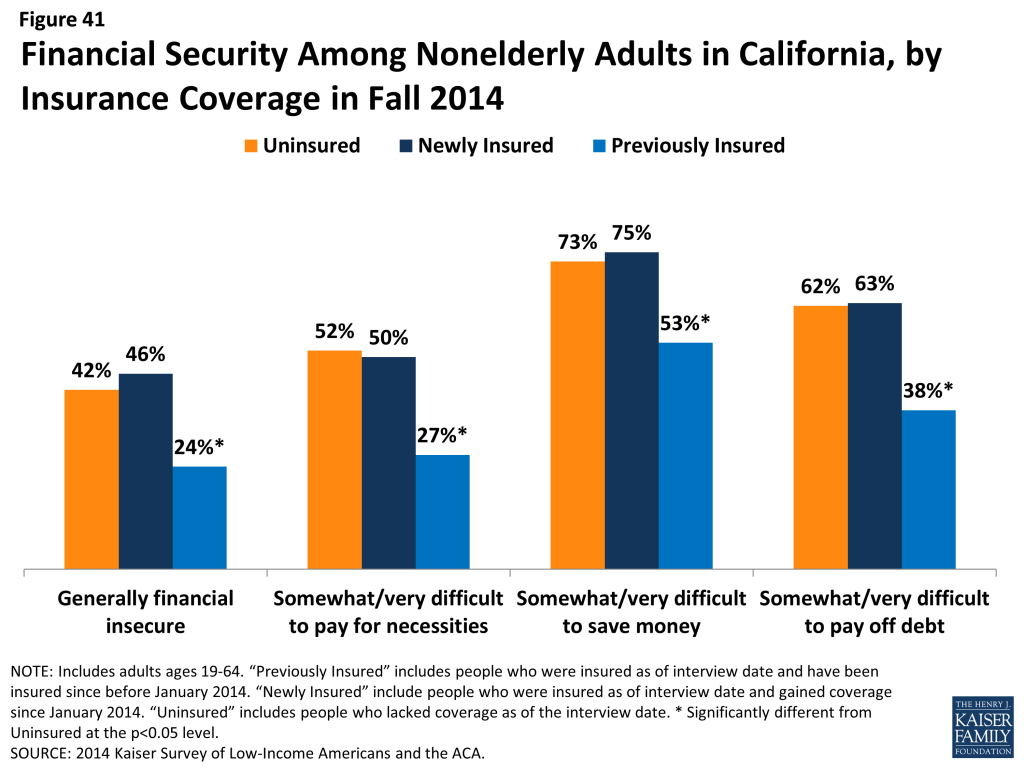
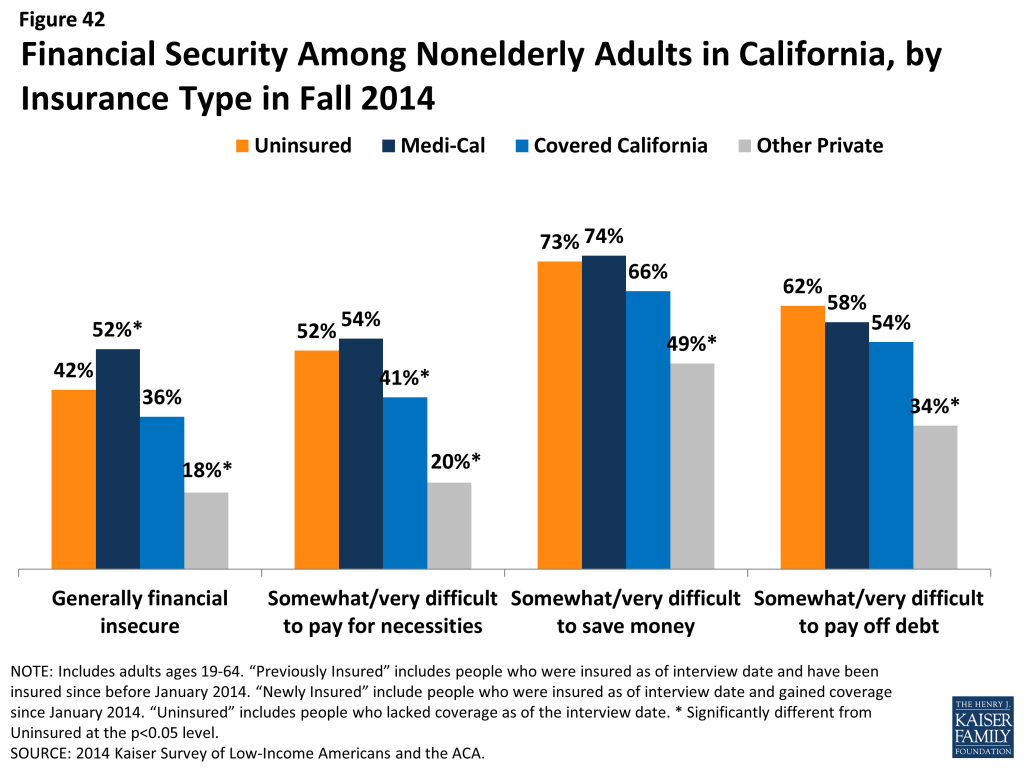
Many newly insured adults still face financial insecurity in areas outside of health care costs. While coverage provides some financial protection from medical bills, there were no significant differences in the share of uninsured and newly insured adults reporting difficulty paying for necessities, saving money, or paying off debt. Previously insured adults were less likely than uninsured to report these challenges.
Why are people still uninsured and what are their coverage options?
Though much attention was paid to the difficulties with the application and enrollment process during the 2014 open enrollment period, logistical issues were not a leading reason why people went without insurance in 2014. Rather, lack of awareness of new coverage options and financial assistance appear to be a major barrier.
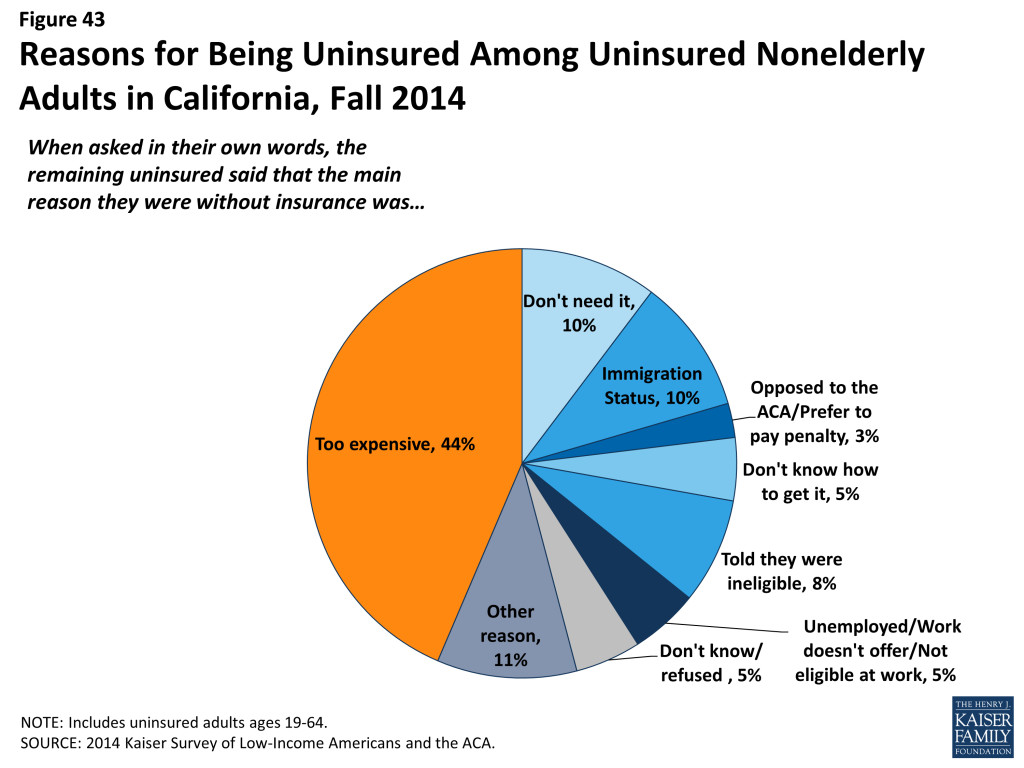
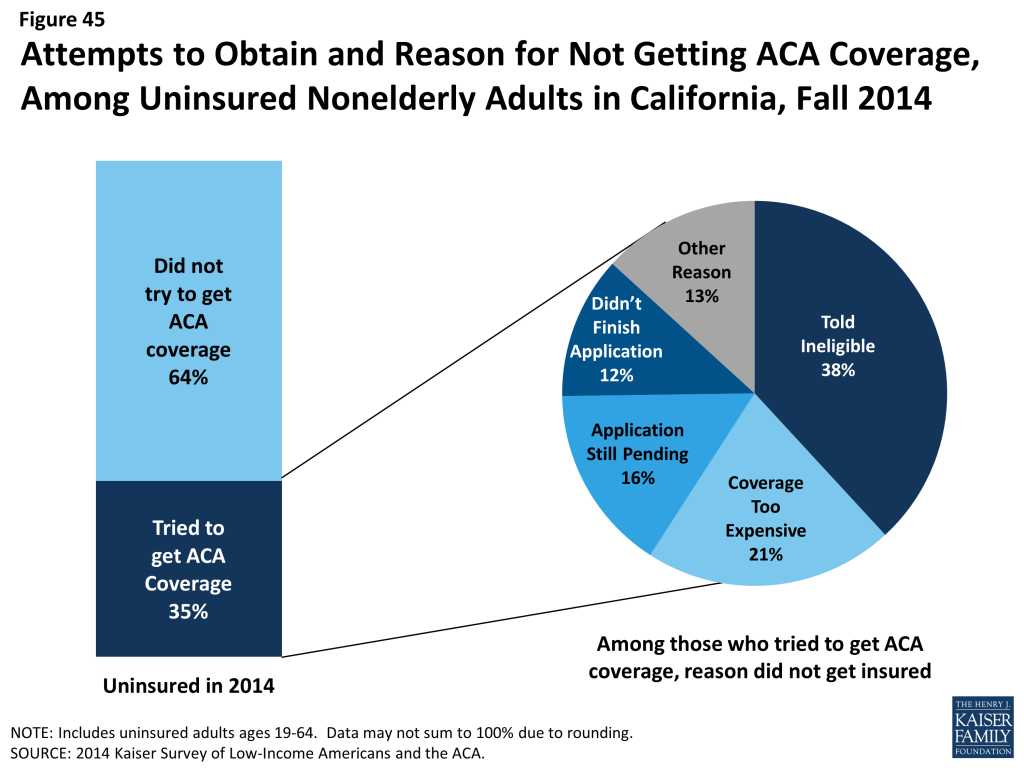
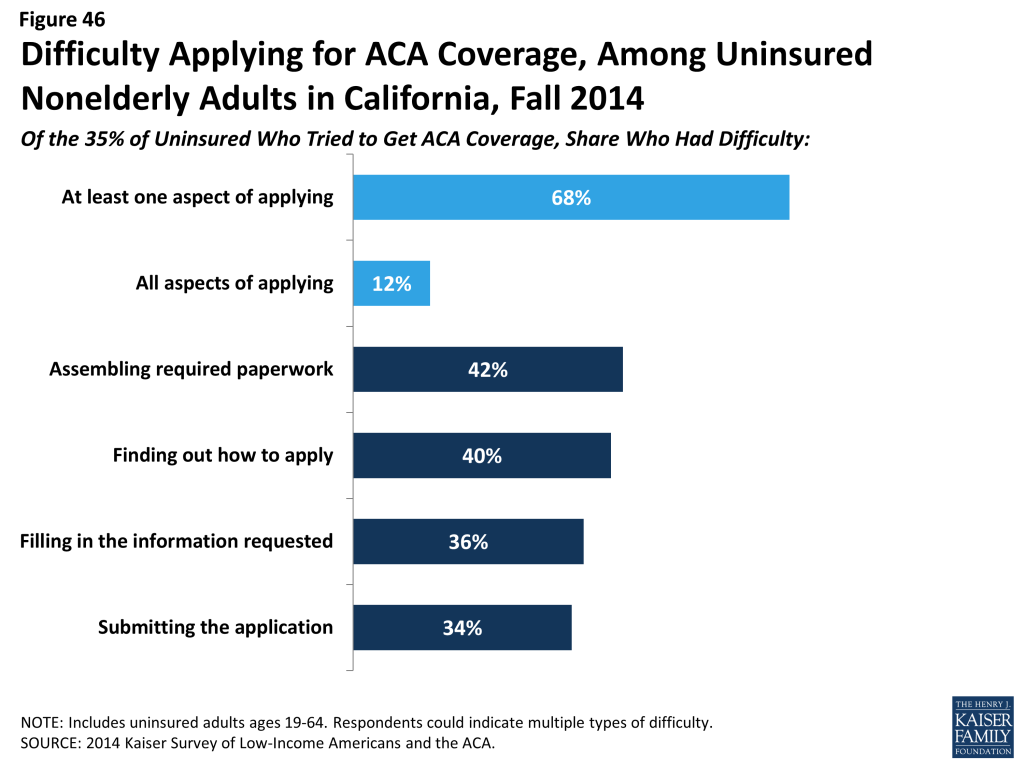
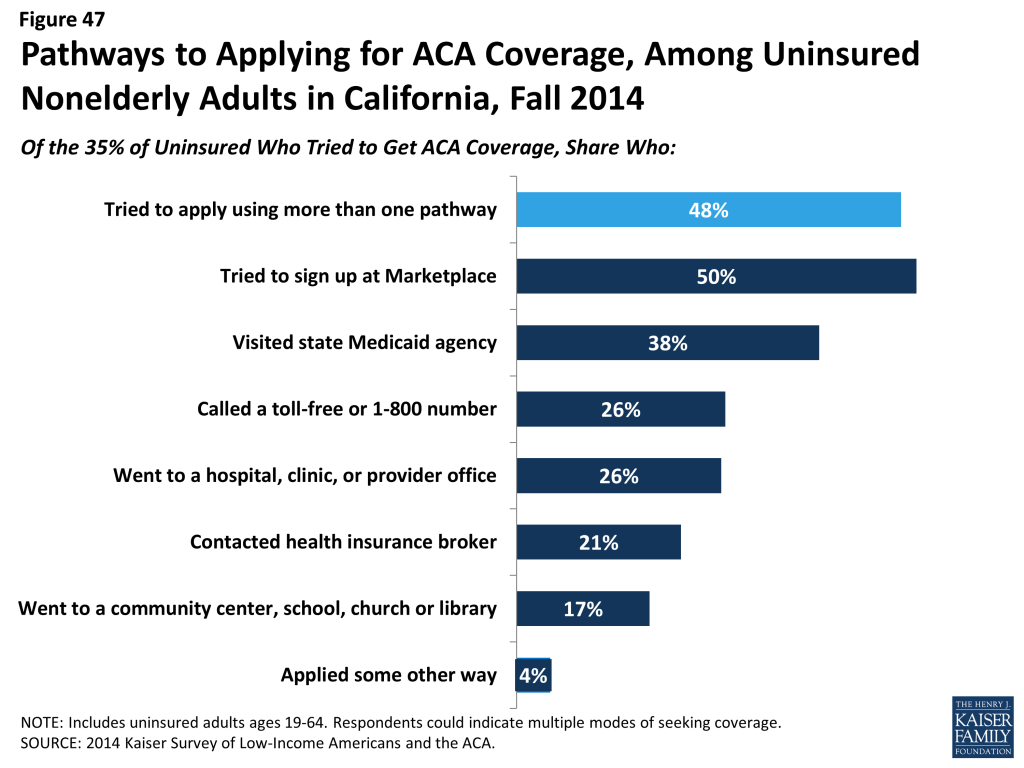
Most adults who were uninsured in fall 2014 had not tried to get ACA coverage, and perceptions of cost and eligibility were a common reason for not obtaining coverage. The main reason that all uninsured gave for why they lack coverage is that it is too expensive (44%). Among the roughly one-third of uninsured who tried to sign up for ACA coverage, the most common reason people gave for not having ACA coverage was being told they were ineligible (38%) or because it was too expensive (21%). Still, when asked directly about application difficulty, most uninsured adults who sought ACA coverage reported difficulty with at least one aspect of the process, and most tried more than one avenue.
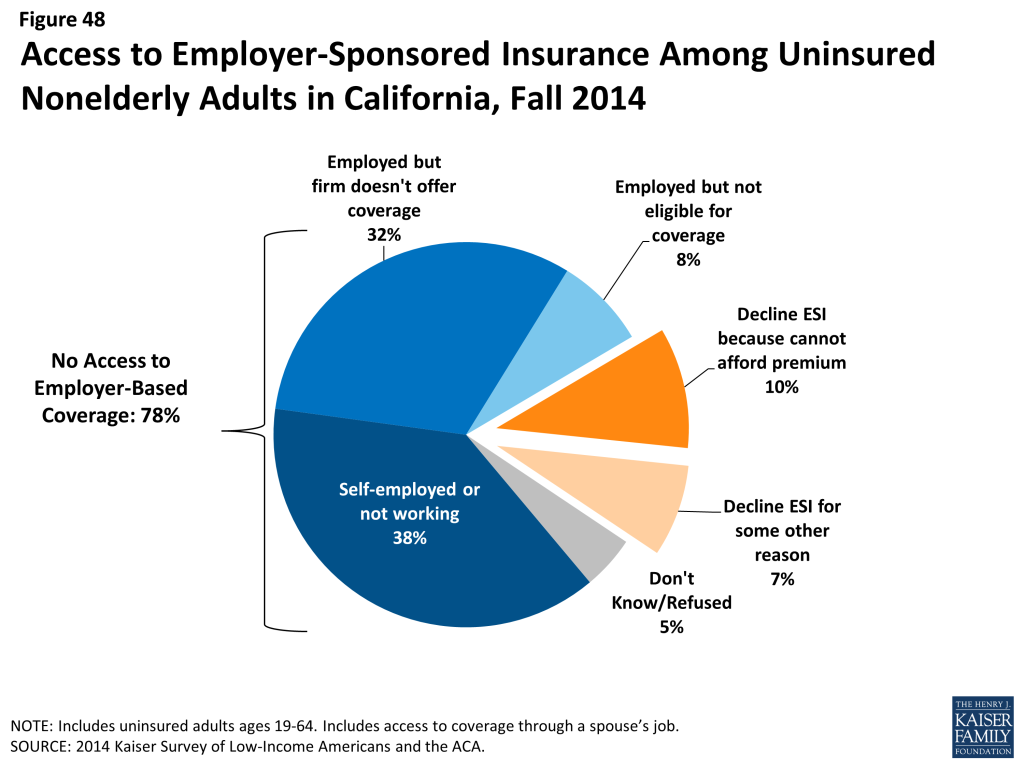
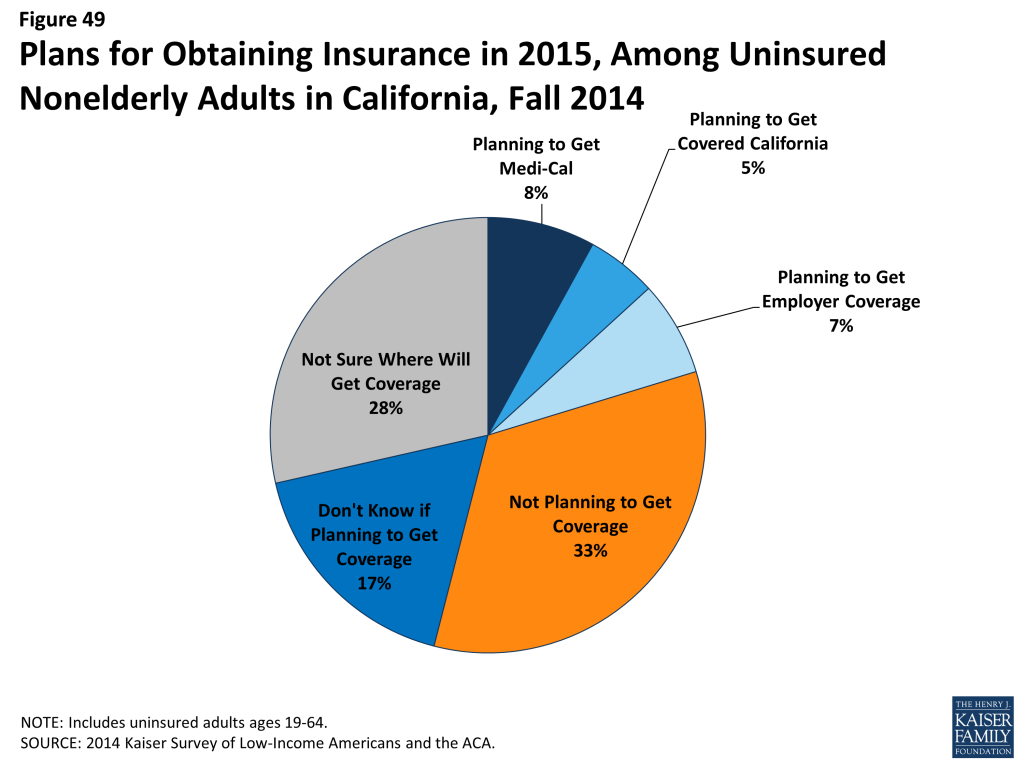
Few adults who were uninsured at the end of 2014 had plans to obtain ACA coverage in 2015. Only about half of uninsured adults indicated that they plan to get coverage in 2015, and few who do identified Medicaid or Marketplace coverage as their goal. Rather, higher shares indicate that they don’t know where they will get coverage or plan to get coverage through a job. However, few are likely to gain coverage through an employer either because they are self-employed or not in a working family (38%), or because the employer does not offer coverage (32%) or coverage for which they are eligible (8%).
Policy Implications
As we enter the second year of new coverage under the ACA, information on people’s experience during the first year can inform ongoing efforts to extend and improve health coverage in California.
Covering the Remaining Uninsured
Cost continues to prevent many uninsured adults from seeking coverage. While some uninsured adults are ineligible for assistance, most can receive some help under the law. Thus, there may be a continuing lack of awareness of new coverage options and financial assistance. Messages that focus on low-cost or free coverage being available to most uninsured may help address these barriers to seeking and obtaining coverage.
Given the high share of remaining uninsured who are Hispanic, targeted outreach to this group is appropriate. In the early stages of ACA implementation in the state, there was much attention to the Hispanic population but administrative barriers in reaching them. In 2015, the state made efforts to reach this population, resulting in higher enrollment among this population. Still, ongoing efforts are needed to enroll eligible Hispanics and to serve those who may be ineligible for coverage due to their immigration status.
Community outreach may help engage many remaining uninsured. A minority of uninsured adults who sought ACA coverage had contact with a provider, community group, or other outreach worker, and many hard-to-reach groups, such as young adults, immigrants, and people with limited English proficiency, require such one-on-one assistance. In 2015, outreach resources will shrink, making these efforts more difficult.
Providing needed services to the remaining uninsured
Clinics and health centers remain core providers for the uninsured and will require ongoing support to serve this population. Safety net providers are likely to play an important, ongoing role in serving the uninsured. However, experts note that these providers are also adapting to meet the changing health care environment, including becoming “providers of choice” to retain patients as they gain coverage.
While some uninsured are able to navigate the system when they need care, most are not and face serious consequences as a result. Experts noted that access to care for the uninsured varies by region within the state. Particularly in rural areas, provider shortages exist for both insured and uninsured people. In addition, not all counties provide services to the undocumented, and those that do vary greatly in the scope of these services. Since people will continue to lack coverage under the ACA, planned efforts to deliver services to the underserved may be necessary.
Improving care for the insured
While most adults with coverage have positive views and experience with their health plan across coverage type, consumer education about health insurance and health care may be needed. According to experts in the state, during outreach, assistors noted that many people appeared to not understand basic aspects of their health plan. While initial outreach efforts were focused on enrollment, education about coverage and health care is the next phase of bringing people into the health care system.
While coverage eases financial strain of health care, many newly insured adults are in precarious financial situations and still report affordability problems. While premium and cost-sharing subsides in Covered California are set at the federal level, continued attention to whether affordability measures are sufficient may provide insight into people’s take-up and use of new coverage.
Continued attention is needed to ensure those who have coverage are able to access care. Some newly insured adults still report access barriers. These barriers could be related to several factors, including network adequacy or difficulty finding a provider, problems navigating the health system and insurance networks, misunderstanding of how to use coverage and when to seek care, or concerns about out-of-pocket costs.
Introduction
In January 2014, the major coverage provisions of the 2010 Affordable Care Act (ACA) went into full effect in California and across the country. These provisions include the creation of a new Health Insurance Marketplace, known in the state as Covered California, where middle income families (between around $27,000 and $79,000 for a family of three in 2014) can receive premium tax credits to purchase coverage and, in states like California that opted to expand their Medicaid program, the expansion of Medi-Cal eligibility to low-income adults (about $27,000 or less for a family of three in 2014). With these provisions, millions have gained coverage and access to needed health care services.
While much attention has been paid to enrollment in new coverage options and changes in the uninsured over the past year, less is known about how this coverage has affected people’s lives. To help fill this gap, the Kaiser Family Foundation is conducting a series of comprehensive surveys of the low and moderate-income population. These projects include both national surveys and a specific focus on California.
California is a bellwether state for understanding the impact of the ACA. Through a Medicaid waiver, the state was an early adopter of the Medicaid expansion, covering over 650,000 people by 2013 through its Low-Income Health Program (LIHP). The state was also the first to create a state-based Marketplace, and California engaged in an aggressive, multi-faceted outreach and enrollment campaign to reach and enroll individuals eligible for Medi-Cal or Covered California. The state’s efforts have led to substantial gains in coverage: Medi-Cal enrollment grew by 30% (2.8 million people) between the pre-open enrollment period in the fall of 2013 and the end of 2014,2 and roughly 1.7 million people applied and were determined eligible for Covered California health plans between October 2013 and October 2014.3 In addition, California’s sheer size means that the state’s experience in implementing the ACA has implications for national goals of reducing the total number of uninsured.
Findings from the 2013 Kaiser Survey of Low-Income Americans and the ACA, fielded prior to the start of open enrollment for 2014 ACA coverage, provided a baseline snapshot of health insurance coverage, health care use and barriers to care, and financial security among insured and uninsured adults at the starting line of ACA implementation and discussed how those findings could inform early implementation.4 The 2013 survey included both a national sample and a California sample, funded by the Blue Shield of California Foundation. In fall 2014, we conducted a second wave of the Kaiser Survey of Low-Income Americans and the ACA nationally and in California (again with support from the Blue Shield of California Foundation) to understand how these factors have changed under the first year of the law’s main coverage provisions. The survey, which included a state-representative sample of 4,555 nonelderly (age 19-64) California adults, was conducted between September 2 and December 15, 2014, with the majority of interviews (67%) conducted prior to November 15, 2014 (the start of open enrollment for 2015 Marketplace coverage; Medicaid enrollment is open throughout the year). In addition to the survey, qualitative interviews were conducted with key stakeholders throughout the state to provide policy context and insight into survey findings. Additional detail on the survey methods is available online.
This report, based on the California sample of the 2014 Kaiser Survey of Low-Income Americans and the ACA, examines the populations that gained coverage and remained uninsured in 2014. It describes the characteristics of these groups in California, comparing them to those who had coverage before 2014. It also provides information on how the newly insured view their coverage and any problems they have encountered in using their coverage; examines how the remaining uninsured and newly insured fare with respect to access to medical care and financial burden; and analyzes why people in California continue to lack coverage and their plans for obtaining coverage in 2015. Where relevant, the report also includes trended data from 2013.
Report: Background: Aca Implementation In California
As the nation’s most populous state, California faced a daunting challenge in expanding coverage under the ACA. Prior to ACA implementation, California had the largest number of uninsured of any state in the country. In 2010, when the ACA was passed, 6.8 million people in the state (or 18.5%) were uninsured,5 and California alone accounted for 14% of all uninsured people nationwide. Private coverage rates in the state were low due to a combination of high unemployment (which limited access to employer coverage) and high premium costs for non-group coverage6 (which made such coverage unaffordable for many). Public coverage through the state’s Medicaid program, Medi-Cal, was limited to only some groups of low-income adults, leaving many without an affordable coverage option. California is also a highly diverse state, with a majority of the population identifying as a race other than White7 and nearly half of residents speaking a language other than English in the home.8 Services for the uninsured in the state were largely devolved to California’s 58 counties, leading to variation in existing financing and availability of services for residents who lacked insurance coverage or regular care.
Leading up to full implementation of the ACA and during the first year of major coverage expansions, California actively pursued opportunities to expand coverage for residents, conducted outreach and enrollment to bring people into new coverage options, and organized systems to deliver care. While these efforts resulted in substantial coverage gains, the state—like all states—faced some early challenges under the ACA.
Early Implementation Efforts and Coverage Gains
California was one of a handful of states to undertake an early expansion of its Medicaid program in anticipation of full expansion in 2014. The state did so under its five-year “Bridge to Reform” §1115 Medicaid Demonstration Waiver, which was approved by the federal government in 2010. In addition to other provisions, the waiver allowed for federal matching funds for the creation of a county-based coverage expansion program for low-income adults not otherwise eligible for Medi-Cal, known as the Low Income Health Program (LIHP). The majority of counties participated in LIHP, and by the end of 2013, over 650,000 people were enrolled in the program.9 As discussed below, these individuals were either auto-enrolled in Medi-Cal or transferred to Covered California when these options became available in January 2014.10
LIHP also enacted innovative strategies to redesign the delivery of health care within California’s safety net system, including the development of robust provider networks and the integration of physical and behavioral health care, among others.11 As part of the “Bridge to Reform” waiver, California was also the first state in the country to adopt the Delivery System Reform Incentive Program (DSRIP) to assist California’s safety-net hospitals expand access to primary care, improve care and health outcomes, and increase efficiency.12
Even with the availability of coverage through LIHP, millions of Californians lacked coverage at the end of 2013. Some of these individuals are ineligible for assistance due to their immigration status (estimates revealed that about a fifth of uninsured California adults in 2013 were undocumented immigrants13 ), but many were likely eligible for Medi-Cal or Covered California subsidies. A majority of uninsured adults on the eve of full ACA implementation (52%) had family income below 138% of poverty, and most (71%) were either working themselves or had a spouse who worked. Compared to insured adults in the state, uninsured adults were more likely to be Hispanic and more likely to be young adults. These characteristics helped shape efforts to reach the eligible uninsured in 2014 and provide needed services to the ineligible population.
Medi-Cal Expansion and Covered California
As of January 2014, California expanded Medi-Cal statewide to cover low-income adults. In addition, subsidized coverage was available for moderate income adults who purchased insurance through the state’s health insurance marketplace, Covered California.
Under the Medi-Cal expansion, Medi-Cal was extended to all citizens and legal immigrants who have been in the country for over five years with income below 138% FPL ($16,105 for an individual or $27,210 for a family of three in 2014). Eligible lawfully residing immigrant pregnant women in this income range are exempt from the five year waiting period for coverage and can receive full-scope Medi-Cal14 and pregnant women with incomes between 109% and 208% FPL are eligible for Medi-Cal pregnancy-only coverage.15 Income-eligible legal immigrants who have been in the country less than five years became eligible for full-scope, state-only funded Medi-Cal beginning in January 2014 and were scheduled to transition to Covered California in January 2015;16 however, this transition has been delayed.17 When the transition takes place, these individuals will receive an affordability wraparound, ensuring that premiums, out-of-pocket costs, and covered services are the same as if they were enrolled in Medi-Cal. Undocumented immigrants who satisfy the income and residency requirements are eligible for limited scope Medi-Cal benefits, including emergency room services, long-term care, kidney dialysis, and prenatal care.18
California operates its own insurance marketplace, known as “Covered California,” as an independent public agency. Through Covered California, individuals who do not have access to another source of affordable coverage are eligible to purchase individual coverage directly from insurers. People with incomes between 139% and 400% of poverty are eligible for premium tax credits, and people with incomes between 139 and 250% of poverty are also eligible for cost-sharing subsidies. In addition, small businesses (up to 50 workers) can offer coverage to their workers via Covered California’s Small Business Health Options Program (SHOP). Legal, permanent residents who have been living in the country for less than five years may purchase health insurance through Covered California and may receive subsidies. Undocumented immigrants are prohibited from purchasing insurance in the Marketplace. Statewide, the average premium rate for the lowest Bronze plan was $219 per month in 2014 and $304 per month for the lowest cost silver plan.19
Covered California received federal funding to create a single online portal, available in Spanish and English, where users can apply and receive eligibility determinations for Medi-Cal or Marketplace insurance. The application can also be completed in-person, by phone, fax or mail, and paper applications are available in thirteen languages. In addition, individuals may continue to apply for Medi-Cal through their county Medi-Cal office. Covered California’s online application system, also known as the California Health Care Eligibility, Enrollment and Retention System (CalHEERs), coordinates with counties’ social services department through an online system called Statewide Automated Welfare Systems (SAWS).
On October 1, 2013, individuals and small businesses could begin shopping for health insurance plans. Coverage purchased through Covered California and coverage under the Medi-Cal expansion started in January 2014. Individuals who had gained coverage under the early LIHP expansion were auto-enrolled in coverage. Specifically, roughly 630,000 LIHP members were auto-enrolled in Medi-Cal, and an additional 25,000 were transitioned into Covered California.20 Open enrollment for Covered California ended on March 15, 2014 (though applications in progress were granted an extension21 ), while Medi-Cal enrollment was open throughout the year.
Outreach and Enrollment Throughout 2014
Leading up to and throughout ACA implementation, the state invested heavily in outreach and enrollment efforts for both Medi-Cal and Covered California. These efforts included statewide marketing campaigns, community mobilization, provider training, and targeted efforts to reach vulnerable populations who may be newly-eligible for coverage. Covered California also established an Assisters Program and worked with community organizations to provide direct assistance to consumers to help them enroll in coverage. In addition, the state received extensive federal funds and funds from private foundations, including $23 million from the California Endowment,22 most of which were distributed to localities, for local outreach efforts. These local outreach efforts included (among other things) support for Medi-Cal Certified Enrollment Counselors, outreach to hard-to-reach populations, and marketing to increase awareness and understanding of new coverage options.23 , 24 , 25 Experts believe that the local efforts to enroll eligible individuals were a key factor in driving high enrollment rates. In addition, 125 health centers operating over 1,000 sites throughout the state received federal grants to help with outreach and enrollment assistance,26 and experts noted that these providers were also crucial to enrollment efforts.
Alongside its extensive outreach efforts, California also took various steps to simplify and streamline enrollment. In addition to transitioning people from LIHP to Medi-Cal, the state also uses Hospital Presumptive Eligibility (PE) and adopted the Express Lane Enrollment Project. Under the PE program, hospitals can assist patients who are receiving services in the hospital in applying for temporary Medi-Cal benefits, producing an immediate eligibility determination based on the information provided in the application.27 The Express Lane Enrollment Project targeted adults and children enrolled in CalFresh, California’s Supplemental Nutrition Assistance Program (SNAP). Through a waiver the state was able to use CalFresh income eligibility to grant Medi-Cal eligibility to CalFresh enrollees without the need for an application or a determination for 12 months.28
Despite all these efforts, the state experienced some challenges in enrollment in 2014. Organizations and individuals encountered challenges with the Covered California in-person assister training process, including an insufficient number of training sessions, which led to a shortage of Certified Enrollment Counselors (CECs).29 In addition, educators and enrollment counselors cited problems with cultural and linguistic resources, including poorly translated materials that left many people confused, and a shortage of linguistically-appropriate materials.30 Some of these issues were addressed toward the end of open-enrollment and leading up to the second enrollment period, which began in the fall of 2014.31 In particular, Covered California made improvements to its Spanish-language website, added more bi-lingual employees and held community events in areas with large Latino populations.
In addition, though people began applying for coverage on October 1, 2013, the interface between CalHEERS and SAWS was not functional until late January 2014,32 thus delaying the enrollment process for consumers and health plans. A combination of technological issues as well as pending documentation on the part of applicants resulted in a Medi-Cal backlog of approximately 900,000 applications by May of 2014. The agency did its best to work through these applications; however, as recently as February of 2015, roughly 45,000 applications were still awaiting eligibility determinations and had gone unanswered.33
The Covered California website also contained small technical glitches across both the English and Spanish versions of the site that sometimes made navigating the site difficult or impossible. For example, the site would shut down while undergoing updates. Consumers and counselors reported long waits when seeking assistance through Covered California’s telephone hotlines, and counselors reported dropped calls while waiting to be transferred to multilingual call center representatives.34 The agency received criticism for not offering the Spanish-language paper applications until half-way through open-enrollment, posing a problem for users who did not have access to high-speed internet.35
These challenges notwithstanding, the state enrolled unexpectedly large numbers of people in 2014. By October 2014, nearly 1.7 million people applied and were determined eligible for Covered California health plans, doubling base projections of 816,00036 and representing about half of the marketplace-eligible population.37 The vast majority (83%) of people who enrolled received financial assistance (compared to 85% nationally).38 Los Angeles County alone accounted for over 400,000 enrollees.39 More than half of all enrollees into Covered California received enrollment help from a Certified Insurance Agents (36%), Certified Enrollment Counselor (8%), Service Center Representatives (10%), or other assister or navigator.40 Though ten health insurance companies offered plans in the Marketplace, the vast majority of people in Covered California chose a plan offered by one of the state’s four largest insurers—Anthem, Blue Shield of California, Kaiser Permanente or Health Net.41
Enrollment in the Medi-Cal program grew by 30%, or 2.8 million people, between October 2013 and the end of 2014.42 Of the approximately 1.9 million who enrolled in Medi-Cal between October 2013 and the end of the open enrollment period (March 15, 2014), 1 million applied through the Covered California portal and county offices, 630,000 transitioned from LIHP, and 180,000 applied through the state’s Express Lane Program.43 While some enrollees may have been eligible for Medi-Cal before the ACA, more than half (59%) are likely newly-eligible under the expansion.44
Despite the various challenges, California made substantial gains in reaching and enrolling millions of people throughout the state during the first year of coverage expansions under the ACA. In 2015, the state is building on these gains and addressing many of the issues that arose in the first year.
Report: Who Gained Coverage And Who Remained Uninsured?
In many ways, the “newly insured” population (those who gained coverage in 2014 and were uninsured before gaining that coverage) and “remaining uninsured” population (those who lacked coverage in fall 2014) resemble each other. For example, they are similar with respect to income, age, and health status, and they have different characteristics from the “previously insured” population (people who had coverage before 2014 and still had it in 2014). These patterns likely reflect the characteristics of the population that has historically lacked coverage. However, the insured and uninsured populations in California differ on some important factors, such as race/ethnicity, work status, gender, immigration status, and family status. These differences are important to understanding who was left out of coverage expansions in 2014 and targeting ongoing outreach to the remaining uninsured.
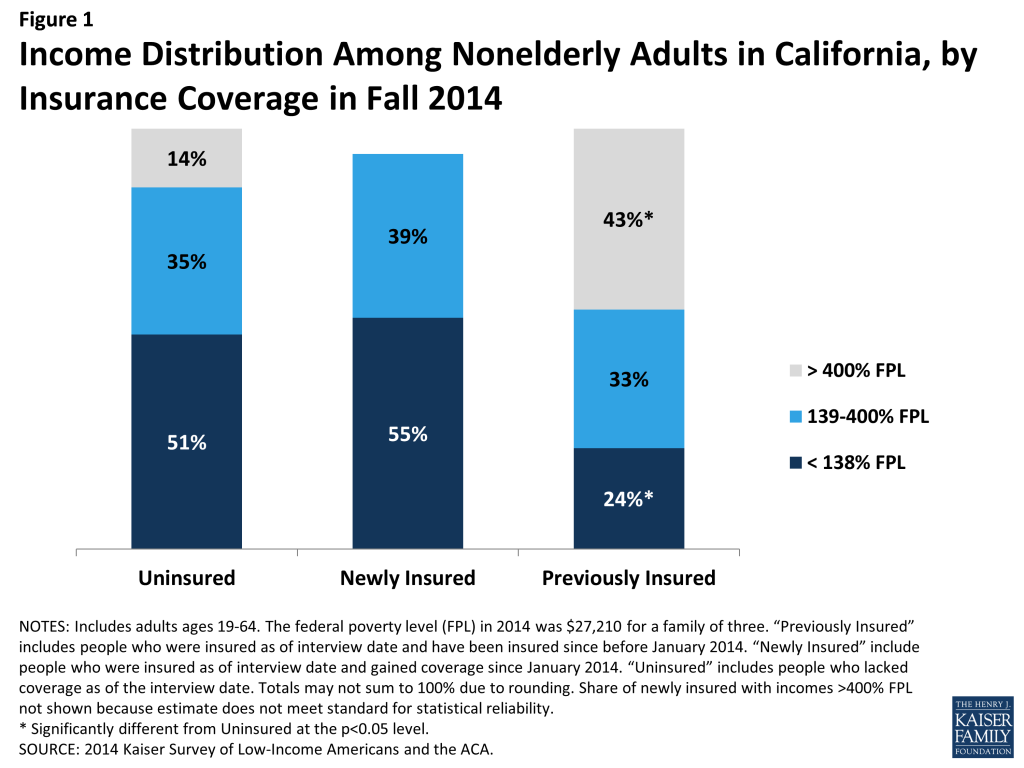
More than half of the newly insured and remaining uninsured populations have family income at or below 138% of poverty, the income range for the Medicaid expansion. As was the case before 2014,45 more than half of uninsured adults (51%) have family incomes at or below 138% of poverty, or about $27,000 for a family of three. Over a third (35%) has family incomes in the range for tax credits (139 to 400% of poverty). This distribution is similar to the newly insured population, the vast majority of whom (94%) had incomes in the range for financial assistance under the ACA. In contrast, the previously insured population is significantly less likely than either the uninsured or newly insured to be low-income and significantly more likely to be higher income (greater than 400% of poverty). This pattern reflects the longstanding association between having low income and lacking insurance coverage. Provisions in the ACA aim to make coverage more affordable for low and middle-income families.
Figure 1: Income Distribution Among Nonelderly Adults in California, by Insurance Coverage in Fall 2014
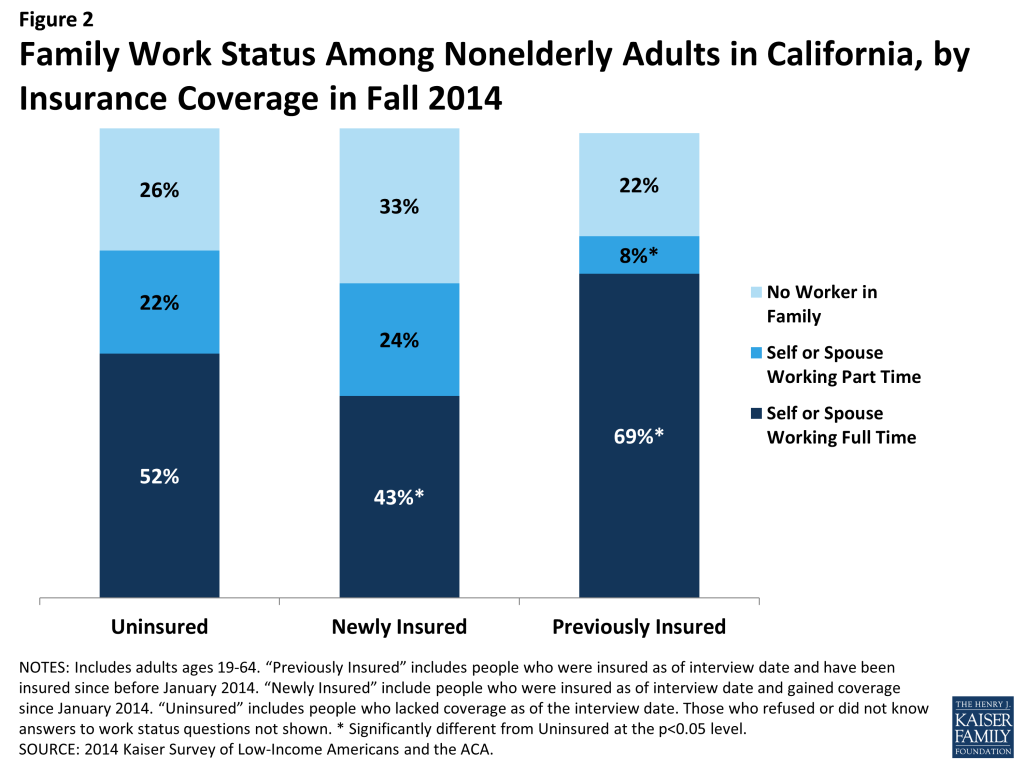
A majority of both the remaining uninsured and newly insured are in a family with at least one worker. Nearly three quarters of uninsured adults are in a family in which either they or their spouse is working, a pattern that has held since before the ACA.46 More than half (52%) are in a family with a full-time worker. While there is no difference in the share of newly insured adults in a working family overall, newly insured adults are less likely than remaining uninsured adults to be in a family with a full-time worker. Those who have been insured since before 2014 are more likely to have a full-time worker and less likely to have a part-time worker in the family. These patterns reflect the historical ties between work and health insurance, since most people who had coverage before the ACA obtained that coverage through a job. With new coverage provisions in place as of 2014, there were more options for health insurance outside employment, and groups traditionally left out of the employer based system—such as part-time workers or low-wage workers—had new avenues for coverage.
Figure 2: Family Work Status Among Nonelderly Adults in California, by Insurance Coverage in Fall 2014
Hispanics are disproportionately represented among the remaining uninsured population. Reflecting historical patterns of the uninsured being more likely to be people of color than the insured,47 the remaining uninsured and the newly insured are both more likely than the previously insured to be Hispanic and less likely to be White. However, the remaining uninsured population is more likely to be Hispanic than either the newly insured or previously insured population: 54% of the remaining uninsured population is Hispanic, a share significantly higher than among the newly insured or previously insured. This pattern likely reflects a combination of factors, including language barriers and immigration policy. Experts believe that lower enrollment among Hispanics may be related to the delay in having accurate Spanish-language enrollment materials.48 Another notable barrier was fear among some mixed-immigration status families that applying for coverage for eligible family members may expose other family members to risk of deportation. Last, the higher share of remaining uninsured who are Hispanic may reflect eligibility limits based on immigration status.
Figure 3: Race/Ethnicity of Nonelderly Adults in California, by Insurance Coverage in Fall 2014
The newly insured population is more likely to be female than their counterparts who remained without coverage. More than half (56%) of the newly insured population is female, a share significantly higher than that among the remaining uninsured (41%) but not significantly different from the previously insured. This pattern may reflect different take-up rates between men and women: Compared to 2013, the uninsured population in 2014 is more likely to be male.49 Women have historically had a lower uninsured rate than men, and the gender patterns in who gained coverage in California may reflect this historical and national pattern.50
Figure 4: Gender of Nonelderly Adults in California, by Insurance Coverage in Fall 2014
The remaining uninsured population is of similar age distribution as adults who gained coverage in 2014. While many were concerned that younger adults would disproportionately opt not to enroll in coverage, the share of uninsured and newly insured who were young adults (age 19-25) were about the same, and the share of the uninsured who were young adults in 2014 was the same as in 2013.51 However, both the uninsured and the newly insured populations were younger than the group of adults who were previously insured. About a fifth of the uninsured (21%) and newly insured (22%) populations were young adults, ages 19 through 25, compared to just 13 percent of the previously insured. About half of the uninsured and about half of the newly insured were under age 35, compared to just 31 percent of the continuously insured. This pattern reflects the fact that those who lacked coverage prior to 2014 were more likely to be young, since younger adults have looser ties to employment and lower incomes.
Figure 5: Age of Nonelderly Adults in California, by Insurance Coverage in Fall 2014
While there are no significant differences in the share of uninsured and newly insured adults who say their health is fair or poor, uninsured adults are less likely than adults with coverage to have a diagnosed medical condition. Compared to 2013, the uninsured in 2014 have a similar health profile;52 more than a third of uninsured adults (37%) and 30% of newly insured adults rate their overall health as fair or poor, in contrast to just 20% of previously insured adults. About a fifth (17% or uninsured and 23% of newly insured) report their mental health is fair or poor, compared to just 11% of the previously insured. However, the remaining uninsured are less likely than either the newly insured or previously insured to report being under care for a chronic condition: Insured adults are more likely than the uninsured to say that they have an ongoing medical condition that requires regular care, and both newly insured and previously insured adults are more likely than the uninsured to say they take a prescription on a regular basis. Comparing the newly insured and previously insured populations reveals that the previously insured are less likely to report fair/poor physical or mental health and are more likely to take a prescription. These patterns may reflect the fact that uninsured individuals are more likely than insured to have undiagnosed illnesses,53 and people with stable insurance coverage are more likely to receive regular and specialty care.54
Figure 6: Health Status Among Nonelderly Adults in California, by Insurance Coverage in Fall 2014
Report: Who Is Covered By Different Programs In California?
Understanding the profile of the population covered by different types of insurance in the state is essential to designing effective health plans to serve their needs. Historically, the adult population served by Medicaid was primarily made up of parents with very low incomes, individuals with disabilities, and pregnant women. With the expansion of Medi-Cal, the program grew to include individuals not traditionally covered by the program (such as non-disabled, non-parents), which has changed the profile of the overall program somewhat. However, given that new enrollment built off a much larger base, Medi-Cal retains many of its traditional roles of serving many individuals with substantial needs. The profile of Covered California enrollees shows that the program is playing an essential role in covering groups that have been left out of coverage expansions in the past.
Medi-Cal and Covered California enrollees are more racially diverse than the group of Californians with other private coverage. As in the past, a majority (two-thirds) of Medi-Cal enrollees identify as a person of color: 41% are Hispanic, 9% are Black, and 16% identify as Asian, Pacific Islander, American Indian, Alaskan Native, or other race. Covered California enrollees are also racially diverse, with 60% identifying as a race/ethnicity other than white, 37% of whom are Hispanic. In contrast, about half of adults with other private coverage in the state are White, non-Hispanic. This diversity indicates the need for these programs to design culturally-appropriate outreach and enrollment materials and to be sensitive to cultural issues in designing coverage and provider networks. It also highlights the importance of these programs for addressing long-standing disparities in health coverage and access for minority populations.
Figure 7: Race/Ethnicity of Nonelderly Adults in California, by Insurance Type in Fall 2014
Medi-Cal enrollees are more likely to be female than adults with other types of coverage. Whereas about half of adults with Covered California or other private coverage are female, nearly two-thirds (64%) of adults covered by Medi-Cal are female, a share equivalent to that in 2013.55 This difference may reflect pre-ACA eligibility restrictions for Medi-Cal, which limited adult coverage to custodial parents, pregnant women, and individuals with disabilities.
Figure 8: Gender of Nonelderly Adults in California, by Insurance Type in Fall 2014
The adult Medi-Cal population is younger than that of other coverage groups, particularly Covered California enrollees. Forty percent of adult Medi-Cal enrollees are under age 34, compared to about a third of adults in Covered California or with other private coverage. Since 2013, the share of adults covered by Medi-Cal who are under age 34 has increased.56 This pattern may reflect income, since younger adults have looser ties to employment and thus lower incomes. Notably, more than half of adults enrolled in Covered California are over age 45, an age at which obtaining non-group coverage outside the Marketplace or without financial assistance could be difficult or costly.
Figure 9: Age of Nonelderly Adults in California, by Insurance Type in Fall 2014
A majority of adult enrollees in both Medi-Cal and Covered California are adults without dependent children, a group that has generally been excluded from publicly-financed health coverage in the past. More than six in ten (62%) adult Medi-Cal enrollees and more than seven in ten (72%) adult Covered California enrollees do not have dependent children. In the past, adults without dependent children could only qualify for Medi-Cal if they were disabled or pregnant, though many non-parent adults gained LIHP coverage before 2014. Adults with other private coverage in 2014 were most likely to be married, perhaps reflecting the availability of family coverage in the private market.
Figure 10: Family Status of Nonelderly Adults in California, by Insurance Type in Fall 2014
About half of Medi-Cal and nearly three-quarters of Covered California adults are in a working family. Because Medi-Cal is designed to reach people at the lowest end of the income spectrum, it is not surprising that a smaller share of adults covered by the program is in a working family than that for other types of coverage. About a quarter (26%) of Medi-Cal adults are either working full-time or have a spouse who works full-time, and about a fifth (19%) are working part-time or have a spouse who works part-time. Given these individuals’ low incomes, they are likely working in jobs that pay low wages, and they are unlikely to have access to coverage through their job. Notably, the share of adults with Medi-Cal coverage who are in a working family increased significantly between 2013 and 2014,57 reflecting both new eligibility pathways for working adults and the improving economy. A larger share of adults in Covered California are in a family with a full-time (49%) or part-time (23%) worker; to meet eligibility for subsidized coverage, these individuals do not have access to affordable coverage through a job. Not surprisingly, most people with other private coverage are working.
Figure 11: Family Work Status Among Nonelderly Adults in California, by Insurance Type in Fall 2014
Reflecting Medi-Cal’s role in caring for people with substantial health needs, Medi-Cal enrollees have poorer health status than adults with other types of coverage. Medi-Cal beneficiaries were more likely than adults with other types of coverage to say their physical health or mental health was fair or poor; they were also more likely to have an ongoing health condition or be taking a prescription on a regular basis. As Medi-Cal’s scope has expanded under the ACA, the share who report health problems has declined significantly.58 Covered California adults were more likely to have health problems than adults with private health coverage; many of these adults were uninsured before gaining coverage and may have health problems that accumulated while they lacked coverage.
Figure 12: Health Status Among Nonelderly Adults in California, by Insurance Type in Fall 2014
Report: What Has Happened To Access To Care For The Insured And Remaining Uninsured?
The ultimate goal of expanding health insurance coverage is to help people access the medical services that they need. A large body of literature has documented that people with insurance are more likely to be linked to regular care, are less likely to postpone care when they need it, and have an easier time accessing services. The survey findings reinforce those findings, indicating that adults who gained coverage in 2014 have better access to care than those who remained without coverage. In addition, the survey findings provide insight into patterns of care among the newly insured and remaining uninsured. While some newly insured adults changed where they regularly go for care, many continue to seek services from community clinics and health centers, which have historically served under-served populations such as the uninsured.
Adults who gained coverage are more likely to be linked to care than those who remained uninsured. Newly insured adults were more likely than those who remained uninsured in fall 2014 to have a usual source of care, or a place to go when they are sick or need advice about their health (not counting the emergency room); they were also more likely to have a regular doctor at their usual source of care. Previously insured adults were also more likely than the uninsured to have a regular site of care and regular provider. These findings hold across coverage type. Having a usual source of care or regular doctor is an indicator of being linked to the health care system and having regular access to services. These patterns reinforce a large body of research that finds that gaining coverage is associated with improved access to care. However, results also indicate that the newly insured are less likely than the previously insured to have a usual source of care or regular doctor. This finding may indicate that newly insured adults are still navigating the health care system and are not as settled into regular care as their previously insured counterparts. Compared to 2013, there was no change in the share of Medi-Cal enrollees who reported having a usual source of care or regular doctor, while uninsured adults in 2014 were less likely than those in 2013 to say they have a usual source of care (but not a regular doctor).59
Figure 13: Share of Nonelderly Adults in California with a Usual Source of Care or Regular Provider, by Insurance Coverage and Type in Fall 2014
Newly insured adults were more likely to change where they usually go for care than their previously insured counterparts. Nearly a fifth (19%) of newly insured adults who have a usual source of care reported that they changed the place they usually go for care since gaining their coverage. Uninsured adults in 2014 were not significantly more likely to say they changed their usual source of care compared to uninsured adults in 2013, and there were no significant differences between the rates of uninsured and newly insured adults changing their usual source of care in 2014. However, newly insured adults in 2014 were more likely than previously insured adults to change their usual source of care. Most newly insured adults who changed their site of care reported that it was due to their insurance, a significantly higher rate than the previously insured. There were no significant differences in the likelihood of Medi-Cal or Covered California enrollees changing their usual source of care, and Medi-Cal enrollees in 2014 were no more likely than those in 2013 to say they changed where they usually go for care.
Figure 14: Change in Usual Source of Care Among Nonelderly Adults in California, by Insurance Coverage and Type in Fall 2014
Clinics remain an important source of care for both the uninsured and the newly insured. Both uninsured and newly insured adults with a usual source of care are most likely to use a clinic or health center for that care. In contrast, previously insured adults were most likely to use a doctor’s office or HMO as their usual source of care. Historically, clinics and health centers were crucial “safety net” providers for uninsured people, and the share of uninsured adults using clinics as their usual source of care was unchanged since 2013. Though some of the newly insured have changed their source of care, many continue to rely on these providers. Experts in the state note that this pattern could reflect community health centers’ efforts to retain patients after helping them enroll in health coverage or patient preferences for these providers, which have a strong tradition and mission of culturally competent care and community environments. According to policy experts from county health systems, this pattern also may reflect lack of understanding of new health care options amongthe newly insured.
Figure 15: Type of Place Used for Usual Source of Care Among Nonelderly Adults in California, by Insurance Coverage in Fall 2014Figure 16: Type of Place Used for Usual Source of Care Among Nonelderly Adults in California, by Insurance Type in Fall 2014
Comparing site of care by type of coverage reveals that those enrolled in Covered California (44%) or other private coverage (71%) were more likely than Medi-Cal enrollees (29%) to choose a doctor’s office as their usual source of care, with adults with other private coverage most likely to do so. Medi-Cal enrollees were most likely to use clinics or health centers for their usual care (57%). This pattern is in line with pre-ACA patterns, which showed that a plurality of adults with Medi-Cal used clinics or health centers for their regular care.60 Comparing the 2013 and 2014 surveys indicates that a significantly larger share of Medi-Cal adults with a usual source of care is relying on clinics. This change could indicate that, as uninsured adults gain Medi-Cal coverage, they still use the clinics and health centers that they relied on when they were uninsured.
Uninsured adults are most likely to choose their site of care based on affordability, whereas newly insured adults are most likely to choose based on convenience. In the past, many uninsured adults reported that they chose their usual source of care because it was affordable, a pattern that is also seen among adults who were uninsured in 2014. More than a third (37%) of uninsured adults say they use their usual source of care because it is affordable, a share not significantly different than the uninsured in 2013 reported. In contrast, adults who gained coverage in 2014 were more likely to say they chose their usual source of care because it was convenient (40%). Previously insured adults were most likely to choose their site of care because their preferred provider is there (37%). As the newly insured establish relationships with a regular doctor at their usual source of care, it is possible that they too will begin to seek out routine care at a place where their preferred doctor is available.
Looking at reason for choosing site of care by coverage, Medi-Cal enrollees were more likely than those in Covered California and other private insurance to report choosing their usual source of care because it was the only place available. Ten percent of Covered California enrollees reported choosing their usual source of care because it was the only place available, compared with 20% of Medi-Cal enrollees and 6% of those with other private insurance. Though Medi-Cal managed care plans are held to state standards of network adequacy and patient access, experts report that low reimbursement rates make contracting with providers difficult, especially in rural areas. There was no change from 2013 to 2014 in the share of Medi-Cal enrollees who reported they chose their usual source of care because it is the only place available. According to a state Medicaid expert, long-standing federal and state standards of network adequacy have required managed care plans to grow their network to meet demand in the past and will continue to do so as needed.
Figure 17: Main Reason for Choosing Usual Source of Care Among Nonelderly Adults in California, by Insurance Coverage in Fall 2014
Figure 18: Main Reason for Choosing Usual Source of Care Among Nonelderly Adults in California, by Insurance Type in Fall 2014
Uninsured adults and newly insured adults report greater difficulty than previously insured adults in traveling to their regular site of care. Among adults with a usual source of care, most report that it is “very easy” or “somewhat easy” to travel there. However, there was no significant difference in the share of newly insured and uninsured adults who reported ease in traveling to care, while previously insured adults were more likely than uninsured to report ease of traveling to care. Within types of coverage, adults with Covered California and other private coverage were more likely than the uninsured to say it was easy to travel to care. These patterns may reflect the need for the uninsured to find a source of care that is affordable, which may require farther travel. In addition, those with private coverage were also more likely than those with Medi-Cal to report ease of travel to their usual source of care. Taken together, these findings also suggest that the difference may be due to lower provider density in areas where those with the lowest incomes live or the need for lower-income people to rely more heavily on public transit than their own vehicle. There was no change from 2013 to 2014 in the share of uninsured or Medi-Cal enrollees reporting difficulty traveling to their usual source of care.
Figure 19: Ease of Travel to Usual Source of Care Among Nonelderly Adults in California, by Insurance Coverage and Type in Fall 2014
Mirroring patterns for being linked to care, adults with insurance coverage were more likely than the uninsured to have used medical services or received preventive care. More than half (58%) of adults who gained coverage in 2014 said that they used at least one medical service since gaining their coverage, and nearly half (47%) had received a preventive visit or check-up. These rates were significantly higher than those the uninsured reported for 2014 but were lower than the previously insured reported for 2014. There were no differences in the share of adults reporting visits by coverage type, with the exception of adults with other private coverage being more likely than adults with Medi-Cal to have a preventive visit. Again, these findings are not unexpected given the large body of research showing that people without insurance coverage are less likely to use care, including preventive care. Compared to 2013, Medi-Cal beneficiaries were less likely to report using care but no more or less likely to report using preventive care. Among uninsured adults, there were no changes in utilization rates between 2013 and 2014.
Figure 20: Use of Medical Services Among Nonelderly Adults in California, by Insurance Coverage and Type in Fall 2014
Still reflecting some unmet need, many newly insured adults reported postponing or delaying needed services. More than a third of newly insured adults (35%) reported that they postponed or went without needed care since gaining their coverage, the same share as the uninsured and a higher share than the previously insured. Similar patterns were seen for the shares reporting that they never received care or that postponing care had negative consequences such as a condition worsening, loss of time at work or school, or substantial stress. When comparing these outcomes by type of coverage, similar patterns persist, though Covered California enrollees were less likely than uninsured adults or adults in Medi-Cal to say that they never received the care they needed or that postponing care led them to miss work or school. Notably, Medi-Cal enrollees were more likely than uninsured adults to report postponing needed care; this outcome may be due to Medi-Cal enrollees’ poorer health status and the greater frequency with which they may need complex services. People with a large number of complex needs may be more likely to encounter access barriers for some services than those with more limited needs. Compared to 2013, Medi-Cal enrollees in 2014 were no more likely to say they postponed care and were less likely to say that their condition worsened or their stress increased as a result of postponing care. The high rates of unmet need among the uninsured corroborate existing evidence that this group goes without needed care due to cost, though the uninsured in 2014 were less likely to postpone care than the uninsured in 2013. Among those who do have coverage, postponing care could be related to several factors, including difficulty finding a provider, problems navigating the health system and health insurance networks, misunderstanding of how to use coverage and when to seek care, or concerns about out-of-pocket costs.
Figure 21: Unmet Need for Care Among Nonelderly Adults in California, by Insurance Coverage in Fall 2014Figure 22: Unmet Need for Care Among Nonelderly Adults in California, by Insurance Type in Fall 2014
Though most adults did not report problems getting appointments, some insured adults say a provider would not take them as a patient due to coverage. Though a very small share (7%) of newly insured or previously insured (4%) adults reported this problem, both these groups were more likely than the uninsured to say a provider would not accept them as a patient due to coverage. The low rates of these problems among the uninsured (2%) likely reflect this group’s lower propensity to seek care, as detailed elsewhere, although uninsured adults in 2014 were more likely than those in 2013 to say they were told a provider would not take them as a patient. There were no significant differences in the share reporting not being taken as a new patient for any reason or reporting having to wait longer than they thought reasonable for an appointment. However, when examined by type of coverage, differences do emerge, with adults in Covered California or Medi-Cal being more likely to report being told that a provider would not take them as a patient than adults with other private coverage. Medi-Cal enrollees in 2014 were no more likely to say a provider would not take them as a patient than those in 2013. Like the forces underlying choice of usual source of care, these issues may reflect continuing problems with network adequacy, despite the existence of state standards for network adequacy and patient access.
Figure 23: Problems Getting Medical Appointments Among Nonelderly Adults in California, by Insurance Coverage in Fall 2014Figure 24: Problems Getting Medical Appointments Among Nonelderly Adults in California, by Insurance Type in Fall 2014
Among adults who received care, most adults across coverage types report effective communication with their providers about their care. Once people get into care, health literacy—or “patients’ ability to obtain, process, and understand the basic health information and services they need to make appropriate health decisions”61 —plays an important role in how that care affects health outcomes. Health literacy depends on a range of factors related to patients (e.g., engagement in care), providers (e.g., how the information is communicated), service setting (e.g., the length of time of the interaction), and the nature of the visit (e.g., the complexity of health information). Survey results reveal that both previously insured and newly insured both reported understanding their test results or how to take their medication either “always” or “most of the time” that they saw a provider in higher proportions than the uninsured. However, on outcomes of getting all the information you wanted from the provider or feeling encouraged to ask questions, the newly insured were no more likely than the uninsured to report experiencing these always or most of the time.
Comparing results by coverage type reveals few differences, though Medi-Cal enrollees were less likely than adults with other private coverage to report getting all the information they wanted or feeling encouraged to ask questions. A statewide analysis of consumer ratings of doctor communication for all health plans found that Medi-Cal managed care plans received a “poor” rating relative to national benchmarks and thresholds, but ratings varied greatly across plans.62 This pattern may stem from income differences between the groups, since low-income Californians are less likely than higher-income Californians to give high ratings of communication with their provider, patient satisfaction, or patient engagement.63 Gaps in patient-satisfaction and engagement stem from low-income Californians reporting lower rates of feeling connected to the health care system or to seeing the same provider over time.64
Figure 25: Effective Communication with Providers Among Nonelderly Adults in California, by Insurance Coverage in Fall 2014Figure 26: Effective Communication with Providers Among Nonelderly Adults in California, by Insurance Type in Fall 2014
Report: How Do People View Their Coverage?
People’s views of their plan may affect not only their use of their coverage but also the likelihood that they re-enroll in coverage or change plans. Survey results reveal that newly insured adults were very sensitive to cost in choosing their plan, placing a priority on cost over benefits and provider networks. A minority of all insured adults reported problems in selecting their plan or using their plan. However, newly insured adults were more likely than previously to say they do not understand the details of their plan and were more likely to give their plan a low rating. These findings indicate that additional education may be needed to help people understand their coverage.
Newly insured adults were less likely to prioritize scope of coverage or provider networks in choosing their plan than previously insured adults. Among adults who say they had a choice of plans and made the choice themselves, less than a fifth (19%) of newly insured adults say they chose their plan because of the benefits covered, compared to 33% of previously insured adults, and only 14% say they chose their plan based on provider network (versus 26%) of previously insured. Newly insured adults were most likely to say they chose their plan because of low cost (29%); while this share was higher than the previously insured (23%), the difference was not statistically significant. Newly insured adults may have been less likely to choose based on benefits because new regulations set a minimum scope of coverage across new plans (so-called “essential health benefits”), but “grandfathered” pre-existing plans are not held to the same requirement. Alternatively, newly insured adults may be more sensitive to price than their previously insured counterparts, even with the availability of financial assistance for coverage.
Price was a particularly important factor in choice of plans among Covered California enrollees, 37% of whom said they chose their plan because of cost (versus 11% of Medi-Cal and 25% of adults with private coverage). In Covered California, premiums varied by region, ZIP code, metal level and age, but benefits were standardized across plans.65 Compared to other coverage groups, Medi-Cal enrollees were less likely to choose a plan based on price and more likely to choose a plan based on other factors such as other family members being enrolled in the plan. In Medi-Cal, plan benefits are largely standardized. Further, enrollees face limited or no out-of-pocket costs for services, so the small share indicating that they chose based on price may indicate confusion about their plan.
Figure 27: Main Reason for Choosing Health Plan, Among Insured Nonelderly Adults in California Who Had a Choice, by Insurance Coverage in Fall 2014Figure 28: Main Reason for Choosing Health Plan, Among Insured Nonelderly Adults in California Who Had a Choice, by Insurance Type in Fall 2014
Across coverage groups, most insured adults did not report difficulty with the plan selection process. While rates of difficulty comparing services, costs, or provider networks across plans varied slightly by timing of coverage and coverage type, there were no significant differences across groups. Still, notable shares reported having difficulty with at least one aspect of plan choice, and the newly insured were more likely than the previously insured to report at least one difficulty (48% versus 34%). The most common difficulty across all coverage groups was comparing provider networks, a finding that echoes patterns nationwide. California, along with several other states, requires all participating Marketplace plans to offer standardized benefit designs, allowing consumers to accurately compare plans based on cost and network alone, since benefits are identical for all plans.66 In Medi-Cal, benefits and cost sharing are standardized across plans.
Figure 29: Views of Plan Selection Process Among Nonelderly Adults in California Who Chose a Health Plan, by Insurance Coverage in Fall 2014Figure 30: Views of Plan Selection Process Among Nonelderly Adults in California Who Chose a Health Plan, by Insurance Type in Fall 2014
Newly insured adults were no more likely than previously insured to report a specific problem with their health plan. When asked specifically if they encountered various problems with their coverage, such as benefits, costs, or customer service, newly insured adults reported similar or lower rates than previously insured. Specifically, there were no significant differences in shares reporting needing a service that was not covered, being denied coverage for a service they thought was covered, having difficulty getting a question answered, or renewing coverage. Newly insured adults were less likely than previously insured to say they faced higher than expected out-of-pocket costs or that they had not yet met their deductible.
Comparing problems with plan by type of coverage reveals mixed results for different types of problems. Medi-Cal enrollees were less likely than those with Covered California or other private coverage to report cost-related problems, such as facing higher than expected costs or not meeting a deductible. In Medi-Cal, enrollees do not have deductibles and face very limited or no out-of-pocket costs; the fact that any Medi-Cal enrollees reported these problems may reflect service use outside their Medi-Cal plan or may reflect misunderstanding of their plan. On problems related to scope of coverage (e.g., needing a service not covered or being denied coverage for a service) or administrative issues (e.g., getting a question answered or renewing coverage), there were no significant differences between Medi-Cal and Covered California, but adults with other private coverage were less likely to report such problems.
Figure 31: Problems with Current Coverage Among Insured Nonelderly Adults in California, by Insurance Coverage in Fall 2014Figure 32: Problems with Current Coverage Among Insured Nonelderly Adults in California, by Insurance Type in Fall 2014
Newly insured adults were also more likely than previously insured to not understand the details of their plan. About two thirds of newly insured adults said they understand the services their plan covers (65%) or how much they would have to pay when they visit a health care provider (66%) “very well” or “somewhat well.” In contrast, previously insured adults were more likely to say they understood the scope of benefits (80%) or cost sharing rules (84%) of their plans. It is possible that newly insured adults face challenges in understanding the complexity of insurance coverage, especially since many adults who were uninsured before the ACA reported that they had never had health insurance.67 When looking by coverage type, there are no significant differences in the share of Medi-Cal or Covered California enrollees reporting understanding these features of their plans. However, adults with other private coverage (most of whom are previously insured) were more likely to understand their plan.
Figure 33: Understanding of Health Insurance Coverage Among Insured Nonelderly Adults in California, by Insurance Coverage in Fall 2014Figure 34: Understanding of Health Insurance Coverage Among Insured Nonelderly Adults in California, by Insurance Type in Fall 2014
Though most newly insured adults give their health plan high ratings, they were less likely than the previously insured to do so. Seven in ten newly insured adults rate their coverage as “excellent” or “good” (versus “not so good” or “poor”). While these findings show high rates of satisfaction, adults who had coverage before 2014 were more likely to give their plan a high rating, with 87% saying their coverage was excellent or good. There were no significant differences between Medi-Cal and Covered California) in the share of people giving their plan a high rating; those with private coverage, on the other hand, were more likely to give their plan a high rating. Findings that newly insured adults were less likely to understand their plan but no more likely to have experienced difficulty with their plan indicate that health insurance literacy may be affecting plan ratings.
Figure 35: Rating of Health Insurance Coverage Among Insured Nonelderly Adults in California, by Insurance Coverage in Fall 2014
Report: How Does Coverage Affect Financial Security?
Health care costs can be a major burden for low-income families. While many newly insured adults report difficulty affording their monthly premium, they also report lower rates of problems with medical bills and lower rates of worry about future medical bill than their uninsured counterparts. However, newly insured adults still face financial insecurity: they are more likely than those who had coverage before 2014 to worry about future medical bills, and they face general financial insecurity at rates similar to the uninsured. These patterns may indicate that while coverage can ameliorate some of the financial challenges that low and moderate-income adults face, many will continue to face financial challenges in other areas of their lives.
Many Covered California enrollees report difficulty paying their monthly premium. Among adults who say that they pay a monthly premium for their health coverage, nearly half of newly insured adults (47%) say it is somewhat or very difficult to afford this cost, compared to just 27% of adults who were insured before 2014. When looking specifically by type of coverage, 44% of Covered California enrollees (not all of whom are newly insured) report difficulty paying their monthly premium, versus a quarter of adults with other types of private coverage. Medi-Cal enrollees do not pay monthly premiums for their coverage. Statewide, the average premium rate for the second-lowest cost silver plan in Covered California was $325 per month,68 compared to $226 nationally.69 While most people in Covered California received premium subsidies to offset some or most of this cost,70 subsidy levels are set at the federal level and do not account for the relatively high cost of living in the state that requires a greater share of family finances to go to other areas such as housing, food, or transportation.71
Figure 36: Difficulty Affording Health Insurance Premiums Among Nonelderly Adults in California, by Insurance Coverage and Type in Fall 2014
However, coverage does provide financial protection from medical bills and eases concern over affording medical care. Compared to the uninsured, both newly insured and previously insured adults report lower rates of difficulty paying medical bills. Despite being less likely to use services, over a quarter (26%) of uninsured adults report a problem paying medical bills, a rate higher than both the newly insured and previously insured. Uninsured adults were also more likely to report serious consequences from medical bills, such as using up their savings, having difficulty paying for necessities, borrowing money, or being sent to collection. The uninsured were significantly more likely than the previously insured to report that medical bills led to difficulty paying for basic necessities; however, compared to the newly insured, there was no significant difference in medical bills leading to problems paying for necessities.
Figure 37: Problems Paying Medical Bills Among Nonelderly Adults in California, by Insurance Coverage in Fall 2014Figure 38: Problems Paying Medical Bills Among Nonelderly Adults in California, by Insurance Type in Fall 2014
When comparing the uninsured to adults with different types of coverage, including Medi-Cal, Covered California, or other private coverage, adults with each type of coverage were less likely than the uninsured to report problems paying medical bills. However, likely reflecting differences in income between these groups, adults with Medi-Cal coverage were significantly more likely than those with other private coverage to report difficulty paying for basic necessities as a result of medical bills (7% versus 3%) and problems paying medical bills (15% versus 11%). As mentioned earlier, Medi-Cal enrollees pay nothing or very little for their medical care, so the share reporting problems related to medical bills may indicate confusion about their plan or services they received that are not covered by their plan. Compared to 2013, there was no significant change in the share of uninsured or Medi-Cal respondents reporting problems with medical bills.72
Figure 39: Financial Insecurity Over Medical Costs Among Nonelderly Adults in California, by Insurance Coverage in Fall 2014Figure 40: Financial Insecurity Over Medical Costs Among Nonelderly Adults in California, by Insurance Type in Fall 2014
In addition to being less likely to report experiencing financial strain due to medical bills, insured adults are less likely than uninsured to report living with worry about their ability to afford medical care in the future. Nearly two-thirds (64%) of uninsured adults say they lack confidence in their ability to afford the cost of care for services they typically require, and three-quarters say they lack confidence in their ability to afford the cost of a major illness. In contrast, both newly insured and previously insured adults reported lower rates of insecurity, a finding that holds across types of coverage. Compared to 2013, uninsured adults in 2014 were less likely to say they lack confidence in affording major medical costs, perhaps reflecting an improving economy.73
Newly insured adults were no more likely than uninsured adults to say that worry over affording medical costs has affected their job performance, family relationships or ability to sleep, a finding that may reflect their difficulty paying premiums. Further, in contrast to reported problems with medical bills, newly insured adults were more likely than previously insured adults to report financial insecurity over future medical bills. It is possible that newly insured adults have less confidence in the protection offered by their coverage, that their recent experience without coverage led them to be more concerned about future coverage and costs, or that their lower incomes leads to general financial insecurity.
Many newly insured adults still face financial insecurity in areas outside of health care costs. While coverage provides some financial protection from medical bills, there are no significant differences between newly insured adults and uninsured adults with respect to general financial challenges in other areas of their lives. For example, there are no significant differences in the share of uninsured and newly insured adults reporting general financial insecurity or in the share reporting difficulty paying for necessities, saving money, or paying off debt. However, previously insured adults were less likely than uninsured to report these financial challenges. Compared to 2013, uninsured adults in 2014 were less likely to report being generally financially insecure, perhaps reflecting improving economic conditions. In addition, compared to 2013, both Medi-Cal beneficiaries and uninsured adults in 2014 reported lower rates of difficulty affording basic necessities and of saving money (there was no change in the share reporting difficulty paying off debt).74
Figure 41: Financial Security Among Nonelderly Adults in California, by Insurance Coverage in Fall 2014Figure 42: Financial Security Among Nonelderly Adults in California, by Insurance Type in Fall 2014
Looking by coverage type, Medi-Cal beneficiaries are more likely than the uninsured to report being generally financially insecure and as likely to report difficulty affording necessities, saving money, or paying off debt. This finding is not surprising, given that Medicaid is targeted to adults with the lowest incomes.
Report: Why Are People Still Uninsured And What Are Their Coverage Options?
Though much attention was paid to the difficulties with the application and enrollment process during the 2014 open enrollment period, logistical issues in applying for coverage do not appear to be a leading reason why people went without insurance in 2014. Rather, lack of awareness of new coverage options and financial assistance appear to be a major barrier. In addition, confusion about eligibility is evident among the remaining uninsured. As of fall 2014, uninsured adults were largely uncertain about whether they would seek coverage in 2015 or where they will get it, and only a small share of those eligible say they plan to seek ACA coverage.
Cost remains a major barrier to coverage. While the ACA aimed to make coverage more affordable, for many (44%), the high cost of coverage is still the main reason that adults say they are uninsured. Many also cite limitations on eligibility for coverage, such as immigration status (10%) or being told they are ineligible (8%). A very small share (3%) says they are uninsured because they are either opposed to the ACA or prefer to pay the penalty. Notably, compared to the uninsured before the ACA, uninsured adults in fall 2014 were less likely to name job-related barriers as a reason for lacking coverage: 5% of uninsured adults named a job-related reason for lacking coverage in 2014, compared to over a quarter in 2013 (data not shown). As outreach efforts continue, the uninsured may be growing more aware of insurance options available outside of employer coverage, even while they perceive these options as unaffordable to them.
Figure 43: Reasons for Being Uninsured Among Uninsured Nonelderly Adults in California, Fall 2014
Coverage transitions remain a challenge to continuous coverage. As in the past, lack of coverage remains a long-term issue for most: eight in ten uninsured adults report that they had lacked coverage for all of 2014. However, nearly one in five actually had coverage at some point in 2014 but lost that coverage. This pattern is similar to that seen in the past: millions of people gain, lose, or change their health coverage throughout the year, and for some, these transitions lead to spells of uninsurance. As in the past, many (36%) who lost coverage in 2014 indicated that they lost employer-based coverage, but about a quarter who lost coverage in 2014 reported that they lost Medi-Cal. Some people may have in fact become ineligible for Medi-Cal but opted not to purchase other coverage, while others may have not renewed their coverage. People who became eligible for Medi-Cal before January 2014 had to re-apply for coverage at their annual renewal period, since the eligibility rules and forms had changed since they first became eligible.75 As adopted, the ACA envisioned a continuum of coverage with various coverage options available as people’s circumstances changed (such as job loss or income change), but implementing these transitions is administratively challenging.
Figure 44: Length of Time Uninsured and Previous Coverage Among Uninsured Nonelderly Adults in California, Fall 2014
Most adults who were uninsured in fall 2014 had not tried to get ACA coverage; however, among those who did, perceptions of cost and eligibility were a more common reason for not obtaining coverage than application problems. Nearly two-thirds (64%) of uninsured adults did not try to get coverage from either Medi-Cal or Covered California in 2014. However, among those who did try to get ACA coverage, the most common reason people gave for not having ACA coverage was that they were told they were ineligible (38%), and more than a fifth (21%) said it was because the coverage was too expensive. Though smaller shares said that they didn’t get coverage due to problems with the application process, such as still having a pending application (16%) or not completing the application process (12%), the findings do indicate that many people encountered difficulty in applying for coverage. This distribution mimics what took place at the national level, where only about a third (37%) of the remaining uninsured adults had tried to obtain Medicaid or Marketplace coverage in 2014, and of those that tried, the most commonly cited reason provided for their lack of insurance was being told they were ineligible (data not shown).
Figure 45: Attempts to Obtain and Reason for Not Getting ACA Coverage, Among Uninsured Nonelderly Adults in California, Fall 2014
When asked directly if they found the application process difficult, most uninsured encountered problems with at least one aspect of applying. Though the remaining uninsured who applied for ACA coverage did not name application difficulties as a leading reason for not obtaining coverage, most (68%) did say they found at least one aspect of the application process difficult. However, no single aspect stands out as the most difficult: more than one in four (42%) reported difficulty assembling the required paperwork, and more than a third reported difficulty finding out how to apply (40%), filling in the information requested (36%), or submitting the application (34%). Very few (12%) uninsured adults found all aspects of the application process to be difficult. Enrollment assistance to help those who encountered difficulty was available in California through a variety of avenues, but, as discussed below, many who remained uninsured said they did not seek assistance through these options.76
Figure 46: Difficulty Applying for ACA Coverage, Among Uninsured Nonelderly Adults in California, Fall 2014
Among those who tried to get ACA coverage, most reported trying multiple avenues, and most tried to get coverage directly from the state or federal government. While the ACA envisioned a streamlined, “no wrong door” application and enrollment process, most people who sought ACA coverage in 2014 said they pursued multiple pathways to coverage. About half (48%) of uninsured adults who sought ACA coverage tried more than one pathway, a similar pattern to that seen among those who successfully gained coverage. The most common way that the uninsured sought ACA coverage was by visiting the Covered California website (50%). About a quarter (26%) reported that they called a toll-free number to get help, and more than a third (38%) visited a Medi-Cal agency. Many uninsured adults pursued other avenues for getting coverage—such as going to a provider for help (26%), contacting a health insurance broker (21%), or going to community agencies, schools, churches, or libraries (17%).
Figure 47: Pathways to Applying for ACA Coverage, Among Uninsured Nonelderly Adults in California, Fall 2014
Few uninsured adults are likely to gain coverage through an employer. As in the past,77 very few uninsured adults have access to coverage through their own or a spouse’s job, either because they are self-employed or not in a working family (38%), or because the employer does not offer coverage (32%) or coverage for which they are eligible (8%). Some uninsured adults do have access to coverage through their own or a spouse’s job, but most who do report that this coverage in unaffordable to them. Many uninsured adults work for an employer who will not be required to offer coverage under the ACA because they have fewer than 50 workers.
Figure 48: Access to Employer-Sponsored Insurance Among Uninsured Nonelderly Adults in California, Fall 2014
Even though most uninsured adults are now eligible for coverage, few uninsured adults had plans to obtain ACA coverage in 2015. Only about half of uninsured adults indicate that they plan to get coverage in 2015, and few who do identified Medicaid or Marketplace coverage as their goal. Rather, higher shares indicate that they don’t know where they will get coverage. According to an estimate reported out of UCLA’s Center for Health Policy Research, between 3.2 and 4 million people will remain uninsured in California in 2015.78 Many of these individuals (about 1.5 million) are undocumented and therefore barred from purchasing insurance on Covered California and from receiving full-scope Medi-Cal benefits, but many are eligible for coverage through Medi-Cal or Covered California. Eligible individuals may be unaware of new coverage options or may still find coverage unaffordable. Outreach to inform them of the availability of financial assistance may help reach these individuals.
Figure 49: Plans for Obtaining Insurance in 2015, Among Uninsured Nonelderly Adults in California, Fall 2014
Report: Policy Implications
As we enter the second year of new coverage under the ACA, information on people’s experience during year one can inform ongoing efforts to extend and improve health coverage in California. While the survey findings can inform a broad range of these efforts, key themes and implications include:
Covering the Remaining Uninsured
Though open enrollment for Covered California is closed, Medi-Cal enrollment is open throughout the year. Analysis of the remaining uninsured population’s income indicates that most fall into the income range for Medi-Cal; thus, ongoing efforts throughout 2015 can bring more people into coverage. In addition, findings related to outreach can inform planning for future Covered California open enrollment periods.
Many low-income, working adults gained coverage in 2014, and ongoing coverage expansions have the potential to reach many more. Adults who gained coverage in 2014 were largely low (below 139% of poverty) or middle (between 139 and 400% of poverty) income, and a majority were in a working family. Further, most who gained coverage were people of color. These findings indicate that coverage expansions are playing an important role in filling gaps in availability of coverage for low-income workers, and expansions may also help long-standing racial and ethnic disparities in access to health care. Like their counterparts who gained coverage, most adults who remained uninsured at the end of 2014 were low or middle income, were in a family with a worker, and were people of color. Extending coverage to the eligible remaining uninsured has the potential to continue efforts to reach those who have historically been left out of coverage. In addition, there is limited evidence that older or sicker adults disproportionately gained coverage in 2014; while some of the remaining uninsured may be hard-to-reach populations, survey findings indicate that this group has a need and desire for coverage. Stakeholders in the state noted that efforts to reach these populations were ongoing.
Cost continues to prevent many uninsured adults from seeking coverage. While many people focused on website glitches and administrative barriers during 2014, uninsured adults say that the reason they still lack coverage is because it’s too expensive, with most not even trying to get ACA coverage, and many who did still saying they are ineligible or believe the coverage is too costly. While some uninsured adults are ineligible for assistance, most can receive some help under the law. Thus, there may be a continuing lack of awareness of new coverage options and financial assistance, particularly among those who are likely eligible for Medi-Cal. Alternatively, it is possible that many are aware of available financial assistance but still believe that coverage is still too costly. Subsidies for Covered California are set at the federal level and are available on a sliding scale, and premium contributions can range from 2% of income for those below 133% FPL to 9.5% of income to those between 300%-400%FPL. Even with financial assistance, people within these higher income groups may find it difficult to afford these premiums, particularly in a high-cost state such as California. Experts reiterated survey findings about cost, noting that, in their enrollment efforts, Medi-Cal was an “easier sell” because enrollees do not pay premiums. Stakeholders commented that, aside from the state providing additional subsidies with its own funds, which was unlikely in the current budget environment, there was little they could do to address affordability issues in Covered California. In addition, the average level of subsidy received by Covered California enrollees ($5,200) implies that most who signed up for that coverage during the first years’ open enrollment had lower incomes.79 Officials would now like to focus on drawing in middle-income residents, which may be challenging because they will not receive large subsidies. Messages that focus on low-cost or free coverage being available to most uninsured Californians and the importance of having coverage for financial protection may help address this challenge. Other states are pursuing approaches to further lowering cost of coverage for low-income residents, such as developing a Basic Health Plan that covers low-income (up to 200% FPL) residents through state-contracting plans outside the Marketplace80 or using an existing Medicaid waiver to provide wraparound subsidies to Marketplace-eligible individuals previously eligible for state-financed or Medicaid coverage.81
Given the relatively high share of the remaining uninsured of Hispanic race/ethnicity, targeted outreach to this group is appropriate. In the early stages of ACA implementation in the state, there was much attention to this population but administrative barriers in reaching them. For example, there were delays in making Spanish-language materials available. Glitches on the Spanish version of the Covered California site were generally addressed only after those on the English site had been resolved. Further, Spanish-language paper forms did not become available until halfway through the open-enrollment period,82 which was particularly problematic since research carried out for Covered California showed that non-English speaking families generally do not use the internet.83 In addition, many stakeholders felt that Spanish-language outreach materials and advertisements were poorly translated, overall failing to resonate culturally for many individuals within the Hispanic community. Many of the issues with Spanish-language materials have been resolved, and the state has also taken steps to address fears among people with mixed citizenship status families. In December of 2014, Covered California announced a partnership with national and state immigrant rights organizations to inform Californians that personal details disclosed in health coverage applications are secure and confidential.84 Data from the second open enrollment period indicate that Covered California’s increased advertising and in-person outreach, targeted at hard-to-reach populations, were effective. Latinos, African-Americans and young adults were all represented in higher proportions compared to the first open enrollment period, with new enrollment of subsidy-eligible Latinos surging by 6 percentage points from 31% in year one to 37% in year two.85 Still, even with successful outreach efforts, some Hispanics in the state are likely to remain ineligible for coverage due to the ban on most undocumented immigrants receiving coverage. State efforts have extended limited Medi-Cal services to undocumented immigrants with state-only funding, and some counties have local initiatives to provide coverage to undocumented adults. However, these programs are not available statewide, and currently undocumented adults with incomes above Medi-Cal limits are ineligible for any assistance in most counties.
Community outreach may reach many remaining uninsured. Most adults who did gain coverage in 2014 did not report problems with the plan selection or enrollment process, indicating that enrollment issues do not necessarily pose a barrier to coverage. Most uninsured adults who sought ACA coverage visited the Covered California website or the Medi-Cal agency, with far fewer having contact with a provider, community group, or other outreach worker who may be able to provide one-on-one assistance. Experts note that outreach efforts in 2014 focused on enrolling as many people as possible with the resources available, which meant some hard-to-reach groups were not the primary focus. Many hard-to-reach groups, such as young adults, immigrants, and people with Limited English Proficiency (LEP), may require one-on-one assistance to enroll in coverage. In 2015, outreach resources will shrink, making these efforts more difficult. Given that most remaining uninsured adults are in a working family but work for an employer who is unlikely to offer (or be required to offer) coverage, engaging employers in these efforts may be a promising approach. In addition, experts noted that efforts varied largely across counties, so state-level engagement may be needed.
Providing needed services to the remaining uninsured
Even if outreach efforts are successful, some Californians will continue to lack coverage due to ongoing eligibility gaps or affordability concerns. Survey findings indicate that the uninsured continue to lack adequate access to care and will require assistance in accessing needed health services.
Clinics and health centers remain core providers for the uninsured and will require ongoing support to serve this population. Though uninsured adults are less likely than insured to have a usual source of care, those that do are most likely to name a clinic or health center (versus doctor’s office, HMO, or other location). Many clinics offer services at greatly reduced cost or on a sliding scale relative to income, which makes them affordable options for the uninsured. Indeed, most uninsured adults said they chose their site of care based on affordability. California safety net providers are likely to play an ongoing, core role in serving the uninsured. However, experts note that these providers are also adapting to meet the changing health care environment in California, including becoming “providers of choice” to retain patients as they gain coverage and expanding primary care capacity to meet demand.
While some uninsured are able to navigate the system when they need care, most are not and face serious consequences as a result. Some uninsured people report that they receive regular care, preventive services, and can access care when they need to, but these individuals are the exception: survey results repeatedly indicate inferior access to care for people who lack insurance coverage compared to those who have coverage. In addition, the uninsured face negative financial consequences of having to pay out-of-pocket for care. Experts noted that access to care for the uninsured varies by region within the state. Some areas, particularly rural areas, have provider shortages for both insured and uninsured people. In addition, while some counties provide services to undocumented individuals, not all do, and those that do vary greatly in the scope of these services. Some local initiatives aim to address access barriers among the uninsured by providing insurance or insurance-like coverage, rather than just direct services, for low-income uninsured people. For example, Healthy San Francisco and My Health LA (MHLA) provide limited coverage for uninsured residents of San Francisco or LA county, respectively, regardless of immigration status. Programs such as these could increase access to health services for California’s uninsured and underinsured and could serve as models for other localities. Since people will continue to lack coverage under the ACA, planned efforts to deliver services to those who lack coverage when they need them may be necessary.
Improving care for the insured
While coverage gains have resulted in increased access to care and financial protection, there is still a need to improve affordability and access for the insured. Newly insured individuals may need help navigating the health system, and plans and providers may need further refinement to meet the new need for care.
While most adults with coverage have positive views and experience with their health plan across coverage type, consumer education about health insurance and health care may be needed. Large majorities of insured Californians across coverage types gave their plans excellent or good ratings, most said they understood their plan, and small numbers reported problems with their plans. However, compared to adults who had coverage before 2014, newly insured adults were less likely to understand the details of their plan and, for some outcomes, more likely to report problems communicating with their provider. Experts in the state noted that, during outreach, assistors found that they had to explain very simple concepts about health insurance (e.g., what it means to have a deductible, how a co-payment works, how to pay premiums); they also noted that many people appeared to not understand what their plan covered (e.g., that all plans covered preventive care) or how to use their insurance once they obtained it. They noted that while initial outreach efforts were focused on signing people up rather than educating them about how to use coverage, education about health insurance and health care is the next phase of bringing people into the health care system.
While coverage eases the financial strain of health care, many newly insured adults are in precarious financial situations and still report affordability problems. Compared to adults who remained uninsured in the state, newly insured Californians report lower rates of problems with medical bills and more financial security from usual or major medical costs. Still, cost remains a concern for insured adults. Covered California enrollees are especially sensitive to costs, with most picking their plan based on cost and many saying it is still difficult to afford the premium. Newly insured adults also reported higher rates of financial insecurity about medical bills than adults who were insured before 2014. While premium and cost-sharing subsides are set at the federal level, and Medi-Cal already limits enrollees’ out-of-pocket expenses to very low (if any) levels, continued attention to whether affordability measures in place are sufficient may provide insight into people’s take-up and use of new coverage.
Newly insured individuals may need interventions to help them navigate the system to access needed care. Though newly insured adults report better access than their uninsured counterparts, on some measures, they are more likely to report barriers to care than adults who had coverage since before 2014. For example, newly insured adults were more likely than previously to say it was difficult to travel to care, that a provider would not take them as a new patient, or that they postponed needed care. These barriers could be related to several factors, including difficulty finding a provider, problems navigating the health system and health insurance networks, misunderstanding of how to use coverage and when to seek care, or concerns about out-of-pocket costs. In discussing barriers to care among the newly insured, experts frequently mentioned issues related to network adequacy. In Medi-Cal, low reimbursement rates have made it difficult to contract with providers in some cases, and the state is monitoring networks closely. In Covered California, experts noted that some plans established narrow networks to contain costs and added that some provider directories were inaccurate. Advocates in the state have pushed for legislation to address these issues, and in January 2015, the state issued an emergency regulation to address network issues in Covered California.86 In addition, the state is focusing on continuing delivery system transformation in Medi-Cal to provide better coordinated care for people. Under the proposed Section 1115 waiver renewal, the state aims to undertake efforts such as behavioral health/physical health integration, increase attention to social determinants of health and access, system redesign for ambulatory care, and care coordination for high-need populations, among other initiatives.87
Attention to coverage transitions and coordinated care may help people from losing coverage. Nearly a fifth of adults who were uninsured in fall 2014 said that they had lost their coverage since the start of 2014. One way in which the state is trying to improve coverage transitions is by enrolling Medi-Cal beneficiaries transitioning from Covered California into the same plan (if available) with no lapse in coverage. In addition, when patients are transitioned to a different plan, they have the right to request continuity of care by being matched to plans that include their primary care physician.88
U.S. Census Bureau: State and County QuickFacts. Data derived from Population Estimates, American Community Survey, Census of Population and Housing, State and County Housing Unit Estimates, County Business Patterns, Nonemployer Statistics, Economic Census, Survey of Business Owners, Building Permits , http://quickfacts.census.gov/qfd/states/06000.html. ↩︎
California Department of Health Care Services. LIHP September2013 Monthly Enrollment (November 15, 2013). ↩︎
Covered California Blog, Covered California’s Historic First Open Enrollment Finished with Projections Exceeded; Agents, Counselors, Community Organizations and County Workers Credited as Reason for High Enrollment in California, (April 2014) http://news.coveredca.com/2014/04/covered-californias-historic-first-open.html↩︎
Covered California Blog, Covered California’s Historic First Open Enrollment Finishes with Projections Exceeded; Agents, Counselors, Community Organizations and County Workers Credited as Reason for High Enrollment in California, (April 2014) http://news.coveredca.com/2014/04/covered-californias-historic-first-open.html↩︎
Wilper AP, Woolhandler S, Lasser KE, McComick D, Bor DH, Himmelstein DU. Hypertension, diabetes, and elevated cholesterol among insured and uninsured US adults. Health Affairs. 2009;28(6):w1151-9. ↩︎
Coverage Matters: Insurance and Health Care, Committee on the Consequences of Uninsurance, Board on Health Care Services, Institute of Medicine, National Academy Press, 2001. ↩︎
Based on comparison of 2013 and 2014 Kaiser Survey of Low-Income Americans and the ACA. ↩︎
Based on comparison of 2013 and 2014 Kaiser Survey of Low-Income Americans and the ACA. ↩︎
Howard, H. and C. Shearer. “State Efforts to Promote Continuity of Coverage and Care under the Affordable Care Act.” Journal of Health Politics, Policy and Law, Vol. 38, No. 6, December 2013. ↩︎
Covered California Blog, Covered California Partners with National Immigrant Rights Organizations to Reassure Consumers in California and Nationally That Immigration Information Is Safe, Secure and Confidential, (December 2014) http://news.coveredca.com/2014/12/covered-california-partners-with.html↩︎
In January 2014, the major coverage provisions of the 2010 Affordable Care Act (ACA) went into full effect. These provisions include the creation of a new Health Insurance Marketplace where people can purchase coverage and middle income families can receive premium tax credits to offset the cost. In Missouri, the federal government is operating the Marketplace, as the state decided to not operate its own. The ACA also included an expansion of Medicaid to cover low-income adults, but the Supreme Court’s 2012 ruling effectively made Medicaid expansion optional for states. As of May 2015, Missouri had not expanded its Medicaid program, known as MO HealthNet, to cover more adults under the ACA. As a result of this decision, many low-income adults in Missouri remain without affordable health insurance options. Using findings from the 2014 Kaiser Survey of Low-Income Americans and the ACA, this report examines the uninsured population who would largely be eligible for Medicaid if Missouri were to expand. Specifically, it focuses on the low-income uninsured in Missouri, comparing who they are, their access to health care, and their financial situation to those enrolled in Missouri’s Medicaid program and to the low-income privately insured. It also examines why low-income uninsured adults in the state remain uninsured and their options for gaining coverage in 2015.
Key Findings
Who Are the Low-Income Uninsured in Missouri?
Because coverage options for the low-income uninsured in Missouri are largely the same as before the ACA, few people gained coverage in 2014, and the profile of the low-income population without coverage is largely the same as it was before the ACA. As in the past, being uninsured is a long-term problem: seven in ten of the low-income uninsured report having been uninsured for more than one year. The majority of the low-income uninsured are non-Hispanic White, about half are male, and the majority are under 35. About four in ten low-income uninsured have dependent children, as does about four in ten low-income privately insured, but the children of the low-income privately insured are more likely to be insured. Low-income uninsured adults are more likely to report having poorer health than the low-income privately insured, and they are also more likely to have unmet health needs.
How Do the Low-Income Uninsured Access Care?
As in the past, where we found that low-income adults without coverage in Missouri continue to lag behind their insured counterparts in access to care, this year’s survey findings continue to show access barriers among uninsured adults in the state. The low-income uninsured are less likely than MO HealthNet enrollees or the low-income privately insured to report having a usual source of care or to have a regular doctor at a usual source of care, indicating that they are less likely to be linked to care than others. The low-income uninsured also use medical care at lower rates and ultimately go without needed care more frequently than those enrolled in MO HealthNet or the low-income privately insured. When uninsured adults do receive care, clinics and health centers are an important source of care for them: of those with a usual source of care, four in ten usually go to a doctor’s office or HMO1 for their care, and about four in ten go to a clinic or health center.
How Does Coverage Affect Financial Security?
Although all low-income people in the state experience varying degrees of financial insecurity, low-income uninsured adults’ financial insecurity is exacerbated by their lack of insurance. The low-income uninsured report higher rates of having problems paying medical bills than those enrolled in MO HealthNet or the low-income privately insured. Although many of those enrolled in MO HealthNet are generally financially insecure, only a third are not confident they can afford usual medical costs and only a third are not confident they can afford major medical costs. By contrast, over three quarters of the low-income uninsured are not confident they can afford usual medical costs, and close to nine out of ten are not confident that they can afford major medical costs. This worry has an effect on people’s well-being: a third of the low-income uninsured report that worry about medical costs affected their job performance, family relationships, or ability to sleep.
Why Are People Still Uninsured and What Are Their Coverage Options?
The majority of low-income uninsured adults say that the main reason they remain uninsured is because of cost. Fewer low-income uninsured in Missouri than a year ago say the main reason they are uninsured because of job-related reasons, such as not being employed or not being eligible for employer provided coverage. Nearly half of low-income uninsured adults tried to obtain MO HealthNet or Marketplace insurance in 2014, but most were told they were ineligible or found the coverage available to be unaffordable. The majority of the low-income uninsured are not eligible for employer sponsored coverage, either because they do not work, their employer doesn’t offer coverage, or they are not eligible for employer sponsored coverage, leaving them with few options for affordable coverage in 2015. Few low-income uninsured adults said they thought they would gain coverage in the upcoming year.
Policy Implications
The survey findings indicate that many low-income uninsured sought insurance coverage in 2014 but found few affordable options. The majority are not eligible for coverage through an employer, even though most are in a working family. Purchasing non-group coverage is the only remaining option for most, but those under the poverty level are ineligible for subsidies in the Marketplace. As a result, insurance remains too expensive for many. However, uninsured adults in the state still have health needs, many of which are not being adequately met, and will continue to face financial hardship in meeting those needs without a source of coverage.
Without the Medicaid expansion, the safety net remains an important source of care for the uninsured in the state. However, these providers face the possibility of revenue cuts in the future. Disproportionate Share Hospital (“DSH”) funding to hospitals will decline starting in 2018, without the expected balance of an increase in the number of Medicaid patients. Further, the Supreme Court decision in King v. Burwell may eliminate subsidies for people covered through the federal marketplace, leaving community clinics with less revenue if privately insured patients cannot afford insurance without subsidies. Ultimately this strain may limit the amount of care that the safety net can provide to the uninsured. If coverage options remain limited for low-income individuals in the state, it will be important to continue to monitor the ability of the uninsured to access services and the capacity and fiscal stability of the providers that serve them.
Lastly, the survey indicates some areas of improvement for MO HealthNet as it exists now. Some low-income uninsured reported that their insurance application was still pending as of Fall 2014, serving as a reminder of the importance of a streamlined application system. In addition, the survey shows MO HealthNet enrollees are linked to and use the health care system, but about half have encountered delays in needed services. While most ultimately do receive the care that they need, ensuring timely access to needed services is an important policy goal in making sure Medicaid works for the people it covers.
Report: Introduction
In January 2014, the major coverage provisions of the 2010 Affordable Care Act (ACA) went into full effect in Missouri and across the country. These provisions include the creation of a new Health Insurance Marketplace where people can purchase coverage and middle income families (between about $27,300 and $79,200 for a family of three in 2014) can receive premium tax credits to offset the cost. In Missouri, the federal government is operating the Marketplace through the healthcare.gov portal, as the state decided to not operate its own. Under the ACA, the Medicaid expansion was intended to be the means of providing affordable coverage to low-income adults (about $27,300 or less for a family of three in 2014), but the Supreme Court’s 2012 ruling in NFIB v. Sebelius effectively made Medicaid expansion optional for states. As of May 2015, Missouri had not expanded its Medicaid program, known as MO HealthNet. As a result of this decision, many low-income adults in Missouri remain without affordable health insurance options.
The majority (64%) of adults who remain without insurance coverage in Missouri are in the income range for Medicaid expansion. There is no deadline for the state to opt to expand its Medicaid program, and many in the state continue to argue for expansion. To inform this debate, this report uses the 2014 Kaiser Survey of Low-Income Americans and the ACA to profile who the low-income uninsured adults in Missouri are, what their health care access and financial security experiences have been, and why they remain uninsured. Findings from the 2013 Kaiser Survey of Low-Income Americans and the ACA, fielded prior to the start of open enrollment for 2014 Marketplace coverage, provided a baseline snapshot of health insurance coverage, health care use and barriers to care, and financial security among the insured and uninsured adults at the starting line of ACA implementation and discussed how those findings could inform early implementation.2 The 2013 survey included both a national sample and a Missouri sample, funded by the Missouri Foundation for Health. In the fall of 2014, we conducted a second wave of the Kaiser Survey of Low-Income Americans and the ACA nationally and in Missouri (again with support from the Missouri Foundation for Health) to understand how these factors changed under the first year of the law’s main coverage provisions. The survey, which included a state-representative sample of 1,864 nonelderly (age 19-64) Missouri adults, was conducted between September 2 and December 15, 2014, with the majority of interviews (68%) conducted prior to November 15, 2014 (the start of open enrollment for 2015 Marketplace coverage; Medicaid enrollment is open throughout the year).
To provide a meaningful comparison for the low-income uninsured in the state, we compare their experience to that of other low-income populations. Specifically, we compare the uninsured with incomes at or below 138% of poverty (“the low-income uninsured”) to enrollees in Missouri’s Medicaid program, also known as “MO HealthNet,” the program that would serve most uninsured adults should the state expand Medicaid. Most (79%) MO HealthNet enrollees have incomes below 138% of poverty. In stark contrast, however, only about one in ten (11%) of the privately insured in Missouri have family incomes at or below 138% of poverty. Thus, in comparisons to the privately insured, we restrict the analysis to the privately insured with incomes at or below 138% of poverty (“the low-income privately insured”). Additional tables provide parallel results for insured and uninsured individuals in higher income groups. A full description of the methods underlying the survey and analysis are available online.
Report: Background: Aca Implementation In Missouri
In 2013, the last year before open enrollment, 5,001,000 non-elderly adults lived in Missouri, 12% of whom were uninsured.3 Although this rate was below the national average, Missouri faces disparities in health insurance and access to care. One in three people in Missouri live in a primary care health professional shortage area. About a third (37%) of the Missouri population lives in a rural setting, where poverty rates are higher than in cities, and many do not have access to employer sponsored coverage. In addition, a large percentage of the uninsured in Missouri live in St. Louis and Kansas City, the two largest cities in the state.4 In 2014, the St. Louis area was the setting for protests and riots following the shooting death of unarmed teenager Michael Brown. Along with many other important issues, these protests have brought attention to the economic disparities existing in these communities and the consequences of these disparities, which include the health and well-being of their residents.5
Medicaid and the Safety Net
MO HealthNet, Missouri’s Medicaid program, currently provides coverage to low-income children, some of their parents, pregnant women, the elderly, and individuals with disabilities. Prior to the ACA, all states expanded eligibility levels for children to levels beyond that for adults. In Missouri, children with family incomes up to 305% of poverty (about $60,400 for a family of three in 2014) are eligible for coverage through Medicaid or the Children’s Health Insurance Program (CHIP). Eligibility for adults is limited to those with dependent children with incomes below 23% of poverty (about $4,600 for a family of three in 2014), one of the lowest eligibility levels in the nation. The Medicaid eligibility level for adults has remained low since 2005, when Missouri lowered eligibility levels amidst great debate in response to an economically-driven budget shortfall.6 Non-disabled adults without dependent children remain ineligible for Medicaid at any level. As in all states, regardless of whether or not they have expanded Medicaid, undocumented immigrants are ineligible for Medicaid under federal rules. The state did enact the option to cover income-eligible pregnant women regardless of immigration status through CHIP’s unborn child option, called “Show-Me Healthy Babies,” though this program was not implemented as of April 2015.
The uninsured in Missouri continue to rely on safety-net services when they need care. Most notably, the city and county of St. Louis provide funding to health centers and clinics through an 1115 Medicaid waiver, known as Gateway to Better Health. Through the waiver, uninsured nonelderly adults who live within the City and County limits, and who are not eligible for Medicaid, Medicare, or the Marketplace, are able to access primary and specialty care.7
ACA Medicaid Expansion and the Marketplace
Although the ACA envisioned providing insurance to the low-income population through Medicaid expansion, the Supreme Court’s ruling in June 2012 effectively made this optional to the states. Missouri has not expanded its MO HealthNet program under the ACA. Governor Jay Nixon supports the expansion, but faces opposition in the Missouri General Assembly, where a number of legislators oppose any form of expansion. Opposition arguments have centered on reforming Medicaid before expanding it and lack of trust that the Federal government would provide funding at the levels promised.8 However, many in the state continue to advocate for expansion, including the Missouri Hospital Association. Arguments in favor of expansion focus on extending coverage to the uninsured, financial support for rural hospitals (particularly in light of upcoming cuts in Disproportionate Share Hospital funding9 ), and the economic benefits of new jobs in Missouri.
Because Missouri opted not to operate its own Marketplace, the federal government operates the Marketplace in the state.10 On March 4, 2015, the Supreme Court heard arguments in King v. Burwell challenging the legality of subsidies to people who purchased insurance through Federally-run Marketplaces. The Supreme Court will provide their ruling by the end of their term in June 2015. If they rule in favor of the plaintiffs, individuals who purchased coverage through the Marketplace with a subsidy would lose that subsidy, likely making such coverage unaffordable for them. Additionally, the employer requirement for coverage under the ACA, which goes into effect in 2015 and requires firms with more than 50 workers to pay a penalty if they do not offer affordable coverage and an employee purchases subsidized coverage through the Marketplace, would be nullified.11
Outreach and Enrollment in 2014
Like many other states, before open enrollment for 2014 coverage began, the Missouri General Assembly passed legislation creating requirements for outreach and enrollment workers, known as navigators. While these requirements were struck down by a Federal judge in January 2014, the legislature has continued to propose or pass legislation that navigators must pass exams, secure bonds, and pass background checks.12 Despite this climate and limited funding, advocates and other state organizations worked to enroll those eligible for coverage.13
On October 1, 2013, open enrollment for 2014 coverage began, but in the first few months, people experienced numerous technical difficulties with the Federal Marketplace website. By the end of open enrollment in 2014, 152,335 people had enrolled in Marketplace coverage in Missouri, accounting for 24% of the Missouri Marketplace eligible, a little below the national average of 28% of Marketplace eligible enrolling.14 Enrollment rates varied within the state, tending to be higher in urban and suburban areas than in rural areas.15
The federal government sends applications for enrollees ineligible for Marketplace enrollment to the state to determine Medicaid eligibility. However, in 2014, there were problems synchronizing the two websites. The Missouri Department of Social Services reported receiving 56,000 applications for MO HealthNet in PDF form that needed to be entered by hand. Most of these applications were deemed ineligible for MO HealthNet, but this influx of applications led in part to a backlog.16 In July of 2014, CMS announced that they would be monitoring the backlog of Medicaid applications in Missouri as well as five other states.17 Missouri has worked to resolve these issues, and as of February 2015, the state reported that there were 14,000 applications waiting to be reviewed, which Missouri Social Services deems to be close to an acceptable case-load.18 Regardless, monthly MO HealthNet enrollment has remained relatively low, increasing by 3.5 percent since before the ACA, as of February 2015.19 It is possible that some of this slow enrollment growth is explained by the recovering economy.20
Report: Who Are The Low-income Uninsured In Missouri?
Because coverage options for the low-income uninsured in Missouri are largely the same as before the ACA, few people gained coverage in 2014, and the profile of the low-income population without coverage is largely the same as it was before the ACA. As in the past, being uninsured is a long-term problem: seven in ten of the low-income uninsured report having been uninsured for more than one year. The majority of the low-income uninsured are non-Hispanic White, about half are male, and the majority are under 35. About four in ten low-income uninsured have dependent children, as does about four in ten low-income privately insured, but the children of the low-income privately insured are more likely to be insured.
The uninsured have been without coverage for long periods of time. While some people experience short spells of uninsurance due to job changes or other changes in life circumstances, as was the case before the ACA,21 lack of coverage is a chronic problem for most low-income uninsured adults. Only about a quarter of the low-income uninsured (27%) was uninsured for less than one year. Three in ten were uninsured for one to five years, about three in ten (29%) were uninsured for more than five years but have had coverage in the past, and about one in ten had never been insured (see Additional Table A1). As discussed below, most low-income adults have few options for affordable coverage.
Reflecting the general demographics of the state, the majority of the low-income uninsured population is non-Hispanic and White. About 70 percent of the low-income uninsured are non-Hispanic Whites. Similarly, about 70 percent of MO HealthNet enrollees and of the low-income privately insured are non-Hispanic Whites. Though non-Hispanic Black adults account for about 11% of the overall adult population in the state, about 20% of each of the coverage groups is comprised of non-Hispanic Blacks (Figure 1). This pattern reflects the link between race and income, since Black adults in the state are more likely to be low-income than adults of other race/ethnicities (data not shown).
Figure 1: Race/Ethnicity of Nonelderly Adults in Missouri, by Insurance Coverage in Fall 2014
About half of the low-income uninsured are male. A slight majority (52%) of the low-income uninsured are male. In contrast, only a third (32%) of MO HealthNet enrollees are male, as women are more likely to meet family-related eligibility criteria such as being pregnant or being a caretaker parent (Figure 2). Male adults without children may obtain MO HealthNet eligibility through a disability pathway. Women make up about six in ten (61%) of the low-income privately insured, but this share is not significantly different from the uninsured.
Figure 2: Gender of Nonelderly Adults in Missouri, by Insurance Coverage in Fall 2014
The majority (62%) of low-income uninsured are under the age of 35. Only 22 percent of the low-income uninsured are ages 45-64, compared with 60 percent of those enrolled in MO HealthNet (Figure 3). Although not statistically different from the low-income uninsured, nearly a third of the low-income privately insured are ages 45-64. Younger adults have looser ties to employment than older adults and thus are more likely to be low-income or in jobs with limited benefits. Additionally, though the uninsured tend to be thought of as the “young invincibles,” the majority (60%) of the mid-income uninsured, most of whom are eligible for subsidies, are over 35 (see Additional Table A1).
Figure 3: Age of Nonelderly Adults in Missouri, by Insurance Coverage in Fall 2014
Although the patterns of marriage and having children are similar between the low-income uninsured and the low-income privately insured, the latter’s children are more likely to all have health insurance. About three quarters (78%) of the low-income uninsured are not married, and nearly four in ten (38%) have dependent children. Similarly over two thirds (68%) of low-income privately insured are not married, and over four in ten (41%) report having dependent children (Figure 4). Nearly three quarters (73%) of those enrolled in MO HealthNet say they do not have children, likely reflecting Missouri’s low income eligibility limit for adults with dependent children. Many adults enrolled in MO HealthNet do so because they have a disability, handicap, or chronic disease (data not shown). Other women without children may qualify through their pregnancy.
Figure 4: Family Status of Nonelderly Adults in Missouri, by Insurance Coverage in Fall 2014
Of those enrolled in MO HealthNet who have children, nearly all have health insurance provided to their children. Similarly, nearly all low-income parents with private coverage have insured children. However, about a third of the low-income uninsured who have children do not have insurance provided to all of their children (Figure 5). Given children’s eligibility levels for MO HealthNet, most of these children are likely eligible for public coverage. This finding supports the generally known pattern that children whose parents have health insurance are more likely to be covered themselves. Additionally, research has shown that among children who are already insured, those whose parents are also insured are more likely to be linked to the health care system and receive needed care.22
Figure 5: Insurance Status of Missouri Nonelderly Adults’ Children, by Insurance Coverage in Fall 2014
Over half of the low-income uninsured live in families with at least one person working full or part-time. One third of the low-income uninsured either works full-time or has a spouse who works full-time. Nearly a quarter (24%) of the low-income uninsured works part-time or their spouse works part-time. In contrast, nearly seven in ten low-income privately insured is in a family where they or their spouse works full-time, and about a seventh (14%) of the low-income privately insured works part-time or their spouse works part time. Health insurance is more frequently provided as a fringe benefit to full-time workers than to part-time workers, as reflected in the higher share of full-time workers within the low-income privately insured. At 80 percent, a far larger share of MO HealthNet enrollees report neither working nor having a working spouse compared to the low-income uninsured, of whom 43 percent report not having a worker in the family (Figure 6). This pattern reflects high disability rates among the adult MO HealthNet population, which may prevent many from working. It also reflects the very low Missouri Medicaid eligibility level for non-elderly adults with dependent children. In Missouri, a non-elderly adult with dependent children can earn no more than 23% of poverty, or about $4,600 a year or $380 a month for a family of three and still be eligible for Medicaid.
Figure 6: Family Work Status of Nonelderly Adults in Missouri, by Insurance Coverage in Fall 2014
Reflecting Medicaid’s role in caring for people with substantial health needs, MO HealthNet enrollees report having poorer health status than other adults. However, the low-income uninsured likely have unmet health needs. Over six in ten (63%) of MO HealthNet enrollees have fair to poor health, compared with four in ten (41%) low-income uninsured and two in ten (20%) low-income privately insured. While 37 percent of the low-income uninsured report having an ongoing condition, only 30 percent take a prescription. In contrast, a greater share of people who are enrolled in MO HealthNet report taking prescriptions than report having an ongoing condition when enrolled in MO HealthNet. The same is true of those who are low-income privately insured (Figure 7). This suggests the possibility that the low-income uninsured have known unmet needs, as well as undiagnosed conditions.23 Notably, middle-income uninsured adults were more likely than low-income uninsured adults to report excellent or very good health and less likely to report ongoing conditions (Additional Table A1).
Figure 7: Health Status of Nonelderly Adults in Missouri, by Insurance Coverage in Fall 2014
Report: How Do The Low-income Uninsured Access Care?
The ultimate goal of expanding health insurance coverage is to help people access the medical services that they need. A large body of literature has documented that people with insurance are more likely than those without to be linked to regular care, are less likely to postpone care when they need it, and have an easier time accessing services. As in the past, where we found that low-income adults without coverage in Missouri continue to lag behind their insured counterparts in access to care,24 this year’s survey findings continue to support the literature, indicating that the low-income uninsured are less likely to have a usual source of care than those enrolled in MO HealthNet or the low-income privately insured. The low-income uninsured also use medical care at lower rates, and ultimately go without care more frequently than those enrolled in MO HealthNet or the low-income privately insured.
The uninsured are less likely to report being linked to care than those with coverage. The low-income uninsured are less likely than those enrolled in MO HealthNet or those who are low-income and enrolled in private coverage to have usual source of care or a place to go when they are sick or need advice about their health (not counting the emergency room); they were also less likely to have a regular doctor at their usual source of care (Figure 8). Having a usual source of care or regular doctor is an indicator of being linked to the health care system and having regular access to services. These patterns reinforce a large body of research that finds that having coverage is associated with improved access to care.
Figure 8: Share of Nonelderly Adults in Missouri with a Usual Source of Care or Regular Provider, by Insurance Coverage in Fall 2014
Clinics and health centers remain an important source of care for the low-income uninsured. Among those who have a usual source of care, the low-income uninsured are less likely than the low-income privately insured to say they received care in a physician’s office. Four in ten of the low-income uninsured who have a usual source of care receive care there, as opposed to nearly six in ten (59%) of the low-income privately insured. Over half of those enrolled in MO HealthNet say they receive care in a physician’s office, although this result is not statistically different from the low-income uninsured. While a physician’s office is the most common location for receiving care amongst the low-income uninsured with a usual source of care, it is closely followed by clinics and health centers (38%) (Figure 9). Although low-income adults across the board are most likely to say they chose their usual source of care because their preferred provider is there (Additional Table A2), about a fifth of uninsured low-income adults say they chose their site of care because of affordability. Most clinics and health centers offer care on a reduced fee or sliding scale basis, making them an important source of care for low-income people without insurance.
Figure 9: Type of Place Used for Usual Source of Care among Nonelderly Adults in Missouri, by Insurance Coverage in Fall 2014
Low-income uninsured adults are less likely than other low-income adults to report using medical services and are more likely to go without needed care. Only fifty-five percent of the low-income uninsured used any medical services compared with over 90 percent (91%) of those enrolled in MO HealthNet and over 70 percent (73%) of the low-income privately insured.25 Only about a quarter of the low-income uninsured had a check-up or other preventive care visit since January 2014, compared 70 percent of those enrolled in MO HealthNet and a little over half (52%) of the low-income privately insured (Figure 10).
Figure 10: Use of Medical Services among Nonelderly Adults in Missouri, by Insurance Coverage in Fall 2014
Over twice as many low-income uninsured postponed or went without care as those who were low-income and privately insured (55% versus 25%), and about four times as many low-income uninsured never got their needed care as the low-income privately insured (41% versus 11%). Although there was no significant difference between the share of low-income uninsured adults and MO HealthNet enrollees who postponed or went without care, nearly twice as many low-income uninsured never got their needed care compared to MO HealthNet enrollees (41% versus 21%) (Figure 11). Postponing care can have major negative implications: about a quarter (26%) of the low-income uninsured postponed care, and consequently lost significant time at work, school, or other important life activities, 28% had their condition worsen, and 42% had their stress level seriously increased. These rates of serious consequences due to postponing care were higher among the uninsured population than among their publicly or privately insured counterparts.
Figure 11: Unmet Need for Care among Nonelderly Adults in Missouri, by Insurance Coverage in Fall 2014
The low-income uninsured were also more likely to go without needed care than the mid-income uninsured. Over half (55%) of the former postponed or went without care, compared with about 40 percent (39%) of the latter (Additional Table A2). This pattern could reflect lower levels of need for health care than those in the low- income range who remained uninsured or could reflect increased ability to meet need due to access to more financial resources.
Although overall, a majority of people reported effective communication with their providers, the low-income uninsured experience more difficulty effectively communicating with their providers than do the low-income privately insured and those enrolled in MO HealthNet. Once people get into care, health literacy—or “patients’ ability to obtain, process, and understand the basic health information and services they need to make appropriate health decisions”26 —plays an important role in how that care affects health outcomes. Health literacy depends on a range of factors related to patients (e.g., engagement in care), providers (e.g., how the information is communicated), service setting (e.g., the length of time of the interaction), and the nature of the visit (e.g., the complexity of health information). About six in ten (64%) of the low-income uninsured got all the information they wanted from their doctor or nurse, about six in ten (63%) felt encouraged to ask health questions, and about two thirds (65%) understood test results all or most of the time. However, these are lower rates compared to those enrolled in MO HealthNet and the low-income privately insured: nearly 90 percent of those enrolled in MO HealthNet and of the low-income privately insured got all the information they wanted from their provider, over 80 percent of each felt encouraged to ask questions, and about 80 percent of each understood their test results all or most of the time (Figure 12). While it’s not clear based on survey findings why these differences exist, it is possible that they are linked to uninsured adults’ lower likelihood of having a regular provider with whom they have an established rapport.
Figure 12: Effective Communication with Providers among Nonelderly Adults in Missouri, by Insurance Coverage in Fall 2014
Report: How Does Coverage Affect Financial Security?
Although all low-income adults face financial insecurity, having health insurance eases the concern about medical expenses. Those enrolled in MO HealthNet demonstrate the “peace-of-mind” value of health insurance. Although over half of those enrolled in MO HealthNet are financially insecure in general, only about a third are not confident that they can afford major medical costs. In contrast, low-income uninsured adults live with worry about medical costs in addition to their general financial instability.
Medical bills lead to an array of financial problems for the low-income uninsured that those with MO HealthNet or private insurance do not encounter as frequently. Despite being less likely to use services, over half (53%) of the low-income uninsured report a problem paying their medical bills. The low-income uninsured were also more likely than low-income adults with either MO HealthNet or private coverage to report serious consequences from medical bills, such as using up their savings, having difficulty paying for necessities, borrowing money, or being sent to collection (Figure 13).
Figure 13: Problems Paying Medical Bills among Nonelderly Adults in Missouri, by Insurance Coverage in Fall 2014
In addition to being more likely to report experiencing financial strain due to medical bills, the low-income uninsured are more likely than others to report living with worry about their ability to afford medical care in the future. As we found in the 2013 survey, the uninsured are much more likely than those with MO HealthNet or the privately insured to lack confidence that they can afford health care costs for usual circumstances or major illnesses.27 In 2014, over three quarters (78%) of the low-income uninsured are not confident they can afford usual medical costs, and close to nine in ten (86%) are not confident they can afford major medical costs. This is in stark contrast to the low-income privately insured, and especially to those enrolled in MO HealthNet. Although more low-income privately insured are not confident that they can afford major medical costs than the share of low-income privately insured who are not confident they can afford usual medical costs, we do not detect a difference between the share of those enrolled in MO HealthNet that are not confident that they can afford usual medical costs and those that are not confident they can afford major medical costs.
Just as higher rates of postponing care among the low-income uninsured affect these persons’ engagement in work, school, and other activities (discussed above), the worry about medical costs also affects low-income uninsured adults’ job performance, family relationships, or ability to sleep at a higher rate (36%) compared to the mid-income uninsured (17%), those enrolled in MO HealthNet (18%), and the low-income privately insured (13%) (Figure 14 and Additional Table A3).
Figure 14: Financial Insecurity Over Medical Costs among Nonelderly Adults in Missouri, by Insurance Coverage in Fall 2014
These differences in problems and worry from medical cost exist even though there are few differences in overall financial stability between the low-income uninsured adults and those enrolled in MO HealthNet. Like low-income uninsured adults, over half of adults with MO HealthNet are generally financially insecure (Figure 15). They also report similar rates of financial difficulty in paying for necessities, saving money, or paying off debt. In contrast, even though low-income adults with private insurance are similarly low-income, they are more financially secure, perhaps reflecting stability due to ties to full-time employment or connections to other resources or support.
Figure 15: Financial Security among Nonelderly Adults in Missouri, by Insurance Coverage in Fall 2014
Report: Why Are People Still Uninsured And What Are Their Coverage Options?
About half of the low-income uninsured report trying to obtain health insurance under the ACA in 2014, demonstrating that many in this population desire to be insured. The majority of this group is ineligible for coverage through their employer. Without Medicaid expansion, the only remaining option for many low-income uninsured is purchasing insurance without any subsidies to offset the cost. Consequently, it is not surprising that cost is the major reason that the low-income uninsured remain uninsured.
The majority of the low-income uninsured remain uninsured because they find coverage to be too expensive. The ACA aimed to make coverage more affordable, but Medicaid expansion was a major part of the intended design. Without Medicaid expansion or subsidies for the Marketplace, the majority (65%) of low-income uninsured report that they are without insurance because of cost. A small share (7%) report that they are uninsured because they either opposed the ACA, prefer to pay the penalty, or feel they do not need insurance (Figure 16). Notably, low-income uninsured adults in Missouri were less likely to name a job-related reason for lacking coverage in 2014 compared to 2013: 10 percent cited a job-related reason for lack of insurance in 2014 compared to 26 percent in 2013 (data not shown).
Figure 16: Reasons for Being Uninsured among Nonelderly Uninsured Adults ≤ 138% FPL in Missouri, Fall 2014
Many low-income uninsured tried to obtain ACA insurance but either encountered difficulty or were told they were ineligible. Forty-six percent of the low-income uninsured tried to obtain Medicaid or Marketplace insurance, but many encountered difficulties. About seven in ten (71%) encountered difficulty with at least one aspect of applying (Figure 17). About two-thirds (67%) tried to apply using more than one pathway. About half (46%) tried to sign up using the healthcare.gov website, about half (46%) called the Marketplace 1-800 number, and more than half (57%) visited the MO HealthNet agency (Figure 18). Ultimately, however, these people remained uninsured, saying that they were told they were ineligible and that coverage was too expensive. Interestingly, one in six (16%) of those who did apply said that their coverage was pending (Figure 19). Missouri has been working to resolve the backlog of Medicaid applications that accrued in 2014.28
Figure 17: Difficulty Applying for ACA Coverage, among Nonelderly Uninsured Adults ≤ 138% FPL in MissouriFigure 18: Pathways to Applying for ACA Coverage, among Nonelderly Uninsured Adults ≤ 138% FPL in MissouriFigure 19: Attempts to Obtain ACA Coverage and Reason for Not Getting ACA Coverage, among Nonelderly Uninsured Adults ≤ 138% FPL in Missouri, Fall 2014
The majority of low-income uninsured report not having access to employer coverage and a plurality do not think they will gain coverage in 2015. Eight in ten (82%) of the low-income uninsured are ineligible for health insurance through their employer, either because they are unemployed, their employer does not offer coverage, or because they are ineligible for coverage. Only one in six (16%) were eligible for coverage through their employer, but remained uninsured (Figure 20). The low-income uninsured population’s inability to obtain coverage through an employer is reflected in their response to whether or not they were planning on obtaining coverage in 2015: only eight percent said they were planning on getting coverage through their employer. The plurality of low-income uninsured (42%) were not planning on obtaining coverage in 2015 (Figure 21). Open enrollment for 2015 Marketplace coverage ended February 15th; while enrollment for Medicaid is ongoing, it remains limited to the levels in place before the ACA was enacted.
Figure 20: Access to Employer-Sponsored Insurance among Nonelderly Uninsured Adults ≤ 138% FPL in Missouri, Fall 2014Figure 21: Plans for Obtaining Insurance in 2015 among Nonelderly Uninsured Adults ≤ 138% FPL in Missouri, Fall 2014
Report: Policy Implications
Though the Affordable Care Act was signed into law five years ago, the state is still debating whether to expand Medicaid to cover low-income uninsured adults. As a result, many low-income Missourians remain uninsured and without an affordable coverage option. These individuals face substantial barriers to accessing needed care and financial hardship as a result of remaining without coverage.
Without Medicaid expansion, most uninsured adults are likely to remain uninsured. The low-income uninsured in Missouri have been uninsured for a long time: seven in ten have been uninsured for more than one year. Many low-income uninsured tried to obtain health insurance in 2014; however, cost ultimately is the major barrier preventing obtaining insurance. Without significant financial assistance, most uninsured adults are likely to remain without coverage. Further, few are likely to gain coverage through a job. The majority of the low-income uninsured are not eligible for health insurance through their employer, even though most are in a working family. Additionally, a lack of health insurance can affect a person’s ability to work: the survey showed that about a quarter of the low-income uninsured postponed care and as a result lost time at work, school, or other life activities. This finding suggests that for many in Missouri, being low-income and uninsured can lead to a cycle of being low-income and uninsured. Last, while some low-income uninsured in the state are eligible for tax credits for private coverage through the Marketplace, take-up in Missouri has lagged that of other states, and many who have sought or purchased Marketplace coverage indicate that they continue to face affordability challenges.29
The safety net of clinics and health centers continues to play a pivotal role in serving the uninsured population in the state. With nearly four in ten of the low-income uninsured who have a usual source of care identifying health centers or clinics as that source of care, there is a demonstrated continued need for the health care safety net. While federally qualified heath centers (FQHCs) in states that expanded Medicaid are encountering increased revenues as Medicaid pays for a larger share of their patients’ services,30 health centers in Missouri are not seeing an infusion of revenues due to coverage gains. If the Supreme Court decides in King v. Burwell that subsidies are to be made available only to those that obtained insurance in a state-based marketplace, Missouri FQHCs will also lose revenue from patients who can no longer afford their private coverage purchased through the Marketplace.31 In addition to the strain placed on FQHCs, hospitals that received DSH funding will encounter cuts to their funding starting in 2018,32 without the expected balance of an increase in the number of Medicaid patients. This strain is may affect hospital financial viability, especially those in rural areas. In 2014, two of Missouri’s 74 rural hospitals shut down, further contributing to Missouri’s already known problem of primary care health professional shortages. If coverage options remain limited for low-income individuals in the state, it will be important to continue to monitor the ability of the uninsured to access services and the capacity and fiscal stability of the providers that serve them.
Enrollment simplification and patient navigation may improve enrollment and use of services for adults in MO HealthNet. The survey indicates that some uninsured people are waiting to know if they are eligible for coverage or not. About one in six of the low-income uninsured who tried to obtain insurance reported that their application was still pending. In July 2014, CMS began monitoring the MO HealthNet application backlog, as at one point in 2014, there were over 50,000 MO HealthNet applications that were waiting to be reviewed. Missouri reports that they have worked out many of the issues causing this, and have reduced the backlog substantially,33 but this finding is a reminder of the effect of a backlog, and the importance of coordination between the federally-facilitated Marketplace and MO HealthNet application systems.
Once people who are eligible for MO HealthNet are able to obtain insurance, they may encounter access to care issues. The survey findings indicate that nearly half of those enrolled in MO HealthNet said they postponed or went without needed care in 2014. Although four out of five MO HealthNet enrollees did eventually get all needed care, this finding suggests a potential for improving patient navigation within the MO HealthNet program. MO HealthNet enrollees may experience delays in care for several reasons, including difficulty finding a provider, challenges in traveling to providers or getting time off work to see providers, or difficulty navigating plan networks. Future work that investigates what drives these challenges will be important to ensuring timely access to needed services and that Medicaid works for the people it covers.
The authors would like to thank independent consultant Anthony Damico for his help in analyzing the survey data.
Tables
Table A1: Demographics of Adults in Missouri, by Insurance Coverage
Uninsured ≤138% FPL
MO HealthNet (Medicaid)
Private Insurance ≤138% FPL
Uninsured ≥138% FPL
Other Insured ≥138% FPL
Work Status
Full Time Working Family
33%
17%*
69%*
67%*
82%*
Part Time Working Family
24%
—
14%
—
5%*
Unemployed Family
43%
80%*
17%*
19%*
13%*
Race/Ethnicity
Hispanic
6%
—
6%
—
3%*
White, Non-Hispanic
68%
67%
73%
70%
85%*
Black, Non-Hispanic
18%
19%
20%
20%
7%*
Other
9%
9%
—
—
5%
Gender
Female
48%
68%*
61%
37%
50%
Male
52%
32%*
39%
63%
50%
Citizenship
Citizen
97%
100%*
97%
99%
98%
Age
19-25
35%
—
33%
21%
10%*
26-34
27%
13%*
20%
19%
15%*
35-44
16%
14%
16%
25%
23%
45-64
22%
60%*
31%
35%
52%*
Family Status
Married with dependent children
15%
10%
18%
19%
34%*
Married, no dependent children
7%
—
14%
21%*
31%*
Not married with dependent children
23%
16%
23%
—
8%*
Not married, no dependent children
55%
66%
45%
42%
27%*
Insurance Status of Participants’ Children
Doesn’t have Children
62%
73%
59%
63%
58%
All Children are insured
23%
25%
36%*
19%
40%*
Some or all children are uninsured
14%
—
—
18%
—
Health Status
Excellent/Good Health
59%
37%*
80%*
90%*
84%*
Fair/Poor Health
41%
63%*
20%*
—
15%*
Excellent/Good Mental Health
76%
61%*
85%
92%*
92%*
Fair/Poor Mental Health
24%
38%*
15%
—
8%*
Has Ongoing Condition
37%
65%*
33%
19%*
37%
Taking Rx
30%
76%*
44%*
—
49%*
Rural/Urban
Rural
29%
39%
29%
37%
23%
Urban or Suburban
65%
58%
67%
55%
74%*
Length of Time Uninsured
Uninsured less than 1 year
27%
NA
NA
25%
NA
Uninsured 1-5 years
30%
NA
NA
36%
NA
Uninsured 5+ years
29%
NA
NA
21%
NA
Never had coverage
11%
NA
NA
—
NA
NOTES: Don’t Know and Refused responses are not shown. The “Other Insured ≥ 138% FPL” category is predominantly privately insured people with incomes greater than 138% of poverty, but also includes Medicare enrollees, those who don’t know if they are insured, those who are insured, but refused to answer with what, those waiting for coverage, and other categories of insurance.NA: Not applicable.“–“: Estimates with relative standard errors greater than 30% or with cell sizes less than 100 are not provided.* Estimate statistically significantly different from uninsured estimate at the 95% confidence level.SOURCE: 2014 Kaiser Survey of Low-Income Americans and the ACA.
Table A2: Access to Care and Health Literacy Among Adults in Missouri, by Insurance Coverage
Uninsured ≤ 138% FPL
MO HealthNet (Medicaid)
Private Insurance ≤ 138% FPL
Uninsured ≥138% FPL
Other Insured≥ 138% FPL
Usual source of care
Has a USC that is not ED
45%
79%*
78%*
40%
84%*
Of those with a USC, it is a clinic
38%
30%
24%
—
16%*
Of those with a USC, it is a doctor’s office
40%
51%
59%*
—
72%*
Of those with a USC, it is some other place
22%
18%
17%
—
12%*
Of those with USC, has regular doctor at USC
66%
86%*
79%
—
89%*
Of those with USC, changed USC
20%
—
—
—
8%*
Of those with USC, changed USC & did so because of insurance
—
—
—
—
—
Of those with USC, somewhat to very easy to travel to USC
76%
69%
91%*
—
95%*
Of those with USC, reason chose USC
Convenient
—
24%
29%
—
22%
Affordable
21%
—
—
—
5%*
Only place available
15%
7%
—
—
3%*
Preferred doc is there
37%
52%
52%
—
59%*
Good reputation
—
10%
—
—
9%
Problems getting appointments
Told could not get appt with a provider
12%
11%
—
—
4%*
Told could not get appt b/c did not take their coverage
—
—
—
—
—
Had to wait longer than reasonable for any appt.
19%
18%
8%*
—
12%
Had to wait longer than reasonable for primary care
—
—
—
0%
5%
Had to wait longer than reasonable for specialty care
—
5%
—
—
4%
Utilization
Used any medical services
55%
91%*
73%*
45%
81%*
Had Checkup or Preventive Care Visit
24%
70%*
52%*
15%
69%*
Postponed needed care
Postponed or went without care
55%
46%
25%*
39%*
24%*
Never ended up getting needed care
41%
21%*
11%*
24%*
9%*
Postponed care & as a result…
Condition worsened
28%
16%*
10%*
—
7%*
Significant loss of time at work, school or other important life activity
26%
15%*
9%*
—
4%*
Stress level seriously increased
42%
27%*
12%*
20%*
11%*
Health literacy
Always/most of the time got all the info wanted from doc
64%
87%*
89%*
—
95%*
Always/most of the time felt encouraged to ask questions
63%
84%*
83%*
—
89%*
Always/most of the time understood test results
65%
82%*
82%*
—
91%*
Always/most of the time understood how to take Rx
80%
89%
93%*
—
94%*
NOTES: Don’t Know and Refused responses are not shown. The “Other Insured ≥ 138% FPL” category is predominantly privately insured people with incomes greater than 138% of poverty, but also includes Medicare enrollees, those who don’t know if they are insured, those who are insured, but refused to answer with what, those waiting for coverage, and other categories of insurance.NA: Not applicable.“–“: Estimates with relative standard errors greater than 30% or with cell sizes less than 100 are not provided.* Estimate statistically significantly different from uninsured estimate at the 95% confidence level.SOURCE: 2014 Kaiser Survey of Low-Income Americans and the ACA.
Table A3: Financial Security Among Adults in Missouri, by Insurance Coverage
Uninsured ≤138% FPL
MO HealthNet (Medicaid)
Private Insurance ≤138% FPL
Uninsured ≥138% FPL
Other Insured ≥138% FPL
Confidence can afford usual medical costs
Confident
22%
65%*
66%*
39%*
84%*
Not confident
78%
33%*
33%*
58%*
15%*
Confidence can afford major medical costs
Confident
12%
65%*
45%*
27%*
67%*
Not confident
86%
32%*
54%*
72%*
32%*
Worry over health care costs have had major effect on…
Family relationships
21%
13%
—
—
3%*
Ability to sleep
24%
16%
—
—
5%*
Job performance, family relationships, or ability to sleep
36%
18%*
13%*
17%*
6%*
Medical Bill Outcomes
Has outstanding medical bills
45%
23%*
31%*
37%
22%*
Any problem paying medical bills
53%
24%*
26%*
36%*
16%*
Problem with medical bills led to using up savings
27%
10%*
13%*
—
9%*
Problem with medical bills led to difficulty paying for basic necessities
30%
15%*
13%*
—
6%*
Problem with medical bills led borrowing money
27%
12%*
11%*
—
5%*
Problem with medical bills led to being sent to collection
31%
13%*
15%*
24%
8%*
General financial security
Generally financial insecure
66%
55%
38%*
43%*
19%*
Somewhat/very difficult to pay for necessities
64%
61%
42%*
53%
22%*
Somewhat/very difficult to save money
85%
82%
68%*
69%*
47%*
Somewhat/very difficult to pay off debt
68%
67%
52%*
61%
36%*
Moved in past year to save money
38%
17%*
28%
25%
7%*
Increased debt in past year to pay bills
29%
31%
27%
29%
16%*
Used savings in past year to pay bills
44%
25%*
44%
30%
31%*
NOTES: Don’t Know and Refused responses are not shown. The “Other Insured ≥ 138% FPL” category is predominantly privately insured people with incomes greater than 138% of poverty, but also includes Medicare enrollees, those who don’t know if they are insured, those who are insured, but refused to answer with what, those waiting for coverage, and other categories of insurance.NA: Not applicable.“–“: Estimates with relative standard errors greater than 30% or with cell sizes less than 100 are not provided.* Estimate statistically significantly different from uninsured estimate at the 95% confidence level.SOURCE: 2014 Kaiser Survey of Low-Income Americans and the ACA.
Table A4: Reasons Why Uninsured Adults in Missouri Lack Coverage and Plans to Obtain Coverage
Uninsured ≤ 138% FPL
Uninsured ≥ 138% FPL
Reasons why uninsured
Too Expensive
65%
58%
Opposed to ACA/Prefer to pay penalty/Don’t need it
7%
19%
Told ineligible
7%
—
Unemployed/Work doesn’t offer/not eligible through work
10%
—
Other/Immigration status/Don’t know how to get it
11%
—
Attempts at obtaining insurance
Tried to get Medicaid or Marketplace coverage
46%
35%
Did not try to get Medicaid or Marketplace coverage
54%
64%
Of those who tried to obtain Medicaid or Marketplace Insurance, did so by…
Signing up on healthcare.gov or state HIM website
46%
—
Visiting a state Medicaid agency
57%
—
Calling a toll-free or 1-800 number for help
46%
—
Going to a community agency, school, church, or library
19%
—
Going to a hospital, clinic, or doctor, or other health care provider’s office for help applying
33%
—
Contacting a health insurance broker
13%
—
Tried to apply using more than one pathway
67%
—
Of those who tried to obtain Medicaid or Marketplace Insurance, found difficulty…
Finding out where to apply
43%
—
Filling in the information requested in the application
34%
—
Assembling all the required paperwork
36%
—
Submitting the application
38%
—
At least one aspect of the applying was difficult
71%
—
All aspects of applying were difficult
9%
—
Tried to obtain Medicaid or Marketplace Insurance, but could not because…
Told ineligible
48%
—
The application is still pending
16%
—
Coverage is too expensive
22%
—
Other reason
13%
—
Future Coverage
Planning on getting coverage in 2015
41%
43%
Not planning on getting coverage in 2015
42%
46%
Don’t know if getting coverage in 2015
17%
—
Planning on getting coverage in 2015 through
Medicaid/Marketplace
7%
—
ESI
8%
—
Elsewhere/Not sure
26%
27%
Don’t know where getting coverage
0%
0%
Other coverage options
ESI Eligibility
Not part of working family
51%
38%
Firm doesn’t offer coverage
20%
24%
Not eligible for coverage
11%
—
Cannot afford to pay premium/Don’t think they need coverage/Some other reason
16%
22%
NOTES: Don’t Know and Refused responses are not shown.“–“: Estimates with relative standard errors greater than 30% or with cell sizes less than 100 are not provided.* Estimate statistically significantly different from uninsured estimate at the 95% confidence level.SOURCE: 2014 Kaiser Survey of Low-Income Americans and the ACA.
Endnotes
A Health Maintenance Organization, or “HMO”, is an organization that provides comprehensive health services using a fixed payment structure or capitated rates. ↩︎
Washington University of St. Louis and Saint Louis University, For the Sake of All: A report on the health and well-being of African Americans in St. Louis and why it matters for everyone. 2014. Available at http://forthesakeofall.org/publications/. ↩︎
See Ku L and Broaddus M, “Coverage of Parents Helps Children, Too.” Center on Budget and Policy Priorities, October 20, 2006. Available at http://www.cbpp.org/files/10-20-06health.pdf. See also Sommers B, “Insuring children or insuring families: do parental and sibling coverage lead to improved retention of children in Medicaid and CHIP?” Journal of Health Economics, November 2006, Vol. 25 No. 6. ↩︎
See Decker S, Kostova D, Kenney G, and Long S, “Health Status, Risk Factors, and Medical Conditions Among Persons Enrolled in Medicaid vs Uninsured Low-Income Adults Potentially Eligible for Medicaid Under the Affordable Care Act.” JAMA, June 26, 2013. Available at http://jama.jamanetwork.com/article.aspx?articleid=1699906. ↩︎
For those who have been uninsured, or enrolled in MO HealthNet, or privately insured for all of 2014, the time period for this is “since January 2014.” For those who became uninsured, enrolled in MO HealthNet or became privately insured during 2014, the time period for this is “since becoming uninsured” or “since gaining your current coverage.” ↩︎
Garfield R and Young K. People Who Gained Coverage in 2014: Implications to Access to Care and Financial Security, Kaiser Family Foundation, Forthcoming. ↩︎
Survey Of Non-group Health Insurance Enrollees, Wave 2: Findings
Introduction
This survey reports on the views and experiences of people purchasing health insurance coverage in the non-group market. Over the past few years, the Affordable Care Act (ACA) has had a significant impact on this group, as new rules took effect that standardized coverage, guaranteed coverage for those with pre-existing conditions, and established income-based federal financial assistance to those buying insurance through new health insurance Exchanges or Marketplaces. Starting on January 1st, 2014, all coverage newly purchased either through a Marketplace or directly from an insurance company had to follow new rules under the ACA (i.e. “ACA-compliant”).
The survey, conducted February 18 – April 5, 2015, after the close of the second open enrollment period, includes individuals who purchased ACA-compliant coverage inside or outside of a Marketplace, as well as those who are currently enrolled in “non-ACA compliant” plans. Non-ACA compliant plans are those purchased before the law was enacted in March 2010 and were grandfathered in under the ACA, as well as those purchased before October 2013 and allowed to continue under a federal transition policy at the discretion of states.1 This survey is the second in a series that seeks to shed light on the experiences and opinions of those purchasing their own health insurance. In addition to stand-alone findings, this report draws trends and comparisons using data from the first survey in the series, conducted at the end of the first open enrollment period, April 3-May 11, 2014.
Related: This Data Note looks at predictors of positive and negative attitudes toward the ACA among non-group enrollees.
Key Findings
Section 1: Basic Demographics Of The Non-Group Market
Looking at the non-group market as a whole, about six in ten enrollees (59 percent) report being in Marketplace plans (including plans purchased directly from a Marketplace and Marketplace plans purchased from an insurance company or an insurance agent2), an increase from 48 percent last year following the first open enrollment period. In addition, many insurance companies continue to sell non-group insurance policies outside the Marketplaces. Seven percent of all non-group enrollees report having these ACA-compliant, non-Marketplace plans. Another 17 percent purchased ACA-compliant plans from either an insurance company or a broker but say they are unsure whether their plan is a Marketplace plan or not. Sixteen percent of enrollees remain in pre-2014, non-ACA-compliant plans, down from 31 percent in 2014.
Figure 1
An important change made by the ACA prohibited insurers from denying coverage or charging higher premiums to people with non-group coverage because of their health. One concern raised about this change was whether the number of healthy people enrolling because of the new premium tax credits and the law’s individual mandate would be sufficient to offset the higher claims from less healthy people enrolling because insurers could no longer exclude them. At the end of the second open enrollment period, the self-reported health status of people in ACA-compliant plans (which insurers rate as a single risk pool) looks much like it did in 2014, with the vast majority (85 percent) saying their health is excellent, very good, or good. However, as in 2014, those with ACA-compliant plans are somewhat more likely than those with non-ACA compliant plans to report their health as “only fair” or “poor” (15 percent versus 6 percent).
Figure 2: Self-Reported Health Status Of Enrollees In ACA-Compliant And Non-ACA Compliant Plans
ACA-compliant plans
Non-ACA compliant plans
In general, would you say your health is excellent, very good, good, fair, or poor?
2014
2015
2014
2015
Excellent
22%
24%
28%
33%
Very good
29
33
37
34
Good
31
28
28
27
Fair
13
11
6
5
Poor
4
4
<1
1
Most people in the non-group market do not have access to employer coverage. Over half are either not employed (29 percent) or self-employed (28 percent), and another 16 percent are employed part-time and likely do not have an offer of coverage.3 Of the one in four (26 percent) who work full-time for someone else, about four in ten, or just 10 percent of all non-group enrollees, say their employer or union offers a health plan to at least some of its employees. Among those whose employers offer a health plan, the largest share says that the main reason they don’t participate in their employer’s plan is because it is less expensive to buy their own coverage than to pay their portion of the cost for the plan at work.
Figure 3
Section 2: Shopping, renewing, and switching coverage
This year’s open enrollment period saw a number of new buyers in the market — more than a third (36 percent) of those with ACA-compliant plans did not have non-group coverage in 2014. The largest share of this group was uninsured immediately prior to purchasing their current plan (72 percent of those new to the non-group market, or 26 percent of all those with ACA-compliant coverage). Among those who had non-group coverage in 2014, most chose to renew their existing plan rather than make a switch. About half (48 percent) of those currently in ACA-compliant plans say they renewed a health plan they had in 2014; only 15 percent say they switched between non-group plans.
Figure 4: Previous Insurance Status Of Enrollees In ACA-Compliant Plans
Although relatively few switched plans, many of those who did cite cost-related reasons for making a change, including finding a lower monthly premium than what they would have paid to renew their previous plan (6 percent of all those with ACA-compliant plans), and wanting a plan with a lower annual deductible (3 percent of total). Seven percent of those with ACA-compliant coverage say they switched plans because their previous plan was cancelled. Only one percent say they switched because they were unhappy with their plan’s choice of providers, they wanted to be eligible for government financial help, or their family’s health needs changed.
A large majority of those who renewed an ACA-compliant plan this year say it was very or somewhat easy to renew, including three-quarters of those with Marketplace plans (77 percent). About half (52 percent) say they were automatically re-enrolled, while 46 percent say they took action to renew their plan.
Figure 5: Reported Ease Of Renewal Among Those Who Renewed ACA-Compliant Plans
Total ACA-compliant
Marketplace
How easy or difficult was it for you to renew your health plan?
Very easy
56%
52%
Somewhat easy
23
25
Somewhat difficult
12
14
Very difficult
6
6
About seven in ten (69 percent) of those who renewed an ACA-compliant plan say they did not shop around before renewing. The most common reason for not shopping was that they were satisfied with their current plan (35 percent). About one in ten each say they were too busy or didn’t have time to shop (10 percent), they didn’t want to deal with the hassle of shopping (9 percent), or they didn’t think they could find a more affordable option (8 percent).
Figure 6
Most (59 percent) of those who did shop for a plan this year (including those who purchased a new plan and those who shopped around but decided to renew a previous plan) say they had about the right number of plans to choose from. This is true of those who bought their coverage both inside and outside the ACA Marketplaces. Still, nearly three in ten (28 percent) feel they had too few plans to choose from, while one in ten say they had too many.
Figure 7
Among those who enrolled in a new plan this year (both those purchased within and outside of the Marketplace) most say that when they signed up for their current plan, it was easy to compare premiums and cost-sharing and to figure out if their income qualifies them for coverage. However, nearly four in ten say it was difficult to set up an account with the marketplace (38 percent) and to compare the providers covered under each plan (37 percent). Reported experiences in the second open enrollment period are very similar to last year, despite the problematic launch of healthcare.gov and state-based Marketplace websites that was widely covered by the media during the first open enrollment.
Figure 8
Last year, with the launch of the new Marketplaces and the accompanying technical issues, personal help with the enrollment process was an important factor in getting people signed up for coverage. Personal help was also important this year, particularly for those new to the market or switching plans. Overall, about six in ten of those either new to the non-group market (60 percent) or those who switched plans this year (57 percent) report getting help with enrollment, while most of those who renewed an ACA-compliant 2014 plan say they completed the process on their own (63 percent).
Figure 9: Reported Help With Enrollment/Renewal Among Those With ACA-Compliant Plans
Did someone help you (enroll in health insurance/renew your health plan for 2015) or did you complete the (enrollment/renewal) process on your own?
Switched non-group plans 2014 to 2015
New to non-group market
Renewed ACA-compliant plan
Someone helped you (enroll/renew)
57%
60%
28%
Completed the (enrollment/renewal) process on your own
43
39
63
Auto-renewed (Vol.)
N/A
N/A
8
In weighing their plan options, those purchasing ACA-compliant plans report considering a number of factors, with costs rising to the top. Nearly four in ten (38 percent) cite the monthly premium costs as an extremely important factor in their plan choice, followed by the deductibles and copays (32 percent). Roughly a quarter say that the plan’s choice of doctors and hospitals was an extremely important factor (25 percent) along with the range of benefits covered (23 percent). Fewer say that recommendations from friends and family were a top factor (6 percent).
Figure 10
Section 3: Plan ratings and satisfaction
A large majority of those in ACA-compliant plans, including three quarters (74 percent) of those with Marketplace coverage, rate their overall health insurance coverage as excellent or good. More than half also say their plan is an excellent or good value for what they pay for it, while about four in ten say the value is only fair or poor. Among those with Marketplace coverage, plan ratings are similar to 2014, though the share saying their plan is an “excellent” value decreased somewhat from 23 percent to 15 percent. Although not a large decrease, further changes in how Marketplace enrollees are assessing their plans’ value should be watched closely in the coming years.
Figure 11
Enrollees in ACA-compliant plans (including those purchased from a Marketplace) give similar ratings to their overall coverage and value for the money compared to those in pre-ACA, non-compliant plans. As was true in 2014, those with non-group coverage give their plans lower ratings overall compared to those with employer-sponsored insurance interviewed as part of a separate survey.
Figure 12: Ratings of Coverage Among Those With ACA-Compliant, Non-ACA Compliant, and Employer Plans
How would you rate your overall health insurance coverage?
Excellent
18%
18%
21%
37%
Good
56
56
62
54
Not so good
13
14
12
7
Poor
7
7
4
1
Would you say your health insurance is an excellent value, good value, only a fair value or a poor value for what you pay for it?
Excellent value
13
15
10
N/A
Good value
42
44
39
N/A
Only a fair value
26
24
20
N/A
Poor value
16
14
30
N/A
Similar to findings from the 2014 survey, most people with ACA-compliant plans say they are satisfied with various elements of their plans, including their choice of providers, copays, premiums, and deductibles. Among those with Marketplace coverage, at least seven in ten say they are “very” or “somewhat” satisfied with their plan’s choice of primary care providers (75 percent) and hospitals (75 percent), as well as their copays for doctor’s visits (73 percent) and prescriptions (70 percent). About two-thirds (64 percent) say they are satisfied with their choice of specialists, while 16 percent are dissatisfied and about one in five (19 percent) say they don’t know, likely because they have not tried to use a specialist under their plan. While majorities of Marketplace enrollees say they are satisfied with their premiums and deductibles, substantial shares express dissatisfaction, including 32 percent who say they are dissatisfied with their premium and 36 percent who are dissatisfied with their deductible.
Figure 13
Compared to those with older, non-ACA compliant non-group coverage, enrollees in ACA-compliant plans (including those purchased through a Marketplace) are somewhat less likely to say they are satisfied with their plan’s choice of primary care doctors and hospitals, but somewhat more likely to express satisfaction with their monthly premiums and annual deductibles. This is likely because many of them are receiving premium tax credits and cost-sharing subsidies that are not available to those in non-ACA compliant plans. As was true with the 2014 survey findings, satisfaction rates are generally lower among non-group plan enrollees compared to those with employer-sponsored insurance interviewed as part of a separate survey.
Figure 14: Plan Satisfaction Among Those With ACA-Compliant, Non-ACA Compliant, And Employer Plans
Percent who say they are satisfied/dissatisfied with each of the following:
Despite relatively high plan ratings and satisfaction levels, many non-group enrollees report feeling vulnerable to high medical bills and say they have encountered problems with health care costs. Over half (57 percent) of those with ACA-compliant plans say they feel well-protected by their plan, but nearly four in ten (38 percent) feel vulnerable to high medical bills (similar to 2014). Those with new plans purchased under the ACA are not the only ones feeling financially precarious; a similar share (34 percent) of those with pre-2014, non-ACA compliant plans says they feel vulnerable to high medical bills. Among those with employer-sponsored coverage interviewed as part of a separate survey, a somewhat smaller share, but still nearly three in ten (28 percent), reports feeling financially vulnerable.
Figure 15
Many also worry about future health care costs. Nearly six in ten (56 percent) of those with ACA-compliant plans say they are at least somewhat worried they won’t be able to afford the health care services they need. But again, worry is not confined to those with newer non-group plans; a similar share (57 percent) of those with older, non-ACA-compliant plans report the same worry. And equal shares of those with ACA-compliant and non-compliant plans (46 percent of each group) say it is difficult for them to afford to pay the cost of their health insurance each month.
Figure 16: Financial Worries Among Those In ACA-Compliant And Non-ACA Compliant Plans
ACA-compliant plans
Non-ACA compliant plans
How worried are you, if at all, that you won’t be able to afford the health care services you need?
Very worried
20%
15%
Somewhat worried
36
42
Not too worried
29
26
Not at all worried
15
16
How easy or difficult is it for you to afford to pay the cost of your health insurance each month?
Very easy
21
21
Somewhat easy
31
32
Somewhat difficult
31
35
Very difficult
15
11
As other surveys have found, having health insurance is not a panacea against problems with medical bills, even for those who are continuously insured. Among enrollees in ACA-compliant plans who’ve had their plan for at least a year, 16 percent say that they’ve had problems paying medical bills in the past 12 months. Some also say they or a family member covered by their plan didn’t fill a prescription (18 percent) or didn’t get needed health care (11 percent) because of cost concerns in the past 12 months7. Enrollees in non-ACA compliant plans, who by definition have had their plan for an even longer period of time, are less likely than those with compliant plans to report problems paying medical bills or delaying care due to cost.
Figure 17
Section 5: Opinions and Experiences of Those In High-Deductible Plans
One group that may be particularly vulnerable to high out-of-pocket health care costs are those with high deductible health plans. In the non-group market as a whole (including those in ACA-compliant and non-ACA compliant plans), four in ten enrollees (40 percent) have a plan with a high deductible (defined for purposes of this analysis as $1,500 or more for an individual or $3,000 or more for a family-level deductible). Another four in ten (43 percent) have plans with lower deductibles, while 17 percent are unsure of their deductible amount.
Comparing those with high-deductible versus lower deductible health plans, those with high deductibles are more likely to be in non-ACA compliant plans (22 percent versus 12 percent), and have higher incomes on average. Consequently, they are less likely to report getting government financial assistance to pay their premium (36 percent versus 56 percent).
Figure 18: Income And Tax Credit Status Of Those In High- Versus Lower-Deductible Non-Group Plans
High-deductible plans
Lower-deductible plans
Self-reported income as a percentage of Federal Poverty Level (FPL)
Those in high deductible plans generally report being less happy with their plans than those with lower deductibles. They are more than twice as likely to rate their health plan as “not so good” or “poor” (29 percent versus 12 percent) and to say the value for what they pay is “only fair” or “poor” (60 percent versus 31 percent).
Figure 19
Those with higher deductibles are also less likely than those with lower deductibles to report being satisfied with their deductible and other cost-sharing arrangements of their plan, including their office visit and prescription copays.
Figure 20
In addition, those with higher deductibles are significantly more likely than those with lower deductibles to say they feel vulnerable to high medical bills (55 percent versus 22 percent). These differences between those with high and lower deductibles hold true regardless of income level or whether or not they are receiving federal financial assistance.
However, there is no significant difference between these two groups in reports of cost-related problems, including problems paying medical bills or skipping needed medical care or prescriptions in the past twelve months because of the cost. This may be due to the fact that while higher deductibles leave this group potentially more vulnerable to out-of-pocket costs, their relatively higher incomes make it somewhat easier for them to absorb these costs.
Many non-group enrollees in both high-deductible and lower-deductible plans say they lack the financial resources to cover a large unexpected medical bill without going into debt. When asked hypothetically about an unexpected medical bill for which the portion not covered by insurance is $500, four in ten non-group enrollees overall (44 percent) say they would be able to pay it off without going into debt, but a third (34 percent) say they would have to go into credit card debt or borrow money to pay it and 13 percent say they would not be able to pay the bill at all. For a hypothetical medical bill on which they owe $1,500, just about a quarter could pay it off without going into debt, while four in ten would have to borrow money and nearly a quarter wouldn’t be able to pay the bill at all. In general, those in high-deductible plans are somewhat more likely than those in lower-deductible plans to say they could weather these expenses without going into debt, perhaps because of their relatively higher incomes. Still, among those in high-deductible plans, 43 percent say they would have to borrow money or go into credit card debt to cover a $1500 medical bill, and 15 percent say they wouldn’t be able to pay such a bill at all.
Figure 21: Responses To A Hypothetical Medical Bill Of $500/$1500 Among Those In Non-Group Plans
Suppose you had an unexpected medical bill and the amount not covered by your insurance was $500/$1500. Based on your current financial situation, would you…
Total non-group
High-deductible health plans
Lower-deductible health plans
$500
$1500
$500
$1500
$500
$1500
Would pay bill without borrowing (NET)
44%
26%
55%
31%
36%
24%
Pay right away by cash or check
30
16
38
19
25
17
Put on credit card and pay off at next statement
14
10
17
12
11
7
Would pay bill by borrowing (NET)
34
41
28
43
37
38
Put on a credit card and pay off over time
26
32
21
35
30
30
Borrow from bank, payday lender, friends, or family
8
9
7
8
7
8
Would arrange payment plan with provider (Vol.)
6
6
7
9
4
3
Would not able to pay at all
13
23
8
15
19
32
Section 6: Non-Group Enrollees’ Opinions of the ACA
Overall, about half of non-group health insurance enrollees (51 percent) report having a favorable view of the Affordable Care Act, while just over four in ten (43 percent) say they have an unfavorable view. Favorability hasn’t changed much over the past year and is roughly similar to adults nationwide in the same age range (45 percent favorable, 42 percent unfavorable).9
However, there are differences in opinion within the non-group market. Those in ACA-compliant plans are more likely to say they have a favorable view of the law compared to those with non-ACA compliant plans (53 percent versus 39 percent). As is true among the general public, partisanship remains by far the biggest driver of opinion of the ACA among non-group purchasers, with a large majority of Republicans (74 percent) expressing an unfavorable view of the law, while an equally large share of Democrats (75 percent) say they are favorable, and independents are in the middle (51 percent favorable, 40 percent favorable).
Figure 22
When asked about the impact the law has had on them and their families, four in ten non-group enrollees say they’ve benefited from the ACA, up slightly from 34 percent who said this in 2014. A somewhat smaller share – 33 percent – say they’ve been negatively affected (similar to the 29 percent who said this last year). Those who say they’ve benefited are about evenly divided in saying the main reason was because the law allowed someone in their family to get or keep health coverage, lowered their health care or insurance costs, or made it easier to get needed health care.
Figure 23
Among the 33 percent of non-group enrollees who say they’ve been negatively impacted by the law, most say the law increased their health care or insurance costs, while smaller shares say it made it more difficult to get needed health care or that it caused someone in their family to lose their insurance.
Figure 24
Here again there are important divisions within the non-group market in who feels they’ve benefited or been negatively affected by the ACA. Those most likely to feel their families have benefited include those who are likely receiving government tax credits to help with the cost of insurance (57 percent), those with Marketplace plans (53 percent), and those in plans with lower deductibles (48 percent). On the other side, those with non-compliant pre-ACA plans stand out as a group that is particularly likely to feel negatively affected– four in ten (41 percent) say they have been negatively affected while only 8 percent say they’ve benefited. Non-group purchasers in high deductible plans also tilt negative; 45 percent say they’ve been negatively impacted and three in ten say they have benefited. Partisanship provides a stark comparison here as well. More than half of Republicans say they’ve been negatively affected, while nearly two-thirds of Democrats say the law has been a benefit to their family. Independents sit squarely in the middle: 34 percent feel they’ve benefited from the law and 33 percent say they’ve felt a negative impact.
Figure 25
Survey Of Non-group Health Insurance Enrollees, Wave 2: Methodology
The Kaiser Family Foundation (KFF) Survey of Non-Group Health Insurance Enrollees is the second in a series of surveys examining the views and experiences of people who purchase their own health insurance, including those whose coverage was purchased through a state or federal Health Insurance Marketplace and those who bought coverage outside the Marketplaces. The survey was designed and analyzed by researchers at KFF. Social Science Research Solutions (SSRS) collaborated with KFF researchers on sample design and weighting, and supervised the fieldwork. KFF paid for all costs associated with the survey.
The survey was conducted by telephone from February 18 through April 5, 2015 among a random sample of 804 adult U.S. residents who purchase their own insurance. Computer-assisted telephone interviews conducted by landline (346) and cell phone (458, including 241 who had no landline telephone) were carried out in English and Spanish by SSRS. Respondents were considered eligible for the survey if they met the following criteria:
Between the ages of 18-64
Currently covered by health insurance that they purchase themselves or purchased insurance that would begin in the next month
Not covered by health insurance through an employer, COBRA, Medicare, Medicaid, a parent’s plan, or the U.S. military or VA
If purchase insurance from a college or university, the insurance covers health services received both within and outside the university setting
If a small business owner, the health insurance they purchase is only for themselves and/or their family, and does not cover non-related employees of their business
If purchase from a trade association, respondent pays the entire premium themselves
Because the study targeted a low-incidence population, the sample was designed to increase efficiency in reaching this group, and consisted of three parts: (1) respondents reached through random digit dialing (RDD) landline and cell phone (N=151); (2) respondents reached by re-contacting those who indicated in a previous RDD survey that they either purchased their own insurance or were uninsured (N=247); (3) respondents reached as part of the SSRS Omnibus survey (N=406), a weekly, nationally representative RDD landline and cell phone survey. All RDD landline and cell phone samples were generated by Marketing Systems Group.
A multi-stage weighting process was applied to ensure an accurate representation of the national population of non-group enrollees ages 18-64. The first stage of weighting involved corrections for sample design, including accounting for the likelihood of non-response for the re-contact sample, number of eligible household members for those reached via landline, and a correction to account for the fact that respondents with both a landline and cell phone have a higher probability of selection. In the second weighting stage, demographic adjustments were applied to account for systematic non-response along known population parameters. No reliable administrative data were available for creating demographic weighting parameters for this group, since the most recent Census figures could not account for the changing demographics of non-group insurance enrollees brought about by the ACA. Therefore, demographic benchmarks were derived by compiling a sample of all respondents ages 18-64 interviewed on the SSRS Omnibus survey during the field period (N=6,519) and weighting this sample to match the national 18-64 year-old population based on the 2014 U.S. Census Current Population Survey March Supplement parameters for age, gender, education, race/ethnicity, region, population density, marital status, and phone use. This sample was then filtered to include respondents qualifying for the current survey, and the weighted demographics of this group were used as post-stratification weighting parameters for the standard RDD and omnibus samples (including gender, age, education, race/ethnicity, marital status, income, and population density). A final adjustment was made to the full sample to control for previous insurance status (estimated based on the combined RDD and omnibus samples), to address the possibility that the criteria used in selecting the prescreened sample could affect the estimates for previous insurance status.
Weighting adjustments had a minor impact on the overall demographic distribution of the sample, with the biggest adjustments being made based on age (this is common in all telephone surveys, as younger respondents are the most difficult to reach and convince to participate). Weighted and unweighted demographics of the final sample are shown in the table below.
Unweighted% of total
Weighted% of total
Age
18-25
9%
15%
26-34
13
18
35-44
14
17
45-54
25
22
55-64
38
26
Refused
2
2
Gender
Male
49
48
Female
51
52
Education
Less than high school graduate
6
7
High school graduate
26
31
Some college
27
29
Graduated college
27
21
Graduate school or more
13
9
Technical school/other
2
2
Refused
–
–
Race/Ethnicity
White, non-Hispanic
73
69
Black, non-Hispanic
10
11
Hispanic
10
12
Other/Mixed
6
6
Refused
1
1
Self-reported health status
Excellent
24
26
Very good
33
33
Good
28
27
Fair
12
10
Poor
4
4
Don’t know/refused
*
*
All statistical tests of significance account for the effect of weighting. The margin of sampling error (MOSE) including the design effect is plus or minus 4 percentage points for results based on the total sample. Unweighted Ns and MOSE for key subgroups are shown in the table below. For other subgroups the margin of sampling error may be higher. Kaiser Family Foundation public opinion and survey research is a charter member of the Transparency Initiative of the American Association for Public Opinion Research.
Group
N (unweighted)
MOSE
Total non-group enrollees
804
±4 percentage points
ACA-compliant plans
667
±5 percentage points
Marketplace plans
494
±6 percentage points
Non-ACA-compliant plans
127
±11 percentage points
Endnotes
Throughout this report, “ACA-compliant plans” refers to plans purchased after January 1, 2014, while “non-ACA-compliant plans” are those purchased before that date. ↩︎
Non-group enrollees are able to purchase Marketplace plans through a health insurance broker or directly through an insurance company. In some states, large shares of non-group enrollees used a broker to enroll in a Marketplace plan ↩︎
Those who’ve had their plans for fewer than 12 months were excluded from this analysis, since problems reported by these individuals may have occurred when they were uninsured or covered by a different plan. ↩︎
Those who likely received a tax credit includes anyone with Marketplace coverage who says they received financial help from the government to pay their health insurance premium, as well as anyone who says their premium is based on their income. ↩︎
Affordability Remains Significant Concern for Many in Non-Group Plans
Following the Affordable Care Act’s second open enrollment period, most people enrolled in marketplace plans report being satisfied with a wide range of their plan’s coverage and features, finds a new Kaiser Family Foundation survey of people who buy their own health insurance.
A large majority (74%) of those in marketplace plans rate their coverage as excellent or good, the survey finds. Most (59%) also say their plan is an excellent or good value for what they pay for it, though the share rating the value as “excellent” declined somewhat from 23 percent last year to 15 percent in the current survey.
Majorities also say they are “very” or “somewhat” satisfied with seven different features of their plans, including their choice of primary-care doctors (75%), hospitals (75%) and specialists (64%); what they have to pay out of pocket for doctor visits (73%), prescription drugs (70%) and annual deductible (60%); and their monthly premiums (65%).
Compared to those with older, non-ACA compliant non-group plans, enrollees in marketplace plans are less likely to say they are satisfied with their plan’s choice of primary care doctors and hospitals, but somewhat more likely to express satisfaction with their monthly premiums and annual deductibles. This is likely because many are receiving premium tax credits and cost-sharing subsidies that are not available in non-compliant plans.
The survey is the second in a series exploring the experiences and perceptions of people who purchase their own health insurance, the group perhaps most affected by the ACA’s reforms to the individual insurance market and tax subsidies to make such coverage more affordable. It includes people in ACA-compliant plans sold both inside and outside the federal and state marketplaces, as well as those still in non-compliant plans, which took effect prior to January 2014 and in many cases do not comply with all the law’s requirements.
Making non-group insurance affordable was a key goal of the ACA’s changes to the individual market and its tax subsidies. In spite of high overall satisfaction levels, a significant minority of enrollees report challenges and worries related to the affordability of coverage and care.
The survey finds most (57%) of those in ACA-compliant plans feel financially well-protected by their insurance, though nearly four in ten (38%) feel vulnerable to high medical bills. A similar share (34%) of those with non-compliant plans reports feeling vulnerable to high medical bills, as do 28 percent of people with employer coverage interviewed as part of a separate survey.
Also, nearly half (46%) of both those with ACA-compliant and non-compliant plans say that it is “very” or “somewhat” difficult for them to afford to pay their monthly health insurance premium.
The survey also finds that among all non-group enrollees (including those in ACA-compliant and non-compliant plans), four in ten have plans with high deductibles ($1,500 or more for an individual or $3,000 or more for a family). Compared to those with lower deductibles, enrollees in high-deductible plans give their insurance lower ratings and are more likely to feel vulnerable to high medical bills.
When asked hypothetically about an unexpected medical bill for which the portion not covered by insurance is $1,500, about three in ten (31%) of those with high-deductible plans say that they could pay it off without going into debt, while 43 percent say they would have to go into credit card debt or borrow money to pay it, and 15 percent say they would not be able to pay such a bill at all.
The survey also examined enrollees’ experiences signing up for coverage. It finds more than a third (36%) of those with ACA-compliant plans did not have non-group coverage in 2014, most of whom (26% overall) were uninsured immediately prior to obtaining their current coverage. Among those who were already in the non-group market last year, most chose to renew their existing plan rather than make a switch, while a small share (15% of all those in ACA-compliant plans) switched from a different non-group plan.
A large majority of those who renewed an ACA-compliant plan this year say it was very or somewhat easy to renew, including 77 percent of those with marketplace coverage. Seven in ten (69%) say they did not shop around before renewing, with the most common reason being that they were satisfied with their current plan. Among those who did purchase new plans this year, most say it was easy to compare premiums and cost-sharing and to figure out if their income qualifies them for government financial assistance.
In weighing plan options, cost concerns play a major role. Nearly four in ten (38%) of those enrolled in ACA-compliant plans cite the monthly premium as an extremely important factor in their plan choice, while nearly as many cite the deductibles and copays (32%). Fewer say that the plan’s choice of doctors and hospitals (25%) or the range of benefits offered (23%) were extremely important.
Other findings include:
The survey suggests little change in the self-reported health status of people with ACA-compliant plans, with 85 percent saying they are in excellent, very good or good health this year, compared with 82 percent who reported the same in 2014.
Many enrollees in new plans this year say they relied on outside help to sign up, including 60 percent of those new to the non-group market and 57 percent of those who switched plans from 2014. In contrast, most of those who renewed their plan from last year (63%) say they completed the process on their own.
METHODOLOGYThe survey was designed and analyzed by researchers at the Foundation. Telephone interviews were conducted from February 18 through April 5, 2015 among a nationally representative random sample of 804 adults ages 18-64 who purchase their own insurance, including 346 via landline and 458 via cell phone. Fieldwork was carried out in English and Spanish by SSRS, an independent research company. The margin of sampling error is plus or minus 4 percentage points for results based on the full sample, 5 percentage points for those in ACA-compliant plans, and 6 percentage points for those in Marketplace plans. For other subgroups, the margin of sampling error may be higher.
In his latest column for The Wall Street Journal’s Think Tank, Drew Altman discusses why many people may not know whether or not they are benefiting from the Affordable Care Act.
All previous columns by Drew Altman are available online.
Ohio was the third state to launch a 3-year capitated financial alignment demonstration to integrate Medicare and Medicaid payments and care for beneficiaries who are dually eligible for Medicare and Medicaid. Concurrently, Ohio implemented mandatory capitated managed care through separate Medicaid waiver authority. Ohio refers to both initiatives as MyCare Ohio. This report describes the early implementation of Ohio’s capitated Medicare-Medicaid financial alignment demonstration. Findings are based on interviews conducted with a diverse group of state leaders, including representatives from state agencies; medical, behavioral health, and social services providers; consumer advocates; and health plans involved in the design and early implementation of the demonstration. The report also includes data on enrollment in the demonstration to provide context for the qualitative findings.
MyCare Ohio launched in May 2014, and as of January 2015, had enrolled 94,525 beneficiaries, over 82 percent of the 115,000 state residents initially estimated to be eligible for the financial alignment demonstration. Most beneficiaries (72 percent) were enrolled in the demonstration (including both Medicare and Medicaid services), with the remainder (28 percent) enrolled only in Medicaid managed care. First, beneficiaries were automatically assigned to plans and enrolled in mandatory Medicaid managed care. During this time, enrollment in the financial alignment demonstration (including Medicare services) was voluntary, and the enrollment rate for Medicare services averaged about 16 percent during the opt-in enrollment period. The demonstration enrollment rate for Medicare services increased to 72 percent once Medicare auto-assignment began.
The Ohio financial alignment demonstration includes the following features:
covers a comprehensive population of adult dually eligible beneficiaries, including seniors, people with physical disabilities, and people with behavioral health needs;
builds upon concurrent implementation of mandatory Medicaid managed care;
bifurcates the enrollment process for most demonstration participants, by first offering an opt-in period for Medicare benefits, while beneficiaries were automatically enrolled in Medicaid managed care, followed by passive managed care enrollment for their Medicare benefits six to eight months later;
includes Medicaid home and community-based waiver services for seniors and people with physical disabilities in the health plan benefit package and capitated rates; and
requires health plans to partner with Area Agencies on Aging (AAAs) and other entities with experience working with people with disabilities to coordinate home and community-based waiver services for beneficiaries age 60 and over.
Beneficiaries, the state, plans, and providers faced several challenges during the early implementation stage of MyCare Ohio, such as:
delayed enrollment due to the complexities involved with launching a new program, such as conducting beneficiary and provider outreach, performing health plan readiness reviews, and building provider networks;
the calculation of appropriate capitated payment rates to account for different populations, such as beneficiaries who enroll in the demonstration for both Medicare and Medicaid benefits versus those who enroll only in Medicaid managed care and for those who are and are not receiving long-term services and supports (LTSS);
complexities in the enrollment process including communicating complicated information to beneficiaries and overcoming IT system challenges in locating and enrolling beneficiaries;
delayed initial assessments of demonstration enrollees by health plans; and
education of independent providers about health plans’ claim reimbursement systems to process timely payments for services.
Some of these issues were related to the concurrent implementation of mandatory Medicaid managed care but affected the capitated financial alignment demonstration, which encompasses both Medicare and Medicaid services.
Strengths of the implementation process that were identified included:
the AAAs’ connections to the community and knowledge about available resources and the LTSS assessment and service planning process;
incorporation of continuity of care provisions to ease beneficiaries’ transition to managed care; and
inclusion of quality measures related to home and community-based services and LTSS rebalancing among the criteria that health plans must meet to earn the quality withhold portion of the capitated rates in the financial alignment demonstration.
As one of the early capitated dual eligible financial alignment demonstrations to be implemented in the country, Ohio’s initial experience can provide important insights for other states as they move their demonstrations forward in the coming months. Stakeholders characterized the first six months of MyCare Ohio as “rocky” and “disruptive” and were eager to move past the initial implementation phases to focus on bringing a fully coordinated system of care to thousands of beneficiaries. Because the transition to mandatory Medicaid managed care was happening concurrently with the integrated care demonstration, it is important to note that not all concerns were solely demonstration issues; some would have occurred in the context of the transition to Medicaid-only managed care. This case study provides a very early look at the demonstration. Because stakeholders agreed that it is too early to tell whether the demonstration is making progress on key objectives, such as providing better coordinated care, improving health outcomes, and realizing cost savings, it will be important to assess Ohio’s and other states’ demonstrations over time as more information becomes available.
Issue Brief
Introduction
In May 2014, Ohio launched a financial alignment demonstration for dual eligible beneficiaries, known as MyCare Ohio. Ohio is one of twelve states to receive approval by the Centers for Medicare and Medicaid Services (CMS) to develop a service delivery and payment model to integrate care for beneficiaries who are dually eligible for Medicare and Medicaid. The objectives of the demonstration are to deliver person-centered, higher quality care, to better coordinate care across all settings (physical, behavioral and long-term services and supports (LTSS)), to promote independence in the community, and to eliminate cost shifting between Medicare and Medicaid. The results of these efforts have the potential to translate into better health outcomes for beneficiaries and savings across both programs. At the same time, changing delivery systems can risk disrupting care for these high need vulnerable beneficiaries. For more information about the demonstrations, see Box 1.
Box 1: Financial Alignment Demonstrations for Dual Eligible Beneficiaries
Under new authority in the Affordable Care Act, the Centers for Medicare and Medicaid Services is testing capitated and managed fee-for-service models as a way to align Medicare and Medicaid benefits and financing for dual eligible beneficiaries with the goal of delivering better coordinated care and reducing costs. The three-year demonstrations, implemented beginning in July 2013, are introducing changes in the delivery systems through which beneficiaries receive medical and long-term care services. They are also changing the financing arrangements among CMS, the states, and providers. As of July 2014, seven states had begun enrolling beneficiaries in their demonstrations. For more information see: https://www.kff.org/medicaid/issue-brief/financial-alignment-demonstrations-for-dual-eligible-beneficiaries-compared.
Unlike demonstrations in other states, Ohio concurrently implemented mandatory Medicaid managed care and the financial alignment demonstration. First, beneficiaries were automatically assigned to plans and enrolled in mandatory Medicaid managed care. During this time, enrollment in the financial alignment demonstration (including Medicare services) was voluntary for dual eligible beneficiaries. Next, Ohio automatically assigned remaining dual eligible beneficiaries to health plans for purposes of their Medicare benefits, effectuating their enrollment in the financial alignment demonstration. This issue brief focuses on the first phase of MyCare Ohio implementation, mandatory Medicaid managed care enrollment with optional enrollment in the financial alignment demonstration for Medicare benefits. It does not report on the integration of both Medicare and Medicaid benefits for the vast majority of participants following Medicare passive enrollment in January 2015. The results of this case study can inform the implementation of financial alignment demonstrations in other states over the coming months, as results from CMS’s evaluation of the demonstrations are not expected to be available for some time.
Ohio was the third state, behind Massachusetts and Washington,1 to receive approval to test a financial alignment model. In December 2012, CMS and the state signed a memorandum of understanding (MOU). Originally set to launch in 2013, enrollment in Ohio’s demonstration was repeatedly delayed due to the complexities involved with launching a new program. The demonstration continues for a 3-year period and ends on December 31, 2017. Ohio’s financial alignment demonstration targets an estimated 115,0002 dual eligible beneficiaries (62% of all duals) in 29 (of 88) counties, grouped into 7 regions. The regions are centered on major metropolitan areas across the state (Columbus, Cincinnati, Cleveland, Toledo, and Dayton). In each region, the state has contracted with two managed care plans (in the Cleveland region, there are three plans) to provide beneficiaries with choice among plans.
Mandatory enrollment for Medicaid benefits began on May 1, 2014 in the northeast region followed by three regions each on June 1 and July 1 (Figures 1 & 2). As part of the Medicaid enrollment process, individuals could choose to enroll in the same MyCare plan for Medicare services or choose to keep their current Medicare fee-for-service (FFS) or Medicare Advantage plan. In October 2014, notices were sent out to beneficiaries informing them that their health care is changing, and that effective January 1, 2015, they would be enrolled for Medicare benefits in the plan from which they were already receiving their Medicaid benefits, unless they made an alternative election. Dual eligible beneficiaries who choose to enroll in the demonstration for their Medicare benefits have the option of switching health plans and can opt out/into a plan for Medicare services at any time, but they must continue to receive Medicaid services through a MyCare plan.
Figure 1: MyCare Ohio Enrollment TimelineFigure 2: MyCare Ohio Enrollment Schedule by Region and by Managed Care Plan
Ohio’s financial alignment demonstration is comprehensive in scope of populations covered and services offered. Populations covered under the demonstration include most dually eligible individuals over the age of 18, including seniors and adults with physical disabilities and behavioral health needs. The demonstration benefits package includes all benefits available through the Medicaid and Medicare programs, including LTSS (both institutional and HCBS) and behavioral health services.
Two distinct features of Ohio’s financial alignment demonstration set it apart from the MA and VA demonstrations. They are the fact that Medicaid managed care enrollment is mandatory (individuals can only opt-out for Medicare benefits) and that the demonstration enrollment process was bifurcated, for most beneficiaries, so that mandatory enrollment happened first for Medicaid benefits and six to eight months later for Medicare benefits. Another unique feature of Ohio’s demonstration is the requirement that plans work with the Area Agencies on Aging (AAAs) and other entities that have experience working with people with disabilities (e.g. Centers for Independent Living and disability-oriented case management agencies, etc.) to provide home and community-based waiver service coordination for individuals age 60 and over.
Methods
This issue brief examines how managed care plans, the state, providers and beneficiary advocates/stakeholders experienced the planning and early implementation of Ohio’s financial alignment demonstration. Goals of the research were to: examine the transition to an integrated managed care benefit for Medicare and Medicaid; identify challenges faced during the first six months of the demonstration and strategies that were employed to deal with certain challenges; and inform other states pursuing financial alignment arrangements for dually eligible beneficiaries. Forty-four stakeholder interviews were conducted between August and December of 2014 with MyCare Ohio plans, Ohio Department of Medicaid (ODM) officials, providers (medical, behavioral health, and social services), and advocacy organizations/beneficiary representatives. Interviews occurred in person and over the phone and included representatives from all seven MyCare Ohio regions. The first round of interviews occurred just one to three months following the phased-in implementation of MyCare Ohio, and therefore represents perspectives on the planning process and initial perspectives on the demonstration rollout. Subsequent interviews over the next several months sought opinions on the demonstration over the course of the first six months. Follow-up interviews were conducted with select stakeholders in early December to assess any changes in initial impressions and perspectives leading up to passive Medicare enrollment in January 2015. The brief was supplemented with data provided by ODM and by reviewing public documents related to MyCare Ohio on the state Medicaid agency and CMS websites.3
Key Planning and Program Features
Like other states across the country, Ohio experienced budgetary challenges during the most recent economic downturn. The state was facing an $8 billion shortfall over the 2011-2013 biennium, and Medicaid costs were increasing nine percentage points per year, according to ODM officials. Governor Kasich’s administration made slowing the growth of Medicaid spending a priority, and plans to modernize Medicaid included prioritizing HCBS over institutional care and integrating Medicaid and Medicare benefits. The financial alignment demonstration was an opportunity to have all physical, behavioral and LTSS benefits fully coordinated and capitated under one system for dual eligible beneficiaries. The state viewed the demonstration as an opportunity to develop more integrated ways to pay for and deliver services to some of the poorest and sickest beneficiaries covered by either program. They are also some of the costliest. In 2011, 15 percent of Ohio’s Medicaid beneficiaries who are also eligible for Medicare accounted for 41 percent of spending for Medicaid services (Figure 3). Seventy-five percent of this spending was for LTSS, including nursing facility and HCBS.4
Figure 3: Ohio Medicaid Enrollees and Expenditures, FY 2011
To be eligible for Ohio’s financial alignment demonstration, an individual must be eligible for all parts of Medicare (Parts A, B and D) and be fully eligible for Medicaid; over the age of 18; and reside in one of the demonstration counties. Certain dual eligible beneficiaries are excluded from MyCare Ohio, including individuals under age 18; individuals with intellectual and/or developmental disabilities (I/DD) who are receiving services through an I/DD home and community-based services (HCBS) waiver or Intermediate Care Facility (ICF)-I/DD; individuals who are eligible for Medicaid through a delayed spend-down; individuals who have creditable third party insurance including retirement benefits; individuals enrolled in the Program of All-inclusive Care for the Elderly (PACE), and individuals participating in the CMS Independence at Home Demonstration. ODM officials noted that a goal from the early planning stages was to “include as many people as possible because we believe care coordination is the best way to go.” Ultimately, according to ODM officials, certain groups were excluded either because their care coordination was “happening fairly well already” (I/DD population) or due to the complexity involved with coordinating with third party insurance.
The demonstration’s benefits package includes all benefits available through the Medicare and Medicaid programs, including LTSS and behavioral health services. Exceptions include Medicare hospice and Medicaid habilitation services, targeted case management, and institutional and home and community-based waiver services for individuals with I/DD. Plans have discretion to offer enhanced benefits, for example, expanded Medicaid state plan benefits such as transportation or dental services. Ohio needed Medicaid managed care authority to operationalize the model for MyCare Ohio because the state was not already delivering Medicaid benefits for dual eligible beneficiaries through capitated managed care. Prior to MyCare, a limited number of dual eligible beneficiaries were enrolled in managed care through the PACE program, while the vast majority (74%) of managed care enrollment in Ohio is made up of children and families. Adults with disabilities (non-duals) account for about 7 percent of the over 2 million individuals enrolled in managed care. Independent of its financial alignment demonstration authority, Ohio obtained a new § 1915(b)/(c) Medicaid managed LTSS waiver that encompassed all of Ohio’s five Medicaid § 1915(c) HCBS waivers where participation was dependent on the beneficiary having level of care (LOC) needs equivalent to that required for Medicaid nursing facility coverage.5 Beneficiaries enrolled in the new waiver saw their services expand to include homemaker and home care attendant services – services not previously offered under each HCBS waiver (Figure 4). The new Medicaid managed care waiver also allows beneficiaries to continue self-direction of services. Meanwhile, some waiver populations now have access to services such as nursing services and respite services that previously only were available to certain other waiver populations.
In February 2014, three-way contracts were signed by CMS, Ohio, and each of the five participating health plans (Aetna, Buckeye (owned by Centene), CareSource, Molina and UnitedHealthcare). CareSource is the only non-profit health plan out of the five MyCare plans, but has partnered with the for-profit company Humana for the financial alignment demonstration.6 The plans were selected through a competitive process designed to assure plans had the experience necessary to meet the needs of dually eligible beneficiaries. Based on rankings from the bidding process, each of the plans was allowed to choose three of the seven regions in which to participate. In each region, two of the plans are available (the Cleveland region has three plans). Four of the five plans had experience with Medicare Advantage Special Needs Plans (SNP) in Ohio. About 11,000 dual eligible beneficiaries were enrolled in SNPs in Ohio in 2014, which is roughly 4% of the total dual eligible population. Four of the five plans were previously serving Medicaid beneficiaries, including children and parents as well as adults and children with disabilities (non-duals). In Ohio 77 percent of Medicaid beneficiaries (or more than 2.1 million people) are enrolled in a managed care plan.7 None of the financial alignment demonstration plans, however, had prior experience with managing HCBS in Ohio. The plans reportedly relied on national experience serving HCBS populations in other states to handle the new service delivery piece, essentially the waiver program, that most demonstration participants rely on to meet their LTSS needs. The plans also largely leaned on the AAAs and local companies that provide home and community-based case management services to develop experience. One of the biggest learning curves plans mentioned was readying their systems to process waiver and nursing facility claims.
A provider agreement between ODM and the managed care plans was signed in February 2014 and amended effective January 1, 2105. The agreement sets forth a number of requirements including call center, staffing, financial reporting, provider contracting, marketing, benefits, and payment requirements. In the agreement, the managed care plans agree to assume the risk of loss, while complying with federal and state laws, and the agreement also specified actuarially sound capitation rates. Lastly, the agreement consists of certain components aimed at incentivizing plans that improve health outcomes.8
“The process of integrating the Medicare and Medicaid programs from a systems standpoint and a programmatic standpoint…people say this is one of the most complicated things they have done in their careers.” – State Official
Prior to enrollment, each plan underwent a joint CMS/state readiness review to ensure the plan’s ability to comply with the demonstration requirements. The review evaluated plans’ ability to quickly and accurately process claims and enrollment information, accept and transition new beneficiaries, and provide access to all Medicare and Medicaid medically necessary services.
While the state first envisioned a target implementation date in 2013, the complexities involved in completing the tasks mentioned above (i.e., the three-way contract, the provider agreement, and plan readiness reviews) led to a delay in implementation. These tasks as well as added time for outreach and education to beneficiaries and providers, setting and risk adjusting payment rates, and building provider networks were all reasons to delay the enrollment start date. Ultimately, CMS and the state settled on a three-month (May-July) phased-in enrollment process starting with Medicare opt-in (concurrently with mandatory Medicaid managed care enrollment) and delayed Medicare passive enrollment until January 1, 2015 (see enrollment section for more details).
MyCare Ohio Financial Model
Under the Medicare-Medicaid Financial Alignment Initiative, CMS will test the effectiveness of two models: 1) a managed FFS model in which the state and CMS enter into an agreement by which the state would be eligible to benefit from savings resulting from initiatives designed to improve quality and reduce costs for both Medicare and Medicaid; and 2) a capitated model in which the state and CMS contract with health plans that receive a prospective, blended payment to provide all enrolled dual eligible beneficiaries with coordinated care. Ohio is testing the capitated model.
Rate Setting
Each MyCare plan receives three different contributions to the capitated rate for each beneficiary enrolled in the financial alignment demonstration: a payment for Medicare-funded services (Parts A and B), a payment for Medicare Part D prescriptions drugs, and a payment for Medicaid-funded services. Medicare pays the MyCare Ohio plans a monthly capitation amount for Medicare Parts A/B services –risk adjusted using Medicare Advantage MCS-HCC model and the CMS-HCC ESRD model. Medicare also pays the plans a monthly capitation amount for Medicare Part D services – risk adjusted using the Part D RxHCC model. The Medicare Parts A/B capitated rate is a blended average of the county Medicare fee-for-services rate and the Medicare Advantage rate. The Medicare prescription drug capitation rate is the national average rate.
“We pushed with the plans to make sure all the incentives were there to help these people stay living independently.” – State Official
To address potential variations in risk among the participating health plans, the state uses a Member Enrollment Mix Adjustment (MEMA) for the Medicaid portion of the capitation. The MEMA will provide more revenue to health plans that have a greater proportion of high risk/cost beneficiaries, and conversely, provide less revenue to health plans that have a lower proportion of high risk/cost beneficiaries. The MEMA was incorporated into the rates starting in the fourth month of MyCare enrollment for each region and updates are made in January and July of each year. According to the three-way contract, the use of the MEMA factor is subject to change and may be a temporary feature.9 In setting the Medicaid capitation rate, the state took into account the potential risk variation of various subpopulations, financial incentives, and ease of operationalization when it determined the plans’ rate structure. Specifically, these considerations included the plans’ enrollment rules, the varying levels of beneficiaries’ need, the existing Medicaid waivers, and the alignment of incentives to promote HCBS as an alternative to nursing facility placement. These incentives include paying slightly lower rates for NF services than for community-based services, to help keep people in the community. The Medicaid rates differ according to LOC and by age and geographic region. Each individual enrolled in MyCare Ohio is assigned to a specific rating category: Community Well or Nursing Facility LOC. The Community Well category represents beneficiaries who do not require a nursing home LOC. Within the community well category, capitation rates vary by the following age groups: 18-44, 45-64 and 65+. The nursing facility LOC category includes those enrolled in a HCBS waiver and nursing facility residents. For the nursing facility LOC category, there is a single rating category for each geographic region. The MyCare capitated rate structure also includes transition rules that apply to individuals who no longer meet the nursing facility LOC criteria. For individuals transitioning from nursing facility LOC to the Community Well category, the plans continue to receive the nursing facility LOC capitation rate for three months following the change in categorization. These considerations applied both to Medicaid managed care-only beneficiaries and beneficiaries enrolled in the financial alignment demonstration for both Medicare and Medicaid benefits.
Another noteworthy feature of Ohio’s financial alignment demonstration, not included in all the other states’ demonstrations, was the inclusion of a medical loss ratio (MLR) performance indicator. The MLR requires plans to spend between 85%-90% of the joint Medicare and Medicaid payment to the plans on medical care (including services and care management). If a plan has an MLR below 85%, they will be required to provide a rebate back to the Medicaid and Medicare programs on a percent of premium basis.
One of the challenges associated with MyCare Ohio was to build two unique capitation rate structures: one for dual eligible individuals who are enrolled in the demonstration for both their Medicare and Medicaid benefits and one for dual eligible beneficiaries who are enrolled in the demonstration only for their Medicaid benefits. There are also different capitation rates for people receiving home and community-based waiver or nursing facility services (mentioned above) and for individuals who do not meet an institutional LOC, resulting in a total of four different Medicaid rates (Figure 5).10 Another challenge cited by ODM officials was the fact that capitation payments in Medicaid must be actuarially sound (appropriate for populations and services covered), and therefore, deriving a methodology that met this test and accommodated the three-way contract made this effort more complex, requiring a strong working relationship between CMS and the state. Ultimately, CMS and the state settled on a rate structure where the Medicaid managed care-only capitation rates are higher than the financial alignment demonstration (both Medicare and Medicaid benefits) rates. Assumptions behind this decision included taking into account the shared savings from Medicare and Medicaid integration and assuming higher utilization of services for dual eligible individuals enrolled in managed care only for Medicaid benefits who choose to keep their own Medicare providers. A follow-up conversation with ODM officials revealed that they have not yet seen this rate setting disincentive impact plans’ efforts to enroll dual eligible beneficiaries into the fully coordinated model.
Figure 5: MyCare Ohio Capitation Rate Structure
Health plans reported that it was too early to tell whether the demonstration’s financial model would be sustainable over the longer term. Each plan reported experiencing less transparency with the Medicare rate setting process than the Medicaid rate. One plan noted that the Medicare rate covered the medical portion of services but had no allowance for care management or for the administrative costs of that service. Plans reported savings targets would be difficult to achieve, especially given the 365-day care continuity requirements. When asked about identifying sources of savings in the demonstration, the plans noted two general sources: change in the population group mix (institutional, community waiver, and community well) under managed care compared to the mix in FFS, and changes in service costs for more cost-effective utilization of services. There are potential savings from serving more individuals in the community rather than institutions and providing HCBS as preventive services, before people need an institutional LOC, to avoid more costly future services. Additionally, plans noted that providing care coordination services to the community-well population could result in savings if they are able to meet these individuals in the hospital and help them to know their care managers and better manage their transition from the hospital to the community. Other potential areas for savings include: reducing emergency room visits, inpatient hospital stays, and duplication of services, and keeping people in the community rather than nursing facilities.
Built into the financial alignment demonstration are aggregate savings percentages of 1 percent in the first year of the demonstration (May 2014-December 2015), 2 percent in the second year (January-December 2016), and 4 percent in the third year (January-December 2017) (excluding the Medicare Part D component). State officials reported that savings played a fairly small role in the state’s interest in participating in the demonstration. While the long-term results may include savings, the short-term focus was on achieving better-coordinated care and better health outcomes. Several stakeholders suggested the key to reaching the savings targets would be to enroll (and maintain enrollment) of beneficiaries for both their Medicare and Medicaid benefits (and not just Medicaid benefits), although it is unclear how the timing of Medicare passive enrollment (6-8 months after Medicaid passive enrollment) will affect savings targets, especially in year one.
Quality Withhold
Included in the 3-way contract are quality withholds where CMS and the state withhold a portion of the Medicare A/B and Medicaid capitation payments – 1 percent in the first demonstration year, 2 percent in the second, and 3 percent in the third year.11 Plans can earn back these funds based on their performance on the quality withhold measures outlined in the contract. In year 1, plans are able to earn back withheld funds if they meet certain quality standards including: (1) submitting encounter data accurately and completely in compliance with contract requirements; (2) the share of beneficiaries with initial assessments completed within 90 days of enrollment, (3) establishment of a beneficiary governance board; (4) percent of best possible customer service score; (5) percent of best possible score getting appointments and care quickly; (6) share of beneficiaries with documented care goals; and (7) nursing facility diversion measure. In years 2 and 3, plan payment will be based on performance on the following quality withhold measures: (1) plan all-cause readmissions; (2) annual flu vaccine; (3) follow-up after hospitalization for mental illness; (4) screening for clinical depression and follow-up care; (5) reducing the risk of falling; (6) controlling blood pressure; (7) Part D medication adherence for oral diabetes medications; (8) nursing facility diversion measure; and (9) long term care overall balance measure.12 A unique feature of Ohio’s financial alignment demonstration, relative to other states, is the inclusion of several HCBS/rebalancing measures among the quality withholds. Specifically, these measures are: (1) Number of beneficiaries residing outside a NF as a proportion of total number of beneficiaries in plan (>100 day continuous NF stay); and (2) number of beneficiaries who lived outside a NF during current year as a proportion of beneficiaries who lived outside a NF during previous year (>100 day continuous NF stay).
Service Delivery Model
Ohio’s financial alignment demonstration was designed to better integrate Medicare and Medicaid benefits for dually eligible individuals in targeted regions of the state. Health plans are required to provide all health, behavioral and LTSS to dual eligible beneficiaries enrolled in the demonstration. As outlined in the MOU between CMS and the state of Ohio in December 2012, key objectives of the demonstration are to improve the beneficiary experience in accessing care, deliver person-centered care, promote independence in the community, improve care quality, eliminate cost shifting between Medicare and Medicaid and achieve cost savings through improvements in care coordination.
A cornerstone of Ohio’s financial alignment demonstration is the promise of comprehensive care coordination across all settings (acute, LTSS, behavioral, and social services) with the help of a care manager. With the demonstration, all beneficiaries receive care management and are assigned a care manager from their plan. The plan’s approach to care management must be person-centered, promote the beneficiary’s ability to live independently and comprehensively coordinate the full set of Medicare and Medicaid benefits. This includes helping beneficiaries transitioning from a hospital back to their home or from a nursing facility to their home. The major components of the service delivery model are described below.
Initial Assessment
Once a beneficiary is enrolled in MyCare Ohio, whether only for Medicaid managed care benefits or for both Medicare and Medicaid benefits, the plan is contractually obligated to perform an initial comprehensive assessment of the beneficiary’s medical, behavioral, LTSS and social needs. The timeframes required for completion of the initial assessment are: within 15 days of enrollment for beneficiaries assigned to the intensive risk stratification level, within 30 days for the high level, within 60 days for the medium level, and within 75 days for the low and monitoring levels.13 These timeframes were designed to ensure that those most at risk would receive the earliest assessments. Face-to-face assessments are required for beneficiaries assigned to the intensive and high-risk levels and for any beneficiary receiving home and community-based waiver services. All other beneficiaries may be assessed by telephone, unless an in-person assessment is requested. Results of the comprehensive assessment are used to confirm the beneficiary’s risk stratification level and to develop the individualized care plan (ICP). Initial ICPs must be developed within 15 calendar days of the initial assessment and include information about the beneficiary’s progress in achieving goals, coordination of care and services, use of providers, ongoing medication management, preferred method of contact, and strategy for care transitions between settings. The assessments are conducted by case managers or other licensed/credentialed professionals employed by the plans, unless the plan decides to subcontract that function out to a provider, such as the local AAAs. Provisions for conflict free case management have been built into the 3-way contract in instances where the plans directly provide or delegate waiver service coordination and case management services to beneficiaries. There are also firewalls in place for the AAAs between the areas responsible for waiver eligibility determination and waiver service coordination.
Stakeholders reported delays in initial assessments across all seven MyCare regions. Delays in initial assessments affected the transition to Medicaid managed care, and while not unique to the demonstration population, the delays were an issue that impacted the demonstration population because the same resources were being utilized among the plans. Some delay was expected given the complexity in launching a new program with over 100,000 individuals over the span of three months. Plans acknowledged the delays and the difficulty of meeting the assessment timeline requirements. Two plans noted their models seems to be working despite some delays, because of their partnership with the AAAs which allowed many MyCare Ohio beneficiaries to keep their same care manager. However, several stakeholders noted that large caseloads delegated to the AAAs were also contributing to the delays in initial assessments. Other plans had models that required beneficiaries to connect to a person different from their existing point of contact. Plans reported difficulty in contacting beneficiaries despite repeated requests to schedule an assessment. Strategies to locate individuals included phone calls, letters, relying on community health workers, visiting people’s homes, examining claims history, ER reports, and calling providers. Individuals not already connected to a waiver service or a case manager were the hardest to locate. Ultimately, there will be no quality withhold payments to the plans that do not complete the initial assessments on time.
Another reason for the delay in initial assessments could relate to a lack of beneficiary understanding and awareness of MyCare Ohio. According to some stakeholders, some individuals were denying the assessment because they were recently assessed under a previous waiver program. In other situations, beneficiaries voiced reluctance to contact a new care manager when they were happy with their previous one. A consequence of the delays in performing the initial assessment was that some individuals were not assigned a care manager until the assessment occurred (75 days or more). One stakeholder reported that beneficiaries “need access to a care manager at enrollment…someone to call for help.”
Care Coordination
Plans are required to form a care management team, called the trans-disciplinary care team, consisting of the individual, the primary care provider, specialists, the care manager, the waiver service coordinator (as appropriate), the individual’s family/caregiver/supports, and other providers based on the individual’s needs and request. The MOU outlines the role of the trans-disciplinary care team: to participate in and support care management activities, such as completion of the comprehensive assessment and development, implementation and updates to the ICP at the direction of the care manager. Prior to MyCare Ohio, only beneficiaries enrolled in an HCBS waiver or in a Medicare Advantage plan had access to a care manager, but even those individuals lacked coordination support across both the Medicare and Medicaid programs. Several months into the financial alignment demonstration, the majority of stakeholders reported that the trans-disciplinary care team was not yet functioning as designed due to delays in completing initial assessments. Looking beyond the initial months of implementation, plans acknowledged the need to ensure that care managers are engaged in service coordination. Advocates cautioned that unless the plans make a meaningful connection between care managers and individuals, outcomes of the demonstration would not be met.
“The AAAs are helping to carry out big pieces of the demonstration including assessments, care management, and care plan development. They are boots on the ground that the state and federal government doesn’t have.” – Stakeholder
Effective January 1, 2015, an amendment to the 3-way contract allows beneficiaries who receive home and community-based waiver services to select a waiver service coordinator to facilitate and manage the delivery of waiver services authorized in the waiver service plan. A unique feature of Ohio’s financial alignment demonstration is the requirement for plans to contract with Ohio’s AAAs and other entities that have experience working with people with disabilities for waiver service coordination for individuals age 60 and over. Because of their involvement with care coordination for seniors in the Passport waiver program, the AAAs had established trusted relationships among beneficiaries and providers. The AAAs were previously providing waiver service coordination under the fee-for-service system, and therefore were equipped to provide these services at implementation. Other qualified entities may include CILs or disability-oriented case management agencies and were included in the 3-way contract language in order to give beneficiaries another option for waiver service coordination.
Stakeholders viewed the AAAs’ involvement in the financial alignment demonstration as a huge asset. Plans relied on them for their connection to community-based resources and their knowledge of services, service authorizations, and assessments. The requirement to including the AAAs in the demonstration as well as the continuity of care provisions built into the demonstration helped maintain continuity of care for seniors during the transition to managed care. One plan noted that working closely with the AAAs helped increase the opt-in percentage for Medicare services. Some advocates pushed to involve the AAAs in wavier service coordination for the under sixty population, but ultimately that flexibility was given to the plans to decide. Plans may contract with AAAs, or other entities, or provide waiver service coordination themselves for individuals under the age of 60. Health plans in the demonstration vary in the degree to which they delegate the roles of waiver service coordination and care management for beneficiaries under age 60. As of October 2014, two of the five health plans participating in the demonstration (Aetna and CareSource) fully delegated care management responsibilities to the AAAs for both the under and over 60 population, while the other three plans hired their own case managers to provide care management for those under age 60 and rely on the AAAs for waiver service coordination for individuals aged 60 and older. Plans using their own case managers reported large hiring activity associated with MyCare Ohio. The majority of the new hires were nurses, care managers, social workers, and community health workers. Plans rely on community health workers to provide peer support services that includes visits to beneficiary’s homes for in-home assessments and ensuring the beneficiary is linked with other social services or community resources.
Behavioral Health Services
State officials estimate that 16 percent of MyCare beneficiaries have behavioral health needs. Therefore, the inclusion of behavioral health services in the demonstration was essential in order to maximize care coordination and access to services across all care settings. As outlined in the three-way contract, plans are required to staff a behavioral health director whose responsibilities include ensuring access to behavioral health services (including mental health and substance abuse services), ensuring overall integration of behavioral health services in the beneficiary’s care plan, ensuring systematic screening for behavioral health disorders, and participating in management and program improvement activities for enhanced integration and coordination of behavioral health services.
Plans made a number of changes, mainly hiring of staff, to accommodate individuals with behavioral health needs. They reached out to community-based organizations and companies with behavioral health care management experience for training, hiring and conducting assessments. Plans reported having a specialized care team dedicated to serving MyCare beneficiaries with a mental illness diagnosis with care managers experienced in behavioral health. For example, a psychiatrist would serve on the trans-disciplinary care team for a beneficiary with behavioral health needs. Some of the plans had prior experience serving Medicaid beneficiaries with behavioral health needs. None of the plans reported difficulty recruiting behavioral health providers, but stakeholders and providers said the transition to managed care from fee-for-service necessitated a learning curve for new billing, coding and IT practices. One provider noted integrating physical and behavioral health has great potential but that potential would only be reached if the behavioral health specialist were part of the care planning and coordination efforts.
Supplemental MyCare Ohio Services
Financial alignment demonstration health plans in Ohio have the option of adding supplemental services or “value-added services” to their existing benefits package. Beneficiaries are made aware of these services through the member handbook and by their care managers. Some plans are offering MyCare beneficiaries enhanced transportation services including 60 one-way trips each calendar year (Molina), access to more frequent dental services (Aetna), and/or assistance with over-the-counter product expenses (Aetna, Buckeye, and Molina). However, these enhanced services are only available for MyCare Ohio beneficiaries enrolled for both their Medicare and Medicaid benefits. The structure of care coordination and benefits offered differs across the plans in terms of value added benefits, but all MyCare Ohio beneficiaries are given access to a 24/7 nurse advice call line, a 24/7 behavioral health crisis line, care coordination, and expanded HCBS waiver services (as noted earlier).
Continuity of Care Requirements
In order to minimize service disruption when transitioning from FFS to managed care, health plans must allow beneficiaries to maintain current providers and service levels at the time of enrollment, for a pre-determined amount of time, depending upon the type of service. Physician services are maintained for 90 days for high-risk individuals and 365 days for all other MyCare beneficiaries. Direct care waiver services such as personal care, adult day and home care attendant services, are maintained at current levels and with current providers at current Medicaid reimbursement rates for 365 days. For assisted living waiver services and nursing facility services, providers are maintained at current rates for the life of the demonstration. All other waiver services are maintained at current levels for 365 days and with existing providers at existing rates for 90 days. This includes services such as home medical equipment and adaptive and assistive devices, transportation, and community transition. Community mental health and addiction treatment center services are maintained at current levels of service with current providers for at least 365 days. There are some exceptions to the transition requirements.14
Stakeholders agreed that the transition requirements built into the demonstration were strong and helped ensure continuity of care during the move to managed care. Early on in the demonstration and after the 90-day transition period ended, beneficiaries reported problems accessing transportation and DME services. Follow-up interviews with beneficiary advocates in December 2014 revealed improvements with transportation services but continued problems with DME prior authorizations. Individuals in some instances were being denied equipment that had been a part of their lives and care plans for some time. Stakeholders expressed concerns about decreased service levels and HCBS provider network adequacy after the 365-day transition period expires. Providers expressed concern that plans would narrow their networks at the end of the transition periods and/or reduce payment rates.
Enrollment in MyCare Ohio
2-Part Enrollment Process and Beneficiary Choices
MyCare Ohio began by first implementing mandatory Medicaid managed care enrollment starting on May 1, 2014 in the Northeast Region (Cuyahoga, Medina, Lorain, Geauga and Lake counties). Mandatory enrollment was based on a computer algorithm that utilized current Medicare Advantage or D-SNP enrollment, past Medicaid managed care plan enrollment, and past claims and provider utilization history.15 As part of the Medicaid passive enrollment process, individuals were given the choice to voluntarily enroll in the same MyCare Ohio plan to receive Medicare services or remain in either traditional Medicare FFS or Medicare Advantage. The remaining six regions began enrollment on June 1 and July 1 of 2014. In September 2014, mandatory Medicaid enrollment was briefly put on hold to accommodate the Medicare open enrollment period. ODM announced that they would not be issuing additional mandatory enrollment notices to beneficiaries to avoid duplication during the Medicare open enrollment period (Oct 15, 2014 – December 7, 2014). Voluntary enrollment for Medicare benefits continued during this time. Beneficiaries who enrolled in managed care only for their Medicaid benefits had 90 days to switch plans before being locked-into a plan. Beneficiaries who enroll in the financial alignment demonstration (for both their Medicare and Medicaid benefits) have the ability to change health plans monthly, at any time during the year, with coverage beginning on the first of the following month.16
In October 2014, beneficiaries who had not voluntarily enrolled in the demonstration received a notice stating that effective January 1, 2015, their Medicare coverage will change to the same managed care plan that provides their Medicaid benefits and that their MyCare plan will also cover their prescription drugs.17 They were given the option to decline that enrollment and continue their current Medicare arrangement. For those who did not actively decline, as of January 1, 2015, their MyCare Ohio plan began providing both Medicare and Medicaid services. Individuals can opt-out of Medicare managed care enrollment by contacting Ohio’s enrollment broker or calling 1-800-MEDICARE. Additionally, individuals who previously requested to opt out may voluntarily opt in at any time for an effective date of the following month.
The flexibilities built into the model including the ability to change plans and opt-in and out every month for Medicare benefits, while important for beneficiary choice, have caused challenges for the state and the health plans. The enrollment/disenrollment flexibility contributes to population instability making it difficult to track individual changes. The process of changing plans begins with the beneficiary notifying the enrollment broker, and then the enrollment broker processes that change and sends that information to Medicare and the managed care plan. State officials noted that because of the daily nature of many LTSS, individuals who change plans need that communication to happen immediately between the individual, the enrollment broker, Medicare and the managed care plan to ensure a streamlined assessment process and continuity of services. Stakeholders called for better, more accurate flow of information between the state and the plans.
Stakeholders were split on whether the two-part process of Medicare opt-in enrollment (concurrent with mandatory Medicaid managed care enrollment) followed by passive Medicare enrollment was a benefit or a hindrance for the financial alignment demonstration. One stakeholder noted the two-step process allowed for “more time to bring up the program and work through issues as they arise.” Allowing beneficiaries six to eight months to voluntarily enroll for Medicare services before being passively enrolled enabled the state and plans to make adjustments to beneficiary notifications, learn from the initial rollout experience, and conduct additional outreach to beneficiaries and providers. Also, issues around the timing of Medicare open enrollment led to the decision to wait until January for Medicare passive enrollment, although letters sent out to beneficiaries arrived at the same time that regular Medicare Advantage open enrollment began in October which may have been confusing for beneficiaries. Others questioned the delay of Medicare passive enrollment since managed care plans had experience with acute services (covered by Medicare) and less experience with managing LTSS (covered by Medicaid). It is too early to know whether health plans were able to leverage opportunities to market the benefits of the demonstration to providers and beneficiaries during the months leading up to Medicare passive enrollment or whether the bifurcated enrollment process led to more confusion for dual eligible beneficiaries.
MyCare Ohio Enrollment Activity
As of January 2015, a total of 94,525 individuals were enrolled in MyCare Ohio (Figure 6). Seventy-two percent (or 67,993 individuals) were enrolled in the fully integrated model for both Medicare and Medicaid services, and 28 percent (26,532 individuals) were enrolled in a plan for only for Medicaid services and chose to keep their prior Medicare Advantage plan or remain in Medicare FFS. Individuals were assigned a MyCare Ohio plan for mandatory Medicaid managed care services between May-July 2014. Over the next 8 months, the opt-in rate for Medicare services averaged around 16 percent of the eligible population until passive enrollment for Medicare services occurred and the enrollment rate for Medicare services jumped to 72 percent (Figure 7). Stakeholders were anticipating a large increase in the percentage of beneficiaries enrolled for both Medicare and Medicaid services, following passive Medicare enrollment. Looking ahead, it will be important to follow whether the health plans can maintain that level of Medicare and Medicaid participation or whether opt-out rates will increase. In Massachusetts and Virginia, for example, opt-out rates have averaged about 35% and 29% respectively.18
Figure 6: MyCare Ohio Enrollment, by Type of BeneficiaryFigure 7: Percentage of MyCare Beneficiaries Enrolled For Both Medicare and Medicaid Benefits
The Northeast region had the highest percentage of beneficiaries eligible for the financial alignment demonstration enrolled (27% or 25,794 individuals) followed by the Southwest region (17% or 16,115 individuals) (Figure 8). These regions cover the Cleveland and Cincinnati areas. With at least two health plans operating in each of the seven regions, one-quarter of demonstration enrollees were members of CareSource. CareSource is also the largest Medicaid managed care plan in the state covering over half of all Medicaid managed care beneficiaries.19 As noted earlier, CareSource has partnered with Humana in this demonstration, and Humana is the largest Medicare Advantage organization in Ohio offering plans that cover 28 percent of all Medicare Advantage enrollees.20 The Northwest region had the highest percentage of beneficiaries participating in the demonstration (for both their Medicare and Medicaid benefits) (76%), and UnitedHealthcare had the highest percentage of beneficiaries participating in the demonstration (for both their Medicare and Medicaid benefits) among the five health plans. Just prior to passive Medicare enrollment, CareSource had nearly thirty percent of its MyCare population enrolled for both Medicare and Medicaid benefits while the other plans’ Medicare opt-in rates averaged just 13 percent.
Figure 8: MyCare Ohio Enrollment, by Region and by Plan, as of January 2015
State officials and plan stakeholders reportedly pursued a mandatory enrollment process for Medicaid services in order to provide stability to the beneficiary, the provider and the managed care plan. Most of the Medicaid population in Ohio was already enrolled in managed care and they believed that this population new to managed care, the dual eligible beneficiaries, would benefit from access to care management services and better care coordination to promote improved health outcomes.
Stakeholders identified some systems issues that caused confusion during the few six months of MyCare enrollment. First, the lists of people to contact and assess were often inaccurate. This problem arose early on and continued through the months leading up to Medicare passive enrollment, although stakeholders reported fewer problems over time. In some cases, people were showing up on two lists (as members of both plans in the region) or not on a list at all. The transmittal of information between the state/CMS, the plans, and the AAAs was delayed or inaccurate, which led to service disruptions for beneficiaries. One stakeholder noted that each plan has its own IT system and never tested it to the level or magnitude of the number of beneficiaries that were being enrolled in MyCare Ohio. Another example of IT systems challenges is the lag time in processing beneficiary plan changes. Some respondents suggested MyCare Ohio beneficiaries who switch plans are going without needed services for one month or more, because the plans are unaware of the enrollment change when it is made. A more prompt notice should be used to notify past and current plans of enrollment changes so that the beneficiary does not experience any gaps in services. The reconciling of lists is also important for providers so that they know which plans to bill and can get paid on a timely basis.
Consumer advocates also reported a number of problems during the first six months of implementation related to mandatory Medicaid managed care enrollment including insufficient outreach to beneficiaries and providers; multiple, complicated written mailings; and lack of knowledge about who to call for help. One stakeholder remarked that the impact of Medicare passive enrollment would not be seen until beneficiaries begin to navigate the new system by filling a prescription or seeking services. It is possible that many of the nearly 52,000 beneficiaries who were passively enrolled in a plan for their Medicare services between December and January were not aware of a change given the challenges in locating individuals following mandatory Medicaid managed care enrollment and given the health and cognitive vulnerability of the dual eligible population.
Public Awareness and Marketing of MyCare
“People have been given an onslaught of information and change at once.” – Stakeholder
Ohio sent letters to eligible individuals in December 2013, introducing the MyCare Ohio program and explaining how managed care affects them. Leading up to the launch, ODM and the Department of Aging sponsored regional forums, webinars and conference calls to inform beneficiaries and providers about MyCare Ohio. Outreach was funded by the state and primarily conducted by community organizations with direct access to beneficiaries such as the AAAs, CILs, and Easter Seals. The consumer enrollment process began with a Medicaid managed care mandatory enrollment notice sent initially on a rolling basis on March 1st, April 1st, and May 1st, 2014, depending on region. A reminder notice was sent to individuals who did not make a voluntary choice 30 days prior to the Medicaid passive enrollment effective date. Several stakeholders reported the 6-page written notices to beneficiaries were confusing and complicated. Individuals had opportunities to choose their plan over the phone from an enrollment broker, during regional/enrollment forums, and through face-to-face individual enrollment counseling. The Medicaid consumer hotline and website served as the primary educational and enrollment mechanisms,21 although auto-assignment was the predominant mechanism for enrollment. State SHIP programs also reported an uptick of calls related to enrollment in Medicaid managed care. Just prior to May 1st, managed care plans took over the marketing responsibility and continued training and education forums throughout the summer.22 Marketing and member materials had to be prior approved by ODM before being shared with eligible MyCare beneficiaries.
“People have gone through one crisis of disruption and now we are going to go through it all over again…with Medicare enrollment in January.” – Provider
The majority of stakeholders agreed that beneficiaries could have been better informed that MyCare Ohio was coming. Given the physical and cognitive limitations many dual eligible beneficiaries face, any transition into a new program would likely cause confusion. Consumer advocates reported hundreds of calls from confused beneficiaries whose services had been disrupted and did not know where to turn for help. Some stakeholders suggested the enrollment of over 100,000 dually eligible beneficiaries into Medicaid managed care over the course of three-months was an aggressive timeline, leaving little opportunity to learn from initial enrollment experience in a region. Thus, “early problems happened in large numbers.” One early challenge repeatedly mentioned was difficulty with finding people. Those hardest to find were in the community well category. These individuals were not already connected to a waiver service that made locating them a difficult task. ODM officials stressed the importance of thinking about how to find people ahead of implementation and noted the value of contracting with the AAAs because of their built in contact with beneficiaries. Plans reported devoting considerable resources toward addressing initial disruptions in service with infrastructure and process improvements. Hiring and training of staff and collaborating with organizations that serve dually eligible beneficiaries to help with outreach were strategies they employed to address initial transition problems. Consumer advocates recommended broadening the state’s beneficiary assistance capacity by expanding the ombudsman program’s hours and increasing funding for local ADRNs. Other suggestions included developing an Early Indicator System, similar to the one in Massachusetts to track patterns of systemic problems.
Given early outreach challenges and potential beneficiary confusion with Medicare passive enrollment occurring at the same time as open enrollment for Part D, Medicare Advantage and the health insurance Marketplace, state officials and plans took additional steps to educate beneficiaries leading up to January 2015. These steps included simplifying the language included in beneficiary mailings, in-person meetings between the plans and community-based beneficiaries, and making sure that call centers were equipped to handle questions. Beneficiaries received a 60-day passive enrollment notice with instructions on how to actively opt-out of the financial alignment demonstration for Medicare services. Thirty days before the passive enrollment effective date, January 1, 2015, beneficiaries received another reminder notice with the effective enrollment date and the name of the assigned MyCare Ohio plan. By the time Medicare passive enrollment occurred, beneficiaries should have received an initial assessment and been given a care manager to help them access care through the plan. The promise of a ‘single point of contact’ or a care manager will hopefully help to mitigate disruptions in continuity of care caused by the transition to managed care.
Provider Involvement
In the 3-way contract, plans must demonstrate annually, as required by CMS and ODM, an adequate provider network sufficient in number, mix, and geographic distribution, to ensure adequate access to medical, behavioral health, pharmacy, and LTSS providers. Each plan reported starting with their existing networks to form a provider network for MyCare Ohio beneficiaries. They engaged with networks from existing Medicaid and Medicare Advantage (or SNPs) contracted providers that included physician, hospital, and pharmacy provider groups, and relied on historical FFS files to identify new network HCBS providers. The 3-way contract also included specific access standards related to LTSS providers including providing: at least two community LTSS providers in each region for services such as enhanced community living, waiver transportation, home medical equipment and supplemental adaptive and assistive devices; at least two community LTSS agency providers for personal care and waiver nursing services; and at least one community LTSS provider in each region for home delivered meals and home modifications maintenance and repairs.23
Each plan and its network providers must comply with the ADA and maintain capacity to deliver services in a manner that accommodates the needs of MyCare Ohio beneficiaries, including physical, geographic and communication needs. All health plans are required to have written policies and procedures in place to assure ADA compliance and must designate to ODM an individual who is responsible for ADA compliance. Some of the policies designed to ensure access include flexibility in scheduling, providing interpreters or translators, and individualized assistance. Plans are also required to conduct annual education programs for their trans-disciplinary care team providers related to ADA/Olmstead requirements, person-centered care planning processes, and accessibility and accommodations. Some stakeholders expressed concern about plans’ ability to meet ADA obligations. This will be an important issue to follow as the demonstration moves ahead.
“Providers have a significant impact on the decision consumers are making regarding enrollment…plans knew this would be the case and they are worried.” – Beneficiary advocate
Both state officials and plans put forth tremendous effort to educate providers about MyCare Ohio, yet some provider groups were slow to engage and stakeholders felt more targeted outreach would have helped. Not understanding the program or fear of reductions in payment rates were reasons that some providers reportedly chose not to participate in MyCare. State officials reported engaging with providers and beneficiaries for many months leading up to the launch and on an ongoing basis. They facilitated forums, meetings, and made information available online for providers, advocates and associations. After May 1, 2014, plans continued training and educational forums through the summer. Plans reported that delaying the rates made it hard to engage with providers. State and CMS officials reportedly took time to negotiate which Medicare and Medicaid factors and growth rates to consider when determining the rates. Outreach to LTSS providers required more time and resources compared to other provider groups since this cohort was new to managed care billing and reimbursement practices. One plan reported conducting over one hundred training sessions for HCBS providers. Stakeholders suggested both the plans and the state could have done a better job with basic program education that informed the provider “what the program is doing and what it is not doing.” The issues involving providers were related to the concurrent implementation of mandatory Medicaid managed care but also affected the capitated financial alignment demonstration, which encompasses both Medicare and Medicaid services.
Independent Providers
One of the most widely cited challenges initially for MyCare Ohio involved independent providers (IPs). Ohio has an estimated 12,000 IPs who are home health workers that provide assistance with activities of daily living, including dressing, bathing, feeding, and toileting. Just prior to the MyCare rollout, a third-party billing agent for IPs dropped the service with little notice, requiring the IPs to submit claims directly to the managed care plans in order to get paid. Claims submission was a skill with which few IPs had any experience prior to MyCare. As a result, many IPs were not paid on a timely basis due to failure to submit accurate claims and added processing time to transition the IPs into the new system. Meanwhile, managed care plans were used to reimbursing claims filed on a 30-day cycle, but IPs were used to being paid faster, so even some “clean claim” payments were delayed. “Nobody was paying attention to MyCare until they stopped getting paid,” reported one LTSS provider. Stakeholders claimed that some IPs walked off the job because of failure to be paid, which jeopardized the health and safety of some MyCare beneficiaries. It also exposed a large educational gap among providers, forcing the plans to reach out to IPs and educate them on the process of submitting claims correctly. Unlike other provider groups, IPs are difficult to reach because they lack an association to voice their needs collectively or to educate them on systems changes.
“We weren’t reimbursing IPs for services rendered, we were giving them a paycheck.” – MyCare Ohio plan
Once the billing problem was exposed, plans set up weeknight and weekend trainings, often on a one-on-one basis, to engage providers and teach them how to bill through an online portal. Each plan now has an online portal where providers can submit claims on their own. Other provider groups reported experiencing payment delays during the transition to managed care, but generally they were larger entities with larger cash flow to absorb the delay. Some providers were given advance checks from the plans in order to make up for delayed payments. Another plan reported speeding up the process of payments to twice a month. Stakeholders agreed that IPs should have been better informed that MyCare Ohio was coming and what impact it would have on their billing process. They also suggested that plans should have engaged beneficiaries and advocates ahead of implementation to better understand the population served by IPs and their daily needs.
Primary Care Providers
Another provider group that has been difficult to engage is primary care providers (PCPs). The 3-way contract requires plans to ensure that all beneficiaries have a network PCP of their choice upon enrollment. PCPs reportedly knew very little about the MyCare Ohio ahead of time, yet are seen as a critical component of the demonstration and influential with respect to enrollment decisions for Medicare services. In general, beneficiaries want to stay with their PCPs, so provider participation in MyCare can have a direct influence on an individual’s decision to enroll in the fully integrated model (for Medicare and Medicaid services). Other providers with influence over beneficiary decisions included pharmacy and HCBS waiver providers. Despite the potential for better-coordinated care for individuals, some PCPs were reluctant to participate, citing overlap with other demonstrations and added billing requirements as barriers. One PCP noted that starting with just mandatory Medicaid managed care enrollment (and not Medicare and Medicaid simultaneously) made some physicians reluctant to participate, given that physicians generally accept Medicare payment but not all accept Medicaid. Stakeholders reported optimism that PCP participation would improve after passive Medicare enrollment in January 2015. If it does not, however, and large numbers of beneficiaries opt-out of Medicare services, stakeholders noted it would be a ramification of not having adequately educated providers about MyCare.
PCPs can be a difficult group of providers to reach, especially the ones who are not affiliated with large health systems or groups. Provider advocates reported that provider participation in MyCare Ohio would be driven by large provider groups’ willingness to enter into contract arrangements with health plans. The demonstration was designed to promote provider participation and to minimize disruptions in care by including a transition period of up to one year for physicians who do not have a relationship with a patient’s MyCare Ohio plan. During that transition, physicians may continue to serve MyCare Ohio beneficiaries, however, they must make authorization and payment arrangements directly with the MyCare Ohio plan. Beyond the transition period, health plans may choose to continue with any certified provider, regardless of whether or not they contracted with a plan. Plans reported ongoing efforts to increase provider education and outreach.
Transportation Providers
In the early stages of MyCare Ohio, the transition to managed care disrupted established communication channels between the AAAs and transportation providers leading to disruptions in services for MyCare beneficiaries. Prior to MyCare, the AAAs were able to directly arrange transportation services between a beneficiary and a provider. Health plans are managing transportation services differently now. Some MyCare plans manage their transportation services through their own case managers while other plans have subcontracted with a third-party company to manage the transportation services of MyCare Ohio beneficiaries. As a result of the transition, beneficiaries reported examples of multiple transportation agencies arriving to pick up a beneficiary as well as “a lot of no-shows.” Stakeholders heard reports of a subcontractor company calling a taxi service instead of a transportation provider to transport individuals with physical disabilities. Although some transportation providers use taxis for non-emergency transportation services, one stakeholder noted, “Curb to curb transport does not work for this population; our population needs door to door transportation.” Stakeholders reported a lack of understanding between the health plans and the beneficiary’s transportation needs, and a lack of understanding of responsibility for transportation services. For example, some plans’ decisions reflected their failure to understand that the scope of transportation services includes non-medical transportation to promote social interactions. Transportation providers working with subcontractor companies also reported having to record more complex billing records and hope to see a smoother and more cost effective billing system going forward. Plans were not obligated to continue existing relationships with transportation providers after the first three months of enrollment. One transportation provider expressed concern about securing a contract with the plans after the transition period ends.
Beneficiary Protections and Engagement
Enrollment and Implementation Workgroup
ODM convened a group of stakeholders consisting of advocates, the plans, providers, beneficiaries, and others to advise and provide input on MyCare communications and processes. State officials characterized the creation of the enrollment workgroup as a valuable component of the demonstration. The workgroup assisted with drafting and vetting of letters, developing instructional material, and organizing regional forums for beneficiaries and providers. Following the launch date of MyCare, the group transitioned to an implementation workgroup that continues to support the demonstration and meets every other month.
Demonstration Ombudsman
MyCare Ohio has an ombudsman program that functions separately from the health plans and the state Medicaid agency, although it is still part of state government, to help beneficiaries access covered services and to handle complaints. In February 2014, the Ohio Department of Aging applied for and received CMS funding to implement the financial alignment demonstration’s ombudsman program. CMS awarded the ombudsman program approximately $1.2 million for the three-year demonstration. Building upon the existing state long-term care ombudsman program staff of 93 ombudsmen and 300 volunteers, MyCare Ohio added one ombudsman coordinator and four regional MyCare ombudsman whose primary focus is on the demonstration. Prior to the demonstration, the state ombudsman program had experience working as an independent advocate for individuals with medical and LTSS needs in both institutional and community-based settings.24 In addition, the state ombudsman had experience working with Medicaid Money Follows the Person program participants and through that program, individuals with behavioral health issues. One ombudsman noted it was a “natural fit” that the state ombudsman offices would be involved with the demonstration because of this experience working with the ODM. In Ohio, the ombudsman’s office was involved early on with demonstration planning and participated in the enrollment (and implementation) workgroup. They engaged with the managed care plans and ODM before they started independent oversight of the demonstration and advocacy work, and participated in weekly meetings with the plans and ODM. During the initial months of implementation, the demonstration ombudsman reported focusing on integrating the estimated 60,000 community well population into the current ombudsman services, responding to beneficiary complaints, and securing additional funding so that each of the seven MyCare Ohio regions would have a local ombudsman.
“States that implement this model need to be aware that they are going to create a series of problems for the beneficiaries. They need to be clear with them that there is going to be a period of transition and there needs to be an easy way that they can seek help. Right now, it’s not clear whether the Medicaid office or the plans or the OSHIP or ombudsman is responsible.” – Stakeholder
State officials characterized the ombudsman program as a valuable resource during the first months of the demonstration highlighting its transparent relationship with the state and the plans. However, some stakeholders questioned the effectiveness of the program due to the low number of complaints reported compared to what other advocacy groups were experiencing. In Ohio, the Ohio Senior Health Insurance Information Program (OSHIP), the plans, the ADRNs, the Ohio Consumer Voice for Integrated Care (OCVIC), legal aid agencies, and the ombudsman all serve as points of contact for beneficiary problems or complaints. No single entity is responsible for logging and reporting those beneficiary issues leading to uncertainty about the number and severity of problems and complaints. One key informant suggested Ohio develop an Early Indicator System modeled after the one in Massachusetts. In the meantime, the state and plans have tried to raise awareness about the ombudsman program and the resources it offers, including for example, representation in appeals and explaining to beneficiaries their options for switching plans. Plans were required to tell beneficiaries about the ombudsman program in the member handbook, and they increased awareness by including ombudsman phone numbers on letters to beneficiaries. The local aging and disability resource networks (ADRNs) have also done outreach for the ombudsman program.
Consumer Advisory Council
All plans are required to have a Consumer Advisory Councils (CAC) in each region the plan serves. Each CAC must be made up of at least 20 percent beneficiary representatives and reflect the diversity of the MyCare population. Organizations such as Linking Employment, Abilities and Potential (LEAP), a federally recognized Center for Independent Living, are engaging with the plans to help train consumers to participate in the councils so that plans can better understand how to contact and communicate more effectively with beneficiaries. Each CAC must meet quarterly and gives direct feedback about the policies and protocols adopted by the health plan. Stakeholders called for more frequent meetings, especially early on in the demonstration to address issues that arise. The establishment of these CACs are one of the “quality withhold” measures discussed previously.
Additionally, the Universal Health Care Action Network of Ohio (UHCAN), an independent community-based organization, received a grant through Community Catalyst to create a coalition to support MyCare Ohio beneficiaries. The Ohio Consumer Voice for Integrated Care (OCVIC) consists of a statewide coalition of aging and disability advocates that seek to organize and educate MyCare Ohio beneficiaries. OCVIC has been heavily involved during the MyCare rollout building a voice for MyCare beneficiaries and advocating for policy changes going forward.
Grievances and Appeals
Financial alignment demonstration beneficiaries who are dissatisfied with their plan’s decisions about service authorizations can file appeals with the plan, and are entitled to use all of the appeals processes applicable to Medicare and Medicaid. Demonstration beneficiaries learn about the right to appeal from the state, the ombudsman and the plans. Ombudsman received training in the appeals process and can represent beneficiaries in appeals (although they are not uniquely assigned to do so), and the state sent notices to beneficiaries with information about the right to appeal. Each service denial/termination notice from a plan also explains this information. Like other states’ demonstrations with the exception of New York, the Ohio appeals systems are not truly integrated. However, Ohio’s financial alignment demonstration is providing aid pending appeal (continued services) for both Medicare and Medicaid benefits (excluding Part D) during internal plan appeals. This is a significant feature of the demonstration and not a feature of regular Medicare. Also, aid pending appeal is not subject to recoupment if the beneficiary’s appeal is ultimately unsuccessful, another feature that is not typical to most state Medicaid programs.
It is too early to determine whether beneficiaries are experiencing challenges related to navigating the demonstration’s appeals process. The ombudsman office and stakeholders expected to see more beneficiaries utilizing the appeals process following passive Medicare enrollment in January 2015. Looking ahead, it will be important to monitor the impact of the ombudsman programs and its ability to assist beneficiaries with grievances and appeals, especially once the care continuity protections during the transition to managed care expire.
Performance Measurement and Achieving Outcomes
Quality Metrics and Reporting
There are a significant number of quality measures contained in the financial alignment demonstration. These eighty-two metrics relate to access and quality of services (including behavioral health and LTSS), care coordination/transitions, health and well-being, beneficiary experience, screening and prevention, and quality of life. The vast majority of quality metrics in the contract are core measures required by CMS, while the rest are state-specific. They include reporting of all National Committee for Quality Assurance/Healthcare Effectiveness Data and Information Set (NCQA/HEDIS), Health Outcomes Survey (HOS), and Consumer Assessment of Healthcare Providers and Systems (CAHPS) measures and all existing Part D metrics. The state-specific measures relate to nursing facility residents, nursing facility diversion, long-term care rebalancing and long-term care transitioning. Some of the measures are specified quality withhold measures, as discussed in a previous section. There are other non-quality withhold measures related to LTSS and they include: 1) Percent of all long-stay NF residents whose late-loss ADL needs increase compared to prior assessment (bed mobility, transferring, eating, toileting); 2) Number of beneficiaries discharged from NF to community who do not return to NF during current year as proportion of number of beneficiaries in NF in previous year; and 3) Number of beneficiaries in NF during current or previous year who were discharged to community for at least 9 months during current year as a proportion of number of beneficiaries in NF during current or previous year (100+ days) . CMS and Ohio will continue to work jointly to refine and update these quality measures in years 2 and 3 of the demonstration.
State officials reported focusing on process issues (getting people enrolled, completing assessments, paying providers, etc.) during the first six months of the demonstration and expect to be “working heavily on the quality metrics in the near future” that are more focused on outcomes. From the plans’ perspective, there was concern about the ability to attain quality outcomes with beneficiaries churning on and off a plan on a monthly basis. Another concern related to the low Medicare opt-in rate for the financial alignment demonstration leading up to passive Medicare enrollment. Both these concerns potentially hinder plans’ ability to maximize comprehensive care coordination and meet quality targets. Stakeholders acknowledged the comprehensive quality metrics included in the demonstration but expressed concern that evaluations will be directed toward HEDIS measures rather than consumer satisfaction and the ability to keep people at home and not in nursing facilities.
Outcomes and Evaluation
The fundamental objectives of the financial alignment demonstration are to deliver person-centered, higher quality care, to promote independence in the community, to better coordinate care, and to eliminate cost shifting between Medicare and Medicaid. The results of these efforts have the potential to translate into better health outcomes for beneficiaries and savings across both programs. At the same time, the demonstration needs to be monitored to avoid any adverse effects on beneficiaries. Evaluation is an essential part of the demonstration. CMS contracted with an independent evaluator, RTI, to assess the impact of the Ohio’s financial alignment demonstration. RTI’s evaluation of Ohio’s demonstration will focus on: health outcomes, access to care, enrollment, quality of care, beneficiary satisfaction and experience, overall costs/savings for Ohio Medicaid and Medicare, long-term care rebalancing and diversion effectiveness, marketing and appeals and grievances. In the three-way contract, the state and the health plans agreed to submit all necessary data to RTI for its report. There are over a hundred different performance measures, both quantitative and qualitative, that will be used. Qualitative measures will be compiled through site visits, focus groups, interviews/surveys and analysis of program data. Quantitative measures will include changes in utilization, costs/savings, and readmission rates among others. The data will be pulled together for an Ohio-specific annual report, which will eventually lead to a final evaluation report at the end of Ohio’s financial alignment demonstration.
“Care coordination is fundamental. Unless you make a meaningful connection between case managers and individuals, you won’t meet the outcomes of the demonstration. The scale of the demonstration has great potential but also one of the biggest obstacles given the diversity of this population. One approach will not work for the whole population.” – Provider
Stakeholders agreed much of the core pieces of Ohio’s financial alignment demonstration – comprehensive care coordination and access to a care manager – were delayed due to various process complexities involved in early implementation. That, plus a 6-8 month delay in passive Medicare enrollment meant large numbers of dual eligible beneficiaries were only enrolled in Medicaid managed care and therefore not receiving fully integrated care coordination during the first six months of the demonstration. Thus, an evaluation of outcomes is likely incomplete until beneficiaries have had experience in the fully integrated model. Until a comprehensive evaluation is possible, consumer advocates and beneficiaries will have to rely on qualitative data, such as beneficiary focus groups to gain early insights into the demonstration. In October and November 2014, OCVIC conducted a series of focus groups with MyCare beneficiaries, via conference call, to share and describe their experiences with MyCare.25 Beneficiaries expressed concerns about lost access to doctors/specialists, confusion about access to services outside their region, transportation problems, delays in authorization for physical therapy and prescriptions, failure to meet expectations that MyCare would make care easier and more streamlined, and independent providers still not getting paid in a timely manner. While beneficiaries pointed out problems, some MyCare beneficiaries also noted improvements with DME requests and were reportedly happy with their care managers and communication. While some of these issues were related to the concurrent implementation of mandatory Medicaid managed care, they also affected the capitated financial alignment demonstration, which encompasses both Medicare and Medicaid services.
Looking Ahead
Stakeholders characterized the first six months of MyCare Ohio as “rocky” and “disruptive” and were eager to move past the initial implementation phases to focus on bringing a fully coordinated system of care to thousands of beneficiaries. If a significant number of people stay enrolled for both Medicare and Medicaid services, then the demonstration will have the opportunity to make an integrated model work for thousands of dual eligible beneficiaries. If large numbers of people opt-out after being passively enrolled for Medicare services, either because they wanted to keep a certain provider who is not participating in MyCare or were wary about joining a new program, then MyCare Ohio will be considered largely a vehicle to expand Medicaid managed care to seniors and certain people with disabilities.
Although it is too early to tell if MyCare Ohio is making timely progress on its key objectives, stakeholders identified some early MyCare Ohio successes as well as challenges going forward. Strengths of MyCare Ohio included consumer protections built into the demonstration (i.e., transition requirements to ensure continuity of services), waiver service coordination with the AAAs for people over age 60, a fully integrated service package, and engagement with the implementation and enrollment workgroups. Challenges and opportunities going forward will be engaging with providers (including independent providers), ensuring IT systems support demonstration activities, safeguarding provider network adequacy once the continuity of care transition periods end, overcoming DME service authorization denials, continuing to educate beneficiaries on their rights and benefits, developing consumer directed models of service within a managed care delivery system, and working toward quality outcomes, including assessing the demonstration’s impact on LTSS rebalancing. Other areas that warrant further evaluation include determining the amount and sources of savings/long-term financial viability of the model, the effect of the financial provisions to incentivize HCBS, the effectiveness of waiver service coordination for people under age 60 (since the AAAs are not required to serve this population), ADA accessibility, and the ability of beneficiaries to navigate the appeals process. While some implementation challenges stemmed from the concurrent implementation of mandatory Medicaid managed care, they also affected the capitated financial alignment demonstration.
Ohio was one of the first states to launch a financial alignment demonstration that aimed to improve care and control costs for dual eligible beneficiaries. Although unanticipated issues and concerns arose during the first six months of the transition to managed care, all of those involved are working toward a shared goal of a person-centered system of care. Stakeholders were eager to move past the enrollment and assessment phases of the demonstration in order to focus on bringing a fully coordinated system of care to thousands of dually eligible beneficiaries. Continued collaboration among agencies (Ohio Department of Medicaid and the Department of Aging), ombudsman, providers associations, hospital associations, managed care plans, beneficiary advocates and other stakeholders will be critical as the demonstration attempts to improve the way health, behavioral, and LTSS are delivered in Ohio.
This issue brief was prepared by Molly O’Malley Watts of Watts Health Policy Consulting, LLC.
Endnotes
Washington received approval for both capitated and managed FFS models but subsequently withdrew its capitated model. ↩︎
Prior to the launch of MyCare Ohio, an estimated 115,000 individuals were eligible for the demonstration. Conversations with state officials in February 2015 reported that the total number of MyCare eligible individuals is closer to 96,000. Some of the differences between these estimates can be attributed to individuals being identified as having third-party health insurance, a factor that excludes them from participating it the demonstration. ↩︎
Savings percentages and quality withhold percentages will be applied based on demonstration years as follows: demonstration year one: May 1, 2014 – December 31, 2015; demonstration year two: January 1, 2016 – December 31, 2016; and demonstration year three: January 1, 2017 – December 31, 2017. ↩︎
Each MyCare Ohio plan uses a combination of predictive modeling software; health risk assessment tools; functional assessments; referrals from individuals, family members and providers; and administrative claims data to determine risk level. Additional information used to determine risk level includes medical, behavioral health (i.e. mental health and substance use), long-term services and supports, and social needs. All plans are currently using five stratification levels: intensive, high, medium, low and monitoring. For more information on risk stratification see: Center for Health Care Strategies, “Risk Stratification to Inform Care Management for Medicare-Medicaid Enrollees: State Strategies,” November 2014, available at: http://www.thescanfoundation.org/sites/thescanfoundation.org/files/inside_risk_stratification_10_30_14_final.pdf. ↩︎
During the transition period, a change from a beneficiary’s existing services or provider can occur in any of the following circumstances: 1) beneficiary requests a change, 2) significant change in beneficiary’s status, 3) provider chooses to discontinue services to a beneficiary, and 4) provider performance issues are identified that affect a beneficiary’s health and welfare. ↩︎
Laura Summer and Jack Hoadley (in press), “Early Insights from Commonwealth Coordinated Care: Virginia’s Demonstration to Integrate Care and Align Financing for Dual Eligible Beneficiaries,” Georgetown University Health Policy Institute for the Kaiser Commission on Medicaid and the Uninsured, April 2015. Colleen Barry et al, “Early Insights from OneCare: Massachusetts’ Demonstration to Integrate Care and Align Financing For Dual Eligible Beneficiaries, Kaiser Commission on Medicaid and the Uninsured, April 2015, available at https://modern.kff.org/medicaid/issue-brief/early-insights-from-one-care-massachusetts-demonstration-to-integrate-care-and-align-financing-for-dual-eligible-beneficiaries. ↩︎
Ohio is one of thirteen states (plus DC) that currently provide state level authority and/or resources to support the expansion of the ombudsman program to serve individuals living in non-facility settings. See: 80 Fed. Reg. 7706 (February 11, 2015), available at: http://www.gpo.gov/fdsys/pkg/FR-2015-02-11/pdf/2015-01914.pdf. ↩︎
More than one third of the nation’s 15,500 nursing homes, accounting for 39 percent of all nursing home residents, received relatively low ratings of 1 or 2 stars under the federal government’s recently revamped Five-star Quality Rating System, according to a new analysis by the Kaiser Family Foundation.
The rating system, overseen by the Centers for Medicare and Medicaid Services, assigns ratings of 1 to 5 stars to all Medicare- and Medicaid-certified nursing homes based on deficiencies that may be reported during health inspections, and measures relating to staffing and quality. The ratings, part of CMS’s Nursing Home Compare tool, aim to give consumers better information to compare and choose among nursing homes in their area, which is especially important given concerns about reported problems arising from inadequate staffing, fire safety hazards and substandard care — serious issues in light of the vulnerability of the nursing home population.
The Kaiser study, based on an analysis of star ratings in the Nursing Home Compare database, finds higher overall ratings among non-profit homes, with one-third of non-profit homes earning 5 stars compared to 18 percent of for-profit homes. It also finds generally higher ratings for smaller nursing homes (with fewer beds) than larger ones. Thirty-nine percent of homes with fewer than 60 beds got a 5-star rating compared 14 percent of homes with more than 120 beds.
The report documents considerable variation in nursing home ratings across the states. In 22 states and the District of Columbia, for example, at least half of nursing homes received relatively high ratings of 4 or 5 stars. Conversely, in 11 states more than 40 percent of nursing homes got relatively low ratings of 1 or 2 stars. The states with the greatest share of low-rated nursing homes include Texas, where 51 percent of all nursing homes received a 1 or 2 star rating, followed by Louisiana (49%) and Georgia, Oklahoma and West Virginia (46% each). In 9 states, at least one in five nursing homes received only 1 star, the lowest possible rating.
At the county level, two-thirds of all counties in the U.S. have at least one nursing home with a 4- or 5- star rating, while the remaining one-third of counties have only nursing homes rated with fewer stars (27%) or no Medicare or Medicaid-certified nursing homes at all (7%). The presence of a highly-rated home in a county doesn’t necessarily imply that area patients will live in one, since bed availability is a factor and people may place a high priority on being close to family.
Filling the need for trusted information on national health issues, the Kaiser Family Foundation is a nonprofit organization based in Menlo Park, California.