2015 Survey of Health Insurance Marketplace Assister Programs and Brokers

Authors: Karen Pollitz, Jennifer Tolbert, and Rosa Ma
Published: Aug 6, 2015

Executive Summary

Executive Summary

Now in second year, a new infrastructure of consumer assistance in health insurance continues to develop. The Affordable Care Act (ACA) provided for new publicly funded consumer assistance entities to help people on an ongoing basis as they apply for health coverage and subsidies and resolve questions and problems with their insurance once covered. Nearly all Marketplace Assistance Programs established for the first year returned this year to continue helping consumers. These assistance professionals have unique insights into how ACA implementation is progressing, what is changing and what challenges remain. How Assister Programs develop in their own right will also likely impact whether consumers can continue to get the help they need.

This report is based on findings from the 2015 Kaiser Family Foundation survey of Health Insurance Marketplace Assister Programs and Brokers. The online survey was conducted from March 31 to May 3, 2015 as the second Open Enrollment period concluded. As was the case last year, Federal and state-operated Marketplaces provided contact information for directors of their Assister Programs, all of whom were invited to participate. Two years of data enable comparison of Assister Programs capacity and experiences from one year to next. This year’s survey also included brokers for the first time. Brokers have traditionally helped consumers enroll in private health insurance coverage. In 2014, many brokers registered to sell coverage through the Marketplace, and nearly all of them returned this year, as well. Returning brokers also offered some observations about how this year compared to the first year, and how it compared to their experience selling non-group coverage prior to ACA.

Ninety-one percent of Assister Programs and 86% of brokers this year had also helped Marketplace consumers last year, and most (82% of Assister Programs and 79% of brokers) who returned said the second open enrollment period went better than the first.  In particular, Marketplace websites worked better this year. In 2014, 65% of Assister Programs said most or nearly all consumers sought help, in part, because of technical difficulties with the Marketplace website. This year, 38% of Programs said this was the case. In 2015, more Assister Programs reported they could complete the enrollment process with consumers and see their plan choice (71% vs. 61%)  Returning Assister Programs had also gained a year of experience. By comparison, when the first Open Enrollment period began, only 16% of Assister Programs had previously helped consumers enroll in private health insurance.

More than 4,600 Assister Programs served Marketplace consumers in the second year of health reform, collectively employing 30,400 full time equivalent staff and volunteers. The overall number of Assister Programs and staff increased slightly in the second year. Similar to last year, 15% of Assister Programs were Navigators, funded directly by the Marketplace, while Assister Programs in Federally Qualified Health Centers (FQHCs), supported by grants from the Health Resources Services Administration (HRSA), comprised another 25% of total Programs. Certified Application Counselor (CAC) Programs, which are mostly supported by their sponsoring non-profit organizations or foundations and do not typically receive direct government support for assistance activities, comprised 60% of total Programs, and more than 50% of FTE staff. In terms of consumers helped, Navigators and FQHCs provided assistance to the majority of consumers reached during the second open enrollment period. Together, Navigators and FQHCs served 70% of all consumers who received help this year (30% and 40%, respectively), while CACs provided assistance to only 30% of consumers helped.

Assister Programs helped an estimated 5.9 million consumers this year. Returning Programs helped 5.8 million of those, or about 19% fewer than last year. This decline was driven by a large drop in the number of people helped by returning CACs. Collectively, returning Navigator and FQHC Assister Programs this year helped about the same number of consumers they reported helping last year (4 million vs. 4.1 million), while returning CAC Programs helped 1.8 million individuals, 60% of the number they helped last year. These differences suggest that Assister Programs supported by outside grant funding may be in a better position than voluntary Programs to help more consumers and to sustain their capacity over time.

The need for in-person consumer assistance remains substantial. Website improvements notwithstanding, millions of consumers continue to need personalized help to apply for health coverage and subsidies. Seventy-nine percent of Assister Programs this year (and 80% last year) said most or nearly all consumers sought help because they lacked confidence to apply on their own; 82% of Programs this year (83% last year) said most or nearly all consumers needed help understanding their plan choices; 74% of Assister Programs (this year and last year) said most or nearly all consumers needed help understanding basic insurance terms, such as “deductible.” In addition, this year, like last year, most Assister Programs said it took one to two hours, on average, to help each consumer who was new to the Marketplace. Programs said it took somewhat less time, about an hour on average, to help consumers who were returning to renew Marketplace coverage and subsidies.

Consumer demand for help exceeded what some Programs could provide this year, though not by as much as last year. About one-in-five Assister Programs reported having to turn away at least some consumers this year. For the Open Enrollment period overall, 19% of Programs said they could not help all who sought assistance; during the final two weeks, 22% said they had to turn at least some consumers away. This contrasts with the first year, when 37% of Programs were stretched beyond capacity during Open Enrollment overall, and nearly half had to turn away at least some consumers during the final two weeks. It appears the availability of Marketplace consumer assistance is aligning with demand; however, additional capacity may still be needed.

In between Open Enrollment periods, returning Assister Programs helped an estimated 630,000 consumers apply for coverage through special enrollment periods, 290,000 consumers report mid-year changes to the Marketplace, and nearly 800,000 consumers resolve post-enrollment problems. The need for consumer assistance is year-round. Changes in work or family status or income during the year mean some people must enroll in coverage outside of Open Enrollment or apply for new or revised subsidies mid-year. Marketplace Assister Programs are tasked with helping consumers at these times as well. In addition, consumers need help once enrolled, including with questions about how to use their new health insurance, or what to do if their provider is not in network, or if a claim is denied. Under the ACA, state ombudsman or Consumer Assistance Programs (CAPs) were established to provide post-enrollment assistance, though CAP funding has not been appropriated since 2010. Most Assister Programs, therefore, try to help Marketplace consumers with their post-enrollment problems, and 69% said they could successfully resolve problems most of the time.

Assister Programs report further improvements are still needed in Marketplace websites and Call Centers, and other technical assistance could be strengthened. Most Marketplace online eligibility systems, especially in FFM states, are not yet integrated with Medicaid, so the single, streamlined application for financial assistance envisioned under the ACA is not yet a reality. As a result, when Marketplaces determine a consumer is likely eligible for Medicaid or CHIP, a new separate application is often required. Sixty-nine percent of Assister Programs will help consumers complete a separate Medicaid application. Most say this can be accomplished during the initial visit, but 45% of Programs say a one or more additional visits are needed, on average, to complete the Medicaid or CHIP application and enrollment process.

Assister Programs also cite the need for better information on health plan choices. Thirty-one percent of Programs this year said it was often or almost always the case that consumers had QHP questions that weren’t answered by information on the Marketplace website. (Last year, 41% of Programs said this was the case.)

Programs also reported that technical assistance from the Marketplace Call Centers can be uneven. Half of Programs who said they reached out to Call Centers for help with translation services said help was effective most or all of the time. Among those who sought technical assistance with immigration questions, tax-related questions, or questions about QHP choices, less than half (41%, 45%, and 39%, respectively) said that Call Center technical assistance was effective most or all of the time.

Coordination among Assister Programs remains an important, but elusive goal. Ninety percent of Assister Programs said coordination with other Programs is somewhat or very important to their effective operation, but just over half of respondents said they seldom if ever coordinate with other Assister Programs. When coordination did take place this year, similar to last year, most often it was initiated by Assisters themselves or by an outside third party, not by the Marketplace.

Funding uncertainty concerns many Assister Programs. Twenty-seven percent of Assister Programs said they are very certain that funding will be available to support them next year, while 39% are not certain at all. Overall, Marketplaces provided fewer funding resources for Assister Programs in the second year. The federally run Marketplace cut funding available for Assister Programs in FFM and FPM states by about 10% this year from $67 million in FY 2014 to $60 million in FY 2015. Many State-based Marketplaces also reduced their Navigator funding from first year levels; in all state-Marketplace funding for Navigators fell by about 15 percent. The Centers for Medicare and Medicaid Services (CMS) has announced $67 million will be available for Navigators in FFM/FPM states in year three – the same amount awarded in year one and a 12% increase over year two funding levels. CMS has also indicated there will be additional, as yet unspecified, funding for Federal Enrollment Assistance Programs (FEAPs), which supplement the work of Navigators in some FFM states, in year three. Many state-based Marketplaces have yet to decide the level of consumer assistance resources they will fund in year three.

Health insurance brokers continue to help many consumers apply for coverage, mostly through Marketplaces. Before the ACA, private health insurance brokers traditionally offered help to consumers seeking non-group coverage, and they continue to play an important role today. Brokers are paid commissions by insurance companies for each policy they sell. Many are certified to sell non-group coverage through the Marketplace, and this year, the survey included Marketplace-certified brokers (referred to simply as “brokers” in this report.) The vast majority of brokers who sold non-group coverage this year had done so during the first Open Enrollment period and prior to 2014, as well. Most (79%) sold non-group coverage both inside and outside of the Marketplace, though on average, brokers helped almost twice as many consumers apply for coverage through the Marketplace compared to outside.

Non-group sales have increased for most brokers since Marketplaces opened in 2014. Sixty percent of brokers say they are selling more non-group coverage today than they did prior to 2014. Most reported it takes more time to sell a policy and the revenue they earn per-policy is less; but 40% earn more income overall from non-group commissions than they did prior to implementation of the Marketplaces and another 20% said their overall non-group commission income is about the same.

Brokers and Assister Programs engage in similar consumer assistance activities, with some differences. Both brokers and Assisters help consumers complete Marketplace applications, compare plan choices, and answer tax-related questions. Both also help consumers with post-enrollment problems. However, compared to Assister Programs, brokers less often engage in public outreach and education activities. Brokers also provide less help to consumers applying for Medicaid and more help to small businesses seeking small-group coverage.

Brokers and Assister Programs appear to serve somewhat different populations. Brokers were less likely than Assister Programs to serve Latinos, consumers who needed language translation help, consumers who lacked Internet service at home, or consumers with incomes low enough to be eligible for Medicaid. Brokers were also less likely than Assister Programs to say that most of their clients were uninsured at the time they sought help. However, returning brokers reported a higher degree of client continuity from year one compared to Assister Programs, indicating they may be establishing more ongoing relationships with their clients than Assister Programs have been able to do so far.

About the Assister Programs and Brokers Described in this Report

Several types of Assister Programs provide outreach and enrollment assistance in the Marketplace.

Navigator refers to Assister Programs that contract directly with State Marketplaces or with federally facilitated Marketplace to provide free outreach and enrollment assistance to consumers. The ACA requires all Marketplaces to establish Navigator Programs and to finance Navigators using Marketplace operating revenue. For the first Open Enrollment, before Marketplaces had received any operating revenue, SBMs were permitted to use federal exchange grant funding to establish similar Programs, called In Person Assisters (IPAs). Now that those state grants have ended, this year’s report does not distinguish between IPAs and Navigators; instead, all Assister Programs funded directly by Marketplaces are referred to as Navigators. CMS provided $60 million for Navigators to work in 34 FFM and FPM Marketplaces in the second year, compared to $67 million in year one.1   SBM states and consumer assistance FPM states provided over $100 million in funding for their IPA and Navigator Programs in year one.2  However, with the termination of federal grant funding to support consumer assistance, overall state spending on these Programs dropped about 15 percent in year two. 3 

Certified Application Counselor (CAC) refers to Assister Programs that are recognized by a Marketplace but do not receive funding from a Marketplace. This designation was created prior to the first Open Enrollment – when funding for Marketplace-paid assisters, at least in the FFM, was still uncertain – to ensure that willing volunteer Programs would also be available to help. CACs must be sponsored by an organization that will attest to the Marketplace that all of its individual Assisters meet minimum requirements. CACs also must provide help to consumers free of charge. Under federal rules, CACs are not required to engage in all activities required of Navigators, and they are not required to undergo training as extensive as that required for Navigators. All Marketplaces are required to recognize and certify CAC Programs, and states have flexibility to establish additional rules for CAC Programs. Although not funded by the Marketplace, many CAC Programs received funding from other outside sources.

Federally Qualified Health Center (FQHC) Programs are operated by health centers funded by the Health Resources and Services Administration (HRSA). FQHCs treat patients regardless of ability to pay and, prior to enactment of the ACA, actively helped patients apply for Medicaid, CHIP, or other available coverage. For the first year of ACA implementation, HRSA awarded $208 million to FQHCs to support enrollment assistance. In the second year, HRSA made permanent enrollment assistance grants to FQHCs totaling about $150 million per year. All FQHC Assisters are required to complete at least the level of training required of CACs. About 6% of FQHCs also serve as Navigators and so received Marketplace funding in addition to HRSA grants. For purposes of this report, FQHCs that also receive Marketplace funding are referred to as Navigators.

Federal Enrollment Assistance Program (FEAP) refers to Assister Programs that contracted with CMS to provide supplemental enrollment help within FFM and FPM states in selected communities where large numbers of uninsured individuals reside. Duties and requirements of FEAPs are similar to those of federal Navigators except that FEAPs provide “surge” assistance. Most have rolled back staff and operations since Open Enrollment ended. In this report, unless otherwise indicated, description of findings about Navigators will include FEAPs because the two types are so similar. For the 2015 coverage year, CMS awarded contracts totaling about $29 million to two organizations to establish FEAPs in 10 states. 4 FEAP contracts were initiated for the 2014 plan year with an option for CMS to elect a second year of work. CMS will continue to contract with FEAPs in year three, though the contract amount and work sites have not yet been determined.

Finally, in addition to Marketplace Assister Programs, the ACA authorized creation of state-based ombudsman programs, also called Consumer Assistance Programs, or CAPs. The law requires CAPs to provide outreach and public education and provide enrollment assistance to consumers in the Marketplace. In addition, CAPs must help all state residents resolve questions and disputes with their private health insurance coverage, including helping consumers to appeal denied claims. The ACA requires Marketplace Assisters to refer consumers with post-enrollment problems to state CAPs. The law provided initial funding for states to establish CAPs and 35 were established in 2010. However no new appropriations have been enacted since and most CAPs have not received any new federal funding since 2012.5  Pending additional federal funding, many CAPs remain operational, albeit at reduced levels.

Broker refers to a state-licensed professional who sells private health insurance to individuals and/or businesses. Brokers are sometimes called agents or producers. To sell non-group or small group health plans offered through a state Marketplace, brokers must register with the Marketplace annually, sign a participation agreement, and complete required training. Brokers who sell non-group policies through the Marketplace help consumers complete an application for financial assistance and explain coverage options. Brokers are paid a commission by the health insurance company offering the policy that the consumer selects. Typically insurers pay commissions when a policy is first issued and at renewal for at least several years. Brokers also offer ongoing services to consumers once they’re covered, including help with post-enrollment questions and help buying other insurance products or financial services.

Report: Section 1: Characteristics Of Assister Programs

In all, more than 4,600 Marketplace Assister Programs were established to help consumers during the second Open Enrollment. This total is based on Program data provided by all state and federal Marketplaces, and represents a 3% increase in the number of Programs established during the first Open Enrollment.

Once again, most Assister Programs that help people enroll in the Marketplace are not funded by Marketplaces. Navigators, which are funded directly by the Marketplace, comprise about 14% of total Programs. Assister Programs in FQHCs, primarily supported by HRSA grants, comprised another 25% and CAC Programs were 61%. Mostly CACs are voluntary Programs, supported by their sponsoring non-profit organizations, foundations, and other sources. Marketplaces are required to recognize and certify qualified CACs, but are not required to provide them financial support.  (Figure 1) This distribution of Assister Program types is somewhat different from that during the first Open Enrollment period, and includes a larger proportion of CACs, largely because of a reclassification of Assister Program types in California.6 

Figure 1: Types of Assister Programs, 2015

Most Assister Programs this year also helped consumers during the first Open Enrollment. Over 90% of Programs indicated they operated during the first year. As a result, these Programs were more experienced. Prior to the first Open Enrollment, just two-thirds of Programs had experience helping consumers enroll in Medicaid and CHIP and only 16% of Programs had previously helped consumers enroll in private health insurance.

Most Assister Programs served specific geographic or population-based communities. Fourteen percent of all Programs operated in a statewide service area, the same proportion as in year one. However, the number of Navigator Programs operating statewide increased to 26% in year two (compared to 17% in year one). This could be attributable to funding requirements that encourage statewide coverage.

Assister Programs varied in size and in the number of consumers they helped. Most Programs have a small staff; 68% have five or fewer full-time-equivalent (FTE) staff, either paid or volunteer, while only 6% of Programs have more than 20 FTE staff. CACs were more likely to have small staff, with 71% of such Programs reporting five or fewer FTE staff, compared to 56% of Navigators. CACs were also more likely to rely primarily on volunteers (19% vs. 4% for other Program types.) These results are similar to year one.

Navigator and FQHC Assister Programs were more likely to report helping large numbers of consumers. This year 40% of Navigators and FQHCs said they helped more than 1,000 people during Open Enrollment. By contrast, 13% of CACs helped more than 1,000 people. This is similar to the distribution in year one. (Table 1)

Table 1: Assister Programs by Size, Service Area, and Numbers of People Helped
Program Characteristics All Assister ProgramsProgram Type
Navigator and FEAPFQHCCAC
Worked during first Open Enrollment91%95%96%87%*^
Statewide vs. specific geographic service area
     Statewide14%27%10%*13%*
     Specific area within state80%68%87%*80%*^
     Other6%5%3%7%^
Paid staff vs. volunteer
     Most/all volunteers13%5%3%19%*^
     Most/all paid staff87%95%97%81%*^
Number of full-time-equivalent staff and volunteers
     5 or fewer68%55%67%*71%*
     6-1017%19%22%14%^
     11-207%11%6%6%*
     21-505%9%3%*5%
     More than 501%4%1%1%
     Don’t know/No answer2%1%1%3%
Mean FTE staff size6.812.26.15.8
Number of consumers helped during Open Enrollment
     100 or fewer32%14%9%45%*^
     101-50031%28%33%30%
     501-1,00013%17%18%10%*^
     1,001-2,50013%22%22%8%*^
     2,501-5,0005%8%10%2%*^
     More than 5,0005%10%8%3%*^
     Don’t know/No answer1%1%2%
Mean number of people helped per Program1,2742,7271,929652
Portion of Consumers helped who were new to Marketplace vs. renewing
Most/nearly all renewing or changing21%18%23%21%
About half new/half renewing or changing22%26%27%20%
Most/nearly all new to Marketplace53%52%46%56%
*Significantly different from Navigator and FEAP at the 95% confidence level; ^Significantly different from FQHC at the 95% confidence levelNOTE: Numbers may not sum to 100% due to rounding.

Assister Program budgets this year were mostly modest. Twenty-nine percent of all Programs reported having an annual budget for consumer assistance of $50,000 or less. Slightly more (31%) had annual budgets between $50,000 and $500,000. Only 4% of Programs reported annual budgets larger than $500,000. CACs tended to have the smallest budgets compared to other types of Assister Programs. (Table 2)

Navigators were more likely to receive most of their funding from the Marketplace, while FQHCs relied more heavily on grants from HRSA. CACs were most likely to rely on re-programmed resources from their sponsoring organization or from other sources of private sector support.

Table 2: Assister Program Budgets and Sources of Funding, FY 2014
   All Assister Programsby Program Type
Navigator and FEAPFQHCCAC
FY 2015 Program budget 
Up to $50,00029%21%13%*38%*^
$50,001 – $200,00021%28%36%13%*^
$200,001 – $500,00010%21%12%*7%*
$500,001 – $1,000,0002%10%1%*1%*
More than $1,000,0002%4%1%2%
Don’t know/No answer35%17%37%39%
Programs receiving most (>50%) of budget from this funding source
Grants or other direct payment from Marketplace13%42%3%*9%*^
Grants from HRSA, other federal agency21%10%53%*11%^
Grants or payments from other state agencies5%17%1%*3%*^
Grants from private foundations2%2%5%*
Grants from other outside private sources1%2%
Funds re-programmed from sponsoring organization’s own budget16%2%2%25%*^
*Significantly different from Navigator and FEAP estimate at the 95% confidence level; ^Significantly different from FQHC at the 95% confidence levelNOTE: Columns may not sum to 100% because not all Programs received a majority of funding from a single source.

Assister Programs engaged in a range of activities during Open Enrollment. Virtually all Programs provided eligibility and enrollment assistance, helping consumers apply for private health insurance and subsidies or for Medicaid and CHIP. Eighty percent of Programs also provided outreach and education to consumers. Beyond outreach and enrollment support, nearly 80% of Programs assisted consumers with post-enrollment questions and problems. Additionally, almost 6 in 10 helped consumers appeal Marketplace eligibility decisions, and new this year, more than 6 in 10 Programs helped consumers with ACA tax-related questions. (Table 3)

These percentages were similar to those reported last year; however, more Assister Programs this year reported helping consumers apply for exemptions from the individual mandate (61% this year vs. 50% last year).

Table 3: Assistance Activities Conducted by Assister Programs
Activity% Programs
Help individuals apply for Medicaid/Children’s Health Insurance Program90%
Help individuals compare private health insurance plan (QHP) options84%
Help individuals apply for premium tax credits and cost sharing subsidies81%
Outreach and public education to individuals and families80%
Help individuals with post-enrollment questions and problems (e.g., denied claims)79%
Help with ACA tax-related questions62%
Help individuals apply for exemptions from the individual responsibility requirement61%
Help individuals appeal eligibility determinations58%
Help other Assister Program staff resolve questions or problems for their clients58%
Outreach and public education to small businesses27% 

Most Programs returned to help consumers for a second year, and almost half of those experienced changes in their staff size and budget. This year 91% of responding Programs said they had also provided consumer assistance during the first Open Enrollment period. Roughly half said their budget and staff size in year two were about the same as in year one. About one-in five Programs grew while about one-in-four experienced declines in their staff or budget. (Figure 2)
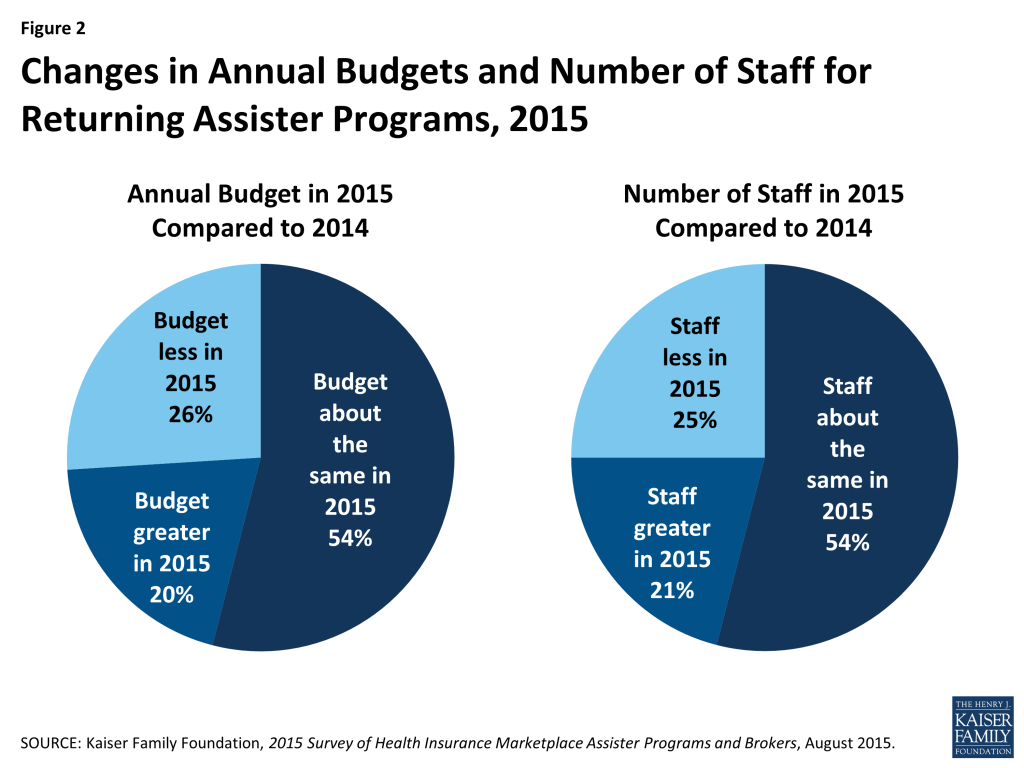
Figure 2: Changes in Annual Budgets and Number of Staff for Returning Assister Programs, 2015

Staff continuity was strong in returning Programs. More than three-quarters of returning Programs said most or almost all of their staff from year one returned to help consumers in year two.

Report: Section 2: How Many Assisters Are There And How Many People Did They Help?

An estimated 30,400 Assisters together helped more than 5.9 million people during the second Open Enrollment period. Based on numbers of staff reported by survey respondents, we estimate all Programs combined employed at least 30,400 full-time equivalent (FTE) staff and volunteers to provide assistance across the country. This is roughly a 7% increase over the number of FTE Assisters in Year 1.In addition, we estimate Assisters together helped more than 5.9 million people apply for coverage and financial assistance during the second Open Enrollment period.7  Two things about this national estimate are noteworthy.

Assister Programs that received Marketplace funding or HRSA funding helped most of the consumers. Navigators and FEAPs, which comprise 15% of all Assister Programs nationwide, helped 31% of all consumers who received assistance this year. FQHCs, which account for 25% of all Assister Programs, assisted 37% of all consumers helped. By contrast, CACs, which make up 61% of all Assister Programs, assisted 31% of consumers helped. While the contribution of volunteer CAC Programs is substantial and not to be taken for granted, it was the formally funded Assister Programs – which had more resources and larger staff – that provided most of the help. (Figure 3)
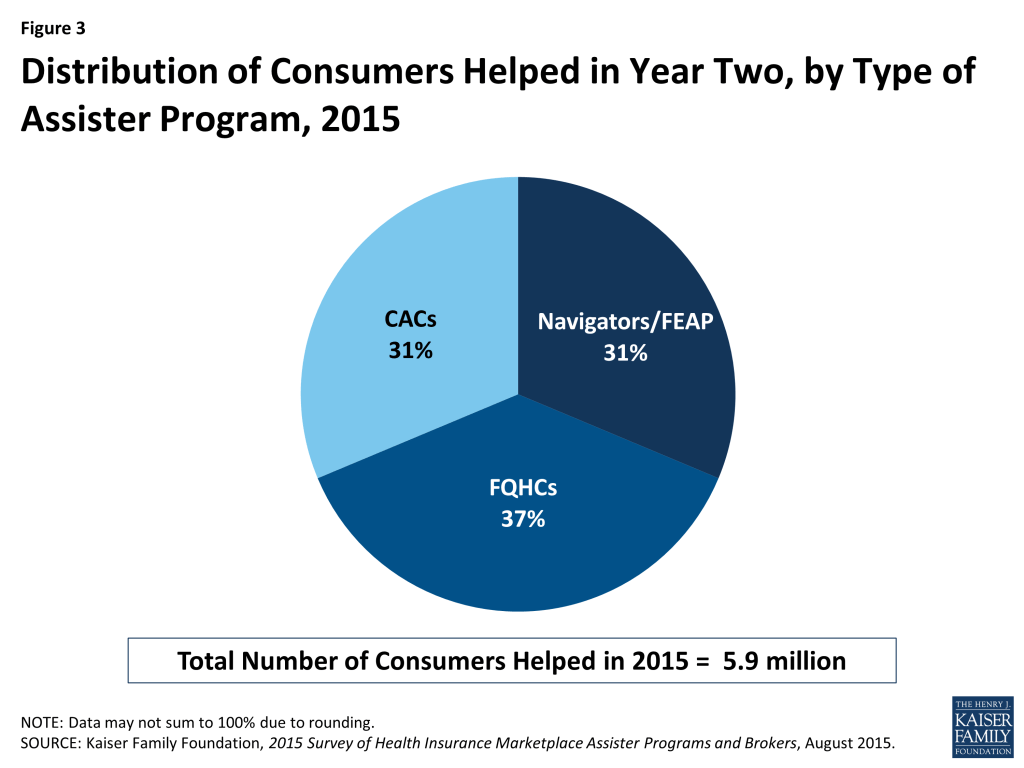
Figure 3: Distribution of Consumers Helped in Year Two, by Type of Assister Program, 2015

Returning Navigator and FQHC Programs helped about the same number of people this year, while the number helped by returning CACs declined sharply. Based on data reported by returning Assister Programs, the estimated number of people helped this year declined by 19% overall compared to last year. Returning Programs report helping 7.1 million in year one vs. 5.8 million this year. However, CAC Programs, as a group, account for most of the decline.   Returning Navigators and FQHCs, together, helped about the same number of people they did last year (4.1 million in year one vs. 4 million in year two), while the number of people helped by returning CACs fell 40 percent. (3 million in year one to 1.8 million in year two). (Figure 4)
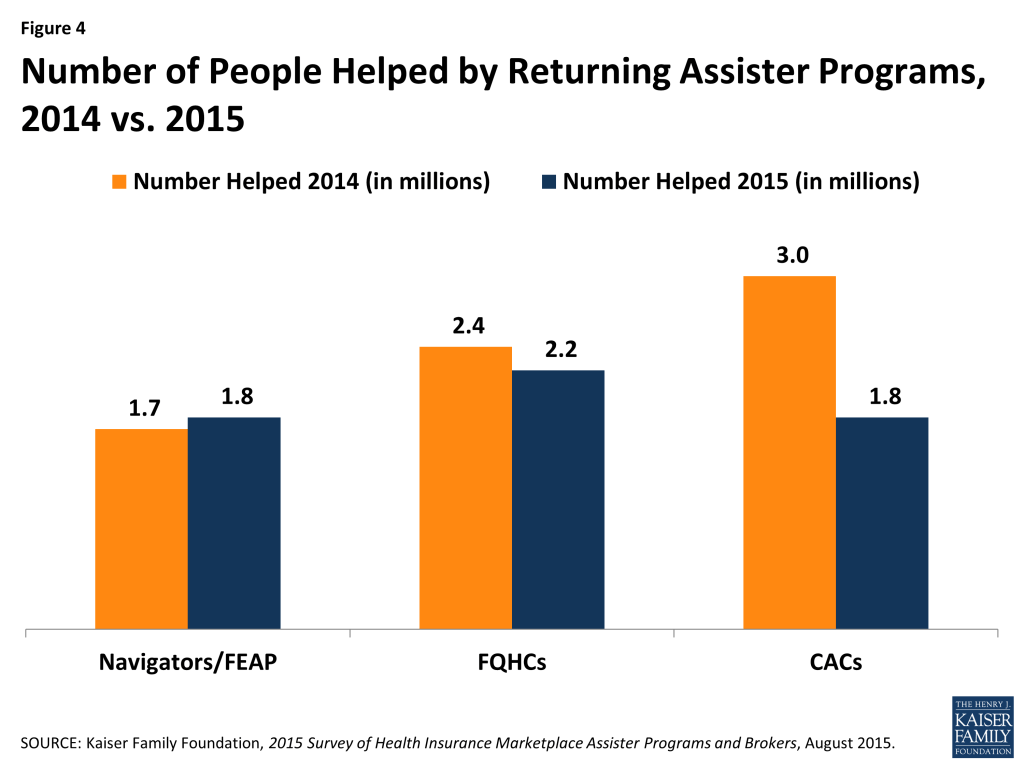
Figure 4: Number of People Helped by Returning Assister Programs, 2014 vs. 2015

Even within Program types, however, there was also variation in the number of people helped in year two vs. year one. For example, 40% of returning Navigator Programs helped more people this year compared to last year, as did 30% of returning CACs. (Figure 5)
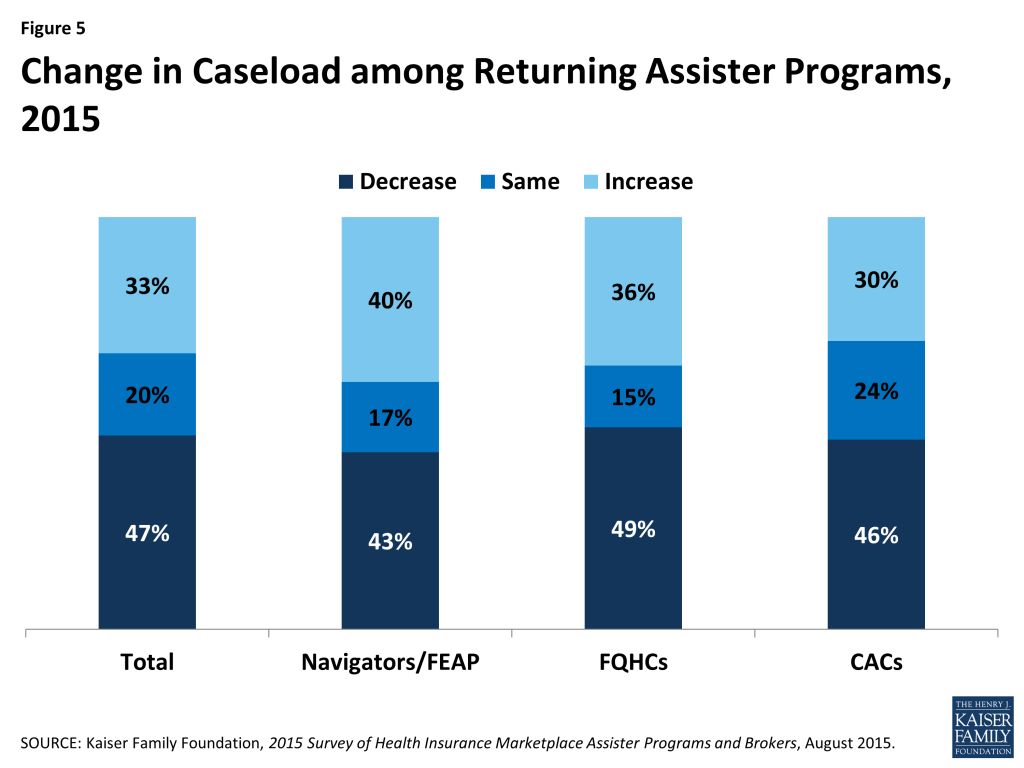
Figure 5: Change in Caseload among Returning Assister Programs, 2015

A number of differences between the first and second Open Enrollment periods could have affected the numbers of consumers helped, such as:

  • The second Open Enrollment period was half as long as the first one (3 months vs. 6 months)
  • Most Marketplace websites worked better in the second year, and website difficulties led many consumers to seek in-person help in year one.
  • About half of all enrollees during the second Open Enrollment period (4.2 million individuals) had first enrolled the year before and fewer of these consumers may have needed help; more than 2 million returning enrollees auto-renewed their health coverage and subsidies for 2015.
  • On the other hand, people who were uninsured as the second Open Enrollment period began may have been harder to reach. First year Marketplace enrollees tended to be the most motivated and capable, while those who remained uninsured were likely less informed about the ACA and/or more burdened by language barriers, transportation problems, and other limitations.

National Estimates and Method ChangesOur national estimate of 5.9 million consumers helped by Assister Programs this year cannot be compared to our estimate of the total number helped during the first Open Enrollment Period due to changes in the way the question was asked. However, returning Assister Programs were asked separately this year to compare the number of people they helped during the first and second Open Enrollment periods. Estimates based on those responses are not impacted by the survey method changes. The responses by returning assisters suggest a 19 percent decline in number of people helped this year, compared to last year.

Consumer Assistance resources continue to be unevenly distributed across Marketplaces. Forty-seven percent of all Assisters nationwide worked in the 16 states and the District of Columbia with a SBM and 53% worked in the 34 states with a FFM or FPM, while 29% of the uninsured in 2014 resided in SBM states and 71% lived in FFM or FPM states. (Figure 6) As a result FFM and FPM states, on average, have fewer than half the number of Assisters per 10,000 uninsured compared to SBM states. A similar distribution was observed during year one. (Figure 7)
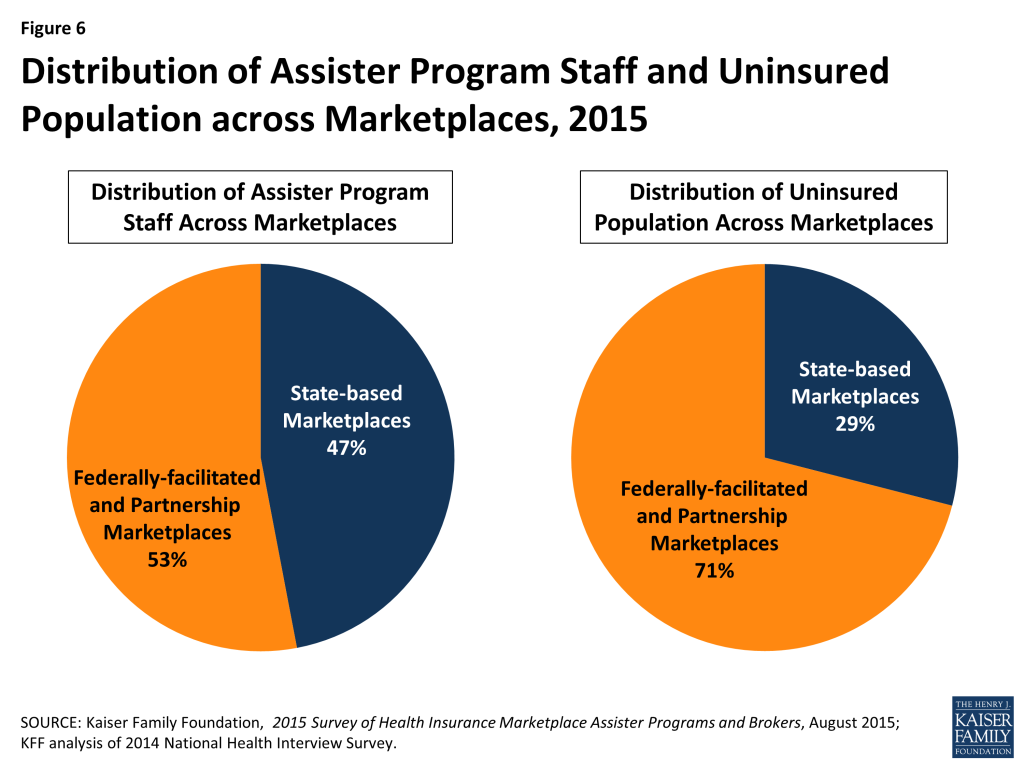
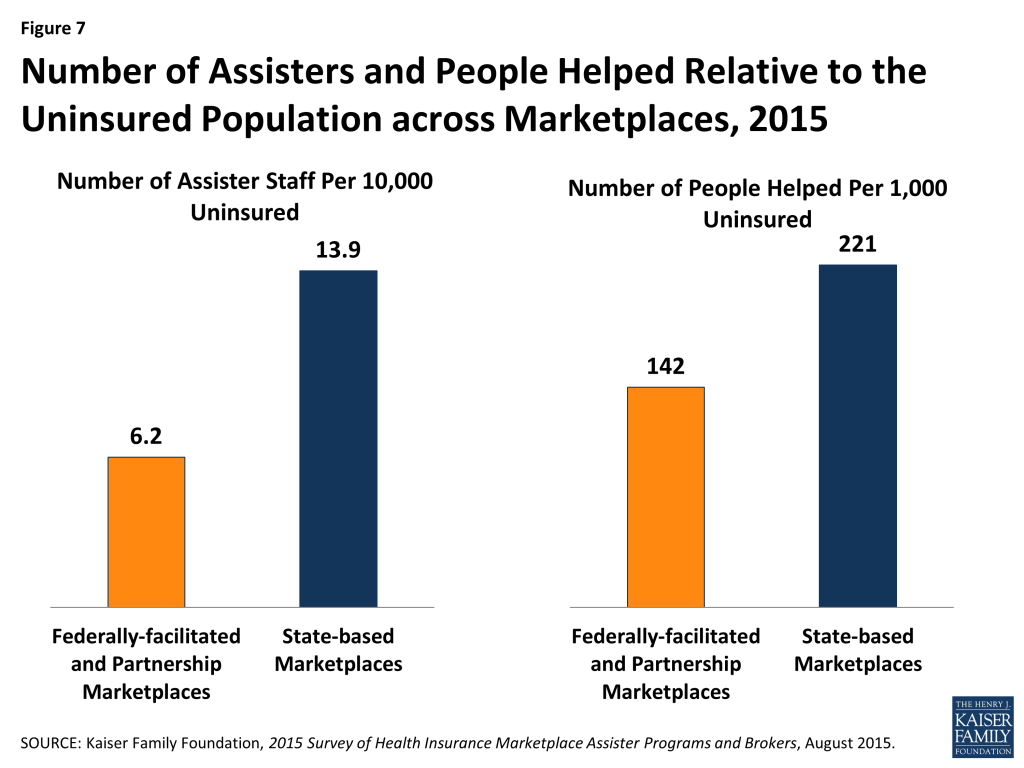
Figure 6: Distribution of Assister Program Staff and Uninsured Population across Marketplaces, 2015
Figure 7: Number of Assisters and People Helped Relative to the Uninsured Population across Marketplaces, 2015

Relative to the number of uninsured, more people were helped in SBM states compared to FFM/FPM states. Of the estimated 5.9 million people helped during the second Open Enrollment period almost 3.7 million, or 62%, lived in FFM/FPM states and almost 2.3 million, or 38%, were in SBM states. Expressed relative to the uninsured population, an estimated 142 people were helped per 1,000 uninsured in FFM/FPM states, and 221 were helped per 1,000 uninsured in SBM states. (Figure 7) This difference is likely driven in part by the disparity in Assister staff across SBM and FFM/FPM states. Another factor may be that a smaller share of FFM states had expanded Medicaid. The Medicaid coverage gap may have discouraged some poor uninsured from seeking help if they thought they would not qualify for coverage.

Report: Section 3: Why Did Consumers Seek Help?

Lack of understanding of the ACA and health insurance motivated many consumers to seek assistance. Like last year, three-quarters of Assister Programs reported consumers sought help because they didn’t understand the ACA, didn’t understand health insurance, or lacked confidence to apply for coverage and financial assistance on their own. Overwhelmingly these were the top three reasons cited by Assister Programs last year and this year.

With millions of consumers returning to the Marketplace in year two to renew or change coverage, Assister Programs were less likely this year than last year to cite Marketplace website glitches as a major factor leading consumers to seek help. But in similar numbers to last year, Programs reported that consumers needed help answering Marketplace questions about their households and income, about their eligibility for Medicaid, and about other tax related questions. Also this year, for the first time, more than 40% of Programs said most consumers they served needed help renewing their coverage or updating their application for financial assistance for year two. (Figure 8)
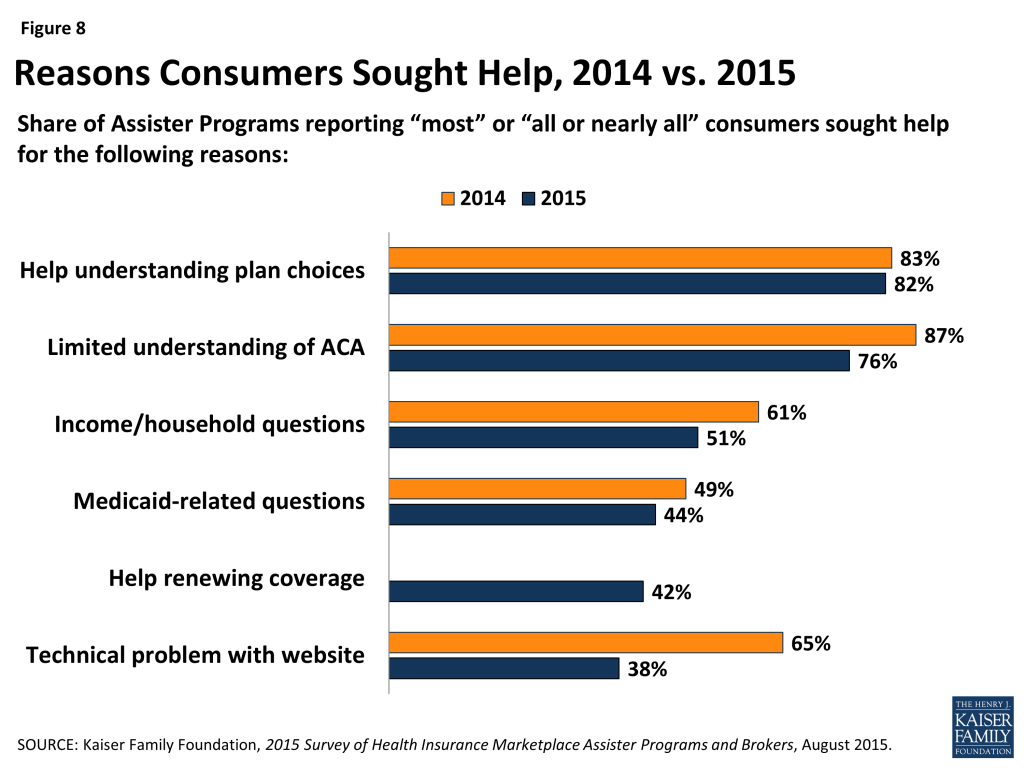
Figure 8: Reasons Consumers Sought Help, 2014 vs. 2015

Most who sought help were uninsured. This year, 83% of Assister Programs reported that most to nearly all of the consumers they helped were uninsured at the time they sought assistance, slightly lower than the 89% of Programs last year reporting most to nearly all of the consumers they helped were uninsured. (Figure 9 and Appendix Table A1) This year for the first time some consumers sought help renewing coverage. Even so, most Assister Programs may remain focused primarily on outreach and assistance to uninsured individuals in year two. This may change in future years as more uninsured people get and keep health coverage.
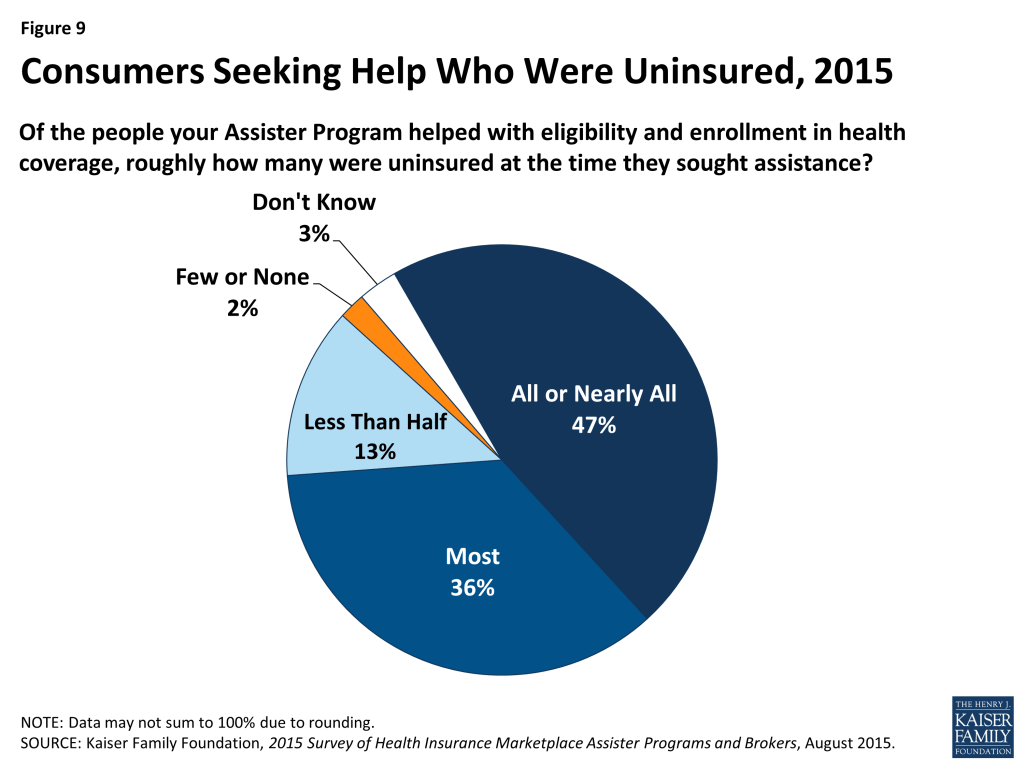
Figure 9: Consumers Seeking Help Who Were Uninsured, 2015

Most who sought help also had limited health insurance literacy. Unchanged from last year, 74% of Assister Programs said most to nearly all of their clients who shopped for or purchased private health plans needed help understanding basic insurance terms and concepts such as “deductible” and “in-network service.” (Figure 10 and Appendix Table A1)
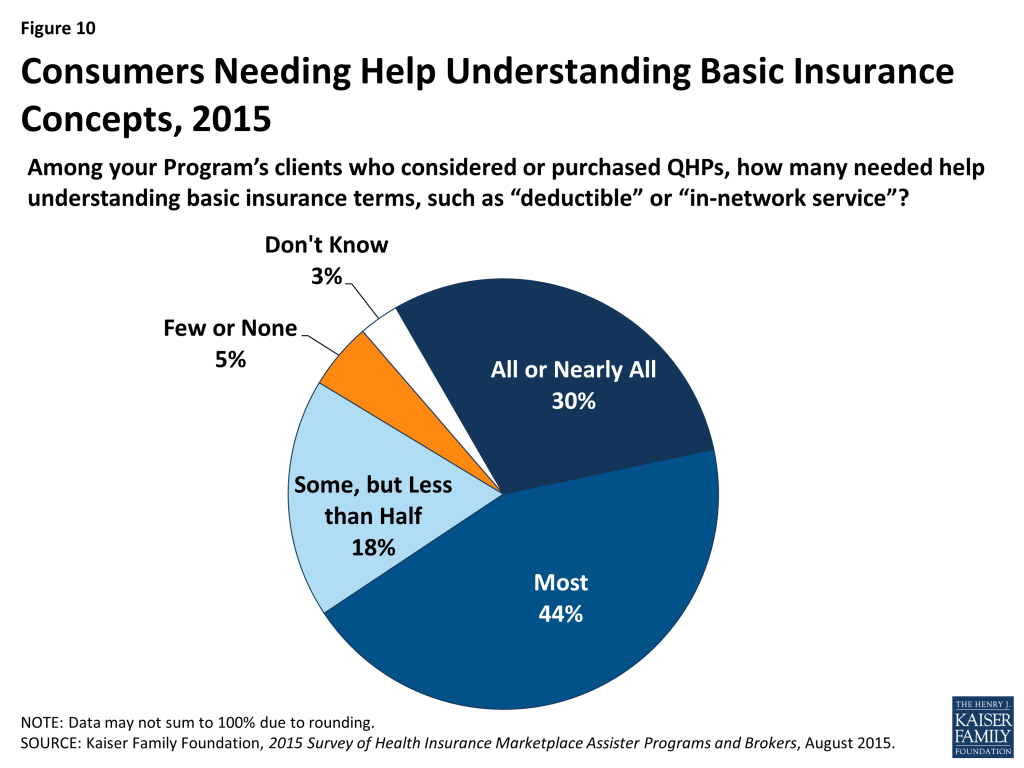
Figure 10: Consumers Needing Help Understanding Basic Insurance Concepts, 2015

Helping consumers renew coverage took less time. When helping consumers who were returning to the Marketplace this year to renew or change coverage they had selected last year, the process was faster. Nearly half of Assister Programs said it took less than one hour, on average, to help consumers who were returning to the Marketplace. (Figure 11)
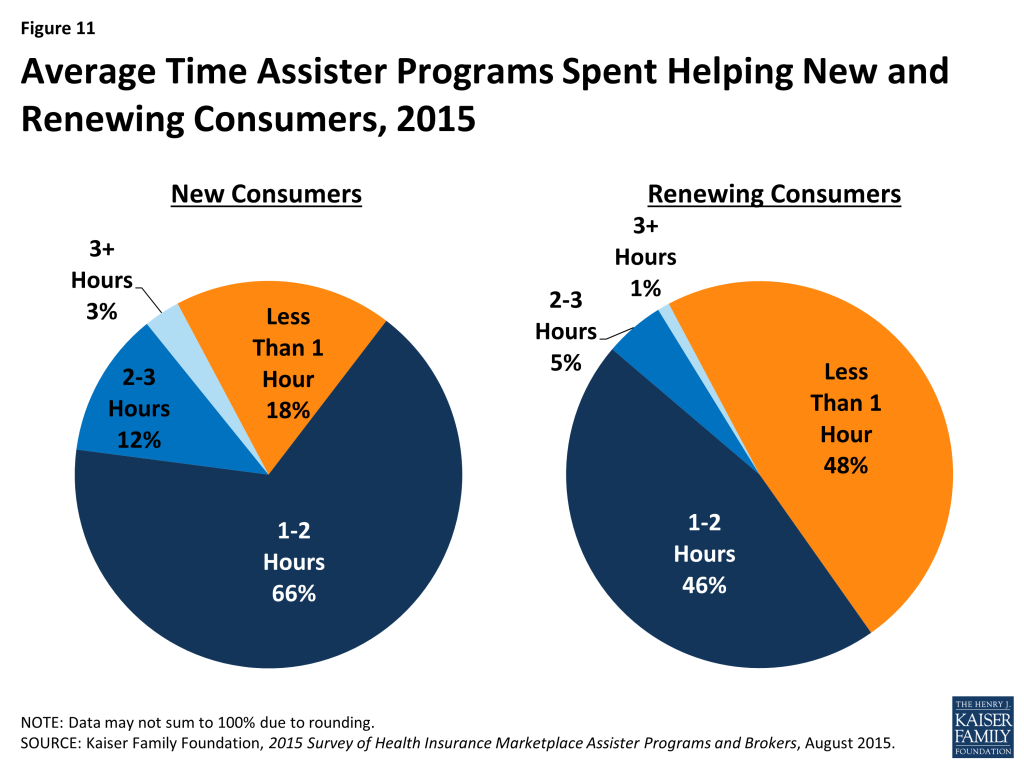
Figure 11: Average Time Assister Programs Spent Helping New and Renewing Consumers, 2015

Eligibility and enrollment assistance is time-intensive. Similar to last year, about two-thirds of Assister Programs said it took one to two hours, on average, to help each consumer who was applying to the Marketplace for the first time. (Figure 11) However, there was a small increase in the number of Programs who said the average application took less than one hour, and a small decrease in the number reporting the average application took more than 2 hours. (Appendix Table A2) This uptick in appointments lasting less than an hour may reflect better functioning websites and more Assister experience using the application.

Appointment time efficiency gains appear to have been spent productively, with more Assisters able to complete the enrollment process with consumers this year, including selection of a health plan. Last year 61% of Assister Programs said they knew the plan choice outcome for most or nearly all consumers they helped. This year 71% said this was the case. (Figure 12)

Figure 12: Consumers Completing the Enrollment Process, Including Selecting a Health Plan, 2014 vs. 2015

Help Between Open Enrollment Periods

Assister Programs helped at least 630,000 consumers with special enrollment periods and at least 290,000 consumers report mid-year changes. This year we asked returning Assister Programs about help they provided consumers outside of Open Enrollment periods. Most Programs were available throughout the year to help consumers who became eligible for special enrollment periods (SEPs or who needed to report other mid-year income or family changes to the Marketplace in order to update their application for subsidies.

On average, returning Programs each helped 183 consumers apply for SEPs last year. Forty-seven percent helped fewer than 50, but 24% of Programs helped more than 100. Navigator Programs and FQHCs helped more consumers with SEPs on average, compared to CACs. (Table 4)  Nationwide, we estimate Assister Programs helped more than 630,000 consumer apply for SEPs in 2014.

Table 4: Help with Special Enrollment Periods and Mid-Year Changes
   All Assister Programsby Program Type
Navigator and FEAPFQHCCAC
Number of People Helped with Special Enrollment Periods 
Up to 50 people47%27%33%60%*^
51-100 people15%19%19%12%
101-500 people17%29%25%9%*^
More than 500 people7%11%10%5%*
Don’t know/No answer13%13%12%14%
Number of People Helped with Mid-Year Changes
Up to 50 people42%44%53%71%*^
51-100 people18%10%13%5%*^
101-500 people19%16%14%5%*^
More than 500 people8%5%3%1%
Don’t know/No answer13%25%17%18%
*Significantly different from Navigator and FEAP estimate at the 95% confidence level; ^Significantly different from FQHC at the 95% confidence levelNOTE: Columns may not sum to 100% due to rounding.

Assister Programs also helped consumers report mid-year changes in their subsidy eligibility, though fewer consumers, overall, came in for this type of help. On average, each Program helped about 90 consumers report mid-year changes last year, although Navigator Programs and FQHCs helped more consumers report mid-year changes compared to CACs. (Table 4) Nationwide, we estimate Assister Programs helped more than 290,000 consumers report mid-year changes to the Marketplaces in 2014.

Assister Programs provided post-enrollment help to nearly 800,000 consumers between the first and second Open Enrollment period. During the 6-month period between Open Enrollments, nearly all returning Assister Programs also offered to help consumers with post-enrollment problems, though they are not required to do so. Those Programs that did provide post-enrollment assistance, on average, helped about 250 consumers. Again, Navigator Programs and FQHCs helped more consumers with post-enrollment problems compared to CACs. (Table 5)

Table 5: Help with Post-Enrollment Problems
   All Assister Programsby Program Type
Navigator and FEAPFQHCCAC
Number of People Helped with Post-Enrollment Problems 
Up to 50 people42%29%32%51%*^
51-100 people18%14%19%19%
101-500 people19%28%26%13%*^
More than 500 people8%13%14%3%*^
Don’t know/No answer13%16%9%14%
*Significantly different from Navigator and FEAP estimate at the 95% confidence level; ^Significantly different from FQHC at the 95% confidence level

NOTE: Columns may not sum to 100% due to rounding.

Consumers sought help with premium payment and invoicing problems, claims denials, and when their health providers were not in-network. Consumers also returned for help because they did not understand how to use their health coverage. (Figure 13) Most Assister Programs (69%) say they could help consumers successfully resolve post-enrollment problems most of the time; 27% said they succeeded just some of the time and 4% said not very often.
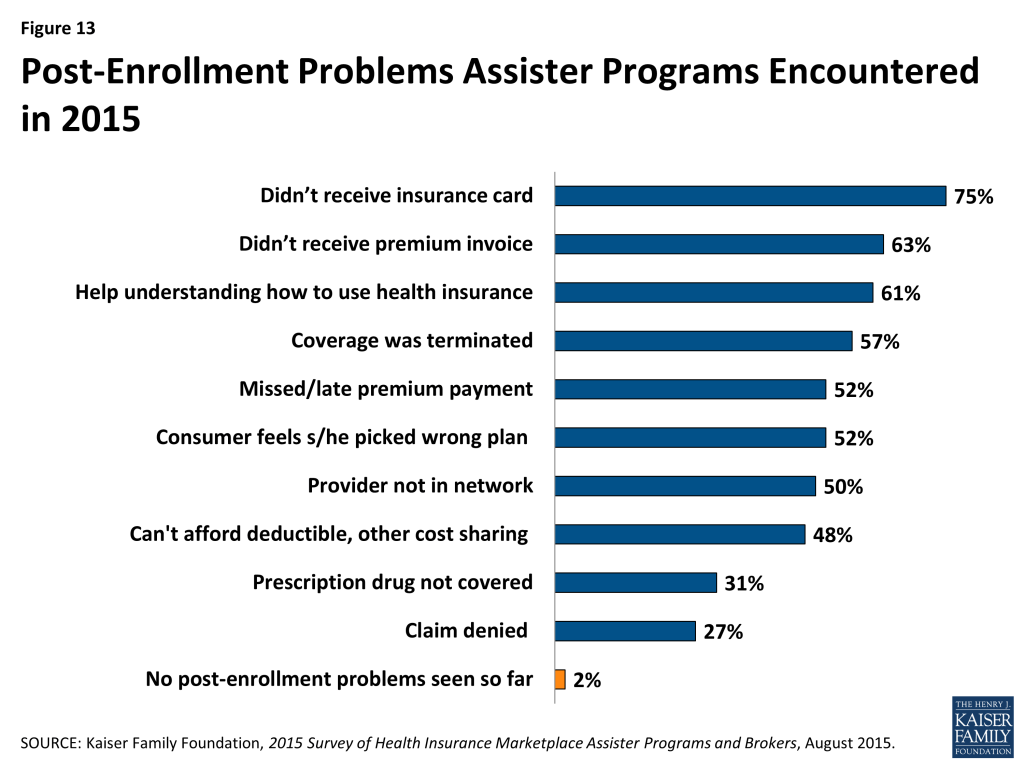
Figure 13: Post-Enrollment Problems Assister Programs Encountered in 2015

The ACA requires Navigators to refer consumers with post-enrollment problems to state Consumer Assistance Programs, or CAPs. However, federal funding for CAPs has not continued, and while many remain operational, Marketplace Assisters mostly refer consumers with post-enrollment problems elsewhere. When asked where they refer consumers with post-enrollment problems they cannot resolve, only 16% of Assister Programs mention CAPs. Instead, like last year, Assisters mostly refer consumers to the Marketplace Call Center (81%) or back to their health plan (62%). (Figure 14)
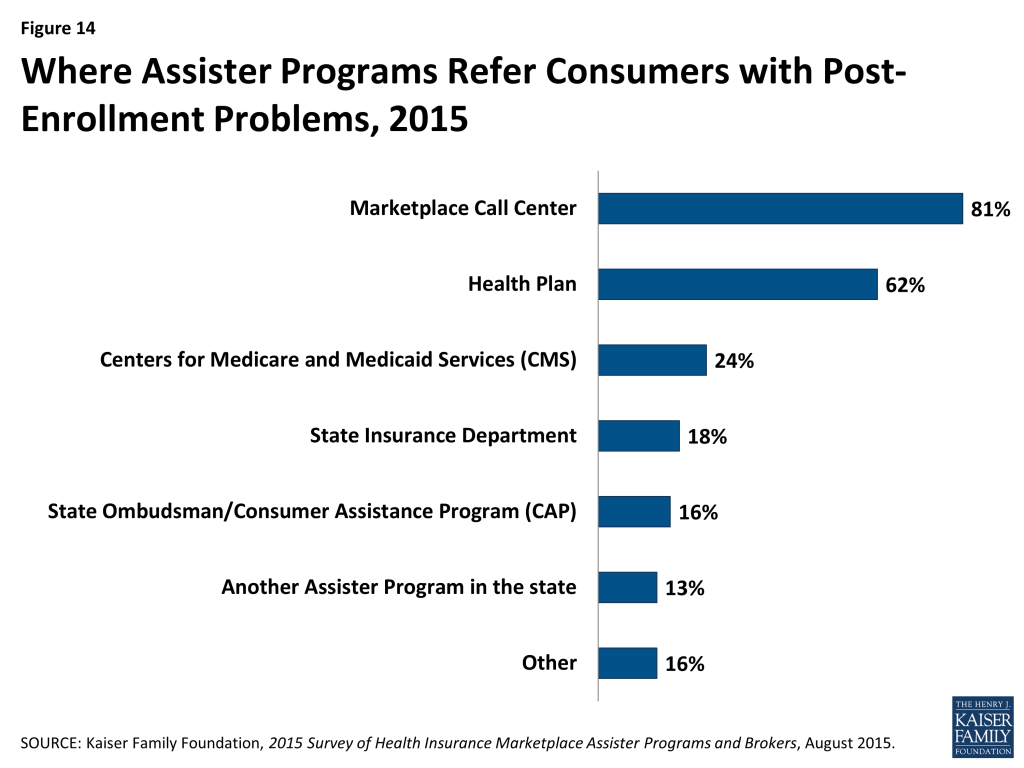
Figure 14: Where Assister Programs Refer Consumers with Post-Enrollment Problems, 2015

Report: Section 4: Challenges Facing Assister Programs

Demand for consumer assistance sometimes exceeded capacity, though less so than last year. For the second Open Enrollment period overall, 19% of Assister Programs said they could not help all who sought assistance. (Figure 15) In the final weeks of Open Enrollment, 22% of Programs said they had to turn at least some consumers away. This contrasts with 37% of Programs that were stretched beyond capacity overall during year one, and nearly half that had to turn away at least some consumers during the final weeks.
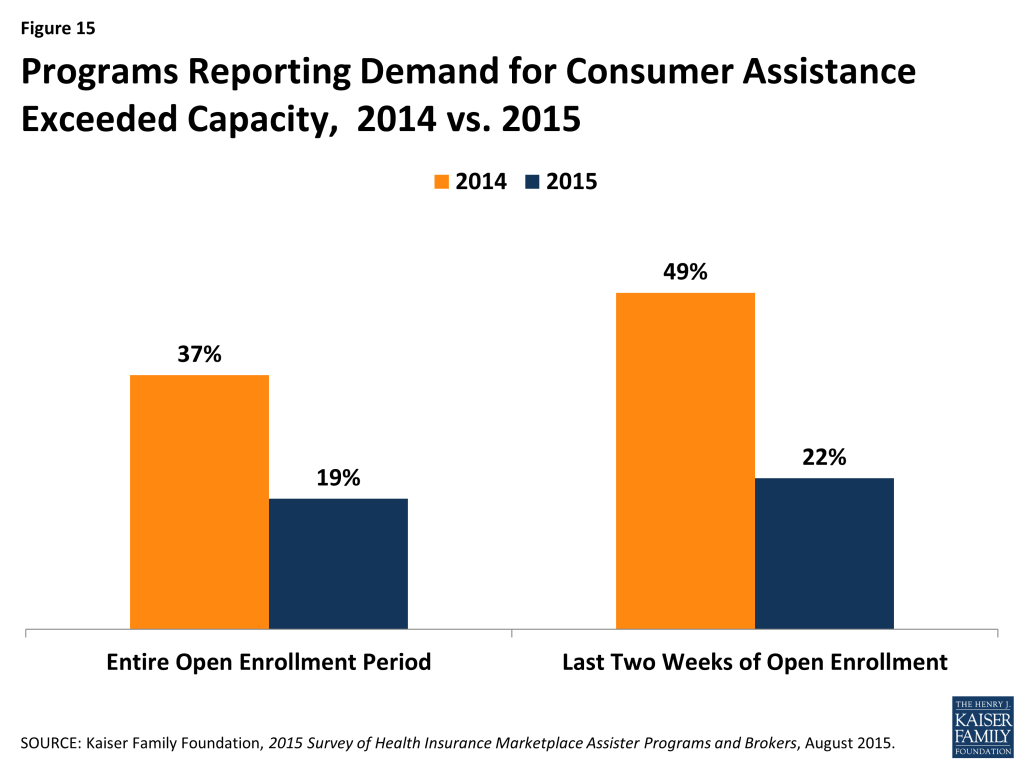
Figure 15: Programs Reporting Demand for Consumer Assistance Exceeded Capacity, 2014 vs. 2015

The shift in capacity relative to demand during the final weeks of Open Enrollment may be due to the fact that half of Marketplace enrollees this year were re-enrolling for a second year. In order to maintain continuous coverage on January 1, 2015, consumers had to re-enroll by mid-December. In addition, half of returning enrollees elected the auto-renewal option for 2015.

With respect to Marketplace consumer assistance capacity overall, it may be that capacity is coming more into alignment with the demand for help for many Assister Programs, though a significant number of Programs still are being asked for more help than they have capacity to provide.

Client continuity was low. Returning Assister Programs were asked approximately how many consumers they helped during the second Open Enrollment were returning clients they had helped the year before. Two-thirds of Programs responded that most to nearly all of the consumers helped this year were new. (Figure 16)

Figure 16: Client Continuity Among Returning Assister Programs, 2015

FQHCs were somewhat more likely to have an ongoing relationship with clients from year one. Over a third of FQHCs reported most clients they helped during the second open enrollment period were returning compared to less than a quarter of Navigators and CACs. In many Marketplaces, rules governing retention of identifiable personal information may have limited Programs’ ability to follow up with consumers. Also, some consumers who needed help enrolling in year one may not have needed help in year two. In addition, many Programs still focus heavily on outreach and assistance to uninsured consumers. As more consumers gain coverage, the extent to which ongoing relationships develop between consumers and Assisters remains to be seen.

Reported shortcomings in available health plan information hindered the ability of Assister Programs to help consumers evaluate QHPs in some cases. Assister Programs continue to report that at least some of their clients who considered QHPs had questions about plans that weren’t answered by information on the Marketplace website. However, the number of Programs indicating this was often or almost always the case declined to 31% this year, compared to 41% last year. (Figure 17)

Figure 17: Assister Programs Reporting Consumers had Health Plan Questions Unanswered by Marketplace, 2014 vs. 2015

Respondents also report that insurers selling coverage in the Marketplace tend not to offer training on their health plans to Assister Programs; 74% of Programs say few or none of the insurers in their Marketplace do so.

Most Assister Programs help clients apply for Medicaid and CHIP, but completing these applications often took multiple visits. Under the ACA, Marketplaces must provide a single streamlined application process for individuals seeking financial assistance, whether through premium tax credits and cost sharing subsidies for QHPs or through Medicaid and CHIP. In many states so far, though, including most FFM states, Marketplace IT systems are not sufficiently integrated with Medicaid to seamlessly transfer applications and enroll eligible individuals in a single transaction. Instead, when the Marketplace assesses an individual is likely eligible for Medicaid or CHIP, that person must often make a separate application to the state Medicaid agency, re-entering information already submitted to the Marketplace.

Most Programs said they will help consumers file a separate application for Medicaid or CHIP, while 30% refer consumers to another Assister Program or to apply on their own. (Figure 18) When Programs do help, 55% said the separate Medicaid application could usually be completed during the same appointment, while the rest said that it typically took multiple visits to help the client complete the transaction with Medicaid. (Figure 19)
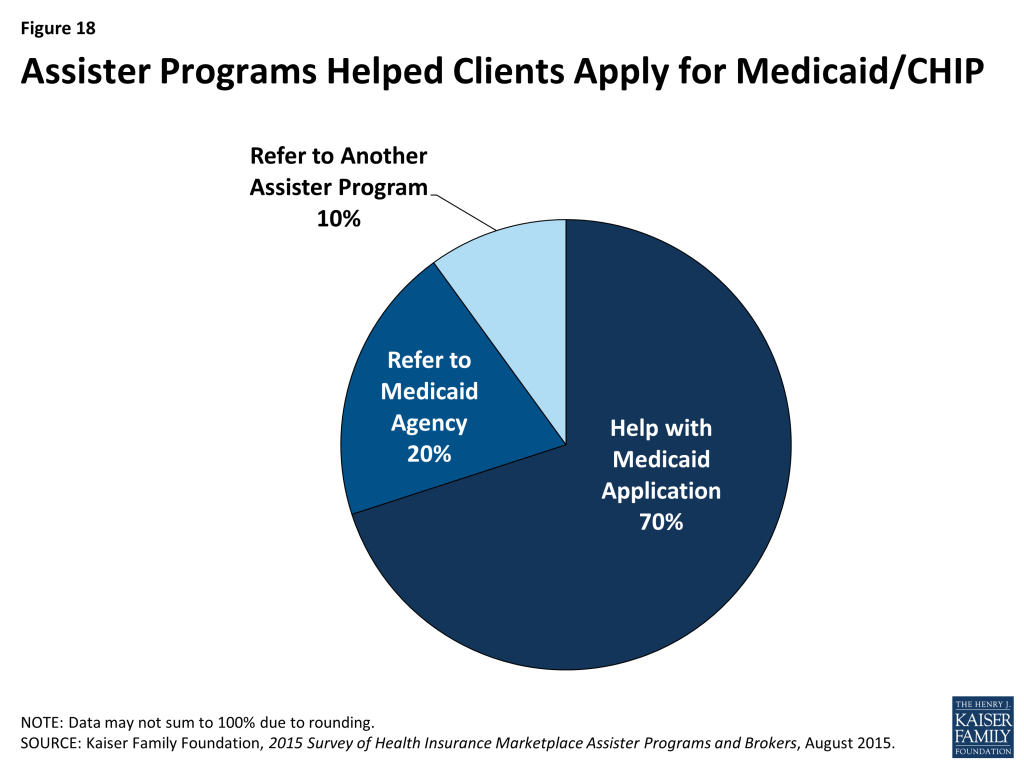
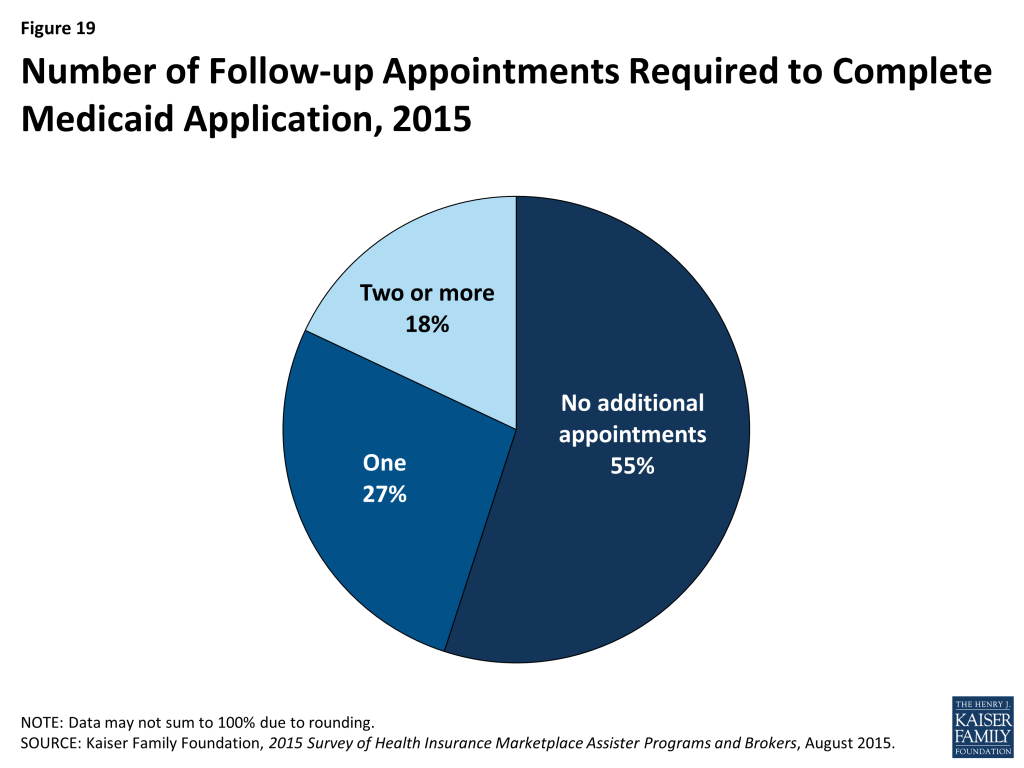
Figure 18: Assister Programs Helped Clients Apply for Medicaid/CHIP
Figure 19: Number of Follow-up Appointments Required to Complete Medicaid Application, 2015

Call Center technical support was uneven. Last year Programs reported that technical support from Marketplace call centers was not always effective. Last year Programs also listed types of consumer problems that could be especially difficult to resolve, including the need for translation services, immigration-related questions, tax-related questions, and help understanding QHP choices. This year, the survey asked Programs how often they turned to Call Centers for technical assistance when consumers presented with these types of problems and, when they did, how often they found Call Center technical assistance to be effective. (Table 6)

Table 6: Necessity and Effectiveness of Technical Help from Marketplace For Assister Programs
   % That Sought Technical Help from Marketplace% That Said Technical Help from Marketplace Was Effective
Most/all of the timeSome of the timeRarely/neverMost/all of the timeSome of the timeRarely/never
Translation Services18%13%69%50%27%23%
Immigration Questions24%29%47%41%36%24%
Tax Questions18%35%47%45%37%19%
Questions About QHP Choices7%21%72%39%42%20%
NOTE: Numbers may not sum to 100% due to rounding.

Assister Programs were more likely to seek help from the Call Center on cases involving immigration questions or tax related questions. Most Programs said they contacted the Call Center for help at least some of the time when faced with such cases. By contrast, 7 in 10 Assister Programs said they rarely if ever contacted the Call Center for help with translation services or questions about QHP choices.

When Programs did seek technical assistance, they said help from the Call Centers was uneven. Half of Assister Programs said Call Center help with translation was effective most to nearly all of the time. However, 39-45% of Programs ranked Call Center help as reliable on immigration, tax, and QHP questions. Between 19 and 24% of Programs said Call Centers rarely if ever provided effective help on these four topics.

Last year, Assisters in some SBM states reported they had access to dedicated staff at the Marketplace Call Center who could expedite service and help resolve more complex questions. This year the FFM launched a dedicated help center for Assister Programs called the Assister Help Resource Center (AHRC). The new center was launched on a test basis in a few states after Open Enrollment began and was available for all FFM Assisters by the end of Open Enrollment. The AHRC was operated separately from the FFM Call Center and offered policy-related technical assistance (e.g., explaining eligibility rules for immigrants) but no application assistance (e.g., AHRC staff could not check on the status of an application or re-set a password). Survey respondents this year were not asked about the AHRC.

Most Assister Programs reported they would like additional training on specific issues. All Assister Program staff must complete initial training to be certified by Marketplaces, and returning staff had to be recertified to work in year two. In FFM and FPM states, Navigators were required to complete 30 hours of federal training, while CAC Assisters had to complete at least 5 hours of federal training. Depending on the applicable training curriculum, topics include eligibility standards for financial assistance, initial and renewal application procedures, and general standards for qualified health plans. In addition, during the year, Marketplaces may offer supplemental training. The FFM, for example, publishes a weekly newsletter for Assisters with updates on various topics. CMS also hosts periodic webinars to provide additional information during the year. Participation by Assisters is voluntary.

Nearly all Assister Programs (86%) indicated they would like additional training on a range of complex issues. Last year, more than 90% of Assister Programs indicated additional training would be helpful. Topics for which further training is desired are similar to those identified last year, except that further training on renewing health coverage and subsidies is new on the list this year. (Figure 20 and Appendix Table A3)
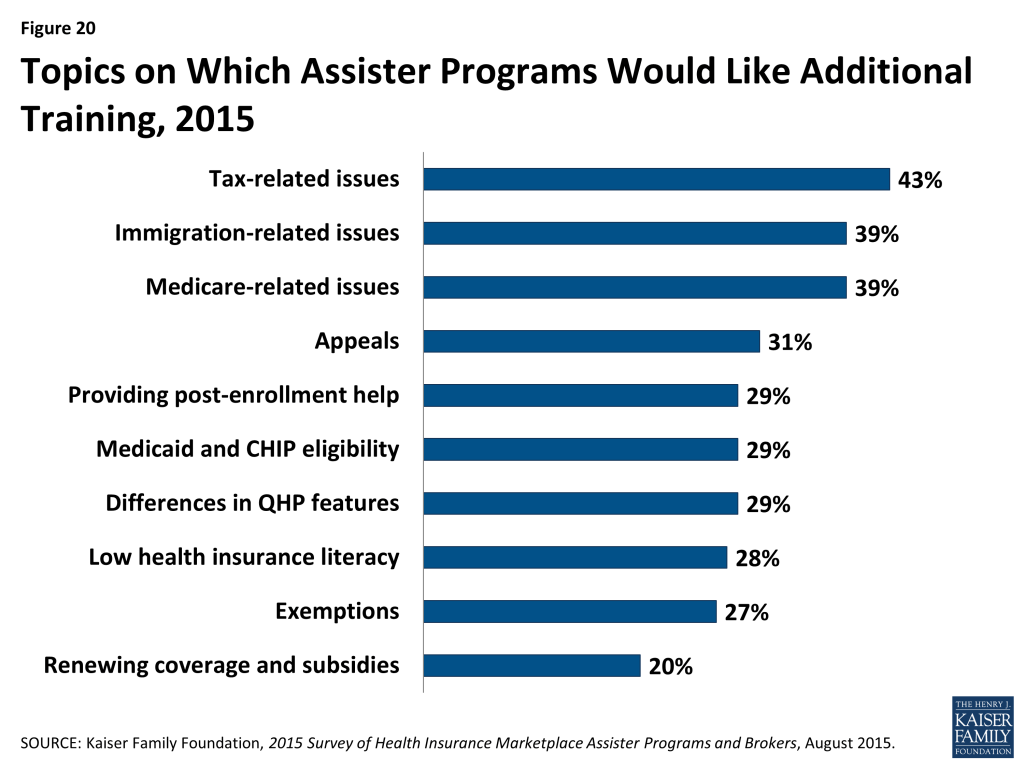
Figure 20: Topics on Which Assister Programs Would Like Additional Training, 2015

While nearly all Assister Programs recognize the value of coordinating with other Programs on activities and to share best practices, a majority reported that they did not often coordinate with other Programs. Like last year, Assister Programs strongly indicated that coordination with other Assister Programs improves effectiveness; 90% of Programs said coordination is somewhat or very important to operating effectively. But like last year, a majority of Programs say they seldom if ever coordinate with other Assister Programs. Just 46% said they coordinated often with other Programs. Navigators were most likely (60%) to report coordinating often with other Assister Programs, followed by FQHCs (50%). (Figure 21)
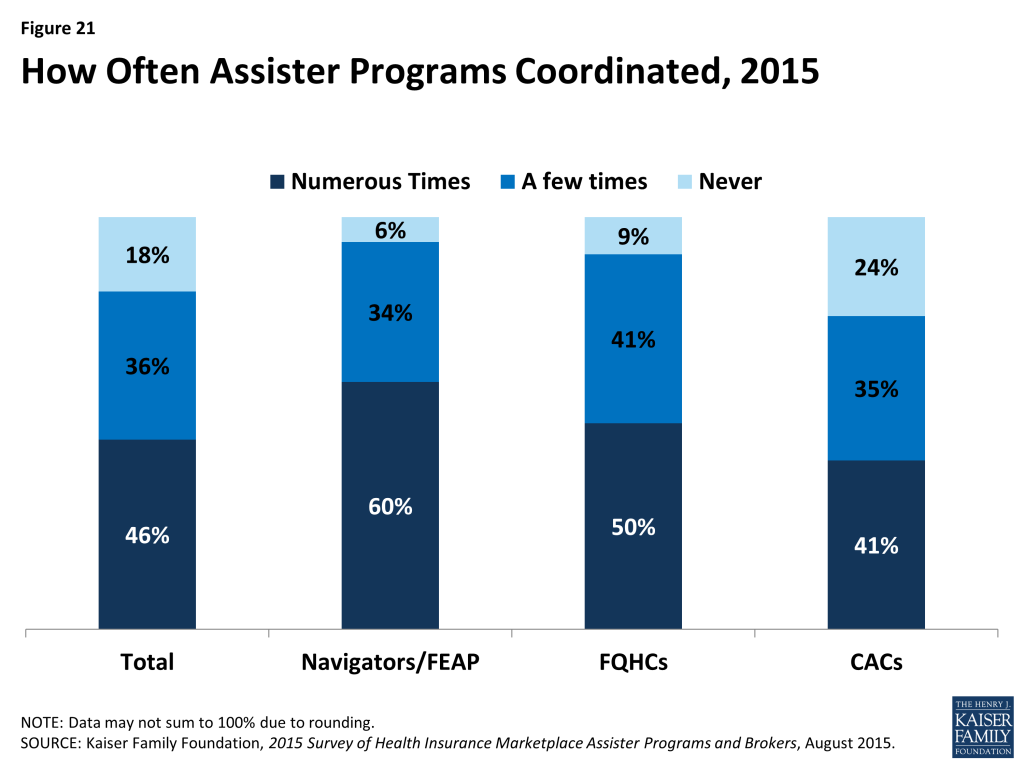
Figure 21: How Often Assister Programs Coordinated, 2015

Coordination was most often initiated by Assisters themselves or by an outside third party. Nine percent of Programs say the Marketplace facilitated coordination, though in SBM states, it was 19%. When Marketplaces did help Programs coordinate, this was most often the case for Navigators. (Table 7) Most FQHCs receive coordinating help from their state Primary Care Associations, which receive separate HRSA grants to support FQHC Assisters.

Table 7: Who Initiates Coordination Among Assister Programs
All ProgramsProgram TypeMarketplace Type
Navigator/ FEAPFQHCsCACsFFM/FPMSBM
Marketplace9%22%7%*7%*3%19%**
Other third party33%28%43%*29%^31%34%
Programs coordinate on their own64%73%61%*63%*71%55%**
 *Significantly different from Navigator and FEAP at the 95% confidence level; ^Significantly different from FQHC at the 95% confidence level**Significantly different from FFM/FPM at the 95% confidence level.

Report: Section 5: Consumer Assistance By Health Insurance Brokers

For the first time this year, the survey included health insurance brokers who helped consumers apply for non-group coverage in the Marketplace. Most, though not all state Marketplaces provided contact information for their certified brokers. As a result, survey findings are generalizable to most states but may not reflect experiences unique to some states.

Characteristics of Marketplace brokers

The vast majority (86%) of brokers who sold non-group coverage in the Marketplace this year had done so during the first Open Enrollment period and prior to 2014. Similar to Assistance Programs, 80% of returning brokers said they thought this year’s Open Enrollment went better than the first.

The opening of ACA Marketplaces in January 2014 changed the business of selling non-group health insurance for most brokers. Most say the time involved in selling a private policy has increased relative to pre-ACA days (66%), and revenue earned per policy has decreased (57%); but most also say they sell more non-group policies overall than they did pre-ACA (60%). Forty percent of brokers say their overall revenue from the sale of non-group policies has increased, 40% say overall revenue has decreased, and 20% say it is about the same. (Figure 22)
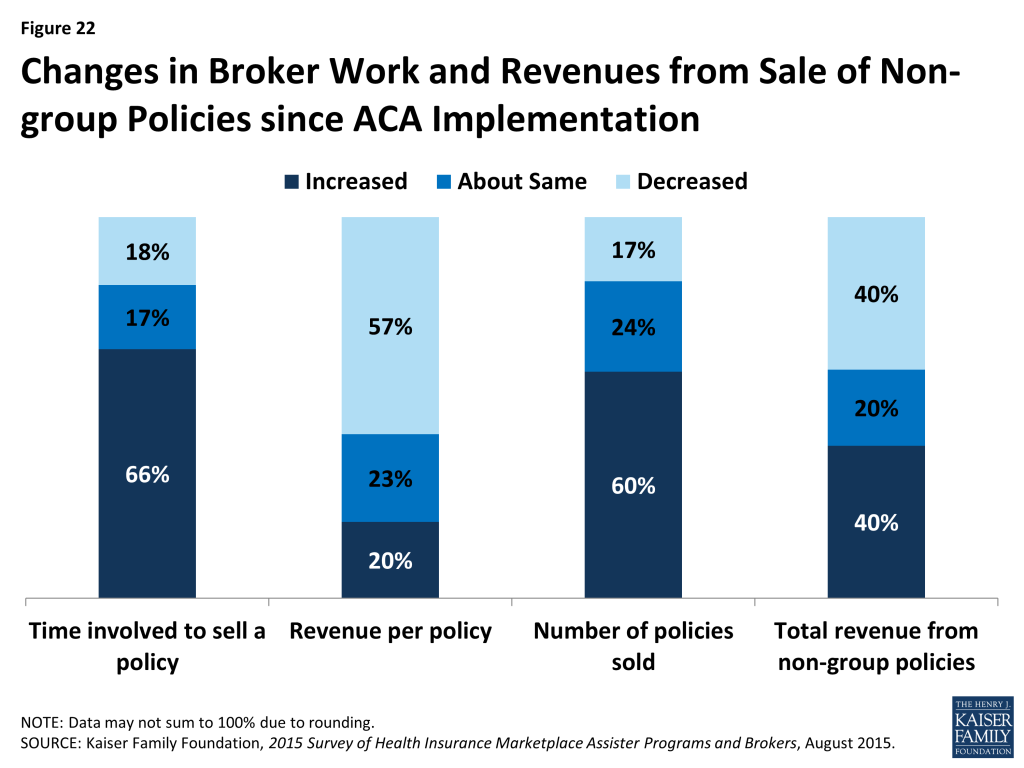
Figure 22: Changes in Broker Work and Revenues from Sale of Non-group Policies since ACA Implementation

Most brokers who sold Marketplace coverage (79%) also sold policies outside of the Marketplace. On average, brokers report helping about 140 consumers, both in and outside of the Marketplace, with eligibility and enrollment during the second Open Enrollment period. On average, brokers helped almost twice as many clients apply for coverage through the Marketplace (91) compared to outside of the Marketplace (49).

Some brokers were busier than others. Sixty percent said they helped up to 50 Marketplace consumers during this Open Enrollment period, while 20% of brokers said they helped more than 100. (Figure 23) Returning brokers, on average, helped about 8% fewer consumers this year compared to year one.

Figure 23: Number of Consumers Helped by Brokers Inside and Outside the Marketplaces, 2015

Comparing Activities of brokers and Assister Programs

Brokers generally engaged in similar consumer assistance activities as Assister Programs, but with emphasis on different services. For example, the vast majority of both brokers and Assister Programs said they help consumers compare and select QHPs, apply for premium tax credits, and resolve post-enrollment problems. But, compared to Assister Programs, brokers were less likely to engage in outreach and public education activities (33% vs 80%) and less likely to help consumers appeal Marketplace eligibility decisions (39% vs 58%). Compared to Assister Programs brokers were more likely to help small businesses select coverage (34% vs 9%).

Brokers were also less likely, compared to Assister Programs to help individuals apply for Medicaid and CHIP (49% vs 90%). Brokers who said they helped consumers with Medicaid applications were more likely to be from SBM states, where Marketplace websites are better integrated with Medicaid. However, when Marketplaces determined that consumers should complete a separate Medicaid application, brokers helped them do this less often than did Assister Programs. (13% vs. 69%)

Similar to Assister Programs, most brokers said, on average it took about one-to-two hours to help each client that was applying to the Marketplace for the first time, and about one hour to help clients who were returning to renew or change their Marketplace coverage.

Also similar to Assister Programs, most brokers said they would like to receive additional training on a range of topics, including tax related issues, Marketplace appeals and renewal procedures, Medicare, and Medicaid. And, similar to Assister Programs, brokers report that when they did need to seek technical assistance from Marketplace Call Centers, help was often inconsistent or ineffective. (Table 8)

Table 8: Use and Effectiveness of Technical Help from Marketplace For Brokers
   % That Sought Technical Help from Marketplace% That Said Technical Help from Marketplace Was Effective
Most/all of the timeSome of the timeRarely/neverMost/all of the timeSome of the timeRarely/never
Translation Services14%10%76%48%20%32%
Immigration Questions27%13%60%47%28%25%
Tax Questions16%25%58%37%30%33%
Questions About QHP Choices4%6%89%44%25%32%
NOTE: Numbers may not sum to 100% due to rounding

Comparing clients of brokers and Assister Programs

Similar to Assister Programs, brokers overwhelmingly said the consumers they helped had limited understanding of the ACA and limited health insurance literacy. In other respects, though, brokers served a somewhat different clientele. For example,

  • 82% of brokers said few or none of their clients needed language translation help, compared to 53% of Assister Programs
  • 9% of brokers said most or all of their clients lacked internet at home, compared to 35% of Assister Programs
  • 49% of brokers said they helped Latino clients, compared to 77% of Assister Programs
  • 50% of brokers said most or nearly all clients they served were uninsured when they sought help, compared to 83% of Assister Programs
  • 8% of brokers said most or nearly all clients had income low enough to qualify for Medicaid, compared to 50% of Assister Programs.

Brokers also reported higher rates of client continuity and were more likely than Assister Programs (47% vs 29%) to say most of the consumers they helped this year were people whom they had also helped during the first Open Enrollment period.

Report: Discussion

Last year, we reported the establishment of new consumer assistance resources under the ACA was a significant new development in the health coverage system. The ACA enabled millions of new consumers to enroll in coverage and created a new process for applying for coverage and financial assistance. Last year, we reported the new consumer assistance infrastructure faced many challenges, including inexperience and IT problems.   This year most Programs are more seasoned and websites worked better. But challenges remain.Returning Assister Programs helped 19% fewer people during the second Open Enrollment period. Returning Navigator and FQHC Programs (supported by Marketplace and HRSA grants, respectively) helped about the same number of consumers this year; voluntary CAC Programs experienced most of the decline in people helped. Two years do not make a trend. But because the level of consumer assistance provided this year was more sustained in grant funded programs compared to volunteer programs, this suggests that continued investment in Marketplace consumer assistance would make a difference. So far, though, a minority (27%) of Assister Programs overall say they are very certain funding will be available to support their work next year.

Programs also suggest other changes that could improve their efficiency and effectiveness. Strengthening the technical assistance offered by Marketplace Call Centers, and fully integrating Marketplace and Medicaid websites are steps that could streamline the enrollment process.

Facilitating coordination between Assister Programs is something else Marketplaces could undertake to strengthen consumer assistance.   Returning Programs that coordinated often with other Assister Programs were more likely to increase the number of people they helped this year. In some states, so-called super Navigators have been designated (formally by the Marketplace or informally) to promote coordination, centralize training and mentor new Assisters, facilitate scheduling and referrals, and help on complex cases.

Further capacity building may also still be important, though capacity constraints were less severe than in year one. One-in-five Assister Programs this year said they could not help all consumers who needed it. Because voluntary CAC Programs continue to provide a significant portion of all consumer assistance, Marketplaces could consider targeting additional financial support or coordination to at least some of these Programs, as well.

For a second year, enrollment assistance was time intensive. This year more Programs were able to complete the process through consumer selection of a health plan. But plan comparison and selection continued to pose challenges. Help comparing plans is still one of the leading reasons why consumers seek in-person help. Assisters still report many consumers have questions about plan choices that were not answered by information on Marketplace websites. Low health insurance literacy among consumers also persists. Because consumers may be faced with dozens of Marketplace plan choices, improving this process will be challenging. The FFM and some state Marketplaces are working to gradually improve the quality of health plan information and to develop new plan comparison tools for consumers in the future. But consumers will likely need a substantial amount of in person help, in addition, for years to come.

Outside of Open Enrollment, many Assister Programs remained busy. During the 6-month period between enrollment periods, Assister Programs helped nearly 300,000 people report mid-year changes and more than 600,000 people apply for special enrollment periods (SEP). Over the same period Assister Programs also helped nearly 800,000 individuals with post-enrollment problems. The ACA provided for state-based ombudsman programs (CAPs) to help with post enrollment problems and requires Navigators to refer consumers to CAPs for this kind of help. However this part of the ACA consumer assistance infrastructure is the least developed. CAPs were established in most states in 2010, but most have not received any new federal funding since 2012.

Brokers also continue their traditional role helping consumers in the non-group market, and are an important source of assistance for consumers seeking marketplace coverage. Most in this space today sold non-group coverage prior to the ACA. Most say it now takes more time to sell a non-group policy and the per-policy commission is lower. But most also say they are earning as much or more in total non-group revenue today compared to pre-2014, though a substantial minority also report earning less. Brokers also continue to help consumers buy coverage outside of the Marketplace. On average, brokers sell one policy outside for every two Marketplace policies they sell.

Brokers and Assister Programs engage in many of the same activities, though brokers are less likely to help consumers apply for Medicaid and more likely to help small businesses apply for small group plans. Brokers also appear less likely, compared to Assister Programs, to help some other of the most vulnerable consumers, including those who lack internet at home and those who need translation assistance.   The implication for Marketplaces would seem to be that brokers and Assister Programs are not interchangeable. To ensure that all consumers who need help receive it, both types of professionals will need to continue their key roles.

Methodology

The Kaiser Family Foundation 2015 Survey of Health Insurance Marketplace Assister Programs and Brokers was designed and analyzed by KFF researchers and administered by Davis Research. This nationwide survey was conducted through an online questionnaire from March 31, 2015 through May 3, 2015.

Assister Programs

To recruit Assister Program survey participants, we asked officials CMS and from States operating SBM or FPM Marketplaces to provide contact information for the directors of their certified Assister Programs. In addition, we requested contact information for the directors of enrollment assistance activities in each of the FQHCs from HRSA. All Assister Programs received an email with a link to the survey inviting the director to participate. In the event the person receiving the survey was not the appropriate person to complete it, they were asked to provide the contact name and email for the appropriate person within their organization.

To analyze results, we assigned Assister Programs to one of four types based on their primary source of funding. The first type, Navigators, were those identified by Marketplace officials contracted with and received grant funding directly from the Marketplace.   Of note, last year we distinguished between Marketplace-funded Programs that were supported with Section 1311 grant funds – called In Person Assisters (IPAs) – and those that received other Marketplace funding – Navigators. Because Section 1311 grant funds were discontinued, this year we categorized as Navigators all Assister Programs that received direct grant funding from a Marketplace.   The second type, FEAP, were those identified by CMS as contractors that operate in certain FFM states and that otherwise act as Navigators. We tracked FEAP responses separately in the survey, but for most data analysis presented in this report we combined responses of FEAPs and Navigators.   The third type, FQHCs, were those that received grant funding from HRSA to provide enrollment assistance.   We identified FQHCs using the contact list provided by HRSA. A small percentage of FQHC Programs receive both HRSA grants and Marketplace Navigator grant funding; these were categorized as Navigators for our analysis. All other Assister Programs certified to provide assistance in Marketplaces were designated as CACs.

A total of 4,680 Programs were invited to participate in the study, and 713 Programs responded and were included (for a response rate of 15%). Because response rates varied by Program type, data were weighted to reflect the distribution in the initial sample by Program type and Marketplace type (FFM, FPM, or SBM). Weighted and unweighted proportions of the final sample by Program type are shown in the table below.

 Unweighted % of totalWeighted % of total
FFM CAC23%34%
FFM FQHC15%14%
FFM Navigator/FEAP7%2%
FPM CAC3%4%
FPM FQHC2%2%
FPM Navigator/FEAP3%2%
SBM CAC18%22%
SBM FQHC11%8%
SBM Navigator/FEAP18%11%

Nationwide Estimates

Using responses provided by Assister Programs in the study, we were able to estimate the number of Assister Program staff and the number of consumers they helped with eligibility and enrollment in Medicaid/CHIP and Qualified Health Plans during the second Open Enrollment period nationwide, by extrapolating response data to the national level. Survey participants were asked to provide the number of full-time equivalent Assisters in their Program and the number of consumers helped. Respondents who did not provide a numeric value for the number of consumers helped were asked to estimate a number using a range of options. In making our calculation, we used the midpoint value for responses that provided a range of numbers of consumers helped.   Non-responses were imputed based on the type of Assister Program.

We also surveyed the work of Assister Programs outside of Open Enrollment as they helped people apply for Special Enrollment Periods, report mid-year changes to the Marketplace, and resolve post-enrollment problems. Using response data provided by returning Assister Programs, we were able to estimate the number of people nationally who received help from Assister Programs between the first and second Open Enrollment periods with each of these types of issues.

Brokers

To recruit brokers in the Federally-Facilitated Marketplace (FFM) states, we obtained contact information from a comprehensive file of brokers in the FFM states, made publicly available through HealthCare.gov.8  To obtain broker contact information from the SBM and FPM states, we asked Marketplaces to provide contact information, and when that was not provided, compiled contact information that was publicly available on Marketplace websites.   As we estimate that there are tens of thousands of brokers selling non-group Marketplace policies nationwide, we drew a sample of 9,700 brokers based on their distribution by Marketplace type (FFM, FPM, or SBM). Our general sampling rule was to randomly select 10% of all contacts in each state; we oversampled in ten states where we had fewer than 500 contacts to begin with. Because we did not have a complete sample of Marketplace brokers in all states, we were not able to compute national estimates of the numbers of consumers helped by brokers.

Out of the 9,700 brokers who were invited to participate in the study, 662 responded and were included (for a response rate of 7%).

Toplines and Margin of Sampling Error

Survey toplines with overall frequencies of both Assister Programs and Brokers for all survey questions are available at https://www.kff.org/health-reform/report/2015-survey-of-health-insurance-marketplace-assister-programs-and-brokers/.

The sample size and margin of sampling error (MOSE) for the total sample and key subgroups of Assister Programs are shown in the table below. All statistical tests of significance account for the effect of weighting.

GroupN (unweighted)MOSE
Total713+/-4 percentage points
CAC311+/-6 percentage points
FQHC202+/-7 percentage points
Navigator and FEAP200+/-7 percentage points
BrokersN (unweighted)MOSE
Total662+/-4 percentage points

Appendix

Table A1: Characteristics of Consumers Helped by Assister Programs, 2014 vs. 2015
Clients who were uninsured at time of assistance20142015
All or nearly all46%36%*
Most43%47%
Some, but less than half7%13%*
Few or none2%2%
Don’t know18%19%
Clients determined eligible for Medicaid or CHIP
All or nearly all6%13%*
Most38%37%
Some, but less than half33%29%
Few or none16%19%
Don’t know6%3%
Clients falling into the coverage gap  
All or nearly all1%4%*
Most12%11%
Some, but less than half36%36%
Few or none41%44%
Don’t know10%6%
Clients determined eligible for premium tax credits  
All or nearly all8%11%*
Most38%40%
Some, but less than half40%35%
Few or none10%11%
Don’t know5%4%
Clients eligible for Marketplace coverage without premium tax credits
All or nearly all0%1%
Most3%5%*
Some, but less than half26%26%
Few or none65%65%
Don’t know5%3%
Clients needing help understanding basic insurance concepts
All or nearly all33%30%
Most41%44%
Some, but less than half19%18%
Few or none5%5%
Don’t know2%3%
*Significantly different from 2014 estimate at the 95% confidence levelNOTE: Numbers may not sum to 100% due to rounding
Table A2: Average Time Assister Programs Spent Helping Each Client New to Marketplace
20142015
Less than one hour13%18%*
One hour up to two hours64%66%
Two hours up to three hours18%12%*
Three hours up to four hours3%2%
Four hours or longer2%1%
Mean1.7 hours1.5 hours*
Median1.6 hours1.5 hours
*Significantly different from 2014 estimate at the 95% confidence levelNOTE: Numbers may not sum to 100% due to rounding
Table A3: Topics on Which Assister Programs Would Like Additional Training, 2014 vs. 2015
20142015
Tax-related Issues41%43%
Immigration-related Issues39%39%
Medicare-related Issues34%33%
Appeals36%31%*
Providing Post-enrollment Help41%29%*
Medicaid and CHIP Eligibility35%29%*
Differences in QHP Features39%29%*
Low Health Insurance Literacy34%28%*
Exemptions33%27%*
Renewing Coverage and Subsidies20%*
Eligibility for Premium Tax Credits32%20%*
Special Enrollment Periods27%15%*
*Significantly different from 2014 estimate at the 95% confidence level

Endnotes

  1. Center for Consumer Information and Insurance Oversight, “Navigator Grant Recipients for States with Federally-facilitated or State Partnership Marketplace, ” available at http://www.cms.gov/CCIIO/Programs-and-Initiatives/Health-Insurance-Marketplaces/Downloads/Navigator-Grantee-Summaries-UPDATED-05-05-15.pdf. ↩︎
  2. The 14 SBM states in year two were California, Colorado, Connecticut, District of Columbia, Hawaii, Idaho, Kentucky, Maryland, Massachusetts, Minnesota, New York, Rhode Island, Vermont and Washington. The 4 consumer assistance FPM states were Delaware, Illinois, New Hampshire and West Virginia. Arkansas has been approved for status as a consumer assistance FPM in year one, but ceased providing state support for consumer assistance in year two and so was included with FFM states for this analysis. ↩︎
  3. Information on funding for In-person Assisters and Navigators provided by state-based marketplaces collected by KFF staff through information available on state websites and through conversations with state officials. ↩︎
  4. During the second Open Enrollment period, FEAPs operated in Arizona, Florida, Georgia, Indiana, Louisiana, North Carolina, New Jersey, Ohio, Pennsylvania, and Texas. ↩︎
  5. Twelve CAP programs received limited supplemental grants for FY 2015: California, Connecticut, District of Columbia, Maine, Maryland, Massachusetts, Michigan, Mississippi, Missouri, New York, North Carolina, and Vermont. ↩︎
  6. In year one, California provided for a type of Assister Program called Certified Enrollment Counselors (CECs) that were paid by the Marketplace on a per-enrollment basis. Subsequently, federal regulations prohibited Marketplaces from funding Navigators on a per-enrollment basis. For year two, California established a new Navigator Program, funded through Marketplace grants. The CEC program continues in California, though not all CECs receive Marketplace reimbursement. During the first two years, there were between 600 and 700 CEC Programs in California. During the first year of this survey, all CECs were classified as Navigator/In-Person Assister Programs. During the second year of this survey, CECs were included in the CAC classification.   This change in classification accounts for roughly a 10 percentage point change, from year 1 to year 2, in the proportion of total Assister Programs that are CACs. ↩︎
  7. Estimates were derived by extrapolating survey responses (on how many staff worked for Assister Programs and hope many people were helped) to data on the number of Assister Programs nationwide collected from the Marketplaces. ↩︎
  8. https://localhelp.healthcare.gov/ ↩︎
News Release

Survey Finds Many Primary Care Physicians Have Negative Views of the Use of Quality Metrics and Penalties for Unnecessary Hospital Readmissions 

Published: Aug 5, 2015
KFF_Commonwealth_Logo

Primary Care Providers View Health IT as Improving Quality, But Tilt Negatively on ACOs

Half of the nation’s primary care physicians view the increased use of quality-of-care metrics and financial penalties for unnecessary hospitalizations as potentially troubling for patient care, according to a new survey from The Commonwealth Fund and the Kaiser Family Foundation.

Fifty percent of primary care physicians say the increased use of quality metrics to assess provider performance is having a negative impact on quality of care. Far fewer (22%) see quality metrics as having a positive impact on quality.

Similarly, 52 percent say programs that impose financial penalties for unnecessary hospital admissions or readmissions are having a negative effect on quality of care, while just one in eight (12%) say such programs have a positive effect. Nurse practitioners and physician assistants view quality metrics and admissions penalties somewhat more favorably but still are more likely to see negative impacts than positive ones.

The findings are from a new brief based on the 2015 National Survey of Primary Care Providers, which captures the experiences and views of primary care physicians, nurse practitioners, and physician assistants related to recent changes in health care delivery and payment, including accountable care organizations (ACOs), medical homes, and increased use of health information technology.

Many primary care providers see the increased use of health information technology (IT) as improving quality of care. Half (50%) of physicians and nearly two-thirds (64%) of nurse practitioners and physician assistants see the advance of health IT having a positive impact on practices’ ability to provide quality care to their patients. Fewer physicians (28%), nurse practitioners and physician assistants (20%) say health IT is having a negative impact on quality.

More primary care physicians view the spread of ACOs as having a negative (26%) rather than positive (14%) impact on quality, though the majority either sees no impact or is not sure. Three in 10 (29%) primary care physicians say they currently participate in an ACO. Among those who participate, views are more favorable, though still mixed (30% positive, 24% negative).

Among the other survey findings:

  • A third (33%) of primary care physicians see the increased use of medical homes as having a positive impact on quality, more than twice the proportion who see a negative impact (14%). An even larger share (40%) of nurse practitioners and physician assistants view the impact as positive. Those who participate in medical homes are more likely to take a positive view than those who don’t: 43 percent of physicians and 63 percent of nurse practitioners and physician assistants practicing in medical homes have a positive view of their impact on quality of care.
  • Most (55%) of the nation’s primary care physicians are currently receiving financial incentives based on quality or efficiency measures, an indication of the reach of ongoing efforts by public and private payers to reward providers for quality of care rather than for the amount of services delivered to patients.
  • Nearly half (47%) of physicians and just over a quarter (27%) of nurse practitioners and physician assistants say the recent trends in health care are leading them to consider an earlier retirement. This continues a 20-year trend of physician dissatisfaction with market trends in health care.

Primary Care Providers’ Views of Recent Trends in Health Care Delivery and Payment is available online.

METHODOLOGY

The Kaiser/Commonwealth Fund 2015 National Survey of Primary Care Providers, conducted by mail and online from January 5 through March 30, 2015, is based on a nationally representative sample of 1,624 primary care physicians, supplemented by a separate nationally representative sample of 525 nurse practitioners and physician assistants in primary care practices. The margin of sampling error is plus or minus 3 percentage points for physicians and 5 percentage points for nurse practitioners and physician assistants. For results based on subgroups, the margin of sampling error is higher.


Poll Finding

Primary Care Providers’ Views Of Recent Trends In Health Care Delivery And Payment

Published: Aug 5, 2015

A new survey from The Commonwealth Fund and The Kaiser Family Foundation asked primary care providers—physicians, nurse practitioners, and physician assistants—about their experiences with and reactions to recent changes in health care delivery and payment. Providers’ views are generally positive regarding the impact of health information technology on quality of care, but they are more divided on the increased use of medical homes and accountable care organizations. Overall, providers are more negative about the increased reliance on quality metrics to assess their performance and about financial penalties. Many physicians expressed frustration with the speed and administrative burden of Medicaid and Medicare payments.  An earlier brief focused on providers’ experiences under the ACA’s coverage expansions and their opinions about the law.  An additional data note looks at reported acceptance of Medicare patients among non-pediatric primary care physicians.


Report (PDF)

State Medicaid Eligibility Policies for Individuals Moving Into and Out of Incarceration

Authors: Catherine McKee, Sarah Somers, Samantha Artiga, and Alexandra Gates
Published: Aug 4, 2015

Executive Summary

Executive Summary

Many individuals in prisons and jails have significant physical and behavioral health care needs, but lack health insurance and regular access to care. Compared to individuals in the community, incarcerated individuals are much more likely to have chronic physical and mental health conditions, such as HIV/AIDS, a serious mental illness, or a substance abuse disorder. Despite having significant health care needs, many individuals do not receive necessary medical care during incarceration. Because the majority of individuals leaving prisons and jails do not have health insurance, they often continue to lack access to care after release.

Medicaid coverage for individuals moving into and out of incarceration may help increase their access to care and improve their health status, and thus contribute to broader benefits. Enrolling these individuals in Medicaid may also contribute to state savings. The Affordable Care Act’s (ACA) Medicaid expansion offers a new opportunity for states to connect individuals in prisons and jails to coverage. However, Medicaid eligibility policies for incarcerated individuals vary in both expansion and non-expansion states. These policies affect if and when individuals may be enrolled in coverage and the savings states may achieve from their coverage.

Federal law does not prohibit individuals from being enrolled in Medicaid while incarcerated. However, Medicaid will not cover the cost of care for incarcerated individuals, except for care received as an inpatient in a hospital or other medical institution. Given these broad federal rules, states have flexibility to make policy choices related to eligibility and enrollment of incarcerated individuals. Building on an earlier brief that provides an overview of health coverage and care for individuals involved with the criminal justice system, this brief highlights how state eligibility policies for incarcerated individuals differ, based on a review of state statutes, regulations, Medicaid eligibility manuals and other Medicaid agency guidance publicly available online and Medicaid managed care contracts. It finds:

A few states do not appear to have any written policies regarding Medicaid eligibility for incarcerated individuals. However, given the program’s potentially greater role for this population as a result of the Medicaid expansion, this is an area where states will likely continue to develop policies over time.

Many states terminate eligibility for individuals who become incarcerated, but the number of states that suspend rather than terminate eligibility appears to be growing. Some states have relatively broad suspension policies, while others explicitly limit suspension to certain groups of incarcerated individuals or for a specified length of time. Historically, many states terminated eligibility, as federal law prohibits Medicaid payment for most services provided to individuals in prisons and jails.  However, suspending eligibility allows individuals to receive services immediately after release and may make it easier for states to access federal Medicaid funding for inpatient services provided to incarcerated individuals.

Policies and processes related to accessing Medicaid reimbursement for inpatient services provided to incarcerated individuals vary among states. Many states’ policies acknowledge that individuals who are incarcerated may receive Medicaid coverage for inpatient services, and some outline the process for accessing federal reimbursement for these services. Other state policies do not specify this exception for inpatient services, meaning that the states may not be accessing available federal reimbursement. Accessing this federal reimbursement can lead to savings for states. The Medicaid expansion increases this savings potential, as more individuals qualify for the program, and the federal government provides an enhanced match rate for newly eligible adults.

States also vary in whether they allow individuals in prisons and jails to apply for and enroll in Medicaid. If individuals cannot apply and be determined eligible for Medicaid while incarcerated, they may not have access to health care services immediately after release. Policies in several states explicitly allow individuals who are incarcerated to apply for Medicaid before release. A few states also require corrections staff to facilitate the application process for individuals nearing release. Allowing individuals to apply for and enroll in Medicaid prior to release can help ensure timely access to care immediately after release.

Through their contracts with Medicaid managed care entities, some states have established policies to prevent making capitated payments on behalf of individuals who are incarcerated.1  Some contracts exclude individuals who are incarcerated from enrolling in the managed care plan and/or provide for disenrollment from the plan when an enrollee becomes incarcerated. In addition, some contracts specify that the state will recoup a capitated payment made on behalf of an enrollee who becomes incarcerated. By adopting such policies, states can stop capitated payments to plans for individuals while they are in prison or jail without terminating enrollment in Medicaid.

Several states have Medicaid managed care contract provisions that require plans to provide care coordination services to individuals upon release from jail or prison. Medicaid managed care entities may be well-positioned to help Medicaid enrollees access necessary community-based services upon release. Several states require plans to work with correctional agencies to help individuals returning to the community connect to services, particularly behavioral health services, upon release.

In conclusion, state Medicaid eligibility policies for individuals moving into and out of incarceration vary. These policies affect if and when individuals may enroll in Medicaid and the scope of any resulting savings. Looking ahead, state policies in this area will likely continue to evolve given the larger role of Medicaid for this population under the expansion. It will be important for states to consider the implications of different choices as they develop their policies. Suspending rather than terminating eligibility, allowing individuals to enroll in coverage prior to release, and facilitating enrollment as part of re-entry planning all promote timely access to health coverage upon release. Research suggests that coverage immediately upon release can lead to improved access to care and broader benefits. Expanding health coverage among individuals moving into and out of incarceration may also lead to state savings through federal reimbursement for inpatient services provided to incarcerated individuals, reductions in uncompensated care, and savings in other indigent care programs.

Introduction

Connecting individuals moving into and out of incarceration to health coverage may not only increase their access to care and improve their health status, but may also lead to state savings. The Affordable Care Act’s (ACA) Medicaid expansion to low-income adults offers a new opportunity to connect these individuals to health coverage. However, in both expansion and non-expansion states, a range of state policy choices determine if and when individuals moving into and out of incarceration may be enrolled in coverage and the potential savings that states may achieve from increasing coverage for these individuals. Based on a review of state statutes, regulations, publicly available state Medicaid policies, and Medicaid managed care contracts, this brief highlights examples of how Medicaid eligibility policies for incarcerated individuals differ among states and discusses the implications of these state policy choices. This work builds on an earlier brief that provided an overview of health coverage and care for the criminal justice-involved population and the role of Medicaid.

Background

Many individuals in prisons and jails have significant health care needs, but lack health insurance and regular access to care. As of 2013, approximately 1.5 million individuals were incarcerated in U.S. state and federal prisons and another 730,000 were incarcerated in county and city jails.2  These individuals are much more likely to have chronic physical and mental health conditions than individuals in the community.3  For example, HIV/AIDS is two to seven times more prevalent among people in correctional facilities than among individuals in the community.4  Similarly, the prevalence of serious mental illness is two to four times higher in state prisons than in the community.5  In addition, 68% of people in jails and over 50% of people in state prisons have a diagnosable substance abuse disorder, compared with 9% of the general population.6  Despite having these significant health care needs, many individuals do not receive necessary medical treatment during incarceration.7  The lack of access to continuous, quality care often persists after release, as the majority of individuals leaving prisons and jails do not have health insurance.8 

Historically, Medicaid played a limited role for individuals moving into and out of prisons and jails. Prior to the ACA, only certain groups of low-income individuals qualified for the program: pregnant women and children, caretaker relatives, people over age 65, and people with disabilities.9  Most adults not living with their minor children were therefore excluded from the program under federal rules. As such, many individuals moving into and out of prisons and jails did not qualify for the program. Moreover, even for individuals enrolled in the program, federal law prohibits federal Medicaid payment for most health care services provided to individuals while incarcerated, with the exception of care received as an inpatient in a hospital or other medical institution (Box 1).10 

The ACA Medicaid expansion provides a new opportunity to increase health coverage among individuals moving into and out of incarceration. The ACA expanded Medicaid to adults who do not fit into an existing Medicaid eligibility category, are not eligible for Medicare, and have incomes up to 138% of the Federal Poverty Level, providing a new coverage option for many individuals involved with the criminal justice system. However, the Supreme Court ruling on the constitutionality of the ACA effectively made the Medicaid expansion a state option. As of July 2015, 31 states have adopted the expansion, while the remaining 20 states have not.11 

Box 1: Medicaid Funding for Individuals in Prisons and Jails

There is no federal statute, regulation, or policy that prevents individuals from being enrolled in Medicaid while incarcerated.12  Notably, in 2004, CMS issued guidance reminding states that “[i]ndividuals who meet the requirements for eligibility for Medicaid may be enrolled in the program before, during and after the time in which they are held involuntarily in secure custody of a public institution.”13  Federal law requires states to allow individuals to apply for Medicaid at any time.14 

Although individuals may be enrolled in Medicaid while they are incarcerated, Medicaid generally will not cover the cost of their care. Specifically, federal law prohibits the use of federal Medicaid funds to pay for nearly all services for “an inmate of a public institution” regardless of whether they are otherwise eligible for Medicaid.15 

However, states may receive federal Medicaid funds for services provided to individuals who are incarcerated, but are patients of a medical institution.16  CMS has clarified that this includes individuals admitted to a hospital, nursing facility, juvenile psychiatric facility, or intermediate care facility on an inpatient basis, as long as they remain Medicaid eligible.17 

Increased Medicaid coverage among individuals leaving prisons and jails may improve their access to care and health outcomes. Without access to health services immediately upon release, recently incarcerated individuals’ physical and mental health conditions may deteriorate. In fact, research shows that individuals face a markedly increased risk of death– over 12 times that of other individuals – during the first two weeks after release.18  Research suggests that providing access to Medicaid upon release can promote more timely access to care, which may reduce that risk, particularly for individuals with chronic physical or mental health conditions.19  In addition, continuous access to health care immediately after release may reduce the risk of re-arrest and re-incarceration. One study of individuals with a severe mental illness found an association between enrollment in Medicaid before release from jail and fewer subsequent detentions.20 

Increasing Medicaid coverage for individuals moving into and out of incarceration may also contribute to state savings. Although federal Medicaid funds are not available for most care provided to individuals while incarcerated, states may receive Medicaid reimbursement for care provided to eligible individuals admitted as inpatients to a medical institution, such as a hospital, nursing facility, psychiatric facility, or intermediate care facility. Prior to the ACA, only a few states pursued Medicaid reimbursement for these services. This decision may have been due in part to the limited share of the incarcerated population that qualified for Medicaid. However, the Medicaid expansion offers greater potential savings to states given that a larger share of the incarcerated population may qualify for Medicaid and that the federal government is providing states an enhanced federal matching rate for newly eligible adults. Increased coverage among individuals returning to the community from jail or prison may also contribute to other state and local savings through reductions in uncompensated care and savings in other indigent care programs, such as state-funded behavioral health services.

Methods

This analysis examines states’ policies regarding Medicaid eligibility and enrollment for individuals who are incarcerated. It is based on a review of state statutes, regulations, Medicaid eligibility manuals, and other Medicaid agency guidance that is publicly available online conducted during spring 2015. These resources were reviewed to determine if a state has written policies indicating if the state: (1) suspends or terminates Medicaid eligibility during incarceration; (2) has a process in place to access federal Medicaid funds for individuals who receive inpatient hospital services during incarceration; and (3) explicitly allows individuals to apply and be determined eligible for Medicaid during incarceration, and, if so, facilitates the process. In addition, sample state Medicaid managed care contracts were reviewed to identify any provisions regarding enrollees involved in the criminal justice system.

It is important to note that this review was limited to Medicaid agency guidance that is publicly available online. As a result, it may not have captured all pertinent agency guidance. Moreover, given that this area of policy is rapidly changing, the reviewed materials may not reflect the most current policies in all states. Lastly, this review did not assess whether and how states are implementing their written policies. Given these limitations, this analysis does not present any comprehensive conclusions about policies across all 50 states. Rather, it highlights the range of polices states have adopted in this area and discusses the implications of different policy choices. Future state survey work by the Kaiser Family Foundation will capture more comprehensive information on the status of state policies across the country.

Issue Brief

Findings

A few states do not appear to have any statutes, regulations, or written policies regarding Medicaid eligibility for individuals in prisons and jails. Moreover, many states lack complete written policies addressing every aspect of this issue, and several states appear to have internally inconsistent written policies. The dearth of clear and comprehensive policies on these topics in some states could reflect the limited role Medicaid has historically played for individuals moving into and out of incarceration. Given the program’s potentially greater role for this population as a result of the ACA Medicaid expansion, more states will likely develop their policies in this area over time.

Termination and Suspension of Eligibility for Incarcerated Individuals

Even though federal law does not preclude individuals who are incarcerated from being enrolled in Medicaid, many states have historically terminated coverage for enrollees who become incarcerated. States have found termination attractive from an administrative perspective because it makes improper billing for services provided to incarcerated individuals (who are not eligible for Medicaid coverage for most care) less likely. However, the Department of Health and Human Services encourages states to suspend rather than terminate Medicaid benefits during incarceration.21  When states terminate eligibility, individuals must re-apply for Medicaid, which may delay access to services upon release. DHHS has noted that suspending Medicaid eligibility allows individuals to receive services immediately after release, which “may reduce the demand for costly and inappropriate services later.”22  In addition, suspending Medicaid eligibility can make it easier for states to access federal Medicaid funding when individuals who are incarcerated receive inpatient services in a medical institution.

Many states continue to terminate eligibility for individuals who become incarcerated, but a number of states require the Medicaid agency to suspend rather than terminate eligibility. Some of these states specify that eligibility is suspended during incarceration. Others simply indicate that enrollees who become incarcerated retain their Medicaid eligibility, but cannot receive services through Medicaid. This area of state policy is evolving, with more states moving toward suspending Medicaid eligibility during incarceration. For example, in 2015, New Mexico enacted legislation stating that incarceration is not a basis to deny or terminate eligibility for Medicaid and requiring the Medicaid agency to adopt regulations implementing the statute.23  Other states have introduced similar legislation.24  However, some states that have  adopted policies to allow for suspension of eligibility have faced challenges updating their eligibility systems to implement these policies.25 

Some states have relatively broad suspension policies, while others explicitly limit suspension of eligibility to certain groups of incarcerated individuals or for a specified length of time. For example, under a Florida state statute, all Medicaid enrollees who become incarcerated in a state, county, or municipal correctional facility remain eligible for Medicaid, but generally cannot receive services through Medicaid.26  Some states provide for suspension of Medicaid enrollees in some, but not all, correctional facilities. For example, North Carolina’s written policy suspends eligibility for individuals in state prisons, but not in other correctional facilities.27  Similarly, Arizona’s policy provides for suspension of eligibility only for individuals in state prisons and certain county jails.28  In addition, some states explicitly limit the length of time of a suspension. For example, Arizona’s policy does not allow for suspended eligibility for Medicaid enrollees who will remain incarcerated for 12 months or longer.29  Iowa and Indiana suspend eligibility for individuals regardless of how long they are expected to remain incarcerated, but the suspension cannot last for more than 12 months (Box 2).30 

Box 2: State Examples of Eligibility Suspension Policies

Florida: “[I]n the event that a person who is an inmate in the state’s correctional system…in a county detention facility…or in a municipal detention facility…was in receipt of medical assistance under this chapter immediately prior to being admitted as an inmate, such person shall remain eligible for medical assistance while an inmate, except that no medical assistance shall be furnished under this chapter for any care, services, or supplies provided during such time as the person is an inmate…Upon release from incarceration, such person shall continue to be eligible for receipt of medical assistance furnished under this chapter until such time as the person is otherwise determined to no longer be eligible for such assistance.”31 

North Carolina: “Beneficiaries who are incarcerated in a federal prison, juvenile justice facility, county or local jail must have their eligibility terminated. Inmates who are incarcerated in a NC Department of Public Safety, Division of Prisons (DOP) facility must have their eligibility placed in suspension, provided they remain otherwise eligible for Medicaid.”32 

Indiana: “When a recipient becomes incarcerated…, the individual’s health coverage is to be suspended, not discontinued….The suspension continues until the individual is released from the facility, but will not exceed 12 months.”33 

Accessing Federal Medicaid Funds for Inpatient Services

As noted above, federal law allows states to receive Medicaid reimbursement for inpatient services provided to incarcerated individuals by a hospital outside of a correctional facility. Historically, few states have sought out this reimbursement. This decision may have been due in part to the small share of the incarcerated population that qualified for Medicaid prior to the ACA. However, states may realize savings from accessing this reimbursement, and the savings potential is significantly enhanced by the ACA Medicaid expansion (Box 3).

Box 3: Examples of Estimated State Savings inCorrectional Spending Due to Federal Reimbursement forInpatient Costs for Incarcerated Individuals

Michigan projects a reduction in state correctional spending of $13.2 million in SFY 2015.34 

Colorado expects savings of $5 million per year in state correctional spending.35 

Kentucky has estimated savings of $5.4 million in SFY 2014 and $11.0 million in SFY2015.36 

Policies and processes related to accessing Medicaid reimbursement for inpatient services differ among states. Many states’ written policies acknowledge that individuals who are incarcerated may receive Medicaid coverage for inpatient services. However, others do not specify this exception. Some of the states that do specify this exception have adopted written policies outlining the process for accessing federal Medicaid funds for inpatient services. In many of these states, correctional staff members submit a Medicaid application on behalf of individuals receiving inpatient services. Some states allow submission after an individual is admitted to the hospital, while others do not allow submission until after discharge.37  Accordingly, the process for ensuring that eligibility is terminated or suspended upon discharge from the hospital also varies among states. In Arizona, for example, Medicaid eligibility simply begins on the date of hospital admission and ends on the date of hospital discharge.38  In Colorado, when an individual returns from the hospital to the correctional facility, facility staff must notify the Medicaid agency to properly terminate eligibility.39  Several states only specify a process for accessing Medicaid funding for individuals in certain correctional institutions.40 

Connecting Individuals to Coverage Upon Release

Enrolling individuals who are uninsured (including those whose coverage has been terminated upon incarceration) in Medicaid prior to release from prison or jail can help support access to care immediately after release. If individuals cannot apply for Medicaid until after release, they may experience a delay in obtaining coverage and thus, necessary care. As noted above, federal Medicaid law requires states to allow individuals to apply for Medicaid at any time,41  and CMS has clarified that states may enroll individuals who are incarcerated in Medicaid.42  As a practical matter, most individuals in prisons and jails will not be able to apply for Medicaid unless the state actively facilitates the process. States may require correctional or Medicaid agency staff to assist individuals with the application process, and federal Medicaid funding should be available to states for this purpose.43  In addition, outside organizations may coordinate with states to send navigators or certified application counselors into jails and prisons to help individuals enroll in Medicaid.

Current state policies vary with regard to allowing individuals to enroll in Medicaid prior to release. Several states’ policies explicitly allow individuals who are incarcerated to apply for Medicaid (Box 4). Many of these policies specify that individuals who are nearing their release date may apply for Medicaid. Some note that the Medicaid agency must determine eligibility within the standard time period required under federal Medicaid regulations, but that individuals cannot be found eligible or cannot be enrolled in the program until after release.44  However, at least two states, Michigan and North Carolina, appear to suspend eligibility for incarcerated individuals found to qualify for Medicaid.45  These policies may allow individuals to receive services more quickly after release.

Box 4: Examples of State Policies Related toMedicaid Applications for Inmates

Washington: “Application for Apple Health (Medicaid) benefits is possible for inmates. Many correctional facilities are incorporating an application for Medicaid into their release planning activities. The agency must accept these applications when an anticipated release date is known that is not over 45 days into the future.”46 

Arizona: “A person may apply for medical assistance before being released, but cannot be approved until the actual date of release.”47 

Michigan: “An individual can remain eligible and an applicant can be determined eligible for Medicaid during a period of incarceration.”48 

A few states require corrections staff to facilitate the application process for individuals nearing release.49  For example, in Connecticut, the Department of Corrections and Department of Social Services have partnered to ensure that individuals who are discharged from a Department of Corrections facility continue to receive necessary health care upon re-entry into the community through Medicaid. The Department of Social Services has provided two eligibility workers dedicated solely to processing Medicaid applications for those individuals determined potentially eligible for assistance.50  Moreover, in New Hampshire, state prison and county jail staff initiate Medicaid applications for individuals nearing release by using an automated process or by completing and mailing all necessary forms to the Medicaid agency.51  Similarly, in Virginia, state prison staff must complete and submit a Medicaid application for individuals who need to be placed in a nursing facility upon release.52 

Outlining Responsibilities for Managed Care Plans

Under federal Medicaid law, states may enter into contracts with managed care entities to provide services to Medicaid beneficiaries.53  While federal law allows for several kinds of Medicaid managed care arrangements, most Medicaid managed care plans are “capitated” plans.54  This means that states pay plans a set amount each month for providing health care services to an enrollee. Over the past several decades, managed care has come to play an increasingly important role in Medicaid, with almost three-quarters of Medicaid beneficiaries now enrolled in some type of managed care arrangement.55  Given this fact, provisions in Medicaid managed care contracts may have implications for coverage and care of incarcerated individuals.

Through their contracts with Medicaid managed care entities, some states have taken steps to ensure that they do not make capitated payments on behalf of individuals who are incarcerated.56  As discussed above, individuals who are incarcerated are generally not eligible to receive services through Medicaid. As a result, when individuals who are enrolled in a managed care plan become incarcerated, the plan is no longer responsible for providing their care. States have adopted several approaches to ensure that that they do not continue to make capitated payments to managed care plans on behalf of enrollees who become incarcerated. For example, some state contracts exclude individuals who are incarcerated from enrolling in the managed care plan and/or provide for disenrollment from the plan when an enrollee becomes incarcerated.57  Adoption of such policies can facilitate the ability of states to discontinue capitated payments to plans during a period of incarceration without terminating Medicaid eligibility. Additionally, several contracts specify that the state will recoup a capitated payment made on behalf of an enrollee who becomes incarcerated. For example, Wisconsin’s Medicaid HMO contract indicates that the state will recoup a capitated payment when the enrollee cannot use HMO facilities. As a result, when an enrollee enters a correctional facility before the first day of the month for which the state made the payment, the state will recoup the payment.58 

Several states have Medicaid managed care contract provisions that require plans to provide care coordination services to individuals upon release from jail or prison. Medicaid managed care entities may be well-positioned to help Medicaid enrollees quickly access necessary community-based services during this time period. Colorado, for example, requires behavioral health plans to “collaborate with agencies responsible for the administration of jails, prisons and juvenile detention facilities to coordinate the discharge and transition” of enrollees.59  In addition to ensuring that enrollees leaving incarceration receive medically necessary behavioral health services, plans must propose innovative strategies to meet the needs of enrollees involved with the criminal justice system.60  Similarly, Florida requires Medicaid managed care plans to “make every effort…to provide medically necessary community-based services for Health Plan enrollees who have justice system involvement.”61  Among other things, plans must: (1) provide psychiatric services to enrollees and likely enrollees within 24 hours after release from a correctional facility; (2) ensure that enrollees are linked to services and receive routine care within 7 days after release; (3) conduct outreach to populations of enrollees “at risk of justice system involvement, as well as those Health Plan enrollees currently involved in this system, to assure that services are accessible and provided when necessary.”62  In addition, plans must work to develop agreements with correctional facilities that will enable the plans to anticipate the release of individuals who were enrolled prior to incarceration.63 

Conclusion

In conclusion, state Medicaid eligibility policies for incarcerated individuals vary significantly, and these policies affect if and when individuals may be enrolled in coverage and the scope of savings states may achieve from their coverage. Looking ahead, state policies will likely evolve given the growing importance of Medicaid for this population under the expansion. As policies continue to develop, it will be important to consider the implications of different state choices. Specifically, suspending rather than terminating eligibility for individuals who become incarcerated may help facilitate timely access to coverage and care upon release and may make it easier for states to access federal Medicaid reimbursement for inpatient services provided to individuals while incarcerated. In addition, explicitly allowing uninsured individuals to apply for and enroll in coverage prior to release and facilitating enrollment as part of re-entry planning can support timely access to coverage as individuals return to the community. Research suggests that coverage immediately upon release may lead to improved access to care and broader benefits. Gains in coverage among individuals returning to the community may contribute to savings in uncompensated care and other indigent care programs. Lastly, through managed care contracts, states can adopt policies that enable them to discontinue capitated payments to plans for enrollees who become incarcerated without terminating their Medicaid coverage. Moreover, managed care plans can play a key role in supporting individuals’ timely access to care as they return to the community, and states can outline and strengthen this role through contract provisions.

This brief was prepared by Catherine McKee and Sarah Somers with the National Health Law Program and Samantha Artiga and Alexandra Gates of the Kaiser Family Foundation.

Endnotes

  1. As noted in the methodology section, supra, our review did not assess whether and how states are enforcing their Medicaid managed care contracts. ↩︎
  2. E. Ann Carson, U.S. Dep’t of Justice, Office of Justice Programs, Bureau of Justice Statistics, Prisoners in 2013 at 1-2 (revised Sept. 30, 2014), available at http://www.bjs.gov/content/pub/pdf/p13.pdf; Todd D. Minton and Daniela Golinelli, U.S. Dep’t of Justice, Office of Justice Programs, Bureau of Justice Statistics, Jail Inmates and Midyear 2013: Statistical Tables (revised Aug. 14, 2014), available at http://www.bjs.gov/content/pub/pdf/jim13st.pdf. ↩︎
  3. See, e.g., Nat’l Comm’n on Correctional Health Care, The Health Status of Soon-To-Be-Released Inmates: A Report to Congress (2002). ↩︎
  4. David Cloud, Vera Institute of Justice, On Life Support: Public Health in the Age of Mass Incarceration 10 (2014) (citing Anne C. Spaulding, HIV/AIDS among Inmates of and Releasees from US Correctional Facilities, 2006: Declining Share of Epidemic but Persistent Public Health Opportunity, 4 PLOS One e7558 (2009)). ↩︎
  5. Id. at 9 (citing Seth J. Prins, Prevalence of Mental Illnesses in US State Prisons: A Systematic Review, 65 Psychiatric Services 862 (2014)). ↩︎
  6. Id. at 10 (citing Jennifer C. Karberg & Doris J. James, U.S. Dep’t of Justice, Office of Justice Programs, Bureau of Justice Statistics, Substance Dependence, Abuse, and Treatment of Jail Inmates, 2002 (2005); Seena Fazel et al., Substance abuse and dependence in prisoners: a systematic review, 101 Addiction 181 (2006); Bridget F. Grant et al., Prevalence and Co-occurrence of Substance Use Disorders and Independent Mood and Anxiety Disorders: Results From the National Epidemiologic Survey on Alcohol and Related Conditions, 61 Archives of General Psychiatry 807 (2004)). ↩︎
  7. Andrew P. Wilper et al., The Health and Health Care of US Prisoners: Results of a Nationwide Survey, 99 Am. J. Pub. Health 666, 668-69 (2009). ↩︎
  8. See, e.g., Emily A. Wang et al., Discharge Planning and Continuity of Health Care; Findings from the San Francisco County Jail, 98 Am. J. Pub. Health 2182 (2008) (finding approximately 90% of individuals who enter county jails have no health insurance); Kamala Mallik-Kane & Christy A. Visher, Urban Inst., Justice Policy Ctr., Health and Prisoner Reentry: How Physical, Mental, and Substance Abuse Conditions Shape the Process of Reintegration 13 (2008) (finding that 78% of men and 66% of women have no health insurance two to three months after release from prison). ↩︎
  9. 42 U.S.C. § 1396a(a)(10)(A). In addition, individuals must be residents of the state in which they apply and be citizens or have qualifying immigration status. ↩︎
  10. 42 U.S.C. § 1396d(a)(29)(A); 42 C.F.R. §§ 435.1009, 435.1010. ↩︎
  11. The Kaiser Family Foundation State Health Facts. Data Source: Current status for each state is based on KCMU tracking and analysis of state executive activity. Available at https://modern.kff.org/health-reform/state-indicator/state-activity-around-expanding-medicaid-under-the-affordable-care-act/ ↩︎
  12. See Letter from Robert A. Streimer, Dir., Disabled and Elderly Health Programs Grp., Ctr. for Medicaid and State Operations, Dep’t of Health & Human Servs., to All Associate Regional Adm’rs., Div. for Medicaid and State Operations 1 (Dec. 12, 1997); see also Health Care Finance Agency Program Issuance Transmittal Notice Region IV (Mar. 6, 1998) (transmitting policies set forth in the December 1997 policy letter to Medicaid agencies in AL, FL, GA, KY, MS, NC, SC, and TN). ↩︎
  13. Letter from Glenn Stanton, Acting Dir., Disabled and Elderly Health Programs Grp., Ctr. for Medicaid and State Operations, Dep’t of Health & Human Servs., to State Medicaid Directors 2 (May 25, 2004) (discussing strategies for ending chronic homelessness). ↩︎
  14. 42 U.S.C. § 1396a(a)(8). ↩︎
  15. 42 U.S.C. § 1396d(a)(29)(A); 42 C.F.R. § 435.1009. Medicaid regulations define inmate[s] of a public institution as individuals who are living in a public institution, unless they are: (1) “in a public educational or vocational training institution for purposes of securing educational or vocational training;” or (2) in a public institution for “a temporary period pending other arrangements appropriate to [their] needs.” 42 C.F.R. § 435.1010. A public institution is one that “is the responsibility of a governmental unit or over which a governmental unit exercises administrative control.” Id. CMS has further explained that the definition includes individuals “serving time for a criminal offense or confined involuntarily in State of Federal prisons, jails, detention facilities, or other penal facilities.” Letter from Robert A. Streimer, supra note 12, at 1. It also includes individuals held involuntarily in detention centers awaiting trial, people required to reside in wilderness camps that are under governmental control, and involuntary residents of halfway houses under governmental control. Letter from Robert A. Streimer, supra note 12, at 4. ↩︎
  16. 42 U.S.C. § 1396d(a)(29)(A); 42 C.F.R. §§ 435.1009, 435.1010. ↩︎
  17. Letter from Robert A. Streimer, supra note 12, at 3. ↩︎
  18. Ingrid A. Binswanger et al., Release from Prison – A High Risk of Death for Former Inmates, 356 N Eng. J. Med. 157, 160 (2007). ↩︎
  19. Id. at 165. See also Joseph P. Morrissey et al., Medicaid Enrollment and Mental Health Service Use Following Release of Jail Detainees with Severe Mental Illness, 57 Psychiatric Services 809 (2006) (finding that among individuals with severe mental illness, those enrolled in Medicaid at the time of their release from jail were more likely to use services, accessed the services more quickly, and received more days of services than those who were not enrolled in Medicaid). ↩︎
  20. Joseph P. Morrissey et al., The Role of Medicaid Enrollment and Outpatient Service Use in Jail Recidivism Among Persons With Serious Mental Illness, 58 Psychiatric Services 794 (2007). ↩︎
  21. See Letter from Glenn Stanton, supra note 13, at 1-2. ↩︎
  22. Id. ↩︎
  23. See 2015 N.M. Laws 127 (to be codified at N.M. Stat. Ann. § 27-2-4). ↩︎
  24. See, e.g., Unicameral Leg., LB12 (Neb. 2015). ↩︎
  25. See Colo Rev. Stat. Ann. § 25.5-4-205.5; Colo. Dep’t of Health Care Policy and Fin., HCPF 14-006, Medicaid Policy for Incarcerated or Inmates in a Correctional Facility 2 (2014), available at https://www.colorado.gov/pacific/sites/default/files/2014 Agency Letters Number 14-006.pdf.  See also Ct. Gen. Assembly, Office of Legislative Research, 2013-R-0288, The Affordable Care Act and Prisoners (2013), available at http://www.cga.ct.gov/2013/rpt/2013-R-0288.htm. ↩︎
  26. Fla. Stat. Ann. § 409.9025. ↩︎
  27. N.C. Dep’t of Health & Human Servs., Div. of Medical Assistance, Family And Children’s Medicaid Manual §3360 (updated 2015), available at http://info.dhhs.state.nc.us/olm/manuals/dma/fcm/man/. Moreover, individuals in certain eligibility categories cannot have their eligibility suspended. The Medicaid agency must evaluate these individuals for eligibility in other categories and transfer or terminate their eligibility as appropriate. Id. ↩︎
  28. Ariz Health Care Cost Containment Sys., Eligibility Policy Manual § 1502 (updated 2014), available at. https://www.healthearizonaplus.gov/PolicyManual/eligibilitypolicymanual/MA/MA1500/MA1502.V_Incarcerated.html ↩︎
  29. Id. Oregon also only suspends eligibility for Medicaid enrollees expected to remain incarcerated for no more than 12 months. Or. Rev. Stat. Ann. § 411.447. ↩︎
  30. See Iowa Code Ann. § 249A.38; Iowa Admin. Code R. § 75.12(1); Indiana Health Coverage Program Policy Manual § 2237.05.00 (undated), available at http://in.gov/fssa/files/Medicaid_Combined_PM.pdf. ↩︎
  31. Fl. Stat. Ann. § 409.9025(1)-(2). ↩︎
  32. N.C. Dep’t of Health & Human Servs., Div. of Medical Assistance, Family And Children’s Medicaid Manual §3360 (updated 2015), available at http://info.dhhs.state.nc.us/olm/manuals/dma/fcm/man/ ↩︎
  33. Indiana Health Coverage Program Policy Manual § 2237.05.00 (undated), available at http://in.gov/fssa/files/Medicaid_Combined_PM.pdf. ↩︎
  34. Deborah Bachrach, Patricia Boozang, & Dori Glanz, State Health Reform Assistance Network, The Report Wood Johnson Fdtn., States Expanding Medicaid see Significant Budget Savings and Revenue Gains, (2015), http://www.rwjf.org/en/library/research/2015/04/states-expanding-medicaid-see-significant-budget-savings-and-rev.html ↩︎
  35. Ibid. ↩︎
  36. Deloitte commissioned by Kentucky, Report on Medicaid Expansion in 2014, (2015), http://governor.ky.gov/healthierky/Documents/medicaid/Kentucky_Medicaid_Expansion_One-Year_Study_FINAL.pdf ↩︎
  37. Cf. Colo. Dep’t of Health Care Policy and Fin., HCPF 14-006, Medicaid Policy for Incarcerated or Inmates in a Correctional Facility 2 (2014), available at https://www.colorado.gov/pacific/sites/default/files/2014%20Agency%20Letters%20Number%2014-006.pdf (indicating that applications can be filed 24 hours after admission) with Kan. Dep’t of Health & Environment, Div. of Health Care Finance, Policy No: 2012-09-01, Inpatient Hospital Coverage for Inmates of State Correctional Institutions (2012), available at https://khap.kdhe.state.ks.us/kfmam/policydocs/Inmate%20Memo.pdf (indicating that applications should be filed after discharge). ↩︎
  38. Ariz. Health Care Cost Containment Sys., Eligibility Policy Manual § 1312 (updated 2014), available at https://www.healthearizonaplus.gov/PolicyManual/EPMPlus/index.html#page/MA/MA1300/MA1312.html. ↩︎
  39. Colo. Dep’t of Health Care Policy and Fin., HCPF 14-006, Medicaid Policy for Incarcerated or Inmates in a Correctional Facility 2 (2014), available at https://www.colorado.gov/pacific/sites/default/files/2014%20Agency%20Letters%20Number%2014-006.pdf. Similarly, in Oregon, the county jail must notify the Medicaid agency when an individual returns from the hospital so that the Medicaid agency can suspend eligibility. See Or. Health Authority, Div. of Medical Assistance Programs, Medicaid Eligibility for Inmates of Jails and Prisons 11, 23 (updated Sept. 2014), available at http://www.orpca.org/Oregon_Medicaid_Eligibility_Determinations_for_Inmates-UPDATED_9-14.pdf. ↩︎
  40. See, e.g., Kan. Dep’t of Health & Environment, Div. of Health Care Finance, Policy No: 2012-09-01, Inpatient Hospital Coverage for Inmates of State Correctional Institutions (2012), available at https://khap.kdhe.state.ks.us/kfmam/policydocs/Inmate%20Memo.pdf (outlining process for individuals in state custody);  N.H. Dep’t of Health & Human Servs., Div. of Family Assistance, Medical Assistance Manual (updated 2014), available at http://www.dhhs.nh.gov/MAM_HTM/newmam.htm (outlining process for individuals in state custody). ↩︎
  41. 42 U.S.C. § 1396a(a)(8). ↩︎
  42. See Letter from Robert Streimer, supra note 12, at 1; Letter from Glenn Stanton, supra note 13, at 2. ↩︎
  43. See 42 U.S.C. § 1396b(a)(7). ↩︎
  44. See, e.g., Va. Dep’t of Social Servs., Medicaid Manual § M0120.400F (updated 2013), available at https://www.dss.virginia.gov/files/division/bp/medical_assistance/manual_transmittals/manual/m01r.pdf;  Ariz. Health Care Cost Containment Sys., Eligibility Policy Manual §§ 1302, 1309, 1310 (updated 2014), available at https://www.healthearizonaplus.gov/PolicyManual/EPMPlus/index.html#page/MA/MA1300/MA1312.html. ↩︎
  45. See Mich. Comp. Laws Ann. § 400.106b; N.C. Dep’t of Health & Human Servs., Div. of Medical Assistance, Family And Children’s Medicaid Manual § 3360 (updated 2015), available at http://info.dhhs.state.nc.us/olm/manuals/dma/fcm/man/. ↩︎
  46. WA Health Care Authority, Apple Health (Medicaid) Manual Incarceration Overview (updated November 10, 2014), available at http://www.hca.wa.gov/medicaid/manual/Pages/90-110.aspx ↩︎
  47. AZ Health Care Cost Containment System (AHCCCS) Eligibility Policy Manual for Medical, Nutrition, and Cash Assistance §525, available at https://www.healthearizonaplus.gov/PolicyManual/eligibilitypolicymanual/index.html#page/MA/MA500/MA0525.html ↩︎
  48. Michigan Department of Community Health Modified Adjusted Gross Income (MAGI) Related Eligibility Manual, available at http://www.michigan.gov/documents/mdch/MAGI_Manual_457706_7.pdf ↩︎
  49. State or local corrections policies may also contain such requirements. Examining these corrections policies was beyond the scope of our review, which focused on Medicaid statutes, regulations, and policies. ↩︎
  50. Cohen, R., OLR Research Report, The Affordable Care Act and Prisoners, August 13, 2013, available at: http://www.cga.ct.gov/2013/rpt/2013-R-0288.htm ↩︎
  51. N.H. Dep’t of Health & Human Servs., Medical Assistance Manual § 175.01 (2014), available at http://www.dhhs.nh.gov/MAM_HTM/newmam.htm. ↩︎
  52. Va. Dep’t of Social Servs., Medicaid Manual § M0120.500F (updated 2013), available at https://www.dss.virginia.gov/files/division/bp/medical_assistance/manual_transmittals/manual/m01r.pdf ↩︎
  53. See generally 42 U.S.C. §§ 1396b(m), 1396d(t), 1396u-2. ↩︎
  54. See 42 U.S.C. §§ 1396u-2(a)(1)(B), 1396b(m)(1)(A) (managed care organizations), 1396d(a)(25), 1396d(t) (primary care case managers); 42 C.F.R. § 438.2 (prepaid health plans). ↩︎
  55. Ctrs. For Medicare & Medicaid Servs., Medicaid Managed Care Enrollment Report: Summary Statistics As Of July 1, 2011, at 4, available at http://www.medicaid.gov/Medicaid-CHIP-Program-Information/By-Topics/Data-and-Systems/Downloads/2011-Medicaid-MC-Enrollment-Report.pdf. ↩︎
  56. As noted in the methodology section, supra, our review did not assess whether and how states are enforcing their Medicaid managed care contracts. ↩︎
  57. See, e.g., Ky. Dep’t for Medicaid Servs., Medicaid Managed Care Contract Between the Commonwealth of Kentucky on Behalf of Department for Medicaid Services and Anthem Health Plans of Kentucky, Inc. 86-88 (undated) (contract to expire June 30, 2015). ↩︎
  58. Wis. Dep’t of Health Servs., Contract for BadgerCare Plus and/or Medicaid SSI HMO Services for Jan. 1, 2014 – Dec. 31, 2015, at 144 (2014). The term “public institution” is not limited to penal institutions. See id. at 19; 42 C.F.R. § 435.1010. ↩︎
  59. See, e.g., Colo. Dep’t of Health Care Policy & Financing, Contract with Behavioral Healthcare, Inc. for Behavioral Health Services Program 17 (undated) (contract to expire June 30, 2015 unless sooner terminated or further extended). ↩︎
  60. Id. at 17-18. ↩︎
  61. Fla. Agency for Health Care Admin., 2012-2015 Health Plan Model Contract Attachment II – Core Contract Provisions 125 (undated). ↩︎
  62. Id. ↩︎
  63. Id. ↩︎
News Release

The Connection Between Health Coverage and Income Security

Published: Aug 3, 2015

Using data from a new Kaiser Family Foundation panel survey following the uninsured in California who gained coverage since 2010, Drew Altman’s latest column in The Wall Street Journal’s Think Tank shows how expanding health coverage and improving economic security for working Americans are connected even though they are often part of separate policy debates.

All previous columns by Drew Altman are available online.

Medicaid Expansion in Pennsylvania: Transition from Waiver to Traditional Coverage

Published: Aug 3, 2015

As of July 2015, 31 states (including DC) have adopted the Affordable Care Act’s (ACA) Medicaid expansion to low-income adults, creating a new coverage option for adults who were previously excluded from the program. While the majority of these states expanded Medicaid as envisioned by the ACA, four states (Arkansas, Indiana, Iowa, and Michigan) have implemented the Medicaid expansion using a Section 1115 demonstration, and a fifth state (New Hampshire) will transition to demonstration authority as of 2016. A sixth state, Pennsylvania, had implemented the Medicaid expansion using a Section 1115 demonstration under Governor Tom Corbett, but later changed to a traditional Medicaid expansion under Governor Tom Wolf. This fact sheet describes Pennsylvania’s transition from waiver to traditional expansion coverage, which may inform other states’ expansion decisions.

History of Medicaid Expansion in Pennsylvania

On August 28, 2014, the Centers for Medicare and Medicaid Services (CMS) approved Pennsylvania’s Section 1115 demonstration to implement the ACA’s Medicaid expansion under then Governor Tom Corbett. In addition, Governor Corbett’s Medicaid expansion plan sought benefit package changes for current and newly eligible beneficiaries, which were made through a state plan amendment (SPA).   The Medicaid expansion demonstration was implemented on January 1, 2015.

In February 2015, newly-elected Governor Tom Wolf announced that Pennsylvania would transition from the waiver Medicaid expansion to a SPA Medicaid expansion and remove the benefit package changes made by Governor Corbett’s administration.1  The transition will mostly affect newly eligible adults ages 21 to 64 in Pennsylvania with incomes up to 138% of the federal poverty level (FPL, $11,770 per year for an individual in 2015). Under Governor Wolf’s plan, all newly eligible Medicaid beneficiaries enrolled in the new managed care plans created by the waiver will transition to the state’s pre-existing Medicaid managed care plans, and the three benefit packages created under Governor Corbett’s plan will be replaced with one benefit package. The transition to Governor Wolf’s expansion plan is scheduled to be completed by September 30, 2015.2 

Pennsylvania’s Waiver to SPA Transition

The state will complete the transition in two phases:3 

  • Phase 1: From April 2015 to June 1, 2015, beneficiaries who were enrolled in Medicaid expansion waiver coverage in December 2014 (through the new managed care plans created by the waiver) were moved to SPA Medicaid expansion coverage (in the pre-existing managed care plans).4 
  • Phase 2: From July 1, 2015 to September 30, 2015, beneficiaries who were enrolled in Medicaid expansion waiver coverage between January 2015 and April 2015 (in the new managed care plans created by the waiver) are moving to SPA Medicaid expansion coverage (through the pre-existing Medicaid managed care plans).

Individuals determined eligible for Medicaid after April 2015 have been enrolling directly into the traditional Medicaid expansion and receiving services through the pre-existing Medicaid managed care plans. Additionally, non-emergency medical transportation, which was waived for one year as part of the demonstration, has been reinstated across the state. Lastly, the transition to traditional Medicaid expansion removes beneficiary premiums and the healthy behaviors program which were part of the waiver.

Governor Corbett’s waiver enrolled healthy newly eligible Medicaid beneficiaries into newly created Medicaid managed care plans called the “Private Coverage Option.” While the new managed care plans were mostly offered by the same insurance companies and closely mirrored the structure of managed care plans in place prior to the waiver, the new managed care plans required cost sharing and offered a slimmer benefit package than the package offered by managed care plans.

Under Governor Corbett’s plan, Pennsylvania sought benefit package changes for current and newly eligible beneficiaries through a SPA by creating three benefit packages: a “high risk” package for people who are medically frail, a “low risk” package for other beneficiaries who were eligible for Medicaid before Pennsylvania expanded coverage, and a managed care-like plan for healthy adults enrolled in the newly eligible adult group. As part of the transition, the state will consolidate these three packages into one adult benefit package. The new adult benefit package modifies the high and low risk packages to comply with the essential health benefit requirements established by the ACA and federal mental health parity requirements. It also covers Early and Periodic Screening, Diagnosis and Treatment services for individuals in the new adult group up to age 21 and non-emergency medical transportation for all beneficiaries.5 

In addition, because CMS indicated it would not approve a work requirement as a condition of Medicaid eligibility, Pennsylvania amended its waiver application to include a voluntary work search program for current and newly eligible beneficiaries. These elements were not included as part of the demonstration approved by CMS, and instead Governor Corbett planned to offer incentives for job training and work-related activities for Medicaid beneficiaries who chose to participate in a state-funded program.6   Governor Wolf’s administration has not continued to pursue the incentives for job training and work-related activities.

To ensure that beneficiaries are aware of how the transition affects them, especially how their benefits and coverage are changing, Governor Wolf’s administration has posted updates about the transition to the state website and sent beneficiaries letters explaining the transition. The letters are causing confusion because the transition began soon after the waiver was implemented and beneficiaries were informed about being enrolled in one coverage type and then quickly changed to another. However, once the transition is complete, all beneficiaries will receive the same benefit package regardless of their coverage group or health status, and the same Medicaid managed care plans will serve all beneficiaries.  In addition, the state will be relieved of some of the administrative complexities of the previous waiver.  For example, the state will not have to track or administer premium payments, multiple benefit packages, or healthy behavior incentives.  Overall, while the transition period is somewhat complicated, the end result should be a more streamlined, straightforward program for Pennsylvania and Medicaid beneficiaries.

Table 1 compares Pennsylvania’s SPA expansion under Governor Wolf to the waiver expansion under Governor Corbett.

Table 1:  Comparing SPA expansion Under Governor Wolf to Section 1115 Medicaid Expansion Demonstration Waiver Approved Under Governor Corbett, Effective 1/1/15 to 9/30/2015
ElementSPA ProvisionsWaiver Provisions
Coverage Groups:Covers newly eligible parents between 33-138% FPL and newly eligible adults without dependent children between 0-138% FPL through Medicaid managed care.
Premiums:No premiums.Beginning in year 2, state may have charged monthly premiums up to 2% of household income for newly eligible adults and certain currently eligible beneficiaries above 100% FPL.
Co-Payments:Nominal copays consistent with current law.7 All demonstration beneficiaries would have paid state plan co-payments in demonstration year 1..In demonstration year 2, beneficiaries who would have been subject to monthly premiums would only have had co-payments for non-emergency use of the emergency room ($8 per state plan amount).
Healthy Behavior Incentives:No healthy behaviors incentives.Beneficiaries could have reduced their premiums or co-payments by completing healthy behaviors in the prior year beginning demonstration year 2.
Delivery Systems and Benefits: Delivery System: Existing Medicaid Managed Care Organizations.Benefits: One benefit package for all beneficiaries.Delivery System: Medicaid managed care organizations designed specifically for newly eligible adults..Benefits: Three benefit packages for different types of beneficiaries (packages are explained above).
Evaluation:No evaluation.State would have submitted draft evaluation plan within 120 days of waiver approval.
Reporting:Federal/state oversight consistent with traditional Medicaid managed care.State would have submitted quarterly and annual reports to CMS.


  1. Health Choices PA (Pennsylvania Department of Human Services, 2015), http://www.healthchoicespa.com/. ↩︎
  2. Pennsylvania Department of Human Services News Release, “Pennsylvania Releases Detailed Medicaid Expansion Timeline,” (March 9, 2015), http://listserv.dpw.state.pa.us/scripts/wa.exe?A3=ind15&L=NEWS-RELEASES&E=quoted-printable&P=496868&B=–_000_390C74D65912E345AFF2FFADF656E68DFD7D72C430ENHBGMBX02PAL_&T=text%2Fhtml;%20charset=us-ascii&XSS=3. ↩︎
  3. Pennsylvania Department of Human Services News Release, “Pennsylvania Releases Detailed Medicaid Expansion Timeline,” (March 9, 2015), http://listserv.dpw.state.pa.us/scripts/wa.exe?A3=ind15&L=NEWS-RELEASES&E=quoted-printable&P=496868&B=–_000_390C74D65912E345AFF2FFADF656E68DFD7D72C430ENHBGMBX02PAL_&T=text%2Fhtml;%20charset=us-ascii&XSS=3. ↩︎
  4. Some state documents indicate beneficiaries enrolled in the Select Plan (family planning plan) will be transferred from waiver coverage to traditional coverage in Phase 1. ↩︎
  5. Additionally, compared to the high and low risk benefit package in Governor Corbett’s expansion, the new adult benefit package removes the inpatient rehabilitation hospital limit of one admission per year, the inpatient psychiatric hospital limit of 30 days per year, the six prescription drug limit per month, and the outpatient psychiatric and drug and alcohol treatment limits. ↩︎
  6. Letter from Marilyn Tavenner, CMS Administrator, to Secretary Beverly Mackereth (Aug. 28, 2014), available at http://www.medicaid.gov/Medicaid-CHIP-Program-Information/By-Topics/Waivers/1115/downloads/pa/pa-healthy-ca.pdf. ↩︎
  7. See Table 18 of Modern Era Medicaid: Findings from a 50-State Survey of Eligibility, Enrollment, Renewal, and Cost-Sharing Policies in Medicaid and CHIP as of January 2015, Kaiser Family Foundation, January 20, 2015. https://modern.kff.org/medicaid/report/modern-era-medicaid-findings-from-a-50-state-survey-of-eligibility-enrollment-renewal-and-cost-sharing-policies-in-medicaid-and-chip-as-of-january-2015/ ↩︎

California’s Previously Uninsured After The ACA’s Second Open Enrollment Period

Authors: Bianca DiJulio, Jamie Firth, and Mollyann Brodie
Published: Jul 30, 2015

Executive Summary

The Kaiser Family Foundation California Longitudinal Panel Survey is a series of surveys that, over time, tracks the experiences and views of a representative, randomly selected sample of Californians who were uninsured prior to the major coverage expansions under the Affordable Care Act (ACA). The initial baseline survey was conducted with a representative sample of 2,001 nonelderly uninsured Californian adults in summer 2013, prior to the ACA’s initial open enrollment period. After the first open enrollment period concluded in spring 2014, the second survey in the series followed up with the same group of previously uninsured Californians who participated in the baseline (a longitudinal panel survey). The third in the series, and the focus of this report, followed up with them again after the second open enrollment period in spring 2015 to find out whether more have gained coverage, lost coverage, or remained uninsured, what barriers to coverage remain, how those who now have insurance view their coverage, and to assess the impacts that gaining health insurance may have had on financial security and access to care. A fourth survey in the series will keep tracking these individuals as the expansions and changes in California continue under the ACA. The surveys are designed and analyzed by researchers at KFF and the fieldwork costs associated with the spring 2014 and spring 2015 surveys were paid for by The California Endowment.

This longitudinal panel study allows us to follow a large group of randomly selected uninsured Californians and assess how their insurance status changes over time to learn more about why those changes did or did not occurr, and what gaining health insurance means for their daily lives without having to rely on respondents ability to report and recall details from months or years ago. By tracking a scientifically representative panel, we can quantify how widespread or limited certain problems or changes that may have been reported anecdotally actually were.  Statistically representative narratives and stories from individual’s actual experiences can then be drawn from the sample to illuminate more accurately how the uninsured fare as the law is implemented in California.

Key Findings

After two rounds of open enrollment under the Affordable Care Act, 68 percent of Californians who were uninsured prior to the first open enrollment period now report that they have health insurance, referred to in this report as the “recently insured.” This share is up from 58 percent after the first open enrollment period in the spring of 2014. The largest share of California’s previously uninsured, a third (34 percent), say they have coverage thought the state’s Medicaid program, Medi-Cal, up from 25 percent after the first open enrollment period. In addition, 14 percent say they are insured through an employer, 12 percent say they have a plan through Covered California, the state’s health insurance marketplace where people can shop for and compare health insurance plans and access federal subsidies for coverage, and another 7 percent say they have other non-group coverage or insurance through some other source. About a third (32 percent) report being currently uninsured, referred to in this report as the “remaining uninsured.” Because the same group of previously uninsured people has been followed over time, the survey is also able to explore the dynamics of health insurance and track how many people have moved in to or back out of coverage since the baseline survey in 2013.

Coverage Among Key Groups

Enrollment rates for whites and Hispanics are similar (79 percent for whites and 74 percent for eligible Hispanics) when excluding those Hispanics who are likely to be ineligible for financial assistance through Covered California or Medi-Cal due to their immigration status. In addition, just over half (53 percent) of those who say they’ve spent their lifetime without insurance now report having coverage, significantly lower than the more than 7 in 10 who said they had insurance at some point in the past who report gaining coverage since the health care law was implemented. Still, the gains in coverage among those who report never having coverage are notable.

Gains In Financial Security And Health Needs Being Met For Recently Insured

The survey finds significant improvements in perceptions of health care affordability and access to care for the recently insured, but that affordability and access issues remain even for those who gained coverage. Those who have gained insurance are much less likely than they were in the baseline survey to report problems paying for medical bills in the past 12 months (23 percent now, compared to 45 percent in 2013) or difficulty affording health care (49 percent now, compared to 86 percent in 2013). They also are more likely to now report that their health needs are being met (86 percent now, compared to 51 percent in 2013) and that they now have a usual source of care to go to when they are sick or need medical advice (76 percent now, compared to 60 percent in 2013). For those who have remained uninsured, they report having difficulty affording care, problems paying for medical bills, their health needs being met, or having a usual source of care at similar rates as they did in the baseline survey.

Most Rate Plan Favorably, But Some Report Access Challenges

While most of California’s recently insured (76 percent) report positive experiences with their current plan and say they are satisfied with their plan’s choice of primary care doctors (79 percent), hospitals (75 percent), and specialists (67 percent), some say they have experienced problems accessing care in the past year. For example, 16 percent of the recently insured say they have been told by a doctor’s office in the past year that they would not accept them as a new patient and 28 percent say that within the past year they have had to wait longer than they thought was reasonable for a medical appointment.

Remaining Uninsured Are Largely Long-Term Uninsured Or Ineligible For ACA Coverage

Many of California’s remaining uninsured have had little interaction with the health insurance system in the years prior to the ACA implementation. Four in 10 (41 percent) of the remaining uninsured are undocumented immigrants who are not eligible for Medi-Cal or assistance through Covered California and 43 percent are likely eligible for coverage but had been without coverage for two years or more or never had insurance as of the baseline survey. In addition, 70 percent of the remaining uninsured are Hispanic, including 41 percent who are Hispanic undocumented immigrants and 29 percent who are Hispanics likely eligible for coverage under the ACA. Immigration concerns may be a barrier for some Hispanics to enroll in coverage; half of remaining uninsured Hispanics report being worried that if they sign up for health insurance they will draw attention to their immigration status or that of a family member.

Key Findings: Introduction

This report is the latest in the California Longitudinal Panel Survey series examining how previously uninsured Californians navigate the health care system as the Affordable Care Act (ACA) goes into effect. Prior to the enactment of the health care law, California had the largest non-elderly uninsured adult population in the nation, at nearly 6 million.1  The state eagerly adopted options under the ACA to expand coverage to more low- and moderate-income people, primarily through the development of Covered California, the state’s marketplace where people can shop for and compare health plans and access financial help to purchase insurance, and by expanding eligibility for Medi-Cal, the state’s Medicaid program, to include parents and adults without dependent children earning 138% of the federal poverty level (FPL) or less (about $33,465 annually for a family of 4 in 2015). As an early adopter with large numbers of uninsured, California is a particularly valuable place to track how the rollout of the health care law has impacted the state’s uninsured, and its progress and challenges can help inform future enrollment efforts state-wide and nationally.

To track the experiences and perceptions of California’s uninsured as the ACA is implemented, the Kaiser Family Foundation is conducting the California Longitudinal Panel Survey series, following the same group of randomly selected Californians over time who were uninsured prior to the major coverage expansions under the ACA. The initial baseline survey was conducted with a representative sample of 2,001 nonelderly uninsured Californian adults in summer 2013, prior to the ACA’s initial open enrollment period.2  It found that most of the state’s uninsured said they wanted insurance but that most didn’t think they could afford it, as the vast majority reported family incomes under 400% FPL (about $94,000 a year for a family of 4 in 2013). At that time, the first open enrollment period under the ACA was just a couple months away and many of California’s uninsured were unaware of the upcoming coverage expansion opportunities and were unsure of how the law would impact them.

After the first open enrollment concluded in spring 2014, the second survey in the series followed up with the same group of previously uninsured Californians to find out whether they gained coverage or remained uninsured, how they felt about and interacted with the new coverage options, and what barriers to getting insurance remained.3  Many (58 percent) of California’s previously uninsured reported having health insurance at the close of the first open enrollment period. Most reported that shopping for coverage went smoothly, however some expressed difficulty affording the cost of coverage. Still, about 4 in 10 remained uninsured, despite the fact that many reported incomes that put them in the group likely eligible for Medi-Cal or for financial assistance through Covered California.

The third survey in the series, and the focus this report, returns to the same group of previously uninsured Californians a year later, after the second open enrollment period, to determine whether more of them had gained coverage, if some had moved out of coverage and back to being uninsured, and what their ongoing experience has been with their health insurance or the health care system more generally.

Figure 1

One additional survey in the series will continue to track these individuals as the expansions and changes in California under the ACA become the status quo as time passes. While the surveys are generally timed around the ACA’s open enrollment periods, it is important to note that eligible individuals are able to enroll in Medi-Cal year round.

California has made considerable strides in enrolling eligible low- and moderate-income people in new coverage options under the ACA. During the first open enrollment period, about 1.6 million people enrolled in Medi-Cal and 1.4 million people enrolled in Covered California.4  During the second open enrollment period, many renewed their coverage  and nearly 500,000 new enrollees signed up for plans through Covered California and more than 780,000 signed up for Medi-Cal.5  By following a representative group of Californians who were uninsured prior to the ACA’s coverage expansions, a key target of the ACA, we can better understand how these new coverage opportunities have impacted this group’s ability to access coverage and gain insight into their interactions with these new pathways to coverage.

While the ACA makes it easier for some people to get and keep coverage, other people will move in and out of coverage due to job status changes, shifts in income that change their eligibility for public subsidies or coverage, or missed deadlines for enrollment. While many previously uninsured Californians now have insurance, other Californians who had insurance prior to the ACA’s coverage expansions may now be uninsured, a group whose experiences and movements within the health care system are not captured in this series of surveys. As a result, this survey does not estimate the overall change in the number of uninsured Californians since the start of open enrollment, but instead estimates the share of previously uninsured who gained coverage.

Key Findings: Section 1: Coverage Gains Among The Previously Uninsured

Enrollment

After two rounds of open enrollment under the Affordable Care Act, 68 percent of Californians who were uninsured prior to the first open enrollment period now report that they have health insurance, up from 58 percent after the first open enrollment period in the spring of 2014. About a third (32 percent) report being currently uninsured, a group referred to throughout this report as the “remaining uninsured;” this share is down from 42 percent in the spring of 2014. Excluding those who are likely ineligible for coverage under the ACA due to their immigration status,6  77 percent of California’s eligible remaining uninsured now reports having coverage.

Figure 2

Those previously uninsured Californians who now report after the second open enrollment period that they have health insurance (68 percent), referred to throughout this report as “California’s recently insured,” say they gained coverage from several different sources. The largest share of California’s previously uninsured, a third (34 percent), say they have coverage through the state’s Medicaid program, Medi-Cal, up from 25 percent after the first open enrollment period.  In addition, 14 percent currently say they are insured through an employer, 12 percent say they have a plan through Covered California, the state’s health insurance marketplace where people can shop for and compare health insurance plans and access federal subsidies for coverage, and another 7 percent say they have other non-group coverage or insurance through some other source.7 

Figure 3

Who Now Has Coverage?

Because Latinos made up over half of the uninsured adult population prior to the ACA’s coverage expansions, particular attention has been paid to enrollment among this group. Currently, roughly 6 in 10 (59 percent) Hispanics who were uninsured prior to the first open enrollment period in summer 2013 report now having coverage, much lower than the 79 percent of previously uninsured whites who say they are insured. However, excluding the 1 in 3 previously uninsured Latinos who are likely to be ineligible for financial assistance through Covered California or Medi-Cal due to their immigration status,8  74 percent of eligible Latinos say they now have coverage, a share nearly equivalent to that for whites.

Figure 4

In addition, similar shares of many other demographic groups now report having coverage, such as men and women, people of different ages and people of different employment status. However, some groups have made particular gains in coverage or lagged somewhat behind. For example, previously uninsured people who report being in good health are more likely to say they have coverage than those who report being in fair or poor health (71 percent vs. 62 percent). In contrast, those who report having a debilitating chronic disease that keeps them from fully participating in work or other activities are more likely to say they have coverage now than those without significant chronic disease (78 percent vs. 66 percent). Just over half (53 percent) of those who say they’ve spent their lifetime without insurance now report having coverage, significantly lower than the more than 7 in 10 who said they had insurance at some point in the past who report gaining coverage since the health care law was implemented. Still, the gains in coverage among those who report never having coverage are notable. (Table 1)

Table 1: Percentage Of Each Group Of Previously Uninsured Reporting That They Are Recently Insured Or Remain Uninsured
TOTAL RECENTLY INSURED IN 2015COVERAGE TYPE IN 2015TOTAL REMAINING UNINSURED IN 2015
Medi-CalCovered CaliforniaOther Non-GroupEmployer-Sponsored Insurance
TOTAL68%34%12%2%14%32%
AGE19-3468%32%11%1%20%32%
35-4962%33%11%2%12%38%
50-6471%37%17%2%10%28%
RACEWhite non-Hispanic79%29%21%2%20%21%
Hispanic (NET)59%31%7%2%13%41%
Hispanic, Eligible74%41%10%2%16%25%
GENDERMale65%28%10%2%18%35%
Female71%40%15%1%11%29%
LENGTH OF TIME UNINSURED PRIOR TO ACA2mo – <1 year75%32%16%2%22%25%
1 year to <2 years74%47%7%1%15%26%
2 or more years72%35%15%2%13%27%
Never had insurance53%26%9%1%13%47%
EMPLOYMENTEmployed65%26%15%1%20%34%
Unemployed74%47%7%3%5%26%
A student, retired, on disability, or stay at home parent70%45%10%2%5%30%
EDUCATIONHigh school or less61%37%8%1%11%39%
Some college75%34%15%1%18%25%
College or more82%20%28%3%23%18%
HEALTH STATUSExcellent/ Very good/ Good71%33%15%2%15%29%
Fair/ Poor62%34%7%1%13%38%
MARITAL STATUSMarried69%31%13%2%18%30%
Not married67%35%12%1%12%33%
FAMILY INCOMELess than 138% FPL65%48%6%<1%7%34%
Between 138% – 400% FPL71%18%21%3%21%29%
DEBILITATING CHRONIC CONDITIONYes78%43%14%2%11%21%
No66%32%12%1%15%34%

Being contacted by phone, email or a door-to-door visit about signing up for health insurance appears to have played a role in some of California’s previously uninsured gaining or keeping coverage. Three-quarters (76 percent) of those who say they were personally contacted since November 15th say they now have coverage, compared to 64 percent of those who report that they were not contacted. At the same time, there is no statistical difference in gains in coverage for those who report seeing commercials in the past 30 days having to do with the health care law, Covered California or Medi-Cal and those who say they didn’t see such ads (70 percent vs. 62 percent).

Figure 5

Many of these factors tend to be interconnected so in order to isolate which personal elements best predict who of California’s previously uninsured now has coverage, we conducted a regression analysis with demographic factors and outreach indicators. This analysis showed two factors mattered most. Previously uninsured Californians who say they are still uninsured are more likely to be undocumented immigrants or say they never had insurance, even after accounting for a variety of other demographic factors such as age, race/ethnicity, sex, and education.9 

Views Of ACA’s Personal Impact Vary By Coverage Status And Type

Previously uninsured Californians vary in their opinion of the ACA’s impact on their lives. Large shares say the law has had no direct impact on them or their families; however, not surprisingly, the remaining uninsured are more likely to hold this view than those who have recently gained insurance in the two years since the law was implemented (66 percent vs. 44 percent). Additionally, those with recent insurance are more likely to say the ACA has helped them (41 percent) than hurt them (14 percent), while those who remain uninsured are more likely to say the law has hurt them rather than helped them (22 percent vs. 8 percent).

Among the recently insured, perceptions of the ACA’s personal impact vary by plan type. Those who report receiving coverage through Covered California and Medi-Cal are more likely to say the law has helped them than those who report having employer-sponsored insurance. About 6 in 10 (62 percent) of those enrolled through Covered California and about 4 in 10 (43 percent) of those with Medi-Cal coverage say the law has helped them. Most with recent coverage through an employer say they have felt no direct impact (59 percent), and for those who have, they are evenly divided on whether they have been helped or hurt (20 percent vs. 21 percent).

Figure 6

Dynamics In Enrollment And Coverage

People tend to move in and out of coverage as their income, employment status and other life factors change, particularly those with lower-incomes or recent experience being uninsured. One of the primary advantages of a longitudinal panel survey is the ability to examine these movements by following the same group of people over time.

Many (50 percent) Californians who reported being uninsured prior to the ACA’s first open enrollment period, reported gaining insurance in the spring 2014, after the first open enrollment period, and also now say they have coverage after the second open enrollment period in spring 2015, referred to here as those “still insured.”10  While these people may have fluctuated in and out of coverage or changed plans over the course of the year, they are not necessarily new to health insurance. Another 19 percent of California’s previously uninsured are more likely to be new to their coverage because they reported being uninsured after the first open enrollment period in the spring of 2014. This group is referred to here as the “newly insured.”11 

In addition, 23 percent of people reported being uninsured after both open enrollment periods and another 8 percent said they had coverage after the first open enrollment period but now say they are without health insurance. These groups combined are referred to here as the “remaining uninsured.”

Figure 7

These groups are worth a closer look to better understand who took longer to gain coverage, who went back to being uninsured, who remains without coverage, and who continues to report having coverage. Majorities of the remaining uninsured (69 percent) are Hispanic, compared to 43 percent of those still insured. In addition, the newly insured (59 percent) are more likely to be men than those still insured (44 percent). A striking 40 percent of the remaining uninsured said during the baseline survey prior to the ACA’s first open enrollment period that they have never had insurance, while smaller shares of the newly insured (23 percent) and the still insured (18 percent) say they have never had coverage. Those who are still insured (19 percent) are more likely to say they have a debilitating chronic condition than the newly insured (10 percent) or remaining uninsured (9 percent). (Table 2)

Table 2: Demographics Of Each Group Of Previously Uninsured Californians*
 NEWLY INSURED IN 2015 (19%)STILL INSURED IN 2015 (50%)REMAINING UNINSURED IN 2015 (31%)
AGE19-3432%39%34%
35-4934%26%40%
50-6430%31%24%
65+4%4%1%
RACEWhite non-Hispanic34%34%20%
Black non-Hispanic9%6%3%
Other non-Hispanic2%16%7%
Hispanic53%43%69%
Hispanic, eligible42%37%26%
Hispanic, undocumented11%6%41%
GENDERMale59%44%53%
Female41%56%47%
LENGTH OF TIME UNINSURED PRIOR TO ACA2 months to less than a year8%18%9%
1 year to less than 2 years15%18%11%
2 years or more53%46%41%
Never had insurance23%18%40%
EMPLOYMENTEmployed68%56%63%
Unemployed13%15%14%
A student, retired, on disability, or stay at home parent19%29%23%
EDUCATIONHigh school or less53%47%70%
Some college37%33%23%
College or more10%19%6%
HEALTH STATUSExcellent/ Very good/ Good59%69%61%
Fair/ Poor41%31%39%
MARITAL STATUSMarried41%38%37%
Not married59%62%62%
FAMILY INCOMELess than 138% FPL56%54%61%
Between 138% – 400% FPL40%39%34%
Over 400% FPL4%6%5%
DEBILITATING CHRONIC CONDITIONYes10%19%9%
No90%79%90%
SAW OR HEARD ANY ADSYes, saw or heard ads70%70%61%
No, did not see or hear ads30%30%39%
PERSONALLY CONTACTEDYes, been contacted26%34%19%
No, have not been contacted74%66%81%
*Based on those who completed the survey in spring 2014 and spring 2015, after each open enrollment period.

Key Findings: Section 2: Financial Security, Access To Care, And Health Insurance

Problems Paying Bills And Affording Care

Having health insurance appears to have eased some of the financial burden for previously uninsured Californians. About half (49 percent) of those who report now having coverage after the second open enrollment period say it is difficult to afford health care, while 86 percent of them said the same thing when they were uninsured in summer 2013, prior to the first open enrollment period. For those who have remained uninsured, there has been no substantial change in the large majority who say they have a difficult time affording care (85 percent vs. 81 percent in summer 2013). Additionally, those who report having health insurance now are about half as likely to say they have had problems paying medical bills in the past year than they did when they were uninsured in summer 2013 (23 percent vs. 45 percent) and that these bills have had a major financial impact (11 percent vs. 27 percent).

Figure 8

For those who report currently having health insurance in spring 2015 after the second open enrollment period, affording health care falls among one of several household expenses people say they have difficulty affording. But, for those who remain uninsured, health care is the most frequently cited burdensome household expense, with over 8 in 10 (85 percent) saying it is at least somewhat difficult to afford.

Figure 9

Even with some saying coverage is difficult to afford, overall, about half (53 percent) of previously uninsured Californians who have recently gained coverage say that having health insurance makes them feel more financially secure. Just over a third (36 percent) say it doesn’t make much of a difference, and a smaller share (10 percent) say it makes them feel less financially secure. In addition, most (62 percent) of those now with insurance say they feel well-protected by their health insurance, but a third say they feel vulnerable to medical bills.

Figure 10

While many who have recently gained insurance report feeling more financially secure as a result of their coverage, a quarter of the recently insured report forgoing needed medical care in the past year due to cost, similar to the share of those remaining without insurance (31 percent). These shares may be similar due to the fact that most of California’s previously uninsured are lower income and face general affordability challenges. Further, some recently insured say they don’t understand the health care services their plan provides or what they have to pay to use services. Those recently insured who report not understanding their health insurance are more likely to report forgoing care than those who say they understand their health insurance at least somewhat well.

Table 3: Understanding Of Health Insurance And Likelihood Of Forgoing Medical Care
REMAINING UNINSUREDRECENTLY INSURED
Total Recently InsuredUnderstand Coverage Somewhat/ Very Well (64%)Understand Coverage Not Too/ Not At All Well (35%)Understand Cost Somewhat/ Very Well (71%)Understand Cost Not Too/ Not At All Well (27%)
Was there a time over the past twelve months when you needed medical care, but did not get it because of the cost, or not?
Yes31%25%18%37%19%40%
No69%75%82%63%81%60%

Changes In Reports Of Health Needs Being Met Or Having A Usual Source Of Care

In addition to feeling less financial burden from health costs, those who say they have gained insurance recently are also more likely to report that their health needs are being met now that they have insurance compared to when they were uninsured – nearly 9 in 10 (86 percent) now versus about half (51 percent) in the baseline survey in the summer of 2013 prior to the first open enrollment period. Among those without coverage, there has been no statistical change in reports of how well their health needs are being met.

Those who recently gained insurance are also now more likely to say they have a usual source of care than before they had coverage (76 percent, compared to 60 percent in summer 2013).

Figure 11

Key Findings: Section 3: Previously Uninsured Now With Coverage

Source of Coverage

Like last year, the primary source of coverage for California’s previously uninsured who now have insurance continues to be Medi-Cal, with half reporting they have coverage through the state’s Medicaid program. About 2 in 10 (21 percent) of those now with insurance say they are enrolled in a plan through an employer or through Covered California (18 percent).  The combined enrollment in Medi-Cal and Covered California shows that at the end of the second enrollment period about two-thirds (68 percent) of California’s recently insured have coverage through these ACA-related coverage options.

Figure 12

Gaps In Coverage And Plan Changes

As noted above, although people report having health insurance at a point in time, they may experience gaps in coverage during periods of transitions such as gaining or losing coverage through an employer or during changes in income and eligibility.  Nearly 6 in 10 (58 percent) of the recently insured say they had health insurance for all of the last 12 months, but about 4 in 10 (42 percent) say they went without coverage at some point in the past year.

People also may move from one type of insurance or health plan to another over the course of the year as their access to coverage through an employer changes or their eligibility changes as their income fluctuates. About 6 in 10 (63 percent) of the recently insured say they stayed with the same plan they had in 2014, while about a fifth (17 percent) say they changed to a different plan. Another 20 percent say they didn’t have coverage last year.

Figure 13

Most of the recently insured who changed plans said it was easy to do (75 percent, or 12 percent of those with insurance). People report changing plans for a number of reasons, such as a change in income (8 percent), wanting a plan with more choice of providers or a plan that covered a specific provider (7 percent), and a change in personal or family health needs (5 percent).

Figure 14

For those recently insured who report staying with the same plan this year (63 percent), most say they were re-enrolled without having to take any action (62 percent, or 39 percent of the insured overall). About a third of those who report staying with the same plan (35 percent, 22 percent of the insured overall) took action to re-enroll. A large majority of those who stayed with the same plan (87 percent, or 54 percent of the insured overall) say they didn’t shop around for other options before keeping their same insurance plan, but a few say they did (12 percent, or 7 percent of the insured overall). In addition, 6 in 10 of those who say they kept the same plan (59 percent, 36 percent of the insured overall) say they received information from an insurance company, Covered California or Medi-Cal about how to keep their plan.

Figure 15

Plan Costs And Affordability

About half (49 percent) of the recently insured say their plan cost about what they expected. Roughly a third (32 percent) of those with Medi-Cal coverage and about a quarter (27 percent) of those with a Covered California plan say their plan cost less than expected, while 13 percent of those with employer-sponsored coverage say the same.

Figure 16

Many previously uninsured Californians have incomes that qualify them for financial assistance from the government to help pay for insurance. Nine in 10 of previously uninsured people who say they have coverage through Covered California (91 percent) report that they are getting financial assistance or that their premium is based on income. The vast majority (88 percent) of those receiving financial assistance say they would not be able to afford insurance without it. Still, about half (52 percent) of the previously uninsured now with a Covered California plan say that it is at least somewhat difficult to afford the cost of health insurance each month; a share similar to those now with coverage through an employer (58 percent).

Perceptions Of Current Plan

Large majorities of those who report having insurance after the second open enrollment period say their experiences with their current health plan have been positive, including about 8 in 10 (83 percent) Medi-Cal enrollees and about 6 in 10 (63 percent) Covered California enrollees.

Figure 17

The recently insured are largely satisfied with their plan’s choice of primary care doctors (79 percent), hospitals (75 percent), and specialists (67 percent), a finding that is consistent across plan types; however some say that they have experienced problems accessing care in the past 12 months. For example, 16 percent of the recently insured say they have been told by a doctor’s office in the past 12 months that they would not accept them as a new patient. Higher shares of those with Medi-Cal (17 percent) or plans through Covered California (23 percent) say they’ve been turned away by a doctor’s office or clinic than those with employer coverage (6 percent). About 3 in 10 (28 percent) of the recently insured say they have had to wait longer than they thought was reasonable for an appointment for medical care. It is possible that some experienced these issues prior to enrolling in their current coverage. Still, the majority of the recently insured (72 percent) say they have visited a doctor in the past 12 months, significantly higher than the 4 in 10 (40 percent) who are uninsured.

Figure 18

Key Findings: Section 4: The Remaining Uninsured

Who Is Remaining Uninsured?

Although many previously uninsured Californians gained coverage in the nearly two years since the health care law went into effect, 32 percent report that they do not currently have health insurance. Many of these remaining uninsured had little interaction with the health insurance system in the years prior to the ACA implementation. Nearly 4 in 10 of the remaining uninsured reported in the baseline survey that they had been without health insurance for two or more years (38 percent), and an additional 4 in 10 (40 percent) said they have never had insurance. Hispanics make up 70 percent of the remaining uninsured and over half of them (41 percent) report being undocumented immigrants who are not eligible for Medi-Cal or assistance through Covered California, although state lawmakers are considering expanding eligibility to this group. Many report a family income that makes them likely eligible for Medi-Cal (26 percent) or for financial assistance through Covered California (25 percent), while 41 percent report being undocumented and therefore are ineligible.12 

Figure 19

Why Don’t They Have Insurance?

When asked to say in their own words the main reason why they do not currently have health insurance, 44 percent of California’s remaining uninsured say it is because health insurance is too expensive and they can’t afford it. Affordability is by far the most common reason named for lacking health insurance, followed by eligibility reasons (23 percent), such as immigration concerns (15 percent) or the fact that they are ineligible for Medi-Cal or government help (7 percent). About 1 in 10 (12 percent) say they haven’t tried, they don’t need insurance, or they just haven’t gotten around to it, and fewer than 1 in 10 (8 percent) name application process related issues as the main reason. Small shares say other reasons such as unavailability (4 percent), including that their employer doesn’t offer coverage (1 percent) or their plan was cancelled (3 percent), unemployment (4 percent), and opposition to the health care law (2 percent). The shares naming these reasons for not currently having health insurance are similar to those for the remaining uninsured last spring, after the first open enrollment period.

Figure 20

Did They Try To Get Insurance?

Just over a third (37 percent) of California’s remaining uninsured say they tried to get health insurance in the past 6 months.  Two in 10 of them (20 percent) say they attempted to get coverage from Covered California and the same share report attempting to get coverage through Medi-Cal. Fewer say they attempted to get coverage through a broker (11 percent), directly from a private insurance company (10 percent), or through an employer (7 percent).

Figure 21

Those who tried but did not gain health insurance point to cost as a main reason they were unsuccessful. A quarter (26 percent) of California’s remaining uninsured say they tried but didn’t get insurance because it was too expensive, including 14 percent who say they shopped for health insurance and 12 percent who say they didn’t bother shopping because they didn’t think they could afford it. Another 13 percent say they weren’t eligible for coverage, and 1 in 10 (9 percent) say they were not able to complete the application process.

Figure 22

Knowledge About Health Care Law Provisions That Could Benefit Them

A large share (84 percent) of the remaining uninsured in California are aware of the health care law’s requirement that most Americans have health insurance or pay a fine, and most (52 percent) think that the requirement applies to them. Although about 4 in 10 (41 percent) say they think they will have to pay a fine for not having coverage this year, 47 percent do not think they will have to pay a fine and 11 percent are unsure.  It is important to note that many may in fact be exempt from the requirement due to financial hardship or other exceptions under the law. Over half (55 percent) say that if they found out they had to pay a fine for not having coverage last year in 2014 they would be likely to sign up for coverage this year.

Smaller shares of the remaining uninsured are aware of provisions of the health care law, beyond the requirement to have coverage, intended to expand coverage to the uninsured and those with lower-incomes. Just over half know that the law allowed for the expansion of the Medi-Cal program to cover more low-income Californians (55 percent) or that the law provides financial help to low- and moderate-income people to help them purchase health insurance coverage (54 percent).

Figure 23

California’s Remaining Uninsured Hispanics

The Hispanic population is particularly important in California because Latinos make up the largest racial or ethnic group in the state, accounting for 38 percent of the population,13  and 7 in 10 of the remaining uninsured are Hispanic (70 percent). However, 58 percent of California’s remaining uninsured Hispanics (41 percent of the remaining uninsured overall) may not be eligible for coverage because of their immigration status, which leaves 40 percent of California’s remaining uninsured Hispanics likely eligible for, but without health insurance coverage (29 percent of the remaining uninsured overall).

Navigating health insurance options and health care jargon can be confusing, and adding language differences to the equation has the potential to be an even bigger barrier to enrollment. However, Californians currently without health insurance who prefer to communicate in Spanish give largely positive feedback when asked how much information is available in Spanish and whether there are people in their community trained to help them sign up for insurance in Spanish. Most (66 percent) remaining uninsured Spanish speakers say that, in their experience, there is at least some information about signing up for insurance available in Spanish – about 4 in 10 (39 percent) say there is a lot of information available and another 27 percent say there is some information available. There is still room for improvement though, as a third of Spanish-speaking remaining uninsured Californians report that there is only a little information available in Spanish (25 percent) or say that there is none available at all (8 percent). A majority (72 percent) of Spanish-speaking uninsured also report there are people in their community trained to help them sign up, while a quarter (24 percent) say that there are not people in their community trained to help and 4 percent say they do not know.

Figure 24

Half of uninsured Hispanics say they are worried that if they sign up for health insurance it will draw attention to their immigration status or that of a family member, and this share is even higher among undocumented uninsured (67 percent). Additionally, slightly more than half of undocumented Hispanics (54 percent) say they worry about being deported or that a family member could face deportation if they sign up for health insurance.

Figure 25

Key Findings: Section 5: A Closer Look At Previously Uninsured With Medi-cal And Covered California Coverage

Because California was an early adopter of the health care law and led the way by expanding Medi-Cal and creating its own health insurance marketplace, the lessons learned from the experiences of previously uninsured Californians as they navigate the state’s new health insurance options provide insight both at the state level and nation-wide.

Shopping For Coverage

There continues to be large variation in enrollment method depending on type of coverage. Nearly half (48 percent) of California’s previously uninsured who enrolled in Covered California say they bought their policy online, compared to just 13 percent of Medi-Cal recipients. Large shares of Medi-Cal enrollees (40 percent) instead say they signed up in-person, while only 14 percent of Covered California enrollees say the same.  More than 2 in 10 in each group say they signed up over the phone.

Figure 26

Over 4 in 10 (44 percent) recently insured Californians say that someone helped them enroll or renew their coverage, fewer than the roughly 6 in 10 (63 percent) who reported getting assistance last year, in part reflecting that some were automatically renewed in coverage. Community health workers were one of the primary helpers for those enrolling in Medi-Cal while most who enrolled in plans through Covered California say they got help from a Covered California representative.

Table 4:  Assistance Enrolling
Did someone help you enroll in health insurance/renew your health plan or did you complete the enrollment/renewal process on your own?Covered CaliforniaMedi-Cal
Someone helped me/ did the whole thing for me (Vol.)50%42%
Family member or friend68
Covered California representative329
Health insurance broker or agent92
Community or county health worker<115
A health plan representative<13
Someone else25
Automatically renewed (Vol.)87
Completed it alone4150
Note: Don’t know/Refused responses not shown.

Majorities of the recently insured say shopping for coverage was easy. For example, 77 percent of those with Medi-Cal and 66 percent of those with coverage through Covered California say it was easy to figure out if their income qualified them for financial assistance.  Similar shares of the recently insured overall also say it was easy to compare the monthly cost of coverage (74 percent), the services covered under the plans (65 percent), and the cost sharing requirements (64 percent).

Figure 27

While the Medi-Cal program experienced a significant backlog in 2014 as it dealt with large numbers of applicants, most (58 percent) of California’s previously uninsured who say they are now covered by the program say it took less than a month to find out whether they were eligible for Medi-Cal. However, 19 percent say it took between one and two months and 1 in 5 (20 percent) say it took more than two months.

About 4 in 10 (38 percent) who have recently gained insurance through Covered California or reported they had it last year say they got a Health Insurance Marketplace Statement from Covered California containing information about their health insurance coverage for their 2014 taxes, and 27 percent say that the form showed they received a premium tax credit in 2014. However, it is possible that if an individual’s income or family size changes over the course of the year, they may end up owing money to the government. This may come as a surprise to some, as about half (49 percent) of those who say they currently have coverage through Covered California are unaware of this, and many (40 percent) who currently have a Covered California plan say their monthly income changed over the course of 2014, including 24 percent who say they had a big change in income.

The Remaining Uninsured’s Experience With Covered California Website And Phone Center

Small percentages of California’s remaining uninsured report that they have contacted Covered California via web or phone; just 14 percent say they have visited the Covered California website and 7 percent say they have called the 1-800 number since November 15, 2014. This is a substantial change from last year, when about twice as many uninsured reported visiting the website (30 percent) or calling the 1-800 number (15 percent).

Figure 28

Conclusion: Conclusion

After two open enrollment cycles under the ACA, 68 percent of California’s previously uninsured report having health insurance, up from the share (58 percent) who said they had coverage after the first open enrollment period. The largest share reports having coverage through Medi-Cal (34 percent) and 12 percent say they have coverage through Covered California, similar to the 14 percent who say they have coverage through an employer. There have been considerable gains in access and affordability among those who have gained insurance compared to what they said in the baseline survey, while those who remain uninsured report difficulty affording care and that their health needs are being met at similar rates as they did nearly two years ago. Most of California’s previously uninsured who reported having coverage after the first open enrollment period continued to report having coverage, but some have since become uninsured, while some others who reported being uninsured after the first open enrollment period, now report having coverage. These dynamics indicate the potential challenges of getting and keeping coverage for the previously uninsured as well as potential opportunities for new enrollment gains among those who have potentially missed chances to enroll in the past. Future gains in coverage may be moderate, however, as the third (32 percent) of California’s previously uninsured who remain without coverage consists largely of harder to reach groups; those who are undocumented immigrants and therefore ineligible for coverage through the ACA and those who reported as of the baseline survey that they had been without coverage for two or more years or had never had health insurance. A fourth wave of the Kaiser Family Foundation California Longitudinal Panel Survey will continue to track this same, representative group of previously uninsured Californians to see how they are faring several years into the ACA’s implementation.

Conclusion: About The Terms Used In This Report

This report primarily uses the following definitions for key groups examined in the survey:

The overall group of Californians who were uninsured prior to the ACA’s first open enrollment period, most often referred to as “California’s previously uninsured.”

1) The subgroup of previously uninsured Californians who currently report that they are uninsured, referred to as “California’s remaining uninsured.” This group includes some who reported having coverage in 2014, some who reported not having coverage in 2014, and some whose 2014 coverage status is unknown because they were unable to be contacted in 2014.

2) The subgroup of previously uninsured Californians who now report that they have health insurance, referred to as “California’s recently insured.” Two subgroups within California’s recently insured are:

a) Those who reported that they were uninsured in the summer of 2013 and either said in spring 2014 that they did not have coverage or were unable to be contacted, but now report having health insurance, referred to as “California’s newly insured,” and

b) Those who reported that they were uninsured in the summer of 2013, reported gaining insurance in the spring of 2014 and say they still have coverage in spring 2015, referred to as “California’s still insured.”

And, as noted in the Survey Methodology Section, only those uninsured for at least two months were included in the baseline survey. Other terms used occasionally throughout the report are defined below.

  • Eligible Previously Uninsured Californians: Because the coverage expansions under the ACA do not extend to undocumented immigrants, some of the analyses focuses on those who reported being U.S. citizens or permanent residents in the baseline survey, described in shorthand as those who are ‘eligible’ for the ACA’s coverage expansions.
  • Undocumented Previously Uninsured Californians: For the purposes of this report, undocumented immigrants are defined as those who reported in the baseline survey that a) they were not born in the United States or Puerto Rico, b) they came to this country without a green card, and c) they have not received a green card or become a permanent resident since arriving. There are several ways that this definition, while workable for the purposes of a broad analysis of this sort, falls short of the complexity of real life. First, it relies on self-reporting, and since respondents have an incentive not to reveal unlawful immigration status, it is undoubtedly a somewhat imperfect measure. Second, those that did not answer all three in the series of immigration status items in the baseline survey were not able to be categorized. Third, by necessity of time and efficiency, the survey did not allow for a full exploration of the many nuances inherent in the U.S. immigration system. For example, this category may actually include a small number of individuals in California as refugees, asylees or other humanitarian immigrants who might better be placed among the ‘eligible uninsured’. The survey, unfortunately, does not allow this level of detailed sorting. Since estimated immigration status is based on individuals’ responses to the baseline survey, it is possible that some small share of those thought to be undocumented immigrants have now become permanent residents or received a green card.
  • Income categories: Because eligibility for two of the law’s main components – the Medi-Cal expansion and the tax credits being made available to purchase insurance on the new exchanges – is based on an individual’s family income relative to the federal poverty level (FPL), in some cases we report survey results by FPL categories. Eligible previously uninsured Californians with incomes 138% FPL or less (roughly $33,000 a year for a family of 4 in 2014) are eligible for Medi-Cal coverage, while those with incomes greater than 138% and up to 400% FPL (roughly $33,000-$95,000 for a family of 4 in 2014), are eligible for subsidies to purchase insurance through Covered California Marketplace. Those with incomes above 400% FPL are allowed to buy insurance through Covered California, but are not eligible for subsidy assistance. For convenience, we sometimes refer to the eligible group with incomes 138% FPL or less as the “Medi-Cal target group”, and those greater than 138% and up to 400% FPL as the “exchange subsidy target group”. These obviously are approximations that do not allow for every real world exception to be taken into account. For example, lawfully present immigrants may remain subject to a five year wait before they may enroll in Medi-Cal, but for the purposes of this analysis they are included in the Medi-Cal target group if they meet the income criteria. Similarly, some of those in the exchange subsidy target group may not be eligible for marketplace subsidies if they have access to affordable employer coverage, a situation difficult to ascertain in a phone survey.

Methodology

This is the third in a series of surveys by the Kaiser Family Foundation (KFF) tracking the views and experiences of a group of Californians who were uninsured in the summer of 2013, prior to implementation of the ACA’s insurance market reforms and coverage expansions through Covered California and Medi-Cal. The first survey (Wave 1) was conducted from July 11-August 29, 2013, with a randomly selected group of individuals who were uninsured at the time of the interview, and was paid for entirely by KFF. The second survey (Wave 2) was conducted from April 1-June 15, 2014 and the current survey (Wave 3) was conducted from February 18-May 13, 2015, with the same longitudinal panel of respondents, whether they obtained coverage or remained uninsured. All three surveys were designed and analyzed by researchers at KFF. Social Science Research Solutions collaborated with KFF researchers on sample design, weighting, and supervised fieldwork. Fieldwork costs associated with Waves 2 and 3 of the survey were paid for by The California Endowment.

The Wave 1 survey was conducted among a representative random sample of 2,001 adults ages 19-64 living in California who reported having been without health insurance for at least two months at the time of the interview14  (NOTE: persons without a telephone could not be included in the random selection process). Computer-assisted telephone interviews conducted by landline (990) and cell phone (1,011, including 660 who had no landline telephone) were carried out in English and Spanish by SSRS. To increase efficiency in reaching this low-incidence, hard-to-reach group, both the landline and cell phone sampling frames oversampled areas with a lower-income population (since being uninsured is negatively correlated with income). The landline sample frame also oversampled households whose phone numbers were matched with directory listings indicating the presence of at least one person age 19-64 and a household income of less than $25,000. Additionally, 230 interviews (130 landline, 100 cell phone) were conducted with respondents who previously completed recent national SSRS omnibus surveys of the general public and indicated they were ages 19-64 and uninsured. These previous surveys were conducted with nationally representative, random-digit-dial landline and cell phone samples. Waves 2 and 3 also consisted of computer-assisted telephone interviews conducted in English and Spanish by landline and cell phone, including those who had no landline phone.

TotalLandlineCell phone(no landline)Web
Wave 1 (July 11-August 29, 2013)2,0019901,011 (660)Not applicable
Wave 2 (April 1-June 15, 2014)1,219623545 (327)51
Wave 3 (February 18-May 13, 2015)1,105555463 (317)87

In order to re-connect with respondents who may be more willing to complete the survey online, an abbreviated web version was introduced on for Waves 2 and 3 after attempts had been made to reach respondents by phone. The online questionnaire was offered in English and Spanish and was limited to key questions about insurance status, type of coverage, and reasons for obtaining coverage or remaining uninsured. A total of 51 respondents in Wave 2 and 87 respondents in Wave 3 completed the online version of the survey.

Screening for Waves 2 and 3 involved verifying that the respondent had participated in Wave 1. Multiple attempts were made to reach every respondent from Wave 1 and encourage participation in later waves. Efforts included multiple dialing at various times of day and throughout the week, mailings and emails to those who provided such contact information, repeated dialing of non-working numbers, and attempts to find alternative phone numbers for non-working numbers.

A multi-stage weighting design was applied to ensure accurate representation of California’s nonelderly adult uninsured population prior to the ACA’s coverage expansions. The weighting process for Waves 2 and 3 involved corrections for sample design, as well as sample weighting to match the weighted Wave 2 sample and the weighted Wave 3 sample to Wave 1 responses along demographic characteristics. As it did for Wave 1, the base weight for Waves 2 and 3 accounted for the oversamples used in the sample design, as well as the likelihood of non-response for the sample from earlier omnibus surveys, number of eligible household members for the landline sample, and a correction to account for the fact that respondents with both a landline and cell phone have a higher probability of selection. Demographic weighting parameters for Waves 2 and 3 were based on Wave 1 weighted demographics, which were adjusted for age, education, race/ethnicity, nativity (for Hispanics only), Hispanics by gender, presence of own child in household, marital status, California region, poverty level, and phone usage. For more information on weighting and data sources, see the Wave 1 methodology. All differences referred to in the report are statistically significant. Statistical tests of significance account for the effect of weighting, and, for trend analysis, testing takes into account the survey’s panel design.

A unique consideration for panel surveys such as the Kaiser Family Foundation California Longitudinal Panel Survey, is whether those who participate in subsequent waves are different in terms of their attitudes or demographics than those who refuse to participate again or were unable to be re-contacted. Of the total 2,001 respondents who completed Wave 1, 1,219 participated in Wave 2 and 1,105 completed Wave 3. These completion rates are within an expected range given that the uninsured are already an often a difficult to reach population since many are lower income, younger, undocumented immigrants, and members of racial/ethnic minority groups, and may change phone numbers or move more often than the public at large. After data collection was complete, data from Wave 1 and Wave 3 were compared to evaluate the impact of some respondents not completing Wave 3, referred to as attrition. While there are some differences in the unweighted demographics of those who completed Wave 3 and the full Wave 1 sample, these differences are corrected for by weighting. As shown in the table below the total weighted distributions are similar for Wave 1 and Wave 3 for age, gender, race/ethnicity, party identification, education and income. See the Wave 3 Attrition Appendix for more information on attrition.

UnweightedWeighted
Wave 1 (n=2001)Completed Wave 3 (n=1105)Completed all 3 Waves (n=923)Percentage Point Difference (W1 – W3 Total)Wave 1Completed Wave 3Completed all 3 WavesPercentage Point Difference (W1 – W3 Total)
Gender
Male48%44%42%454%53%50%1
Female52%56%58%-446%47%50%-1
Race/ ethnicity
White27%32%35%-526%27%30%-1
Black7%7%8%05%5%6%0
Hispanic58%54%50%456%55%53%1
Other Race8%7%8%112%11%11%1
Age
18 to 2923%18%17%533%31%27%2
30 to 3921%19%20%224%24%25%0
40 to 4922%21%21%121%21%22%0
50 to 6435%41%42%-622%24%26%-2
Education
HS or less57%51%50%658%56%55%2
Some college28%31%32%-329%30%31%-1
College Grad+15%17%17%-212%13%13%-1
Phone status
Landline49%54%55%-542%45%48%-3
Cell51%46%45%558%55%52%3
Marital status
Married33%32%32%137%37%38%0
Not Married67%67%68%062%63%62%-1
Family income
<138% FPL60%58%58%252%53%54%-1
138%-400% FPL30%32%32%-236%35%34%1
400%+ FPL5%6%5%-17%7%7%0
Language of interview
English63%67%69%-465%66%66%-1
Spanish37%33%31%435%34%34%1
Resident Status
Citizen/ legal immigrant79%83%84%-478%80%81%-2
Undocumented immigrant20%16%15%421%19%18%2
Party Identification
Republican11%12%13%-111%12%13%-1
Democrat35%36%36%-132%32%31%0
Independent35%35%34%037%39%38%-2
Other9%8%8%19%8%8%1

Another consideration for panel surveys is the potential for “sensitization effects,” that is, what effect returning to the same people about the same topics has on their experiences or views. For example, after taking the baseline survey that covered many aspects of the coverage expansions under the ACA, were people more likely to seek out information about health insurance and enroll than they would have been otherwise? While there is no direct way to measure this effect on this survey, other analyses have found that these effects are minimal and short-lived,15  and we do not believe they would have had a substantial impact on results presented here, particularly given all the other media coverage, advertising, and outreach targeted at this population during the fall and winter of 2013 and 2014.

The margin of sampling error including the design effect for the full sample is plus or minus 4 percentage points. For the recently insured, it is plus or minus 5 percentage points and for the remaining uninsured it is plus or minus 8 percentage points. Numbers of respondents and margin of sampling error for key subgroups are shown in the table below.

GroupNMOSE
Total Wave 31105+/- 4 percentage points
Recently Insured797+/- 5 percentage points
Recently insured by Medi-Cal411+/- 7 percentage points
Recently insured by non-group plan168+/- 11 percentage points
Recently insured through Covered California147+/- 12 percentage points
Recently insured through an employer143+/- 11 percentage points
Recently insured Hispanics380+/- 7 percentage points
Remaining Uninsured303+/- 8 percentage points
Remaining uninsured Hispanics209+/- 9 percentage points
Remaining uninsured undocumented immigrants110+/- 13 percentage points

For results based on other subgroups, the margin of sampling error may be higher. Sample sizes and margin of sampling errors for other subgroups are available by request. Note that sampling error is only one of many potential sources of error in this or any other public opinion poll.

Some demographic measures referred to in the report were only asked during the baseline survey, such as questions about educational attainment, debilitating chronic condition, length of time uninsured, resident status, and race/ethnicity. For more information on the first and second waves of the Kaiser Family Foundation California Longitudinal Panel Survey visit:

Wave 1: https://www.kff.org/health-reform/report/californias-uninsured-on-the-eve-of-aca-open-enrollment/

Wave 2: https://www.kff.org/health-reform/report/where-are-californias-uninsured-now-wave-2-of-the-kaiser-family-foundation-california-longitudinal-panel-survey/

Endnotes

  1. Kaiser Family Foundation analysis of 2013 ASEC Supplement to the Current Population Survey. ↩︎
  2. Kaiser Family Foundation, California’s Uninsured On The Eve Of ACA Open Enrollment, September 2013, https://modern.kff.org/health-reform/report/californias-uninsured-on-the-eve-of-aca-open-enrollment/. ↩︎
  3. Kaiser Family Foundation, Where Are California’s Uninsured Now? Wave 2 Of The Kaiser Family Foundation California Longitudinal Panel Survey, July 2014, https://modern.kff.org/health-reform/report/where-are-californias-uninsured-now-wave-2-of-the-kaiser-family-foundation-california-longitudinal-panel-survey/. ↩︎
  4. DHHS Centers for Medicare & Medicaid Services, “Medicaid & CHIP: May 2014 Monthly Applications, Eligibility Determinations and Enrollment Report,” July 11, 2014 http://medicaid.gov/AffordableCareAct/Medicaid-Moving-Forward-2014/Downloads/May-2014-Enrollment-Report.pdf. DHHS Office of the Assistant Secretary for Planning and Evaluation Issue Brief, “Health Insurance Marketplace: Summary Enrollment Report For The Initial Annual Open Enrollment Period,” May 1, 2014 http://aspe.hhs.gov/health/reports/2014/MarketPlaceEnrollment/Apr2014/ib_2014Apr_enrollment.pdf. The California Department of Health Care Services estimates 1.9 million people have enrolled in Medi-Cal since open enrollment started, http://news.coveredca.com/2014/04/covered-californias-historic-first-open.html. ↩︎
  5. Covered California 2015 End of Open Enrollment Report, http://www.coveredca.com/PDFs/end-of-open-enrollment-report.pdf ↩︎
  6. For the purposes of this report, the ‘eligible uninsured’ are California residents who said they had been uninsured for at least two months in the baseline survey and would be eligible for participation in the ACA coverage expansion based on their self-reported status as a citizen, permanent resident, or lawfully present immigrant. See the “About The Terms In This Report” Section for more details. ↩︎
  7. The total share with non-group coverage, including those in Covered California, remained stable between the spring 2014 survey and the spring 2015 survey. In addition to an actual enrollment increase, there may be other reasons why more report in Wave 3 that they have Covered California specifically. For example, more people may be familiar with “Covered California” and thus better able to self-report their source of coverage. In addition, the follow-up question for those who report purchasing coverage on their own was modified for Wave 3. See topline for more information. ↩︎
  8. For the purposes of this report, undocumented immigrants are defined as those that reported in the baseline survey that a) they were not born in the United States, and b) they came to this country without a green card, and c) they have not received a green card or become permanent residents since arriving. See the “About The Terms In This Report” Section for more details. ↩︎
  9. Regression results are available on request. ↩︎
  10. The analysis of the dynamics of health insurance excludes those who were unable to be contacted in spring 2014 and focuses exclusively on those who completed the survey after both open enrollment periods (roughly 8 in 10 of those who were interviewed in spring 2015). Including all the previously uninsured who participated in the most recent survey after the second open enrollment period, the results are similar. ↩︎
  11. Examining only those who completed both the spring 2014 and spring 2015 surveys results in a slight discrepancy in the shares recently insured and remaining uninsured – 69% and 31% instead of 68% and 32% when the analysis considers everyone who completed the survey in spring 2015 after the second open enrollment period. This is due to the fact that some previously uninsured adults who completed the survey this year did not complete the survey after the 2014 open enrollment period and therefore we are unable to determine their insurance status at that time and they are excluded from the analysis on the dynamics of health insurance. ↩︎
  12. See endnote 8 or the “About The Terms In This Report” Section for more details. ↩︎
  13. US Census Bureau, California State & County QuickFacts http://quickfacts.census.gov/qfd/states/06000.html ↩︎
  14. Those who had been uninsured for less than two months were excluded from the survey since they may be experiencing a short period of uninsurance (i.e. someone who is between jobs), and the goal of the survey was to capture the experiences and views of those who have been without insurance for a longer period of time and are poised to experience the new coverage provisions of the ACA. ↩︎
  15. M. Brodie, “Sensitization Effects in a Study of the Impact of a Nationally Broadcast Special on Health Care Reform,” in Doctoral Thesis: Political Institutions, Participation, and Media Evaluations— Influences on Health Care Policy (Boston, Mass.: Harvard University, 1995). ↩︎
News Release

New Survey Finds 68 Percent of Previously Uninsured Adult Californians Gained Coverage Since the ACA’s Implementation

Published: Jul 30, 2015

Steep Drops in Problems Paying For and Getting Care among Recently Insured, But Affordability and Access Problems Remain

Eligible Latinos Obtained Coverage at Similar Rates as Whites; People Ineligible Due to Immigration Status Now Make Up 41% of Remaining Uninsured


MENLO PARK, Calif. – About two thirds (68%) of previously uninsured Californians have health coverage after the Affordable Care Act’s second open enrollment period, and this group is now much more likely to report their health needs are being met and much less likely to say they have problems paying for it than they did before when they were uninsured, finds the latest Kaiser Family Foundation’s Longitudinal Panel Survey following the experiences of a randomly selected group of Californians who were uninsured prior to the ACA’s implementation. By contrast, there were no changes in access or ability to pay for those who remained uninsured.

The third to date in the series conducted since 2013, the new survey provides a detailed look at how the ACA has affected the lives of previously uninsured residents in California, a state that embraced the law’s opportunities for coverage expansions by establishing the Covered California insurance marketplace and expanding its Medi-Cal program.

“We have been following the uninsured in California through this survey since ACA implementation began, and now we are seeing striking gains in financial security and access for people who got coverage,” KFF President and CEO Drew Altman said. “Like health insurance generally, their coverage is not a cure-all and they still face problems paying for and getting care, but they are far better off than they were before.”

The survey finds most of California’s previously uninsured enrolled in Medi-Cal (34% of all uninsured adults in 2013), with employer coverage (14%) and Covered California (12%) covering most of the others.

Recently insured residents now report very different experiences than they did in 2013 when they were uninsured, although many still report problems paying for and accessing care:

• The share of recently insured saying it is difficult to afford health care fell sharply from 86 percent in 2013 to 49 percent now.

• The recently insured are about half as likely to say they have had problems paying medical bills in the past year (23% now compared to 45% in 2013). This is similar to the share of the general public reporting that they or a family member have had problems paying bills in other Kaiser surveys.

• When asked how well their health needs are being met, 86 percent of the recently insured now say that they are being somewhat or very well met – up from about half (51%) in 2013.

• Those who recently obtained coverage also are more likely to report they have a usual place of care now than in 2013 (76% compared to 60% in 2013).

Recently_Insured_Feel_Less_Financial_Stress_and_Are_More_Likely_to_Say_Health_Needs_Met

Gaining coverage also results in a reordering of people’s family pocketbook concerns. Those who remain uninsured rank health care costs as their top financial challenge – with 85 percent saying health care is “very” or “somewhat” difficult to afford, more than say the same about housing (66%), gas (57%), or utilities (51%). Among the recently insured, half (49%) say affording health costs is difficult, ranking it fourth behind paying for housing (58%), utilities (54%), and gas (53%).

Affording_Health_Care_Remains_Top_Financial_Concern_For_Remaining_Uninsured-1

Large majorities of those who report having insurance after the second open enrollment period say their experiences with their current health plans have been positive, including 83 percent of Medi-Cal enrollees and 63 percent of Covered California enrollees. The recently insured are also largely satisfied with their plan’s choice of primary care doctors (79%), hospitals (75%), and specialists (67%).

However, challenges exist in using their coverage, with about 3 in 10 (28%) saying that in the past 12 months they had to wait longer than they thought reasonable for an appointment. Also, 16 percent of the recently insured say a doctor’s office told them in the past 12 months that they would not accept them as a new patient. The share is higher for those enrolled through Medi-Cal (17%) or Covered California (23%) than for those with employer coverage (6%). The survey is not able to determine the extent to which these issues occurred before these recently insured residents obtained their coverage.

The new survey finds a similar success rate in covering different groups in California, with the share of previously uninsured who now have coverage similar among whites (79%) and Hispanics eligible for coverage (74%).

The ACA does not allow coverage for undocumented persons, and the survey finds that 41 percent of the remaining uninsured are not eligible because of their immigration status. Of the remaining uninsured, 43 percent are eligible for coverage but had been uninsured for two years or more as of the baseline survey and 29 percent are eligible Hispanics. About a quarter (26%) of the remaining uninsured are likely eligible for MediCal, and another quarter (25%) for subsidies in the Covered California marketplace.

“Our latest survey shows that previously uninsured Hispanics who are eligible to enroll through Medi-Cal or Covered California are signing up at roughly the same rate as whites,” says KFF Senior Vice President Mollyann Brodie, who leads the Foundation’s public opinion and survey research. “Two years in, the group that remains uninsured includes many undocumented immigrants and long-term uninsured residents.”

Demographics_of_Californias_Remaining_Uninsured_In_2015

About The Survey

The survey is the third in the series based on the Kaiser Family Foundation California Longitudinal Panel Survey Project. It was designed and analyzed by researchers at the Foundation. The third wave of the survey was conducted primarily by telephone from February 18 – May 13, 2015 among 1,105 individuals who had participated in the baseline survey. The baseline survey was conducted from July 11-August 29, 2013 with a representative sample of 2,001 adults ages 19 to 64 living in California who reported having been without health insurance for at least two months at the time of the survey. Interviews were carried out in English and Spanish by SSRS, an independent research company. The panel survey estimates the percentage of the previously uninsured who gained coverage and does not estimate the overall change in the number of uninsured Californians because it does not include anyone who may have been insured prior to open enrollment but is now uninsured. The margin of sampling error is plus or minus 4 percentage points for results based on the full sample, 5 percentage points for recently insured Californians, and 8 percentage points for those Californians who remain uninsured. For other subgroups, the margin of sampling error may be higher. Fieldwork for the panel survey is supported by a grant from The California Endowment.

California’s Previously Uninsured After the ACA’s Second Open Enrollment Period: Wave 3 of the Kaiser Family Foundation’s California Longitudinal Panel Survey is available online.

News Release

How to Think About Higher Growth in Health-Care Spending

Published: Jul 30, 2015

In his latest column for The Wall Street Journal’s Think Tank, Drew Altman explains that just as we should not have expected historically low rates of health spending increases to continue, we should not dramatize a return to higher rates in coming years.

All previous columns by Drew Altman are available.


News Release

New Article and Infographics in JAMA Examine Medicaid and Medicare at 50 Years

Published: Jul 28, 2015

The July 28 special issue of the Journal of the American Medical Association (JAMA) includes an article written by Kaiser Family Foundation President and CEO Drew Altman and former U.S. Senate Majority Leader William H. Frist, MD, and two infographics from the Foundation that examine the past, present, and future of Medicaid and Medicare.

Medicare and Medicaid at 50 Years: Perspectives of Beneficiaries, Health Care Professionals and Institutions, and Policy Makers examines the roles the two programs play in the health system today from the perspectives of the public and beneficiaries, providers, and policymakers, and discusses the challenges they face in the future. The article is accompanied by an audio interview with Altman and Frist, who is a member of the Foundation’s board of trustees.

Read the Article

The JAMA issue also includes two Visualizing Health Policy infographics from the Foundation. The first infographic provides details about the reach and demographics of Medicaid and Medicare, as well as the spending associated with them. The second infographic illustrates the programs’ trends and challenges going forward.


JAMA_2015july_mandmat50


JAMA_2015july_trends

Visualizing Health Policy is a monthly infographic series produced in partnership with JAMA. The full-size infographics, Medicaid and Medicare at 50 and Trends and Challenges, are freely available on JAMA’s website and are published in the print edition of the journal.

For more information on the 50th anniversary of Medicaid and Medicare, visit kff.org.