KFF designs, conducts and analyzes original public opinion and survey research on Americans’ attitudes, knowledge, and experiences with the health care system to help amplify the public’s voice in major national debates.
Larry Levitt’s August 2015 piece analyzes Affordable Care Act replacement plans proposed by 2016 Republican presidential candidates, and compares them to the health care law. The post is now available at the Los Angeles Times.
Long-term care (LTC) in the United States has evolved over the course of the last century to better serve the needs of seniors and persons with disabilities. This timeline outlines the major milestones in LTC from the nursing home era, which created an institutional bias in LTC, to the era of home and community based services (HCBS) and integration, and into the era of health reform and beyond. These milestones include key legislation and court decisions that were instrumental in providing LTC funding; improving the quality of care and safety in nursing homes; and allowing people with LTC needs to stay in their communities. Despite these successes, proposals by commissions and legislators for broader and more comprehensive national LTC policies have not been fully realized; though efforts in this area continue. Download the PDF.
Under the SSA, the Old Age Assistance program makes federal money available to the states to provide financial assistance to poor seniors. The law specifically prohibits making these payments to anyone living in public institutions (poor houses, which had become known for their terrible living conditions), thus spawning the creation of the private nursing home industry.
1950:
An amendment to the SSA requires payments for medical care to be made directly to nursing homes rather than beneficiaries of care. Under the amendments, states are also required to license nursing homes in order to participate in the Old Age Assistance program.
1965:
Medicare and Medicaid are passed as amendments to the SSA. Medicare’s focus is on acute care only and does not provide for long-term care (LTC). Medicaid requires coverage of LTC in institutions but not in the home, creating a bias in favor of institutional LTC. Under this legislation, the federal and state governments become the largest payers for LTC: nursing home utilization increases dramatically, along with government expenditures.
Older Americans Act (OAA) enacted, establishing Administration on Aging within the department of Health, Education and Wellness (HEW).
1967:
As a response to public outcry over fraud and abuse in nursing homes, 1967 Amendments to the SSA include a provision for states to govern the licensing of nursing home administrators.
1968:
“Moss Amendments” are passed to authorize HEW to standardize the regulations for the Medicare and Medicaid programs and to withhold funding from nursing homes that do not meet those standards, paving the way for comprehensive regulations to improve nursing home care.
THE ERA OF COMMUNITY-BASED SERVICES
1974:
1974 SSA amendments authorize federal grants to states for social services programs including homemaker services, protective services, transportation, adult day care, training for employment, nutrition assistance and health support.
Final regulations for skilled nursing facilities are put into effect and enforcement of compliance with standards such as staffing levels, staff qualifications, fire safety, and delivery of services become a requirement for participation in Medicare and Medicaid.
1975:
1975 SSA amendments create Title XX, which consolidate the federal assistance to states for social services into a single grant. Under Title XX states are required to prevent or reduce inappropriate institutional care by providing for home and community-based services (HCBS).
1978:
The Comprehensive OAA Amendments of 1978 require all states to develop and implement a nursing home ombudsman program and to prioritize community alternatives to LTC.
1980:
Mental Health Systems Act of 1980 provides federal funding for ongoing support and development of community mental health programs with an emphasis on deinstitutionalization.
The U.S. Department of Health and Human Services’ (HHS) National Long-Term Care Channeling Demonstration to test quality and cost-effectiveness of HCBS for frail seniors is implemented. It runs through 1986.
1981:
HCBS waiver program is enacted under Section 1915(c) of the SSA, allowing states to offer home and community-based services that are not strictly medical in nature through Medicaid as an alternative to institutional care.
1982:
Established under the Tax Equity and Fiscal Responsibility Act, the Katie Beckett Medicaid state plan option permits states to cover children with disabilities living in the community; previously, these children were eligible for Medicaid only if institutionalized.
1984:
Reauthorization of OAA reaffirms role of State Area Agencies on Aging in coordinating HCBS.
1987:
Under OBRA-87, The Nursing Home Reform Act imposes quality standards for Medicare and Medicaid-certified nursing homes in response to well-documented quality issues facing seniors in nursing homes. Reauthorization of the OAA adds six additional distinct authorizations of appropriations for services including in-home services for frail seniors; LTC ombudsman; and prevention of elder abuse, neglect and exploitation.
The Robert Wood Johnson Foundation (RWJF) begins support for long-term care public/private partnership programs in four states to encourage people to purchase LTC insurance in order to potentially offset their need for care financed by Medicaid.
1988:
Medicare Catastrophic Act of 1988 – Among other things, expands skilled nursing facility (SNF) benefits by removing time limits on most hospital service coverage and establishes protections against spousal impoverishment from nursing home expenses, but still does not pay for long-term custodial nursing home care. It also requires Medicaid to cover Medicare premiums and cost-sharing for Medicare beneficiaries with incomes below 100% FPL and limited assets (Qualified Medicare Beneficiaries, QMBs).
Congress creates the U.S. Bipartisan Commission on Comprehensive Health Care to recommend legislative action on health and long-term care. The Commission is renamed the Pepper Commission in honor of its creator and first chair, Representative Claude Pepper (D-FL).
1989:
Repeal of Medicare Catastrophic Act; provisions on spousal impoverishment and QMBs are kept in place.
1990:
OBRA-90 – Requires state Medicaid programs to cover premiums for Medicare beneficiaries with incomes between 100-120% FPL. Medicare is expanded to cover partial hospitalization services in community mental health centers.
The Pepper Commission issues report on LTSS financing options, with a set of recommendations on LTC that include an initiative that would establish government or social insurance to keep resources intact for people with severe disabilities at home or with the potential to return home after a short nursing home stay, and would establish a floor of protection against impoverishment for all nursing home users, no matter how long their stay. It also proposes to cover the first 3 months of nursing home care with 20% copayment and coverage of home care services for Medicare elders with 3+ Activity of Daily Living (ADL) impairments. The recommendations are never enacted.
Americans with Disabilities Act (ADA) enacted. The Act emphasizes the importance of integrating people with disabilities into the community and ending exclusion and segregation.
1993:
Clinton Health Care Plan includes plans to expand HCBS; improve Medicaid coverage for institutional care; and establish minimum standards to improve the quality of private insurance for LTC and tax incentives to encourage its purchase. The plan is never enacted.
1994:
The final rule for OBRA-87 is published, eight years after the law is passed.
1995:
As part of a larger attempt to reform Medicaid, the Nursing Home Reform Act is nearly repealed, but through interventions by consumer advocates demonstrating the positive effects of the reform provisions, repeal is averted.
HHS and RWJF initiate the Medicaid cash and counseling demonstration, allowing beneficiaries to self-direct their HCBS in lieu of traditional agency-provided services.
1999:
Supreme Court’s Olmstead decision promotes broader HCBS coverage for people with disabilities, per ADA’s community integration mandate.
2000:
Americans Act Caregiver Program established, authorizing grants to states to fund a range of supports that assist family and informal caregivers to care for their loved ones at home.
2001:
New Freedom Initiative established to remove barriers to community living for people with disabilities.
Centers for Medicare & Medicaid Services and Administration on Aging Real Choice Systems change grants available to states and non-profit agencies to develop integrated LTSS systems.
2005:
Deficit Reduction Act provides federal funding to states to expand community-based care; authorizes the Medicaid Money Follows the Person (MFP) Rebalancing demonstration program; allows states to add an optional Medicaid state plan benefit for HCBS ; and allows states to offer self-direction of personal care services. It also lengthens the look-back period for transfers of assets for nursing home Medicaid applications from 36 to 60 months. In addition, it allows for Qualified State Long-Term Care Partnerships, which encourage individuals to purchase LTC insurance while still allowing them to qualify for Medicaid if their LTC needs extend beyond the period covered by their insurance policy.
2006:
OAA Amendments of 2006 signed into law, including the principles of consumer information for long-term care planning, evidence-based prevention programs, and self-directed community based services to older individuals at risk of institutionalization.
THE ERA OF HEALTH REFORM
2010:
The Affordable Care Act (ACA) provides new options to states under the Medicaid program to incentivize the improvement of their LTC infrastructures and expand HCBS. Provisions include the Balancing Incentive Program, the Community First Choice state plan option and an MFP extension, among others. In addition, for the 5-year period beginning January 1, 2014, states are required to apply spousal impoverishment standards in determining eligibility for married Medicaid applicants receiving HCBS. Prior to this, these standards were applied to the spouses of nursing home residents only.
Under the ACA, The Community Living Assistance Services and Supports (CLASS) Act is enacted, with the intention of offering a national, voluntary long term services and supports (LTSS) insurance program financed by individual premium contributions.
2011:
First of the nation’s baby boomers turn 65.
2013:
The American Taxpayer Relief Act of 2012 repeals the CLASS Act and establishes thetime-limited, bipartisan Commission on Long-Term Care.
The Commission on Long-Term Care issues a report to the Congress, reviewing LTSS policy and program issues. The report makes recommendations regarding service delivery and workforce. No agreement on financing recommendations are reached; instead the report puts forward financing approaches suggested by members.
2014:
CMS finalizes new rules outlining the qualities that settings must meet to be considered “home and community-based” for the provision of Medicaid services.
2015:
CMS revises the Five-Star Quality rating system for nursing homes, reflecting an improvement of performance standards.
The Affordable Care Act (ACA) went into full effect on January 1, 2014, ushering in health insurance reforms and new health coverage options in California and elsewhere across the country. Prior to 2014, under a waiver, California undertook an early expansion of Medi-Cal, the state’s Medicaid program, and enacted innovative strategies to redesign the health care delivery system within its safety net. In 2014 and 2015, millions more gained coverage through Covered California, the state’s health insurance Marketplace, and through further expansions in Medi-Cal. Building on these reforms, the state is continuing to expand eligibility and redesign delivery systems with the goal of providing efficient, high-quality care to state residents. This fact sheet provides an overview of population health, health coverage, and the health care delivery system in California in the era of health reform.
Demographics
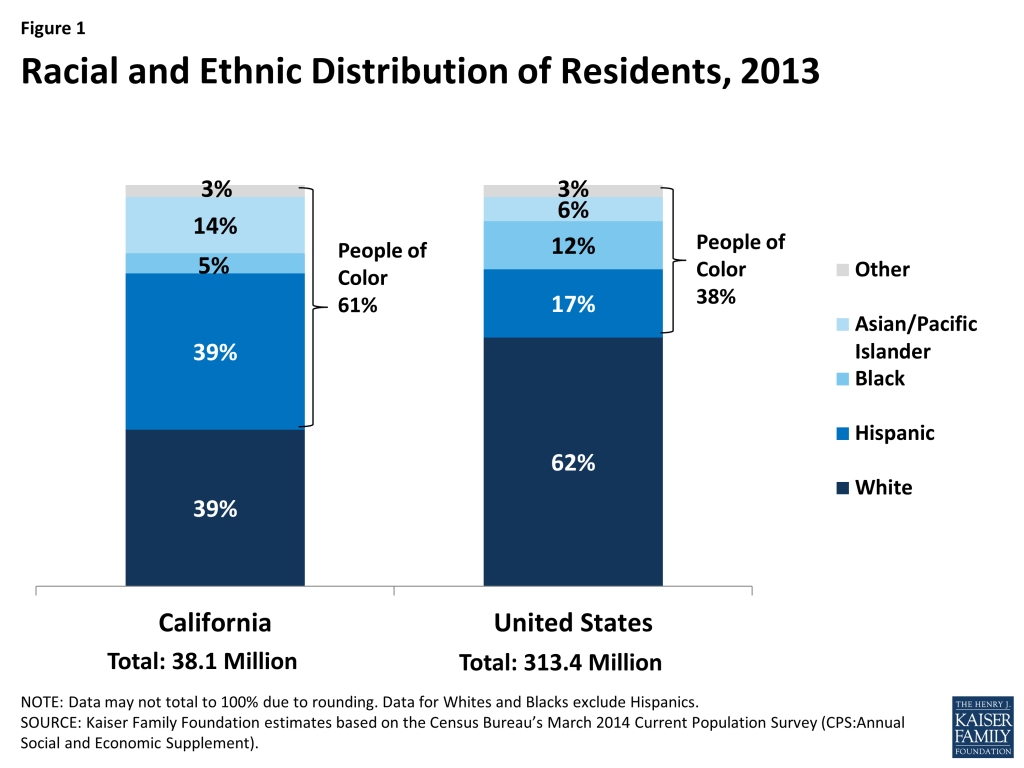
Figure 1: Racial and Ethnic Distribution of Residents, 2013
California is home to over 38 million people, making it the most populous state in the U.S. With nearly 156,000 square miles, California is the 3rd largest state in terms of geography.1 While about a third of the state’s total surface area is made up of forest,2 the vast majority of state residents (95%) live in urban areas, and half are concentrated in Southern California in just 5 of the state’s 58 counties. Los Angeles and San Diego counties alone account for a third of the state’s population.3
California’s population is highly diverse (Table 1). Unlike most states in the U.S., California’s population is majority minority, with 39% of residents identifying as White, another 39% as Hispanic, 14% as Asian, 5% as Black, and 3% as another race/ethnicity (Figure 1).4 Over a quarter (27%) of the population is foreign born5 and 12% are non-citizens, representing approximately 22% of non-citizens nationally.6 Over four in ten (44%) residents speak a language other than English in the home, a rate more than double that of the national average (21%),7 and nearly one in five (19%) speak English less than “very well.”8 By contrast, the age distribution in the state resembles national averages, with nonelderly adults representing the majority of the population (62%) followed by children (25%) and the elderly (12%).
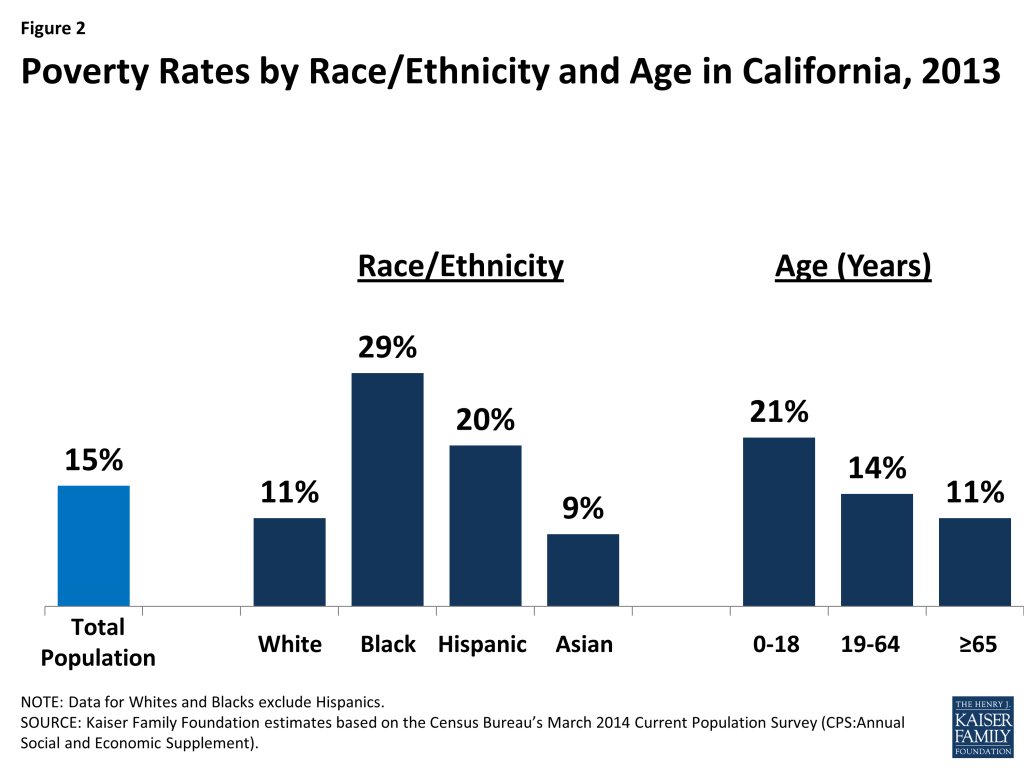
Figure 2: Poverty Rates by Race/Ethnicity and Age in California, 2013
Poverty rates in California reflect national averages and vary by race/ethnicity and age (Table 1). In 2013, over 5.7 million Californians, or 15% of the state’s population, were living in poverty, a decrease since 2011 when the poverty rate reached 17%.9 Blacks (29%) and Hispanics (20%) in California are significantly more likely to be poor than Whites (11%) and Asians (9%).10 The overall poverty rate and rates by race/ethnicity are consistent with national averages. However, the cost of living in California is among the top four highest in the country, so low-income people in California may have a harder time making ends meet than in other places; a family of four in California would need to earn $137,643 in a middle cost urban area to have purchasing power equal to 400% of the federal poverty level ($97,000).11 As in most other states, children in California are more likely than adults to live in a poor household and as of 2013, over one in five (21%) children in the state were living in poverty, compared to 14% of nonelderly adults and 11% of seniors (Figure 2).12
Table 1: Selected Demographic Characteristics of the Californian Population,Compared to the United States Overall, 2013
California
United States
Race/Ethnicity
White
39%
62%
Black
5%
12%
Hispanic
39%
17%
Asian
14%
6%
Other Race/Ethnicity
3%
3%
Age
0-18
25%
25%
19-64
62%
61%
65+
12%
14%
Citizenship Status
Citizen
88%
93%
Non-Citizen
12%
7%
Distribution of Population byFederal Poverty Level
Under 100%
15%
15%
100-199%
21%
19%
200-399%
28%
30%
400% +
36%
36%
NOTE: Data may not sum to 100% due to rounding and data restrictions.SOURCES: Kaiser Family Foundation estimates based on the Census Bureau’s March 2014 Current Population Survey (CPS: Annual Social and Economic Supplement).
State Economy
California’s economy continues to recover after the recession, but unemployment remains high. California, like most states, experienced a decline in GDP during the Great Recession, but the economy has experienced marked improvements since then. In 2014, California’s per capita real GDP was $54,462 compared with the national average of $49,469.13 While the national real GDP grew by 2.2% from 2013 to 2014, California’s grew by 2.8%, placing it among the top nine highest GDP growth rates in the US.14 The largest industry sector in the state is finance, insurance, real estate, rental and leasing, which accounted for 21% of total GDP in 2014. Education, health care and social assistance contributed to 7% of total GDP, a share slightly less than the national average (8%).15 The unemployment rate has also significantly improved since the recession, declining from a height of 12.2% in October 2010 to 6.3% in June 2015.16 However, California’s unemployment rate remains well above the national rate of 5.3% with nearly 1.2 million people in California remaining unemployed as of June 2015.17
Budget actions, tax increases and a strengthening economy have helped to improve California’s fiscal outlook since 2012. In addition to state actions to control costs and raise revenues, the state’s economy also improved. Economic recovery resulted in sharp increases in personal income tax collection and soaring stock prices in 2013, which led to higher than projected revenues.18 After nearly a decade of recurring budget deficits, the peak of which was $45.5 billion in FY2010,19 California experienced a budget surplus in FY 2015 and projected a surplus for FY 2016.20
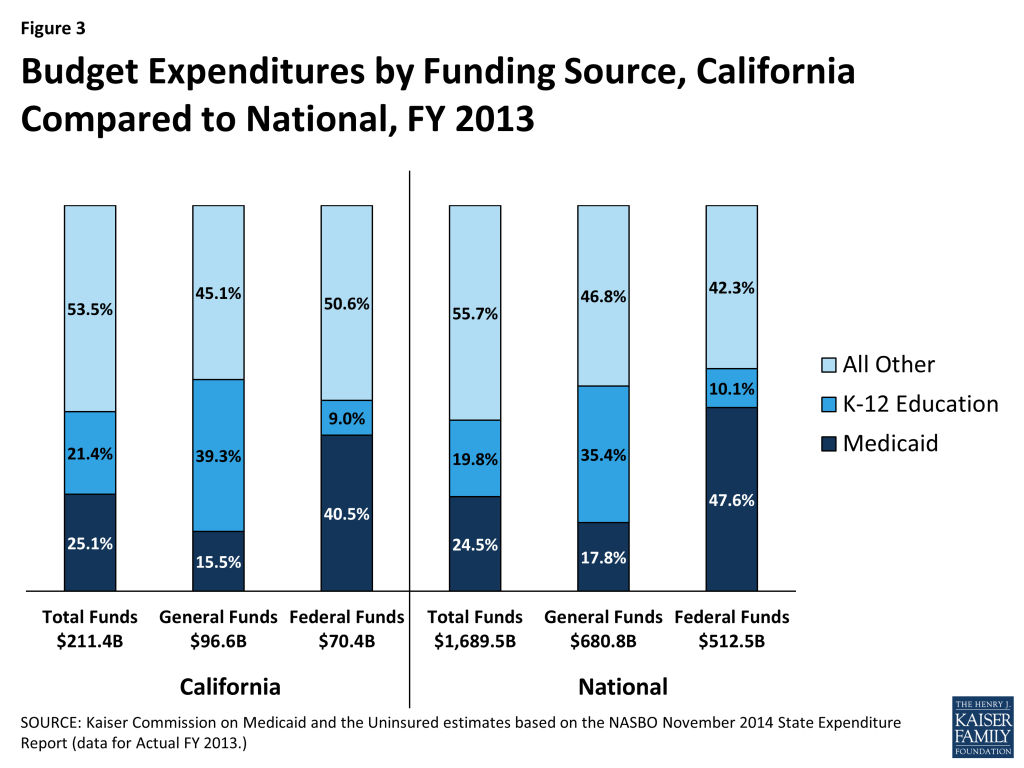
Figure 3: Budget Expenditures by Funding Source, California Compared to National, FY 2013
Medi-Cal acts as both a source of state budget expenditures as well as a source of federal revenue. In FY2013, California spent just over a quarter (25.1%) of its total funds on Medi-Cal, compared to the national average of 24.5%. However, because Medicaid is jointly funded by states and the federal government, California gets at least $1 in federal funds for every $1 it spends from its own resources on the program. Due to this funding structure as well as state constitutional requirements related to K-12 funding in California, Medi-Cal represents only 15.5% of total general fund spending, a far second to K-12 education. Meanwhile, Medi-Cal represents the largest share of federal funds flowing into the state (40.5%) Provider taxes and local funds, among other funding sources, contributed to Medi-Cal funding in FY2013.
Population Health
California ranks above the national average on many measures of population health but faces substantial environmental health challenges. On overall health measures, California ranks 17th among the 50 states in the United Health Foundation’s report, America’s Health Rankings 2014.21 Compared to other states, California has among the five lowest rates of smoking, obesity, and physical inactivity, and violent crime has decreased by 54% since 1990.22 However, high levels of air pollution as well as an extended period of severe and unprecedented droughts23 present continuous public health challenges to the state.
Disparities in health access and outcomes exist in California (Table 2). As in other states across the country, measures of health status and access vary by race/ethnicity in California (Table 2). Whites (14%) are more likely to smoke than Hispanics (10%) and nearly as likely as Blacks (15%) to do so, but a smaller share of Whites report being in fair or poor health, poor mental health, having diabetes, or being overweight or obese compared to Blacks and Hispanics. In addition, Hispanics (57%) and Asians (74%) in California are less likely than Whites (81%) to report having a usual source of care. Disparities in health factors and outcomes also exist across California’s 58 counties, with poor rural counties, especially those in the north and Central Valley, faring worse than urban ones on measures such as life expectancy, health behaviors, clinical care and environmental factors.24
Table 2: Selected Measures of Health Status and Health Access for Adults by Race/Ethnicity in California
Compared to the United States, 2013
Health Indicators
California
United States
White
Black
Hispanic
Asian
White
Black
Hispanic
Asian
Fair or poor health
13%
20%
29%
12%
16%
23%
26%
10%
Mental Distress
36%
39%
38%
35%
33%
36%
34%
30%
Smoke
14%
15%
10%
10%
19%
20%
14%
11%
Diabetes
8%
20%
12%
10%
9%
14%
11%
8%
Are overweight or obese
57%
74%
69%
40%
63%
73%
68%
41%
Have a usual source of care
81%
82%
57%
74%
82%
74%
59%
72%
Data may not sum to 100% due to rounding and data restrictions. Data for Whites and Blacks exclude Hispanics.SOURCES: Center for Disease Control and Prevention (CDC)’s Behavioral Risk Factor Surveillance System (BRFSS) 2013 Survey Results.
State and local efforts are underway to address health disparities in California. California’s Office of Health Equity (OHE) was integrated into the California Department of Health in 2012 to provide a leadership role in reducing health and mental health disparities among vulnerable communities, including racial minorities, the LGBT community, persons with disabilities, and undocumented immigrants. Among its major initiatives, the OHE has launched the California Reducing Health Disparities Project (CRDP), an initiative to reduce mental health disparities in the state. The Office also has a Climate Change and Public Health Team which has issued two reports on how to reduce the impact of climate change with an emphasis on vulnerable communities.25 In addition, through the leadership of OHE, the state is encouraging Health in All Policies (HiAP), a collaborative approach to improving the health of all people by incorporating health, equity, and sustainability considerations into decision-making across sectors and policy areas.26
Health Coverage in California Before the ACA
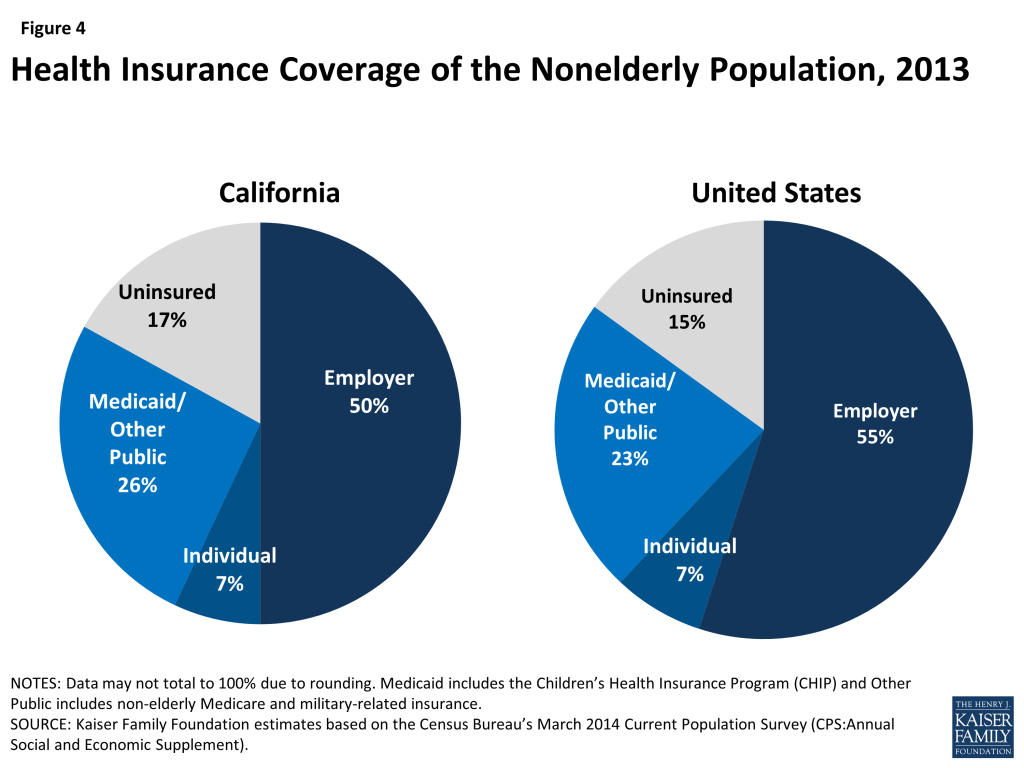
Figure 4: Health Insurance Coverage of the Nonelderly Population, 2013
Prior to ACA implementation, California had the largest number of uninsured of any state in the country. In 2013, just before the major coverage expansions of the ACA went into effect, 5.8 million nonelderly Californians (15%) were uninsured, and California alone accounted for 14% of all nonelderly uninsured people nationwide.27 In 2013, half of nonelderly Californians were covered under an employer plan, while over a quarter (26%) were enrolled in Medi-Cal, or other public coverage (Figure 4).28 Private coverage rates in the state were low due to a combination of high unemployment (which limited access to employer coverage) and high premium costs for non-group coverage29 (which made such coverage unaffordable for many). Pre-ACA public coverage through Medi-Cal was limited to only some groups of low-income adults, leaving many without an affordable coverage option.
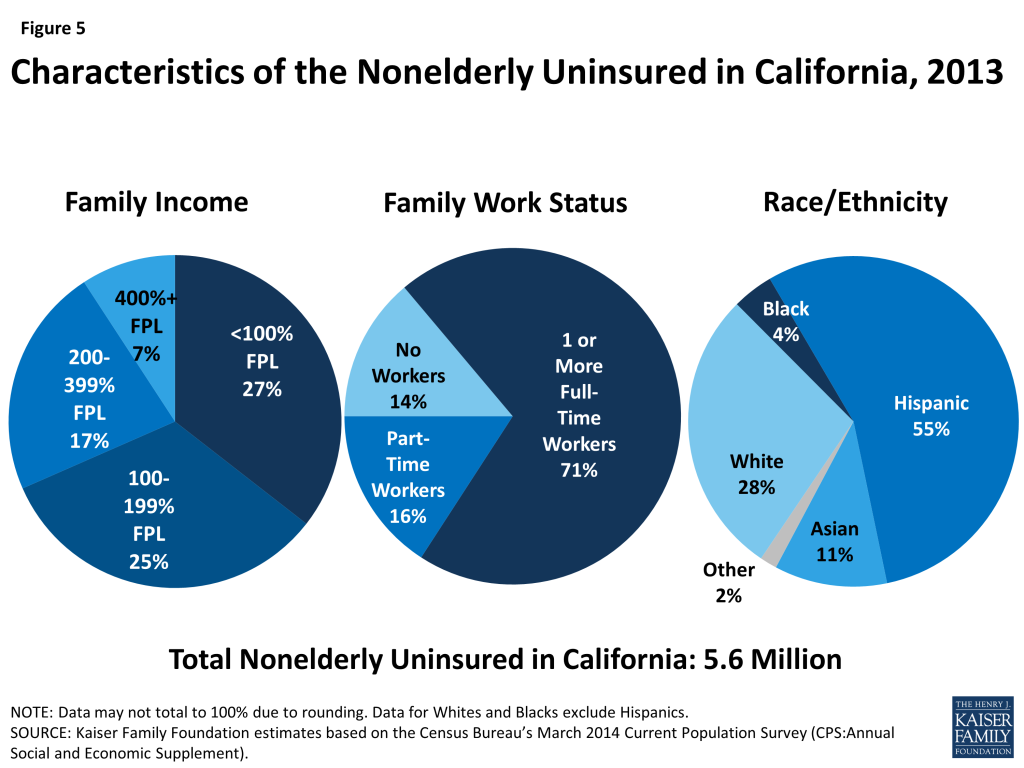
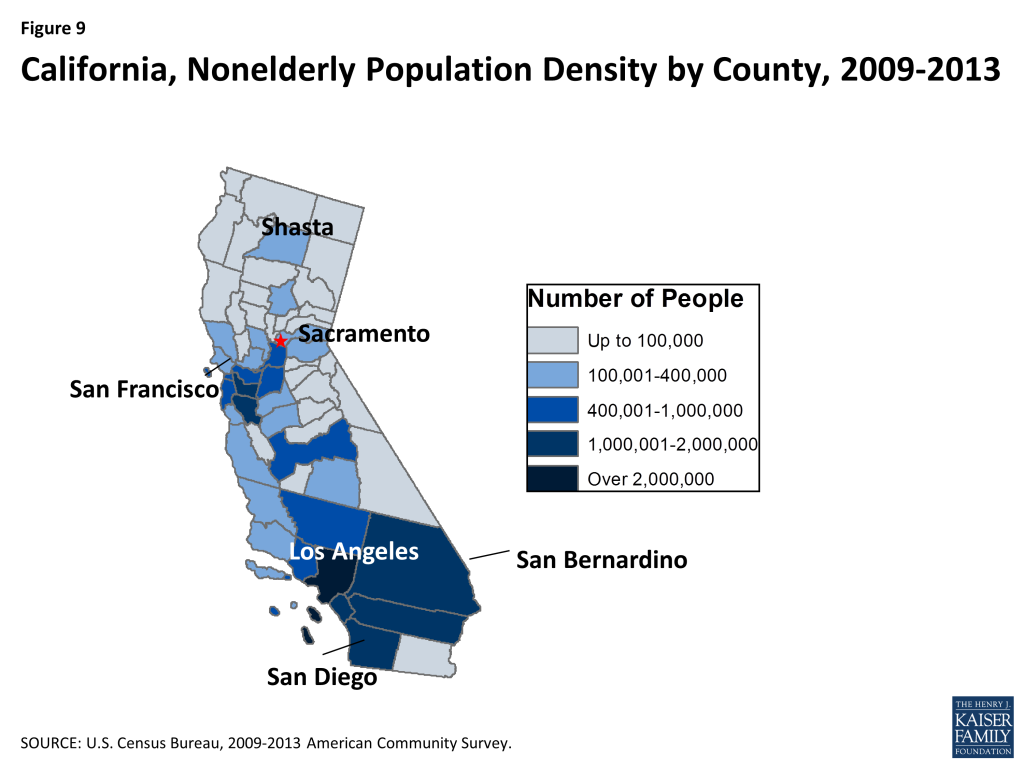
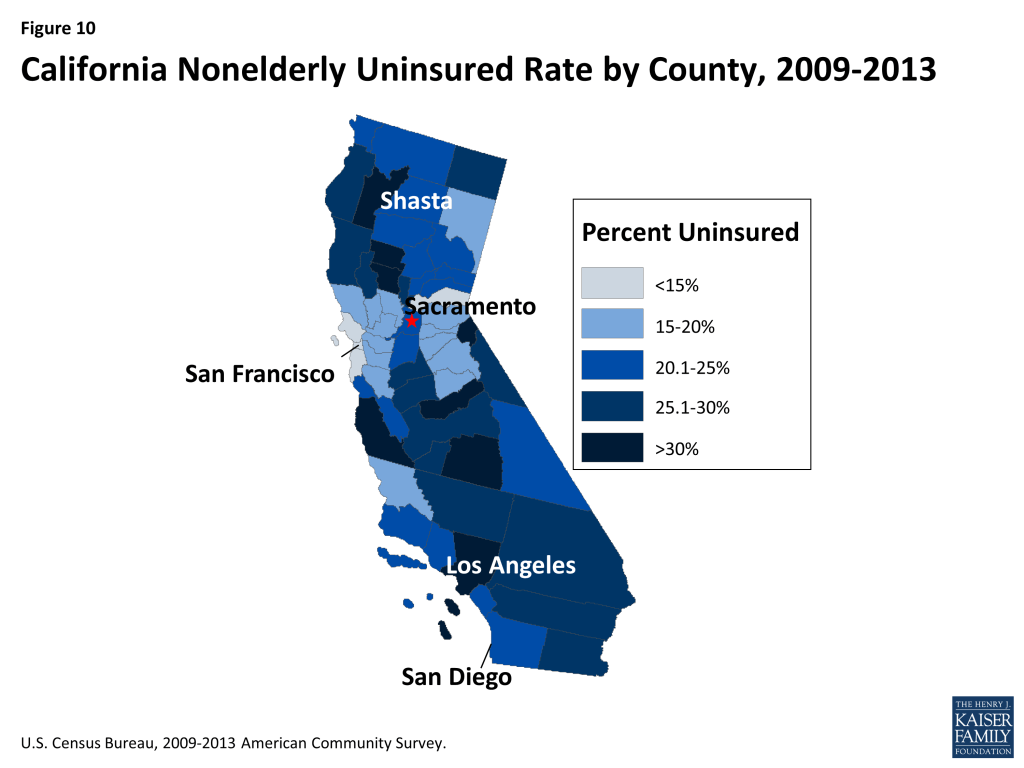
As in other states across the U.S., the majority of nonelderly uninsured people in California had at least one full-time worker in their household (71%), and more than half (52%) had incomes below 200% FPL. Over half (55%) of nonelderly uninsured Californians identify as Hispanic, over a quarter (28%) identify as White, 4% as Black, 11% as Asian, and 2% as another race/ethnicity (Figure 5).30 As shown in Figure 10 (Appendix), the nonelderly uninsured in California are not equally distributed across the state, with the San Francisco Bay Area and surrounding counties generally having lower rates of uninsured than other areas of the state.
Figure 5: Characteristics of the Nonelderly Uninsured in California, 2013
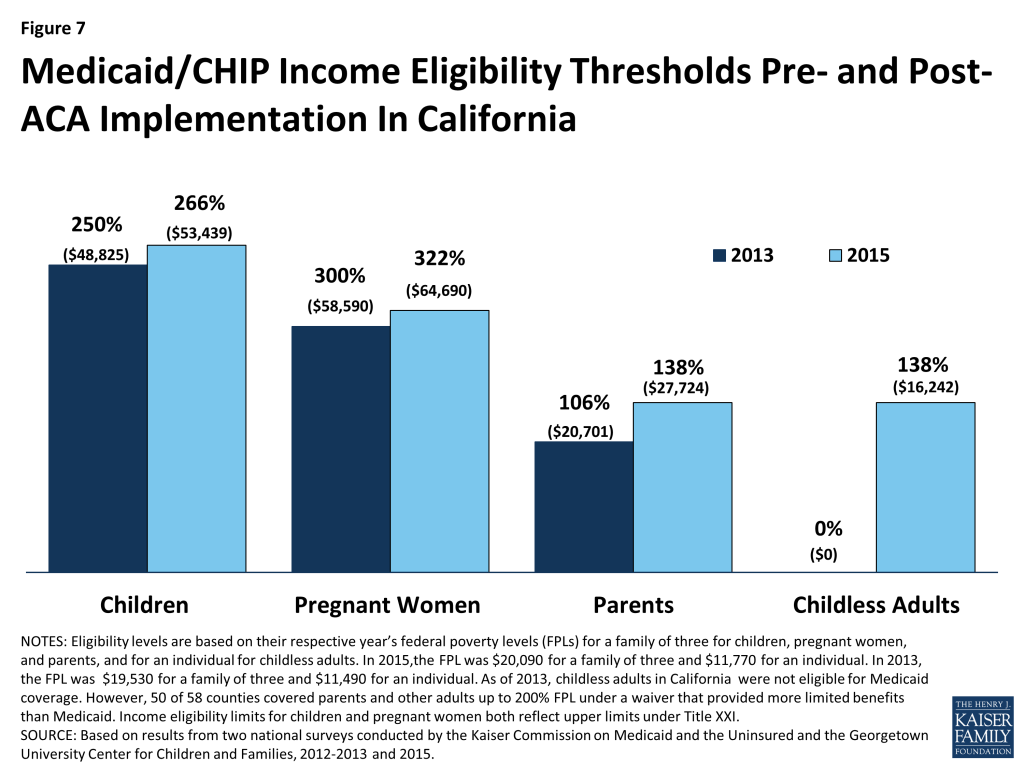
Before the ACA, Medi-Cal helped fill gaps in the availability of private coverage but was limited to certain groups. As of 2013, 41% of children were enrolled in Medi-Cal compared to 15% of nonelderly adults, reflecting differences in eligibility levels, as well as poverty levels, between these two groups.31 Historically, Medi-Cal eligibility for adults has been limited to parents with very low income. In 2013 children up to 250% FPL and pregnant women up to 300% FPL (under the CHIP unborn child option) were eligible for Medi-Cal or CHIP, while eligibility for working parents was 106% FPL (100% for non-working parents).32 Adults without dependent children were not eligible for Medi-Cal. However, since 2010, parents and other adults living in a county participating in the Low-Income Health Program (LIHP) were eligible for coverage under a waiver that provided more limited benefits than Medi-Cal (discussed in more detail below). Medi-Cal also covered individuals with disabilities and provided wrap-around coverage for many elderly in the state.
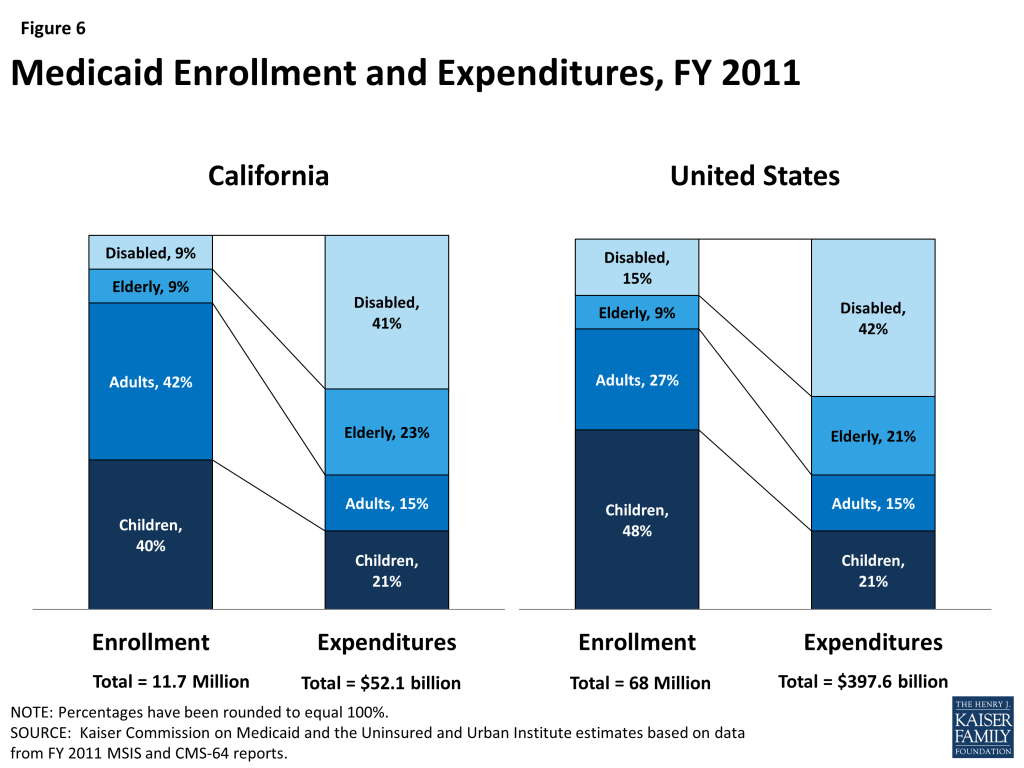
In 2011, the majority of Medi-Cal beneficiaries were children and non-elderly adults, but the elderly and people with disabilities accounted for most of the program’s expenditures. While most Medi-Cal enrollees in 2011 were children and adults (82%),33 they accounted for slightly over a third (36%) of total Medi-Cal expenditures.34 Conversely, the elderly and people with disabilities accounted for less than one-fifth (18%) of enrollees35 but nearly two-thirds (64%) of total program costs (Figure 6).36 Average spending per beneficiary in California in 2011 was $4,468, the fifth lowest in the country and below the national average of $5,790.37 Medicaid costs are shared by states and the federal government; for most services and groups before the ACA, the federal government paid 50% of Medi-Cal costs in California.38
Figure 6: Medicaid Enrollment and Expenditures, FY 2011
In January 2013, children enrolled in California’s separate CHIP program began transitioning to Medi-Cal. Prior to 2013, California had a separate Children’s Health Insurance Program (CHIP) called the Healthy Families Program (HFP). Beginning in January 2013, the state phased out this program and transitioned over 750,000 children from HFP into Medi-Cal. The state continues to receive enhanced CHIP matching funds for children in the income group previously covered through Healthy Families.39 While some access issues resulting from the transition were reported, the majority of children maintained access to the same primary care provider that they had while enrolled in HFP and still receive comprehensive health, dental, mental health and substance abuse services under Medi-Cal, according to a comprehensive report issued by the California Department of Health Care Services.40
Health Coverage Under The Affordable Care Act in California
A main goal of the Affordable Care Act (ACA) was to extend health coverage to many of the 42 million nonelderly uninsured individuals across the country, including many of the 5.8 million who lived in California.41 The ACA accomplishes this through insurance market reforms and by establishing new coverage pathways, including expanding Medicaid and providing premium subsidies to most individuals with incomes from 100 to 400% FPL to purchase coverage on the Health Insurance Marketplace. California expanded Medi-Cal to cover nearly all nonelderly adults with incomes at or below 138% FPL ($16,242 per year for an individual and $27,724 for a family of three in 2015) and established its own marketplace, called Covered California.
Leading up to and throughout ACA implementation, the state invested heavily in outreach and enrollment efforts for both Medi-Cal and Covered California. These efforts included statewide marketing campaigns, community mobilization, provider training, and targeted efforts to reach vulnerable populations who may be newly eligible for coverage. Covered California also established an Assisters Program and worked with community organizations to provide direct assistance to consumers to help them enroll in coverage. In addition, the state received extensive federal and private funds, most of which were distributed to localities, for local outreach efforts. These local outreach efforts included support for Medi-Cal Certified Enrollment Counselors, outreach to hard-to-reach populations, and marketing to increase awareness and understanding of new coverage options.42,43,44 In addition, 125 health centers operating over 1,000 sites throughout the state received federal grants to help with outreach and enrollment assistance.45 Supported by federal funding under the ACA, new grants in 2015 provided funding for the existing Covered California Outreach and Education Program, in-person enrollment assistance programs, and community outreach campaigns.46
Medi-Cal Expansion
California was one of a handful of states to undertake an early expansion of its Medicaid program in anticipation of full expansion in 2014. The state did so under its five-year “Bridge to Reform” §1115 Medicaid Demonstration Waiver, which was approved by the federal government in 2010. In addition to other provisions, the waiver allowed for federal matching funds for the creation of a county-based coverage expansion program, known as the Low-Income Health Program (LIHP), which covered low-income adults who were not otherwise eligible for Medi-Cal. The majority of counties participated in LIHP, and by the end of 2013, over 650,000 adults were enrolled in the program.47 The benefits provided under the waiver were more limited than Medi-Cal. These individuals were either auto-enrolled in Medi-Cal or transferred to Covered California when ACA coverage expansions became available in January 2014.48
Figure 7: Medicaid/CHIP Income Eligibility Thresholds Pre- and Post- ACA Implementation In California
The ACA Medicaid expansion resulted in increased Medi-Cal income eligibility levels for parents and other adults. Under the ACA expansion, nearly all citizens and legal immigrants who have been in the country for over five years with income at or below 138% FPL ($16,242 per year for an individual or $27,724 for a family of three in 2015) are eligible for Medicaid, and states receive substantially enhanced federal matching funds for this expansion population. As a result, eligibility levels for parents and childless adults increased after full ACA implementation.49,50 The ACA also changed the method for determining financial eligibility for Medicaid for children, pregnant women, parents, and adults and CHIP to a standard based on modified adjusted gross income (MAGI). As a result, existing Medicaid income limits for these groups were converted to MAGI-equivalent limits (Figure 7). While the converted 2014 standards appear higher than 2013 levels, they are intended to approximate the existing eligibility levels using different methodology for determining income. Enrollment in the Medi-Cal program grew by 37%, or 3.4 million people, between October 2013 and May 2015.51 While some enrollees may have been eligible for Medi-Cal before the ACA, many were likely newly-eligible under the adult expansion.52
Undocumented immigrants and some lawfully-residing immigrants remain ineligible to enroll in Medi-Cal. Under federal law, undocumented immigrants remain ineligible to enroll in federally-funded full Medi-Cal coverage. In addition, many lawfully present immigrants are subject to a five-year waiting period before they may enroll in Medi-Cal, and some groups of lawfully present immigrants remain ineligible regardless of their length of time in the country. However, the state has taken several actions to expand eligibility for immigrants. For example, it has taken up the options available to states to eliminate the five-year waiting period for lawfully-residing immigrant children and pregnant women. In addition, it extends coverage to pregnant women with incomes up to 322% FPL regardless of immigration status through the CHIP unborn child option.53 Recent state legislation would further expand coverage for undocumented immigrants. Senate Bill 4, known as the Health Care for All Act, passed the State Senate in June 2015. This bill would provide fully state-funded Medi-Cal coverage for children age 19 and under, regardless of immigration status.54 Some local programs in the state also cover immigrant children regardless of immigration status.
Under the ACA, all states are required to implement new simplified eligibility and enrollment processes. To implement these new processes, the state received federal funding to create a single online portal, available in Spanish and English, where users can apply and receive eligibility determinations for Medi-Cal or Marketplace insurance. The application can also be completed in-person, by phone, fax or mail, and paper applications are available in thirteen languages. In addition, the state adopted the Express Lane Enrollment Project to target adults and children enrolled in California’s Supplemental Nutrition Assistance Program (SNAP), known as CalFresh. Covered California’s online application system, also known as the California Health Care Eligibility, Enrollment and Retention System (CalHEERS), coordinates with county social services departments through an online system called Statewide Automated Welfare Systems (SAWS).55 However, like many states, California experienced outreach and enrollment challenges in 2014, including a shortage of in-person assisters,56 problems with cultural and linguistic resources,57 technological issues with the Covered California website,58 and a Medi-Cal backlog,59 which led to delayed or abandoned applications. Through late 2014 and 2015, the state took action to address many of the challenges it faced during the first open enrollment period, though some challenges remain.
Covered California
California operates its own state-based insurance marketplace, known as Covered California. Through Covered California, individuals who do not have access to another source of affordable coverage are eligible to purchase individual coverage directly from insurers. People with incomes above Medi-Cal eligibility but below 400% of poverty are eligible for premium tax credits, and people with incomes up to 250% of poverty are additionally eligible for cost-sharing subsidies. Legal, permanent residents who have been living in the country for less than five years may purchase health insurance through Covered California and may receive subsidies, but undocumented immigrants are currently prohibited from purchasing insurance in the Marketplace. If SB4, the “Health Care for All” Act is passed in its current form, undocumented Californians would be able to purchase unsubsidized insurance through Covered California.60 In addition, small businesses (up to 50 workers) can offer coverage to their workers via Covered California’s Small Business Health Options Program (SHOP). Beginning on October 1, 2013, individuals and small businesses could begin shopping for health insurance plans, and coverage began in January 2014. Ten health insurance companies offered plans in the Marketplace in both 2014 and 2015. Statewide in 2014, the average premium rate for the lowest cost Bronze plan was $219 per month and $304 per month for the lowest cost silver plan.61 The statewide average rate increased by 4.2% between 2014 and 2015 across plans and benefit designs: 16% of consumers saw their premium remain constant or decrease while the majority (71%) saw increases of up to 8%. In response to consumer feedback, some health plans expanded their provider networks in 2015.62
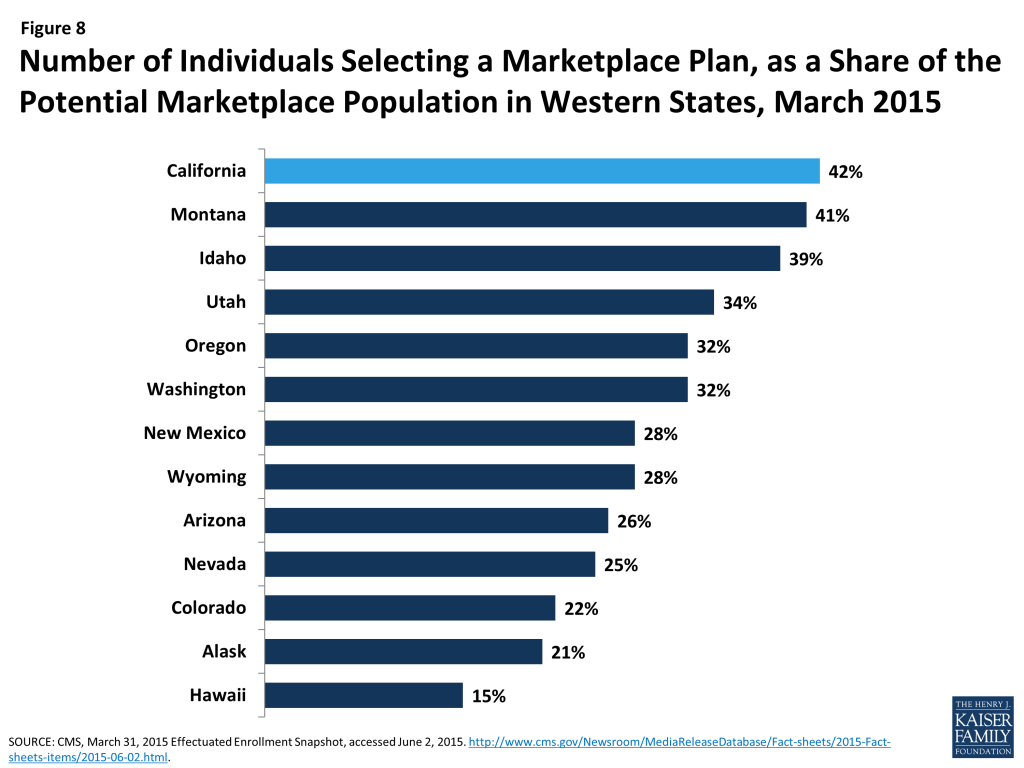
Figure 8: Number of Individuals Selecting a Marketplace Plan, as a Share of the Potential Marketplace Population in Western States, March 2015
As of March 2015, nearly 1.4 million people were enrolled in a Covered California health plan, representing 42% of the potential Marketplace population (Figure 8).63 Two-thirds (65%) of those enrolling during the second open enrollment period (2014-2015 period) were reenrolling, and over half were between the ages of 45 and 64 (51%).64 Almost nine out of ten (88%) enrollees are receiving premium tax subsides, while half (51%) are additionally receiving cost-sharing subsidies.65
Delivery System and the Safety Net
California’s counties play an important role in the structure and delivery of the state’s health care safety net. Counties in California are required by state law to be the health care providers of last resort for people who are medically indigent. However, significant variation exists with respect to the services provided, the method of delivery and the populations served. Twelve counties are “provider” counties, meaning they own and operate inpatient hospitals and clinics and generally provide coverage to broader groups of people than other counties.66 Five “payer” counties contract with private hospitals and/or clinics for care delivery, and six “hybrid” counties deliver outpatient care in their own clinics but contract with private hospitals for inpatient care. County Medical Service Program (CMSP) counties are part of an association of 35 primarily rural counties that collectively pay private providers for care. County programs are funded by a complicated mix of local, state, and federal funds, including Medi-Cal funds, and are also primary providers of public health services and behavioral health services for low-income, underserved, and uninsured populations.67 In addition, California is home to 129 federally-funded health center organizations, together running 1,225 delivery sites throughout the state. In 2015, the state’s health centers served nearly 3.5 million patients, 38.5% of whom were uninsured.68
California is in the process of reforming its payment and delivery system for safety-net programs with funding from a Medicaid Delivery System Reform Incentive Pool (DSRIP). In 2010, California was the first state to secure a DSRIP waiver designed in large part to continue supplemental payments to public hospitals while also ensuring a level of accountability for the funds. The DSRIP initiative was included in the Bridge to Reform §1115 waiver. California’s $6.67 billion dollar DSRIP initiative ties funding for the public hospitals to projects and milestones in one or more of five priority areas: infrastructure development; innovation and redesign; population-focused improvement; urgent improvement in care; and HIV transition projects.69,70 On average, each public hospital system is carrying out 15 simultaneous projects with an average of 217 milestones per year.71
On March 27, 2015, California submitted a renewal application for its Medicaid §1115 waiver, which is being renamed “Medi-Cal 2020.” The renewal requests authority for a series of delivery system transformation and alignment programs, including a continuation of DSRIP funding for public hospital systems. However, the proposed waiver expands the scope of DSRIP-eligible institutions to 42 safety net institutions run by health care districts (referred to as “non-designated public hospitals”). These institutions are predominantly located in rural areas and are often the only hospitals serving their communities. The delivery system transformation and alignment programs also seek to transform and improve the managed care system; improve the fee-for-service system used to pay for dental and maternity care; spur workforce development; increase access to supportive services and housing; and promote regionally-based “whole-person” integrated care pilot projects.72
Medi-Cal Managed Care
The majority of Medi-Cal beneficiaries receive their health care through a managed care plan. In May 2015, over 9.5 million people,73 or a little over three-quarters of the Medi-Cal population, were enrolled in a managed care plan. The state uses six different models of managed care, which vary with respect to how many plans operate in a county, whether the plans are private or county-operated, and whether there is a fee-for-service option. Each county is served by a single managed care model. In 35 counties, individuals may choose from between two and five plans, with at least one commercial plan option. In 22 counties, everyone is in the same managed care plan that is operated by the county, and one county (San Benito) offers a choice between one commercial plan and traditional fee-for-service.74
California has recently expanded mandatory enrollment in managed care to certain seniors and persons with disabilities (SPDs). Under California’s “Bridge to Reform” waiver, mandatory enrollment of Medi-Cal-only SPDs in California began in June 2011 in some non-rural counties.75 Goals of the transition included care coordination, better management of chronic conditions, improved health outcomes and cost savings. Dual eligible beneficiaries, those receiving long term care services, as well as certain other groups were excluded from this requirement. Since June 2011, approximately 340,000 SPDs in 16 counties were transitioned from fee-for-service (FFS) to managed care.76 Findings from a beneficiary survey of over 1,500 SPDs found that approximately two-thirds of SPD beneficiaries reported satisfactory experiences with the transition, while one third did not. Some key issues were identified in the notification and distribution of materials to beneficiaries as well as beneficiaries’ knowledge of plan navigation and consumer protections.77 The state and advocates are looking at the experiences from this transition to inform similar transitions in an additional 19 (rural) counties78 and the transition of dually eligible beneficiaries into managed care, both of which began in 2014.
The Coordinated Care Initiative (CCI) is changing the way seniors and persons with disabilities receive health care and long term services and supports (LTSS) in California. The goal of CCI is to enhance health outcomes and beneficiary satisfaction for SPDs and those dually eligible for both Medicare and Medi-Cal. CCI, which is being implemented in seven counties,79 contains two major components: Cal MediConnect and Managed Medi-Cal Long-Term Supports and Services (MLTSS).
Cal MediConnect is a three-year demonstration to integrate care and align financing for beneficiaries eligible for both Medicare and Medi-Cal. California is one of twelve states carrying out such a demonstration, which began in the state in April 2014.80 Cal MediConnect plans are responsible for the delivery and coordination of all Medicare and Medi-Cal medical, behavioral health, and long-term services and supports (LTSS) for their enrollees. Participation in the demonstration is voluntary for purposes of Medicare managed care enrollment, while all beneficiaries must enroll in managed care for purposes of their Medi-Cal benefits. Cal MediConnect enrollment is passive, and individuals must actively notify the state if they choose not to enroll. As of July 2015, the opt-out rate, excluding Los Angeles County, was 33%, consistent with most other states participating in the demonstration. Los Angeles had an unusually high opt-out rate of 51%.81
Under the Managed Medi-Cal MLTSS initiative, all Medi-Cal beneficiaries, including dual eligible beneficiaries, are required to join a Medi-Cal managed care plan to receive LTSS and other Medi-Cal-covered benefits. Managed care plans are required to provide care coordination for MLTSS beneficiaries. Some stakeholders have been concerned about the transition of SPDs to managed care because of the complicated nature of their health care needs and their use of multiple providers and medications.
Looking Ahead
With over 38 million residents, California is the most populous state in the U.S, and the health and health care of its residents have important implications for the nation at large. Through ACA implementation and changes to its Medi-Cal program over the past five years, the state expanded coverage to millions of the previously uninsured and developed the foundation for the state’s managed care infrastructure. Moving forward, the state continues to invest in its health care delivery system and infrastructure and to address the health care needs of the remaining uninsured and medically indigent populations. The state’s proposed “Medi-Cal 2020” waiver focuses on programs aimed at delivery system transformation and alignment, including an extension with some changes to the DSRIP program.82
Despite all of California’s efforts and successes, many challenges lie ahead. While substantial coverage gains were achieved under the ACA, millions of people are still uninsured and will likely rely on California’s public clinics and health centers when they need care, which will require ongoing support.83 Individuals who have newly gained coverage through Medi-Cal or the Marketplace are beginning to use their new health plans and seek care, but some are reporting access barriers and health literacy issues.84 These challenges notwithstanding, California has made substantial progress in reducing the number of uninsured in the state. From 2013 to 2014, the uninsured rate among the nonelderly in California dropped from 19.1 percent to 13.4 percent, with an even bigger drop among nonelderly adults targeted by ACA expansions.85 These coverage gains, combined with delivery system transformation, payment reform and continued support to the health care safety net will likely impact the health, health care access, and health care utilization of Californians in the long term.
Appendix
Figure 9: California, Nonelderly Population Density by County, 2009-2013Figure 10: California Nonelderly Uninsured Rate by County, 2009-2013
U.S. Census Bureau: State and County QuickFacts. Data derived from Population Estimates, American Community Survey, Census of Population and Housing, State and County Housing Unit Estimates, County Business Patterns, Nonemployer Statistics, Economic Census, Survey of Business Owners, Building Permits , http://quickfacts.census.gov/qfd/states/06000.html. ↩︎
Office of the Assistant Secretary for Planning and Evaluation (ASPE), Health Insurance Marketplaces 2015 Open Enrollment Period: March Enrollment Report, 11-15-14 to 2-15-15 (including SEP activity reported through 2-22-15)(HHS, March 10, 2015). ↩︎
The counties that participated in this transition are Alameda, Contra Costa, Fresno, Kern, Kings, Los Angeles, Madera, Riverside, Sacramento, San Bernadino, San Diego, San Francisco, San Joaquin, Santa Clara, Stanislaus, and Tulare. Source: California Department of Health Care Services, http://www.dhcs.ca.gov/individuals/Pages/MMCDSPDEnrollment.aspx. ↩︎
McDonnell D and Graham C, Health Affairs, 2015. “Medicaid Beneficiaries in California Reported Less Positive Experiences When Assigned To a Managed Care Plan.” 34 (3) 447-454. ↩︎
The counties that participated in this second transition are Alpine, Amador, Butte, Calaveras, Colusa, El Dorado, Glenn, Imperial, Inyo, Mariposa, Mono, Nevada, Placer, Plumas, Sierra, Sutter, Tehama, Tuolumne, and Yuba. Source: California Department of Health Care Services, http://www.dhcs.ca.gov/individuals/Pages/SPDRegional_Imperial_Imp.aspx. ↩︎
The counties participating in the Coordinate Care Initiative are Los Angeles, Orange, Riverside, San Bernadino, San Diego, San Mateo, and Santa Clara. Alameda was originally slated to participate but is no longer moving forward with CCI. SourceL Department of Health Care Services, http://www.dhcs.ca.gov/provgovpart/Pages/CoordinatedCareIntiatiave.aspx. ↩︎
The ‘Private Option’ Medicaid Expansion in Arkansas Has Helped Reduce the Uninsured Rate and Uncompensated Care Costs While Boosting the State’s ACA Marketplace
A new issue brief from the Kaiser Family Foundation finds that Arkansas’ “private option” Medicaid expansion has helped reduce the number of uninsured and bring down uncompensated care costs while strengthening the state’s ACA marketplace. A Look at the Private Option in Arkansas draws upon early data as well as interviews conducted in spring 2015 with state officials, providers, insurance carriers, and consumer advocates to provide an initial look how implementation of the private option is going. Under the initiative, Arkansas became the first state in the nation to secure a federal waiver allowing it to require adults newly eligible for Medicaid under the ACA to enroll in private health plans offered through the marketplace, with the federal government paying the cost through premium assistance. This initiative has allowed Arkansas to cover 245,000 newly eligible adults. Arkansas political leaders have announced they will continue the initiative through 2016 while a state taskforce develops recommendations for the future, and the initiative continues to be closely-watched by policymakers in other states. Among the issue brief highlights:
Like more traditional Affordable Care Act Medicaid expansions in other states, Arkansas’ private option has helped spur a reduction in the uninsured rate among non-elderly adults, dropping from 27.5 percent to 15.6 percent, and a 55 percent drop in uncompensated care in the state’s hospitals, with Medicaid beneficiaries experiencing increased access to care.
More unique to Arkansas, the private option has more than tripled enrollment in the Arkansas marketplace, helping to boost competition among insurers and contributing to reductions in premiums. Unlike many other states, Arkansas did not have an established Medicaid managed care delivery system prior to expansion. The private option also has proven more administratively complex to implement than a traditional ACA Medicaid expansion.
Arkansas’ decision to operate a federal-state partnership marketplace gave the state the ability to shape and monitor plans, an important factor in implementing the private option. For example, stakeholders credited Arkansas with standardizing the marketplace plans’ cost-sharing design and making supplemental cost-sharing reduction payments directly to plans, protecting beneficiaries from having to make out-of-pocket payments upfront and then be reimbursed.
The full issue brief, as well as other resources on the Affordable Care Act and the Medicaid expansion, are available at kff.org.
In September 2013, Arkansas became the first state in the nation to receive approval from the federal government for a Section 1115 demonstration waiver to require most adults who are newly eligible for coverage through the Affordable Care Act’s Medicaid expansion to enroll in Marketplace plans. The initiative, often referred to as the “private option,” has allowed Arkansas to cover close to 220,000 Medicaid beneficiaries with commercial provider networks and strengthen its Marketplace. An additional 25,000 medically frail adults are covered through the state’s fee-for-service system, bringing to 245,000 the number of newly eligible adults covered in Arkansas as of June 30, 2015. As a result of this coverage, Arkansas has been able to drive down its uninsured rate and reduce uncompensated care costs. The future of the private option is the source of extensive discussion within Arkansas, and it continues to be watched closely by policymakers within the state and around the country. Drawing on a dozen interviews with state officials, providers, insurance carriers, and advocates, as well as early data on coverage, reduced uncompensated care costs, and other topics, this issue brief provides an initial look at implementation. Key findings include the following:
Arkansas cut its uninsured rate among non-elderly adults nearly in half (from 27.5 percent to 15.6 percent) between 2013 and 2014. This reduction, the second largest percentage point decline nationally, was realized in large part due to the coverage pathway offered through the private option as Arkansas had the lowest eligibility threshold for adults in the country prior to 2014. These gains are consistent with the experience of states that expanded coverage through their traditional Medicaid programs. The marked increase in coverage in Arkansas occurred despite limits on funding for outreach and enrollment, eligibility computer system issues, and confusion among some beneficiaries about where to seek enrollment assistance. Arkansas’ use of fast track enrollment strategies, by using SNAP data to identify beneficiaries eligible for the private option, contributed to strong early enrollment in the program. Since the time of our interviews in the spring of 2015, Arkansas has been confronting operational challenges in conducting renewals in traditional Medicaid and for the private option. Since these renewal issues are not specific to private option enrollees and arose after the interviews for this brief were completed, they are not addressed in any detail.
Stakeholders reported that private option enrollees are generally able to access services, and hospitals are seeing sharp drops in uncompensated care, while the impact on community health centers is more mixed. Close to four in ten private option enrollees gained coverage for the first time in their lives,1 and stakeholders reported that enrollees were able to access a broad set of services, including specialty care and providers in rural areas. Hospitals saw a 55 percent drop in uncompensated care costs and signs of people seeking care in more appropriate community-based settings instead of emergency rooms. Community health centers also are seeing more insured patients, but some reported challenges due to delays in cost-based reimbursement payments from the state or noted that new clinics established by Marketplace plans could “skim off” their insured patients. These findings are similar to the experience of other states that have expanded coverage, regardless of the mechanism used to implement the Medicaid expansion.
Early reports indicate that private option beneficiaries are receiving wrap-around protections for premiums and cost-sharing that exceed Medicaid limits, while access to wrapped benefits required by Medicaid but not covered in the Marketplace was more mixed. Stakeholders credited Arkansas with protecting beneficiaries from having to make burdensome out-of-pocket payments upfront and then be reimbursed; this was accomplished by standardizing the Marketplace plans’ cost-sharing design and having the state make supplemental cost-sharing reduction payments directly to Marketplace plans. Nearly all required Medicaid benefits are provided directly through Marketplace plans, minimizing the need for a “wrap.” However, two benefits – non-emergency medical transportation and Early, Periodic Screening, Diagnosis and Treatment (EPSDT) for 19 and 20-year olds – are provided as a wrap through the fee-for-service system, and stakeholders reported some concern that beneficiaries do not always know how to access these benefits, particularly EPSDT.
The screening tool used to identify medically frail beneficiaries is reported to be working well, although some stakeholders are concerned that it is underutilized. As of June 2015, 9.95 percent of beneficiaries (25,800 individuals) were considered medically frail and served through the state’s traditional fee-for-service Medicaid program, which includes long-term services and supports, instead of in Marketplace plans. While there were no reports that beneficiaries were unable to secure a designation as medically frail, some stakeholders expressed concern that many beneficiaries are auto-assigned into a Marketplace plan, and therefore bypass the screening, raising the possibility that some medically frail individuals are not being identified early on.
The private option has helped to increase competition in the Arkansas Marketplace and contributed to reductions in premiums. The private option has nearly tripled enrollment in Arkansas’s Marketplace, helping to boost the number of carriers offering Marketplace plans statewide from two in 2014 to as many as six in 2016; generating a younger and relatively healthy risk pool; and contributing to a two percent drop in the average rate of Marketplace premiums between 2014 and 2015.
Despite early concerns, the private option appears on track to meet or even outperform federal budget neutrality requirements. Spending on the private option initially was higher than the budget neutrality projections prepared for the waiver, but more recent data suggests that the state is meeting its targets and may even succeed in limiting spending to significantly below the allowable levels. Stakeholders also are closely watching the broader question of whether the private option will prove cost-effective as compared to traditional Medicaid coverage. As part of its waiver, Arkansas is permitted to use criteria that differ from what is otherwise required under federal law to evaluate cost-effectiveness. These include the private option’s impact on coverage, access to care, Marketplace competitiveness, and reductions in churning between Medicaid and Marketplace coverage. While it will be some time before data are available to definitively answer this question, the private option is credited with saving the state over $88 million and generating new revenue of $29.7 million in state fiscal year 2015.
Looking Ahead
Slated to continue through 2016, the private option is now part of an active political and policy debate in Arkansas. A state legislative taskforce and a Medicaid advisory group are in the midst of developing recommendations for the future of Arkansas’ Medicaid program, including the private option. Many stakeholders expect that coverage for newly eligible adults will continue in some form, building on the foundation established by the private option, and also that the private option will be modified in the years ahead. As importantly, the state will need to consider with the future of its fee-for-service system, which continues to serve the vast majority of the state’s beneficiaries, including medically frail adults with the greatest health care needs.
For other states, the Arkansas experience offers lessons on how they might combine their Medicaid programs and Marketplaces, leveraging the buying power of these two markets and potentially providing greater access to care and continuity of coverage. Stakeholders also noted that the private option has proven more administratively complex to implement than a traditional Medicaid expansion, requiring close collaboration across state agencies and other stakeholders. Notably, unlike many other states, Arkansas did not have an established Medicaid managed care delivery system prior to expansion or a fee-for-service network that was equipped to serve a significant number of newly eligible adults. In some states, particularly those that already have a well-developed Medicaid managed care system, the private option may not be a good “fit.” However, even in these states, the Arkansas experience highlights the considerable flexibility available to design an extension of coverage to newly eligible adults consistent with a state’s delivery system, political culture, and larger health care goals.
Introduction
In September 2013, Arkansas became the first state in the country to secure Section 1115 demonstration waiver approval from the Centers for Medicare and Medicaid Services (CMS) to require adults newly eligible for Medicaid with income up to 138 percent of the federal poverty level (FPL, $16,243 per year for an individual in 2015) who are not medically frail to enroll in private health plans offered through the Arkansas Marketplace.2 (Newly eligible adults who are medically frail are served through the state’s fee-for-service system rather than the demonstration, as discussed in more detail below.) Arkansas’s demonstration uses Medicaid funds as premium assistance to purchase Marketplace coverage for parents with income from 17-138 percent FPL and childless adults from 0-138 percent FPL. These newly eligible adults are Medicaid beneficiaries and must be provided with all Medicaid benefits and cost-sharing protections, either through a Marketplace plan or via a “wrap” through the state’s Medicaid program. The approach, often referred to as the “private option,” was designed by the state with goals of increasing access to care by placing beneficiaries in private health plans with a robust provider network; reducing the effects of churning as enrollees move between Medicaid and Marketplace coverage as their income fluctuates; and reinforcing the state’s broader health care delivery system reform efforts. The private option expansion now covers close to 220,000 newly eligible adults in Arkansas, and is authorized by CMS through the end of 2016. An additional 25,000 newly-eligible adults are covered through the state’s fee-for-service system, bringing the total number covered to 245,000 as of June 30, 2015.3
This issue brief offers an early look at implementation of the private option expansion, drawing on a dozen interviews with a broad array of Arkansas stakeholders and early data on coverage, reduced uncompensated care costs, and other topics. Interviews were conducted in April and May 2015 with state officials, providers, insurance carriers, and beneficiary advocates (The interview guide is contained in Appendix A). The findings also are informed by data and reports from the state Medicaid agency and the state insurance department; state legislative oversight committees; and CMS. The brief provides a short history of the private option expansion; presents key findings along several dimensions, focusing on the implications of the model on beneficiaries; and discusses lessons for other states and prospects for the future of the private option expansion in Arkansas.
History of the Private Option Expansion
Arkansas was the first state to consider mandating enrollment in Marketplace plans for adults newly eligible for Medicaid. While states have a long history of using Medicaid funds to purchase employer-based coverage for Medicaid beneficiaries, it was not until passage of the Affordable Care Act (ACA) that states began to look closely at purchasing individual insurance policies with Medicaid funds. Prior to the ACA’s insurance market reforms, premium assistance models in the individual market were challenging for state Medicaid programs to administer. Insurers were not obligated to issue policies; they could impose pre-existing condition exclusions; and they could charge higher premiums for people with extensive health care needs, making it impossible or prohibitively expensive for states to buy individual policies for Medicaid beneficiaries. The individual market also lacked standardized plans and benefit design. After ACA reforms to the individual insurance market eliminated many of these hurdles, CMS issued regulations to give states the option to use Medicaid funds for voluntary enrollment in premium assistance, including for Marketplace plans, without requiring waiver approval.4 In March 2013, CMS released guidance indicating that it would consider approving a limited number of demonstrations that required Medicaid beneficiaries to enroll in Marketplace plans, within certain guidelines.5 The private option expansion was designed by state legislative leaders, then-Governor Mike Beebe, and state agency leadership in the second half of 2012 and 2013. At the time, it was clear that the Arkansas legislature would not approve a traditional Medicaid expansion. The Arkansas constitution requires a 75 percent super majority to approve initiatives requiring appropriations, and there were not enough votes in favor of funding a traditional Medicaid expansion. To move forward, the state required an alternative approach. (Figure 1)
Figure 1: Key Dates for the Private Option
After the legislature authorized expansion through the private option, close collaboration was required among state officials and other stakeholders to implement the program. The Arkansas state legislature debated and ultimately approved authorizing legislation, and the private option expansion was signed into law by Governor Beebe on April 23, 2013.6 In some respects, though, the detailed work of developing the private option expansion was just beginning. Implementation required a Section 1115 Medicaid waiver from CMS, primarily because Arkansas sought to require beneficiaries to enroll in Marketplace plans. The state submitted its waiver application in August 2013. In relatively short order, but, still less than a week before the launch of the initial open enrollment period for Marketplace coverage, Arkansas received waiver approval on September 27, 2013.7
The administrative complexity of operationalizing the private option expansion in a relatively short timeframe required the state to navigate a variety of implementation issues on the state and federal levels. While waiver negotiations were ongoing, the state also was handling other implementation issues, such as working with insurers to develop their rates for participating in the Marketplace; building the enrollment portal that beneficiaries would use to select a Marketplace plan; and developing educational materials and notices for beneficiaries. The initiative requires the state insurance department to oversee the Marketplace plans that serve newly eligible adults,8 while the state Medicaid agency retains ultimate responsibility for ensuring that beneficiaries are provided with coverage that meets federal Medicaid standards. As a result, implementation required what stakeholders described as an unprecedented level of cooperation between the state Medicaid agency and state insurance department. The state began accepting applications for the new program on October 1, 2013, and coverage began on January 1, 2014.
Since 2013, the private option expansion has continued to undergo changes. The Arkansas Senate approved continued funding of the private option expansion in February 2014, but the House voted five times before the required super majority reauthorized it in early March 2015. The final legislation included a ban on using government money to fund outreach and enrollment assistance for health coverage broadly (not just for private option enrollees);9 the acceleration of implementation of new Health Independence Accounts through which private option enrollees would pay cost-sharing; and changes to the state’s non-emergency medical transportation benefit.10
The private option expansion’s future is currently under discussion. On January 22, 2015, the new Governor, Asa Hutchinson, gave a speech outlining his thoughts on the private option. The Governor, who inherited the private option from the earlier Democratic Administration, described the private option as innovative and rooted in market principles. He explained it has offered important benefits to Arkansas residents and the state’s hospitals, while also calling on the legislature to establish a task force to explore more wide-ranging reforms of the state’s Medicaid program.11 In response, the legislature extended funding for the private option through 2016 when the initiative is slated to sunset, and created the Legislative Health Reform Task Force, which will make recommendations by December 2015 for modernizing the state’s overall Medicaid program. The Governor also issued an executive order creating a Medicaid Advisory Committee, headed by the state’s surgeon general, that will provide input into this process.
Issue Brief
Key Findings
Interviews with stakeholders and early data reveal the impact of the private option’s early implementation in the following areas:
Coverage
Since the private option’s launch in October 2013, 245,000 people12 have enrolled in coverage, contributing to Arkansas’s role as a national leader in reducing the uninsured rate. Between 2013 and 2014, Arkansas cut its uninsured rate among non-elderly adults almost in half, dropping it from 27.5 percent to 15.6 percent, one of the largest declines in the country (Figure 2).13 States that adopted a traditional Medicaid expansion also experienced sizeable reductions in uninsured rates.14 Advocates, providers and others report that the coverage has been “a blessing” for Arkansans, many of whom never had coverage before and who previously got care only episodically or in emergencies, leaving them with untreated chronic conditions and without reliable access to preventive care. The private option expansion also is credited with reducing the incentive to apply for SSI benefits by making health coverage available and helping people get medical treatment so they can return to work; since the private option expansion was implemented, SSI applications in Arkansas have dropped for the first time, by about 19 percent.15
Figure 2: Arkansas had the nation’s second largest percentage point drop in non-elderly adults (18-64) uninsurance, 2013-2014
The private option expansion is not the only source of coverage gains in Arkansas, but it has contributed substantially to the reduction in Arkansas’s uninsured. The state also has some 54,000 people enrolled in Marketplace plans outside of the private option,16 as well as an increase in enrollment in its pre-existing Medicaid program. As some stakeholders pointed out, the extent of these coverage gains reflects in part that Arkansas had one of the highest uninsured rates in the country prior to implementation, magnifying the importance of the state’s decision to establish the private option. Prior to expanding Medicaid, Arkansas covered parents with incomes below 17 percent FPL ($3,415 per year for a family of three in 2015), one of the lowest eligibility thresholds in the country.17 It did not provide any coverage for childless adults without disabilities regardless of how low their income was.
Outreach and Enrollment
As the private option expansion was first being implemented in the fall of 2014, the state was able to quickly and efficiently enroll 60,00018 eligible individuals using “fast track” enrollment strategies offered by CMS. Under fast track enrollment, the state Medicaid agency used data available from SNAP files to identify parents and childless adults who met the private option eligibility criteria and sent them an enrollment form to return if they wanted coverage. By using data it already possessed, Arkansas generated a one-time boost in enrollment that contributed to a strong launch of the private option. Stakeholders also cited the state’s rapid creation of the enrollment portal that allows individuals eligible for the private option to select a Marketplace plan as contributing to the initial enrollment success.19 However, some interviewees noted that the fact that there are two separate web portals for eligibility determinations and plan selection increases the complexity and administrative burden of the enrollment process for beneficiaries; one stakeholder also noted that even if there was a single portal for eligibility and plan selection, beneficiaries still might feel overwhelmed or confused by the plan choices and not select a plan on their own.
Many stakeholders felt the legislature’s 2014 decision to bar the use of government funding for outreach and enrollment negatively affected beneficiaries. Hospitals, community health centers and advocacy groups stepped in to provide some education and outreach and partnered with churches and local businesses with connections to beneficiaries, such as the poultry industry, to provide enrollment assistance, but they have not been able to fully meet this need. Stakeholders reported that beneficiaries are sometimes confused about their health plan options, where to go for help if they have issues, and which government agency – the state Medicaid agency or state insurance department – is responsible for answering their questions.20 One concern is that the ban on state expenditures for outreach may contribute to a higher-than-necessary rate of auto-assignment into Marketplace plans; lacking sufficient assistance, some beneficiaries may be auto-assigned to a plan and therefore miss the opportunity to complete the medically frail screening process and select a health plan as discussed below.
A number of stakeholders pointed out that the issues confronting Arkansas’s Medicaid eligibility and enrollment system have added to the challenges beneficiaries face in navigating the private option. Like a number of other states, Arkansas has faced challenges complying with the sweeping changes made to Medicaid eligibility and enrollment procedures in the ACA. These larger system issues are not specific to the private option, but they still have resulted in enrollment delays, added to beneficiary confusion, and raised concerns about the timeliness of coverage renewals.
Medically Frail Enrollees
Stakeholders thought the medically frail screening tool worked well to identify people with extensive health care needs who would be better served in the traditional Medicaid program. No one reported hearing about beneficiaries who wanted to be considered medically frail but who could not secure this designation. As of June 2015, 9.95 percent of newly eligible adults – or 25,800 individuals – were deemed medically frail and enrolled in the state’s fee-for-service Medicaid program.21 By default, they receive the traditional Medicaid state plan benefit package, which includes long-term services and supports (LTSS) not available to private option enrollees. At their option, medically frail individuals instead can elect to receive the same benefit package as private option enrollees (although they still receive these benefits through the fee-for-service system). In some instances, the private option benefit package may be more useful to a beneficiary depending on individual circumstances; for example, it includes substance abuse treatment services not available in Arkansas’s traditional Medicaid benefit package for adults. To date, the vast majority – 88 percent – of those designated medically frail have remained in the traditional Medicaid benefit package.22 Additional information about Arkansas’ medically frail screening process is contained in the box on the next page.
Arkansas’ Medical Frailty Screening Tool
Once determined eligible for Medicaid, newly eligible adults in Arkansas are instructed to visit the state enrollment portal to complete a 12-question screening tool to assess whether they qualify as “medically frail.” The screening tool is designed to identify people with extensive medical needs, such as those with serious and complex medical conditions, disabling mental health disorders, and limitations with one or more activities of daily living. The screening tool includes the following domains: health self-assessment; living situation; assistance with activities of daily living (ADLs) and instrumental activities of daily living (IADLs); overnight hospital stays (both acute and psychiatric); and number of physician, physician extender or mental health professional visits. It gathers information online (unless an individual requests a paper copy) and consists of yes/no and multiple choice questions. Responses are entered into software that calculates whether the person meets the medically frail criteria. The screening tool methodology is a combination of threshold qualifying characteristics, such as the presence of an ADL or IADL limitation, and a weighted scoring algorithm based on applicant responses to other screening questions.
As of February 2014, out of 105,000 beneficiaries eligible for the private option, 58,000 bypassed the medical frailty screening, 36,000 were screening and determined not to be medically frail, and 11,000 were screened and determined to qualify as medically frail.23 Of these 11,000 medically frail beneficiaries, 3,000 were automatically deemed medically frail because they have an ADL or IADL limitation; are homeless or living in an institution or group home; or have a history of psychiatric hospital admissions.24 The remaining 8,000 medically frail beneficiaries qualified because they were determined likely to need services placing them in the top 10 percent of costs, based on their self-reported health status, inpatient admissions, and emergency room and office visits for physical and mental health conditions in the last six months.25
Stakeholders expressed concern that some individuals are bypassing the medically frail screening because they are auto-enrolled into plans. As of June 2015, 40 percent of individuals identified as newly eligible in year 2 of the program were auto-enrolled into plans.26 Because they did not go to the enrollment portal to select a Marketplace plan, they also missed the chance to complete the medically frail screening. Beneficiaries who bypassed the medically frail screening included those who were automatically enrolled based on SNAP data and those who applied for coverage on the federal Healthcare.gov website. Despite the large number of enrollees who bypassed the screening tool, Arkansas met its estimate of identifying 10 percent of newly eligible adults as medically frail because 23 percent of those who responded to the screening tool between October 2013 and February 2014 qualified.27
While they can elect to undergo medically frail screening at any time, it is not clear that beneficiaries are always aware of this option. Moreover, the mid-year process that insurance carriers use to identify medically frail individuals is a source of confusion and is used sparingly. To date, only about 18 additional individuals have been identified as medically frail after carriers flagged them for screening based on their claims history.28 Of these, 5 enrollees asked to be moved to fee-for-service Medicaid. The remainder elected to remain with their Marketplace plans raising the prospect that at least some medically frail individuals may prefer enrollment in Marketplace plans if they are not in need of the specialized services available in the traditional Medicaid package.29 The state is including a reminder in the renewal notices sent to people who must take action to continue their coverage that they should return to the enrollment portal to select a plan and, in the process, undergo screening for medical frailty.30 Beneficiaries also have the opportunity during the open enrollment period to select a new plan and, if they do, they will be prompted to undertake a medical frailty screening.31
Arkansas designed its medical frailty screening tool not only to identify those with exceptional needs, but also to minimize the risk that plans would have to cover beneficiaries with the highest costs in the first year of the private option. Arkansas targeted the group of beneficiaries who are expected to incur the top 10 percent of health care costs as a proxy for identifying those who were most likely to need services, such as LTSS, that are not available in the Marketplace plans’ benefit package.32 State officials reported that insurers needed information about the private option risk pool to establish Marketplace premiums in the first year, and the 10 percent target helped provide predictability for this purpose.33 State officials also indicated that the medically frail screening tool was designed to be over rather than under-inclusive initially, by targeting people with “exceptional medical needs” in addition to those who meet the federal definition of medically frail.34 In future years, the state expects to refine the screening tool to eliminate false positives, validate screening responses through claims data, and better identify beneficiaries who need LTSS.35 To date, medically frail beneficiaries (10 percent of newly eligible adults in Arkansas) account for about 17 percent of expenditures for Arkansas’ entire Medicaid expansion population.36
Stakeholders highlighted the importance of continuing to improve the state’s Medicaid fee-for-service delivery system for medically frail individuals. Medically frail individuals, by definition, are likely to have more extensive health care needs and higher costs than other newly eligible adults. A number of stakeholders pointed out that medically frail enrollees are perhaps in greater need of better provider networks and delivery systems than private option enrollees. Given that Marketplace plans may not be well-equipped to provide some of the more specialized long-term services and supports critical to many individuals who are medically frail, stakeholders did not recommend that this population be mandatorily enrolled in the private option, but rather that steps be taken to strengthen the fee-for-service delivery system available to such individuals or perhaps that they be given the choice of enrolling in the private option when that system could better meet their individual needs.
Access to Care and Utilization
One of the clearest themes to emerge from interviews with stakeholders was that the private option coverage expansion has succeeded in providing beneficiaries, most of whom were previously uninsured, with access to care.37 States that implemented traditional Medicaid expansions also saw significant gains in access to care among adults who gained coverage.38 Stakeholders reported that beneficiaries appreciate having the same commercial insurance card as other Marketplace enrollees and the access to doctors, hospitals, clinics, and specialists that these plans offer. The access to specialists was highlighted by a number of stakeholders as particularly important: while traditional Medicaid beneficiaries often can secure primary and preventive care from community health centers, they may encounter more challenges accessing specialists. An additional advantage of consistent access to care is that it allows private option enrollees to receive care coordination and monitoring of their conditions over time. In the past, many private option enrollees were largely excluded from the health care system – they might have had intermittent care, but they did not have access to continuous coverage. On the other hand, one stakeholder suggested that a lack of experience with commercial insurance plans might have resulted in underutilization of benefits by private option enrollees.
The private option expansion also may be increasing access to care for all Arkansans. In some instances, the private option is credited with encouraging carriers to develop capacity that generated a positive spill-over effect for all community members. One stakeholder, for example, cited a carrier’s decision to set up new outpatient clinics as an outgrowth of the private option coverage expansion. Another noted that some clinics and providers throughout the state are now offering Saturday hours to accommodate the growth in the number of insured patients. This expansion of access may also be related to the state’s patient-centered medical home initiative, which also was included in the legislation that created the private option. It is one component of a larger multi-payer comprehensive payment reform effort aimed at incentivizing quality and cost-effective care delivery in which marketplace plans are required to participate.
Providers
The Arkansas Hospital Association (AHA) reports that hospitals are experiencing a dramatic drop in uninsured patients and uncompensated care costs. In addition, the AHA survey data also point to patients possibly seeking care in community-based settings instead of emergency rooms, with 5.8 percent growth in use of hospital outpatient clinics during the first six months of 2014.39 On the other hand, insurance carriers report relatively high rates of emergency room visits by private option enrollees, suggesting that private option enrollees may still be learning how best to use their coverage.40 More clear is that hospitals are experiencing drops in uninsured patients and uncompensated care costs. In 2014, inpatient visits by uninsured patients dropped 48.7 percent, uninsured emergency room visits by 38.8 percent, and uninsured outpatient clinic visits by 45.7 percent (compared to 2013).41 Hospitals also experienced corresponding gains in financial stability, with uncompensated care losses related to uninsured patients falling by 55.1 percent, or $149 million, from 2013 to 2014. 42 States that adopted a traditional Medicaid expansion also experienced sizeable decreases in uncompensated care costs as more of the uninsured gained coverage.43
The private option expansion’s impact on Arkansas community health centers is more mixed and varied across the state. Community health center leadership is enthusiastic about the coverage expansion, and centers are actively helping people enroll in coverage, using funds provided by the federal Department of Health and Human Services. Moreover, centers, particularly those in isolated rural areas, are seeing positive impacts from the expansion as more of their patients gain coverage and they receive more revenue as a result. Some community health centers, however, have been surprised to continue to see large numbers of uninsured patients. The reasons are not entirely clear but could include that these patients do not meet Medicaid’s immigration and citizenship eligibility criteria; the enrollment process is challenging for people with language and other barriers to navigate; and/or their applications are caught up in the state’s eligibility system delays. Of particular concern to many community health centers is that, as of April 2015, the state had not yet fully implemented the system for ensuring that centers receive cost-based reimbursement for private option enrollees.44 As a result, while community health centers are seeing new revenue as more of their patients gaining coverage, they are not necessarily experiencing the full gains in financial stability they had expected. In addition, some community health centers are concerned that they will lose newly-insured patients to other providers, including some of the new clinics being established by Marketplace plans, and that they could be left with a greater concentration of uninsured patients.
Premiums, Cost-Sharing and Health Independence Accounts
Unlike traditional Medicaid premium assistance programs, a major innovation of the private option is that beneficiaries are fully protected from cost-sharing charges without requiring them to pay upfront and be reimbursed. Stakeholders said that the system for the state Medicaid agency’s payment of premiums directly to Marketplace plans worked smoothly.45 In addition, by combining a standardized cost-sharing design with supplemental cost-sharing reduction payments directly to Marketplace plans, Arkansas ensures that private option enrollees do not incur cost-sharing charges for which they are not responsible.46 The cost-sharing reduction payments represent a little more than a quarter (27.4 percent47 ) of the payments made to Marketplace plans on behalf of private option enrollees, although this share is expected to shift when these payments are reconciled based on actual utilization.48 An estimated 81 percent of private option enrollees have income below 100 percent FPL and therefore are enrolled in a 100 percent actuarial value plan with the state paying all of the plan’s required cost-sharing.49 Beneficiaries from 100-138 percent FPL are enrolled in 94 percent actuarial value plans and have some co-payments for services consistent with Medicaid standards.
It is too early to assess the impact of Arkansas’s new Health Independence Accounts. In 2014, Arkansas added Health Independence Accounts to the private option, which had been called for by the original legislation creating the initiative. It did so with the goal of promoting personal responsibility and creating greater similarities with the cost-sharing charges people face as they move into other forms of coverage.50 Beneficiaries are expected to make a monthly contribution of $10 or $15 (depending upon income) to their accounts and are provided with a debit card than can be used to cover their co-payments and co-insurance when they use services.51 As of July 2015, 45,839 account cards have been issued, 10,806 cards have been activated, and 5,185 beneficiaries had contributed to their accounts.52 At the time of the interviews, Arkansas was in the midst of implementing these accounts for individuals above 100 percent of the federal poverty level. Since only about 20 percent of private option enrollees are in this income range, and the program is new, most stakeholders had little or no direct experience with the functioning of these accounts. Hospitals had received training on how the accounts would work so that they could respond to beneficiary questions. Some stakeholders felt that the accounts would be confusing to beneficiaries and complex to administer, particularly given that limited resources are available to educate beneficiaries about how the accounts work. Others viewed them as an important means of providing beneficiaries with incentives to more actively manage their health insurance. The state did not implement the accounts for individuals below 100 percent of the FPL after considering a number of factors, including the administrative expense of the accounts and the size of the contributions that would be made by individuals in this income range.
Benefits
Stakeholders said that beneficiaries generally reported being well-satisfied with their coverage through Marketplace plans.53 The private option benefit package is based on the ten essential health benefits required by the Affordable Care Act, which includes services such as hospital care, lab and x-ray services, and primary and preventive care, among others. The package also includes mental health and substance abuse services, which are not covered to the same degree in Arkansas’ traditional Medicaid benefit package for adults. Early on, some private option enrollees selected and received premium subsidies for Marketplace plans that included some dental and vision benefits. These services are not covered for newly eligible adults in Arkansas, and the state Medicaid agency ceased paying premiums for those plans. These services, however, had been very popular, and beneficiaries were disappointed when they were eliminated.
Arkansas minimized the need for the state to provide required Medicaid benefits outside of Marketplace plans, but beneficiaries may not be clear about how to access the limited services provided through a wrap. By design, there is almost complete overlap between the benefits covered by Marketplace plans and the Medicaid benefits required for newly eligible adults. Consequently, the state offers private option enrollees only two benefits outside of the Marketplace plan: non-emergency medical transportation and EPSDT benefits for 19 and 20-year olds. Stakeholders reported that the state had given providers information about how to assess wrapped benefits so they were able to assist beneficiaries, but they were less confident that beneficiaries would be able to navigate this issue on their own. One interviewee posited that beneficiaries using wrapped benefits most likely did so after learning about them through providers or word of mouth. Some expressed particular concern that 19 and 20-year olds are not necessarily aware of their eligibility for EPSDT benefits, although they had not heard of problems directly from beneficiaries, perhaps because young adults with serious health care needs are more likely to be classified as medically frail and to receive all of their benefits through the fee-for-service system. Finally, stakeholders flagged that the state has had some issues with its non-emergency medical transportation benefit, such as confusion among beneficiaries about how to access the benefit, but they also pointed out that these challenges are not a function of the private option but rather affect all Medicaid beneficiaries in Arkansas.
Marketplace enrollment and plan options
The private option has had a positive effect on the Arkansas Marketplace. When submitting its waiver request for the private option, Arkansas posited that “by nearly doubling the size of the population enrolling in QHPs offered through the Marketplace,” the demonstration would “drive more competitive premium pricing for all individuals purchasing coverage through the Marketplace.”54 The private option has exceeded expectations for Marketplace enrollment, with private option enrollees comprising 80 percent of Marketplace enrollment.55 As of June 2015, the private option has resulted in an additional 220,000 people using the Arkansas Marketplace, raising enrollment from 54,000 to 273,000 and making it a more attractive market for issuers.56 Along with increasing the volume of Marketplace enrollees, the private option also makes the Arkansas Marketplace more attractive to issuers, who can secure new enrollees at any point during the year because Medicaid-eligible adults are not limited to signing up for coverage during open and special enrollment periods. In the 2015 open enrollment period, Arkansas had four carriers selling plans statewide, two of which had offered coverage in some areas of the state in 2014, and expanded statewide in 2015.57 Six issuers have submitted bids to offer plans in 2016. Many stakeholders credited the private option with driving a 2 percent average Marketplace premium rate decrease between 2014 and 2015, as well as the fact that, that according to the state insurance department, Arkansas had the second lowest average age of Marketplace beneficiaries in 2015.58 (Figure 3)
Figure 3: The Private Option accounts for 80% of total Arkansas Marketplace enrollment and enrollees are younger
Arkansas’s use of an auto-assignment algorithm that gave issuers an incentive to enter the Arkansas market may also have contributed to the jump in Marketplace issuers. The algorithm is explicitly designed to distribute private option enrollment across available plans, making the Arkansas Marketplace more appealing to new issuers who might otherwise find it difficult to break in and secure market share in the face of historical dominance by a single insurer. One stakeholder noted that plan options are similar enough to minimize the risk that auto-assignment disadvantages beneficiaries. Some, however, did suggest that the high rate of auto-assignment and the state’s current policy of paying the full premium cost of any certified silver-level Marketplace plan for private option enrollees could reduce incentives for issuers to compete on price. (As discussed below, however, the state plans to subsidize only selected Marketplace plans for private option enrollees beginning in the fall of 2015.)
Financing
Since it first became a possibility, there has been significant debate about the financing of the private option. While it will be some time before data are available to evaluate some of the key financing issues, stakeholders were able to provide some initial insights.
Because the state had no experience covering the expansion population, it was challenging for the state to negotiate budget neutrality with the federal government. Budget neutrality is a hypothetical exercise applicable to all Section 1115 waivers that requires states to demonstrate that the waiver will not cost the federal government more than it would have spent on the state’s Medicaid program without the waiver. If a state’s expenditures exceed its budget neutrality target, it is at risk of not receiving federal Medicaid matching funds for the excess spending.59 Notably, however, Arkansas secured a provision in the terms and conditions of its waiver that allows it to revisit the budget neutrality targets if the cost of serving newly-eligible adults exceeds expectations. CMS made this allowance for Arkansas and all other states with alternative coverage models because of the difficulty of establishing the budget neutrality baseline for a population with which states have little experience. Even so, the budget neutrality projections are important, and CMS and Arkansas faced two major challenges in establishing them for the private option. First, Arkansas had limited experience covering low-income adults, making it difficult to predict how much the state would have spent on such adults in the absence of the waiver. Second, and more fundamentally, state leaders believed that adding some 220,000 newly eligible adults to the existing fee-for-service Medicaid program would require the expansion of the state’s Medicaid provider network to ensure adequate access to care, particularly in rural areas. Consequently, Arkansas and CMS developed a “without waiver” baseline using historical spending on a similar population (low-income parents below 17 percent FPL who are covered under Arkansas’s traditional Medicaid program) and made adjustments to reflect the need for higher provider reimbursement rates in the fee-for-service system under a traditional expansion to achieve sufficient provider access. The baseline allowed Medicaid spending to increase at an estimated rate of approximately 4.7 percent a year, comparable to national Medicaid expenditure trends.60
Despite early concerns, the private option is on track to meet budget neutrality targets and may even outperform expectations. As with all Medicaid Section 1115 waivers, Arkansas must demonstrate budget neutrality over the life of the private option (2014 – 2016), not on a year-by-year basis. This allows the state to incur higher start-up costs and exceed its annual budget target in the early years of the waiver and make up for it in later years. In the early months of the private option, Arkansas’s actual per capita spending on private option enrollees was higher than projected, generating some controversy and debate. Now, however, the state’s actual per capita spending has dropped below projected levels, and concerns that the state might not meet budget neutrality over the life of the waiver have abated. In fact, the state’s success in keeping per capita expenditures below projected targets in 2015 when enrollment is significantly higher than in 2014 – and, thus, a more important factor in the state’s ability to meet budget neutrality over the three-year life of the waiver – means the state may potentially keep spending well below allowable levels. As noted above, the higher-than-expected per capita expenditures in the early months of 2014 are attributable in part to some enrollees selecting and receiving subsidies for plans that included supplemental coverage (such as dental services) not covered for newly eligible adults, an issue that the state Medicaid agency has now remedied. Stakeholders also pointed out that a recent state decision to limit the state’s payment of premiums to the two least expensive silver-level Marketplace plans or any plans with a premium within 10 percent of the cost of the second lowest cost silver plan, beginning in the fall of 2015, will likely solidify compliance with budget neutrality.61
The private option also will be evaluated based on whether it is “cost-effective,” a broader measure of the impact of the initiative. Under the terms of Arkansas’ waiver, the cost-effectiveness inquiry considers more factors than simply whether the program requires more or less federal Medicaid money to cover the same population through traditional Medicaid and instead is designed to evaluate both the costs and benefits of providing Medicaid coverage through Marketplace premium assistance.62 The state can take into account the private option’s impact on beneficiary access to care, Marketplace competitiveness, and reductions in churning between Medicaid and Marketplace coverage as income changes. Unlike the budget neutrality measure, cost-effectiveness is not used to establish limits on the availability of federal Medicaid matching funds, but it is an important measure of whether the private option has met its objectives as a whole. It will be some time before data are available to answer the larger and more complex question of cost-effectiveness, but early signs are that the value of the private option extends well beyond its impact on newly eligible adults. This includes improved access to care for private option enrollees and potential increases in provider capacity for the larger community; the impact on the cost of Marketplace coverage; and benefits to Arkansas’s providers.
Reports also find the private option has generated state savings. According to state officials, the private option saved Arkansas $30.8 million in fiscal year 2014, and the state expects to save an additional $88.8 million in fiscal year 2015. Another recent report projects state savings of $438 million from 2017 to 2021.63 Sources of savings include reductions in uncompensated care spending and in behavioral health care spending,64 as well as savings from moving people who previously received coverage under specialized Medicaid categories for adults with disabilities, women with breast or cervical cancer, and others into the expansion’s new eligibility group, for which the federal government pays the enhanced matching rate. In addition, Arkansas expects to collect $34.4 million in new revenue over 2014 and 2015 from taxes on providers and health plans, producing a total gain for the state budget of over $150 million in 18 months.65 Not included in these estimates is the potential effect on state health care spending and quality associated with requiring Marketplace issuers to participate in the state’s broader delivery system reform efforts on behalf of private option enrollees.
Looking Ahead
For now, the private option expansion is slated to continue at least through the end of 2016. Over the next several months, state policymakers will be charting the longer-term future of the private option in the context of broader Medicaid reform in Arkansas. Most stakeholders were reluctant to make firm predictions about the future of the private option, preferring to wait until the state legislative task force and Governor’s Medicaid Advisory Committee complete their work in December 2015. Many, however, speculated that the extension of coverage to newly eligible adults would continue in one form or another because the alternative would generate significant upheaval for the state’s residents and providers. Stakeholders also thought that key elements of the private option, including its use of private plans – rather than the fee-for-service system – would continue to have strong appeal to policymakers, although they might want to integrate the private option into broader Medicaid reforms. On the other hand, with the state expected to finance a share of the cost of covering newly eligible adults in the years ahead,66 stakeholders felt that answering some of the critical questions about the cost-effectiveness of the private option – relative to other Medicaid service delivery options available to the state – would be critical. Finally, the state’s interest in a Section 1332 waiver is strong, spurred by the potential flexibility it could provide to re-make Arkansas’s Marketplace. Discussion about the role that a Section 1332 waiver might play in Arkansas was just beginning at the time of the interviews, however, and stakeholders did not yet have detailed ideas about how such a waiver could be used. It, however, was noted that if the state seeks a Section 1332 waiver, it could potentially tap any federal savings attributed to the private option driving down the cost of Marketplace plans and, in turn, the cost to the federal government of providing tax credits to marketplace enrollees.67
Lessons for Other States
States that expand coverage realize substantial reductions in uninsured rates and provider uncompensated care costs along with increased access to care among beneficiaries, regardless of the mechanism used to implement an expansion. After expanding Medicaid through the private option, Arkansas realized considerable reductions in its non-elderly adult uninsured rate and providers’ uncompensated care costs along with increased beneficiary access to care. Unlike other effects of the private option in Arkansas, such as the impact on Marketplace enrollment, these gains were not unique to Arkansas’ Medicaid expansion delivery model. Most states that adopted the ACA’s Medicaid expansion did so without waiver authority and using their existing Medicaid delivery systems, which vary among the states from private capitated Medicaid managed care plans to managed fee-for-service models. In general, states that expanded coverage, regardless of delivery system, experienced the benefits of expansion.68
States have significant flexibility to tailor their Medicaid programs for newly eligible adults to fit their particular delivery system and broader policy agenda. In Arkansas, the private option met the needs of the state given that it had a fee-for-service system that was unlikely to be able to absorb more than 200,000 new enrollees without increases in provider payment rates and no Medicaid managed care infrastructure on which to build. In addition, Arkansas’s policymakers were committed to using private plans and competitive market forces as the mechanism for a coverage extension and for furthering the state’s delivery system reform efforts. The state had the ability to do so because its Marketplace operates as a Partnership model and can actively shape and monitor the plans offered , allowing for greater alignment between the Marketplace plans and Medicaid requirements. Many other states are not in this situation – they may have well-developed Medicaid managed care programs on which to build, a more limited ability to shape Marketplace plans because they do not operate as a State-based or Partnership model, or a different set of political and policy priorities. Even if the private option does not fit their particular circumstances, a larger lesson from Arkansas is that states have considerable flexibility to tailor coverage extensions to their unique circumstances and priorities.
Implementation of the private option has required unprecedented levels of cooperation between the state Medicaid agency and state insurance department and an enormous amount of time and effort on the part of the state’s leadership. State officials and other stakeholders had to work across their silos to develop Marketplace plans consistent with both Marketplace and Medicaid requirements and develop strategies for resolving issues where it initially was not clear whether the state Medicaid agency or insurance department was responsible. One of the biggest and most time-consuming challenges was bringing about what one stakeholder described as a “marriage of different mindsets” – insurance regulators are accustomed to viewing health insurance as the prepaid management of an actuarial risk pool whereas Medicaid officials more often view it as a cost-based enterprise under which the federal government matches the state’s incurred costs. Adding to the challenge was that the federal officials charged with overseeing Medicaid and Marketplaces also work in separate divisions of HHS, and they too had to find new ways to collaborate and provide clear guidance to Arkansas.
Strong collaboration with stakeholders and transparency were key to implementation of the private option in Arkansas, but could have been even stronger. Given the unprecedented nature of Arkansas’s initiative and rapid implementation timeline, the state worked closely with issuers, providers, and other stakeholders to prepare for the program’s launch well in advance of formal approval of Arkansas’s waiver. The state adopted a transparent and collaborative approach with carriers during implementation that helped them to navigate a highly fluid environment. One stakeholder described carriers as having almost real-time access to updates on the policy and fiscal assumptions behind the private option and credited this “tremendous transparency” with allowing issuers to design Marketplace plans consistent with Medicaid requirements and emerging fiscal estimates. Some interviewees, however, suggested that the state would have benefited from engagement with a broader group of stakeholders; some community health centers, in particular, suggested the state might have avoided the issues arising with respect to cost-based reimbursement if they had been more involved in the planning stages.
Conclusion
Stakeholder interviews revealed that the private option offers a path to coverage for close to 260,000 newly eligible adults in Arkansas, and enabled the state to use Marketplace plans to cover Medicaid beneficiaries in the absence of an established Medicaid managed care delivery system in the state. Early implementation experience reported by stakeholders suggests that the vast majority of beneficiaries are receiving much-needed care; the state has succeeded in keeping spending in line with its federal budget neutrality agreement; hospitals are experiencing unprecedented declines in their uncompensated care costs; and the state’s Marketplace is stronger and more robust because of the inclusion of private option enrollees. Arkansas continues to discuss what should come next for the private option; what, if anything, the state may do with the emerging opportunity to use a Section 1332 waiver; and whether the state should consider more sweeping changes to its larger delivery system for all Medicaid beneficiaries, including medically frail adults not enrolled in the private option. Any new approach will need to fit with the state’s mission and goals; be consistent with its delivery system; win the political sanction of the state’s leadership, including a super majority in the Arkansas legislature; and secure approval from the federal government.
This issue brief was prepared by Jocelyn Guyer and Naomi Shine of Manatt Health and MaryBeth Musumeci and Robin Rudowitz of the Kaiser Family Foundation’s Commission on Medicaid and the Uninsured. Manatt Health has served as a consultant to the state of Arkansas on aspects of its Medicaid private option plan; this study was conducted independently of that work. The authors gratefully acknowledge the state policymakers and leaders, health plans, providers, consumer advocates and other stakeholders who participated in the interviews on which this issue brief is based. The authors also thank others at Manatt Health and the state who helped with research and review of this brief.
Appendix
Appendix A: Interview Guide
High Level Questions
Please describe your role in designing/implementing/monitoring the private option.
In general, what has been the impact of the private option on key stakeholders?
What do you consider the key successes and challenges of the design and implementation of the private option?
Overall Impact of Private Option on Consumers
In general, how are the consumers who gained coverage through the private option faring?
How well do consumers understand the private option?
Eligibility and Enrollment
How well is the eligibility and enrollment process working for consumers?
How do private option consumers fare at renewal? What is working well and what needs to be improved?
How well is the process for identifying medically frail individuals working?
Implementation/Operational Issues
In general, what have been the major implementation and operational challenges that the state has faced?
How have the Medicaid agency and Arkansas Insurance Department worked together to implement the private option?
Implications for the Marketplace
How has the private option affected the Marketplace?
How have issuers reacted to inclusion of newly eligible adults in Marketplace plans?
Financing Issues
What do you see as the major financing opportunities/challenges created by the private option?
What has been the impact of the recent report on the state savings generated by the private option?
Future of the Private Option
In general, what are your thoughts on the future of the private option?
Process, structure, expected outcomes from new commission for post-2016? What recommendations are being put forward?
What do you think of the strategies in place for evaluating the private option?
If you were speaking to another state that was considering a Marketplace premium assistance approach, what advice would you give?
According to Arkansas’s Department of Health and Human Services, there were approximately an additional 15,000 newly-eligible adults who were covered in the state’s fee-for-service system for a brief period pending enrollment into a Marketplace plan on June 30, 2015. These individuals are not included in the 245,000 figure. ↩︎
These conditions included limiting Marketplace premium assistance to individuals whose Medicaid benefit package closely aligns with Marketplace plans and offering beneficiaries a choice of at least two plans. HHS, Medicaid and the Affordable Care Act Premium Assistance (March 2013), available at http://medicaid.gov/Federal-Policy-Guidance/Downloads/FAQ-03-29-13-Premium-Assistance.pdf. ↩︎
Arkansas has a State Partnership Marketplace, a non-profit public benefit corporation, which is overseen by the Arkansas Health Insurance Marketplace Board. The state retains control of plan management and consumer outreach and education functions while the federal government is responsible for eligibility and enrollment functions. ↩︎
The Arkansas legislature also included bans on outreach funding in the budget bill for the Insurance Department and for the Department of Health. ↩︎
Ark. Act 257, § § 16, 17 (March 7, 2014), available at http://www.arkleg.state.ar.us/assembly/2013/2014F/Pages/BillInformation.aspx?measureno=SB111. The legislation specifies that the state insurance department may not apply for or accept funds, including federal funds, for the purpose of advertisement, promotion, or other activities designed to promote or encourage enrollment in the Arkansas Marketplace or the private option. It also prohibits the state from applying for or accepting any funds for the purpose of funding navigators, guides, certified application counselors and certified licensed producers. ↩︎
See, id., (noting significant difference in non-elderly adult uninsured rate from 2013 to 2014 in the following states which have traditional Medicaid expansions: CA (-5.7%), DE (-5.3%), KY (-6.3%), NV (-7.2%), OH (-4.5%), RI (-4.0%), WA (-7.4%), and WV (-14.8%)). ↩︎
ACHI, Facts About Arkansas’s Health Care Independence Program: Private Option and Marketplace Plan Enrollment (April 2015), available at http://www.achi.net/Docs/275/. ↩︎
As of June 2015, 22,629 medically frail beneficiaries were receiving the traditional benefit package, and the remaining 3,186 received the same benefit package as private option enrollees but on a FFS basis. Ark. Health Care Reform Task Force, The Stephen Group Update Report #2 Powerpoint Slides at slide 6 (July 15, 2015), available at http://governor.arkansas.gov/promises/healthcare-taskforce. ↩︎
Andy Allison, Thomas Seldon, and Joe Thompson, Arkansas Center for Health Improvement, Arkansas Health Care Needs Questionnaire: Primer on Implementation webinar, (March 19, 2014), available at http://www.achi.net/Pages/OurWork/Project.aspx?ID=58. ↩︎
As reported by Ark. Dep’t of Human Servs., Div. of Medical Servs. (June 2015) (on file with authors). ↩︎
Andy Allison, Thomas Seldon, and Joe Thompson, Arkansas Health Care Needs Questionnaire: Primer on Implementation webinar, Arkansas Center for Health Improvement (March 19, 2014), available at http://www.achi.net/Pages/OurWork/Project.aspx?ID=58. ↩︎
As reported by Ark. Dep’t of Human Servs., Div. of Medical Servs. (June 2015) (on file with authors). ↩︎
Some beneficiaries will be automatically renewed based on electronic data available to the state of Arkansas and so will not receive the renewal notice. They, however, can still request a medical frailty screening at any time. ↩︎
Andy Allison, Thomas Seldon, and Joe Thompson, Arkansas Health Care Needs Questionnaire: Primer on Implementation webinar, Arkansas Center for Health Improvement (March 19, 2014), available at http://www.achi.net/Pages/OurWork/Project.aspx?ID=58. ↩︎
The Stephen Group Status Report #1 to Ark. Health Reform Task Force Appendix at 13 (June 11, 2015), available at http://governor.arkansas.gov/promises/healthcare-taskforce; see also The Stephen Group Status Report #2 to Ark. Health Reform Task Force at 3, 9-12 (July 15, 2015), available at http://governor.arkansas.gov/promises/healthcare-taskforce (noting that “the highest cost medically frail newly eligible patients fall far below the average cost of highest cost Traditional Medicaid patients”). ↩︎
See, e.g., Benjamin D. Sommers et al., Changes in Self-reported Insurance Coverage, Access to Care, and Health Under the Affordable Care Act, 314 JAMA 366 (July 28, 2015), available at http://jama.jamanetwork.com/article.aspx?articleid=2411283 (finding that lacking a personal physician and limited access to medications both declined significantly more in expansion states than in non-expansion states). ↩︎
Federal law requires the state Medicaid agency to reimburse federally qualified community health centers and related clinics for 100 percent of their costs. Because this requirement was not waived by the federal government in the special terms and conditions for the private option, the Arkansas Medicaid agency is developing a system for sending payments to these centers to supplement, as needed, the reimbursement rates that they receive from Marketplace plans for private option enrollees. ↩︎
Unlike in a Medicaid managed care environment, the cost of an individual’s premium is not set by the Medicaid agency, but rather is set by the commercial carriers competing for business, as regulated by the state insurance department. For any given individual, the specific premium amount that the Medicaid agency pays is a function of the person’s geographic region; age; and choice of plan. Arkansas has seven different geographic regions for purposes of its insurance market, and carriers can vary their premium bids by region. ↩︎
Arkansas enrolls private option beneficiaries into 94 percent actuarial value silver-level Marketplace plans to meet federal Medicaid rules that limit beneficiary copayments to nominal levels and cap total cost-sharing at 5 percent of household income. With the exception of the plan deductible, these Marketplace plans meet Medicaid cost-sharing standards, charging nominal amounts for individuals above 100 percent FPL and nothing for those below 100 percent FPL. To ease administration of the cost-sharing wrap for Medicaid beneficiaries, Arkansas defined a standard cost-sharing design for its 94 percent actuarial value plans, consisting of a $664 annual deductible and set co-payments or co-insurance for certain services. Arkansas makes additional cost sharing reduction payments to Marketplace plans to eliminate the deductible for private option enrollees, which otherwise would violate Medicaid cost-sharing protections. For more details, see Manatt Health, Marketplace Premium Assistance: Creating Alignment Between Medicaid and Qualified Health Plans (April 2015), available at https://www.manatt.com/Marketplace-Premium-Assistance-Creating-Alignment-Between-Medicaid.aspx. ↩︎
The initial cost-sharing reduction payments to carriers are based on projections of the amount required to eliminate deductibles and reduce cost-sharing charges to Medicaid-allowable limits. These initial up-front payments are subject to reconciliation and will be revised once data on actual costs are available for those beneficiaries who enrolled in the private option. If the actual cost of buying down deductibles and cost-sharing charges are higher than expected, carriers will receive an additional payment; if costs are lower, they will return some of the cost-sharing reduction payments to the state. ↩︎
Arkansas Center for Health Improvement, Private Option and Marketplace Plan Enrollment: Facts About Arkansas’s Health Care Independence Program, April 2015 (April 2015), available at http://www.achi.net/Docs/275/. ↩︎
Arkansas secured an amendment to its waiver to establish Health Independence Accounts on December 31, 2014. The amendment allows Arkansas to waive Medicaid’s comparability requirement to impose cost-sharing charges selectively on those individuals who fail to make the required monthly contribution to a Health Independence Account. See Centers for Medicare and Medicaid Services, Arkansas Health Care Independence Program (Private Option) Section 1115 Demonstration Amendment Approval (January 2015) available at http://www.medicaid.gov/Medicaid-CHIP-Program-Information/By-Topics/Waivers/1115/downloads/ar/ar-private-option-ca.pdf. ↩︎
The state also uses Medicaid funds to make contributions to the accounts, ensuring that they are funded at a level sufficient to cover any copayment and coinsurance obligations that otherwise would be the responsibility of enrollees. In effect, this allows beneficiaries to substitute a set monthly contribution for cost-sharing charges that rise and fall with their use of services each month. If beneficiaries fail to contribute to their Health Independence Accounts, they are not terminated from coverage, but they must cover their copayments and co-insurance out-of-pocket at the point of service. To provide an additional financial incentive to participate, individuals above 100 percent of the FPL making at least six monthly contributions can receive credits to offset premiums they face in the future after leaving the private option and enrolling in other coverage. ↩︎
Under federal law, newly eligible adults receive a benefit package known as an Alternative Benefit Plan (ABP), a state-designed package that must cover, at a minimum, the 10 essential health benefits (EHBs) required of all Marketplace plans, plus a limited number of additional services and provider types required by Medicaid. Accordingly, with limited exceptions, the ABP aligns with the Marketplace benefit package. In Arkansas, the ABP includes some benefits not otherwise offered to adults under Arkansas’ state plan benefit package for adults, such as coverage of outpatient diagnostic tests without a dollar limit and substance use disorder services, as a result of the EHB requirements. ↩︎
Arkansas Center for Health Improvement, Private Option and Marketplace Plan Enrollment: Facts About Arkansas’s Health Care Independence Program, April 2015 (April 2015), available at http://www.achi.net/Docs/275/↩︎
Arkansas Center for Health Improvement, Private Option and Marketplace Plan Enrollment: Facts About Arkansas’s Health Care Independence Program, April 2015 (April 2015), available at http://www.achi.net/Docs/275/. ↩︎
The plans include Arkansas Blue Cross Blue Shield, the national BCBS plan, Qualchoice, and Ambetter. ↩︎
In practice, states rarely exceed their budget neutrality targets. If they are at risk of hitting the targets, states typically have a number of options for scaling back their rate of spending or for revisiting their targets with CMS. ↩︎
Arkansas Center for Health Improvement, Health Care Independence Program and Budget Neutrality (June 2015), available at http://www.achi.net/Docs/316/. ↩︎
Specifically, Arkansas will pay the premiums for any of the following plans: 1) the lowest cost qualifying EHB-only silver-level plan offered in the service area; (2) the next lowest cost qualifying EHB-only silver-level plan offered in the service area that is offered by a different carrier than the lowest cost EHB-only silver-level plan (referenced in item #1 above); and (3) any other carrier’s lowest cost qualifying EHB-only silver-level plan, so long as such plan’s cost falls within 10% of the second-lowest cost qualifying EHB-only silver-level plan available to private option enrollees in the service area. ↩︎
Under federal Medicaid law, states can use Medicaid funds to pay private insurance premiums on behalf of beneficiaries only if it is “cost effective” to do so. The criteria for cost-effectiveness determinations contained in federal Medicaid law include the costs of paying premiums, providing any supplemental Medicaid benefits, paying cost-sharing charges that exceed Medicaid allowable limits, and administrative expenses. Social Security Act § 1902(a)(4); 42 C.F.R. § 435.1015(a)(4). ↩︎
The Stephen Group, Status Report #3 to Ark. Health Reform Task Force at 25 (Aug. 19 and 20, 2015). ↩︎
Federal funding for newly eligible adults is set in the ACA at 100 percent in 2014, 2015, and 2016, and gradually decreases to 90 percent by 2020, where it remains indefinitely. The share of federal dollars to cover newly eligible adults exceeds the state’s regular Medicaid matching rate, which is 70 percent in FY 2016. Kaiser Commission on Medicaid and the Uninsured, Federal Medical Assistance Percentage for Medicaid and Multiplier, available at https://modern.kff.org/medicaid/state-indicator/federal-matching-rate-and-multiplier/. ↩︎
Section 1332 waivers allow states to develop their own initiatives to replace some or all of the Marketplace provisions of the ACA. States, however, must ensure that the alternative provides as much coverage to as many people without costing the federal government more. While these waivers cannot be used as the basis for an alternative Medicaid expansion such as the private option, they can potentially be combined with Medicaid § 1115 waivers to provide Arkansas with some new options. At the request of a state legislator, the Arkansas Health Insurance Marketplace Board and Legislative Oversight Committee commissioned a report that provides some basic information on the role that Section 1332 waivers might play in shaping the future of Arkansas healthcare reforms. The task force and the Governor’s advisory committee are reviewing this report, but also more broadly considering a range of options for the future of the state’s Medicaid program. Public Consulting Group, Section 1332 Waivers and the Future of Arkansas Healthcare Innovation (April 6, 2015) available at http://www.publicconsultinggroup.com/news/post/2015/04/16/1332-Waivers-Will-Allow-State-Specific-Variation-to-Health-Care-Reform-Efforts.aspx↩︎
See, e.g., National Center for Health Statistics, National Health Insurance Survey Early Release Program (June 2015), available at http://www.cdc.gov/nchs/data/nhis/earlyrelease/State_estimates_insurance_2013_2014.pdf., (noting significant difference in non-elderly adult uninsured rate from 2013 to 2014 in the following states which have traditional Medicaid expansions: CA (-5.7%), DE (-5.3%), KY (-6.3%), NV (-7.2%), OH (-4.5%), RI (-4.0%), WA (-7.4%), and WV (-14.8%)); Benjamin D. Sommers et al., Changes in Self-reported Insurance Coverage, Access to Care, and Health Under the Affordable Care Act, 314 JAMA 366 (July 28, 2015), available at http://jama.jamanetwork.com/article.aspx?articleid=2411283 (finding that lacking a personal physician and limited access to medications both declined significantly more in expansion states than in non-expansion states); Deloitte, Commonwealth of Kentucky Medicaid Expansion Report 2014 at 35 (2015), available at http://governor.ky.gov/healthierky/Documents/medicaid/Kentucky_Medicaid_Expansion_One-Year_Study_FINAL.pdf (finding decrease of $1.15 billion in hospital uncompensated care charges from 2013 to 2014). ↩︎
In his latest column for The Wall Street Journal’s Think Tank, Drew Altman analyzes the politics of Republican Affordable Care Act replacement plans and the challenges all Republican candidates will face distinguishing themselves from others on the ACA in a crowded primary field.
All previous columns by Drew Altman are available online.
Share of Potentially-Affected Employers Could Grow to 30% in 2023, 42% in 2028, Analysis Finds
New projections from the Kaiser Family Foundation estimate that one in four employers (26%) offering health benefits could be subject to the Affordable Care Act’s tax on high-cost health plans, also known as the “Cadillac plan” tax, in 2018 unless they make changes to their plans.
The analysis also estimates that the share of employers potentially affected by the tax could grow significantly over time — to 30 percent in 2023 and 42 percent in 2028 — if their plans remain unchanged and health benefit costs increase at expected rates. It’s likely that many employers will revise their plans to avoid the tax, at least initially, through modifications that could include reducing options for employees or shifting costs to workers in the form of higher deductibles and other patient cost sharing.
The ACA’s high-cost plan tax, which takes effect in 2018, was meant to raise revenue to fund coverage expansions under the health care law and to help contain health spending. It taxes plans at 40 percent of each employee’s health benefits that exceed certain cost thresholds: In the first year, the thresholds are $10,200 for self-only coverage and $27,500 for other than self-only coverage. The thresholds increase annually with inflation.
Using data from the forthcoming 2015 Kaiser/HRET Employer Health Benefits Survey, the Foundation’s new analysis estimates the percentage of employers who offer one or more plans that would reach Cadillac tax thresholds for some employees and who would face a choice between paying the tax or restructuring their benefits to avoid it. The analysis provides projections for 2018, 2023 and 2028, using different scenarios, including with and without flexible spending accounts; small vs. large employers; and with various growth rates in premiums. The estimates assume the health plans remain unchanged.
In addition to projections, the new analysis also explains how the high-cost plan tax works and describes its implications for how employers structure and administer their health benefits.
As fall approaches, we can expect to hear more about how employers are adapting their health plans for 2016 open enrollments. One topic likely to garner a good deal of attention is how the Affordable Care Act’s high-cost plan tax (HCPT), sometimes called the “Cadillac plan” tax, is affecting employer decisions about their health benefits. The tax takes effect in 2018.
The potential of facing an HCPT assessment as soon as 2018 is encouraging employers to assess their current health benefits and consider cost reductions to avoid triggering the tax. Some employers announced that they made changes in 2014 in anticipation of the HCPT, and more are likely to do so as the implementation date gets closer. By making modifications now, employers can phase-in changes to avoid a bigger disruption later on. Some of the things that employers can do to reduce costs under the tax include:
Increasing deductibles and other cost sharing;
Eliminating covered services;
Capping or eliminating tax-preferred savings accounts like Flexible Spending Accounts (FSAs), Health Savings Accounts (HSAs), or Health Reimbursement Arrangements (HRAs);
Eliminating higher-cost health insurance options;
Using less expensive (often narrower) provider networks; or
Offering benefits through a private exchange (which can use all of these tools to cap the value of plan choices to stay under the thresholds).
For the most part these changes will result in employees paying for a greater share of their health care out-of-pocket.
In addition to raising revenue to fund the cost of coverage expansion under the ACA, the HCPT was intended to discourage employers from offering overly-generous benefit plans and help to contain health care spending. Health benefits offered through work are not taxed like other compensation, with the result that employees may receive tax benefits worth thousands of dollars if they get their health insurance at work. Economists have long argued that providing such tax benefits without a limit encourages employers to offer more generous benefit plans than they otherwise would because employees prefer to receive additional benefits (which are not taxed) in lieu of wages (which are). Employees with generous plans use more health care because they face fewer out-of-pocket costs, and that contributes to the growth in health care costs.
The HCPT taxes plans that exceed certain cost thresholds beginning in 2018. The 2018 thresholds are $10,200 for self-only (single) coverage and $27,500 for other than self-only coverage, and after that they generally increase annually with inflation. The amount of the tax is 40 percent of the difference between the total cost of health benefits for an employee in a year and the threshold amount for that year.
While the HCPT is often described as a tax on generous health insurance plans, it actually is calculated with respect to each employee based on the combination of health benefits received by that employee, and can be different for different employees at the same employer and even for different employees enrolled in the same health insurance plan. While final regulations have not yet been issued, the cost for each employee generally will include:
The average cost for the health insurance plan (whether insured or self-funded);
Employer contributions to an (HSA), Archer medical spending account or HRA;
Contributions (including employee-elected payroll deductions and non-elective employer contributions) to an FSA;
The value of coverage in certain on-site medical clinics; and
The cost for certain limited-benefit plans if they are provided on a tax-preferred basis.
The inclusion of FSAs here is important. FSAs generally are structured to allow employees the opportunity to divert some of their pay to pretax health benefits, which means that they can avoid payroll and income taxes on money they expect to use for health care. Employees often are permitted to elect any amount of contribution up to a cap (which is $2,550 in 2015), which means that the amount of benefits for an employee subject to the HCPT in a year could vary depending on their FSA election.
The amount and structure of the HCPT provide a strong incentive for employers to avoid hitting the thresholds. The tax rate of 40 percent is high relative to the tax that many employees would pay if the benefits were merely taxed like other compensation, and the ACA does not allow the taxpayers (e.g., the employer) to deduct the tax as a cost of doing business, which can significantly increase the tax incidence for for-profit companies. Further, to avoid the perception that this was a new tax on employees, the HCPT was structured as a tax on the service providers of the health benefit plans providing benefits an employee: insurers in the case of insured health benefit plans; employers in the case of HSAs and Archer MSAs; and the person that administers the benefits, such as third party administrators, in the case of other health benefits. While it is generally expected that insurers and service providers will pass the cost of the tax back to the employer, doing so may not always be straightforward. Because there can be numerous service providers with respect to an employee, the excess amount must be allocated across providers. In some cases, it may not be possible to know whether or not the benefits provided to an employee will exceed the threshold amount until after the end of a year (for example, in the case of an experience-rated health insurance plan), which means that service providers may need to bill the employer retroactively for the cost of the tax they must pay. Amounts that employers provide to reimburse service providers for the HCPT create taxable income for the service provider, which the parties will want to account for in the transaction. The IRS has requested comments on potential methods for determining tax liability among benefit administrators, including a way that could assign the responsibility to the employer in cases other that insured benefit plans. The proposed approach could simplify administration of the tax.
How the High-Cost Plan Tax Works
Let’s take an employer that, in 2018, offers employees an HSA-qualified health plan with a total annual premium of $7,800 ($650 monthly) for single coverage. The employer makes an annual contribution of $780 to HSAs established by its employees, and offers a FSA plan where employees can elect to contribute up to $2,700 (the estimated legal maximum) for the year through payroll deduction. Employee A enrolls in single coverage under the plan for all 12 months but does not elect to contribute to an FSA while employee B enrolls in single coverage under the plan for all 12 months and elects to make the maximum FSA contribution. For employee A, the monthly health benefit cost would be the sum of $650 for the health plan premium and $65 (one-twelfth of the annual HSA contribution by the employer), or $715. Because this is less than the monthly threshold amount for single coverage of $850 (one-twelfth of $10,200), no HCPT would be owed for employee A. For employee B, the monthly health benefit cost would be the sum of $650 for the health plan premium, $65 (one-twelfth of the annual HSA contribution by the employer) and $225 (one-twelfth of the annual FSA contribution), or $940. Because this is more than the monthly threshold amount for single coverage of $850, there would be a HCPT for employee B for the month equal to 40 percent of the health benefit cost in excess of the threshold. The excess amount in this case is $90 ($940 – $850), and 40 percent of the excess is $36. The annual HCPT owed for employee B would be $432.
To illustrate the impact of the HCPT, we created a simple model of future plan costs, based on the distribution of employer-sponsored plans from the 2015 Kaiser/HRET Employer Health Benefits Survey (EHBS), and estimated the share of employers with plans that could be expected to hit the HCPT threshold in 2018, 2023 and 2028 if plan premiums grew at a range of reasonable rates. The EHBS has information about plan premiums, and employer contributions to HSAs and HRAs, but generally does not ask about the details of other health benefits offered to employees. While we can identify which employers make an FSA option available to employees, we do not have information about permitted or actual contribution levels.
Our estimates focus on the self-only plan threshold because the EHBS asks about premiums for a family of four while the HCPT threshold for family coverage applies to any family enrollment (such as couple or single plus one) other than self-only. We assume that premiums and employer contributions to HSAs and HRAs would rise five percent annually, which is consistent with estimates of future health care cost increases. We also present tables showing how the results would change if premiums, HSA and HRA contributions were to grow annually at four and six percent. Employers in the EHBS provide information about their largest plan for up to four plan types (health maintenance organization, preferred provider organization, point of service plan, high deductible health plan combined with a savings option) and we assess the cost each plan option separately to determine if the cost would exceed the HCPT threshold. We do not have information that would allow us to make adjustments permitted by the ACA for plans with older workers, plans in certain industries, or multiemployer plans, which means we may be somewhat over-counting the percent of these firms reaching the threshold. Other limitations are discussed in the methods (see below).
Two sets of estimates are presented. The first is based on the premiums for health coverage plus employer contributions for HSAs and HRAs, while the second includes the effects of FSA plans as well to illustrate how FSA elections impact the number of plans affected. We assume that employees offered an FSA option are permitted to elect contributions up to the maximum allowed by law, and that some employees do so.
The purpose here is to look at the share of current plans that might meet the definition of “high cost” over time, assuming modest premium growth and no changes to the plan. We do not attempt to estimate the share of employer plans that will actually be assessed under the HCPT, as we believe its high tax rate and potentially complicated structure will encourage most employers to make plan adjustments to avoid the tax for as long as they can. These estimates can be understood as the share of employers who have plans where the cost for some employees will exceed the thresholds for the HCPT, presenting employers with a choice of whether to pay the tax or (more likely) restructure their benefits to avoid it.
Estimates
Looking first at the expected costs for just plan premiums plus employer contribution to HSAs and HRAs, we estimate that about 16 percent of employers offering health benefits would have at least one health plan that would exceed the $10,200 HCPT self-only threshold in 2018, the first year that plans are subject to the tax (Table 1). The percentage would increase to 22 percent in 2023 and to 36 percent in 2028.
Table 1: Share of Employers with At Least One Plan Hitting Threshold
Year
HCPT Self-Only Threshold
Premium, HSA, HRA
Premium, HSA, HRA & FSA
2018
$10,200
16%
26%
2023
$11,800
22%
30%
2028
$13,500
36%
42%
SOURCE: Kaiser Family Foundation analysis
These percentages rise significantly when we consider the impact that FSA options can have: up to 26 percent in 2018, 30 percent in 2023 and 42 percent in 2028 (Figure 1).
Figure 1: Percent of Employers Offering Health Benefits with Plans that Would Exceed HCPT Threshold With 5% Premium Growth
This should not be surprising since the maximum FSA contribution levels (estimated to be $2,700 in 2018, $3,100 in 2023 and $3,600 in 2028) are quite large and generally are additive to other benefit costs for employees that elect to contributions. As we noted above, not all employees offered an FSA option will make the maximum contribution, and some will make no contribution, which means that the threshold will be reached for some employees and not for others with the same plan choices. For example, consider two employees offered a PPO with a premium of $9,000 in 2018 and an FSA option that permits a payroll deduction of up to $2,700. If one employee elects not to contribute to the FSA, the threshold is not met for that employee and no tax is owed. If the other employee contributes the full amount, the threshold is hit and a 40 percent tax is assessed on the excess ($1,500) allocated between the administrators or the PPO and the FSA (if they are different). For the percentages above, we count a plan as exceeding the threshold if an employee who elected the maximum FSA contribution would cause the plan to exceed the threshold for that employee. Because large firms (200 or more workers) are much more likely than smaller firms to offer an FSA, large firms are much more likely to have a plan that exceeds the HCPT threshold when FSA contributions are considered (Table 2).
Table 2: Share of Employers with At Least One Plan Hitting Threshold By Firm Size
Year
HCPT Self-Only Threshold
Premium, HSA, HRA & FSA
Small Firms (3-199 workers)
Large Firms (200 or more workers)
2018
$10,200
25%
46%
2023
$11,800
29%
56%
2028
$13,500
41%
68%
SOURCE: Kaiser Family Foundation analysis
The assumed rate of premium growth also has a large impact on these estimates, particularly in the later years (Table 3). The HCPT thresholds increase with inflation, so what matters over the longer run is the difference between the growth in benefit costs and inflation. With our inflation assumption of 2.7 percent annually between 2018 and 2028, a four percent annual growth in health plan costs would reduce the 2028 percentage to 29 percent when FSA offers are considered, while a six percent annual growth in premiums would increase the percentage to 54 percent. This wide range shows how sensitive the effects of the tax are to premium growth in excess of inflation, and how those effects compound over time.
Table 3: Share of Employers with At Least One Plan Hitting Threshold, Different Premium Growth Assumption
Year
HCPT Self-Only Threshold
Premium, HSA, HRA & FSA
4% Premium Growth
5% Premium Growth
6% Premium Growth
2018
$10,200
24%
26%
27%
2023
$11,800
26%
30%
38%
2028
$13,500
29%
42%
54%
SOURCE: Kaiser Family Foundation analysis
Discussion
Our estimates suggest that a meaningful percentage of employers would need to make changes in their health benefits to avoid the HCPT in 2018, and that this percentage grows significantly over time unless employers are able to keep heath plan cost increases at low levels. In fact, 19 percent of employers already in 2015 have a plan that would exceed the HCPT threshold when FSA offers are considered; these firms would need to reduce their current plan costs over the next several years to avoid the tax. We estimate that by 2028, 42% of employers would have plans where costs would exceed the threshold for some or all employees. To the extent that health plan premiums continue to grow faster than inflation – a likely scenario – the share of employers affected by the HCPT will grow and eventually reach 100 percent. To avoid the tax, an employer would have to keep plan costs below the threshold and contain growth in costs over time to no more than inflation.
In addition to raising revenue to fund the expansion of coverage under the ACA, the HCPT provides powerful incentives to control health plans costs over time, whether through efficiency gains or shifts in costs to workers in the form of higher deductibles and other patient cost-sharing.
The design of the HCPT also has several implications for how employers structure and administer their health benefits, including:
The potential complexity of the tax may cause employers to simplify their health benefit offerings. The tax is calculated on total costs for an employee across health benefit programs but assessed separately against coverage providers. For employers that use multiple providers for health benefits, the employer and service providers may not know until the end of the year whether or not they owe a tax or how much it may be. The potential complications associated with allocating the tax burden and managing reimbursements to insurers (and potentially other services providers) may encourage employers to simplify their benefit arrangements and reduce the number of options that employees have and the number of coverage providers involved. The IRS is considering an option where the employer could be considered the benefit provider (and therefore the party that owes the tax) for most benefit arrangements, including self-funded health plans, although this would not be possible where there is an insured health plan (where the tax is assessed against the health insurer).
The HCPT threshold may be passed for some employees of an employer but not for others if employees are able to choose different amounts of benefits. This may make employers reluctant to give employees the ability to select benefit options that have the potential to trigger the tax. One current benefit that may be at particular risk is the option to contribute to an FSA because, as currently structured, it allows employees to add up to several thousand dollars to their benefit costs. These plans are separate from the core health insurance options provided by employers, so limiting or eliminating them provides a way for employers to lower costs without affecting the plans that most employees rely upon and value the most. Employers also may consider reducing other ancillary health benefit options (e.g., critical disease or hospital indemnity plans) offered on a pre-tax basis if the cost of the core health insurance plans approach the HCPT thresholds.
The significant tax rate, which would likely be borne by the employer (either directly or through reimbursing tax paid by coverage providers), may cause employers to limit employee choice generally and even among core health insurance offerings. Discussions about employee health benefits often focus on giving employees choices and sometimes focus on making employees aware of costs by having them pay all of the additional costs if they select more expensive plans. Under the HCPT, a significant additional cost for plans that exceed the threshold is borne in the first instance by the employer, who may be reluctant to permit employees to elect these plans if it can be avoided. Employers could structure the employee contributions for plans above the threshold so that they include a surcharge, which would pass the tax incidence on to the employees who selected the plans. Doing so would require knowing before the beginning of the year if, and (perhaps roughly) by how much, the options selected by an employee would exceed the threshold. This approach would be possible for an employer sponsoring multiple plan options on its own or offering insured health benefits through a private exchange (where the insurers could collect the additional contribution).
Employers considering this design would need to assess whether, and which, employees would be willing to pay a high surcharge to elect these more expensive benefit options. Plan choice generally results in employees that are less healthy selecting more comprehensive benefit options, and putting a surcharge on these options would increase the adverse selection against these plans, increasing their costs. If the additional contribution for an employee was small (for instance, the excess cost above the threshold is modest), enrollment may not fall too much, but if the additional contribution was large, or grew larger over time, enrollment in the more expensive options would likely shrink and skew less and less healthy. This could affect the viability of these plan options.
We expect employers to make modifications to their health benefit plans over the next several years to avoid or delay hitting the threshold for the HCPT. While some will need to move more quickly than others, the tax will be an important contrast for a large share of employers within the next decade.
Methods
We used information about the premiums for employer-sponsored health insurance from the 2015 Kaiser/HRET Employer Health Benefits Survey (EHBS) to estimate the percentage of employers that would have at least one health plan that would be subject to the High Cost Plan Tax (HCPT) assuming certain future rates of premium growth. The EHBS is an annual survey that collects information about health benefits offered by about 2,000 employers with three or more employees.
The EHBS collects information from responding employers about their largest plan for up to four plan types — health maintenance organization (HMO), preferred provider organization (PPO), point of service plan (POS), and high deductible health plan offered with a savings account (HDHP/SO). An HDHP/SO is a plan with a single deductible of $1,000 or more offered with a health reimbursement arrangement (HRA), or a health plan that qualifies the employee to make contributions to a Health Saving Account (HSA). The EHBS asks respondents for the premium for single coverage and for a family of four for their largest plan in each plan type. For HDHP/SOs, the amounts that employers contribute to employees’ HSAs or make available to employees through HRAs are also collected. Periodically, including in 2015, the EHBS asks about whether or not the employer sponsors a flexible spending account (FSA) but does not obtain information about participation or the amounts contributed.
For the estimates, we took the single premium for each health plan offered by responding employers and increased them by five percent annually. We also looked at alternate scenarios with a four percent and a six percent increase. For HSA qualified plans we added the amount that employers contribute to employees’ HSAs to the premium. For high deductible health plans offer with an HRA, the survey collects information about the amounts employers make available to employees but not the amounts that are actually contributed. To be conservative, we added one-half of the amount that employers make available through the HRA to the plan premium. The HSA and HRA amounts were also increased by the percentages above. A five percent annual growth rate is roughly consistent with the historic trend for these contributions. For employers that reported offering an FSA, we added the maximum contribution amount permitted for an FSA to the estimated premium for each plan type except HSA qualified plans for each of the three years. We did not add the FSA amount to the premium for HSA qualified plans because generally a person cannot establish an HSA if they have an FSA that could reimburse expenses before the plan deductible is met. We used the maximum contribution amount because we were looking to see if the cost for the plan could exceed the threshold for an employee. The total costs for each plan for 2018, 2023 and 2028 were compared to the estimated HCPT thresholds to determine if any plan offered by an employer would hit the threshold.
To calculate the HCPT thresholds, we assumed that inflation increase annually by 2.7 percent between 2018 and 2028. This is consistent with the assumptions used in the 2015 Medicare Trustees Report. We also used the Trustee’s assumed annual inflation from 2015 to 2028 to calculate the maximum FSA contribution amounts.
With renewed discussion of the high cost of prescription drugs recently, the August Kaiser Health Tracking poll finds that most Americans feel that drug costs are unreasonable (72 percent) and that drug companies put profits before people (74 percent). At the same time, the public largely values the role prescription drug companies play, with most (62 percent) saying that prescription drugs developed in the past two decades have made the lives of people in the U.S. better, including about 4 in 10 (42 percent) who say a lot better. About half of Americans (54 percent) report currently taking prescription drugs, with most of them (72 percent) saying they are easy to afford, while about a quarter (24 percent) say they have a difficult time paying for their drugs; a share that rises among those with lower incomes (33 percent) or in worse health (43 percent). Large shares, across the partisan spectrum, have favorable views of several proposed actions to lower drug costs, including requiring drug companies to release information to the public on how they set their drug prices (86 percent) and allowing the federal government to negotiate with drug companies to get a lower price on medications for people on Medicare (83 percent), and majorities also say these strategies would be effective. Reflective in part of the perceived high costs of prescription drugs and focus on profits, about 4 in 10 (42 percent) Americans have a favorable view of drug companies, lower than the shares who feel favorably towards doctors (78 percent), food manufacturers (58 percent) and banks (58 percent).
When it comes to their views of the Affordable Care Act (ACA) this month, the American public remains divided in their opinion of the law; 44 percent say they have a favorable view and 41 percent say they have an unfavorable view. Nearly 3 in 10 (28 percent) say they want Congress to expand what the law does, an identical share (28 percent) want the law repealed, and the remainder fall in the middle by saying they want Congress to continue implementing the law as it is (22 percent) or scale it back (12 percent). Those who favor repeal are divided on whether the law should be replaced with a Republican-sponsored alternative or if it should be repealed and not replaced (12 percent and 11 percent of the public overall). In addition, even after being told that about 19 million people would become uninsured if the health care law were to be repealed, only 3 percent are swayed to say they no longer favor repealing the law.
The Public’s Views On Prescription Drugs
Most Say Costs Are Unreasonable And Higher Than In Other Countries
Due to a renewed focus on the issue of prescription drug costs amongst policymakers and the media, the August Kaiser Health Tracking Poll expands upon the April and June Kaiser Health Tracking Polls that touched on the issue. As in June, this month a large majority of the public (72 percent) view the cost of prescription drugs as unreasonable. Those currently taking prescription drugs are somewhat more likely to say drug costs are unreasonable (77 percent), but still 66 percent of those not currently taking medications say they are unreasonable. In addition, about three quarters of the public (74 percent) think people in the U.S. pay higher prices than people in Canada, Mexico and Western Europe pay for the same prescription drug, a share that is similar across those taking medications and those who are not.
Figure 1
Views On Ways To Keep Drug Costs Down
Public Is Favorable Toward A Number Of Proposed Ways To Keep Drug Costs Down
When presented with policy options intended to help keep the cost of prescription drugs down, the public is supportive of a number of different actions and a majority feels each would be an effective option. Topping the list is requiring drug companies to release information to the public on how they set their drug prices, with more than 8 in 10 Americans reporting a favorable view (86 percent) and saying it would be effective (81 percent). Eight in 10 (83 percent) also favorably view allowing the federal government to negotiate with drug companies to get a lower price on medications for people on Medicare, while 72 percent view this as effective. In addition, more than 7 in 10 favor limiting the amount drug companies can charge for high-cost drugs for illnesses like hepatitis or cancer (76 percent) and allowing Americans to buy prescription drugs imported from Canada (72 percent) and similar shares think these would be effective actions to help lower drug prices (77 percent and 74 percent, respectively). Lower on the list is encouraging people to buy lower cost drugs by requiring them to pay a higher share of the cost if they choose a similar, but higher cost version of the drug (48 percent favorable). However, even more (57 percent) say this would be effective.
Figure 2
Feelings about these options and their effectiveness are similar across parties with the exception of allowing the government to negotiate on Medicare drugs which is favored by a somewhat higher share of Democrats (93 percent) than Republicans (74 percent) or independents (83 percent) and where more Democrats feel it would be effective (88 percent) than Republicans (56 percent) or independents (74 percent).
Table 1: Views Of Policy Actions To Keep Drug Costs Down By Party Identification
Percent who say they favor each of the following and percent who say they think each would be effective in keeping prescription drug costs down:
Party ID
Democrats
Independents
Republicans
Requiring drug companies to release information to the public on how they set their drug prices
Favorable
90%
84%
82%
Effective
83%
85%
75%
Allowing the federal government to negotiate with drug companies to get a lower price on medications for people on Medicare
Favorable
93%
83%
74%
Effective
88%
74%
56%
Limiting the amount drug companies can charge for high-cost drugs for illnesses like hepatitis or cancer
Favorable
79%
77%
70%
Effective
82%
78%
74%
Allowing Americans to buy prescription drugs imported from Canada
Favorable
69%
76%
75%
Effective
72%
78%
71%
Encouraging people to buy lower cost drugs by requiring them to pay a higher share if they choose a similar, higher cost drug
Favorable
51%
47%
51%
Effective
56%
59%
60%
Note: Items asked of half samples.
Partisan Disagreement On Government Regulation Or Marketplace Approach
When asked whether regulation by the federal government or competition in the marketplace would do a better job at keeping prescription drug costs down, more prefer competition in the marketplace than government regulation (51 percent vs. 40 percent). Not surprisingly, a majority of Democrats (57 percent) feel regulation would do a better job, while about three quarters of Republicans (76 percent) feel market competition is better. Independents are divided with 43 percent saying regulation and 46 percent saying market competition.
Figure 3
Opinion Of Pharmaceutical Companies
Majorities of the public feel favorably towards a number of companies and groups in American society, such as doctors (78 percent), food manufacturers (58 percent), banks (58 percent), and airlines (55 percent), but pharmaceutical companies rank lower. About 4 in 10 (42 percent) of the public views pharmaceutical companies favorably, similar to the shares who have positive views of oil companies (40 percent) and health insurance companies (44 percent). The share with favorable views of pharmaceutical companies is similar across Democrats (38 percent), Republicans (41 percent) and independents (42 percent).
Figure 4
While Americans hold some other industries and groups in higher regard than pharmaceutical companies, most of the public (57 percent) says drug companies are making about the same contribution to society as most other companies. About a fifth (22 percent) say they are making more of a contribution to society than most other companies and just under a fifth (17 percent) say they are making less of a contribution. Those who are currently taking prescription drugs are somewhat more likely than those not taking prescription drugs to say drug companies are making more of a contribution to society than other companies (25 percent vs. 18 percent).
Figure 5
Most Feel Drugs Have Improved Americans’ Lives
Most of the public (62 percent) says that prescription drugs developed in the past 20 years have made lives of people in the U.S. better, including 4 in 10 (42 percent) who say a lot better, while about 15 percent say they have made the lives of people in the U.S. worse and 19 percent say they haven’t made much difference.
Figure 6
Many Say Drug Companies Are Focused Too Much On Profits
While many feel pharmaceuticals have improved Americans’ lives, over 7 in 10 Americans (73 percent) say drug companies make too much profit, while about 2 in 10 (21 percent) say they make about the right amount of profit and very few say they do not make enough profit (1 percent). Those who feel the cost of prescription drugs is unreasonable are much more likely to say companies make too much profit than those who say costs are reasonable (83 percent vs. 46 percent).
In addition, about three quarters of the public (74 percent) say that pharmaceutical companies are too concerned about making profits and not concerned enough about helping people, while about a quarter (23 percent) say the balance between making profits and helping people at drug companies is about right. Again, those who believe drug costs are unreasonable are more likely to say drug companies are too concerned with making profits than those who feel drug costs are more reasonable (82 percent vs. 52 percent).
Figure 7
Personal Experience With Prescription Drugs
The cost of prescription drugs is personal for many as just over half of Americans (54 percent) report currently taking any prescription medicine, many of whom (37 percent of those currently taking drugs) report taking four or more different prescription drugs.
Figure 8
About 7 in 10 (72 percent) of those taking drugs say they are very or somewhat easy to afford, but about a quarter (24 percent) report that affording their prescription medicine is difficult, a share that rises to 33 percent of those with lower incomes (household incomes less than $40,000) who currently take prescription drugs. Some taking prescription drugs also report that in the past year they or a family member have not filled a prescription (24 percent) or skipped a dose or cut pills in half (19 percent) because of the cost.
Figure 9
Those who report that they are in fair or poor health and those who say they are currently taking 4 or more prescription drugs are more likely than their counterparts to say affording their medicine is difficult (43 percent vs. 17 percent and 38 percent vs. 16 percent, respectively). These groups are also more likely than others to say that they have not filled a prescription or cut pills in half or skipped doses in the past 12 months due to cost (Table 2).
Table 2: Those In Worse Health Or Taking 4 Or More Drugs More Likely To Report Difficultly Affording Their Medicines
Health Status Among Those Taking Prescription Drugs
Prescription Drug Use
Excellent/ Very Good/Good Health
Fair/ Poor Health
Taking 1-3Prescription Drugs
Taking 4 Or MorePrescription Drugs
In general, how easy or difficult is it for you to afford to pay the cost of your prescription medicine?
Very easy
54%
18%
53%
32%
Somewhat easy
26
32
27
27
Somewhat difficult
12
28
12
24
Very difficult
5
15
4
14
In the past 12 months, have you or another family member living in your household not filled a prescription for a medicine?
Yes
19
37
21
30
No
80
63
79
69
In the past 12 months, have you or another family member living in your household cut pills in half or skipped doses of medicine?
Yes
15
31
14
27
No
85
68
86
72
NOTE: Don’t know/ Refused responses not show. “Don’t have to pay (Vol.)” responses not shown.
Among those with insurance, prescription drug costs rank among a number of other health expenses, with 11 percent saying their prescription drug costs is their most burdensome health care cost, while 17 percent say it is the deductible, 14 percent say it’s their health insurance premiums, and 44 percent say that paying for health care and health insurance is not a financial burden. For those with lower incomes, paying for prescription drugs tops the list, with 17 percent reporting it is their greatest financial burden when it comes to health care costs.
Figure 10
Using generic over brand-name prescription drugs is one way to spend less on the cost of prescription drugs and just over half (52 percent) of those who say they are currently taking prescription medicine say that in the past two years they have asked for a generic drug when they were prescribed a brand-name. About 8 in 10 (78 percent) of those currently taking prescription drugs say brand-name drugs are about the same in quality as generic drugs, and 15 percent say they are better in quality, while just 2 percent say they are worse.
Figure 11
Views Of The Affordable Care Act
Public Still Split In Opinion Of Health Care Law
Consistent with findings over the past few months, the American public remains divided in their opinion of the health care law; 44 percent say they have a favorable view and 41 percent say they have an unfavorable view. Opinion of the law continues to diverge along party lines, with most Democrats reporting a favorable view of the law (76 percent) and most Republicans reporting an unfavorable view of the law (71 percent). Among independents, 46 percent say they have an unfavorable view, while 39 percent report a favorable view.
Figure 12
Next Steps For The ACA
Opinion about what Congress should do next when it comes to the law also has been fairly constant over time. Nearly 3 in 10 (28 percent) say they want Congress to expand what the law does, an identical share (28 percent) hope for a complete repeal of the law, and the remainder fall in the middle by saying they want Congress to continue implementing the law as it is (22 percent) or scale it back (12 percent).
Figure 13
Those who want Congress to repeal the law in its entirety are split about what should happen next. Twelve percent say they think Congress should replace the law with a Republican-sponsored alternative, while 11 percent say they would like the law repealed and not replaced.
Figure 14
Although those who want the law repealed disagree about what Congress should do, they are unified in their unwavering desire for repeal. After being told that about 19 million people would become uninsured if the health care law were to be repealed, only 3 percent are swayed to say they no longer favor repealing the law.
Figure 15
However, the vast majority of the public (70 percent) does not think that the Republicans in Congress have an agreed-upon alternative. Even majorities of those who would like to see it repealed and replaced with a Republican-sponsored alternative (58 percent) do not think that that such an alternative exists.
Kaiser Health Policy News Index: August 2015
The Kaiser Health Policy News Index is designed to help journalists and policymakers understand which health policy-related news stories Americans are paying attention to, and what the public understands about health policy issues covered in the news.
In the wake of the first Republican primary debate that took place the first week of August and the first night this survey was in the field, nearly 7 in 10 Americans report “very” or “fairly” closely following news coverage of the 2016 presidential campaigns (69 percent), significantly more than the slim majority that said the same in the last two Kaiser Health Policy New Index reports. Perhaps not surprisingly given the recent debate, Republicans (78 percent) are more likely to say they have been following the presidential campaigns closely than Democrats (71 percent) or independents (66 percent). About two thirds of the public (66 percent) report following another national headline, coverage of the four Marines killed in a shooting in Chattanooga, Tennessee, as well as the international headline about the recent agreement on Iran’s nuclear program between Iran, the United States, and other nations (63 percent). More than half followed other national news stories such as the controversy about Planned Parenthood (57 percent) and the death of an African American woman, Sandra Bland, in a Texas jail (54 percent).
Health stories fall to the bottom of the public’s radar this month, with just 3 in 10 (30 percent) saying they closely followed profits made by insurance companies, and about 2 in 10 say they closely followed the merger between health insurance companies Anthem and Cigna (22 percent), the release of Medicare’s annual financial report (20 percent), or the Food and Drug Administration’s (FDA) approval of an expensive new cholesterol-lowering drug (18 percent). Those who say they are currently taking prescription medicine are slightly more likely to say they followed news of the FDA’s approval of the new cholesterol-lowering drug closely than those who say they are not taking any prescription drugs, however these shares are small among both groups (21 percent vs. 13 percent, respectively).
Figure 16
The Health Care Law In The Media
Although more than 4 in 10 of the American public have previously said that they are tired of hearing about the health care law and are ready for the country to focus on other issues,1 this month, the public doesn’t express fatigue with the topic. When asked about news coverage of the health care law, just 16 percent say they think the news media covers the health care law too much, while 4 in 10 say it covers the law too little (37 percent) or about the right amount (37 percent). This is a rare instance where there is no large difference by political party, however opinion does vary by favorability towards the health care law. Those with an unfavorable view are more likely than those with a favorable view to say the media covers the law too little (45 percent vs. 32 percent), while those with a favorable view are more likely than those with an unfavorable view to say the media coverage is about right (48 percent vs. 29 percent).
Figure 17
Kaiser Health Tracking Poll: August 2015 Methodology
This Kaiser Health Tracking Poll was designed and analyzed by public opinion researchers at the Kaiser Family Foundation (KFF). The survey was conducted August 6-11, 2015, among a nationally representative random digit dial telephone sample of 1,200 adults ages 18 and older, living in the United States, including Alaska and Hawaii (note: persons without a telephone could not be included in the random selection process). Computer-assisted telephone interviews conducted by landline (480) and cell phone (720, including 419 who had no landline telephone) were carried out in English and Spanish by Princeton Data Source under the direction of Princeton Survey Research Associates International (PSRAI). Both the random digit dial landline and cell phone samples were provided by Survey Sampling International, LLC. For the landline sample, respondents were selected by asking for the youngest adult male or female currently at home based on a random rotation. If no one of that gender was available, interviewers asked to speak with the youngest adult of the opposite gender. For the cell phone sample, interviews were conducted with the adult who answered the phone. KFF paid for all costs associated with the survey.
The combined landline and cell phone sample was weighted to balance the sample demographics to match estimates for the national population using data from the Census Bureau’s 2013 American Community Survey (ACS) on sex, age, education, race, Hispanic origin, nativity (for Hispanics only), and region along with data from the 2010 Census on population density. The sample was also weighted to match current patterns of telephone use using data from the July-December 2014 National Health Interview Survey. The weight takes into account the fact that respondents with both a landline and cell phone have a higher probability of selection in the combined sample and also adjusts for the household size for the landline sample. All statistical tests of significance account for the effect of weighting.
The margin of sampling error including the design effect for the full sample is plus or minus 3 percentage points. Numbers of respondents and margins of sampling error for key subgroups are shown in the table below. For results based on other subgroups, the margin of sampling error may be higher. Sample sizes and margins of sampling error for other subgroups are available by request. Note that sampling error is only one of many potential sources of error in this or any other public opinion poll. Kaiser Family Foundation public opinion and survey research is a charter member of the Transparency Initiative of the American Association for Public Opinion Research.
Large Bipartisan Majorities Support Range of Policy Changes They Believe Would Curb Drug Costs
Opinion on the Affordable Care Act Remains Largely Unchanged In August
About half of Americans (54%) report currently taking a prescription drug, and a large majority of them (72%) say their prescriptions are very or somewhat easy to afford. However, about a quarter (24%) say paying for their drugs is difficult, and the share facing difficulties rises among those with low incomes (33%) or currently taking four or more prescription drugs (38%), and is highest for those in fair or poor health (43%).
These are among the findings from the August Kaiser Health Tracking Poll, which expands on findings from earlier this year looking at prescription drug costs. The new poll finds strong majorities of the public support a wide range of policy actions to lower the costs of prescription drugs. At least seven in 10 support each of these four potential policy changes:
86 percent support requiring drug companies to release information on how they set prices, an idea proposed in legislatures in several states, including majorities of Democrats (90%), Republicans (82%), and independents (84%);
83 percent support allowing the government to negotiate with drug companies to lower prices for people with Medicare, including majorities of Democrats (93%), Republicans (74%), and independents (83%);
76 percent support limiting how much drug companies can charge for high-cost drugs for illnesses such as hepatitis or cancer, including majorities of Democrats (79%), Republicans (70%), and independents (77%); and
72 percent support allowing Americans to buy prescription drugs imported from Canada, including majorities of Democrats (69%), Republicans (75%), and independents (76%).
Fewer (48%) support changes to encourage consumers to use low-cost drugs by charging them a larger share of the costs when they choose a higher-cost alternative.
Majorities view each of these changes as likely to be effective at reducing drug costs, ranging from 81 percent who say requiring public disclosure about how drug companies set prices would be effective to 57 percent who say so about charging consumers more when they choose high-cost drugs over lower-cost ones.
Most of the public (62%) says that prescription drugs developed in the past 20 years have made lives of people in the U.S. better, including 42 percent who say a lot better. Far fewer say they have made them worse (15%) or say they haven’t made much difference (19%). However, the survey also finds a large majority of the public view the cost of prescription drugs as unreasonable (72%). Similar shares say that drug companies make too much profit (73%) and that they are too concerned about profits and not concerned enough about patients (74%).
The survey also assesses the public’s perception of pharmaceutical companies in comparison to other industries. Among the public overall, 42 percent hold a favorable view of pharmaceutical companies, similar to the share holding a favorable view of oil companies (40%) and health insurers (44%) but smaller than the share saying so about doctors (78%), food manufacturers (58%), banks (58%), and airlines (55%).
On the ACA overall, the poll finds the public remains closely divided, with 44 percent reporting a favorable view of the law and 41 percent reporting an unfavorable view, statistically unchanged from recent months. As in the past, most Democrats hold a favorable view (76%), most Republicans an unfavorable one (71%), and independents are more evenly split (46% unfavorable, 39% favorable).
Opinion about what Congress should do next when it comes to the law also has been fairly constant over time. Equal shares (28%) say that they want Congress to expand what the law does and that they want a complete repeal of the law, with the remainder falling in between by saying either they want Congress to continue implementing the law as it is (22%) or scale it back (12%).
Those who want Congress to repeal the law in its entirety are split about what should happen next: 12 percent of the public overall say they think Congress should replace the law with a Republican-sponsored alternative, while 11 percent say they would like the law repealed and not replaced.
The poll was designed and analyzed by public opinion researchers at the Kaiser Family Foundation and was conducted from August 6-11, 2015 among a nationally representative random digit dial telephone sample of 1,200 adults. Interviews were conducted in English and Spanish by landline (480) and cell phone (720). The margin of sampling error is plus or minus 3 percentage points for the full sample. For results based on other subgroups, the margin of sampling error may be higher.