Outreach and Enrollment Strategies for Reaching the Medicaid Eligible but Uninsured Population

Published: Mar 2, 2016

Issue Brief

Introduction

As of February 2016, a total of 31 states and the District of Columbia are moving forward with the ACA Medicaid expansion to adults. While millions of individuals have gained Medicaid coverage since initial implementation of the ACA coverage provisions in 2014, an estimated 8.8 million individuals who are eligible for coverage through Medicaid or the Children’s Health Insurance Program (CHIP) remained uninsured as of 2015.1  These include adults made newly eligible by the expansion as well as children and adults who were already eligible under pre-ACA rules but not enrolled. Reaching and enrolling these individuals into coverage will be one important component of achieving continued coverage gains moving forward. Moreover, as additional states may take up the expansion in the future, outreach and enrollment efforts will be key for achieving successful enrollment as the expansion is implemented. Keeping eligible individuals enrolled over time through successful renewals of coverage also will be important for maintaining coverage gains achieved to date.

This brief identifies a range of successful strategies to reach and enroll Medicaid- and CHIP-eligible individuals as well as options to facilitate renewals. It draws on a collection of previous work examining state enrollment experiences after implementation of the ACA (listed in Appendix A). In sum, it shows that states that have achieved enrollment success have embraced an array of strategies and approaches that include promoting the expansion through strong leadership and collaboration, implementing broad marketing and outreach campaigns, establishing a coordinated and diverse network of assisters, developing effective eligibility and enrollment systems that coordinate with the Marketplace, and planning ahead to translate coverage gains into improved access to care.

Outreach and Enrollment Strategies

Leadership and Collaboration

Promoting coverage efforts through strong leadership and collaboration with key stakeholders. States have cited strong leadership as a factor that contributes to successful coverage efforts. For example, in Kentucky, the previous governor made successful implementation of the expansion a priority, and stakeholders indicated that this leadership carried down through top state officials who were highly engaged in on-the-ground enrollment efforts and personally committed to achieving success. The former governor and other leading state officials were often present at local level enrollment events to demonstrate their leadership and support for the coverage expansion. Similarly, other leading states noted that ACA implementation built on earlier state-initiated reform efforts that streamlined Medicaid enrollment policies and established a culture of coverage in the state. In addition to strong leadership, close collaboration between stakeholders has been identified as a contributor to success. This includes collaboration across state agencies as well as with the community, advocates, and providers (including clinics and other health care providers). This collaboration is supported through early engagement of stakeholders, regular meetings, and ongoing information sharing. Leading states have also pointed to the importance of keeping state legislators updated on coverage progress and the value of having data available to show progress achieved at the district level.

Marketing and Outreach

Providing a combination of broad mass marketing campaigns and localized grassroots efforts. Mass marketing campaigns through print, television, radio and billboards help raise awareness of coverage options. States found that utilizing high profile figures such as the governor to deliver messages in these campaigns can demonstrate strong leadership for the expansion and the governor’s personal commitment and engagement in the effort. Some states also utilized other public figures such as sports stars in mass marketing efforts. In combination with these mass media efforts, local level outreach and enrollment efforts play a pivotal role in educating consumers and encouraging them to enroll in coverage. Stakeholders point to the importance of conducting an array of outreach and enrollment initiatives through numerous local avenues including churches, college campuses, beauty and barber shops, local grocery or community stores, libraries, and extension centers. Recognizing that many in the newly eligible population may be in working families, small businesses and job placement sites have also been identified as effective outreach sites. Outreach avenues historically used to reach families, such as schools and sports leagues, also remain important for reaching eligible children and parents. Offering outreach and enrollment assistance at large community events, such as fairs and sporting events, provides opportunities to efficiently reach large numbers of people. States and assisters also found it effective to create their own local enrollment events. Other approaches that have been particularly successful include establishing walk-in enrollment storefronts or temporary enrollment sites and providing mobile enrollment vans that can travel across the state and into rural areas.

Maintaining outreach efforts outside of open enrollment. Outside of open enrollment periods, when media coverage and public awareness falls off, targeting outreach to correspond with life events (such as graduation, job loss, marriage, divorce, birth) associated with health coverage loss and/or a change in eligibility is key. Developing partnerships with entities that serve people in these situations provides an avenue to reach individuals during these transition periods. Moreover, providing continued outreach to communicate that Medicaid enrollment remains open year-round is particularly important outside of open enrollment periods.

Targeting outreach and enrollment efforts to harder to reach communities (e.g., Hispanics, African Americans, immigrants, the LGBT community, young adults, and veterans). Partnering with churches and other community organizations that serve particular populations, including food banks, homeless shelters, and immigrant support organizations, is helpful for connecting with hard-to-reach communities. These organizations are trusted by community members and, particularly for immigrants, speak their languages. In addition, developing customized outreach materials and resources can help in connecting with targeted populations. For example, in an area of Connecticut with a large Portuguese-speaking population, fact sheets were created in Portuguese. Similarly, assisters in Colorado serving the African American community developed informational materials that focus on the importance of obtaining health coverage to address some of the specific health problems faced by African Americans. Moreover, advertising on Spanish-language radio and in Spanish-language newspapers were found to be cost-effective strategies for reaching the Hispanic community in several states.

Messaging that directs individuals to assistance resources, includes personal testimonials, and emphasizes availability of financial help and benefits of coverage. One key role of messaging is to raise awareness of available coverage options. States also found that providing personal testimonials from individuals who have benefited from gaining coverage; emphasizing the affordability of coverage, for example by indicating that it may be free or low-cost; and identifying the benefits of having coverage are effective messages to encourage enrollment. In addition, states have pointed to the importance of messaging that emphasizes that Medicaid enrollment remains open year-round and directs individuals to local enrollment assistance resources.

Enrollment Assistance

Personalized, one-on-one assistance provided through trusted individuals in the community. Successful states established extensive consumer assistance networks that drew on existing assistance resources. These networks include assisters of varied backgrounds who are able to provide assistance that is personalized to the community being served. Experience also suggests that providing additional state funding beyond that available through federal sources can help increase the capacity of assisters.

Coordination among assisters. Facilitating coordination among assisters makes scheduling, outreach, and other tasks more efficient and supports sharing of scarce resources, such as multi-lingual staff and expertise on complex cases. Using shared appointment schedulers and jointly planning outreach and enrollment events maximizes limited resources, enabling assisters to reach more people. Especially when targeting immigrant populations, coordinating enrollment events can ensure bilingual staff or interpreters are available to meet with clients. Some states used regionally-based structures to organize and coordinate assister activities. In addition, facilitating strong relationships between assisters and brokers supports referrals and information sharing that enables individuals to connect to the specific assistance they need. Some states have also tied enrollment assistance into broader assistance tools, such as the United Way 211 resource call-in line or local 311 call-in service lines.

Providing sufficient assister training and support. States can support assisters by providing dedicated resources for assisters who have questions or need assistance while helping a client. For example, providing dedicated telephone lines for assisters helps reduce long waits when they need support with complex cases, website problems, or other issues, leading to quicker resolution of those problems. States can also dedicate Medicaid agency staff to support assisters. For example, in California, the Medicaid agency, Medi-Cal, assigned staff to work with each assister organization. This not only allows assisters to get fast and reliable feedback on their questions but also fosters strong relationships between the agency and assisters. Although many assisters have experience helping consumers enroll in Medicaid, they may need additional training on the new eligibility rules, how to answer consumer questions related to their transition from Marketplace to Medicaid coverage, and how to navigate the Medicaid online portal. Moreover, although the process of transferring files between the federal Marketplace and state Medicaid agencies is improving, state agencies can work closely with assister organizations to help facilitate such transfers.

Expanding call center capacity to meet increased need. During the initial year of enrollment under the ACA, some states did not adequately expand call center capacity, which contributed to long wait times and dropped calls. To meet increased demand, states trained and hired more staff, contracted with additional vendors, extended call center hours, and created tiered levels of assistance so calls could be directed based on what type of assistance a caller was seeking.

Engaging the provider community in outreach and enrollment efforts. Providers can play an effective role in educating their patients about coverage options and encouraging enrollment. In particular, safety-net hospitals and community health centers play an important role in enrollment because they have existing relationships with their patients and their staff is experienced in communicating with their patients and enrolling people into Medicaid coverage. Beyond conducting “in-reach” to uninsured patients they already serve, they also can conduct outreach to uninsured patients in the communities they serve.

Systems

Building systems to support smooth coordination with the Marketplace. Smooth coordination with the Marketplace system is key to ensuring that cases move between the Marketplace and Medicaid. States that use a State-based Marketplace for Marketplace coverage eligibility determinations have established a single integrated Marketplace/Medicaid eligibility determination system, eliminating the need to transfer accounts between programs to make an eligibility determination. However, in states relying on the Federally-facilitated Marketplace (FFM), Healthcare.gov, electronic accounts must be transferred between the FFM and state Medicaid eligibility determination systems to provide a coordinated, seamless enrollment experience for individuals as envisioned under the ACA. Moreover, when new states take up the Medicaid expansion, communication and coordination will be necessary to transition individuals with incomes between 100-138% FPL from Marketplace coverage to Medicaid. States relying on the FFM can facilitate coordinated enrollment by authorizing the federal system to make final Medicaid eligibility determinations rather than assessments of Medicaid eligibility.

Offering consumer friendly features. Certain features of state systems have proven to be particularly effective for facilitating enrollment. These include allowing individuals to quickly pre-screen their eligibility for coverage after answering a few questions, enabling individuals to electronically upload documentation when it is required, and allowing people to search for local assistance resources. Moreover, offering mobile-based options or apps expands options for consumers who rely on mobile-based technology to connect to the system.

Harnessing data and technology to facilitate enrollment and renewal. Several options are available to states to utilize data available from other programs to facilitate enrollment and renewal, including Express Lane Eligibility and the new Supplemental Nutrition Assistance Program (SNAP) facilitated enrollment strategy. States that have utilized these options have enrolled large numbers of eligible individuals quickly and efficiently. The Centers for Medicare and Medicaid Services (CMS) also offered states an option under waiver authority to utilize child enrollment data to reach and enroll parents, which has proven effective in some states. CMS has outlined other strategies that utilize child enrollment data to facilitate parent enrollment that do not require special authorization. These include using child enrollment data to identify potentially eligible parents and then collecting additional information necessary to enroll the parents. CMS also indicates that children’s renewal dates can be extended to synchronize renewal dates for the whole family as parents are enrolled. With regard to renewal, automating renewals for as many groups as possible by relying on available data helps keep eligible individuals enrolled and reduces the workload on agencies to process renewals. Providing 12-month continuous eligibility also supports stable coverage and reduces agency workload associated with processing renewals. States have an option to adopt 12-month continuous eligibility for children and can obtain a waiver to provide it to adults.

Translating Coverage into Improved Access to Care

Increasing health literacy and ensuring adequate provider capacity. As states achieve coverage gains, they point to the importance of increasing health insurance and health care literacy among newly insured individuals, particularly since many of those gaining coverage may have been uninsured for long periods of time and be unfamiliar with how to access the health care system with insurance. Some states are developing their own education materials for consumers. For example, the Washington state Medicaid agency created a first-time user guide for new Medicaid enrollees, which includes basic information on what is covered, how to arrange a doctor’s visit, and who to call for assistance with different issues. In addition, stakeholders have noted that the “From Coverage to Care” materials developed by CMS have been helpful in supporting these health coverage literacy efforts. Some Medicaid managed care plans also are working directly with their members on education. Some states have also taken steps to enhance provider capacity and benefits to meet increased demands for care as a result of the Medicaid expansion. For example, Kentucky expanded access to behavioral health providers by allowing Medicaid to contract with additional provider types (such as licensed drug alcohol counselors) and added new substance abuse treatment services to Medicaid. Both Colorado and Washington added adult dental benefits to Medicaid subsequent to the expansion, but stakeholders noted that there is a limited supply of dentists to provide these services, particularly given the high demand for them. Continued efforts to expand capacity and access, particularly in rural areas and for specialties subject to overall shortages, will be important for supporting improved access as coverage gains are achieved.

Conclusion

Three years into implementation of the ACA, millions of individuals have gained coverage through Medicaid. However, 8.8 million individuals are eligible for Medicaid or CHIP but remain uninsured. Reaching and enrolling these individuals will be important for achieving continued coverage gains looking ahead. Moreover, outreach and enrollment strategies will be key for supporting successful enrollment as additional states may implement the Medicaid expansion in the future. State experiences to date point to an array of effective outreach and enrollment strategies that states and other stakeholders may look to as tools to support continued enrollment gains. These strategies include implementing broad marketing and outreach campaigns, promoting the expansion through strong leadership and collaboration, establishing a coordinated and diverse network of assisters, developing effective eligibility and enrollment systems that coordinate with Marketplace coverage, and planning ahead to translate coverage gains into improved access to care.

State Policies

“Medicaid and CHIP Eligibility, Enrollment, Renewal, and Cost-Sharing Policies as of January 2016: Findings from a 50-State Survey,” January 2016, https://www.kff.org/medicaid/report/medicaid-and-chip-eligibility-enrollment-renewal-and-cost-sharing-policies-as-of-january-2016-findings-from-a-50-state-survey/

“Fast Track to Coverage: Facilitating Enrollment of Eligible People into the Medicaid Expansion,” November 2013, https://www.kff.org/medicaid/issue-brief/fast-track-to-coverage-facilitating-enrollment-of-eligible-people-into-the-medicaid-expansion/

State Implementation

“Year Two of the ACA Coverage Expansions: On-the-Ground Experiences from Five States,” June 2015, https://www.kff.org/health-reform/issue-brief/year-two-of-the-aca-coverage-expansions-on-the-ground-experiences-from-five-states/

“What Worked and What’s Next? Strategies in Four States Leading ACA Enrollment Efforts,” July 2014, https://www.kff.org/health-reform/issue-brief/what-worked-and-whats-next-strategies-in-four-states-leading-aca-enrollment-efforts/

“Key Lessons from Medicaid and CHIP for Outreach and Enrollment Under the Affordable Care Act,” June 2013, https://www.kff.org/medicaid/issue-brief/key-lessons-from-medicaid-and-chip-for-outreach-and-enrollment-under-the-affordable-care-act/

Consumer Assistance

“2015 Survey of Health Insurance Marketplace Assister Programs and Brokers,” August 2015, https://www.kff.org/health-reform/report/2015-survey-of-health-insurance-marketplace-assister-programs-and-brokers/

“Connecting Consumers to Coverage: Lessons Learned from Assisters for Successful Outreach and Enrollment,” September 2014, https://www.kff.org/health-reform/issue-brief/connecting-consumers-to-coverage-lessons-learned-from-assisters-for-successful-outreach-and-enrollment/

“Survey of Health Insurance Marketplace Assister Programs,” July 2014, https://www.kff.org/health-reform/report/survey-of-health-insurance-marketplace-assister-programs/

Endnotes

  1. Robin Rudowitz, et al., A Closer Look at the Remaining Uninsured Population Eligible for Medicaid and CHIP, (Washington, DC: Kaiser Commission on Medicaid and the Uninsured, Feb. 2016), https://modern.kff.org/uninsured/issue-brief/a-closer-look-at-the-remaining-uninsured-population-eligible-for-medicaid-and-chip/. ↩︎
Medicaid Expansion Waivers: What Will We Learn?

Authors: Robin Rudowitz, MaryBeth Musumeci, and Alexandra Gates
Published: Mar 1, 2016

Introduction

Six of the 32 states implementing the Affordable Care Act’s (ACA) Medicaid expansion to date have done so through Section 1115 waivers. Using these waivers, the Centers for Medicare and Medicaid Services (CMS) has approved terms that extend beyond the flexibility provided by federal law. Section 1115 waivers authorize research and demonstration projects that, in the view of the Health and Human Services (HHS) Secretary, further the purposes of the Medicaid program. The ACA implemented new requirements for these waivers, including that states must have a publicly available, approved evaluation strategy. States also must submit an annual report to HHS that describes the changes occurring under the waiver and their impact on access, quality, and outcomes. Additionally, a federal contract has been awarded to evaluate different types of Section 1115 waivers, including those related to the ACA’s Medicaid expansion. This brief examines some of the major research questions and hypotheses relevant to the federal and state evaluations of Medicaid expansion Section 1115 waivers and explores key challenges that may hamper research and evaluation efforts.

The federal evaluation of Section 1115 waivers is designed to consider the experiences of multiple states in implementing policy changes related to Medicaid expansion, including Marketplace premium assistance programs, premiums beyond the limits set in federal law, and healthy behavior incentive programs. While the state evaluations are unique to each state’s waiver, the evaluation questions identified by the states relevant to Medicaid expansion waivers can be grouped into five key areas: coverage, access to care and utilization, premiums, healthy behavior incentives, and program costs.

As additional states seek waivers, evaluations are key to understanding Medicaid expansion experiences under existing waivers. Evaluation plans include comprehensive research questions, but a number of challenges may hamper research efforts including: limited access to timely data; difficulty selecting outcome measures; difficulty generalizing the results; administrative complexity; and implementation of waivers in dynamic, continuously evolving environments. Despite the challenges in conducting waiver evaluations, timely and publicly available results are important. In the near term, availability of data can help states and CMS to understand issues and make mid-course corrections in the implementation of current waivers. In the near and longer term, data and analysis of existing waivers also begins to inform policy makers about which policies are effective and could be replicated or implemented more broadly as well as what approaches to avoid.

Background

As of January, 2016, six of the 32 states1  implementing the ACA’s Medicaid expansion are doing so through a Section 1115 waiver (Arkansas, Iowa, Michigan, Indiana, New Hampshire, and Montana).2  The ACA expands Medicaid eligibility to nearly all adults with income at or below 138% of the federal poverty level (FPL, $16,394 per year for an individual in 2016); however, the Supreme Court’s ruling on the ACA’s constitutionality effectively made the Medicaid expansion a state option.3   For states that implement the expansion, the ACA provides for full federal financing from 2014 through 2016 for those made newly eligible by the law, then gradually decreases to 90% federal funding by 2020.

While each of the Medicaid expansion waivers is unique, they contain some common provisions.4  Common elements of the waivers include a “premium assistance” model, in which the state uses federal Medicaid funds to purchase Marketplace coverage for enrollees or other private coverage; enrollee premiums; elimination of the non-emergency medical transportation benefit, which is otherwise required under Medicaid; and use of “healthy behavior incentives” to reduce enrollee premiums and/or copayments. Indiana’s waiver contains additional provisions (some of which were subsequently approved in other states) that allow the state to waive retroactive Medicaid eligibility; make coverage effective beginning on the date of the first premium payment, rather than on the date of application; and bar certain expansion adults from re-enrolling in coverage for six months if they are disenrolled due to unpaid premiums. In addition, under separate Section 1916(f) waiver authority, Indiana received approval to charge higher cost-sharing than otherwise allowed under federal rules for non-emergency use of the emergency room. Also unique among the current expansion waivers, Montana received approval to implement 12-month continuous eligibility for expansion adults to reduce the effects of churn between Medicaid and Marketplace coverage due to small changes in income.  Except for Montana, where the evaluation plan is still under development, all of these states have approved evaluation plans.

Table 1:  Key Themes in Approved ACA Expansion Waivers
Waiver ProvisionARIA*MI*IN*NH*MT*
Premium AssistanceQHPESIQHPESIQHP
Premiums / Monthly ContributionsXXXXX
Healthy Behavior IncentivesXXX
Waive Required Benefits (NEMT)XX
Reasonable PromptnessX
Waive Retroactive EligibilityXX
Co-payments Above Statutory LimitsX
12-Month Continuous EligibilityX
NOTES: * New Hampshire transitioned from a SPA to a waiver in 2016. Cost-sharing waiver approved in IN under Section 1916(f), not Section 1115. IA has approval for mandatory QHP enrollment with premium assistance for new adults from 101-138% FPL but has a waiver amendment pending to instead require mandatory Medicaid managed care due to the loss of both QHPs. Under MI’s waiver amendment, beneficiaries from 101-138% FPL will choose between coverage in Medicaid managed care and QHPs beginning April 2018. PA transitioned from a waiver to a SPA in 2015 (not included in the table). An evaluation plan has not yet been submitted for MT.SOURCE: KCMU analysis of waiver proposals.

Issue Brief

Research Questions in Federal Waiver Evaluation Design

CMS is funding a national cross-state evaluation that will consider several issues related to Section 1115 Medicaid expansion waivers, including the impact of Marketplace premium assistance, premiums, and healthy behavior incentive programs.5  Key research questions identified in the federal waiver evaluation design plan6  related to these issues include:

  • Marketplace premium assistance: How do states that require beneficiaries to enroll in Marketplace Qualified Health Plans (QHPs) using Medicaid as premium assistance compare to states implementing traditional expansions using their Medicaid delivery systems, in terms of enrollment rates, continuity of coverage, access to care, health outcomes, and health care and administrative costs?
  • Premiums: What effect do premiums imposed on beneficiary groups who are not otherwise subject to premiums under federal law, premiums that exceed the limits in federal rules, and lock-out periods for non-payment of premiums have on enrollment and continuity of coverage?
  • Healthy behavior incentive programs: Do beneficiaries understand healthy behavior incentive programs? Which educational strategies are most effective? Which incentives encourage beneficiaries to actively participate in their care without impairing access to care, and which yield the greatest relative gains in preventive care and management and care of chronic conditions and the greatest reductions in emergency room use? What are the administrative costs to states and managed care plans of implementing healthy behavior incentive programs?

Appendix 1 provides a full list of federal research questions.

Unlike the individual state waiver evaluations (described below), the federal Section 1115 waiver evaluation can assess the experience across states in implementing common waiver provisions. The federal evaluation will examine Marketplace premium assistance programs in Arkansas, Iowa and New Hampshire, and premiums and beneficiary engagement (such as healthy behavior incentives) programs in Arkansas, Indiana, Iowa, Michigan, Montana and Wisconsin (these are the issues most relevant to the expansion waivers).7  The federal evaluation also will consider questions related to other types of Section 1115 Medicaid waivers, including Delivery System Reform Incentive Payment (DSRIP) programs and managed long-term services and support programs.8 

Research Questions in State Waiver Evaluation Designs

The Medicaid expansion demonstrations set out fairly broad goals under which the states have identified a number of hypotheses for evaluation. While each state’s evaluation is unique, the themes of evaluation questions identified by the states relevant to the Medicaid expansion waivers can be grouped into five key areas: coverage, access to care and utilization, premiums, healthy behavior incentives, and program costs. The rest of this section summarizes the states’ waiver evaluation questions in these five areas. A full state-specific summary of evaluation goals and hypotheses that will be tested is included in Appendix 2.

Coverage

While no waiver is required to examine the implications of the Medicaid expansion on changes in coverage, Michigan’s and Indiana’s evaluations will measure their waivers’ impact on change in the number of uninsured. Both states expect to experience reductions in the uninsured as a result of their Medicaid expansions. Michigan expects that both the reduction in uninsured and the increase in Medicaid enrollment will be significant relative to expected state trends absent the Medicaid expansion, similar to the experience of other expansion states, and significantly larger than the changes in non-expansion states. Reductions in the uninsured and increases in Medicaid coverage are expected in all states that implement the Medicaid expansion; so, this issue is not specific to Medicaid expansion waivers; however, other expansions are not required to conduct evaluations so other states may not be explicitly tracking these changes.

Several states plan to examine their demonstration’s impact on continuity of coverage and gaps in care. Arkansas and New Hampshire are testing the impact of mandatory Marketplace premium assistance on continuity of coverage. These states anticipate that as a result of Marketplace enrollment, Medicaid expansion adults will experience fewer gaps in coverage and more continuous access to the same health plans and provider networks. Although no longer using a Marketplace premium assistance model as originally intended,9  Iowa’s evaluation will examine whether beneficiaries maintain access to a regular source of care when Medicaid eligibility changes due to income fluctuations. Indiana will test how, in the absence of retroactive eligibility, its waiver provisions to utilize additional presumptive eligibility and fast-track prepayment of premiums (required for enrollment to become effective) affect gaps in coverage. It is expected that Montana’s waiver evaluation will examine continuity of coverage, as it relates to the state’s adoption of 12-month continuous eligibility.

Arkansas and New Hampshire expect that their premium assistance waivers will impact the premiums and coverage options in their Marketplaces. Arkansas anticipates that providing Marketplace coverage for Medicaid expansion adults will reduce premium costs in the Marketplace. New Hampshire projects that using Marketplace premium assistance could lead to a greater variety of Marketplace health plans, as insurers will have incentives to offer both Medicaid managed care and Marketplace plans.

Indiana plans to test how its demonstration promotes access to employer-sponsored insurance (ESI) and reduces fragmented coverage within families. Indiana’s waiver includes a voluntary defined contribution ESI premium assistance program, which the state expects will increase the proportion of Medicaid expansion adults who are covered by ESI. Indiana also expects that its ESI premium assistance option for family coverage will increase the number of families in which all members have access to the same provider network instead of having parents enrolled in ESI and children in Medicaid or CHIP.

While not directly related to coverage, Indiana’s evaluation includes an assessment of its state-funded work search program, which is not considered part of the Section 1115 demonstration by CMS.

Indiana’s Work Search and Job Training Program Evaluation

Indiana’s evaluation of its Medicaid expansion waiver includes an assessment of its state-run voluntary work search and job training program. CMS did not approve Indiana’s request to require a work referral as a condition of eligibility as part of its Medicaid expansion waiver and noted that Indiana’s work search and job training program is separate from the Section 1115 demonstration. Indiana expects that Medicaid applicants who are referred to work search and job training resources available through the state’s Department of Workforce Development will have increased employment rates over the course of the demonstration.

Access to Care and Utilization

Several state evaluations will examine changes in beneficiary access to care. Arkansas, Iowa, and New Hampshire will assess changes in access to primary, preventive, behavioral health, and specialty care and Early and Periodic Screening, Diagnostic and Treatment (EPSDT) services for 19- and 20-year-olds. Iowa also plans to measure access to dental care, including preventive dental services. Arkansas will compare access to care in its Marketplace premium assistance model to access in its Medicaid fee-for-service delivery system, while New Hampshire will compare access to care for expansion adults to access for the state’s general population. Arkansas, Iowa, and New Hampshire also mention plans to assess beneficiary satisfaction or experience with care as part of their evaluations. In Arkansas and Iowa, the evaluation plans will examine the adequacy of provider networks as part of their evaluations. Iowa expects that its Medicaid expansion enrollees will have the same access to medical providers and improved access to dental providers, relative to traditional (non-expansion) Medicaid populations in the state.

States expect their demonstrations to reduce potentially preventable emergency room use and hospital admissions through a variety of measures. For example, Arkansas, Iowa, Michigan, and New Hampshire plan to assess whether improved access to primary care services for expansion adults results in lower rates of non-urgent use of the emergency room and fewer potentially avoidable hospital admissions. Michigan also expects that beneficiaries who participate in its healthy behavior incentive program (described below) will have fewer emergency room visits and hospital admissions. Indiana hypothesizes that non-urgent emergency room visits will be reduced through its use of graduated copayments, prior authorization, and expanded access to urgent care. Iowa will assess whether copayments for non-emergency use of the emergency room (at state plan amounts) decrease inappropriate emergency room use without imposing barriers to access to care.

States that have waived non-emergency medical transportation (NEMT) and those that are delivering these services as a wrap-around benefit plan to measure access to transportation services. States that have waivers of NEMT (Iowa and Indiana) will measure barriers to care resulting from lack of transportation, but hypothesize that the waivers will not create access barriers. For example, Indiana will measure the effect of its NEMT waiver on missed appointments, by income level, in various geographic areas of the state, and on access to preventive care and overall health outcomes.  The state plans to assess the impact of its NEMT waiver on both providers and beneficiaries.  Arkansas and New Hampshire do not have waivers of NEMT services but plan to measure access to NEMT, which is provided as a wrap-around service in their Marketplace premium assistance programs.

Premiums

States implementing programs to collect premiums or monthly contributions and/or cost-sharing will test whether these payments are affordable and whether they create barriers to health care access. Indiana and Iowa hypothesize that monthly premiums will not present barriers to access. Indiana will examine the number of individuals who are locked-out of coverage for non-payment of premiums, and the number of beneficiaries who have employers and/or not-for-profit organizations paying all or part of their required premiums. Michigan expects that its model, in which monthly premiums and cost-sharing based on the prior six months of service use are paid into health savings accounts, will not be associated with expansion adults dropping their coverage.

Demonstrations in Indiana and Michigan will test whether policies related to out-of-pocket contributions lead to greater beneficiary engagement in their health care and more efficient use of services. Indiana expects that beneficiaries who make monthly payments into their health savings accounts will exhibit more cost-conscious health care consumption than other Medicaid beneficiaries without harm to their health. Indiana also hypothesizes that its provisions for rollover of health savings account funds and coverage of preventive care without copayments will encourage beneficiaries to make monthly account payments and actively manage their account funds. Michigan expects that cost-sharing will lead to more efficient health care utilization when comparing beneficiaries’ total health care costs over time with costs in their first year of enrollment. Michigan hypothesizes that those above poverty, who are subject to both premiums and copayments, will use services more efficiently than those below poverty, who are subject only to copayments. As described below, efficient use of care would mean less emergency room and inpatient care and more primary and preventive care.

Healthy Behavior Incentives

Iowa and Michigan will evaluate whether their healthy behavior incentive programs lead to improved health outcomes for beneficiaries. Iowa anticipates increased utilization of annual examinations, smoking cessation services, and preventive dental services between the first and second years of its demonstration. Additionally, Iowa expects that over half of its expansion adults will earn access to enhanced dental benefits by completing specified healthy behavior activities. Michigan projects improved health over time from its healthy behavior program, as reflected in health risk assessment results, use of preventive care, adherence to medications to manage chronic disease, and self-reported health status.

Iowa and Michigan also will assess beneficiaries’ understanding of healthy behavior incentive programs. For example, Iowa will track which activities beneficiaries complete and which characteristics (such as age, race, gender, geographic area, and provider engagement with the program) are predictive of completing healthy behavior activities. In addition, Iowa and Michigan will assess beneficiaries’ understanding of the purpose of the program and how it works. Michigan plans to identify the factors that facilitate beneficiary completion of healthy behaviors and those that serve as barriers. Both Iowa and Michigan also plan to examine the impact of their healthy behavior programs on providers, such as whether providers use information from beneficiary health risk assessments and whether they have changed how they communicate with or care for beneficiaries as a result of the demonstration.

Program Costs

While longstanding federal policy requires Section 1115 demonstrations to be budget-neutral to the federal government, state waiver evaluations also will measure program costs. For example, Indiana expects its demonstration to be budget-neutral for the state as well as the federal government and will compare its waiver expenditures to expenditures in other states. Iowa anticipates that the costs for its demonstration will be comparable to the predicted cost of covering expansion adults in its traditional Medicaid program. Arkansas and New Hampshire expect that their Marketplace premium assistance models will be cost-effective compared to covering expansion adults under their traditional fee-for-service Medicaid programs.10 

The Michigan and Indiana evaluations will also analyze uncompensated care costs. These states expect significant reductions in uncompensated care costs relative to pre-expansion trends. Michigan expects that hospitals with above-average baseline levels of uncompensated care costs and uninsured patients will experience greater percentage decreases in uncompensated care costs as a result of the expansion. The state also anticipates that its uncompensated care costs will decrease significantly relative to non-expansion states, and that its uncompensated care costs will not significantly differ from those other expansion states. Indiana will measure how its waiver of retroactive coverage impacts uncompensated care costs.

Key Evaluation and Research Challenges

While it is important to understand states’ experience with implementing current expansion waivers to help inform future program directions, some key challenges that will hamper the ability to conduct meaningful evaluation of the Medicaid expansion waivers.11 

Data Limitations

Robust evaluations depend on access to reliable and timely data, which may not be available within the timeframes for the state and federal waiver evaluations. All of the evaluations include quantitative data analysis, but there are often lags in the availability of federal survey data that is needed for the evaluations. The federal evaluation design plan also points to potential problems with the availability of administrative data from the national Medicaid data systems. States will soon transition from the Medicaid Statistical Information System (MSIS) to a revamped version known as Transformed MSIS (T-MSIS). During the transition, MSIS data may be incomplete as states shift to reporting in T-MSIS, but T-MSIS will likely need start-up time before its data are considered to be reliable. Some states plan to rely on state surveys or surveys of beneficiaries; however, state surveys can be expensive to administer and data from the surveys may not be comparable to data in other states to enable cross state comparisons.

Selection of Outcome Measures and Interpreting Data

Selecting outcome measures and interpreting evaluation findings can be extremely complicated. The selection of outcome measures to study in evaluations of Medicaid expansion waivers and the interpretation of data findings are both important challenges. Some outcome measures, such as change in the coverage status of low-income adults and change in out-of-pocket costs for health care, are more direct measures of the impact of Medicaid expansion. However, other expected downstream impacts of increased coverage, such as increases in access to care and improvements in health status, may be mediated by other individual-level or system-level factors, take a longer time to materialize or not materialize, or simply be difficult to interpret. Conflicting interpretations of early findings about access to care and health outcomes from the seminal (pre-ACA) Oregon Health Insurance experiment highlight issues associated with evaluating the impacts of Medicaid expansions, related to study design, methodological choices, timing, and other matters.12 ,13 ,14 

Generalizability

Small sample sizes and unique state circumstances make it difficult to generalize findings from state evaluations to broader populations. One of the goals of Section 1115 waivers is for states to identify new approaches that may be effective elsewhere. However, evaluation results may not be generalizable because some state evaluations call for comparisons of Medicaid expansion adults to other populations in the state. Each state has a unique set of factors from the Medicaid delivery system to broader health care market factors. So, even evaluations that show robust results for a specific state may not be generalizable to other states due to these specific state circumstances.

Administration

The waivers’ administrative complexity makes it difficult to interpret evaluation findings.  For example, in states that assess a premium, there are often options to mitigate the effect of the premium for beneficiaries.  In Indiana a third party may contribute to the premiums payments which may may make it hard to determine the effect of premiums on low-income individuals.  Many aspects of the expansion waivers are extremely complicated for states to administer, and in some cases, states have delayed implementation of certain provisions. This administrative complexity could cause provisions to be implemented in ways that differ from what was originally intended. For example, Indiana’s implementation of the lock-out provision for non-payment of premiums was delayed; Arkansas received approval to implement monthly contributions for individuals down to 50% FPL but, due to administrative costs has only implemented the policy for those above poverty, to date. Sometimes, these changes are course corrections where a state is able to assess available data and information to assist in the implementation process.

Most states are not specifically considering administrative costs as part of their waiver evaluations, despite the programs’ complexity. Only New Hampshire specifically plans to look at the administrative costs of its waiver.  It anticipates that using Marketplace premium assistance may result in lower administrative costs.  Other states are not planning to assess the impact of their waivers on state administrative costs even though their waivers often introduce complicated program elements, such as premiums, cost-sharing, and healthy behaviors, that require ongoing tracking by the state.

Dynamic Environment

It is challenging to isolate the effects of policy changes related to the expansion waivers from the effects of policy and other changes unrelated to the waivers. State Medicaid expansion demonstrations do not operate in a vacuum. Along with the expansion, broader coverage expansions, enrollment and application streamlining, and insurance market reforms are also being implemented as part of the ACA. In addition, states are simultaneously implementing a variety of other reforms, including multi-payer delivery system reforms through State Innovation Model grants, Medicaid managed care initiatives, and Accountable Care Organizations – any or all of which could affect access to care, health outcomes, and costs. In such a dynamic environment, isolating the impacts of an expansion waiver can be difficult. With multiple large-scale policy changes underway all at once, it will be hard, in both the state-level and federal cross-cutting evaluations, to attribute observed changes to particular waiver-related interventions or reforms.

States have also amended original waivers adding complexity to the evaluation process. Upon waiver approval, states usually have a set period of time to develop implementation protocols and an evaluation plan. The evaluation plans are based on the terms of the waiver as originally approved. However, since waivers were first approved, various aspects have been amended. For example, in response to legislative requirements, Arkansas added monthly contributions to its waiver and has indicated that it will seek additional amendments that could further change the program.15  Iowa’s initial plan included a Marketplace premium assistance waiver (for expansion adults above poverty); however, the Marketplace premium assistance program no longer is being implemented due to the loss of participating QHPs.

Looking Ahead

As additional states seek waivers to expand Medicaid or amend existing expansion waivers, it will be important to understand states’ experience with implementing current expansion waivers. A combination of federal and state waiver evaluations can capture cross-state assessment as well as in-depth state specific analysis to reveal which initiatives have been effective, which have proven too complicated, and which may add barriers to needed care for beneficiaries.  The combination of state and federal waivers (in addition to other independent research) can also help to guard against bias from a singular perspective (state or federal) given that the evaluations are taking place in an environment with a lot of scrutiny, consequences for beneficiaries, and often political stakes.  To learn from the expansion waivers, it will be important for the evaluations to be conducted and disseminated in a timely manner. Final results from the federal waiver evaluation will not be available until 2019, although interim reports will be available. However, states have already or will soon be required to release some waiver evaluation results. For example, Iowa already submitted data to CMS about the effects of its NEMT waiver, and Indiana is expected to release data from its NEMT waiver evaluation soon.16  Michigan has published analyses about reductions in uncompensated care after the expansion.17  Studies in Arkansas report on the early impact of its Marketplace premium assistance model on coverage, access to care, utilization, and other areas.18 ,19 ,20 

For waiver evaluation results to be meaningful, it is also important for data and results to be accessible to policy makers, researchers, and the public in a timely manner. States are required to submit data to CMS quarterly, but much of this data is not public. Monitoring of waiver evaluations by stakeholders can help ensure that waiver implementation is on track and help policy makers to know if corrections are needed during the course of implementation. Keeping track of waiver evaluation results and understanding the issues and challenges that states and researchers faced in conducting these evaluations will help inform future efforts make changes to the Medicaid program.

Appendices

Appendix 1: Federal Waiver Evaluation Design

Federal Section 1115 Waiver Evaluation Plan
DomainResearch Questions
Medicaid-supported Enrollment in Qualified Health Plans (QHPs)How do states supporting QHP enrollment for newly eligible beneficiaries compare to Medicaid expansion states in terms of access and health outcomes?Are beneficiaries enrolled in QHPs able to access care at similar or better rates, compared to beneficiaries enrolled in Medicaid?
Does provider participation improve under premium assistance?
What is the unmet need for medical care?
Is there continuity of coverage between Medicaid and Marketplace coverage?
How do states supporting QHP enrollment compare to Medicaid expansion states in terms of total spending, especially given premium variability over time with QHPs?How do premium assistance states compare to Medicaid expansion states in terms of per beneficiary spending on direct medical services and capitation payments?
How do premium assistance states compare in terms of states’ administrative costs?
How do states supporting QHP enrollment compare to Medicaid expansion states in terms of take-up rates?Does the take-up rate among likely eligible individuals suggest that premium assistance (i.e., enrollment in QHPs) is more attractive to beneficiaries than traditional Medicaid?
Are there patterns in the timing of Medicaid beneficiary enrollment that may be related to the Marketplace open enrollment period, even though Medicaid beneficiaries are not subject to open enrollment periods?
Beneficiary Engagement/Premium Incentive Structures and Other Financial ContributionsTo what extent do requirements for premiums act as a disincentive to enrollment?How does requirement to make premium payments to complete enrollment, as compared to following an initial period of enrollment, affect take-up of coverage?
How do the premium amounts affect take-up of coverage?
What effects do premiums appear to have on continuity of coverage?Do incentive programs that require premiums affect continuity of coverage?
What is the effect of premium enforceability rules, such as required time lapses (or “lock-out” periods) before reenrollment?
Beneficiary Engagement/Premium Incentive StructuresWhat strategies are states using to educate beneficiaries about preferred healthy behaviors?What strategies are states using to explain incentives and disincentives? Which are perceived to be effective?
Conditional on qualitative information suggesting successful education strategies, or on survey or focus group data from state evaluations that explores beneficiary understanding, what is the effect of mode, content, and/or timing of education?
To what extent can program incentives encourage Medicaid enrollees to actively participate in their care without impairing access to needed care?To what extent can program incentives encourage Medicaid enrollees to actively participate in their care?
Do program incentives impair access to needed care?
Do incentives for wellness behaviors work?Which behavior incentives yield the greatest relative gains in preventive care?
Which behavior incentives yield the greatest relative gains in management and care of chronic conditions?
Which behavior incentives yield the greatest reductions in dis-incentivized care (i.e., non-emergent ED visits)?
What are the administrative costs to states and managed care companies of implementing incentive programs?What administrative costs do states with healthy behavior incentive programs incur to establish and maintain these programs? To what extent are costs borne by the state versus contracted health plans?
Link to Evaluation Designhttps://www.medicaid.gov/medicaid-chip-program-information/by-topics/waivers/1115/downloads/evaluation-design.pdf (Tables III.4, III.5, and III.6)

Appendix 2: State Waiver Evaluation Design Plans

Arkansas
#GoalsHypotheses*
1HCIP beneficiaries will have equal or better access to health care compared with what they would have otherwise had in the Medicaid fee-for-service system over time.Premium Assistance beneficiaries will have equal or better access to care, including primary care and specialty physician networks and services.
Premium Assistance beneficiaries will have lower non emergent use of emergency room services.
Premium Assistance beneficiaries will have lower rates of potentially preventable emergency department and hospital admissions.
Premium Assistance beneficiaries who are young adults eligible for EPSDT benefits will have at least as satisfactory and appropriate access to these benefits.
Premium Assistance beneficiaries will have appropriate access to non-emergency transportation.
2HCIP beneficiaries will have equal or better care and outcomes compared with what they would have otherwise had in the Medicaid fee-for-service system over time.Premium Assistance beneficiaries will have equal or better access to preventive care services.
Premium Assistance beneficiaries will report equal or better experience in the care provided.
Premium Assistance beneficiaries will have lower non-emergent use of emergency room services.
Premium Assistance beneficiaries will have lower rates of potentially preventable emergency department and hospital admissions.
3HCIP beneficiaries will have better continuity of care compared with what they would have otherwise had in the Medicaid fee-for-service system over time.Premium Assistance beneficiaries will have fewer gaps in insurance coverage.
Premium Assistance beneficiaries will maintain continuous access to the same health plans, and will maintain continuous access to providers.
Maintenance of continuous access to the same providers.
4Services provided to HCIP beneficiaries will prove to be cost effective.Premium Assistance beneficiaries, including those who become eligible for Exchange Marketplace coverage, will have fewer gaps in plan enrollment, improved continuity of care, and resultant lower administrative costs
Premium Assistance will reduce overall premium costs in the Exchange Marketplace and will increase quality of care.
The cost for covering Premium Assistance beneficiaries will be comparable to what the costs would have been for covering the same expansion group in Arkansas Medicaid fee-for-service in accordance with STC 68 on determining cost effectiveness and other requirements in the evaluation design as approved by CMS.
Link to Evaluation Designhttps://www.medicaid.gov/Medicaid-CHIP-Program-Information/By-Topics/Waivers/1115/downloads/ar/Health-Care-Independence-Program-Private-Option/ar-private-option-demo-waiver-proposed-eval-02202014.pdf
* Research questions of interest identified in the development and approval process for the HCIP waiver include those examining the goals of improving access, improving care and outcomes, reducing churning, and lowering costs. The final waiver design collapses some of these hypotheses and identifies measures to assess the four main goals.
Indiana
#GoalsHypotheses
1Reduce the number of uninsured low income Indiana residents and increase access to health care services.HIP will reduce the number of uninsured Indiana residents with income under 138% FPL over the course of the demonstration.
HIP will increase access to quality health care services among the target population.
POWER account contributions for individuals in the HIP Plus plan are affordable and do not create a barrier to health care access.
  • Few individuals will experience the lockout period because the policy will deter nonpayment of POWER account contributions policy for HIP Plus beneficiaries.
Presumptive eligibility and fast-track prepayments will provide the necessary coverage so as not to have gaps in health care coverage.
Waiver of non-emergency transportation to the non-pregnant and non-medically frail population does not pose a barrier to accessing care.
2Promote value-based decision making and personal health responsibility.HIP policies will encourage member compliance with required contributions and provide incentives to actively manage POWER account funds, including:
  • HIP policies surrounding rollover and preventive care will encourage beneficiaries’ compliance with required contributions and provide incentives to actively manage POWER account funds.
HIP Plus members will exhibit more cost-conscious healthcare consumption behavior than: a) HIP Basic members; and b) traditional Hoosier Healthwise members in the areas of primary, specialty, and pharmacy service utilization without harming beneficiary health.
HIP’s (i) graduated copayments required for non-emergency use of the emergency department (ED), (ii) ED prior authorization process, and (iii) efforts to expand access to other urgent care settings will together effectively deter inappropriate ED utilization without harming beneficiary health.
  • The graduated copayment structure for non-emergency use of the emergency department will decrease inappropriate ED utilization without harming beneficiary health.
  • The prior authorization process for hospital emergency department use and efforts to expand access to other urgent care settings will decrease inappropriate ED utilization without harming beneficiary health.
3Promote disease prevention and health promotion to achieve better health outcomes.HIP will effectively promote member use of preventive, primary, and chronic disease management care to achieve improved health outcomes.
4Promote private market coverage and family coverage options to reduce network and provider fragmentation within families.HIP’s defined contribution premium assistance program (HIP Link) will increase the proportion of Indiana residents under 138% FPL covered by employer-sponsored insurance (ESI).
HIP’s ESI premium assistance option for family coverage will increase the number of low income families in which the parents and children have access to the same provider network.
5Provide HIP members with opportunities to seek job training and stable employment to reduce dependence on public assistance.Referrals to Department of Workforce Development (DWD) employment resources at the time of application will increase member employment rates over the course of the demonstration.
6Assure state fiscal responsibility and efficient management of the program.HIP will remain budget-neutral for both the federal and state governments.
Link to Evaluation Designhttps://www.medicaid.gov/Medicaid-CHIP-Program-Information/By-Topics/Waivers/1115/downloads/in/Healthy-Indiana-Plan-2/in-healthy-indiana-plan-support-20-draft-eval-design-10292015.pdf
Iowa – Wellness Plan
#GoalsHypotheses
1What are the effects of the Wellness Plan on member access to care?Wellness Plan members will have equal or greater access to primary care and specialty services.
Wellness Plan members will have equal or greater access to preventive care services.
Wellness Plan members will have equal or greater access to mental and behavioral health services.
Wellness Plan members will have equal or greater access to care, resulting in equal or lower use of emergency department services for non-emergent care.
Wellness Plan members without a non-emergency transportation benefit will have equal or lower barriers to care resulting from lack of transportation.
Wellness Plan members ages 19-20 years will have equal or greater access to EPSDT services.
2What are the effects of the Wellness plan on member insurance coverage gaps and insurance service when their eligibility status changes (churning)?Wellness Plan members will experience equal or less churning.
Wellness Plan members will maintain continuous access to a regular source of care when their eligibility status changes.
3What are the effects of the Wellness Plan on member quality of care?Wellness Plan members will have equal or better quality of care.
Wellness Plan members will have equal or lower rates of hospital admissions.
Wellness Plan members will report equal or greater satisfaction with the care provided.
4What are the effects of the Wellness Plan on the costs of providing care?The cost for covering Wellness Plan members will be comparable to the predicted costs for covering the same expansion group in the Medicaid State Plan.
5What are the effects of the premium incentive and copayment disincentive programs on Wellness Plan enrollees?The premium incentive for the Wellness Plan enrollees will not impact the ability to receive health care.
The copayment for inappropriate emergency department (ED) use for the Wellness Plan enrollees will not pose an access to care barrier.
In year two and beyond, the utilization of an annual exam will be higher than in the first year of the program.
In year two and beyond, the utilization of smoking cessation services will be higher than in the first year of the program.
6What is the adequacy of the provider network for Wellness Plan enrollees as compared to those in the Iowa Medicaid State Plan?Iowa Wellness Plan members will have the same access to an adequate provider network as members in the Medicaid State Plan.
Link to Evaluation Designhttp://dhs.iowa.gov/sites/default/files/WellnessPlanEvaluationDesignApproval.pdf
Iowa – Healthy Behaviors Plan
#GoalsHypotheses
1Which activities do members complete?The proportion of Wellness Plan (WP) and Marketplace Choice(MPC) members who complete a wellness exam is greater than the proportion of Medicaid State Plan (MSP) or IowaCare members.
The proportion of WP/MPC members who complete a Health Risk Assessment is greater than 50%.
The proportion of WP/MPC members who are eligible to participate and complete at least one behavior incentive is greater than 50%.
Members (WP/MPC) are most likely to complete the behaviors that require the least amount of effort.
Members (WP/MPC) will be least likely to complete incentivized behaviors requiring sustained enrollee participation.
Members (WP/MPC) will be most likely to complete incentivized behaviors with the largest real or perceived value.
2What personal characteristics are predictive of completing at least one behavior incentive, and the number (or extent) of behavior incentives completed?Members (WP/MPC) who have heard of the program from their health care provider are more likely to complete at least 1 behavior.
Members (WP/MPC) who are young, white, female, and/or live in metro areas are more likely to complete at least 1 behavior.
Members (WP/MPC) with poorer health status are less likely to complete the behaviors when compared to members with better health status.
Members who do not pay a contribution (WP members less than 50% FPL) are less likely to complete behaviors compared to those who pay a contribution.
Members (WP/MPC) receiving care at federally qualified health centers, rural health clinics, and public hospitals will be more likely to participate in the incentive programs than members receiving care in other settings.
3Is engaging in behavior incentives associated with health outcomes?The program will improve WP/MPC members’ access to health care.
Health outcomes of WP/MPC members will be positively impacted by completing the healthy behaviors.
4What are the effects of the program on health care providers?Providers use the information from the Health Risk Assessment.
Providers are encouraging patients to participate in the behavior incentive program.
Providers are receiving their additional reimbursement.
Providers are more likely to use the HRA with Wellness Plan members compared to Marketplace Choice Plan members
The HRA changes communication between the provider and patient.
The HRA changes provider treatment plans.
There are barriers to providers using the HRA information.
5What are the effects of HBI on Medicaid costs?The costs of the program do not exceed the savings.
6What are the implications of disenrollment?Disenrolled members do not understand the disenrollment process.
Disenrolled members do not understand premiums.
Disenrolled members do not understand the HBI program.
Disenrolled members find it difficult to meet their health needs.
Disenrolled members are unable to re-enroll due to administration issues.
7What are members’ knowledge and perceptions of the HBI program?Members (WP/MPC) will value incentives offered to complete healthy behaviors.
Members (WP/MPC) will be most willing to complete behaviors that have lower costs/barriers compared to those with higher benefits and relevance.
Members (WP/MPC) with a greater sense of locus of control will be more willing to participate.
Members (WP/MPC) understand the logistics (for example – payment, payment options, requirements of the program, …) of the HBI program.
Members (WP/MPC) understand the purpose of HBI and how it is supposed to influence their behavior.
Members (WP/MPC) do not report difficulties paying premiums related to payment form accepted by IME.
8What are the experiences of ACOs related to the Health Behavior Incentives Program?ACOs experience barriers to reaching targets for wellness exams and HRA.
ACOs promote the HBI program.
ACOS experience advantages and successes from the HBI program.
Link to Evaluation Designhttp://dhs.iowa.gov/sites/default/files/HealthyBehaviorsEvalDesignApproval_042015.pdf
Iowa – Dental Wellness Plan
#GoalsHypotheses
1What are the effects of DWP on member access to care?DWP members will have equal or greater access to dental care.
DWP members will be more likely to receive preventive dental care.
DWP members will have equal or greater access to care, resulting in equal or lower use of emergency department services for non-traumatic dental care.
DWP members will have equal or greater access to dental EPSDT services.
High risk populations in the Dental Wellness Plan will be more likely to receive preventive dental care.
2What are the effects of the DWP on member quality of care?DWP members will have equal or better quality of care.
DWP members will report equal or greater satisfaction with the care provided.
DWP members will be equally or more likely to return for a second recall exam within 6-12 months.
3What are the effects of the DWP on costs of dental care as compared to traditional Medicaid adult dental coverage?The cost for providing dental care to DWP members will be comparable to the

predicted costs for providing dental care to DWP members had they been enrolled in

Medicaid State Plan.

4What are the effects of the earned benefit structure on DWP members?The earned benefit structure for DWP members will increase regular use of recall dental exams.
Over 50% of DWP members will earn access to Enhanced Benefits.
Over 50% of DWP members will earn access to Enhanced Plus Benefits.
In year two and beyond, the regular use of dental recall exams will be higher than in the first year of the program.
The earned benefit structure will not be seen as a barrier to care perceived as needed by DWP members.
5What is the adequacy of the provider network for DWP members?DWP members will have better access to an adequate provider network than those in the Medicaid State Plan as reflected by travel distance and time, access to safety net providers, and provider acceptance of new patients.
6What are provider attitudes towards the DWP?The earned benefit structure will not be perceived by DWP providers as a barrier to providing care.
Over 50% of DWP providers will remain in the plan for at least 3 years.
7What are the effects of DWP member outreach and referral services?DWP member outreach services will address dentists’ concerns about missed appointments.
DWP member referral services will improve access to specialty care compared to members in the State Medicaid Plan.
DWP member outreach will improve members’ compliance with follow-up visits, including recall exams.
 Link to Evaluation Designhttp://dhs.iowa.gov/sites/default/files/DentalWellnessPlanEvaluationDesign_Sept2014.pdf
Michigan
#GoalsHypotheses
1Uncompensated Care Analysis:

Uncompensated care in Michigan will decrease significantly.

Uncompensated care in Michigan will decrease significantly relative to the existing trend in Michigan.
Uncompensated care will decrease more by percentage for Michigan hospitals with baseline levels of uncompensated care that are above the average for the state than for hospitals with levels that are below the average for the state.
Uncompensated care will decrease more by percentage for Michigan hospitals in areas with above average baseline rates of uninsurance in the state than for hospitals with below state average levels
Uncompensated care in Michigan will decrease significantly relative to states that did not expand their Medicaid programs.
Trends in uncompensated care in Michigan will not differ significantly relative to other states that did expand their Medicaid programs.
2Reduction in the Number of Uninsured:

The uninsured population in Michigan will decrease significantly.

The uninsured population in Michigan will decrease significantly relative to the existing trend within Michigan.
The uninsured population in Michigan will decrease more by percentage for subgroups with higher than average baseline rates of uninsurance in the state than for subgroups with lower than state average baseline rates.
The uninsured population in Michigan will decrease significantly relative to states that did not expand their Medicaid programs.
The uninsured population in Michigan will decrease to a similar degree relative to states that did expand their Medicaid programs.
Reduction in the Number of Uninsured:

Medicaid coverage in Michigan will increase significantly.

The Medicaid population in Michigan will increase significantly relative to the existing trend in Michigan.
The Medicaid population in Michigan will increase significantly more by percentage for subgroups with rates of uninsurance higher than state average baseline than for subgroups with baseline rate lower than the state average.
The Medicaid population in Michigan will increase significantly relative to states that did not expand their Medicaid programs.
The Medicaid population in Michigan will increase to a similar degree relative to states that did expand their Medicaid programs.
3Impact on Healthy Behaviors and Health Outcomes:

Emergency Department Utilization

Emergency department utilization among the Healthy Michigan beneficiaries will decrease from the Year 1 baseline.
Healthy Michigan Plan beneficiaries who make regular primary care visits (at least once per year) will have lower adjusted rates of emergency department utilization compared to beneficiaries who do not have primary care visits.
Healthy Michigan Plan beneficiaries who agree to address at least one behavior change will have lower adjusted rates of emergency department utilization compared to beneficiaries who do not agree to address behavior change.
Impact on Healthy Behaviors and Health Outcomes:

Healthy Behaviors

Receipt of preventive health services among the Healthy Michigan Plan population will increase from the Year 1 baseline.
Healthy Michigan Plan beneficiaries who make regular primary care visits (at least once per year) will have higher rates of general preventive services compared to beneficiaries who do not have primary care visits.
Healthy Michigan Plan beneficiaries who complete an annual health risk assessment will have higher rates of preventive services compared to beneficiaries who do not complete a health risk assessment.
Healthy Michigan Plan beneficiaries who agree to address at least one behavior change will demonstrate improvement in self-reported health status compared to beneficiaries who do not agree to address behavior change.
Healthy Michigan Plan beneficiaries who receive incentives for healthy behaviors will have higher rates of preventive services compared to beneficiaries who do not receive such incentives.
Impact on Healthy Behaviors and Health Outcomes:

Hospital Admissions

Adjusted hospital admission rates for Healthy Michigan Plan beneficiaries will decrease from the Year 1 baseline.
Healthy Michigan Plan beneficiaries who make regular primary care visits (at least once per year) will have lower adjusted rates of hospital admissions compared to beneficiaries who do not have primary care visits.
Healthy Michigan Plan beneficiaries who agree to address at least one behavior change will have lower adjusted rates of hospital admission compared to beneficiaries who do not agree to address behavior change.
4Participant Beneficiary Views of the Healthy Michigan PlanDescribe Healthy Michigan Plan enrollees’ consumer behaviors and health insurance literacy, including knowledge and understanding about the Healthy Michigan Plan, their health plan, benefit coverage, and cost-sharing aspects of their plan.
Describe Healthy Michigan Plan enrollees’ self-reported changes in health status, health behaviors (including medication use), and facilitators and barriers to healthy behaviors (e.g. knowledge about health and health risks, engaged participation in care), and strategies that facilitate or challenge improvements in health behaviors.
Understand enrollee decisions about when, where and how to seek care, including decisions about emergency department utilization.
Describe primary care practitioners’ experiences with Healthy Michigan Plan beneficiaries, practice approaches and innovation adopted or planned in response to the Healthy Michigan Plan, and future plans regarding care of Healthy Michigan Plan patients.
5Impact of Contribution Requirements & MI Health AccountsCost-sharing implemented through the MI Health Account framework will be associated with beneficiaries making more efficient use of health care services, as measured by total costs of care over time relative to their initial year of enrollment, and relative to trends in the Healthy Michigan Plan’s population below 100% of the Federal Poverty Level that face similar service-specific cost-sharing requirements but not additional contributions towards the cost of their care.
Cost-sharing implemented through the MI Health Account framework will be associated with beneficiaries making more effective use of health care services relative to their initial year of enrollment, as indicated by a change in the mix of services from low-value (e.g., non-urgent emergency department visits, low priority office visits) to higher-value categories (e.g., emergency-only emergency department visits, high priority office visits), and relative to trends in the Healthy Michigan Plan’s population below 100% of the Federal Poverty Level that face similar service-specific cost-sharing requirements but not additional contributions towards the cost of their care. Several questions on the Healthy Michigan Voices Survey also address this hypothesis.
Cost-sharing and contributions implemented through the MI Health Account framework will not be associated with beneficiaries dropping their coverage through the Healthy Michigan Plan.
Exemptions from cost-sharing for specified services for chronic illnesses and rewards implemented through the MI Health Account framework for completing a health risk assessment with a primary care provider and agreeing to behavior changes will be associated with beneficiaries increasing their healthy behaviors and their engagement with healthcare decision-making relative to their initial year of enrollment. Several questions on the Healthy Michigan Voices Survey also address this hypothesis.
This increase in healthy behaviors and engagement will be associated with an improvement in enrollees’ health status over time, as measured by changes in elements of their health risk assessments and changes in receipt of recommended preventive care (e.g., flu shots, cancer screening) and adherence to prescribed medications for chronic disease (e.g., asthma controller medications).
Link to Evaluation Designhttp://www.michigan.gov/documents/mdhhs/Healthy_Michigan_Plan_2nd_Waiver_STCs_12_17_15_508663_7.pdf (Attachment B)
New Hampshire
#GoalsHypotheses
1Continuity of coverage:

For individuals whose incomes fluctuate, the Demonstration will permit continuity of health plans and provider networks.

Premium assistance beneficiaries will have equal or fewer gaps in insurance coverage.
Premium assistance beneficiaries will maintain continuous access to the same health plans, and will maintain continuous access to providers.
2Plan Variety:

The Demonstration could also encourage Medicaid Care Management carriers to offer QHPs in the Marketplace in order to retain Medicaid market share, and could encourage QHP carriers to seek Medicaid managed care contracts

Premium assistance beneficiaries, including those who become eligible for Exchange Marketplace coverage, will have equal or fewer gaps in plan enrollment, equal or improved continuity of care, and resultant equal or lower administrative costs.
The Demonstration could lead to an increase in plan variety by encouraging Medicaid Care Management carriers to offer QHPs in the Marketplace in order to retain Medicaid market share, and encouraging QHP carriers to seek Medicaid managed care contracts
3Cost-effective Coverage:

The premium assistance approach will increase QHP enrollment and may result in greater economies of scale and competition among QHPs.

Premium assistance beneficiaries will have equal or lower non-emergent use of emergency room services.
Premium assistance beneficiaries will have equal or lower rates of potentially preventable emergency department and hospital admissions.
The cost for covering premium assistance beneficiaries will be comparable to what the costs would have been for covering the same expansion group in New Hampshire Medicaid in accordance with STC #69 on determining cost-effectiveness and other requirements in the evaluation design as approved by CMS.
4Uniform Provider Access:

The State will evaluate access to primary, specialty, and behavioral health care services for beneficiaries in the Demonstration to determine if it is comparable to the access afforded to the general population in New Hampshire

Premium assistance beneficiaries will have equal or better access to care, including primary care and specialty physician networks and services.
Premium assistance beneficiaries will have equal or better access to preventive care services.
Premium assistance beneficiaries will report equal or better satisfaction in the care provided.
Premium assistance beneficiaries who are young adults eligible for EPSDT benefits will have at least as satisfactory and appropriate access to these benefits.
Premium assistance beneficiaries will have appropriate access to non-emergency transportation.
Link to Evaluationhttps://www.medicaid.gov/Medicaid-CHIP-Program-Information/By-Topics/Waivers/1115/downloads/nh/health-protection-program/nh-health-protection-program-premium-assistance-draft-eval-design-03042015.pdf

Endnotes

  1. The 32 states include DC. Kaiser Family Foundation, Status of State Action on the Medicaid Expansion Decision (Jan. 12, 2016), https://modern.kff.org/health-reform/state-indicator/state-activity-around-expanding-medicaid-under-the-affordable-care-act/.   ↩︎
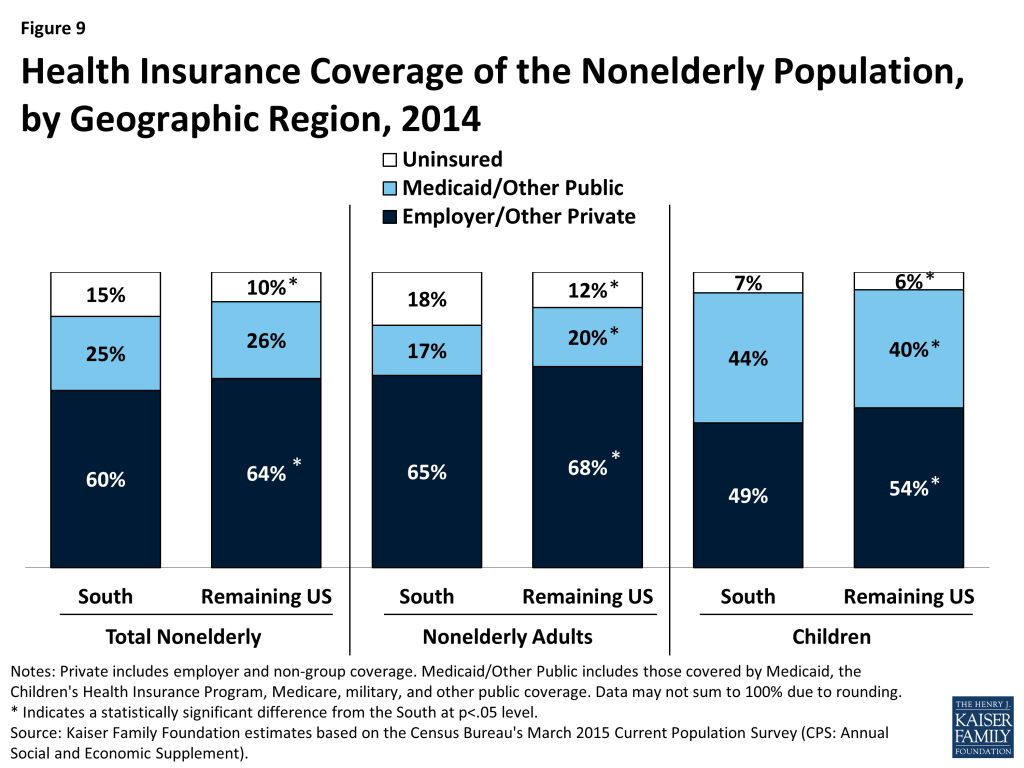
  2. In January 2016, New Hampshire transitioned from a state plan amendment to a waiver, and expansion coverage in Montana became effective. Pennsylvania initially obtained a waiver to implement the expansion but subsequently transitioned to a traditional expansion under a state plan amendment. Detailed summaries of the expansion waivers are available at https://modern.kff.org/tag/waivers/. ↩︎
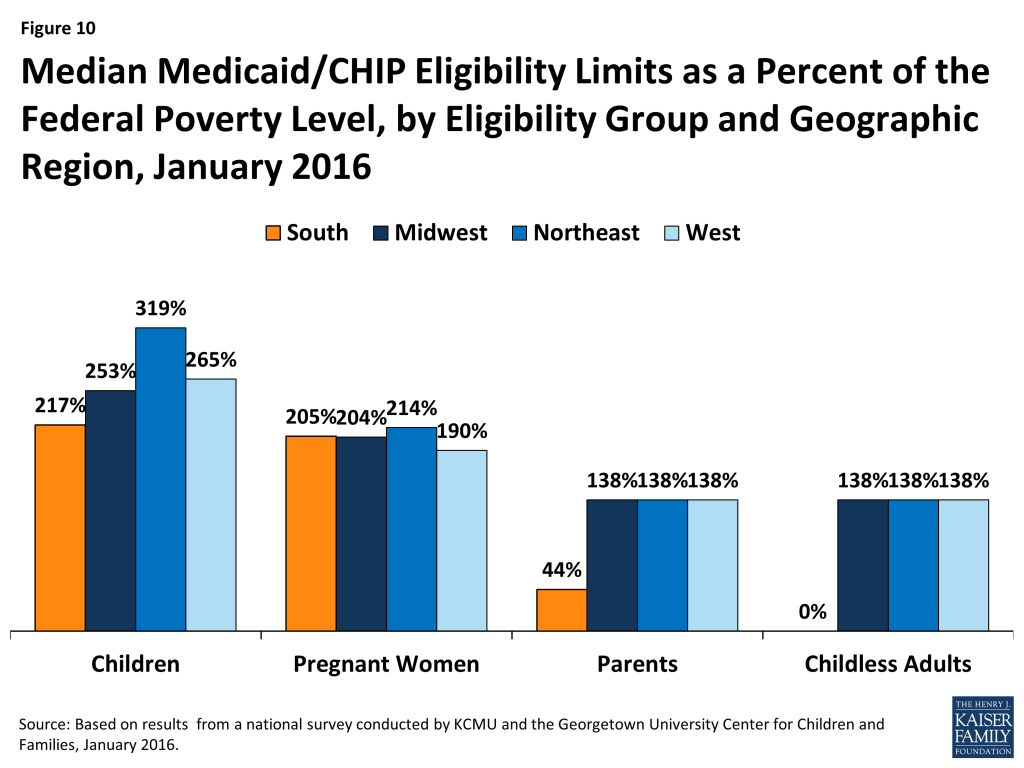
  3. Kaiser Family Foundation, A Guide to the Supreme Court’s Decision on the ACA’s Medicaid Expansion (Aug. 2012), https://modern.kff.org/health-reform/issue-brief/a-guide-to-the-supreme-courts-decision/. ↩︎
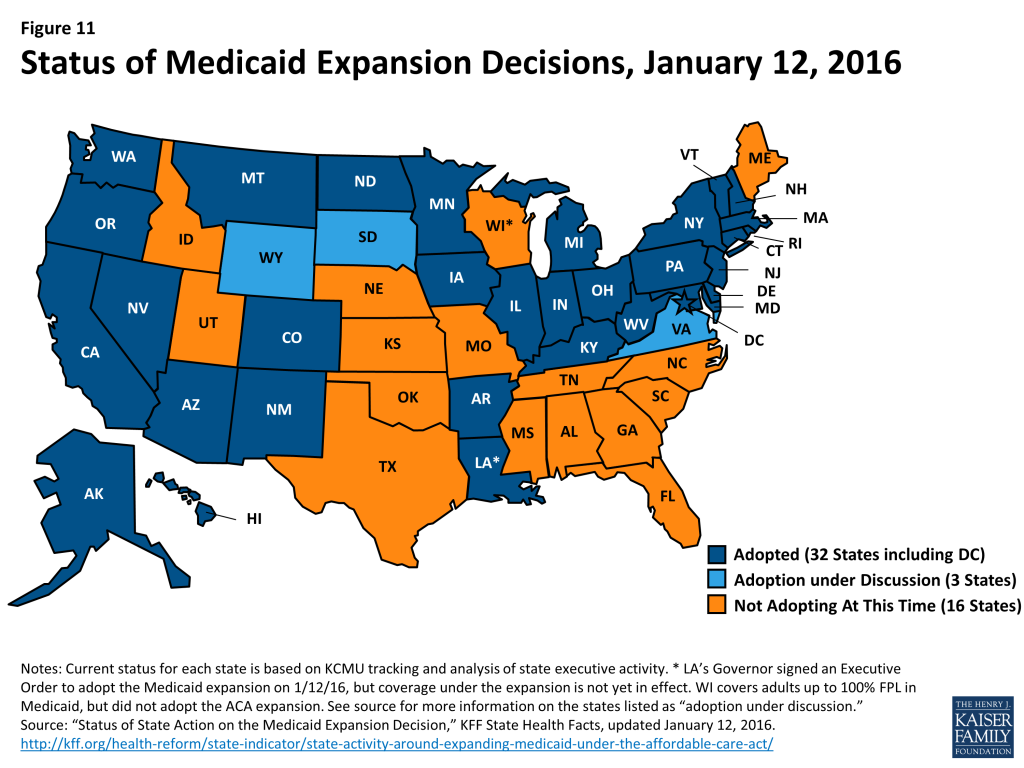
  4. Robin Rudowitz and MaryBeth Musumeci, The ACA and Medicaid Expansion Waivers (Washington, D.C.: Kaiser Family Foundation, November 2015), https://modern.kff.org/medicaid/issue-brief/the-aca-and-medicaid-expansion-waivers/. ↩︎
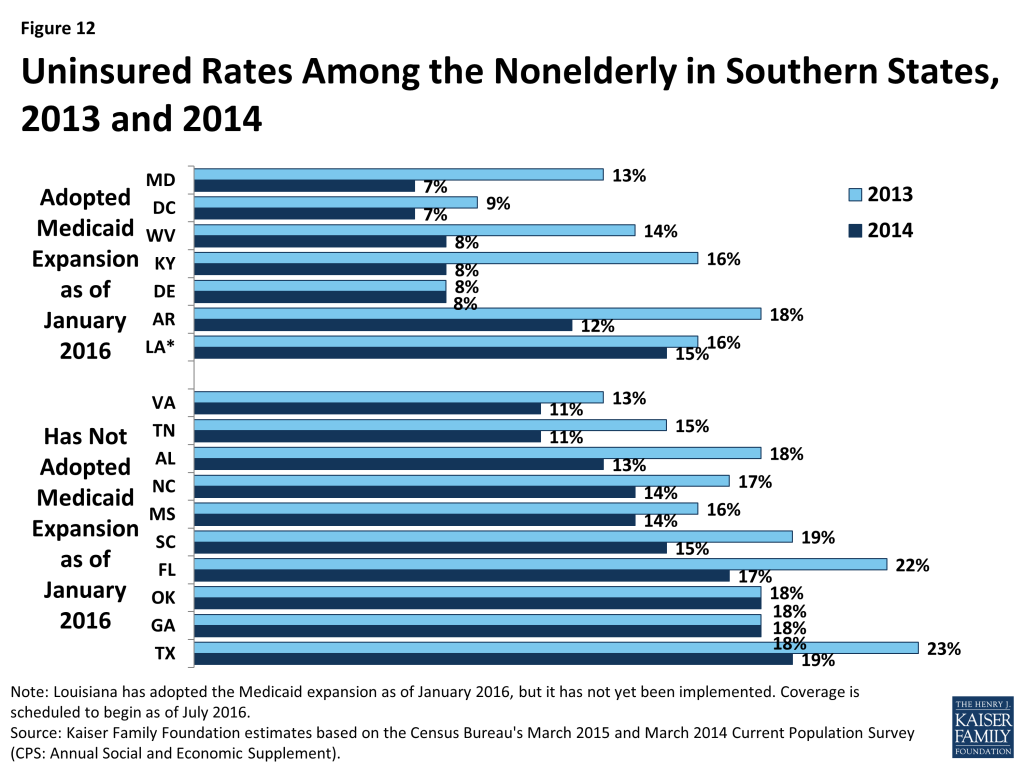
  5. The federal waiver evaluation contract was awarded to Mathematica Policy Research and its partners, Truven Health Analytics and the Center for Health Care Strategies. ↩︎
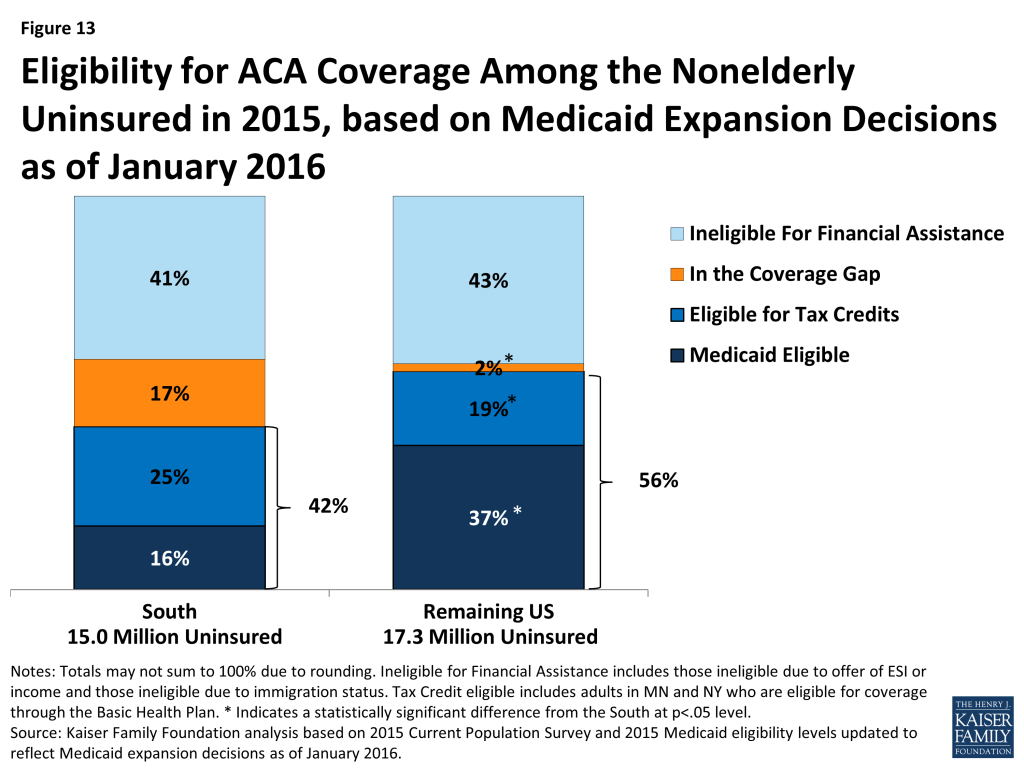
  6. Mathematica released the waiver evaluation design plan in May, 2015. ↩︎
  7. Wisconsin is included in the federal evaluation but this brief does not include an analysis of the state evaluation plan because the state has not adopted the Medicaid expansion. ↩︎
  8. In addition, CMS contracted with the Urban Institute to conduct a federal evaluation of HIP 2.0 in addition to the state evaluation that will be conducted by the Lewin Group. Governor Pence wrote a letter to Secretary Burwell expressing concerns about need for the second evaluation and the objectivity of the selected contractors. No information has been released about the design plan for the federal evaluation of HIP 2.0. The Governor’s letter from December 3, 2015 can be found here:  http://media.mcguirewoods.com/mwc/Mike-Pence-Letter-Dec-3-2015.pdf ↩︎
  9. Originally, Iowa’s waiver required expansion adults from 100-138% FPL to enroll in a Marketplace QHP with Medicaid premium assistance. As of October, 2014, Marketplace enrollment was voluntary for this group after one of the two QHPs serving Medicaid beneficiaries left the Marketplace. Subsequently, the other QHP decided that it would no longer accept new Medicaid enrollees, and Iowa submitted a waiver amendment request to CMS seeking to require all expansion adults to enroll in capitated Medicaid MCOs as of January, 2016. ↩︎
  10. Both states have waiver authority to use state-developed tests to measure the cost-effectiveness of their premium assistance programs that differ from those otherwise permissible under federal law. ↩︎
  11. Many of these challenges were highlighted in the Federal Evaluation Design Plan. https://www.medicaid.gov/medicaid-chip-program-information/by-topics/waivers/1115/downloads/evaluation-design.pdf ↩︎
  12. The Oregon Health Insurance Experiment, The National Bureau of Economic Research, http://www.nber.org/oregon/ ↩︎
  13. Kronick and Bindman, NEJM 368;18, May 2, 2013 ↩︎
  14. Harold Pollack, Oregon Medicaid experiment “is a Rorschach test of people’s views of the ACA” (The Incidental Economist, May 2013), http://theincidentaleconomist.com/wordpress/oregon-medicaid-experiment-is-a-rorschach-test-of-peoples-views-of-the-aca/ ↩︎
  15. Letter from Governor Asa Hutchinson to Secretary Burwell (Dec. 29, 2015), http://posting.arktimes.com/media/pdf/asaletter.pdf. ↩︎
  16. Peter Damiano, Suzanne Bentler, Mark Pooley, Susan McKernan, Elizabeth and Momany, Non-Emergency Transportation Services for IHAWP Members: The early experiences of Iowa Health and Wellness Plan members (Iowa City, Iowa: University of Iowa Public Policy Center, March 2015), http://dhs.iowa.gov/sites/default/files/NEMT_Brief_IHAWP_Early_Experiences_042015.pdf ↩︎
  17. Sayeh Nikpay, Thomas Buchmueller, and Helen Levy, “Affordable Care Act Medicaid Expansion Reduced Uninsured Hospital Stays in 2014,” Health Affairs  35, no.1 (2016):106-110, http://content.healthaffairs.org/content/35/1/106.full.html ↩︎
  18. The Stephens Group, Status Report #2 on Health Care Reform/Medicaid Consulting Services for the Arkansas Health Reform Task Force (Manchester, New Hampshire: The Stephen Group, July 2015), http://ee-governor-2015.ark.org/images/uploads/TSG-1_June_report-No.2-corrected_7-16_version.pdf. ↩︎
  19. Jocelyn Guyer, Naomi Shine, MaryBeth Musumeci, and Robin Rudowitz, A Look at the Private Option in Arkansas (Washington, D.C.: Kaiser Family Foundation, August 2015), https://modern.kff.org/medicaid/issue-brief/a-look-at-the-private-option-in-arkansas/ ↩︎
  20. Benjamin Sommers, Robert Blendon, and E. John Orav, “Both The “Private Option” And Traditional Medicaid Expansions Improved Access to Care For Low-Income Adults,” Health Affairs, 35, no.1 (2016):96-105, http://content.healthaffairs.org/content/35/1/96.full.html ↩︎
News Release

Public Split On What to Do About the Health Care System, Though More Support Building on ACA Than Repealing It, Replacing with a GOP Alternative, or Creating a Single Payer Plan

Published: Feb 25, 2016

Following Flint Water Crisis, Nearly Half Worry about Their Community’s Water Supply

Almost Half of Public is Concerned about a Widespread Zika Outbreak in U.S. This Year

The latest Kaiser Health Tracking Poll finds the public as divided as the remaining presidential candidates over their vision for the future of the nation’s health care system.

When asked to choose among four broad approaches for changing the health care system currently being discussed, the largest share (36%) say lawmakers should build on the Affordable Care Act to improve affordability and access to care, while fewer choose establishing guaranteed coverage through a single government plan (24%), repealing the ACA and not replacing it (16%), or repealing the law and replacing it with a Republican alternative (13%).

Among Democrats, a majority (54%) supports building on the existing law, as advocated by former Secretary of State Hillary Clinton, while about a third (33%) favor a single government plan, as advocated by Vermont Sen. Bernie Sanders.  Among Republicans, a clear majority (60%) favor repealing the ACA, whether it’s replaced (34%) or not (26%).

Feb_2016_chart_for_release.png

The survey also finds that the words to describe such a plan clearly affect how people view it.  For instance, nearly two thirds (64%) of Americans say they have a positive reaction to the term “Medicare-for-all,” and most (57%) say the same about “guaranteed universal health coverage.”  Fewer have a positive reaction to “single payer health insurance system” (44%) or “socialized medicine” (38%).  About half (53%) of Democrats say they have a very positive reaction to “Medicare-for-all” compared with 21 percent who say the same for “single payer health insurance system.”

When asked directly about “guaranteed health insurance coverage in which all Americans would get their insurance through a single government health plan,” the poll finds half (50%) in favor and 43 percent opposed. Majorities of Democrats (70%) and independents (54%) support the concept, while few Republicans (20%) do.

The poll also finds the public’s view of the ACA largely stable so far this year, with 46 percent holding an unfavorable view of the law and 41 percent holding a favorable view. The public is also almost evenly divided about whether the debate over the law should continue: 49 percent of the public says they are tired of hearing about the debate, while 46 percent say it is important for the debate to continue.  Most Republicans (58%) want the debate to continue, while most Democrats (59%) say they are tired of it.

This month’s Kaiser Health Policy News Index finds nearly two thirds of the public (64%) paying close attention to news about unsafe lead levels in the water supply in Flint, Mich., That is slightly more than say the same about the Zika virus outbreak (57%).

Nearly half (47%) are concerned about the safety of the water supply in their own community, including a quarter (27%) who are ‘very concerned.’  More than three quarters (77%) report that they are concerned about the safety of the water supply in low income communities, including 40 percent who are “very concerned.”

Regarding the Zika virus, the survey finds 43 percent of the public is worried that the U.S. will see a large number of Zika cases this year. Somewhat fewer (28%) say they are worried they or someone in their family will be affected.

A majority of the public is aware of the potential ways to spread the virus and potential effects of the virus. Three quarters (76%) report that they are aware that a person can become infected through a bite from an infected mosquito and more than half (54%) are aware that a person can become infected by having sex with someone who is infected.

The poll was designed and analyzed by public opinion researchers at the Kaiser Family Foundation and was conducted from Feb. 10 to 18, 2016 among a nationally representative random digit dial telephone sample of 1,202. Interviews were conducted in English and Spanish by landline (421) and cell phone (781). The margin of sampling error is plus or minus 3 percentage points for the full sample. For results based on subgroups, the margin of sampling error may be higher.

Poll Finding

Kaiser Health Tracking Poll: February 2016

Authors: Bianca DiJulio, Jamie Firth, Ashley Kirzinger, and Mollyann Brodie
Published: Feb 25, 2016

Findings

The February Kaiser Health Tracking Poll asked the public about broad options for changing the health system that are currently being discussed and finds more Americans (36 percent) say policymakers should build on the existing law to improve affordability and access to care than any other option presented.  Sixteen percent say they would like to see the health care law repealed and not replaced, 13 percent say it should be repealed and replaced with a Republican-sponsored alternative, and 24 percent say the U.S. should establish guaranteed universal coverage through a single government plan.

As debate continues over the idea of universal coverage through a single government plan, the survey finds the public divided, with half saying they favor the idea and 43 percent saying they oppose it, and some opinions swayed after hearing counterarguments. In addition, majorities of Democrats and independents favor the idea, compared to just 20 percent of Republicans. Most Americans think that if guaranteed universal coverage through a single government plan was put into place, uninsured and low-income people would be better off, but there is little consensus among the public about how it would impact their care personally.

This month’s poll also explores the public’s reaction to a few terms used to describe the idea of expanding health insurance coverage to all Americans. Majorities say they have a positive reaction to the terms “Medicare-for-all” and “guaranteed universal health coverage” and fewer say the same for “single payer health insurance system” and “socialized medicine.”  About half (53 percent) of Democrats say they have a very positive reaction to “Medicare-for-all” compared with 21 percent who say the same for “single payer health insurance system.”

Following the water crisis in Flint Michigan, about half (47 percent) of the public is concerned about the water supply in their community, and this share jumps to nearly eight in 10 when the public is asked about their concern over the water supply in low-income communities.

A majority of the public are aware of how the Zika virus is or is not transmitted, its presence in the U.S. and its suspected association with birth defects.

The Role of Health in the 2016 Presidential Election

With the 2016 primary election campaign in full swing, three-fourths of Americans (73 percent) report they are following news about it closely with the economy/jobs currently being the most important issue to voters in the upcoming presidential election (27 percent).  Health care ranks fourth at 8 percent, behind presidential candidates’ characteristics or positions on the issues (21 percent), and foreign policy (16 percent). Similar shares of Democratic voters (7 percent), independent voters (10 percent), and Republican voters (7 percent) say health care is a top voting issue.

Figure 1: Economy/Jobs Is Top Voter Issue Across Parties, Health Care Ranks Lower

Next Steps for the Health Care System

While health care ranks fourth as an important voting issue, presidential hopefuls have proposed a range of visions for the future of the health care system, from the full repeal of the Affordable Care Act (ACA) to the adoption of a universal government plan. The survey finds that when given four broad approaches for the future of the health care system that are currently being discussed, Americans opinions are split with the largest share reporting that they favor building on the ACA and the existing system. Overall, 36 percent say lawmakers should build on the existing law to improve affordability and access to care, 24 percent say the U.S. should establish guaranteed universal coverage through a single government plan, 16 percent say they would like to see the health care law repealed and not replaced, and 13 percent say it should be repealed and replaced with Republican-sponsored alternative.

A closer look at views across parties shows that a third of Democrats (33 percent) favor the idea of universal coverage through a single government plan but more Democrats (54 percent) say they would prefer to build on the existing health care law. A roughly similar share of independents (26 percent) say the U.S. should establish guaranteed universal coverage through a single government plan, and 36 percent say lawmakers should build on the existing health care law. The majority of Republicans (60 percent) say they would like to repeal the health care law whether it’s replaced or not, although 21 percent say they would like to build on the existing law and 9 percent say they would like universal coverage through a government plan.

Figure 2: Views of the Future of the U.S. Health Care System

Views of Guaranteed Universal Coverage from a Government Plan

Half (50 percent) of Americans say they favor the idea of having guaranteed health insurance coverage in which all Americans would get their insurance through a single government plan while 43 percent say they oppose it. Majorities of Democrats (70 percent), independents (54 percent), adults under age 30 (65 percent), and members of racial minority groups (72 percent of Black Americans, 64 percent of Hispanic Americans) report a favorable opinion. Republicans are the least likely group to express a favorable view (20 percent).

Figure 3: Views of Universal Coverage

How Malleable are Americans’ Opinions of Guaranteed Health Coverage From a Government Plan?

Although half of the public says they favor having guaranteed health insurance coverage through a single government health plan, some can be swayed by counterarguments made by critics. For instance, 20 percent overall shift their opinion from favor to oppose after hearing that guaranteed coverage through a single government plan would “require many Americans to pay more in taxes,” 20 percent say they now oppose the idea after hearing that it would “give the government too much control over health care,” and 14 percent say they now oppose it after hearing that it would “eliminate or replace the current health care law.” On the other side of the debate, those who originally said they opposed the idea were also persuaded by arguments, although fewer changed their opinions after hearing the arguments. About one in 10 changed their stance from oppose to favor after hearing that guaranteed coverage would “ensure that all Americans have health insurance as a basic right” (13 percent), that it would “reduce health insurance administrative costs” (11 percent), and that it would “eliminate all private health insurance premiums, co-pays, and deductibles paid by employers and individuals” (11 percent).

Figure 4: Some Opinions of Coverage Through a Single Government Plan Swayed By Arguments

Impact of Coverage Through Single Government Plan

Most Americans think that if guaranteed universal coverage through a single government plan was put into place, uninsured and low-income people would be better off (60 percent and 57 percent, respectively). Fewer say that middle class people (34 percent) and people like them (31 percent) would be better off, which is roughly similar to the shares who say these same groups will be worse of or not be impacted much at all. Most (63 percent) say it would not have much impact on wealthy people, just 14 percent say they would be better off and 18 percent say they would be worse off. Democrats and independents are more likely than Republicans to report that all people would be better off through a single government plan.

Figure 5: Impact of Coverage Through Single Government Plan

The country has not had a substantial public debate about single payer legislation recently and there is little consensus among the public about how enacting guaranteed universal coverage through a single government plan would impact their personal health care. Roughly four in 10 say that they think the cost, quality, availability of health care treatments, and choice of doctors and hospitals would stay about the same as it is under the current health care system. About a third say these measures would get worse if universal coverage was put into place and around two in 10 think these measures would get better. Not surprising considering their stances on the idea of guaranteed universal coverage, majorities of Republicans say each measure would likely get worse if such a plan was enacted, while at least half of Democrats say each would likely stay about the same. Additionally, those under age 50, Black and Hispanic Americans, and those with lower incomes are more likely than their counterparts to say that these measures will get better.

Figure 6: Perceived Changes to Current Health Care if Coverage Through Single Government Plan is Put in Place

Wording Matters

Politicians and pundits use a variety of terms to describe the idea of expanding health insurance coverage to all Americans and this month’s poll explores the public’s reaction to a few of these terms. Nearly two-thirds (64 percent) of Americans say they have a positive reaction to the term “Medicare-for-all” and more than half (57 percent) say they have a positive reaction to the term “guaranteed universal health coverage.” Less than half of Americans report a positive association with the phrases “single payer health insurance system” (44 percent) and “socialized medicine” (38 percent).

Figure 7: Reactions Vary Depending on What You Call It

Similar to the public at large, more Democrats report having a positive reaction to “Medicare-for-all” and “guaranteed universal health coverage” than say the same about “socialized medicine” or “single payer health insurance system.” Additionally, more Democrats have positive reactions to all of the terms than Republicans and independents do. Around half of Democrats report a very positive reaction to “Medicare-for-all” (53 percent) and “guaranteed universal health coverage” (44 percent), while fewer Republicans say the same for each (17 percent and 9 percent, respectively). Two in 10 Democrats report very positive reactions to “socialized medicine” (22 percent) and “single payer health insurance system” (21 percent), while fewer than one in 10 Republicans do.

Table 1
Please tell me if you have a positive or negativereaction to each term.DemocratsIndependentsRepublicans
Medicare-for-all
Very Positive53%32%17%
Somewhat Positive283520
Somewhat Negative111226
Very Negative41528
Guaranteed universal health coverage
Very Positive44269
Somewhat Positive323317
Somewhat Negative131323
Very Negative52247
Socialized medicine
Very Positive22154
Somewhat Positive332512
Somewhat Negative182120
Very Negative152659
Single payer health insurance system
Very Positive21176
Somewhat Positive372918
Somewhat Negative221925
Very Negative61834
NOTE: Neutral/ Neither positive or negative (Vol.) and Don’t Know/ Refused responses not shown.

Americans’ Opinions of the Affordable Care Act

Should the Debate Continue?

In the midst of the presidential campaigns and political battles over the future of the country’s health care system, half (49 percent) of Americans say they are tired of hearing about the debate over the ACA and think the country should focus more on other issues, while another 46 percent say they think it is important for the country to continue the debate. Not surprisingly, opinions on the matter differ across partisans. A majority of Republicans (58 percent) prefer to see the debate continue, while a similar share of Democrats (59 percent) say they are tired of the debate. Independents are split down the middle with 47 percent saying they are tired of the debate and 46 percent saying they want it to continue.

Figure 8: Division Over Whether Debate About Health Care Law Should Continue Or If It Is Time To Move On

So far in 2016, opinion of the health care law itself remains largely stable, with 41 percent saying they have a favorable view and 46 percent saying they have an unfavorable view. Furthermore, partisans continue to hold widely differing views; two-thirds of Democrats (66 percent) report a favorable view, while nearly eight in 10 Republicans (78 percent) report an unfavorable view, and independents fall in the middle, tilting negative, with 38 percent saying they have a favorable opinion and 49 percent saying they have an unfavorable opinion.

Figure 9: Public’s View of the Health Care Law Remains Divided

Kaiser Health Policy News Index: February 2016

The February Kaiser Health Tracking poll finds that, like last month, the most closely followed stories are the 2016 presidential campaign and news about conflicts involving ISIS and other Islamic militant groups (73 percent say they are following each ‘very’ or ‘fairly’ closely). The most closely followed health policy news story is the unsafe lead levels in Flint Michigan’s water, with 64 percent of Americans reporting they followed the story either ‘very closely’ (28 percent) or ‘fairly closely’ (35 percent). This is followed by the Zika virus outbreak with 57 percent reporting that they followed this story ‘very closely’ (20 percent) or ‘fairly closely’ (37 percent) which is roughly similar to the share of individuals who reported following the lifting of international sanctions against Iran following the release of American hostages (53 percent). Fewer Americans report closely following news on the health care open enrollment period (34 percent) or President Obama’s proposal to increase government funding for treatment and prevention of opioid addiction (30 percent).

Figure 10: Kaiser Health Policy News Index: February 2016

The Zika Virus Outbreak

Over the past month both the Obama Administration and the World Health Organization announced increased spending to combat the Zika virus outbreak. The mosquito-borne virus, which has mostly affected South and Central American countries and has been associated with birth defects in babies born to infected mothers, was declared a global health emergency by the United Nations on February 1st.1  About six in 10 Americans (57 percent) report that they closely followed news about the Zika virus outbreak with a similar share reporting that they have heard or read at least some about the virus (61 percent).2 

The majority of the public is aware of the potential ways to spread the virus and potential effects of the virus. Three-quarters (76 percent) report that they are aware that a person can become infected through a bite from an infected mosquito, more than half (54 percent) are aware that a person can become infected by having sex with someone who is infected, and seven in 10 (69 percent) are aware that it does not appear to be spread through shaking hands with an infected person.

Figure 11: Knowledge of Potential Ways to Spread Zika Virus

In addition, more than six in 10 (63 percent) of the public are aware that there are cases of infected persons in the U.S. And while the link between the Zika virus and birth defects in children born to infected mothers has not been proven, 60 percent of Americans report knowing about this potential connection.

Figure 12: Knowledge of Potential Effects of the Zika Virus

About four in 10 (43 percent) of the public are worried that the U.S. will see a large number of cases of the Zika virus in the next 12 months and three in 10 (28 percent) are worried that they or someone in their family will be affected by the Zika virus. Likely due to the virus’ potential connection to birth defects, women are somewhat more likely than men to be worried about a potential outbreak in the U.S. (49 percent vs. 37 percent) or if they or someone in their family may be affected by the virus (32 percent vs. 23 percent).

Figure 13: Concern About the Spread of the Zika Virus in the U.S.

Unsafe Levels of Lead in Flint Michigan’s Water Supply

Nearly two-thirds (64 percent) of Americans report following news about unsafe levels of lead in Flint Michigan’s water supply closely, and a similar share (63 percent) say that they have heard or read a lot (34 percent) or some (28 percent) about it. Another 37 percent report hearing or reading only a little (19 percent) or nothing at all (18 percent) about the crisis. More than six in 10 people (65 percent) say that the lead level of Flint Michigan’s water supply is not under control compared to one in 10 who say that it is mostly under control and 6 percent who do not know.

Figure 14: Heard About Flint Water Crisis?

Nearly eight in 10 Americans (77 percent) report that they are concerned about the safety of the water supply in low income communities in the U.S. with 40 percent reporting that they are ‘very concerned,’ while less than half (47 percent) are concerned about the safety of the water supply in their own community, with 27 percent reporting that they are ‘very concerned.’ People with lower incomes are more likely to report being concerned about the safety of the water supply in their own communities.

Figure 15: Concern Over the Safety of the Water Supply


Methodology

This Kaiser Health Tracking Poll was designed and analyzed by public opinion researchers at the Kaiser Family Foundation (KFF). The survey was conducted February 10-18, 2016, among a nationally representative random digit dial telephone sample of 1,202 adults ages 18 and older, living in the United States, including Alaska and Hawaii (note: persons without a telephone could not be included in the random selection process). Computer-assisted telephone interviews conducted by landline (421) and cell phone (781, including 460 who had no landline telephone) were carried out in English and Spanish by Princeton Data Source under the direction of Princeton Survey Research Associates International (PSRAI). Both the random digit dial landline and cell phone samples were provided by Survey Sampling International, LLC. For the landline sample, respondents were selected by asking for the youngest adult male or female currently at home based on a random rotation. If no one of that gender was available, interviewers asked to speak with the youngest adult of the opposite gender. For the cell phone sample, interviews were conducted with the adult who answered the phone. KFF paid for all costs associated with the survey.

The combined landline and cell phone sample was weighted to balance the sample demographics to match estimates for the national population using data from the Census Bureau’s 2014 American Community Survey (ACS) on sex, age, education, race, Hispanic origin, nativity (for Hispanics only), and region along with data from the 2010 Census on population density. The sample was also weighted to match current patterns of telephone use using data from the January-June 2015 National Health Interview Survey. The weight takes into account the fact that respondents with both a landline and cell phone have a higher probability of selection in the combined sample and also adjusts for the household size for the landline sample. All statistical tests of significance account for the effect of weighting.

The margin of sampling error including the design effect for the full sample is plus or minus 3 percentage points. Numbers of respondents and margins of sampling error for key subgroups are shown in the table below. For results based on other subgroups, the margin of sampling error may be higher. Sample sizes and margins of sampling error for other subgroups are available by request. Note that sampling error is only one of many potential sources of error in this or any other public opinion poll. Kaiser Family Foundation public opinion and survey research is a charter member of the Transparency Initiative of the American Association for Public Opinion Research.

GroupN (unweighted)M.O.S.E.
Total1202±3 percentage points
Party Identification
   Democrats356±6 percentage points
   Republicans301±7 percentage points
   Independents399±6 percentage points


Endnotes

  1. World Health Organization, February 1, 2016. http://www.who.int/mediacentre/news/statements/2016/emergency-committee-zika-microcephaly/en/ ↩︎
  2. The survey was in the field February 10-18, prior to the Pope’s suggestion that contraception use may be acceptable for those fearing the Zika virus. ↩︎

Medicaid Non-Emergency Medical Transportation: Overview and Key Issues in Medicaid Expansion Waivers

Authors: MaryBeth Musumeci and Robin Rudowitz
Published: Feb 24, 2016

Issue Brief

Medicaid’s non-emergency medical transportation (NEMT) benefit facilitates access to care for low income beneficiaries who otherwise may not have a reliable affordable means of getting to health care appointments. NEMT also assists people with disabilities who have frequent appointments and people who have limited public transit options and long travel times to health care providers, such as those in rural areas. NEMT expenses eligible for federal Medicaid matching funds include a broad range of services, such as taxicabs, public transit buses and subways, and van programs. Although comprehensive data about Medicaid NEMT expenditures do not exist because states are not required to separately report on this item, the Transit Cooperative Research Program, a federally funded independent research entity, estimates NEMT spending at $3 billion annually, less than one percent of total Medicaid expenditures.1  This issue brief describes the NEMT benefit, how states administer it, and the reasons that beneficiaries frequently use NEMT. It also explores current policy issues related to NEMT in the context of alternative Medicaid expansion waivers.

What is Medicaid’s Non-Emergency Medical Transportation Benefit?

State Medicaid programs are required to provide necessary transportation for beneficiaries to and from providers. NEMT services are not included in the statutory list of mandatory Medicaid benefits but are required by a long-standing federal regulation,2  based on the Department of Health and Human Services’ statutory authority to require state Medicaid plans to provide for methods of administration necessary for their proper and efficient operation.3  Additionally, as part of the Early and Periodic Screening, Diagnostic, and Treatment (EPSDT) benefit, states are required to offer children from birth to age 21 and their families “necessary assistance with transportation” to and from providers.4 

How is the Medicaid NEMT Benefit Administered?

State Medicaid agencies have considerable latitude in how they administer NEMT benefits. Federal law contains a broad guideline that state Medicaid plans must specify the methods used to provide NEMT.5  Most states utilize third-party brokerage firms to coordinate transportation for beneficiaries in return for a capitated payment, while some states deliver NEMT directly via fee-for-service reimbursements, and still others rely on a mix of capitated brokerage, direct delivery, and public transit voucher programs as appropriate based on geographic and beneficiary needs.6 

State spending for Medicaid NEMT services can be reimbursed as an administrative expense or as a medical service expense. Reimbursement as an administrative expense caps the Federal Medical Assistance Percentage (FMAP), or the amount of federal matching funds available, at 50% like other administrative expenses. Claiming as an administrative expense affords states greater flexibility in delivery system design and eliminates the free choice of provider requirement, allowing for contracts with a single provider and alternative payment models, like vouchers. Claiming NEMT as a medical service expense allows for reimbursement at the state’s regular FMAP, which ranges from 50 to 74.63% in FY 2017, depending on state per capita income, for most populations.7  Claiming as a medical service expense generally makes NEMT subject to additional guidelines, including offering beneficiaries free choice of providers and covering travel for attendant care providers. However, the Deficit Reduction Act (DRA) of 2005 added an option for states to include NEMT brokerage programs in their Medicaid state plans where cost-effective.8  States using the DRA option can claim NEMT as a medical expense, accessing their regular FMAP, while also limiting beneficiaries’ free choice of provider and varying NEMT programs by geographic region and in amount, duration, and scope.9 

Why Do Medicaid Beneficiaries Use NEMT?

NEMT can be a cost-effective means of facilitating access to care for Medicaid beneficiaries. One study estimated that at least 3.6 million people miss or delay medical care each year because they lack available or affordable transportation.10  This study found that improved access to NEMT for this population is cost-effective or cost-saving for all 12 medical conditions analyzed, including preventive services such as prenatal care, and chronic conditions such as asthma, heart disease, and diabetes.11  Another study found that adults who lack transportation to medical care are more likely to have chronic health conditions that can escalate to a need for emergency care if not properly managed.12  This study also noted that adults who lack transportation to medical care are disproportionately poor, elderly, and disabled and more likely to have multiple health conditions.13  Most recently, a report for the Arkansas Health Reform Task Force cited national studies showing a positive return on investment for NEMT and recommended that the state retain its current Medicaid NEMT benefit structure as it has proven cost effective.14 

Beneficiaries frequently use NEMT to access behavioral health services, preventive health services, and care for chronic conditions. While there are no comprehensive national data about beneficiary use of NEMT (because states are not required to separately report this data), information from one company that provides Medicaid NEMT services in 32 states indicates that the most frequently cited reasons for using NEMT are accessing behavioral health services (including mental health and substance abuse treatment), dialysis, preventive services (including doctor visits), specialist visits, physical therapy/rehabilitation, and adult day health care services.15  (Figure 1)

Figure 1: Medicaid Non-Emergency Medical Transportation Trips in 32 States, by Treatment Type (Nov. 2015 year-to-date)

Adult Medicaid beneficiaries frequently use NEMT to access behavioral health services. For example, data about NEMT use in 2 states (Nevada and New Jersey) that adopted the ACA’s Medicaid expansion show that both expansion adults and those who were eligible for Medicaid prior to the ACA most frequently use NEMT to access mental health and substance abuse treatment services (over 40% of total trips for both groups in NJ, and over 30% of total trips for both groups in NV, from Feb. to April 2014).16  These data also indicate that expansion adults’ use of NEMT has grown over time (from 1.9% to 5.1% from Feb. 2014 through April 2015 in NJ, and from 1.5% to 5.2% from March 2014 through April 2015 in NV).17  This could be due to beneficiaries learning about the availability of these services as they are enrolled longer and have more experience with using and understanding the Medicaid program.

Expansion adults and children in particular frequently use NEMT to access preventive care. When considering the top ten reasons for NEMT use, expansion adults in Nevada and New Jersey were more likely than traditional Medicaid beneficiaries to use NEMT to access preventive services (54% greater utilization for preventive services in NJ from Feb. 2014 to April 2015, and 53% greater utilization for preventive services in NV from March 2014 to April 2015).18  Another study found that children who used Texas’s Medicaid NEMT program were significantly more likely to access EPSDT’s preventive services, at a rate of almost one more visit per year.19  These services can help to address health disparities in early childhood, such as those resulting from socioeconomic factors. NEMT services also facilitated Texas children’s access to periodic appointments, such as routine immunizations, vision screenings, and neonatal visits.

What is NEMT’s Role in Medicaid Expansion Waivers?

Adults who are eligible for Medicaid under the Affordable Care Act’s expansion up to 138% FPL must receive a benefit package that includes NEMT.20  As with other beneficiaries, NEMT for expansion adults can be considered an administrative expense or a medical service expense for purposes of claiming federal matching funds. NEMT claimed as a medical service expense for expansion adults is subject to the ACA’s enhanced FMAP, which is substantially higher than states’ regular FMAPs, 100% until 2016, and gradually decreasing to 90% by 2020, where it remains indefinitely.21 

Two states (Iowa and Indiana) with approved Section 1115 demonstrations to expand Medicaid in ways that differ from existing federal law are implementing time-limited waivers of NEMT.22  (Pennsylvania’s demonstration also included a limited NEMT waiver, although Pennsylvania subsequently transitioned to a traditional Medicaid expansion, and its demonstration is no longer being implemented.23 ) Iowa and Indiana’s NEMT waivers exclude medically frail individuals. These states sought waivers because they are seeking to offer a benefit package to expansion adults similar to private insurance coverage, which does not include NEMT.

Some other states are interested in waiving NEMT as part of Medicaid expansion demonstrations. Arizona has an application pending with CMS that seeks a one year waiver of NEMT for expansion adults from 101-138% FPL.24  NEMT waivers also were part of the Medicaid expansion proposals debated in Utah and Tennessee, although no waiver applications from those states have been submitted to CMS to date.25 

Another Medicaid expansion waiver state, Arkansas, decided to keep its NEMT benefit as the state believes its brokerage model has proven cost-effective. When amending its Medicaid expansion waiver, Arkansas sought authority to limit NEMT for expansion adults but subsequently established a prior authorization process for NEMT that did not require waiver authority.26  Arkansas provides NEMT to expansion adults as a wrap-around benefit on a fee-for-service basis because its entire Medicaid expansion population is required to enroll in Marketplace premium assistance, and NEMT is not offered in Marketplace plans.27  A recent report for the Arkansas Health Reform Task Force (described above) recommended that the state keep NEMT in place because there is a “very effective brokerage model for non-emergency medical transportation (NEMT) with a capitated benefit structure that manages the program in a cost effective manner.”28 

In response to a recent U.S. Government Accountability Office (GAO) study, states cited “consider[ing] the NEMT benefit crucial to ensuring enrollees’ access to care” and “want[ing] to align benefits for the newly eligible enrollees with those offered to enrollees covered under the traditional Medicaid state plan” as among the reasons offered for maintaining the NEMT benefit for expansion adults.29  Of the 30 Medicaid expansion states studied by the GAO in September, 2015, 25 reported that they did not seek to exclude NEMT when they implemented the ACA’s Medicaid expansion and were not considering doing so.30  The GAO found that state efforts to exclude NEMT from Medicaid expansion adults are “not widespread.”31 

What is the Impact of Waiving NEMT for Expansion Adults?

CMS conditioned extension of Iowa and Indiana’s NEMT waivers on an evaluation of the waiver’s impact on beneficiary access to care.32  Iowa’s initial NEMT waiver was approved from January through December 2014, and its Medicaid expansion demonstration expires on December 31, 2016. Indiana’s initial NEMT waiver was approved from January, 2015 through January, 2016, and its Medicaid expansion demonstration expires in January, 2018.

Preliminary state data evaluating the impact of Iowa’s NEMT waiver indicate that the waiver may have adverse implications for beneficiary access to care. A fall 2014 beneficiary survey found that Iowa Medicaid beneficiaries whose benefit package does not include NEMT are more likely than those with access to NEMT to need assistance with travel to a health care visit.33  CMS noted that these data “raised concerns about beneficiary access [to care,] particularly for those with incomes below 100 percent of the [federal poverty level,] FPL.”34 

CMS has extended Iowa’s and Indiana’s NEMT waivers, pending additional evaluation results. Iowa’s waiver was extended through July 31, 2015, and again through March 31, 2016. Indiana’s waiver has been temporarily extended through November 30, 2016.

Additional data from the NEMT waiver evaluations are expected but not yet publicly available. After reviewing the preliminary evaluation results, CMS instructed Iowa to conduct another survey to compare with the fall 2014 data.35  By December 31, 2015, Iowa was to provide CMS with the results of this survey and its draft interim demonstration evaluation comparing utilization outcomes for beneficiaries who have an unmet transportation need and who do not have access to NEMT with other beneficiaries. Iowa also was to submit a readiness plan for beginning NEMT services in the event that CMS does not extend the NEMT waiver beyond March, 2016.36  Indiana is due to submit state survey data and analyses evaluating its NEMT waiver to CMS by February 29, 2016. In addition to the state evaluation findings, CMS noted that it will consider beneficiary survey data from the federal demonstration evaluation in Indiana, when determining whether to extend Indiana’s waiver, due to CMS’s concerns about sample sizes and limited use of control groups in the state evaluation.37 

The recent GAO report identifies decreased access to care and increased costs of care as potential implications of waiving NEMT for expansion adults.38  The research and advocacy groups interviewed by the GAO as part of its study cited access to care issues particularly for those living in rural or underserved areas and for those with chronic health conditions.39  While expansion adults who qualify as medically frail in Iowa and Indiana must receive NEMT, some interviewees noted that medical frailty determinations may be too limited in terms of which people with chronic health conditions can qualify and may involve long waits.40  GAO’s interviewees also noted that those “without access to transportation may forgo preventive care or health services and end up needing more expensive care, such as ambulance services or emergency room visits.”41 

Looking Ahead

Medicaid beneficiaries rely on NEMT in the absence of other affordable available transportation to necessary medical care. Evidence supports this service as a cost-effective or cost-saving measure for facilitating access to care for beneficiaries with low incomes, including people seeking preventive services as well as those with disabilities and chronic conditions that require more frequent regular care. States have flexibility in how they administer NEMT under existing law, and recent demonstrations have allowed Iowa and Indiana to test whether waiving this benefit for expansion adults adversely affects access to care. CMS has extended these waivers pending the availability of additional data, while noting that early data from Iowa raises concerns about an adverse impact on beneficiary access to care. Other states, such as Arkansas, have determined that providing NEMT to expansion adults is cost-effective, and data from Nevada and New Jersey indicate that expansion adults are using NEMT to access behavioral health services at a similar rate and preventive care at a greater rate compared to the traditional Medicaid population. Given the interest in NEMT waivers for expansion adults in other states, following developments in this area will be important in evaluating NEMT’s role in facilitating Medicaid beneficiaries’ access to care and its impact on health outcomes.


Endnotes

  1. Transit Cooperative Research Program, Impact of the Affordable Care Act on Non-Emergency Medical Transportation: Assessment for Transit Agencies at 2 (Oct. 2014), http://onlinepubs.trb.org/onlinepubs/tcrp/tcrp_rrd_109.pdf. ↩︎
  2. 42 C.F.R. § 431.53. ↩︎
  3. 42 U.S.C. § 1396a(a)(4)(A). ↩︎
  4. 42 C.F.R. § 441.62; see also 42 U.S.C. § 1396a(a)(43) (requiring state to arrange for screening services and corrective treatment for EPSDT beneficiaries). ↩︎
  5. 42 C.F.R. § 431.53. ↩︎
  6. See, e.g., J. Kim et al., “Transportation Brokerage Services and Medicaid Beneficiaries’ Access to Care,” 44 Health Serv. Res. 145-161 (2009), http://www.ncbi.nlm.nih.gov/pmc/articles/PMC2669622/; see also Centers for Medicare and Medicaid Services., EPSDT-A Guide for States: Coverage in the Medicaid Benefit for Children and Adolescents (2014), http://www.medicaid.gov/Medicaid-CHIP-Program-Information/By-Topics/Benefits/Downloads/EPSDT_Coverage_Guide.pdf. ↩︎
  7. Kaiser Family Foundation State Health Facts, Federal Medical Assistance Percentage (FMAP) for Medicaid and Multiplier Data Source: FY 2017: 80 Fed. Reg. 73779 (Nov. 25, 2015), https://modern.kff.org/medicaid/state-indicator/federal-matching-rate-and-multiplier/. ↩︎
  8. 42 U.S.C. § 1396a(a)(70); 42 C.F.R. § 440.170(a)(4). ↩︎
  9. S. Rosenbaum, et al., Medicaid’s Medical Transportation Assurance: Origins, Evolution, Current Trends, and Implications for Health Reform (July 2009), http://hsrc.himmelfarb.gwu.edu/cgi/viewcontent.cgi?article=1035&context=sphhs_policy_briefs. ↩︎
  10. P. Hughes-Cromwick and R. Wallace, et al., Cost-Benefit Analysis of Providing Non-Emergency Medical Transportation, Transit Cooperative Research Program (Oct. 2005), http://onlinepubs.trb.org/onlinepubs/tcrp/tcrp_webdoc_29.pdf. ↩︎
  11. Id. ↩︎
  12. Richard Wallace, et al, “Access to Health Care and Nonemergency Medical Transportation: Two Missing Links,” 1924 Transportation Research Record: Journal of the Transportation Research Board 76-84 (2005), http://www.researchgate.net/publication/39967547_ Access_to_Health_Care_and_Nonemergency_Medical_Transportation_Two_Missing_Links. ↩︎
  13. Id. ↩︎
  14. The Stephen Group, Volume II: Recommendations to the Arkansas Health Reform Task Force (Oct. 2015), http://www.arkleg.state.ar.us/assembly/2015/Meeting%20Attachments/836/ I14099/TSG%20Volume%20II%20Recommendations.pdf. ↩︎
  15. LogistiCare Solutions, Medicaid Gross Trips by Treatment Type (Nov. 2015) (on file with authors). ↩︎
  16. Id. ↩︎
  17. LogistiCare Solutions, NJ Expansion Analysis (on file with authors); LogistiCare Solutions, NV Expansion Analysis (on file with authors). ↩︎
  18. Id. ↩︎
  19. S. Borders, Transportation Barriers to Health Care: Assessing the Texas Medicaid Program, Dissertation submitted to Texas A&M University Office of Graduate Studies (May 2006), http://oaktrust.library.tamu.edu/bitstream/handle/1969.1/6016/etd-tamu-2006A-URSC-Borders.pdf?sequence=1&isAllowed=y. ↩︎
  20. 42 C.F.R. § 440.390. The Affordable Care Act requires states to expand Medicaid to adults with income up to 138% FPL as of 2014. However, the Supreme Court’s decision on the constitutionality of this provision effectively made expansion a state option. See Kaiser Commission on Medicaid and the Uninsured, A Guide to the Supreme Court’s Decision on the Medicaid Expansion (Washington, DC: Kaiser Commission on Medicaid and the Uninsured, Aug. 2012), https://modern.kff.org/health-reform/issue-brief/a-guide-to-the-supreme-courts-decision/. Expansion adults receive an alternative benefit plan. 42 U.S.C. § 1396(k)(1). ↩︎
  21. Kaiser Commission on Medicaid and the Uninsured, Financing Medicaid Coverage Under Health Reform: What is in the Law and the New FMAP Rules (Washington, DC: Kaiser Commission on Medicaid and the Uninsured, May 2013), https://modern.kff.org/health-reform/issue-brief/financing-medicaid-coverage-under-health-reform-the-role-of-the-federal-government-and-states/. ↩︎
  22. Kaiser Commission on Medicaid and the Uninsured, The ACA and Medicaid Expansion Waivers (Washington, DC: Kaiser Commission on Medicaid and the Uninsured, Nov. 2015), https://modern.kff.org/medicaid/issue-brief/the-aca-and-medicaid-expansion-waivers/ . To date, 32 states (including DC) have implemented the ACA’s Medicaid expansion, most of which have done so through a traditional state plan amendment instead of a waiver. Kaiser Family Foundation State Health Facts, Status of State Action on the Medicaid Expansion Decision Data Source: Based on KCMU tracking and analysis of state executive activity (Jan. 12, 2016), https://modern.kff.org/health-reform/state-indicator/state-activity-around-expanding-medicaid-under-the-affordable-care-act/. ↩︎
  23. Kaiser Commission on Medicaid and the Uninsured, Medicaid Expansion in Pennsylvania: Transition from Waiver to Traditional Coverage (Washington, DC: Kaiser Commission on Medicaid and the Uninsured, Aug. 2015), https://modern.kff.org/medicaid/fact-sheet/medicaid-expansion-in-pennsylvania/. ↩︎
  24. Arizona expanded Medicaid in 2014 as envisioned in the ACA but is now seeking changes through waiver authority as required by state law. Kaiser Commission on Medicaid and the Uninsured, Proposed Changes to Medicaid Expansion in Arizona (Washington, DC: Kaiser Commission on Medicaid and the Uninsured, Nov. 2015), https://modern.kff.org/medicaid/fact-sheet/proposed-changes-to-medicaid-expansion-in-arizona/. ↩︎
  25. Kaiser Commission on Medicaid and the Uninsured, Proposed Medicaid Expansion in Tennessee (Washington, DC: Kaiser Commission on Medicaid and the Uninsured, Jan. 2015), https://modern.kff.org/medicaid/fact-sheet/proposed-medicaid-expansion-in-tennessee/; Kaiser Commission on Medicaid and the Uninsured, Proposed Medicaid Expansion in Utah (Washington, DC: Kaiser Commission on Medicaid and the Uninsured, Jan. 2015), https://modern.kff.org/medicaid/fact-sheet/proposed-medicaid-expansion-in-utah/. ↩︎
  26. Kaiser Commission on Medicaid and the Uninsured, The ACA and Medicaid Expansion Waivers (Washington, DC: Kaiser Commission on Medicaid and the Uninsured, Nov. 2015), https://modern.kff.org/medicaid/issue-brief/the-aca-and-medicaid-expansion-waivers/. ↩︎
  27. Kaiser Commission on Medicaid and the Uninsured, A Look at the Private Option in Arkansas, (Washington, DC: Kaiser Commission on Medicaid and the Uninsured, Aug. 2015), https://modern.kff.org/medicaid/issue-brief/a-look-at-the-private-option-in-arkansas/; Kaiser Commission on Medicaid and the Uninsured, Medicaid Expansion in Arkansas (Washington, DC: Kaiser Commission on Medicaid and the Uninsured, Feb. 2015),  https://modern.kff.org/medicaid/fact-sheet/medicaid-expansion-in-arkansas/. ↩︎
  28. The Stephen Group, Volume II: Recommendations to the Arkansas Health Reform Task Force (Oct. 2015), http://www.arkleg.state.ar.us/assembly/ 2015/Meeting%20Attachments/836/I14099/TSG%20Volume%20II%20Recommendations.pdf. ↩︎
  29. GAO did not ask states to provide their reasons for not seeking to exclude NEMT from expansion adults, but 14 states offered reasons.  Eight reported considering NEMT critical to ensuring access to care, four reported wanting to align new adult and traditional Medicaid benefit packages, and two reported seeing no need to alter the benefit as expansion did not significantly increase program enrollment.  U.S. Gov’t Accountability Office, Report to Congressional Requesters, Medicaid, Efforts to Exclude Nonemergency Transportation Not Widespread, but Raise Issues for Expanded Coverage,GAO-16-221 at 10 (Jan. 2016), http://www.gao.gov/products/GAO-16-221. ↩︎
  30. Three states (AZ, IA, and IN) indicated that they were pursuing efforts to exclude NEMT for expansion adults.  Two states (NJ and OH) did not respond to GAO, but CMS confirmed that neither had sought to exclude NEMT as part of their Medicaid expansions.  Id. at 6. ↩︎
  31. Id.at GAO Highlights page.    ↩︎
  32. Kaiser Commission on Medicaid and the Uninsured, The ACA and Medicaid Expansion Waivers (Washington, DC: Kaiser Commission on Medicaid and the Uninsured, Nov. 2015), https://modern.kff.org/medicaid/issue-brief/the-aca-and-medicaid-expansion-waivers/ ; Kaiser Commission on Medicaid and the Uninsured, Medicaid Expansion in Iowa (Washington, DC: Kaiser Commission on Medicaid and the Uninsured, Nov. 2015), https://modern.kff.org/medicaid/fact-sheet/medicaid-expansion-in-iowa/; Kaiser Commission on Medicaid and the Uninsured, Medicaid Expansion in Indiana (Washington, DC: Kaiser Commission on Medicaid and the Uninsured, Feb. 2015), https://modern.kff.org/medicaid/fact-sheet/medicaid-expansion-in-indiana/. ↩︎
  33. Letter from Cindy Mann, Director, CMCS, CMS to Julie Lovelady, Interim Medicaid Director, State of Iowa (Dec. 30, 2014), http://medicaid.gov/Medicaid-CHIP-Program-Information/By-Topics/Waivers/1115/downloads/ia/ia-marketplace-choice-plan-ca.pdf. ↩︎
  34. Id.  ↩︎
  35. Letter from Vicki Wachino, Director, CMCS, CMS to Mikki Stier, Medicaid Director, State of Iowa (July 31, 2015), http://medicaid.gov/Medicaid-CHIP-Program-Information/By-Topics/Waivers/1115/downloads/ia/ia-marketplace-choice-plan-ca.pdf. ↩︎
  36. CMS Special Terms and Conditions, Iowa Wellness Plan, Section VII. 41 (p. 14) (Jan. 1, 2014-Dec. 31, 2016, amended July 31, 2015), https://www.medicaid.gov/Medicaid-CHIP-Program-Information/By-Topics/Waivers/1115/downloads/ia/ia-wellness-plan-ca.pdf. ↩︎
  37. Letter from Eliot Fishman, Director, CMS to Joseph Moser, Medicaid Director, Indiana Family and Social Services Administration (Dec. 22, 2015), https://www.medicaid.gov/Medicaid-CHIP-Program-Information/By-Topics/Waivers/1115/downloads/in/Healthy-Indiana-Plan-2/in-healthy-indiana-plan-support-20-response-ltr-12222015.pdf. ↩︎
  38. GAO at 15. ↩︎
  39. Id.  ↩︎
  40. Id.at 15, n.32. ↩︎
  41. Id. at 15. ↩︎
News Release

Contraceptive Coverage Court Case in a Changing Supreme Court Landscape

Published: Feb 23, 2016

Next month, the U.S. Supreme Court will hear the Zubik v. Burwell case, another challenge to the Affordable Care Act, this time to the contraceptive coverage requirement brought by nonprofit corporations.  After the death of Justice Antonin Scalia, this already complicated and charged case has taken on an additional question:  If the Court is operating with only eight Justices, what would be the impact of a tie decision?

The Hobby Lobby decision established that certain firms with religious beliefs should be relieved of the requirement of paying for contraceptive coverage.  The current challenges, brought by religiously-affiliated nonprofits, address a different issue:  Does the accommodation the government offers to relieve them of the coverage requirement burden their religious beliefs?

A new issue brief from the Kaiser Family Foundation explains the legal issues raised by the Zubik v. Burwell case, discusses the influence of the Hobby Lobby decision, and the examines the potential impact of the ruling, including a split decision.

Contraceptive Coverage at the Supreme Court: Does the Law Accommodate or Burden Nonprofits’ Religious Beliefs? is available on kff.org.

Key Data on Health and Health Coverage in South Carolina

Published: Feb 10, 2016

This fact sheet draws on data from “Health and Health Coverage in the South: A Data Update” to highlight findings for South Carolina. The findings show the current status of health and health coverage in the state and the potential coverage gains that may be achieved through the ACA.

Portrait of South Carolina Residents

As of 2014, nearly 4.8 million individuals lived in South Carolina. South Carolinians accounted for 4% of the total 118 million individuals living in the 17 states, including DC, that make up the American South.

People of color make up over one third (36%) of South Carolinians. Non-Hispanic Blacks account for a higher share of South Carolina residents compared to the rest of the South and the United States. Over one in four (27%) South Carolinians is Black compared to 19% of Southerners and 12% of the population nationwide (Figure 1).

Figure 1: Racial/Ethnic Distribution of the Population, 2014

Nearly one in five (17%) South Carolinians is poor. The poverty rate in South Carolina is consistent with the Southern region and slightly higher than the overall rate for the U.S. (17% vs. 15%) (Figure 2).

Figure 2: Percent of Population Below Poverty, 2014

Health Needs in South Carolina

There are significant health needs among South Carolinians. In South Carolina, one in five (20%) adults reports fair or poor health status, over one in ten (12%) adults have been told by a doctor they have diabetes, and two-thirds (67%) of adults are overweight or obese (Figure 3). South Carolina also has high infant mortality and cancer death rates compared to rates for the United States (Figure 4).

Figure 3: Selected Health Indicators Among Adults, 2014
Figure 4: Infant Mortality and Cancer-Related Death Rates

Health Coverage in South Carolina

South Carolinians are more likely to be uninsured compared to the nationwide population. Consistent with the uninsured rate for the Southern region, 15% of nonelderly South Carolinians are uninsured, which is higher than the 12% uninsured rate for the nonelderly population nationwide. Uninsured rates are higher for nonelderly adults in South Carolina compared to children (18% vs. 7%). Consistent with adults in the Southern region, nonelderly adults in South Carolina have a higher uninsured rate compared to the overall rate for the United States (18% vs. 14%) (Figure 5).

Figure 5: Health Insurance Coverage of the Nonelderly Population, 2014

Medicaid and CHIP eligibility levels in South Carolina are low compared to the national medians. South Carolina’s Medicaid/CHIP eligibility limit for children is 213% FPL compared to the national median of 255%, and its limit for pregnant women is 199% FPL compared to the national median limit of 205% FPL. Because the state has not adopted the ACA Medicaid expansion to adults, eligibility for parents remains at just 67% FPL, or about $13,500 for a family of three, and other adults without dependent children remain ineligible regardless of their income (Figure 6).

Figure 6: Median Medicaid/CHIP Eligibility Limits as a Percent of the Federal Poverty Level, January 2016

The ACA coverage expansions have the potential to extend health coverage to many uninsured South Carolinians, but because the state has not expanded Medicaid, many poor uninsured adults fall into a coverage gap. Among the 600,000 remaining nonelderly uninsured in South Carolina as of 2015, 17% are eligible for Medicaid and 31% are eligible for tax credit subsidies for Marketplace coverage. However, 20% or 123,000 fall into a coverage gap (Figure 7). These are poor adults who earn too much to qualify for Medicaid, but not enough to qualify for premium tax credits, which begin at 100% FPL. South Carolinians are more likely to fall into the coverage gap and less likely to be eligible for Medicaid compared to the uninsured nationwide. If South Carolina expanded Medicaid, the coverage gap would be eliminated and 48% of uninsured South Carolinians would be eligible for Medicaid coverage, increasing the total share of uninsured eligible for coverage to 70% (Figure 8).

Figure 7: Eligibility for ACA Coverage Among the Nonelderly Uninsured in 2015 Based on Medicaid Expansion Decisions as of January 2016
Figure 8: Eligibility for ACA Coverage Among the Nonelderly Uninsured if All States Expanded Medicaid

Health and Health Coverage in the South: A Data Update

Authors: Samantha Artiga and Anthony Damico
Published: Feb 10, 2016

Issue Brief

With its recent adoption of the Affordable Care Act (ACA) Medicaid expansion to adults, Louisiana became the 32nd state to move forward with the expansion, and the 7th of the 17 states that make up the American South to expand. However, within the South, which has high rates of chronic disease and poor health outcomes, the majority of states still have not adopted the Medicaid expansion. The ACA and its Medicaid expansion offer important opportunities to expand access to health coverage, particularly in the South, where Medicaid and CHIP eligibility levels across groups have lagged behind other regions for many years.1  While many factors contribute to chronic disease and poor health outcomes, expanding health coverage can provide an important step in improving health by supporting individuals’ ability to access preventive and primary care and ongoing treatment of health conditions. This brief provides key data on the South and the current status of health and health coverage in the South to provide greater insight into the health needs in the region and the potential coverage gains that may be achieved through the ACA. State specific data for the indicators presented in the brief are available in Tables 1 through 6.

Portrait of the South

The American South accounts for over one-third of the nation’s population. The South, as defined by the U.S. Census Bureau, includes 17 states, stretching from Oklahoma, Texas, and Arkansas on the West to the Atlantic Ocean on the East, and northward to Delaware, Maryland, Kentucky, and West Virginia (Figure 1). As of 2014, over 118 million individuals lived in the South accounting for more than one-third (37%) of the total U.S. population and the region is growing rapidly.

Figure 1: Census Regions and Divisions of the United States

The South is racially and ethnically diverse and home to a large share of the nation’s people of color. People of color make up 42% of the population living in the South compared to 36% in the remaining United States (Figure 2). In particular, Blacks account for a greater share of the Southern population compared to the remaining areas of the United States (19% vs. 8%). Moreover, more than four in ten (41%) of all people of color reside in the South, including nearly six in ten of Blacks (58%).2 

Figure 2: Racial and Ethnic Distribution of the Population in the South and Remaining US, 2014

Southerners are more likely than those in each of the other regions to be poor (Figure 3), and the region includes several states that have among the highest poverty rates in the nation. Four states in the South (Kentucky, Louisiana, Mississippi, West Virginia), have at least one in five residents living in poverty.

Figure 3: Percent of Population Below Poverty by Geographic Region, 2014

Health Needs in the South

Southerners as a group are generally more likely than those in the rest of the nation to have certain chronic illnesses and to experience worse health outcomes. Overall, one in five (20%) adults living in the South reports fair or poor health status, compared to 16% of adults in the Midwest and Northeast and 17% of adults in the West (Figure 4).

Figure 4: Percent of Adults Reporting Fair or Poor Health Status by Region, 2014

Higher rates of diabetes and obesity for adults are concentrated among Southern states (Figures 5 and 6). The states with the nation’s highest adult diabetes rates are all in the South as are the states with the nation’s highest obesity rates.

Figure 5: Percent of Adults Who Have Ever Been Told by A Doctor that They Have Diabetes, by State, 2014

Figure 6: Percent of Adults Who are Overweight or Obese, 2014

The South also includes the states with the highest infant mortality and cancer death rates. Overall, the infant mortality rate in the South is higher compared to that in the other regions (Figure 7). The South also has a higher rate of cancer-related deaths compared to the Northeast and West (Figure 8).

Figure 7: Infant Mortality Rate by Geographic Region, 2013

Figure 8: Cancer Death Rate by Geographic Region, 2012

Health Coverage in the South

Southerners are more likely to be uninsured compared to individuals living in the rest of the country. Among the total nonelderly population, 15% of individuals in the South are uninsured compared to 10% of individuals in the rest of the country. Uninsured rates are lower for children compared to nonelderly adults, but children and nonelderly adults in the South are still more likely to be uninsured than those in the rest of the country (Figure 9).

Figure 9: Health Insurance Coverage of the Nonelderly Population, by Geographic Region, 2014

Medicaid and CHIP eligibility levels are more limited in the South compared to other regions. The largest disparities in eligibility levels between the South and other regions are for parents and other adults (Figure 10). This finding reflects the fact that most states in the region have not adopted the ACA Medicaid expansion to adults. As of January 2016, 10 of the 17 states in the South are not moving forward with the Medicaid expansion (Figure 11). In these states, eligibility levels for parents remain low and other adults without dependent children remain ineligible, regardless of their income.

Figure 10: Median Medicaid/CHIP Eligibility Limits as a Percent of the Federal Poverty Level, by Eligibility Group and Geographic Region, January 2016

Figure 11: Status of Medicaid Expansion Decisions, January 12, 2016

Among Southern states, those that have adopted the Medicaid expansion generally have lower uninsured rates as of 2014 compared to those that have not adopted the expansion. Moreover, those that adopted the expansion generally experienced a larger decline in the uninsured rate between 2013 and 2014, when the ACA was implemented, compared to those that have not adopted the Medicaid expansion (Figure 12). Louisiana has a relatively high uninsured rate compared to other Southern states that have adopted the Medicaid expansion because it has not yet been implemented in the state; the expansion is scheduled to become effective as of July 2016. Delaware and the District of Columbia show little change in the uninsured rate between 2013 and 2014 because they already had Medicaid coverage for adults as of 2013.

Figure 12: Uninsured Rates Among the Nonelderly in Southern States, 2013 and 2014

The ACA Medicaid and Marketplace coverage expansions have the potential to extend health coverage to many currently uninsured Southerners. Based on current Medicaid expansion decisions, 42% of uninsured Southerners are eligible for coverage (Figure 13). This includes 16% who are eligible for Medicaid and 25% who are eligible for tax credit subsidies for Marketplace coverage. However, 17% fall into a coverage gap in the Southern states that have not adopted the Medicaid expansion. These are poor adults who earn too much to qualify for Medicaid but not enough to qualify for premium tax credits, which begin at 100% FPL. Because most states not implementing the Medicaid expansion are concentrated in the South, uninsured Southerners are more likely to fall into the coverage gap and less likely to be eligible for Medicaid compared to the uninsured in the rest of the country. If all states were to expand Medicaid, the coverage gap would be eliminated and 61% of uninsured Southerners would be eligible for coverage, with the share eligible for Medicaid increasing from 16% to 44% (Figure 14).

Figure 13: Eligibility for ACA Coverage Among the Nonelderly Uninsured in 2015, based on Medicaid Expansion Decisions as of January 2016

Figure 14: Eligibility for ACA Coverage Among the Nonelderly Uninsured in 2015 if All States Expanded Medicaid

Implications

The South is a vital component of the nation, accounting for over a third of the total population. The region is racially and ethnically diverse and home to a large share of the nation’s people of color. There are significant health needs within the region. Southerners as a group are generally more likely than those in other regions to have a number of chronic illnesses and experience worse health outcomes. While a broad array of factors contributes to the high rates of chronic disease and poor health outcomes in the South, ensuring individuals have health coverage that enables them to access preventive and primary care and ongoing treatment to meet their health needs can be an important step in addressing these disparities. Southerners are more likely to be uninsured compared to the rest of the country. The ACA has the potential to extend health coverage to many uninsured Southerners through the Medicaid and Marketplace coverage expansions. However, in states that do not implement the Medicaid expansion, many poor adults fall into a coverage gap. Despite this coverage gap, millions of uninsured Southerners are eligible for coverage today. Outreach and enrollment efforts will be key for getting these individuals into coverage. If all states were to expand Medicaid, the coverage gap would be eliminated and potential coverage gains in the region would be significantly larger.

Samantha Artiga is with the Kaiser Family Foundation. Anthony Damico is an independent consultant to the Kaiser Family Foundation.

Tables

Table 1: Racial and Ethnic Distribution and Poverty Rate of Total U.S. Population, 2014
StateTotal ResidentsRacial/Ethnic DistributionPercent With Income Below Poverty
WhiteBlackHispanicAsianOther
United States 316,168,000 62%12%18%6%3%15%
South 118,339,000 58%19%17%3%2%17%
Alabama4,768,00066%27%4%2%1%18%
Arkansas2,896,00072%16%7%N/A3%19%
Delaware929,00063%20%10%4%2%11%
District of Columbia657,00037%47%11%4%2%19%
Florida19,731,00055%16%25%3%1%17%
Georgia9,965,00053%31%10%4%2%17%
Kentucky4,316,00084%8%4%3%1%20%
Louisiana4,557,00058%31%6%2%2%23%
Maryland5,939,00054%29%8%6%3%10%
Mississippi2,965,00057%37%3%N/A1%22%
North Carolina9,836,00062%21%10%3%N/A17%
Oklahoma3,742,00068%7%11%2%12%18%
South Carolina4,764,00064%27%6%1%2%17%
Tennessee6,502,00074%17%6%1%N/A17%
Texas26,687,00044%12%38%4%2%16%
Virginia8,259,00063%19%8%7%2%10%
West Virginia1,826,00092%3%1%N/A2%21%
U.S Excluding South 197,829,000 64%*8%*18%7%*3%*14%*
Midwest 67,239,000 76%*10%*8%*3%2%13%*
Illinois12,798,00064%13%16%6%1%14%
Indiana6,478,00078%9%9%3%1%15%
Iowa3,081,00088%3%5%3%N/A10%
Kansas2,853,00075%6%12%4%3%12%
Michigan9,906,00075%14%6%3%2%15%
Minnesota5,419,00079%6%6%5%5%8%
Missouri5,961,00081%12%4%1%2%11%
Nebraska1,881,00079%4%11%3%N/A12%
North Dakota733,00088%2%3%2%5%10%
Ohio11,536,00080%12%3%2%3%16%
South Dakota847,00085%2%2%N/A10%13%
Wisconsin5,747,00082%6%8%2%3%11%
Northeast 55,766,000 67%*11%*13%*7%*2%*13%*
Connecticut3,578,00071%9%13%6%1%9%
Maine1,300,00092%1%1%2%4%15%
Massachusetts6,658,00072%7%11%8%2%14%
New Hampshire1,320,00092%1%3%3%1%7%
New Jersey8,939,00058%13%19%9%1%11%
New York19,679,00057%13%18%10%2%14%
Pennsylvania12,627,00077%10%7%3%2%13%
Rhode Island1,048,00077%6%12%4%2%12%
Vermont617,00094%1%1%2%2%10%
West 74,824,000 51%*4%*30%*11%*4%*15%*
Alaska696,00057%2%9%10%22%12%
Arizona6,657,00049%4%39%4%5%21%
California38,701,00039%5%38%15%3%16%
Colorado5,377,00070%4%21%2%3%12%
Hawaii1,365,00019%2%9%53%17%11%
Idaho1,610,00082%1%13%1%3%13%
Montana1,009,00090%1%3%N/A5%12%
Nevada2,823,00050%9%28%9%5%17%
New Mexico2,035,00040%2%43%N/A13%20%
Oregon3,962,00076%2%12%6%4%15%
Utah2,929,00081%1%12%4%2%10%
Washington7,085,00070%4%13%8%5%12%
Wyoming572,00086%1%9%N/A3%10%
NOTES: Persons of Hispanic origin may be of any race; all other racial/ethnic groups are non-Hispanic. Asian includes Native Hawaiians and Other Pacific Islanders. Other includes American Indians and Alaska Natives and individuals reporting two or more races. Numbers may not sum to 100% due to rounding. *Indicates the region has a statistically significant difference from the South at p<.05 level. Statistical comparisons not included for total United States or for individual states. N/A: Estimates with relative standard errors greater than 30% are not provided.SOURCE: Kaiser Family Foundation estimates based on the Census Bureau’s March 2015 Current Population Survey (CPS: Annual Social and Economic Supplement).

Table 2: Health Status and Selected Health Indicators
Selected Health Indicators among AdultsInfant Deaths per 1,000 Live BirthsCancer Death Rate per 100,000
Fair/Poor Health StatusPercent Told by A Doctor Have DiabetesPercent Overweight or Obese

United States

18%11%64%6.0166.4

South

20%11%66%6.7171.4
Alabama23%13%67%8.6184.8
Arkansas23%13%71%7.9188.6
Delaware16%11%67%6.4176.1
District of Columbia13%8%55%6.7178.4
Florida19%11%62%6.1157.8
Georgia19%12%66%7.0169.6
Kentucky24%12%67%6.4201.2
Louisiana22%11%69%8.7190.5
Maryland14%10%65%6.6166.0
Mississippi22%13%71%9.6200.0
North Carolina19%11%66%7.0170.5
Oklahoma20%12%68%6.7189.6
South Carolina20%12%67%6.9179.0
Tennessee24%13%67%6.8187.9
Texas19%11%68%5.8160.6
Virginia17%10%65%6.2165.3
West Virginia26%14%70%7.6191.1
U.S Excluding South17%*10%*63%*5.5*163.4*
Midwest16%*10%*66%6.4*174.1*
Illinois17%10%64%6.0175.5
Indiana19%11%66%7.2184.2
Iowa14%9%67%4.3167.9
Kansas15%10%66%6.5167.7
Michigan17%10%66%7.1174.3
Minnesota12%8%64%5.1155.6
Missouri17%11%66%6.5182.0
Nebraska13%9%67%5.2164.6
North Dakota14%9%69%6.0150.7
Ohio18%12%67%7.3182.1
South Dakota14%9%65%6.5162.0
Wisconsin16%9%67%6.3166.1
Northeast16%*10%*62%*5.2*164.1*
Connecticut14%9%60%4.8152.0
Maine15%9%64%7.1179.0
Massachusetts14%10%59%4.2163.3
New Hampshire14%9%64%5.6167.7
New Jersey17%10%63%4.5160.3
New York17%10%61%4.9159.5
Pennsylvania17%11%64%6.7174.8
Rhode Island15%9%62%6.5163.6
Vermont12%8%60%4.4164.8
West 17%*10%*61%*5.0*151.9*
Alaska13%7%65%5.8169.0
Arizona19%10%64%5.3148.3
California18%10%60%4.8151.0
Colorado13%7%57%5.1143.7
Hawaii15%10%58%6.4134.6
Idaho13%8%66%5.6152.0
Montana15%9%63%5.6154.2
Nevada18%10%64%5.3163.8
New Mexico21%12%65%5.3148.0
Oregon16%9%62%4.9168.3
Utah12%7%60%5.2128.7
Washington16%9%63%4.5161.8
Wyoming14%8%65%4.8154.6
NOTES: *Indicates the region has a statistically significant difference from the South at p<.05 level. Infant mortality rates are not subject to sampling variation; as such, these rates were tested using the CDC’s recommended approach described on p.26 of http://www.cdc.gov/nchs/data/nvsr/nvsr64/nvsr64_09.pdf. Statistical comparisons not included for total United States or for individual states.SOURCES: KCMU analysis of the Centers for Disease Control and Prevention (CDC)’s Behavioral Risk Factor Surveillance System (BRFSS) 2014 Survey Results. Infant mortality rates based on KCMU analysis of CDC Linked Birth/Infant Death Records, 2013. Cancer-related deaths based on KCMU analysis of CDC and National Cancer Institute United States Cancer Statistics, 2012, Incidence and Mortality Web-based Report.

Table 3: Health Insurance Coverage of the Nonelderly, 2014
Total Nonelderly (0-64)Nonelderly Adults (19-64) Children
PrivateMedicaid/Other PublicUninsuredPrivateMedicaid/Other PublicUninsuredPrivateMedicaid/Other PublicUninsured
United States62%26%12%67%19%14%52%41%6%
South60%25%15%65%17%18%49%44%7%
Alabama60%27%13%65%19%16%48%46%5%
Arkansas57%31%12%63%22%15%44%52%4%
Delaware66%26%8%68%23%9%60%34%6%
District of Columbia65%28%7%70%22%8%47%50%4%
Florida56%27%17%60%19%20%44%48%8%
Georgia59%24%18%63%15%22%48%43%8%
Kentucky60%32%8%64%26%9%50%45%5%
Louisiana56%29%15%63%18%19%41%56%3%
Maryland74%20%7%76%16%8%68%30%2%
Mississippi51%35%14%58%25%18%35%61%5%
North Carolina61%26%14%66%18%16%49%43%8%
Oklahoma58%24%18%63%17%20%46%40%14%
South Carolina58%27%15%61%21%18%49%44%7%
Tennessee64%25%11%69%18%13%53%42%6%
Texas59%23%19%64%13%23%47%44%9%
Virginia69%19%11%72%15%13%63%30%6%
West Virginia55%37%8%59%32%9%43%54%N/A
U.S Excluding South64%*26%10%*68%*20%*12%*54%*40%*6%*
Midwest67%*23%*10%*71%*18%11%*58%*37%*5%*
Illinois65%24%10%69%18%13%57%39%4%
Indiana65%23%12%69%17%15%56%37%7%
Iowa71%22%7%77%15%8%58%37%N/A
Kansas66%22%12%71%15%15%56%38%7%
Michigan66%26%8%69%21%10%58%39%3%
Minnesota74%19%8%76%16%8%68%26%7%
Missouri69%21%10%72%15%13%62%33%5%
Nebraska68%21%11%73%13%14%57%39%4%
North Dakota76%14%10%78%10%11%70%24%N/A
Ohio63%29%9%68%22%10%50%46%4%
South Dakota71%18%11%75%12%13%62%31%7%
Wisconsin71%21%8%74%16%10%61%34%4%
Northeast66%*25%9%*70%*20%*11%*56%*39%*5%*
Connecticut72%20%8%75%15%10%67%31%3%
Maine62%26%11%66%21%13%53%42%N/A
Massachusetts67%28%5%70%25%5%58%37%4%
New Hampshire75%17%8%78%12%10%64%32%4%
New Jersey66%22%12%68%17%14%60%34%6%
New York62%29%9%66%23%10%51%44%5%
Pennsylvania69%22%9%74%15%11%55%40%5%
Rhode Island71%22%6%76%17%7%59%38%3%
Vermont68%26%7%72%21%8%55%42%N/A
West60%28%*12%*64%22%*14%*51%*43%7%
Alaska58%26%16%62%20%18%48%41%12%
Arizona55%31%14%59%25%16%45%45%10%
California59%30%11%63%23%14%49%45%5%
Colorado60%27%13%64%22%15%51%40%9%
Hawaii65%29%6%70%22%7%53%44%3%
Idaho66%22%12%72%14%14%56%37%7%
Montana64%21%15%68%15%17%56%36%8%
Nevada59%27%14%63%21%16%48%41%11%
New Mexico49%38%14%54%30%16%37%55%8%
Oregon63%27%9%66%23%12%57%39%4%
Utah73%14%13%75%10%15%71%19%10%
Washington62%28%10%67%21%12%51%44%5%
Wyoming75%14%11%76%10%13%70%24%6%
NOTES: Private includes employer and non-group coverage. Medicaid/Other Public includes those covered by Medicaid, the Children’s Health Insurance Program, Medicare, military and other public coverage. Data may not sum to 100% due to rounding. *Indicates the region has a statistically significant difference from the South at p<.05 level. Statistical comparisons not included for total United States or for individual states. N/A: Estimates with relative standard errors greater than 30% are not provided.SOURCE: Kaiser Family Foundation estimates based on the Census Bureau’s March 2015 Current Population Survey (CPS: Annual Social and Economic Supplement).

Table 4: Medicaid/CHIP Eligibility Limits as a Percent of the Federal Poverty Level, January 2016

State

Upper Limit for ChildrenUpper Limit for Pregnant WomenParentsChildless Adults

United States Median

255%205%138%138%

South Median

217%205%44%0%
Alabama317%146%18%0%
Arkansas216%214%138%138%
Delaware217%217%138%138%
District of Columbia324%324%221%215%
Florida215%196%34%0%
Georgia252%225%37%0%
Kentucky218%200%138%138%
Louisiana*255%214%24%0%
Maryland322%264%138%138%
Mississippi214%199%27%0%
North Carolina216%201%44%0%
Oklahoma210%190%44%0%
South Carolina213%199%67%0%
Tennessee255%255%101%0%
Texas206%207%18%0%
Virginia205%205%39%0%
West Virginia305%163%138%138%

U.S. Excluding South Median

266%205%138%138%

Midwest Median

253%204%138%138%
Illinois318%213%138%138%
Indiana263%218%139%139%
Iowa380%380%138%138%
Kansas244%171%38%0%
Michigan217%200%138%138%
Minnesota288%283%138%138%
Missouri305%201%22%0%
Nebraska218%202%63%0%
North Dakota175%152%138%138%
Ohio211%205%138%138%
South Dakota209%138%52%0%
Wisconsin306%306%100%100%

Northeast Median

319%214%138%138%
Connecticut323%263%155%138%
Maine213%214%105%0%
Massachusetts305%205%138%138%
New Hampshire323%201%138%138%
New Jersey355%205%138%138%
New York405%223%138%138%
Pennsylvania319%220%138%138%
Rhode Island266%258%138%138%
Vermont317%213%138%138%

West Median

265%190%138%138%
Alaska208%205%143%138%
Arizona152%161%138%138%
California266%322%138%138%
Colorado265%265%138%138%
Hawaii313%196%138%138%
Idaho190%138%26%0%
Montana266%162%138%138%
Nevada205%165%138%138%
New Mexico305%255%138%138%
Oregon305%190%138%138%
Utah205%144%45%0%
Washington317%198%138%138%
Wyoming205%159%57%0%
NOTE: *Louisiana has adopted the Medicaid expansion for adults, but coverage is not yet in effect. When coverage becomes effective July 2016, eligibility levels for parents and other adults will be 138% FPL.SOURCE: Based on results from a national survey conducted by KCMU and the Georgetown University Center for Children and Families, January 2016.

Table 5: Eligibility for ACA Coverage Among the Nonelderly Uninsured in 2015 based on Medicaid Expansion Decisions as of January 2016

State

Total UninsuredMedicaid EligibleEligible for Tax CreditsIneligible for Financial Assistance Due to Offer of ESI, Income, or Citizenship In the Coverage Gap 

United States

32,339,000 8,850,000 27% 7,022,000 22% 13,572,000 42% 2,895,000 9%

South

15,050,000 2,450,000 16% 3,823,000 25% 6,186,000 41% 2,591,000 17%
Alabama513,00075,00015%160,00031%139,00027%139,00027%
Arkansas285,000127,00044%60,00021%98,00034%
Delaware63,00022,00035%15,00024%25,00040%
District of Columbia42,00020,00048%N/AN/A19,00045%
Florida2,788,000306,00011%825,00030%1,091,00039%567,00020%
Georgia1,524,000201,00013%406,00027%612,00040%305,00020%
Kentucky285,000121,00043%N/AN/A119,00042%49,00017%
Louisiana+582,000311,00053%117,00020%154,00026%
Maryland336,000133,00040%43,00013%160,00048%
Mississippi359,00042,00012%104,00029%106,00029%108,00030%
North Carolina1,138,000152,00013%289,00025%452,00040%244,00021%
Oklahoma581,000109,00019%144,00025%236,00041%91,00016%
South Carolina604,000100,00017%186,00031%195,00032%123,00020%
Tennessee605,000104,00017%127,00021%257,00042%118,00019%
Texas4,425,000493,00011%1,035,00023%2,132,00048%766,00017%
Virginia804,00077,00010%235,00029%361,00045%131,00016%
West Virginia116,00056,00048%31,00027%29,00025%
U.S. Excluding South17,289,000 6,400,000 37%* 3,199,000 19%* 7,386,000 43% 304,000 2%*
Midwest 5,427,000 1,916,000 35%* 1,103,000 20%* 2,209,000 41% 198,000 4%*
Illinois1,122,000397,00035%166,00015%559,00050%
Indiana686,000310,00045%128,00019%248,00036%
Iowa188,00088,00047%30,00016%71,00038%
Kansas302,00038,00013%83,00028%131,00043%
Michigan685,000320,00047%147,00021%218,00032%
Minnesota^364,000126,00035%45,00012%193,00053%
Missouri516,00052,00010%156,00030%198,00038%109,00021%
Nebraska178,00016,0009%46,00026%90,00050%27,00015%
North Dakota64,00024,00037%16,00025%24,00038%
Ohio834,000404,00048%165,00020%264,00032%
South Dakota77,00012,00016%22,00029%30,00039%13,00017%
Wisconsin410,000129,00032%100,00024%181,00044%&&
Northeast 4,249,000 1,612,000 38%* 818,000 19%* 1,795,000 42% 24,000 1%*
Connecticut247,00069,00028%62,00025%116,00047%
Maine121,00018,00015%40,00033%39,00032%24,00020%
Massachusetts288,00093,00032%N/AN/A147,00051%
New Hampshire94,00037,00039%17,00018%41,00043%
New Jersey940,000335,00036%131,00014%473,00050%
New York^1,476,000548,00037%317,00021%611,00041%
Pennsylvania994,000477,00048%180,00018%338,00034%
Rhode Island55,00027,00049%13,00023%15,00027%
Vermont34,0008,00024%11,00033%15,00043%
West 7,613,000 2,872,000 38%* 1,277,000 17%* 3,382,000 44%* 81,000 1%*
Alaska100,00051,00051%20,00020%29,00029%
Arizona808,000368,00046%100,00012%341,00042%
California3,845,0001,428,00037%623,00016%1,795,00047%
Colorado593,000223,00038%104,00018%266,00045%
Hawaii70,00035,00050%N/AN/A28,00039%
Idaho166,00021,00013%43,00026%72,00044%30,00018%
Montana126,00059,00047%27,00022%40,00032%
Nevada350,000147,00042%61,00017%143,00041%
New Mexico233,000109,00047%31,00013%94,00040%
Oregon307,000122,00040%N/AN/A150,00049%
Utah337,00066,00020%92,00027%138,00041%41,00012%
Washington621,000238,00038%116,00019%267,00043%
Wyoming56,0006,00011%19,00034%20,00036%11,00019%
NOTES: Numbers may not sum to 100% due to rounding. N/A indiciates estimates do not meet minimum standards for statistical reliability. *Indicates the region has a statistically significant difference from the South at p<.05 level. Statistical comparisons not included for total United States or for individual states. +LA’s Governor has adopted the Medicaid expansion but coverage is not yet in effect. For this analysis, LA is considered an expansion state. ^Tax credit-eligible population in Minnesota and New York include uninsured adults who are eligible for coverage through the Basic Health Plan. & Wisconsin covers adults up to 100% FPL in Medicaid under a waiver but did not adopt the ACA expansion.SOURCE: Kaiser Family Foundation analysis based on 2015 Current Population Survey data and 2015 Medicaid eligibility levels updated to reflect state Medicaid expansion decisions as of January 2016.

Table 6: Eligibility for Coverage Among the Nonelderly Uninsured in 2015 if All States Expanded Medicaid
StateTotal UninsuredMedicaid Eligible Eligible for Tax Credits Ineligible for Financial Assistance Due to Offer of ESI, Income, or Citizenship 
United States 32,339,000 13,542,000 42% 5,628,000 17% 13,169,000 41%
South 15,050,000 6,615,000 44% 2,602,000 17% 5,832,000 39%
Alabama513,000296,00058%95,00018%123,00024%
Arkansas285,000127,00044%60,00021%98,00034%
Delaware63,00022,00035%15,00024%25,00040%
District of Columbia42,00020,00048%N/AN/A19,00045%
Florida2,788,0001,179,00042%580,00021%1,030,00037%
Georgia1,524,000675,00044%284,00019%564,00037%
Kentucky285,000121,00043%N/AN/A119,00042%
Louisiana582,000311,00053%117,00020%154,00026%
Maryland336,000133,00040%43,00013%160,00048%
Mississippi359,000199,00055%64,00018%96,00027%
North Carolina1,138,000583,00051%140,00012%414,00036%
Oklahoma581,000260,00045%98,00017%223,00038%
South Carolina604,000289,00048%133,00022%182,00030%
Tennessee605,000290,00048%76,00013%239,00040%
Texas4,425,0001,727,00039%677,00015%2,022,00046%
Virginia804,000328,00041%143,00018%334,00041%
West Virginia116,00056,00048%31,00027%29,00025%
U.S. Excluding South17,289,000 6,926,000 40%* 3,026,000 18% 7,337,000 42%*
Midwest 5,427,000 2,261,000 42% 987,000 18% 2,179,000 40%
Illinois1,122,000397,00035%166,00015%559,00050%
Indiana686,000310,00045%128,00019%248,00036%
Iowa188,00088,00047%30,00016%71,00038%
Kansas302,000134,00044%43,00014%125,00041%
Michigan685,000320,00047%147,00021%218,00032%
Minnesota^364,000126,00035%45,00012%193,00053%
Missouri516,000220,00043%110,00021%186,00036%
Nebraska178,00051,00029%40,00022%87,00049%
North Dakota64,00024,00037%16,00025%24,00038%
Ohio834,000404,00048%165,00020%264,00032%
South Dakota77,00031,00040%17,00023%29,00037%
Wisconsin410,000156,00038%80,00020%174,00042%
Northeast 4,249,000 1,649,000 39%* 809,000 19% 1,791,000 42%
Connecticut247,00069,00028%62,00025%116,00047%
Maine121,00056,00046%31,00025%35,00029%
Massachusetts288,00093,00032%N/AN/A147,00051%
New Hampshire94,00037,00039%17,00018%41,00043%
New Jersey940,000335,00036%131,00014%473,00050%
New York^1,476,000548,00037%317,00021%611,00041%
Pennsylvania994,000477,00048%180,00018%338,00034%
Rhode Island55,00027,00049%13,00023%15,00027%
Vermont34,0008,00024%11,00033%15,00043%
West 7,613,000 3,016,000 40%* 1,230,000 16% 3,367,000 44%*
Alaska100,00051,00051%20,00020%29,00029%
Arizona808,000368,00046%100,00012%341,00042%
California3,845,0001,428,00037%623,00016%1,795,00047%
Colorado593,000223,00038%104,00018%266,00045%
Hawaii70,00035,00050%N/AN/A28,00039%
Idaho166,00067,00040%31,00019%68,00041%
Montana126,00059,00047%27,00022%40,00032%
Nevada350,000147,00042%61,00017%143,00041%
New Mexico233,000109,00047%31,00013%94,00040%
Oregon307,000122,00040%N/AN/A150,00049%
Utah337,000147,00044%62,00018%129,00038%
Washington621,000238,00038%116,00019%267,00043%
Wyoming56,00023,00041%14,00026%19,00033%
NOTES: Numbers may not sum to 100% due to rounding. N/A indiciates estimates do not meet minimum standards for statistical reliability. *Indicates the region has a statistically significant difference from the South at p<.05 level. Statistical comparisons not included for total United States or for individual states. ^Tax credit-eligible population in Minnesota and New York include uninsured adults who are eligible for coverage through the Basic Health Plan.SOURCE: Kaiser Family Foundation analysis based on 2015 Current Population Survey data and 2015 Medicaid eligibility levels, updated to assume adoption of the Medicaid expansion to adults in all states.

Endnotes

  1. Samantha Artiga and Elizabeth Cornachione, Trends in Medicaid and CHIP Eligibility Over Time (Washington DC: Kaiser Family Foundation, January 2016), https://modern.kff.org/medicaid/report/trends-in-medicaid-and-chip-eligibility-over-time/. ↩︎
  2. KCMU analysis of 2015 ASEC Supplement to the CPS. ↩︎