Connecting the Justice-Involved Population to Medicaid Coverage and Care: Findings from Three States

Authors: Jennifer Ryan, Lucy Pagel, Katy Smali, Samantha Artiga, Robin Rudowitz, and Alexandra Gates
Published: Jun 1, 2016

Executive Summary

This brief provides an overview of initiatives to connect the justice-involved population to Medicaid coverage and care in three states—Arizona, Connecticut, and Massachusetts. These states are leading efforts in these areas and provide key lessons about how to coordinate across health care and corrections and the potential of such initiatives to better link individuals to physical and behavioral health services. While their experiences to date point to important benefits stemming from these efforts, more time and data are needed to examine the effects on health and criminal justice outcomes. In sum, this brief finds:

Each of the case study states is connecting individuals to Medicaid coverage at multiple points within the justice system. The states have processes to suspend Medicaid eligibility for incarcerated individuals and to enroll incarcerated individuals who receive inpatient care. They also have initiatives to enroll inmates prior to release from incarceration and individuals on probation and parole. In Connecticut, about 60% of the incarcerated population is enrolled in Medicaid upon release, and, in Massachusetts, the majority of individuals released from prison each year are enrolled. Arizona reaches a smaller share of the incarcerated population since it targets efforts to those with serious mental illness and complex health conditions, but plans to broaden its scope in the future. Even with these efforts, there remain enrollment barriers, including difficulty reaching individuals who move into and out of custody quickly and system limitations.

The study states also connect individuals to health care in the community as they are released from jail or prison. To date, the initiatives primarily target individuals with significant health needs. They help individuals establish connections with community providers, schedule appointments, and obtain referrals for care or other services. The study states also have processes to provide individuals access to prescription drugs upon release. Newly released individuals face a range of access barriers even with this support. Providing assistance through individuals with a shared incarceration history, helping individuals address their priority needs, and identifying culturally competent providers can help overcome these challenges.

These approaches have increased coverage, facilitated access to care, and contributed to administrative efficiencies and state savings, but effects on criminal justice outcomes have not been measured. Savings include avoided capitation payments, increased federal funds for inpatient care for incarcerated individuals, and reduced costs in other programs. More research is needed on the effects on health and criminal justice outcomes, including recidivism rates. Strong leadership and close collaboration across stakeholders are key to success given that these are complex initiatives that involve multiple agencies.

Issue Brief

Introduction

Many individuals who are involved with the criminal justice system have significant physical and mental health needs. With the Affordable Care Act (ACA) Medicaid expansion to low-income adults adopted in 32 states to date, many individuals involved with the justice system are now eligible for Medicaid. Connecting these individuals to health coverage can facilitate their integration back into the community by increasing their ability to address their health needs, which may contribute to greater stability in their lives and broader benefits. An increasing number of states have efforts underway to enroll eligible individuals moving into and out of the justice system into Medicaid. Moreover, some states are looking beyond coverage to help link individuals to health services in the community upon release from incarceration.

Building on previous briefs about health coverage and Medicaid eligibility for the justice-involved population, this brief provides an overview of initiatives to connect the justice-involved population to Medicaid coverage and care in three states—Arizona, Connecticut, and Massachusetts. These states are leading efforts in these areas and provide key lessons about how to coordinate across health care and corrections and the potential of such initiatives to better link individuals to physical and behavioral health services. It is based on telephone interviews conducted in early 2016 with a range of stakeholders, including Medicaid agency staff, staff from the state Departments of Corrections (DOCs), Justice departments, providers and health plans, and advocates.

Background

The justice-involved population has significant physical and behavioral health needs. They have high rates of disease, including tuberculosis, HIV, Hepatitis B and C, arthritis, diabetes, and sexually transmitted disease compared to the general population.1  They also have significant behavioral health needs. Over half of prison and jail inmates have a mental health disorder, with local jail inmates experiencing the highest rate (64%). Moreover, the majority of inmates with a mental health disorder also have a substance or alcohol use disorder.2 

The criminal justice system is comprised of a range of different correctional facilities. It includes prisons, which typically house longer-term felons or inmates serving a sentence of more than one year, and jails, which house individuals awaiting trial or sentencing and those convicted of misdemeanors and serving shorter terms that are typically less than one year. There also are community-based supervision arrangements, including probation, parole, and halfway houses. The federal correctional system consists of prisons overseen by the Federal Bureau of Prisons, which house individuals convicted of a federal crime and generally serving a term of more than one year. State correctional systems oversee prisons housing individuals convicted of state crimes and generally serving terms of more than one year. Each state governs its own prison system through a Department of Corrections. Jails typically are governed by the local city or county governments. However, the structure of the system varies across states. For example, some states, including C0nnecticut, have a unified system in which the state oversees both the state prisons and jails.

Individuals may be enrolled in Medicaid while incarcerated. There is no federal statute, regulation, or policy that prevents individuals from applying for, being enrolled in, or being renewed for Medicaid while incarcerated. In April 2016 guidance, the Centers for Medicare and Medicaid Services (CMS) reiterated that incarcerated individuals may be determined eligible for Medicaid and that the state Medicaid agency must accept applications and process renewals for incarcerated individuals (Box 1).3 

Box 1: Medicaid Eligibility for Incarcerated Individuals

In guidance released in April 2016, CMS clarified that:

  • Incarceration does not preclude an inmate from being determined Medicaid-eligible.
  • The state Medicaid agency must accept applications from inmates to enroll in Medicaid or renew Medicaid enrollment during the time of their incarceration.
  • If the individual meets all applicable Medicaid eligibility requirements, the state must enroll or renew the enrollment of the individual effective before, during, or after the period of time spent in the correctional facility.
  • Once enrolled, the state may place the inmate in a suspended eligibility status during the period of incarceration.

Source: Centers for Medicare & Medicaid Services, “To facilitate successful re-entry for individuals transitioning from incarceration to their communities,” State Health Official Letter SHO #16-007, April 28, 2016, https://www.medicaid.gov/federal-policy-guidance/downloads/sho16007.pdf

Although individuals may be enrolled in Medicaid while they are incarcerated, Medicaid will not cover the cost of their care, except for inpatient services. In its recent guidance, CMS clarified who is considered an inmate of a public institution and therefore only able to receive Medicaid coverage for inpatient care. It also clarifies some groups that are not considered inmates of a public institution and, thus, can receive Medicaid coverage for all covered services if enrolled (Box 2).

Box 2: Who is an Inmate of a Public Institution?

An inmate of a public institution is a person living in a public institution, including a correctional institution. Correctional institutions include state or federal prisons, local jails, detention facilities, or other penal settings. An important consideration of whether an individual is an “inmate” is his or her legal ability to exercise personal freedom. Inmates may be enrolled in Medicaid but are only able to receive Medicaid coverage for inpatient care.

The following groups are NOT inmates of a public institution and can receive Medicaid coverage for all covered services if enrolled:

  • Individuals on probation, parole, or community release pending trial;
  • Individuals residing in corrections-related, supervised community residential facilities, unless the individual does not have freedom of movement and association while residing at the facility; and
  • Individuals on home confinement.

Source: Centers for Medicare & Medicaid Services, “To facilitate successful re-entry for individuals transitioning from incarceration to their communities,” State Health Official Letter SHO #16-007, April 28, 2016, https://www.medicaid.gov/federal-policy-guidance/downloads/sho16007.pdf

Overview of Study State Initiatives

Medicaid Enrollment Efforts

Historically, most states terminated Medicaid coverage for enrollees who became incarcerated because reimbursement was not available for most services provided to inmates of public institutions and most individuals involved with the justice system were not eligible for Medicaid prior to the ACA. However, given eligibility gains as a result of the ACA Medicaid expansion and CMS guidance encouraging states to facilitate connections to coverage and care, there has been increased movement among states to suspend rather than terminate Medicaid coverage for enrollees who become incarcerated.4  Over 30 states reported that they suspend Medicaid coverage as of January 2016.5  Suspending Medicaid coverage allows individuals to have their coverage active immediately upon release, facilitating their ability to access services. It also expedites access to federal Medicaid funds if an individual receives inpatient care during a period of incarceration that qualifies for Medicaid reimbursement. Beyond increased use of suspension, there also are growing efforts to enroll uninsured individuals into Medicaid prior to release from incarceration. For example, New York and Maryland recently released proposals to facilitate individuals’ connections to Medicaid upon release from incarceration.6 

As described below, each of the case study states—Arizona, Connecticut, and Massachusetts—is connecting individuals involved with the justice system to Medicaid coverage in multiple ways, including suspending Medicaid eligibility for incarcerated individuals, enrolling incarcerated individuals into Medicaid when they receive inpatient care that qualifies for Medicaid coverage, enrolling individuals in Medicaid prior to release from incarceration, and enrolling individuals in other areas of the justice system, including those on probation and parole.

Suspending Medicaid Eligibility

In Arizona, the Medicaid agency has suspense agreements in place with the Arizona DOC, Arizona Department of Juvenile Corrections (ADJC), and 9 out of the state’s 15 county jail systems, which together account for 90% of the state’s incarcerated population. (See agreement template here.) These efforts began as a pilot in one of the state’s larger county jail systems around 2005 and have expanded over time. Participating jails and prisons send a daily file of bookings and releases to the state Medicaid agency to identify cases to be placed in suspension status and those that need the suspension status lifted due to release. This is an electronic, automated process in most participating counties. When an individual is placed in suspension status, the state discontinues capitation payments to managed care plans for the individual, since he or she is only eligible for coverage of inpatient care while incarcerated. About 9,000 Medicaid enrollees are in suspension status in any given month. Upon release from jail or prison, individuals’ coverage is reactivated without them having to reapply. The Medicaid agency also processes renewals while individuals are incarcerated.

Connecticut places an enrollee in suspension status once he or she has been in custody for 60 days. Waiting 60 days before moving an enrollee into suspension status helps prevent disruptions in coverage for individuals who move into and out of incarceration over very short periods of time. Because Connecticut does not have managed care in its Medicaid program, there are no financial consequences related to waiting 60 days to activate the suspension. About 2,300 people were in suspension status as of April 2016. The DOC notifies the Medicaid agency as individuals are released and full benefits are restored. The state implemented this suspension process in June 2015. Prior to implementing this process, Medicaid coverage was discontinued for approximately 1,200 individuals each month due to their incarceration status.

Massachusetts has established a special fee-for-service limited inpatient Medicaid benefit. When the Medicaid agency is notified that an enrollee is incarcerated, eligibility staff update the individual’s coverage to this limited hospital benefit. Full benefit coverage is turned back on upon release.

Enrolling Incarcerated Individuals Who Receive Inpatient Care

In Arizona, the state has a separate agreement with counties regarding Medicaid coverage for inpatient hospital care for incarcerated individuals. (See agreement template here.) The Medicaid agency receives information from the hospital when inpatient care is provided to an inmate. If an individual is not already in suspension status, an application is initiated and processed to initiate Medicaid coverage for the care that is provided during the inpatient stay.

Connecticut processes new applications for individuals who receive inpatient care and are not in suspension status in order to access Medicaid coverage for the care. Hospitals are no longer required to submit an application if an inmate is in suspension status to access the coverage. The state hopes to implement a more automated process in the future that will rely on data matching rather than applications.

In July 2015, Massachusetts launched a statewide effort to enroll inmates with inpatient stays into Medicaid. If an individual has a scheduled inpatient stay, the individual is enrolled prior to receiving the care. If the care is unexpected, the individual is enrolled while in the hospital. The state’s DOC medical care vendor is assisting with these enrollments. As part of implementation of this policy, the DOC conducted significant outreach to the hospitals to educate them about the change in financing for this care.

Pre-Release Enrollment Efforts

Arizona began enrolling individuals into Medicaid prior to release a number of years ago with targeted efforts for people with serious mental illness and complex health needs. Medicaid applications for uninsured individuals are submitted via the online application or faxed or mailed from the jails and prisons to the Medicaid agency about 30 days prior to release. There is a dedicated unit within the Medicaid agency to process these applications. Approval is pended until there is a confirmed release date. Once release is confirmed, enrollment information and the Medicaid card is provided to the facility to give to the individual upon release. Since its initial efforts began, the state has expanded its focus to include women prisoners. Over time, the state plans to expand these efforts to the broader population with mental health and substance abuse needs and eventually to the entire pre-release population. The state recently passed legislation establishes new requirements for Arizona DOC to increase enrollment and care coordination for people transitioning out of prison.7  Arizona also has county-led initiatives to connect individuals to coverage prior to release (Box 3).

Box 3: Connecting Individuals to Coverage in Maricopa County, Arizona

Maricopa County is Arizona’s most populous county and includes the Tucson area. The county is working in partnership with local organizations to connect individuals to Medicaid:

  • Health insurance navigators are placed in the county’s Probation Assessment Centers to provide education and enrollment assistance to individuals eligible for release. Since February 2014, over 1,000 individuals have been enrolled in Medicaid through this pathway.
  • Inmates in the Maricopa County jail ALPHA program also are connected to coverage prior to release. ALPHA is an intensive 16 week substance abuse treatment program that provides transitional planning for integration into the community, including assistance enrolling in Medicaid. Nonprofit health educators educate ALPHA participants on health coverage options and how to use health coverage and provide assistance with completing applications. Since the program began in November 2015, 95 ALPHA participants have qualified for Medicaid upon release.8 

Connecticut has a dedicated Pre-Release Entitlement Unit within the Department of Social Services to facilitate processing of applications prior to release. The positions in the unit are funded through the DOC, the Judicial Branch, and the Department of Mental Health and Addiction Services. The unit works with staff at correctional facilities to expedite processing of applications for people prior to release. These efforts began many years ago with an initial focus on the seriously mentally ill population and have gradually expanded over time. Currently, the goal is to target everyone upon release.

Massachusetts launched a MassHealth/DOC Prison Reintegration Pilot Program beginning in 2015, under which MassHealth, the Medicaid agency, works with the DOC to enroll prisoners into Medicaid prior to their release. Previously, pre-release enrollment efforts within jails occurred on an ad hoc basis, but a statewide approach was launched in 2015. Currently, jails and prisons submit a notification to Medicaid 30 days prior to an individual’s release. If there is a Medicaid application on file from within the past 12 months, eligibility is determined based on that application and a prospective date is established for full Medicaid coverage based on the individual’s expected release date. If an application is not on file, a new application is completed. Some corrections staff have been trained as Certified Application Counselors (CACs) and assist individuals nearing release with completing the application and explaining the benefits.

Enrollment for Individuals in Other Areas of the Justice System

The study states also have initiatives to connect individuals in other areas of the justice system to coverage, including those on probation and parole. Community supervision arrangements account for 70% of the justice-involved population and nearly all jurisdictions have more individuals under community supervision than in jail or prison.9  As such, connections with individuals under community supervision provide important opportunities to enroll individuals into health coverage.  In Connecticut, every person sentenced to probation from court is screened for Medicaid. If they are not already enrolled, a new application is initiated with the probation officer. Once complete, the applications are scanned and sent to DSS, where a dedicated eligibility worker enters them into the system and a determination is made. The Judicial Branch funds one eligibility position at DSS to process these applications. Currently over 400 probation officers are involved in this process. Massachusetts has trained parole officers as CACs, and they assist with completing applications. In addition to enrollment efforts through adult probation offices, Arizona also recently began working to enroll individuals who are awaiting trial into coverage.

Connecting Individuals to Care in the Community

Beyond connecting individuals to coverage, efforts to connect individuals to care in the community upon release are important for supporting their reintegration and enabling them to address their health needs. Each of the three study states has various initiatives underway to establish connections to care in the community.

Arizona

Arizona’s care coordination efforts currently are focused on people with serious mental illness and complex health needs. Beginning as many as 180 days prior to release, a release planner is notified of an individual’s upcoming release. In cases where the individual has a serious mental illness diagnosis, a connection is then established with one of the state’s Regional Behavioral Health Authorities (RBHAs) to initiate the planning and care coordination process. A liaison from the RBHA works with staff at the correctional facility to help ensure the individual completes their Medicaid application as well as a care coordination form that identifies conditions. The RBHA liaison then provides necessary treatment referrals, schedules appointments, and ensures that the individual has a supply of medications upon release. Stakeholders noted that one challenge they face in coordinating care is that correctional facilities are scattered throughout the state, and where an individual is incarcerated may not necessarily be the same area as where they will reside after release. To address this challenge, the state has tried to release individuals with higher needs closer to Phoenix and Tucson, where the majority of the population is concentrated.

Among the broader population being released, individuals are provided a 30 day medication supply. In addition, the pharmacy system will show individuals enrolled in Medicaid prior to release as having active Medicaid coverage within 24-48 hours of release, enabling them to fill prescriptions at community pharmacies if necessary.

Looking ahead, the state plans to have managed care plans play a similar role as the RBHAs in coordinating care for physical health needs. The state is amending contract language with each health plan to require increased care coordination for individuals as they transition out of jails and prisons. Plans will be required to connect with individuals with complex health needs prior to release to establish appointments and connect them to care in the community. The state is also developing plan performance measures in this area. The goal is to have all plans in progress with this effort by October 2016. In addition, the state is working closely with the RBHAs and managed care plans to establish clinics that will be collocated within probation and parole offices.

Connecticut

Beginning 60-90 days prior to release, Discharge Planners begin working with people who have identified physical and mental health needs to coordinate care. Connecticut has implemented a detailed screening process to identify inmates with health issues. Discharge Planners work with individuals who have identified health needs to coordinate medical and mental health appointments, identify community providers, connect individuals to a local community health center, and provide 30-day prescriptions and prescription drug vouchers to ensure they have immediate access to required medications upon release. These discharge planning services are included as part of the contract with the DOC medical care vendor. The contract requires the vendor to have discharge planners in all correctional facilities.

The Department of Public Health also funds a program that provides release planning for people diagnosed with HIV. As part of this program, 90 days prior to release, case managers from outside of the facilities meet with individuals to connect them to care in the community and make sure they will have all their medications available upon release.

Re-entry Counselors work with individuals without identified health needs. Re-Entry Counselors help ensure that individuals have complete Medicaid applications but provide less personalized care coordination than Discharge Planners. For example, they may hold group pre-release planning sessions.

Probation officers also provide health education. Individuals are required to report to their probation officer within ten business days of sentencing if the sentence does not include a term of incarceration, providing an opportunity to discuss health care. In addition to assisting with enrollment if needed, probation officers provide education on the importance of Medicaid coverage and how to use coverage. The probation department developed FAQs to assist with these efforts.

Building off of a pilot that was launched in 2010, individuals are provided a voucher to obtain up to 30 days of prescription drugs from a community pharmacy. This helps ensure that individuals can obtain a supply of medications without being dependent upon what the facility has on hand at the time an individual is released.

Massachusetts

Since 2013, the DOC in Massachusetts has utilized its medical vendor to provide patient education and continuity of care for individuals being released. Re-entry counselors help individuals make appointments with providers, ensure appropriate placements in care facilities as needed, and provide referrals to social services. If individuals already have a provider in the community, re-entry staff help to reconnect them to that provider or similar care. Individuals receive a paper copy of their medical record upon their release. If a community provider needs a copy of a patient’s medical record, the provider can contact DOC and obtain information with the patient’s permission. The state also provides individuals with a supply of medication upon release and a prescription. In addition, the state has a Recovery Support Navigator program designed to help address the opioid epidemic by providing targeted care coordination assistance to people with substance use disorders as they transition back to the community (Box 4).

Box 4: Recovery Support Navigator Program in Massachusetts

Originally funded through a grant from the state Attorney General’s Office and expanded through the Massachusetts Bureau of Substance Abuse Services, Massachusetts provides reentry support for individuals receiving Medication Assisted Treatment (MAT) for substance use. The program matches individuals preparing for release from state prison with Recovery Support Navigators, who are trained to provide non-clinical peer support services. The Navigator ensures that the person connects with an outpatient treatment program within 24 hours of release and maintains contact for a year to provide ongoing support. Since it began two years ago, the program has enrolled 229 participants, exceeding its initial goal of 150 enrollees. More than 100 participants have accessed MAT in the community and 100% report having had all their reentry needs addressed through this program.10 

Experiences to Date and Lessons Learned

Impacts on Individuals, Administration, and Budgets

The study states’ enrollment efforts have increased coverage among individuals moving into and out of the justice system. Facilitating enrollment through multiple pathways is key for reaching people at different points within the justice system, including when they enter the system, during incarceration, prior to release, and when under community supervision. Connecticut reports that about 60% of the incarcerated population is enrolled in Medicaid upon release, either through reinstatement of suspended coverage or through the pre-release enrollment process. In Massachusetts, over 70% of individuals released from prison in Fiscal Year 2015 had a MassHealth application submitted, and over three-quarters of submitted applications were approved.11  (Most individuals who did not have an application submitted were already enrolled.) Arizona’s enrollment efforts have reached a smaller share of the total incarcerated population, since they have been targeted to those with serious mental illness and complex health needs. The state plans to expand enrollment efforts to the broader incarcerated population, including individuals with a substance use disorder. However, as the state broadens its focus, the volume of individuals to reach may be challenging since approximately 120,000 inmates are released each year from county jails and state prisons. To expand its capacity to reach individuals, the state is making changes to its eligibility system to support more pre-release applications being submitted online. In addition, because of the state’s robust suspension process, there are fewer individuals that need to be newly enrolled prior to release.

Anecdotal experiences and data suggest that the study states’ initiatives have facilitated access to care for individuals as they transition back to the community. Stakeholders reported that coverage and care coordination initiatives support greater access to health services in the community for newly released individuals, particularly with respect to behavioral health services. Research from Connecticut found that individuals who were enrolled in Medicaid prior to release connected to outpatient care more quickly than those that were not pre-enrolled.12  They also used more outpatient care and had reduced use of inpatient care.13  However, there were no significant differences in their number of visits to the emergency room, and they were more likely to use the emergency room than those that were not pre-enrolled.14  Data from Massachusetts show that, among former prisoners that had Medicaid coverage in the year after their release, 84% used any covered service, including nearly half (47%) who had a behavioral health visit.15  Moreover, more than half of those who had a medical or behavioral health visit were seen within the first 60 days post release.16 

The enrollment initiatives have contributed to gains in administrative efficiencies and state savings. In Arizona, implementation of suspension policies reduced state costs by avoiding capitation payments to managed care plans while individuals are incarcerated.  The state reports $30 million in avoided capitation payments in Fiscal Year 2015. In Massachusetts, the jails and prisons have realized savings as a result of receiving federal Medicaid funds for inpatient care provided to incarcerated individuals. The state DOC estimates that, since it initiated these efforts in July 2015, it has offset more than $4.2 million in costs for inpatient care provided to prisoners at private hospitals. Massachusetts anticipates that these savings will continue to increase, since the state will soon begin to claim reimbursement for inpatient care provided in the state hospital that serves a large share of inmates. In Connecticut, gains in Medicaid coverage among the probation population have led to savings for the state’s Judicial Branch, allowing them to increase capacity of other services that do not qualify for Medicaid reimbursement. Stakeholders in the study states also pointed to administrative savings and efficiencies. For example, they indicated that suspension policies have reduced the volume of applications that need to be processed for individuals who receive inpatient care while incarcerated as well as prior to release.

There remains very limited data how these efforts impact criminal justice outcomes, including recidivism rates. Research in Connecticut found that individuals enrolled in Medicaid prior to release had more days in the community prior to re-incarceration compared to those that were not pre-enrolled. However, overall, there is a lack of data on the impact of these initiatives on criminal justice outcomes. Stakeholders universally agreed that more research is needed for increased understanding of how connections to coverage and care among this population are impacting their health and broader criminal justice outcomes, including recidivism rates, over time.

Remaining Enrollment and Access Barriers

Even with multiple enrollment efforts in place, some subsets of individuals remain difficult to reach. In particular, stakeholders commented that it is difficult to reach the jail population because a large share of the population moves in and out of custody quickly and their release dates are often unpredictable. Stakeholders in Massachusetts indicate that working with the parole board is helpful for reaching cases in which there is a quick turnaround and the facility does not have adequate time to assist the individual with enrollment before release.

System limitations remain a key challenge to enrollment efforts. Although states have significantly upgraded or launched new modernized Medicaid eligibility systems as part of implementation of the ACA, due to coding and other system limitations, the three study states rely on workarounds or manual processes for some of their enrollment efforts targeted to justice-involved populations. For example, all three case study states primarily rely on paper applications for pre-release enrollment efforts. In addition, some of the smaller counties in Arizona have not implemented suspension due to limits in their system functionalities that would make it difficult to transfer information to Medicaid. Moreover, Connecticut and Massachusetts use manual processes to reactivate people from suspension status upon release. Because of the manual process, there are some cases in which individuals are released without their coverage being reactivated. The states are planning for continued system modifications to make the pre-release enrollment efforts and suspense processes more automated in the future.

Establishing connections with individuals early is key for facilitating connections to community care, but individuals face a range of challenges to accessing care even with support. All three study states initiate care coordination efforts prior to individuals being released back to the community. However, stakeholders noted that individuals face many barriers to care even with this support. They indicated that health care is one of many competing priorities for newly released individuals. They often have many requirements to meet associated with parole/probation and more pressing needs that take priority over health care. Stakeholders stressed the importance of meeting people where they are to address their priority needs and recognizing that health care is one piece of interrelated issues, including housing, food, and employment. Stakeholders also pointed to the importance of finding culturally competent providers in the community and noted that discrimination among providers against people with a criminal history can present a barrier to care. Community health workers with a shared history of incarceration can play a key role in overcoming these barriers, as seen in the Transitions Clinic program, which has two locations in Connecticut (Box 5).

Box 5: Using Community Health Workers to Overcome Barriers to Access to Care at the Transitions Clinics in Connecticut

The Transitions Clinic Network (TCN) is a national network of medical homes for individuals with chronic diseases recently released from prison. The network is comprised of 14 clinics in several states, including 2 locations in Connecticut. Each clinic that adopts the Transitions Clinic Program employs a community health worker with a history of incarceration as part of the clinical team. This shared history facilitates their ability to develop trusted relationship with individuals that are reentering the community. The community health workers establish connections with individuals prior to release to initiate initial appointments at the clinic and play a key role as part of the health care team post-release by helping individuals engage in health care services and connect to broader supports to address social determinants of health.

Sharing information between jails and prisons and community providers remains a challenge, but the study states are working to improve this coordination. Stakeholders noted that continued reliance on paper processes and medical charts limits the ability to share information from jails and prisons to community providers. For example, in Connecticut, the DOC utilizes a paper chart and medical records often do not get passed on to community providers. The DOC recently purchased an electronic health record and is currently in the design phase of implementation. Similarly, work is underway in Arizona to connect the DOC and jails to the state’s health information exchange, and the DOC recently implemented an electronic health record.

Operations and Implementation

Approaches and challenges vary based on the structure and organization of the state correctional system. For example, Connecticut has a unified state correctional system in which the state oversees both the state prisons and jails. As such, the state can implement statewide approaches that will reach all of its state prisons and jails through a single agency. In contrast, Arizona and Massachusetts have state run prisons, but the jails are overseen at the county level. As such statewide initiatives in these states require coordination across counties. Moreover, the organizational relationship across the state agencies, including DOC and jail systems, Medicaid, Departments of Health and mental health agencies also varies across states and impacts how states approach enrollment and care connection efforts.

Initiatives in the study states started with a focus on targeted, high-need populations and have gradually expanded over time. For example, Arizona began its efforts focused on the seriously mentally ill population and individuals with complex health needs and has expanded to broader populations over time. Similarly, Connecticut’s efforts began back in the early 2000’s under a federally-funded grant that supported work by the mental health agency and Medicaid agency to connect individuals with serious mental illness to coverage and have broadened significantly over time. Massachusetts’ work in this area began as a small pilot program to keep people connected to coverage and has expanded to a statewide effort. Stakeholders indicated that starting with smaller, focused efforts provided an opportunity to launch initiatives with more limited staff and financial resources and to work through challenges before broadening the scope of efforts and investment of resources.

Leadership and collaboration is key for supporting successful initiatives. Stakeholders unanimously pointed to the importance of strong leadership for driving policy, process, and operational changes to support these efforts. For example, Arizona selected justice as one of three topic areas for its Statewide Innovation Model grant, which has helped raised the profile of the state’s work in this area. In addition, the Governor announced in his “State of the State” address that reducing recidivism is one of his key priorities for the year. In Massachusetts, the Governor and legislative leaders formed a bipartisan working group to explore criminal justice policy reform. Stakeholders also consistently stressed the need for vested interest and commitment from both the Medicaid and Corrections side and the importance of sharing resources across agencies. A strong partnership between the DOC and the state Medicaid agency was consistently noted as key element of each of the study states’ successes.

Consistent and clear communication among stakeholders were also cited as important components of success. In Massachusetts, a statewide task force was established that brought together Medicaid, DOC, and the jails. Stakeholders noted that having the Medicaid agency convene with the jails was key for understanding each jail’s processes and operations and establishing processes that would work within each facility. Connecticut held re-entry roundtables around the state, in which eligibility specialists, discharge planners, community providers and other stakeholders came together to share lessons learned and improve processes. In Arizona, a statewide criminal justice stakeholder group with over 50 participants across the continuum of health and justice meets on a quarterly basis. Stakeholders also pointed to the importance of documenting everyone’s role through written agreements. In Arizona suspension policies are established through Memoranda of Understandings between Medicaid and each county jail, the ADJC, and the Arizona DOC that clarify roles and responsibilities. Similarly, in Connecticut, written agreements are in place between each involved agency that document roles, responsibilities, and funding of positions.

Recognizing that this is a long-term effort is important for maintaining ongoing support. Stakeholders noted that these are complex initiatives that require coordination across multiple agencies as well as system upgrades and modifications to facilitate new processes. They noted it is important to enter into these efforts recognizing that success does not happen overnight and sometimes multiple approaches are needed to address the many moving parts of the system.

Conclusion

The three case study states profiled in this brief have achieved success enrolling individuals involved with the justice system into Medicaid and facilitating their connections to care in the community, particularly for individuals with significant health needs. Supported by strong leadership, commitment, and close collaboration across agencies, the initiatives in these states have led to increased coverage, facilitated access to care, and contributed to gains in administrative efficiencies and state savings. However, more research is needed to understand effects on broader criminal justice outcomes, including recidivism rates. Even with these successful efforts, there remain barriers to enrollment and access among the justice-involved population. The study states are working to address many of these barriers as they continue to expand and refine their efforts moving forward.

This brief was prepared by Jennifer Ryan, Lucy Pagel and Katy Smali with Harbage Consulting and Samantha Artiga, Robin Rudowitz and Alexandra Gates with the Kaiser Family Foundation. The authors extend their appreciation to all the participants for sharing their time and perspectives to inform this project.

Endnotes

  1. National Institute of Corrections, “Solicitation for a Cooperative Agreement—Evaluating Early Access to Medicaid as a Reentry Strategy,” Federal Register 76, no. 129 (2011): 39438-39443; Ingrid Binswanger, Nicole Redmiond, and LeRoi Hicks, “Health Disparities and the Criminal Justice System: An Agenda for Further Research and Action,” Journal of Urban Health 89, no. 1 (2012): 98–107; and Laura Maruschak, Medical Problems of Prisoners (Washington, DC: US Department of Justice, Office of Justice Programs, Bureau of Justice Statistics, April 2008), http://www.bjs.gov/content/pub/pdf/mpp.pdf. ↩︎
  2. Doris James and Lauren Glaze, Mental Health Problems of Prison and Jail Inmates, (Washington, DC: US Department of Justice, Office of Justice Programs, Bureau of Justice Statistics, September 2006), http://www.bjs.gov/content/pub/pdf/mhppji.pdf ↩︎
  3. Centers for Medicare and Medicaid Services, To facilitate successful re-entry for individuals transitioning from incarceration to their communities, State Health Official Letter SHO #16-007, (Baltimore, MD: Centers for Medicare and Medicaid Services, April 2016),  https://www.medicaid.gov/federal-policy-guidance/downloads/sho16007.pdf ↩︎
  4. Catherin McKee, Sarah Somers, Samantha Artiga, and Alexandra Gates, State Medicaid Eligibility Policies for Individuals Moving Into and Out of Incarceration, (Washington, DC: Kaiser Commission on Medicaid and the Uninsured, August 2016), https://modern.kff.org/report-section/state-medicaid-eligibility-policies-for-individuals-moving-into-and-out-of-incarceration-issue-brief/ ↩︎
  5. Unpublished data from a national survey conducted by the Kaiser Commission on Medicaid and the Uninsured with the Georgetown University Center for Children and Families, 2016. ↩︎
  6. Governor Cuomo Marks National Re-Entry Week by Seeking to Expand Medical Coverage for Individuals Leaving Incarceration, (Albany, NY: New York Governor’s Office, April 2016), https://www.governor.ny.gov/news/governor-cuomo-marks-national-re-entry-week-seeking-expand-medical-coverage-individuals-leaving and, Maryland HealthChoice Section 1115 Waiver Renewal Application, (Baltimore, MD: Maryland Department of Health and Mental Hygiene), https://mmcp.dhmh.maryland.gov/Documents/1115%20HealthChoice%20Waiver%20Final%20Draft%20V2%204.29.16.pdf ↩︎
  7. HB2701, Budget Reconciliation 2016-2017, (Arizona 2016) http://www.azleg.gov/DocumentsForBill.asp?Bill_Number=hb2701&Session_Id=115 ↩︎
  8. County partners with state, nonprofits to help inmates get care before release, Mesa Independent, March 31, 2016, http://mesaindependent.com/maricopa-county/maricopa-county-helping-inmates-get-health-care-before-release/ ↩︎
  9. Danielle Kaeble, Lauren Glaze, Anastasios Tsoutis, and Todd Minton, Correctional Populations in the United States, 2014 (Washington, DC: U.S. Department of Justice, January 2016), http://www.bjs.gov/content/pub/pdf/cpus14.pdf. ↩︎
  10. Spectrum’s Recovery Support Navigator Program Changes Lives, Spectrum Health Systems, March 2016, http://www.spectrumhealthsystems.org/2015/spectrum-s-recovery-support-navigator-program-changes-lives ↩︎
  11. Massachusetts Department of Correction Performance and Outcome Measurements, Fiscal Year 2015. ↩︎
  12. Hsiu-Ju Lin, Linda Frisman, and Coleen Gallagher, Expedited Medicaid Restoration in Connecticut, American Public Health Association Annual Meeting, Boston, MA, November 2013. ↩︎
  13. Ibid. ↩︎
  14. Ibid. ↩︎
  15. Paul Kirby, Warren Ferguson, and Ann Lawthers, Post-Release MassHealth Utilization, Center for Health Policy and Research, University of Massachusetts Medical School. ↩︎
  16. Ibid. ↩︎
Puerto Rico: Datos Básicos

Published: May 26, 2016
Indicadores seleccionados sobre Puerto Rico, comparados con los 50 estados y DC
 Puerto Rico50 estados y DC
Población total (2014)1 3,522,000314,896,000
Cambio porcentual desde 20062 -10%+7%
Características demográficas (2014)3 
Ciudadanos nacidos en EE.UU.97%87%
Identficados como hispanos99%17%
Mayores de 65 años17%14%
Por debajo del 100% FPL46%15%
Cobertura de salud (2014)4 
Cubiertos por ESI/Compra directa34%59%
Cubiertos por Medicaid/CHIP49%19%
Cubiertos por Medicare o Military11%10%
Sin seguro6%12%
Estadísticas económicas
Ingreso medio del hogar (2014)$18,9285 $53,6576 
Tasa de desempleo ajustada estacionalmente (marzo 2016)7 12%5%
Estadísticas de salud
Adultos que reportan en general buena/pobre salud (2014)8 35%18%
Casos de enfermedad por el virus del zika adquiridos localmente (desde mayo de 2016)9 6690
Tasa de diagnósticos de VIH por cada 100,000 habitantes (2014)10 22.716.5
Tasa de mortalidad infantil por cada 100,000 niños nacidos vivos (2013)11 7.16.0
Reglas federales del Medicaid12 
Tasa de participación federalFijada al 55%Rangos de 50 al 83% basados en el ingreso per cápita en el estado
Fondos federales

Limitados a $321 millones en el año fiscal 2014

Sin límites
  • Puerto Rico, un territorio de Estados Unidos, está ubicado en el Caribe. Los puertorriqueños son ciudadanos nacidos en Estados Unidos.
  • Las deudas de Puerto Rico ascienden a $73 mil millones, o aproximadamente 2.5 veces el tamaño del presupuesto para el año fiscal 2016 propuesto por el gobernador.13  Un proyecto de ley está pendiente en el Congreso de Estados Unidos para reestructurar la deuda de Puerto Rico.
  • El Affordable Care Act (ACA) proveyó a Puerto Rico de dos fuentes de fondos para el Medicaid además de la asignación anual cubierta. La primera es una asignación de $5.5 mil millones para usar entre 2011 y 2019. En el año fiscal 2014, los fondos del ACA representaron el 71% del total de la financiación del Medicaid para el territorio, y Puerto Rico había usado 42% de los $5.5 mil millones. La segunda fuente de fondos es una asignación de $925 millones que la isla recibió en lugar de crear su propio mercado de seguros. Estos fondos están disponibles hasta el año fiscal 2019, después que los $5.5 mil millones se hayan agotado.14 
  • El zika plantea un reto de salud pública, y financiero, para Puerto Rico. El número de casos ha aumentado de forma constante desde que se confirmara el primero en la isla en diciembre de 2015.15 
  • La crisis financiera de Puerto Rico ha añadido presión a un sistema de atención de salud ya tenso. Los informes noticiosos describen la escasez de electricidad y agua en hospitales, retrasos en el acceso a los suministros críticos, y la emigración de los médicos.16 ,17 ,18 
  1. Kaiser Family Foundation analysis of U.S. Census Bureau, 2014 American Community Survey, 1-Year estimates. ↩︎
  2. Kaiser Family Foundation analysis of U.S. Census Bureau, 2006 and 2014 American Community Survey, 1-Year estimates. ↩︎
  3. Kaiser Family Foundation analysis of U.S. Census Bureau, 2014 American Community Survey, 1-Year estimates. ↩︎
  4. Ibid. ↩︎
  5. U.S. Census Bureau; American Community Survey, 2014 American Community Survey 1-Year Estimates, Table S1903; generated by Alexandra Gates and Melissa Majerol; using American FactFinder; http://factfinder2.census.gov; (16 February 2016). ↩︎
  6. Ibid. ↩︎
  7. Bureau of Labor Statistics, “Regional and State Employment and Unemployment,” March 2016, http://www.bls.gov/news.release/laus.toc.htm. ↩︎
  8. KFF analysis of CDC, Behavioral Risk Factor Surveillance System, 2014. ↩︎
  9. CDC, Zika virus disease in the United States, 2015-2016, as of May 11, 2016, http://www.cdc.gov/zika/geo/united-states.html. ↩︎
  10. CDC, National Center for HIV/AIDS, Viral Hepatitis, STD, and TB Prevention (NCHHSTP) Atlas, 2014. ↩︎
  11. Mathews TJ, MacDorman MF, Thoma ME, Infant Mortality Statistics from the 2013 period linked birth/infant death data set. National vital statistics reports; vol 64 no 9. Hyatsville, MD: National Center for Health Statistics, 2015. ↩︎
  12. Congressional Research Service, “Puerto Rico and Health Care Finance: Frequently Asked Questions,” Feb 2016. ↩︎
  13. The Governor’s proposed buget for all funds in FY 2016 was $28.8 billion.  For more information see the Governor’s budget at: Commonwealth of Puerto Rico Office of Management and Budget, Proposed 2015-2016, http://www2.pr.gov/presupuestos/presupuesto2015-2016/Pages/default.aspx. ↩︎
  14. Congressional Research Service, “Puerto Rico and Health Care Finance: Frequently Asked Questions,” Feb 2016. ↩︎
  15. CDC, Zika virus disease in the United States, 2015-2016, as of May 11, 2016, http://www.cdc.gov/zika/geo/united-states.html. ↩︎
  16. Vann R. Newkirk II, “Will Puerto Rico’s Debt Crisis Spark a Humanitarian Disaster?” The Atlantic, (May 9, 2016), http://www.theatlantic.com/politics/archive/2016/05/puerto-rico-treasury-visit/482562/. ↩︎
  17. Lizette Alvarez and Abby Goodnough, “Puerto Ricans Brace for Crisis in Health Care,” New York Times (August 2, 2015), http://www.nytimes.com/2015/08/03/us/health-providers-brace-for-more-cuts-to-medicare-in-puerto-rico.html. ↩︎
  18. Nick Timiraos, “Treasury Secretary Jacob Lew Tours Puerto Rico to Urge Action in Congress,” Wall Street Journal (May 9, 2016), http://www.wsj.com/articles/treasury-secretary-jacob-lew-tours-puerto-rico-to-urge-action-in-congress-1462814534. ↩︎
News Release

Survey Finds Most Marketplace Enrollees Like Their Coverage, Though Satisfaction with Premiums and Deductibles Has Declined Since 2014

Most Say They are Satisfied with Their Plan’s Doctor and Hospital Networks

Published: May 20, 2016

Following the Affordable Care Act’s (ACA) third open enrollment period, a new Kaiser Family Foundation survey of people who buy their own health insurance finds most marketplace enrollees give their coverage good marks, though concerns about premiums, deductibles, and other costs have risen since 2014.

The survey, the third in a series, finds about two thirds (68%) of marketplace customers rate their current coverage as either “excellent” or “good.” Although concerns about narrow network plans have been in the news, large shares of marketplace enrollees say they are satisfied with their plan’s networks, including their choice of hospitals (75%), primary care doctors (74%), and specialists (59%).

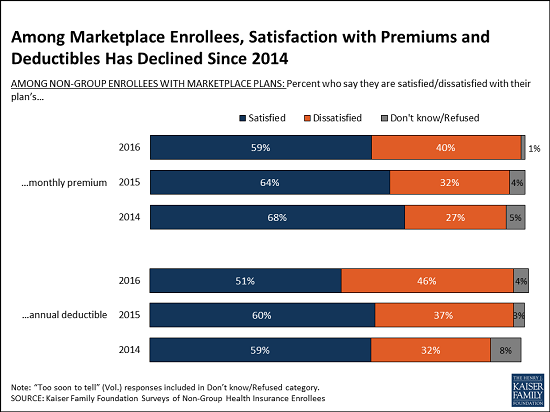
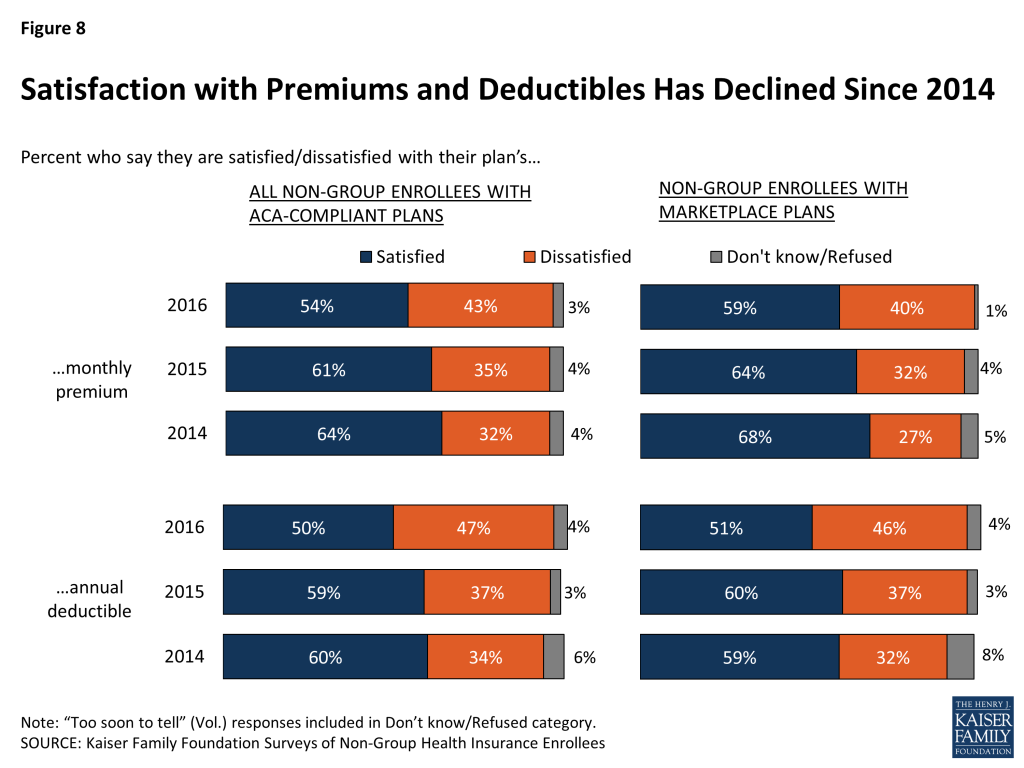
About six in 10 also say they are satisfied with their plan’s premium (59%), and half say the same about their deductible (51%).  At the same time, about four in ten express dissatisfaction with their premium (40%) and deductible (46%). Since 2014, the share saying they are satisfied with their plan’s premiums and deductibles has declined, while the share saying that they are dissatisfied has increased.

2nd_chart_for_release_v3_tff.png

Perhaps as a result, marketplace enrollees are now split when asked about their plan’s value for what they pay, with about half (48%) saying their plan provides “excellent” or “good” value, and the other half (51%) giving it low marks. That split represents a shift from the previous two years, when nearly six in 10 gave high marks and fewer than four in 10 gave low ones.

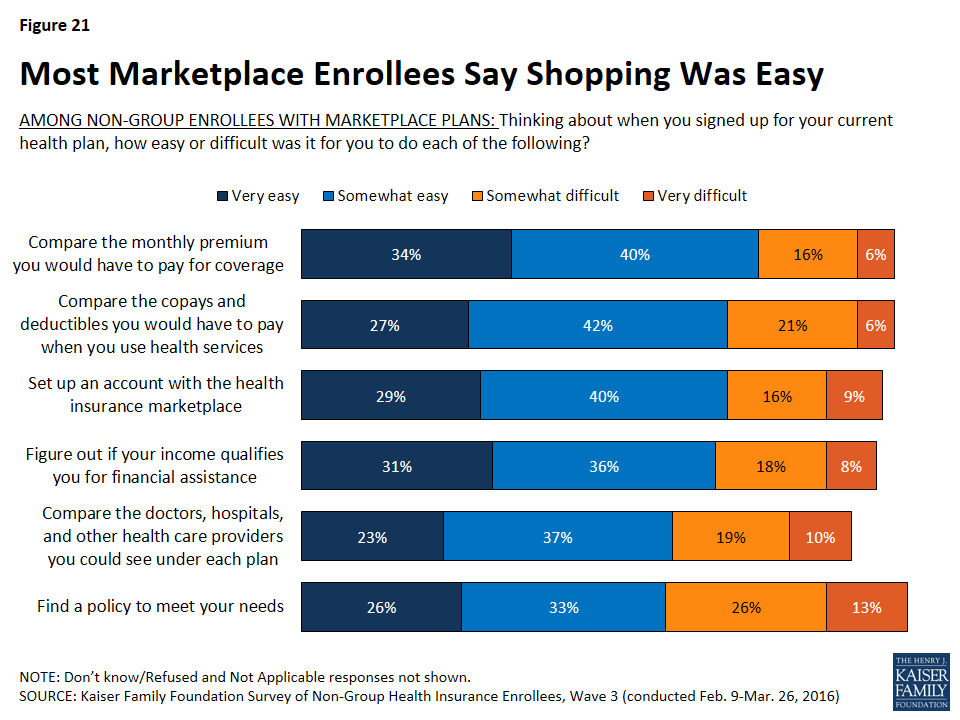
The survey also reveals a generally positive shopping experience for marketplace enrollees. Most say that it was easy for them to compare premiums (74%), cost-sharing (69%), and provider networks (61%), and to find a plan that met their needs (59%). Fewer say it was difficult to set up an account this year than said so in 2014.

The survey is the third in a series exploring the experiences and perceptions of people who purchase their own health insurance, the group perhaps most affected by the ACA’s reforms to the individual insurance market and tax subsidies to make such coverage more affordable.

Similar trends are affecting people with employer coverage, a group that is generally better off economically. An annual survey of employer health benefits finds workers face rising deductibles, while other Kaiser polls reveal those with employer coverage are somewhat less satisfied than in the past.

Conducted during a period of shakeout in the marketplaces, the new survey includes people in plans that meet all of the ACA’s requirements for coverage and benefits, whether sold inside or outside the federal and state marketplaces, as well as the small share who remain in older non-compliant plans that often do not meet all the law’s requirements. The report includes findings about enrollees in all ACA-compliant plans.

The survey was designed and analyzed by researchers at the Foundation. Telephone interviews were conducted from February 9 through March 26, among a nationally-representative random sample of 786 adults ages 18-64 who purchase their own insurance (293 via landline and 493 via cell phone), including 512 with marketplace plans. Fieldwork was carried out in English and Spanish by SSRS, an independent research company. The margin of sampling error is plus or minus 5 percentage points for those in marketplace plans. For other subgroups, the margin of sampling error may be higher.

Poll Finding

Survey of Non-Group Health Insurance Enrollees, Wave 3

Authors: Liz Hamel, Jamie Firth, Larry Levitt, Gary Claxton, and Mollyann Brodie
Published: May 20, 2016

Findings

Introduction

This survey is the third in a series that seeks to shed light on the experiences and opinions of those purchasing their own health insurance in the non-group market. The Affordable Care Act (ACA) has had a significant impact on this group, through new rules that standardized benefits and guaranteed coverage for those with pre-existing conditions, and through the establishment of income-based federal financial assistance to those buying insurance through new health insurance Exchanges or Marketplaces created by the law.

Starting on January 1st, 2014, all newly purchased non-group coverage has had to follow new rules under the ACA (i.e. “ACA-compliant”). This survey, conducted February 9 – March 26, 2016, after the close of the law’s third open enrollment period, focuses on individuals who purchased ACA-compliant coverage, whether inside or outside of a Marketplace. The survey also includes individuals who are currently enrolled in “non-ACA compliant” plans (those purchased before March 2010 that were grandfathered in and those purchased before October 2013 that were allowed to continue under a federal transition policy at the discretion of states and insurers); however, few people remain in non-compliant plans and the sample size does not allow their results to be reported separately.1 

This report details findings from the latest survey and draws trends and comparisons using data from the first and second surveys in the series, conducted at the end of each of the previous enrollment periods in 2014 and 2015. It also draws some comparisons to the experiences and opinions of people with employer-sponsored insurance through data collected on a separate series of surveys, the Kaiser Health Tracking Polls.2 

Key Findings

Basic Demographics of the Non-Group Market

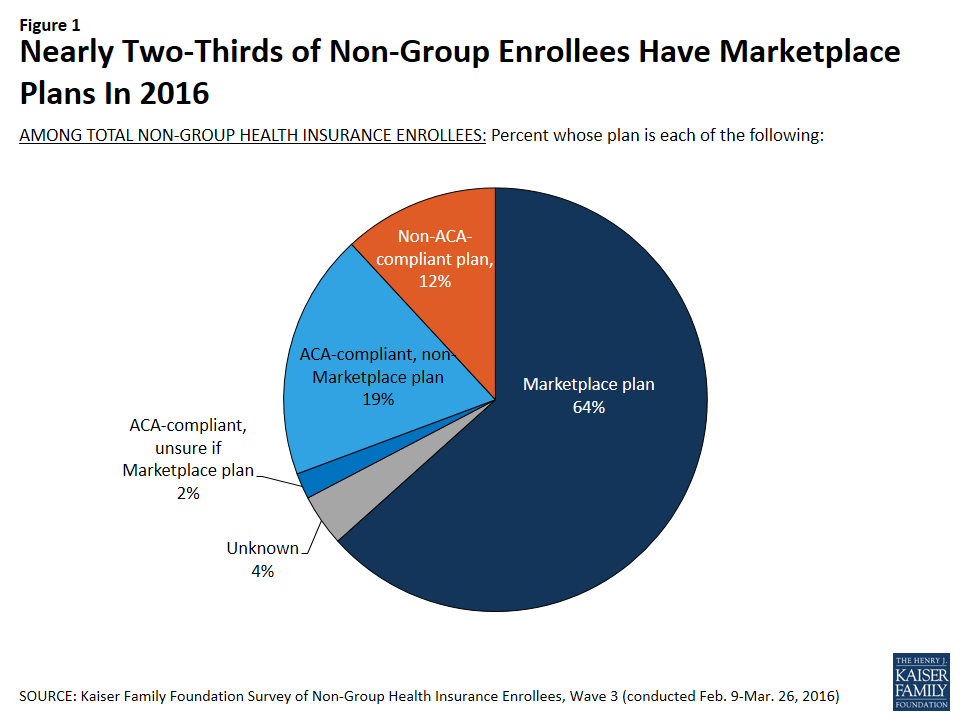
Looking at the non-group market as a whole, nearly two-thirds of enrollees (64 percent) report being in a Marketplace plan.3  This is similar to the share who had Marketplace plans in 2015 (59 percent) and an increase from 2014 (48 percent). Currently, about one in five enrollees (19 percent) report being in an ACA-compliant, non-Marketplace plan purchased from a broker or insurance company, and 12 percent report having pre-ACA, non-compliant plans.4 

Figure 1: Nearly Two-Thirds of Non-Group Enrollees Have Marketplace Plans In 2016

One concern raised about the ACA’s guarantee of coverage for those with pre-existing conditions was whether enough healthy people would enroll to offset higher claims from less healthy people enrolling in new coverage because insurers could no longer exclude them. The expectation was that sicker people would enroll initially because they were certain they needed coverage, with the hope that an increasing number of healthier people would sign up over time. The share of people who say they are in fair or poor health has been fairly consistent through the first three open enrollment periods, with most changes from year to year within the survey’s margin of sampling error.

Table 1: Self-Reported Health Status of Non-Group Enrollees
In general, would you say your health is excellent, very good, good, fair, or poor?ALL ACA-COMPLIANT PLANSMARKETPLACE PLANS ONLY
201420152016201420152016
NET Excellent/Very good/Good82%85%80%79%85%78%
            Excellent222422212319
            Very good293331273432
            Good312827312827
NET Fair/Poor171520201522
            Fair131115161016
            Poor445446
NOTE: Don’t know/ Refused responses not shown.

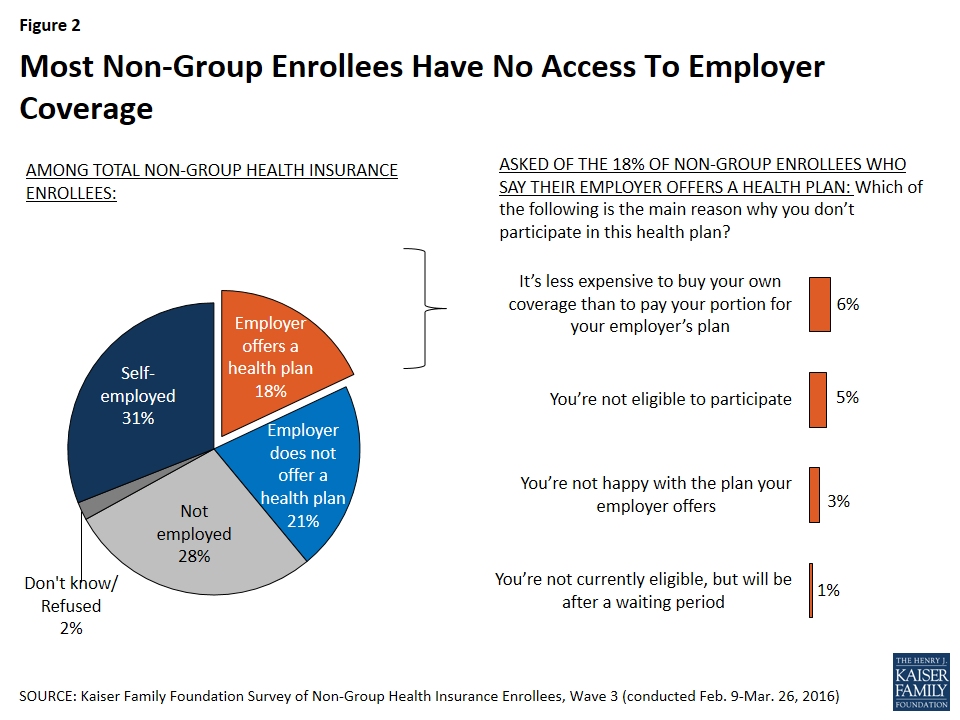
Most individuals with non-group coverage don’t have access to coverage from an employer, either because they are self-employed (31 percent), not employed (28 percent), or their employer does not offer a health plan (21 percent). Among the 18 percent who work for an employer that offers coverage, most are either not eligible to enroll in their employer’s plan (5 percent are not currently eligible and 1 percent are in an eligibility waiting period), or say it’s less expensive to buy their own coverage than to pay the premium for their employer plan (6 percent). Three percent say they’re not happy with the plan their employer offers.

Figure 2: Most Non-Group Enrollees Have No Access To Employer Coverage

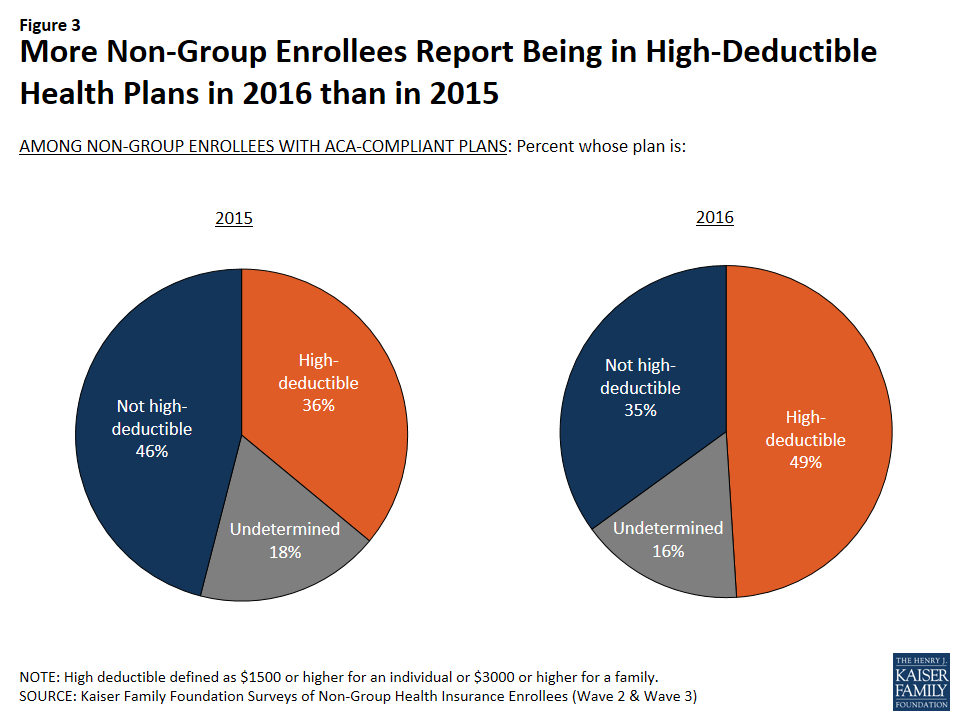
A somewhat higher share of non-group enrollees now report being in plans with high deductibles than did so in 2015. In the current survey, about half (49 percent) of those with ACA-compliant non-group coverage say their plan has an annual individual deductible of at least $1,500 or a family deductible of at least $3,000, up from just over a third (36 percent) last year. Those with Marketplace plans are somewhat less likely to report having a high deductible (46 percent, compared with 61 percent of those in ACA-compliant non-Marketplace plans), likely because many Marketplace enrollees qualify for cost-sharing subsidies that lower their deductible.5 

Figure 3: More Non-Group Enrollees Report Being in High-Deductible Health Plans in 2016 than in 2015

Health Plan Ratings and Satisfaction with Coverage

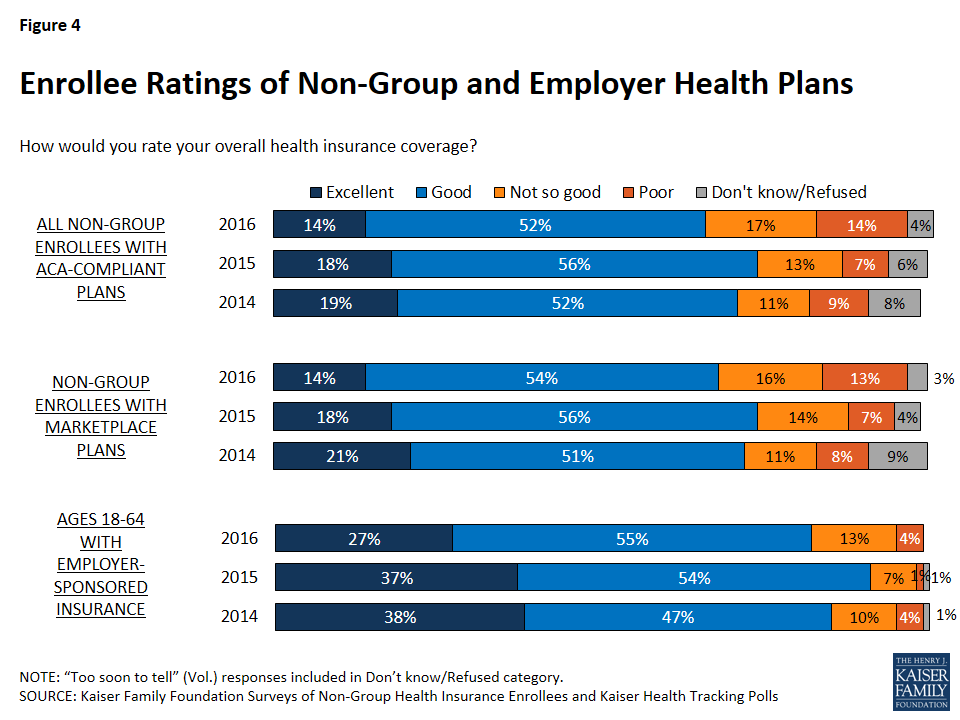
The majority of enrollees in ACA-compliant non-group plans give their overall coverage a positive rating, with 14 percent calling their plan “excellent” and about half (52 percent) saying it is “good.” However, the share rating their coverage as “not so good” or “poor” is higher in 2016 (31 percent) than it was in the two previous waves of the survey (20 percent in 2014 and 21 percent in 2015). Non-group enrollees have consistently given their plans lower ratings than their counterparts in employer-sponsored plans, however among those with employer coverage, the share rating their coverage as “not so good” or “poor” is also higher in 2016 than it was in previous years. It is also notable that those with Marketplace plans are less likely to give their plans low ratings than those with ACA-compliant plans purchased outside the Marketplace (29 percent versus 38 percent).

Figure 4: Enrollee Ratings of Non-Group and Employer Health Plans

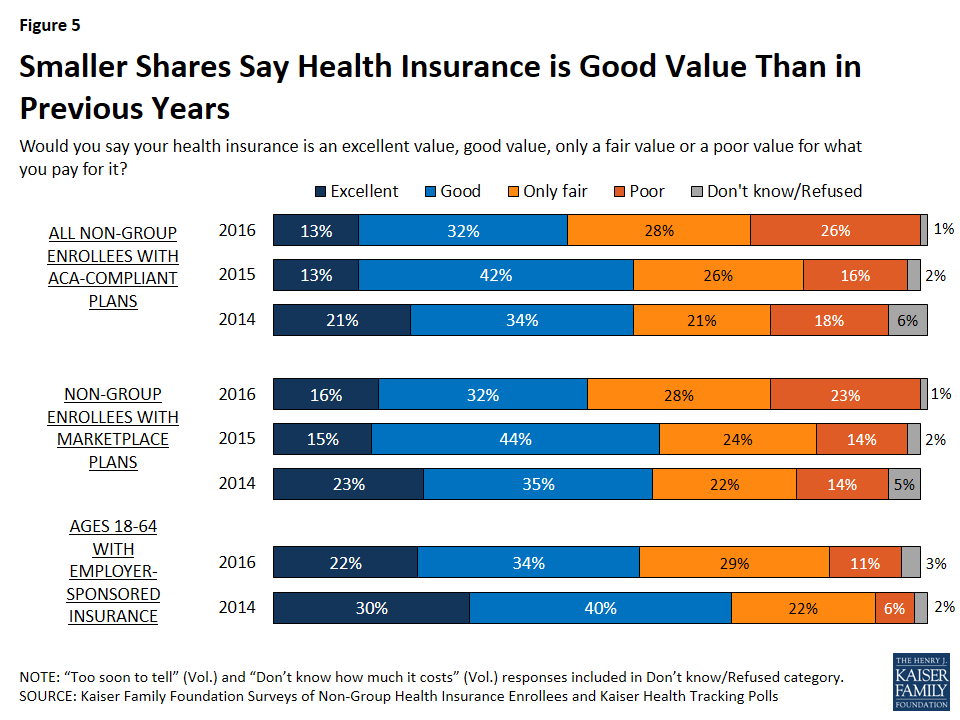
Similar to the trend in overall plan ratings, the current survey finds those with ACA-compliant non-group plans are less likely than in previous years to say their coverage is an “excellent” or “good” value for what they pay for it. Just over half (54 percent) now rate the value of their coverage as “only fair” or “poor” (up from 42 percent in 2015 and 39 percent in 2014). Individuals with Marketplace coverage are more likely to give their plan a positive rating than those with ACA-compliant, non-Marketplace plans (48 percent versus 35 percent). Those with employer-sponsored coverage, who generally pay a lower portion of their premium, are more likely than those with non-group coverage to see their plan as at least a “good” value for the money, but the share of this group saying the value is “only fair” or “poor” has also increased, from 28 percent in 2014 to 40 percent in 2016.

Figure 5: Smaller Shares Say Health Insurance is Good Value Than in Previous Years

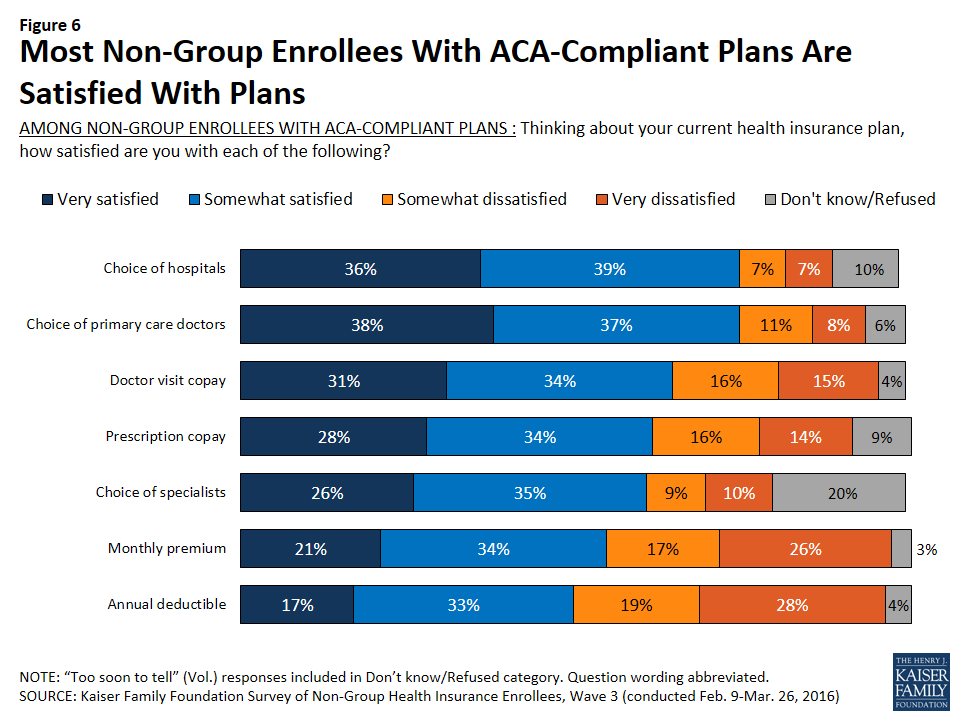
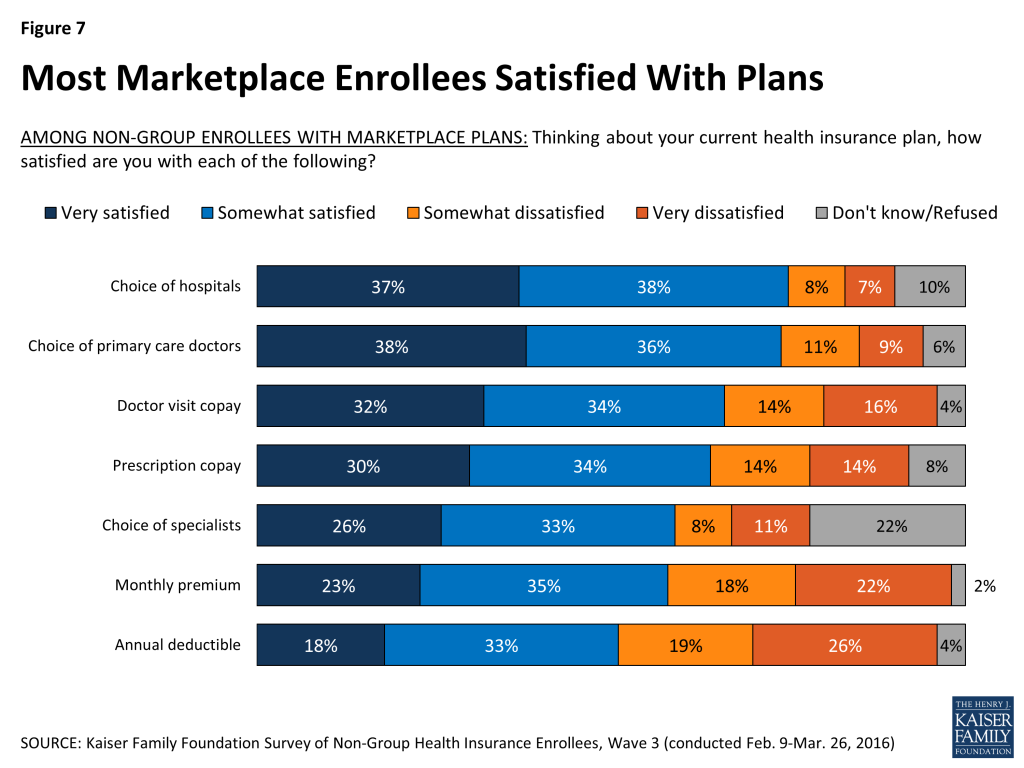
Looking beyond overall plan ratings, most people with ACA-compliant non-group coverage say they are satisfied with various elements of their plans. Despite media coverage of narrowing provider networks, three-quarters of those with ACA-compliant non-group plans say they’re “very” or “somewhat” satisfied with their plan’s choice of hospitals (75 percent) and primary care providers (75 percent), and about six in ten (61 percent) say the same about the choice of specialists. Satisfaction levels are similar when looking just at those enrolled in Marketplace plans.

Figure 6: Most Non-Group Enrollees With ACA-Compliant Plans Are Satisfied With Plans
Figure 7: Most Marketplace Enrollees Satisfied With Plans

A majority of enrollees also say they are satisfied with their plan’s premium (54 percent of all those in ACA-compliant plans and 59 percent of those in Marketplace plans), and about half say the same about their deductible (50 percent of ACA-compliant enrollees and 51 percent of Marketplace enrollees). However, satisfaction with premiums and deductibles has declined since 2014. Nearly half now say they are dissatisfied with their plan’s annual deductible (47 percent among all those ACA-compliant plans and 46 percent in Marketplace plans), and four in ten are dissatisfied with their monthly premium (43 percent and 40 percent, respectively).

Figure 8: Satisfaction with Premiums and Deductibles Has Declined Since 2014

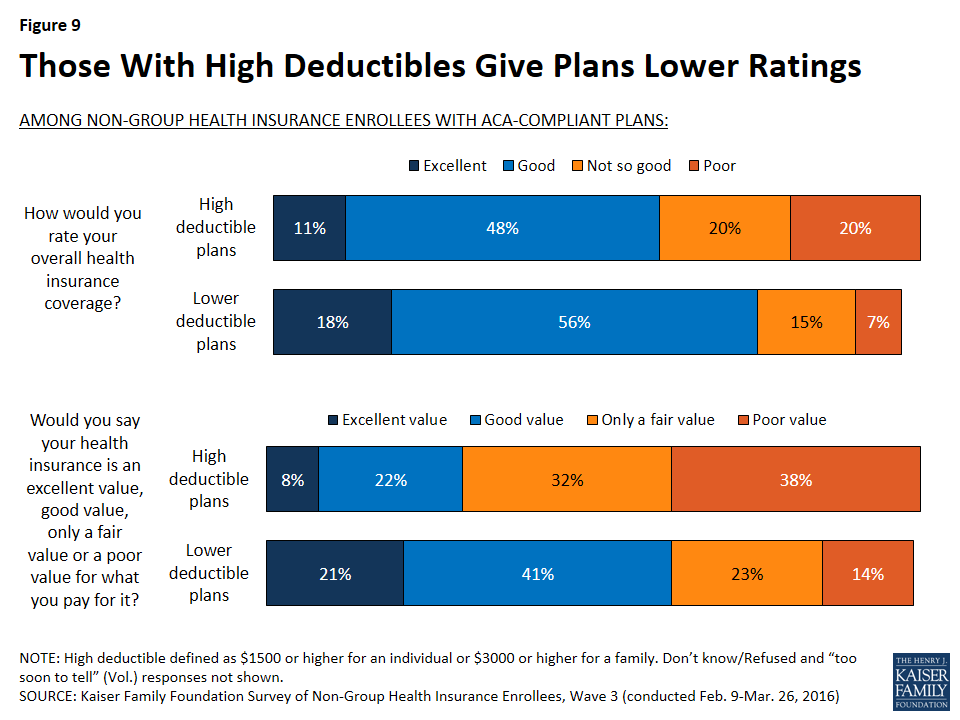
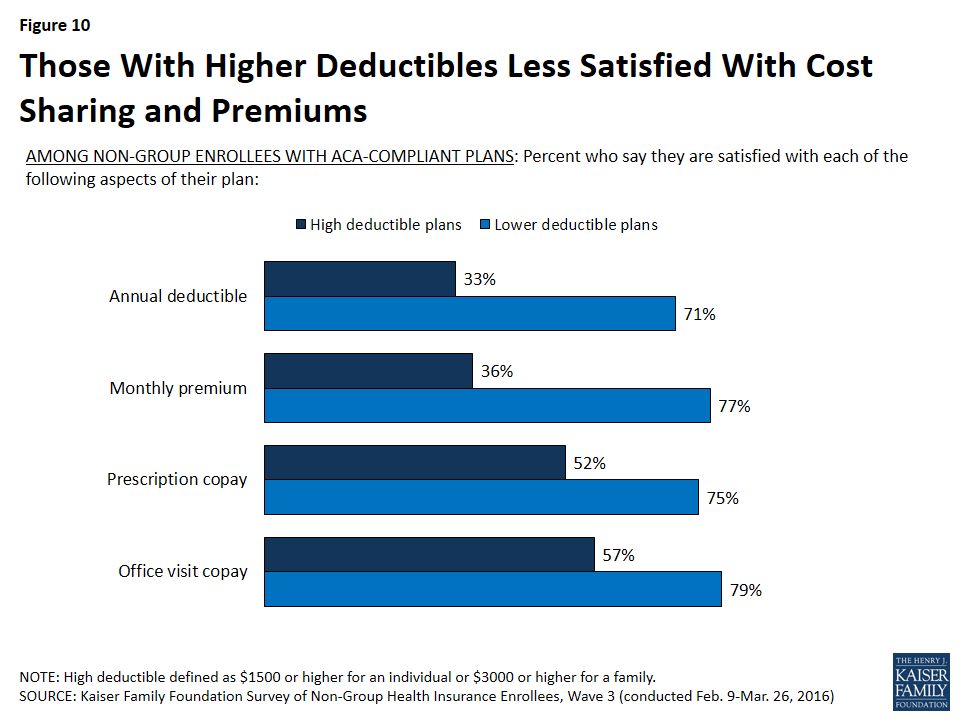
Each of these trends toward more negative ratings of non-group coverage may be related to the fact that more enrollees now report being in high-deductible plans (as noted above, 49 percent of those with ACA-compliant plans now have a high-deductible plan, up from 36 percent in 2015). The latest survey finds that those with high-deductible plans give their coverage lower ratings overall and are less likely than their counterparts in lower-deductible plans to say they are satisfied not only with their deductible, but also with their copays and premiums.

Figure 9: Those With High Deductibles Give Plans Lower Ratings
Figure 10: Those With Higher Deductibles Less Satisfied With Cost Sharing and Premiums

Financial Protection of Health Insurance

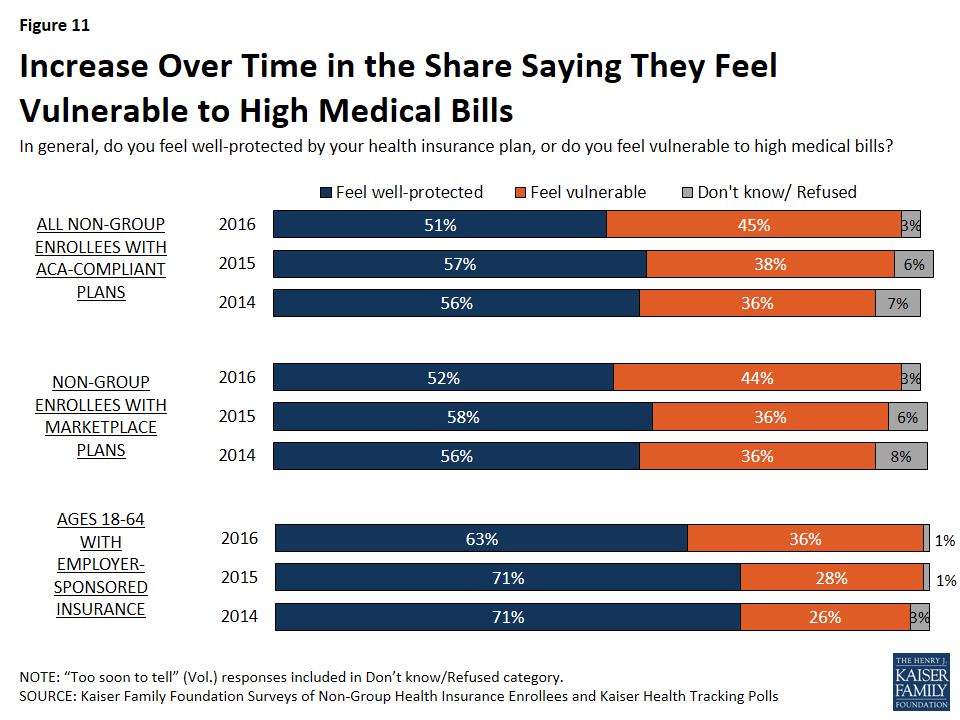
About half (51 percent) of non-group enrollees with ACA-compliant plans say they feel well-protected by their health insurance; however, the share saying they feel vulnerable to high medical bills has risen over the past two years, from 36 percent in 2014 to 45 percent in the current survey. Again, it’s notable that while those with employer coverage are more likely than non-group enrollees with ACA-compliant plans to say they feel well-protected, this group has also seen a similar increase in the share saying they feel vulnerable (from 26 percent in 2014 to 36 percent today).

Figure 11: Increase Over Time in the Share Saying They Feel Vulnerable to High Medical Bills

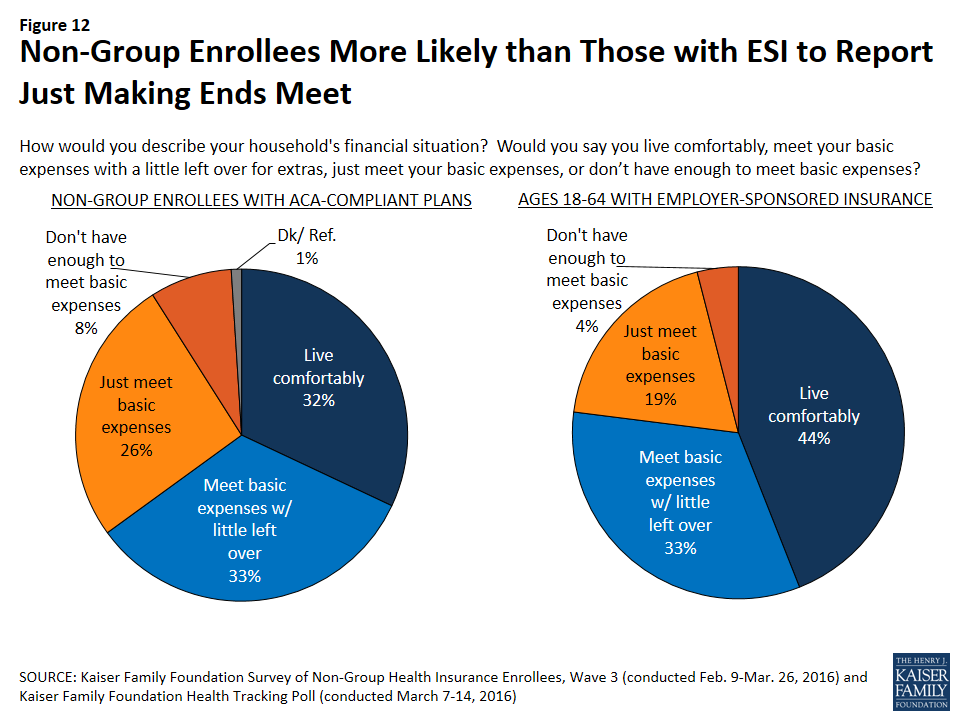
People with ACA-compliant non-group coverage generally report more tenuous financial circumstances than people who get insurance through their jobs. Those with ACA-compliant non-group plans are less likely than those with employer plans to say they “live comfortably” (32 percent versus 44 percent), and more likely to say they either “just meet basic expenses” or “don’t have enough to meet basic expenses” (34 percent versus 23 percent).

Figure 12: Non-Group Enrollees More Likely than Those with ESI to Report Just Making Ends Meet

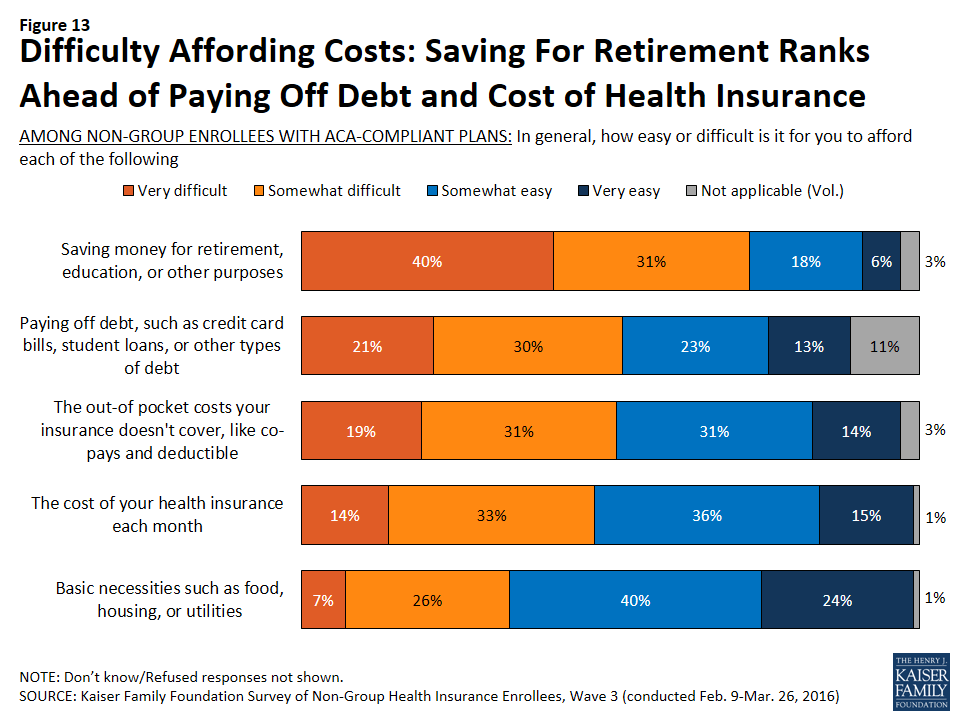
Given this, it’s no surprise that difficulty affording health care costs ranks among several other categories of expenses that non-group enrollees say they find it difficult to afford. Half (50 percent) of those with ACA-compliant plans say it is difficult for them to afford the out-of-pocket health care costs not covered by insurance, and a similar share (46 percent) say it’s difficult to afford their monthly premiums (nearly identical to the 45 percent who said so in 2014). A similar percentage (51 percent) says it is difficult for them to afford paying off debt, while a much larger share (71 percent) reports difficulty saving money for retirement, education, and other purposes. Ranking lower in terms of difficulty, a third (33 percent) say they find it difficult to afford basic necessities like food, housing, and utilities.

Figure 13: Difficulty Affording Costs: Saving For Retirement Ranks Ahead of Paying Off Debt and Cost of Health Insurance

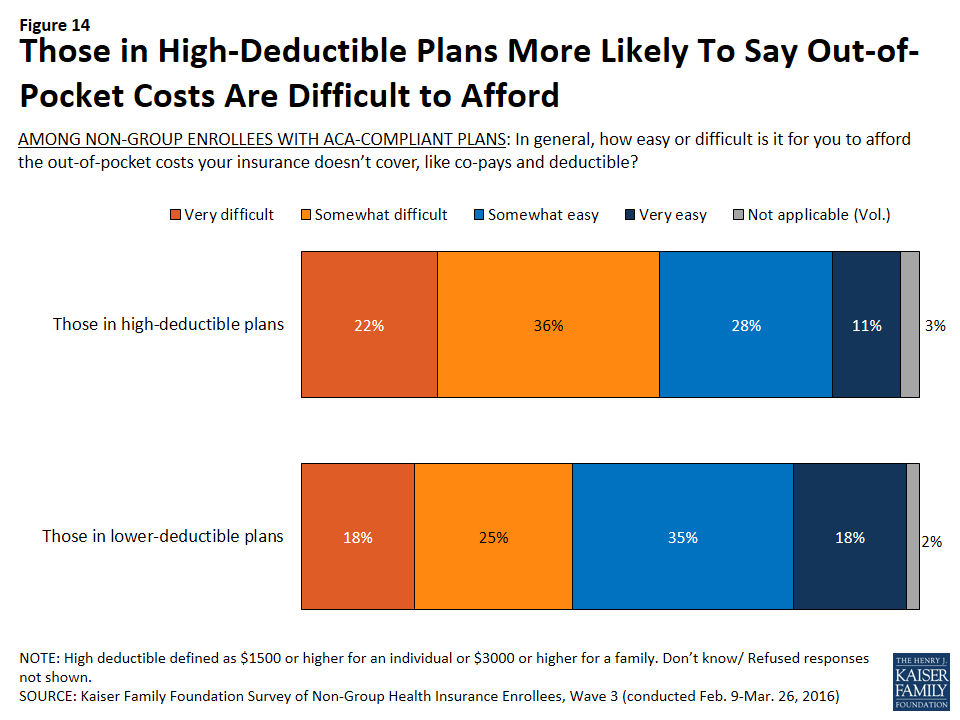
Not surprisingly, those whose plans have higher deductibles are more likely than those with lower deductibles to say it is difficult for them to afford their out-of-pocket health care costs (58 percent versus 43 percent). This is despite the fact that those with high-deductible plans report higher incomes on average than those whose plans have lower deductibles.

Figure 14: Those in High-Deductible Plans More Likely To Say Out-of-Pocket Costs Are Difficult to Afford

Plan Utilization and Reported Problems

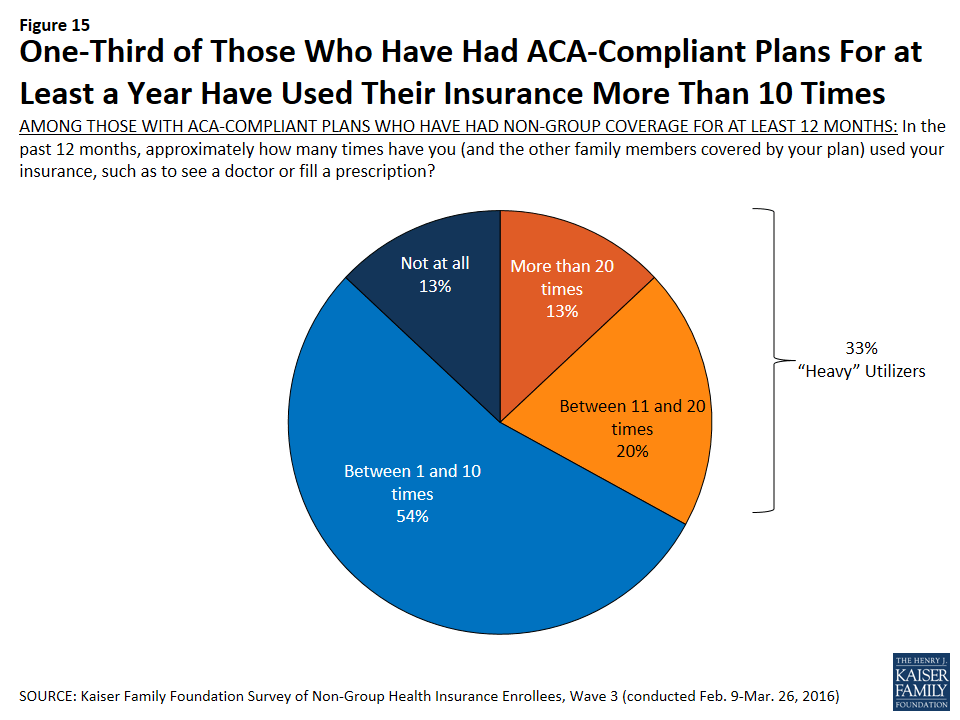
Among those with ACA-compliant plans who’ve had non-group coverage for at least 12 months, a third (33 percent) can be classified as “heavier” utilizers, saying they have used their insurance more than 10 times in the past 12 months to visit a doctor or fill a prescription. Most enrollees (54 percent) say they’ve used their plans between 1 and 10 times, and 13 percent say they haven’t used their plans at all.

Figure 15: One-Third of Those Who Have Had ACA-Compliant Plans For at Least a Year Have Used Their Insurance More Than 10 Times

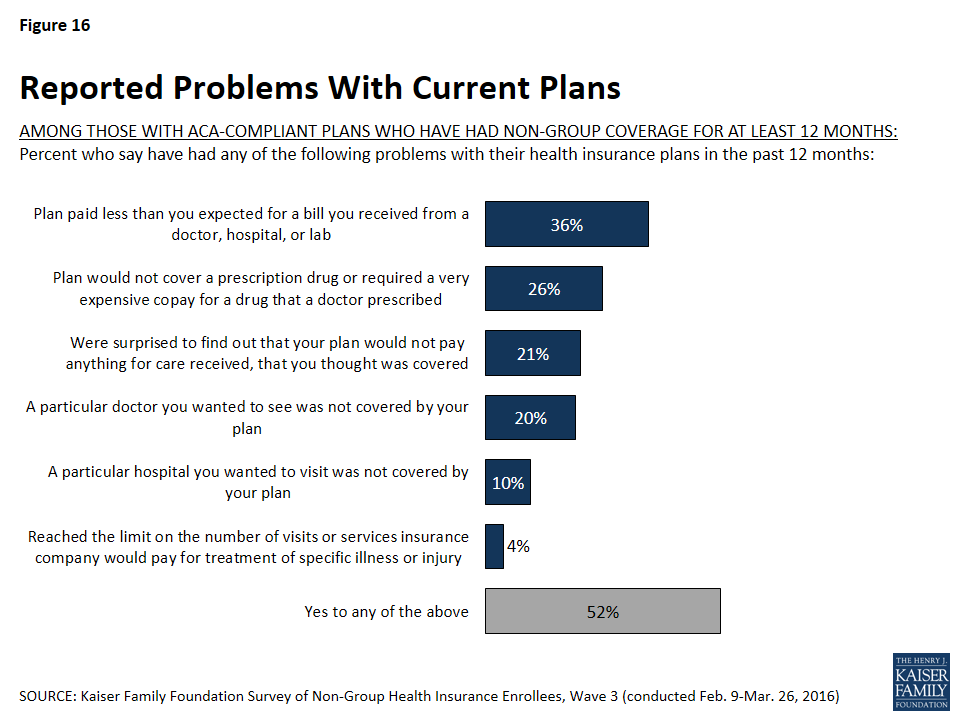
Among those who’ve had ACA-compliant non-group coverage for at least a year, many report having problems with their plans. Most commonly, just over a third (36 percent) say their plan paid less than they expected for a bill, about a quarter (26 percent) say their plan wouldn’t cover or required a very expensive copay for a drug prescribed by their doctor, one in five (21 percent) say they were surprised to find their plan wouldn’t pay anything for care they thought was covered, and a similar share (20 percent) say that a particular doctor they wanted to see wasn’t covered by their plan. Fewer say they wanted to visit a hospital that wasn’t covered (10 percent) or that they reached the limit on what their insurance would pay for treatment of a specific illness or injury (4 percent). About half (52 percent) report having at least one of these problems.

Figure 16: Reported Problems With Current Plans

Those who are heavier utilizers of health insurance are more likely than their counterparts to report some of these problems, including their plan paying less than they expected for a bill (47 percent versus 31 percent), their plan not covering a prescription or requiring a very expensive copay (37 percent versus 20 percent). Heavy utilizers are also more likely to report problems paying medical bills in the past 12 months (31 percent versus 16 percent).

Table 2: Heavy Utilizers More Likely to Report Problems With Their Plans Than Light Utilizers
AMONG THOSE WITH ACA-COMPLIANT PLANS WHO HAVE HAD NON-GROUP COVERAGE FOR AT LEAST 12 MONTHS: Percent who say:TotalHeavy UtilizersLight Utilizers
Their plan paid less than they expected for a medical bill36%47%31%
Their plan would not cover or required a very expensive copay for a prescription drug prescribed by a doctor263720
They have had problems paying medical bills in the past 12 months213116
NOTE: “Heavy utilizers” are classified as those who say they have used their insurance more than 10 times in the past 12 months

In addition to problems with their plans, one in five (20 percent) of those who’ve had ACA-compliant coverage for at least a year say there was a time in the last 12 months when they or another family member covered by their plan needed medical care but did not get it because of the cost. Nearly as many (16 percent) say there was a time in the past year when they did not fill a prescription because of the cost.

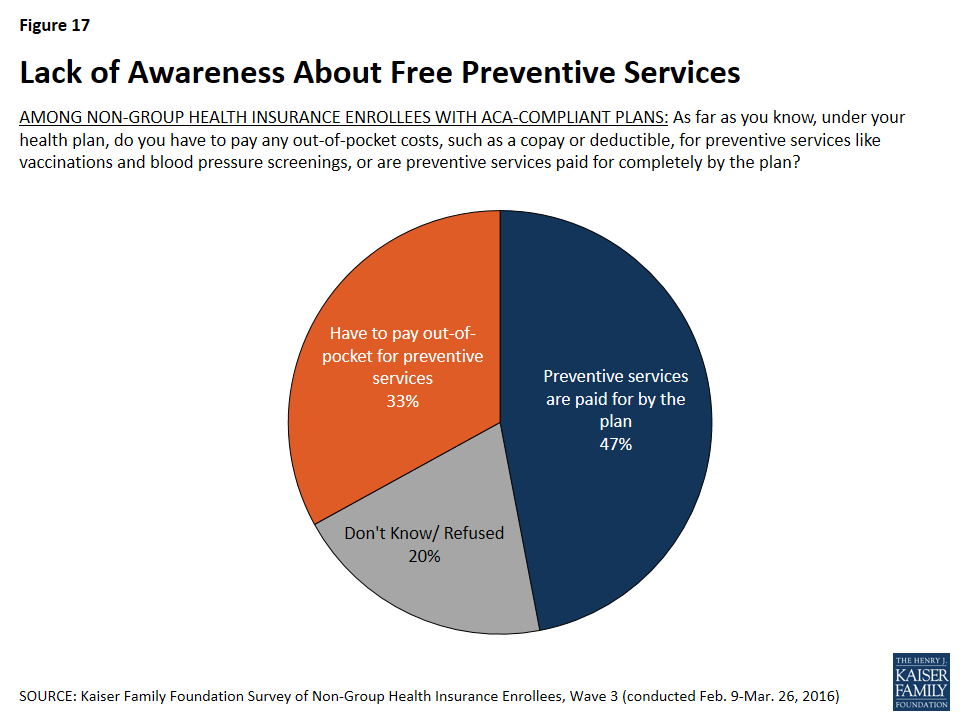
The survey also finds a lack of awareness about new rules for coverage introduced by the ACA. Among all those with ACA-compliant coverage, fewer than half (47 percent) know that preventive services are covered completely by their plans, while a third (33 percent) think that copays or deductibles apply to preventive services and one in five (20 percent) are not sure. Among those in high-deductible plans, awareness is even lower: 41 know that preventive services are covered with no cost-sharing.

Figure 17: Lack of Awareness About Free Preventive Services

Health Plan Switching

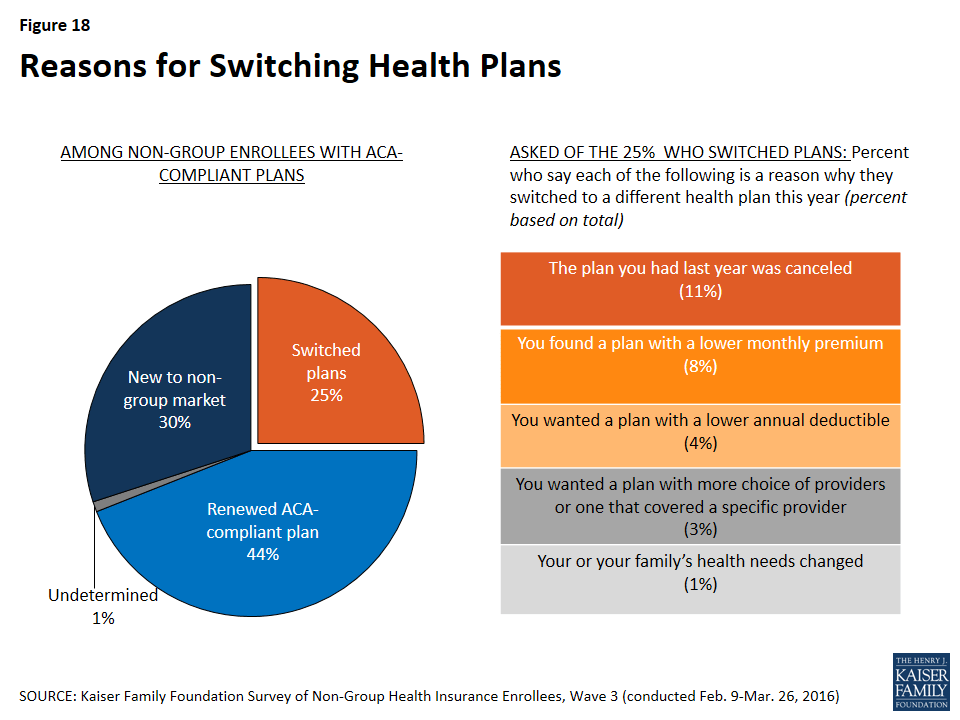
Looking at all those with ACA-compliant non-group plans, three in ten (30 percent) are new to the non-group market this year, and 44 percent report renewing a 2015 plan. Twenty-five percent of all those in ACA-compliant plans, and 23 percent of those in Marketplace plans, say they chose a new plan in the latest open enrollment period.6 

Most of those who switched plans either said the plan they had last year was cancelled (11 percent of all those with ACA-compliant plans) or that they found a plan with a lower monthly premium than they would have had to pay to renew their existing plan (8 percent). Smaller shares said they wanted a plan with a lower deductible (4 percent) or that they wanted a plan with a broader choice of providers or one that covered a specific provider (3 percent).

Figure 18: Reasons for Switching Health Plans

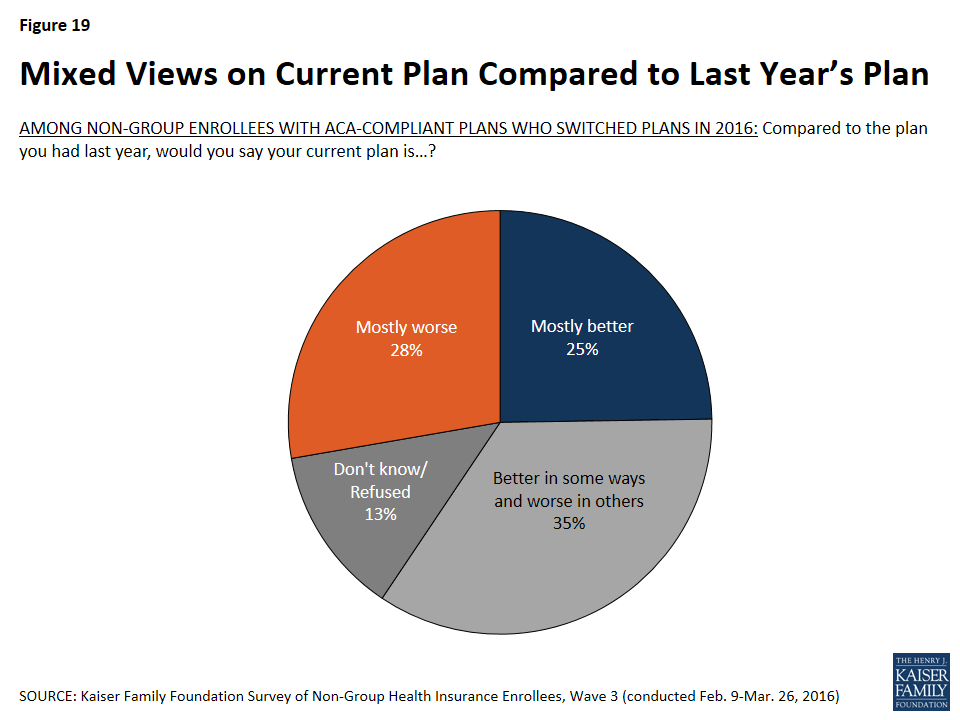
Among those who switched plans in the most recent enrollment period, there is not an overwhelming consensus that their new plan is better or worse than their old plan. Roughly equal shares say their new plan is better (25 percent) and worse (28 percent), with about a third saying it is better in some ways and worse in others (35 percent).

Figure 19: Mixed Views on Current Plan Compared to Last Year’s Plan

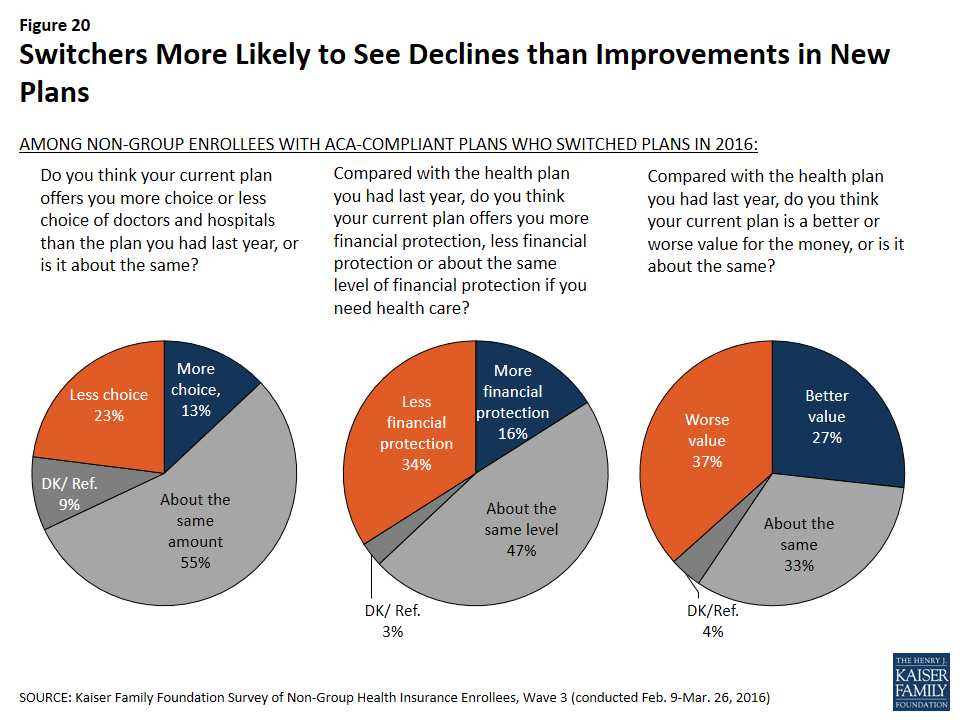
Similarly, large shares of plan switchers say their new plan is about the same as their old plan in terms of the choice of doctors and hospitals (55 percent) and the level of financial protection offered by the plan (47 percent). However, the share saying their new plan is worse on each of these measures is larger than the share saying it’s better: 23 percent say their new plan offers less choice of providers compared with 13 percent who say it offers more choice, and 34 percent say their new plan provides less financial protection compared with 16 percent who say it provides more. The picture is also mixed but tilting negative on value for the money: one-third say their new plan offers about the same value for the money as their old plan, but more see their plan as a worse value (37 percent) than a better one (27 percent).

Figure 20: Switchers More Likely to See Declines than Improvements in New Plans

Experiences with Shopping and Renewing Coverage

Among those with Marketplace coverage, most say that when they were shopping for their current plan, it was easy to compare premiums, cost-sharing, and provider networks, and to find a policy to meet their needs. While most measures of the shopping experience are similar to 2015, among those with Marketplace plans, the share saying it was difficult to set up an account with the marketplace decreased from 34 percent in 2014 to 25 percent this year.

Figure 21: Most Marketplace Enrollees Say Shopping Was Easy

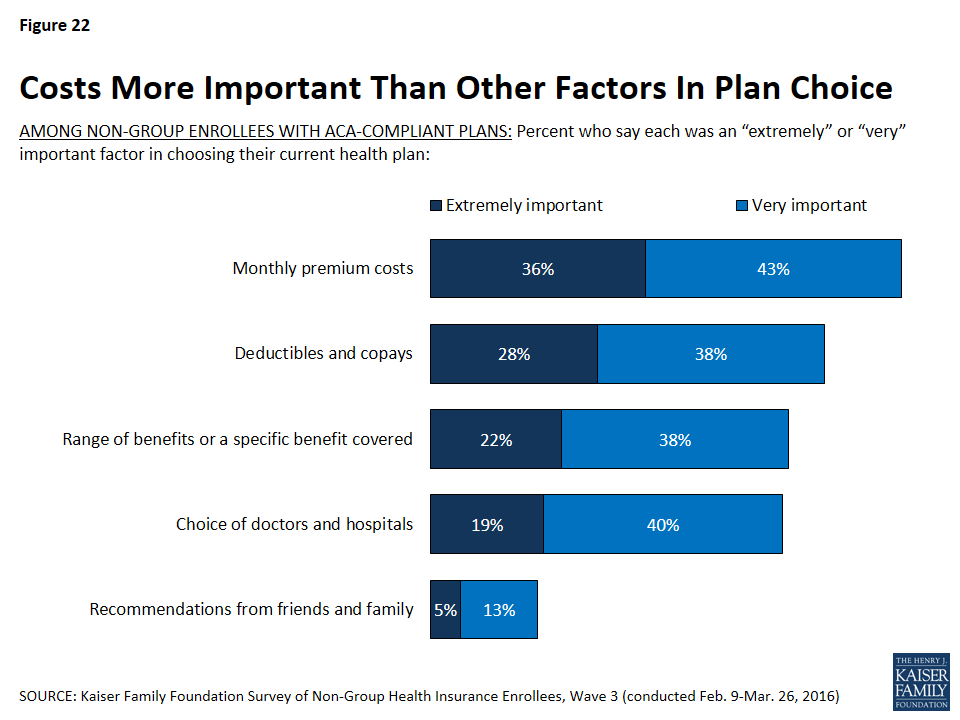
When asked about the most important factors in choosing a plan, non-group enrollees in ACA compliant plans are more likely to cite costs than other factors. The monthly premium cost of the plan (36 percent) was rated most frequently as an “extremely important” factor in plan choice, followed by the amount of deductibles and copays (28 percent). About one in five each said the range of benefits covered (22 percent) and the choice of doctors and hospitals (19 percent) were “extremely important” factors, while very few (5 percent) said the same about recommendations from friends and family.

Figure 22: Costs More Important Than Other Factors In Plan Choice

Among those with ACA-compliant plans, four in ten (39 percent) say they got help with the enrollment or renewal process this year, while about six in ten (59 percent) either auto-renewed or completed the process on their own. These rates are similar to 2015, when 44 percent reported getting help with the enrollment process. Those who are new to the non-group market this year and those who switched plans for 2016 are more likely to say they got help with the enrollment process than those who renewed a 2015 plan (45 percent, 55 percent, and 27 percent respectively). Among all those who got help with enrollment, the most frequently-reported source of assistance was health insurance brokers or agents (15 percent, including 34 percent of those who switched plans), followed by navigators and other enrollment assistance programs (8 percent), family members or friends (7 percent), and health plan representatives (6 percent).

Table 3: About Four in Ten Non-Group Enrollees Report Getting Help With Enrollment Process
TotalNew to non-group marketSwitched plans for 2016Renewed 2015 plan
Someone helped you39%45%55%27%
Health insurance broker/agent1514346
Navigator/enrollment assistance program81176
Family member/friend7876
Health plan representative6656
Community/county health worker12<11
Someone else3323
Completed the process on your own57534566
Auto-renewed (Vol.)24
Don’t know/Refused2212

Opinions of the Affordable Care Act Among Those with Non-group Coverage

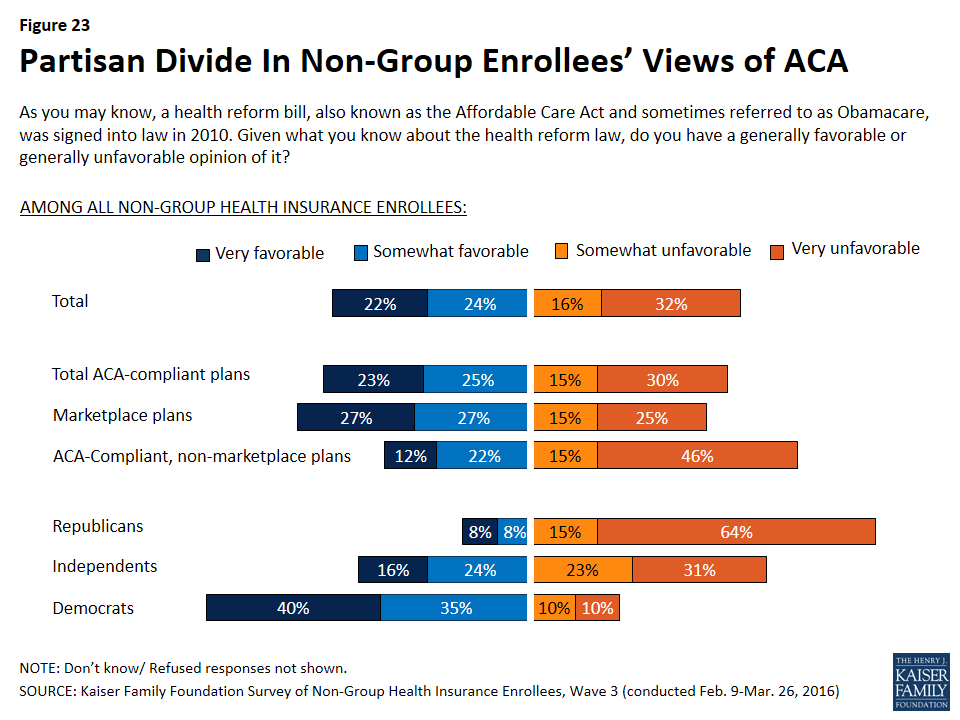
As in previous waves of the survey, and as is true among the general population, overall views of the Affordable Care Act among those with non-group coverage are largely divided, with 46 percent saying they have a favorable view of the law and 48 percent unfavorable. Even among this population – whose views one might expect to be divided more on the basis of experience – the biggest differences in opinion are along partisan lines, with 75 percent of Democrats having a favorable view of the law, 79 percent of Republicans expressing an unfavorable view, and independents divided (40 percent favorable, 44 percent unfavorable). Those with Marketplace coverage are more likely to have a favorable view of the law than those with ACA-compliant, non-Marketplace coverage (54 percent versus 34 percent).

Figure 23: Partisan Divide In Non-Group Enrollees’ Views of ACA

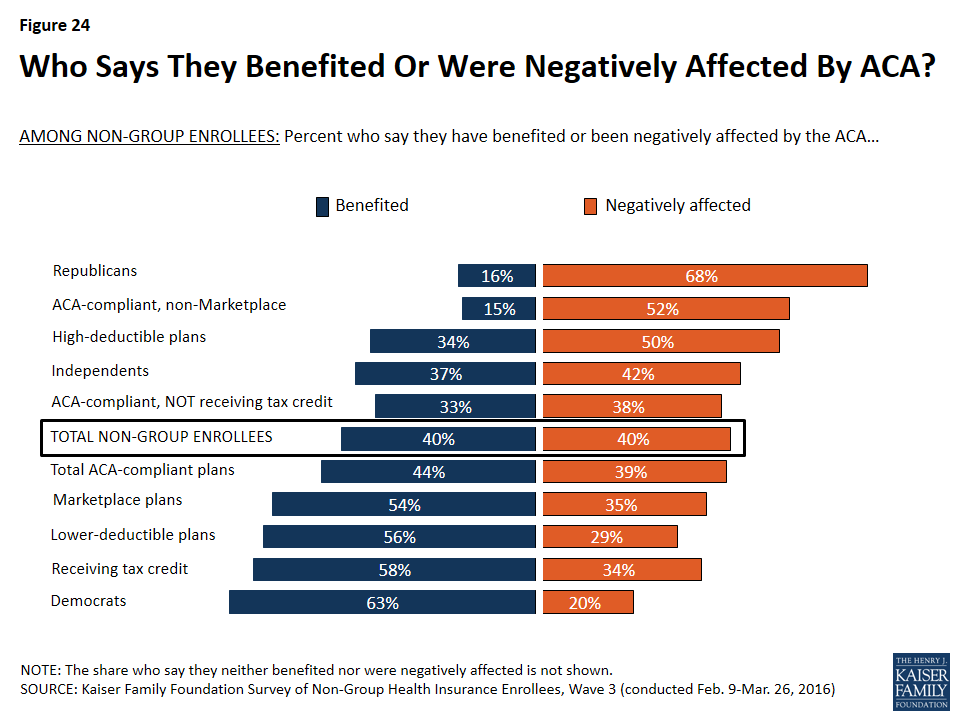
When non-group enrollees overall (including those in both ACA-compliant and non-compliant plans) are asked how they feel the ACA has affected them personally, equal shares say they’ve benefited from the law and been negatively affected by it (40 percent each). The share feeling they’ve benefited from the law is the same as in 2015, but the share feeling they’ve been negatively impacted is up 7 percentage points from 33 percent last year. Similar to last year, the largest divide in how people feel the law has impacted them is partisan, with Democrats overwhelmingly feeling they’ve benefited and Republicans overwhelmingly feeling they’ve been negatively affected. Other differences are evident, too: those in lower-deductible plans, those in Marketplace plans, and those who report getting a tax credit to help pay their premium are more likely to feel they’ve benefited from the law, while those in higher-deductible plans, those not receiving a tax credit, and those with non-Marketplace plans are more likely to feel they’ve been negatively affected.

Figure 24: Who Says They Benefited Or Were Negatively Affected By ACA?

Discussion

The ACA significantly transformed the non-group insurance market, making it accessible to people who are sick and more affordable for people with lower incomes. Now in its third year of implementation, the ACA has led to substantial increases in non-group enrollment, with 12.7 million people signing up in the recent open enrollment period for 2016. However, enrollment growth appears to be slowing, raising concerns about the potential to attract additional healthy people to the insurance risk pool.7 

This series of three surveys of non-group enrollees under the ACA reveals the gains that have been made and the challenges that still remain.

The process for signing up in the Marketplaces is generally seen as easy, and has improved since the early technical problems. Enrollees are largely satisfied with their coverage, including the choice of doctors and hospitals, which is typically narrower than in employer-sponsored health plans. And, many enrollees have been shopping for coverage and switching plans to save money.

At the same time, the share of enrollees who see their plan as a good value has been declining, reflecting growing dissatisfaction with premiums and cost-sharing. Some enrollees who have had their plan for a year or more report expensive drug copays, as well as surprise medical bills and other unexpected expenses they thought their plan covered.

These are important signals to track to identify potential gaps in consumer understanding of how their plans work and the adequacy and transparency of coverage. These trends also could affect the potential for Marketplaces to attract new enrollees – particularly people who are currently healthy – and retain existing consumers.

Methodology

The Kaiser Family Foundation (KFF) Survey of Non-Group Health Insurance Enrollees is the third in a series of surveys examining the views and experiences of people who purchase their own health insurance, including those whose coverage was purchased through a state or federal Health Insurance Marketplace and those who bought coverage outside the Marketplaces. The survey was designed and analyzed by researchers at KFF. Social Science Research Solutions (SSRS) collaborated with KFF researchers on sample design and weighting, and supervised the fieldwork. KFF paid for all costs associated with the survey.

The survey was conducted by telephone from February 9 through March 26, 2016 among a random sample of 786 adult U.S. residents who purchase their own insurance. Computer-assisted telephone interviews conducted by landline (293) and cell phone (493 including 302 who had no landline telephone) were carried out in English and Spanish by SSRS. Respondents were considered eligible for the survey if they met the following criteria:

  • Between the ages of 18-64
  • Currently covered by health insurance that they purchase themselves or purchased insurance that would begin in the next month
  • Not covered by health insurance through an employer, COBRA, Medicare, Medicaid, a parent’s plan, or the U.S. military or VA
  • If a small business owner, the health insurance they purchase is only for themselves and/or their family, and does not cover non-related employees of their business

Because the study targeted a low-incidence population, the sample was designed to increase efficiency in reaching this group, and consisted of three parts: (1) respondents reached through random digit dialing (RDD) landline and cell phone (N=142); (2) respondents reached by re-contacting those who indicated in a previous RDD survey that they either purchased their own insurance or were uninsured (N=234); (3) respondents reached as part of the SSRS Omnibus survey (N=410), a weekly, nationally representative RDD landline and cell phone survey. All RDD landline and cell phone samples were generated by Marketing Systems Group.

A multi-stage weighting process was applied to ensure an accurate representation of the national population of non-group enrollees ages 18-64. The first stage of weighting involved corrections for sample design, including accounting for the likelihood of non-response for the re-contact sample, number of eligible household members for those reached via landline, and a correction to account for the fact that respondents with both a landline and cell phone have a higher probability of selection. In the second weighting stage, demographic adjustments were applied to account for systematic non-response along known population parameters. No reliable administrative data were available for creating demographic weighting parameters for this group, since the most recent Census figures could not account for the changing demographics of non-group insurance enrollees brought about by the ACA. Therefore, demographic benchmarks were derived by compiling a sample of all respondents ages 18-64 interviewed on the SSRS Omnibus survey during the field period (N=7,601) and weighting this sample to match the national 18-64 year-old population based on the 2015 U.S. Census Current Population Survey March Supplement parameters for age, gender, education, race/ethnicity, region, population density, marital status, and phone use. This sample was then filtered to include respondents qualifying for the current survey, and the weighted demographics of this group were used as post-stratification weighting parameters for the standard RDD and omnibus samples (including gender, age, education, race/ethnicity, marital status, income, and population density). A final adjustment was made to the full sample to control for previous insurance status (estimated based on the combined RDD and omnibus samples), to address the possibility that the criteria used in selecting the prescreened sample could affect the estimates for previous insurance status.

Weighting adjustments had a minor impact on the overall demographic distribution of the sample, with the biggest adjustments being made based on age (this is common in all telephone surveys, as younger respondents are the most difficult to reach and convince to participate). Weighted and unweighted demographics of the final sample are shown in the table below.

Unweighted

% of total

Weighted

% of total

Age18-247%12%
25-29811
30-391316
40-491621
50-645640
Refused**
GenderMale4849
Female5251
EducationLess than high school graduate46
High school graduate2026
Some college2728
Graduated college3125
Graduate school or more1613
Technical school/other11
Refused**
Race/EthnicityWhite, non-Hispanic7467
Black, non-Hispanic79
Hispanic811
Other/Mixed810
Refused33
Self-reported health statusExcellent2223
Very good3232
Good2927
Fair1314
Poor45

All statistical tests of significance account for the effect of weighting. The margin of sampling error (MOSE) including the design effect is plus or minus 4 percentage points for results based on the total sample. Unweighted Ns and MOSE for key subgroups are shown in the table below. For other subgroups the margin of sampling error may be higher.

GroupN (unweighted)MOSE
Total non-group enrollees786±4 percentage points
ACA-compliant plans671±5 percentage points
Marketplace plans512±5 percentage points


Endnotes

  1. Throughout this report, “ACA-compliant plans” refers to plans purchased after January 1, 2014, while “non-ACA-compliant plans” are those purchased before that date. ↩︎
  2. For full methodological details for comparison data from Kaiser Health Tracking Polls, see: March 2016 (https://modern.kff.org/report-section/kaiser-health-tracking-poll-march-2016-methodology/), March 2015 (https://modern.kff.org/report-section/kaiser-health-tracking-poll-march-2015-methodology/), and May 2014 (https://modern.kff.org/report-section/kaiser-health-tracking-poll-may-2014-methodology/) ↩︎
  3. Throughout this report, individuals in Marketplace plans are those who say they purchased their plan from a state or federal Marketplace, those who report purchasing a Marketplace plan from an insurance broker or agent or directly from an insurance company, and those who say they are receiving an advance premium tax credit or that their premium is reduced based on their income. ↩︎
  4. Sample size for those who report being in a pre-ACA, non-compliant plan is insufficient to analyze and report on. ↩︎
  5. M. Rae, L. Levitt, G. Claxton, et al., “Patient Cost-Sharing in Marketplace Plans, 2016,” Kaiser Family Foundation, November 2015. https://modern.kff.org/health-costs/issue-brief/patient-cost-sharing-in-marketplace-plans-2016/ ↩︎
  6. Among current Marketplace enrollees who had non-group coverage in 2015, 35 percent report switching plans in 2016. The Department of Health and Human Services (HHS) reports that 43 percent of consumers re-enrolling in Marketplace coverage in HealthCare.gov states switched plans. The difference between these two estimates is likely due to the fact that the survey data are self-reported while the HHS is using administrative records in reporting. See HHS Issue Brief: https://aspe.hhs.gov/pdf-report/health-insurance-marketplaces-2016-open-enrollment-period-final-enrollment-report ↩︎
  7. L. Levitt, G. Claxton, A. Damico, and C. Cox, “Assessing ACA Marketplace Enrollment,” Kaiser Family Foundation, March 2016. https://modern.kff.org/health-reform/issue-brief/assessing-aca-marketplace-enrollment ↩︎

Workplace Wellness Programs Characteristics and Requirements

Authors: Karen Pollitz and Matthew Rae
Published: May 19, 2016

Issue Brief

The majority of large employers that offer health benefits today also offer at least some wellness programs in an effort to promote employee health and productivity and reduce health related costs.  Workplace wellness programs vary in the services and activities they include, and about three-in-ten large employers use incentives to encourage employees to participate.  Depending on a program’s characteristics, different federal rules might apply.  Final regulations recently issued by the Equal Employment Opportunity Commission (EEOC) would change standards applicable to certain workplace wellness programs that use incentives to encourage workers and their spouses to provide personal health information.  These new rules are intended to be more consistent with other standards implementing requirements in the Affordable Care Act (ACA) that apply to certain workplace wellness programs.  Both rules seek to balance employer interest in incentivizing workers to participate in wellness programs against requirements that prohibit discrimination based on health status, disability, and genetic information.

Federal Standards for Workplace Wellness Programs

Three federal laws directly address workplace wellness programs within the context of other broad rules that prohibit discrimination based on health status.  The Employee Retirement Income Security Act (ERISA) prohibits discrimination by group health plans based on an individual’s health status.  ERISA makes exceptions for wellness programs to offer premium or cost sharing discounts based on an individual’s health status in certain circumstances.  The Americans with Disabilities Act (ADA) prohibits employment discrimination based on health status and generally forbids employers from inquiring about workers’ health status, but makes an exception for medical inquiries that are conducted as part of voluntary wellness programs.   Finally, the Genetic Information Nondiscrimination Act (GINA) prohibits employment discrimination based on genetic information and forbids employers from asking about individuals’ genetic information, including information about family members’ health status, or family history.  Like the ADA, GINA allows an exception for inquiries through voluntary wellness programs.

Another federal law – the Health Insurance Portability and Accountability Act (HIPAA) – establishes standards to protect the privacy of personal health information, including information that may be collected by some workplace wellness programs.  The ADA and GINA also include certain privacy protections.

In May 2016, the EEOC, which enforces ADA and GINA, issued new regulations to modify ADA requirements for workplace wellness programs “in a manner that reflects both the ADA’s goal of limiting employer access to medical information … and the ACA’s provisions promoting wellness programs.”  A new final rule made similar changes to GINA wellness program requirements.

ERISA standards for health-contingent wellness program incentives – In 2010, the Affordable Care Act amended ERISA to permit group health plans to adopt wellness program incentives that vary a person’s group health plan premiums or cost-sharing based on their health status.1   Such programs are called “health-contingent” wellness programs.  Some health-contingent programs provide rewards, such as premium discounts, to people who can meet certain health outcomes, such as normal weight or blood pressure.  Others might identify people with health problems and then provide rewards if they participate in wellness classes or activities.

Final regulations to implement ACA provisions, issued in 2013 by the US Department of Labor (DOL), said health-contingent wellness programs can vary group health plan premiums or cost sharing based on health status and will not be considered to discriminate based on health status if they meet five standards.  One limits the amount of rewards.2   The maximum reward is 30% of the total cost (both the employer and employee share) of self-only group health plan coverage.  The maximum can be increased to 30% of the cost of family coverage if spouses and dependents are eligible to participate in the wellness program, and to 50% if tobacco-related components are included in the wellness program.  In 2015, the average annual cost of group health plan coverage was $6,251 for an individual and $17,545 for a family.  Variation around the average is substantial; for example, 25% of covered workers are enrolled in plans that cost more than $7,000 for single coverage and $20,000 for family coverage. As a result, the maximum wellness incentive could reach thousands of dollars.3 

Health-contingent wellness programs also must be reasonably designed to promote health or prevent disease.  “Reasonably designed” is defined as having a reasonable chance of improving the health or preventing disease, not being overly burdensome or a subterfuge for discrimination, and not being highly suspect in the method chosen to promote health.  By regulation, this is “intended to be an easy standard to satisfy… There does not need to be a scientific record that the method promotes wellness to satisfy this standard.” 4   In addition, reasonably designed health-contingent wellness programs must meet other standards related to providing notice to participants, providing waivers or alternative ways for participants to earn rewards, and making rewards available to participants at least annually.

ERISA standards for participatory wellness programs – Under the DOL rule, wellness programs that do not base rewards or penalties on health status are called “participatory” wellness programs.  Participatory wellness programs are not required to meet any of the five standards that apply to health-contingent wellness programs and generally are not considered to implicate ERISA nondiscrimination rules.  However, the DOL rule notes that other employment discrimination laws, such as the ADA and GINA, also apply, and that being in compliance with the ERISA/ACA wellness program standards does not relieve employers from having to comply with other federal laws.

ADA and GINA standards for wellness programs – In 2000, the EEOC issued enforcement guidance that a wellness program is considered voluntary under the ADA “as long as an employer neither requires participation nor penalizes employees who do not participate.”   In 2010, final regulations to implement GINA restated this definition of voluntary wellness programs.

In 2014, EEOC brought enforcement actions against several employers that penalized workers who would not participate in wellness programs that included medical inquiries.  One action involved an employer that used financial incentives to encourage participation.  Employer groups expressed disagreement with these actions, urging that the ADA should be interpreted to permit use of financial incentives similar to those authorized under the ACA/ERISA.

Revised ADA standards for wellness programs offered through a group health plan – Final regulations issued by the EEOC reinterpret ADA standards for voluntary wellness programs.  For programs offered on or after January 1, 2017, the rule requires any wellness program that involves medical inquiries to be reasonably designed, as defined under the ERISA/ACA rule.  The ADA rule also specifies a reasonably designed wellness program must not be designed mainly to shift costs onto employees based on their health. Further, reasonably designed wellness programs that collect health information must also provide participants with their results, follow-up information, or advice designed to improve health or use collected information to design a program that addresses at least a subset of health conditions identified.  A program also is not reasonably designed if it exists “simply to give an employer information to estimate future health care costs.”  Whether a wellness program is reasonably designed to promote health or prevent disease will be evaluated by EEOC in light of all relevant facts and circumstances.

In addition, two new standards relating to financial incentives and notice will apply.  With respect to incentives, employers cannot deny eligibility for group health plan benefits or take adverse employment action, or retaliate against, intimidate, or threaten employees who refuse to participate in workplace wellness programs.  The rule allows use of financial or in-kind incentives (such as time off awards or other items of value) to encourage participation in wellness programs that include medical inquiries.  The maximum financial incentive is 30% of the total cost (employer and employee share) of self-only group health plan coverage.  This limit applies to both health-contingent and participatory wellness programs.  A wellness program will be considered voluntary under the ADA if the amount of an incentive offered for participation – alone or in combination with incentives offered for health-contingent wellness programs – does not exceed this maximum.  The rule further specifies that incentives need not be conditioned on participating in the group health plan.  For example, if an employer offers a wellness program but does not offer group health plan benefits, the maximum incentive to participate in the wellness program must not exceed 30% of the cost of self-only coverage under the second lowest cost silver plan offered for a 40-year-old nonsmoker in the health insurance exchange located where the employer’s principal place of business is located.  Finally, the rule specifies that wellness programs cannot condition the incentive on the individual’s agreeing to the sale, exchange, sharing, transfer, or other disclosure of medical information (except which would otherwise take place to carry out the reasonably designed wellness program) or to waive confidentiality protections that would otherwise apply.

Notice requirements will also apply to wellness programs that involve medical inquiries such as HRAs. Programs will be required to provide workers notice of what information would be requested, how it would be used, and how the privacy and security of personal information would be protected.  Notice requirements also apply to any workplace wellness program, either health-contingent or participatory, that involves medical inquiries.

Modified GINA standards for wellness programs – In addition, EEOC issued a final rule to make similar changes in workplace wellness standards under GINA.  The GINA wellness rule addresses the extent to which an employer may offer inducements to an employee’s spouse to participate in its workplace wellness program.  Inducements for the spouse to participate in a wellness program can be made without regard to whether the employer offers group health benefits to the spouse or whether the spouse participates in the employer’s group health plan.

Under GINA, genetic information is defined to include not only results of a genetic test, but health information about an individual’s family members, including the spouse.  The rule makes an exception to this definition and permit wellness programs to offer incentives to spouses to provide information about their own health status, though not about results of genetic tests.  The final rule does not permit workplace wellness programs to offer incentives for children (including adult children) of employees to disclose their genetic information or any other health information.

The GINA wellness rule also adopts the ERISA/ACA definition of a reasonably designed wellness program as modified by the ADA wellness rule.  The proposed rule had specifically sought comment on whether to adopt other restrictions on collection of genetic information by workplace wellness programs, including a requirement to collect only the minimum necessary information to administer the program, or a prohibition on collecting genetic information from other sources, such as patient medical records and health insurance claims data.  The final rule declined to adopt these restrictions.

In addition, the GINA wellness rule amends the standard for voluntary wellness programs to permit a maximum incentive for the spouse to participate in the workplace wellness program.  The maximum incentive applicable to the spouse would also be 30% of the cost of self-only coverage offered by the employer, regardless of whether the spouse participates in the health plan.  If the employer does not offer a health plan, the maximum incentive would be based on the cost of the second lowest cost silver plan in the Marketplace.

The final GINA wellness rule also includes the ADA rule requirement that wellness programs cannot condition the incentive on the individual’s agreeing to the sale, exchange, sharing, transfer, or other disclosure of medical information (except which would otherwise take place to carry out the reasonably designed wellness program) or to waive confidentiality protections that would otherwise apply.

Federal privacy standards and workplace wellness programs – Federal privacy protections may also apply to personal information gathered under workplace wellness programs.  The ADA establishes privacy standards for covered entities subject to that law – employers with 15 or more workers.  Covered employers are required to keep private all medical information about workers that they may obtain, whether such information is collected through a wellness program or gathered for other permitted employment-related purposes.  Access to identifiable medical information is restricted and only need-to-know exceptions are allowed, such as for administering a health plan.  Identifiable medical information must be kept securely and separate from other employment records.  ADA privacy standards also generally require that personal health information gathered by a wellness program shall not be used for any purpose inconsistent with the ADA prohibition on employment discrimination.  Medical information obtained by the program may only be provided to the employer in aggregate terms that do not disclose or are not reasonably likely to disclose the identity of any employee.  In case of a suspected violation of ADA privacy rules, individuals may file a complaint with the EEOC and/or initiate a private law suit.  Similar privacy standards under GINA apply to genetic information.

Federal privacy protections under HIPAA also apply to some workplace wellness programs.  Covered entities under HIPAA include most health care providers, health care clearinghouses, and health plans, including group health plans sponsored by employers, but employers are not covered entities under HIPAA.  As a consequence, HIPAA privacy rules do not apply to wellness programs that are offered directly by employers outside of a group health plan.  Under HIPAA, a group health plan generally cannot disclose personal health information to a person’s employer without that person’s authorization, but a group health plan is permitted to disclose protected health information to the employer without authorization if the employer certifies to the plan that it will safeguard the information and not use or share it for any employment-related activity or in connection with any other benefit.  In case of a suspected violation of HIPAA privacy rules, individuals may file a complaint with the US Department of Health and Human Services (HHS); there is no private right of action under HIPAA.  For a complaint involving a covered workplace wellness program, HHS would investigate and verify whether the plan had received the required certifications from the employer.  If the group health plan had not obtained the required certification HHS could seek civil monetary penalties.  However, if HHS found that an employer had violated its promise to only use the information that it receives for permitted purposes, HHS could not pursue enforcement against the employer due to the agency’s limited jurisdiction.

Interpretive guidance issued with the final ADA wellness rule notes that different privacy standards might apply to worksite wellness programs, depending on whether the program is offered as part of a group health plan.  The guidance states that privacy standards established under the ADA continue to apply to any ADA covered entity.  In addition, when a wellness program is part of group health plan, its obligation to comply with ADA privacy rules will likely be satisfied by adhering to HIPAA privacy rules.

Under all three privacy standards, it remains permissible for wellness programs to share participants’ health information with their business partners for purposes of administering the program.  Under the “reasonably designed” standard, for example, this could include sharing information with a business partner to market health- or wellness-related products and services to the enrollee.

What is Known About Workplace Wellness Programs Today?

The annual Employer Health Benefit Survey conducted by the Kaiser Family Foundation and Health Research and Annual Trust (HRET) has collected data on workplace wellness programs since 2005.  In 2015, the survey was revised to capture new information on employer’s wellness offerings.  RAND Corporation studies on workplace wellness programs provide further information about program efficacy and participation rates.

According to the KFF/HRET survey,5  50% of firms offering health benefits in 2015 offered wellness programs related to “tobacco cessation,” “weight loss,” and/or “other lifestyle or behavioral coaching.”6   Large firms (at least 200 employees) are more likely to offer such programs than smaller firms (81% vs. 49%).  Large firms that offered health benefits and wellness programs in 2015 collectively employed 66.4 million workers, 42.7 million of whom were covered by one of the firms’ health plans.7   Programs vary in their use of financial incentives, health screenings, and whether they are offered as part of or outside of the group health plan. (See Table 1)

Table 1: Characteristics of Large Firms Offering Health Benefits and Workplace Wellness Programs and Number of Covered Employees*
 Percent of Large Firm Wellness Programs**Covered Employees (millions)
All10046.8
General Features
Dependents eligible to participate in wellness program (2013)6531.7~
Health Screenings
Offer HRA5032.0
Offer biometric screening5030.7
Offer HRA or biometric screening6437.5
Offer HRA and biometric screening3625.1
Incentives
Incentive to participate in wellness programs, HRA, or biometric screening (combined)4632.6
Incentive to participate in wellness programs3124.1
Incentive to complete HRA3124.4
Incentive to complete biometric screening2822.7
Incentive to complete either HRA or biometric screening3929.7
Amount of incentive to participate in wellness programs, HRA or biometric screening (combined):
·       $1 to $5001913.3
·       $501 to $1,00067.1
·       >$1,00053.5
Require HRA to join health plan21.2
Require biometric screening to join health plan21.3
Financial incentive to meet biometric outcome #55.1
Amount of incentive to meet biometric outcome:
·       $1 to $50032.6
·       $501 to $1,00011.3
·       >$1,00010.8
* Covered employee refers to covered by the group health plan, not necessarily participating in the wellness program.

** Large firms have 200 or more workers.  Estimates are based on all large firms offering wellness programs.  Only firms which offer biometric screening or HRAs are asked about their use of financial incentives for completing those activities.

~ Estimates, including counts of covered workers, based on 2013 Employer Health Benefit Survey.

# Excludes firms which have incentives for meeting biometric outcomes tied to other wellness activities.

SOURCE:  KFF/HRET Annual Employer Health Benefits Survey, 2013 and 2015.

Wellness Programs and Group Health Plans – The 2014 KFF/HRET survey asked employers whether most of their wellness programs are provided by the group health plan, or by the firm.  In 2014, 55% of large firms that offered wellness programs said most of their wellness benefits were provided by the group health plan.  The survey did not ask respondents to specify which wellness program components are offered through the health plan.  Absent a formal definition of what it means for wellness benefits to be offered through a group health plan, the categorization remains somewhat subjective.

Wellness Programs and Dependent Eligibility – In 2013, nearly half (48%) of employer wellness programs were open for participation by the spouses or dependents of workers as well.  This was more often the case for wellness programs offered by large firms than for small firms (65% vs. 47%).

Health Risk Assessments and Biometric Screening – In 2015, 19% of firms offering health benefits required or offered their employees the opportunity to complete a health risk assessment or HRA – a survey that asks workers to self-report their health status, health history, and other information.  Large firms were more likely than smaller firms to offer HRAs (50% vs. 18%).  Similarly, 14% of firms offering health benefits offered their employees the opportunity to complete biometric screening – a physical examination that provides an objective source of health information, such as body mass index and blood pressure.  Large firms were more likely than smaller firms to offer biometric screening (50% vs. 13%).  A quarter of firms offering health benefits, including 64% of large firms, offered either type of wellness screening.  Thirty-six percent of large firms offering health benefits offer wellness programs that include both an HRA and biometric screening.

Wellness Program Incentives – Employee participation in workplace wellness programs generally has not been very high.  To encourage participation, in 2015, 11% of employers offering health benefits, offered incentives for employees to complete an HRA, complete biometric screening or participate in a wellness programs related to tobacco use, weight loss, or coaching.  Large firms offering health benefits are more likely (46%) to use financial incentives than smaller firms (11%).  Most large firms with wellness incentives (65%) offer incentives in the form of cash, gift cards or other merchandise.  Some provide incentives through health plan premium or cost sharing discounts (34%), or other incentives such as paid time off (19%).  In all, about 24.1 million covered workers are in large firms that offer a financial incentive to participate in the wellness program, and 29.7 million covered workers are in large firms that offer a financial incentive to participate and/or to complete health risk assessments or biometric screening.

  • Financial Incentives to Complete HRAs and Biometric Screening- At firms which offer an HRA, on average about half of employees complete it (51% of employees in small firms, 45% in large firms). Sixty-two percent of large firms offering health risk assessments (or 31% of all large firm wellness programs) offer financial incentives to employees who complete the health risk assessment.  Large firms that offer incentives to complete health risk assessments, collectively, employ about 24.4 million covered workers. Half of large employers who have an incentive to complete an HRA, award employees through health plan premium and/or cost sharing discounts.  Five percent of large firm wellness programs that offer health risk assessments require employees to complete the assessment in order to enroll in the health plan.Fifty-six percent of large firms offering biometric screening (or 28% of all large firm wellness programs) offer financial incentives to employees to complete the biometric screening.  Forty-seven percent of large employers that offer biometric screening also offer incentives to complete it that are tied to the health plan premium and/or cost sharing, and 7% of large firm wellness programs that offer biometric screening require employees to complete screening in order to enroll in the health plan.Twenty-one percent of large firms offering health benefits have an incentive for both biometric screening and health risk assessments.  In total, 39% of large firms offering health benefits offer incentives for either screening.Among large firms offering financial incentives to participate in workplace wellness programs, (including incentives to complete HRAs or biometric screening  the maximum value of financial incentives is $500 or less in 64% (or 19% of all large firm offering health benefits) and is greater than $1,000 in 15% of firms (or 5% of all large firms offering health benefits.)
  • Financial Incentives to Meet Biometric Outcomes – A small percentage of programs offered by employers today are health-contingent wellness programs as authorized under the ACA. In 2015, 5% of large employers that offer health plans and wellness programs included financial incentives for participants to complete biometric screening and meet one or more biometric outcomes.  Most often in such large firms, biometric outcomes relate to blood pressure (93%), body mass index (87%), blood cholesterol (85%), and blood glucose (67%) levels. About 5.1 million covered workers are at large firms offering health-contingent wellness programs. When such programs are offered, most large employers use more limited financial incentives than the maximum permitted under the ACA.  In most (51%) health-contingent wellness programs offered by large employers in 2015, the financial incentive is $500 or less, though in 29% of such programs, the reward or penalty exceeds $1,000.

Who Administers Wellness Programs?

The corporate wellness services industry has experienced rapid growth in recent years.  In 2011, the industry reportedly generated $1.8 billion in revenue.  Today, more than 5,600 vendors reportedly generate annual revenue of $8 billion.  Market analysts note the industry is characterized by intense competition and fragmented market share, as barriers to entry are modest.   Leading vendors include health insurance companies, as well as non-insurer entities.

Efficacy of Workplace Wellness Programs

The federal government contracted with the RAND Corporation to describe the design of workplace wellness programs and review their experience achieving cost savings and health status improvements, as well as the experience of programs that use financial incentives and how incentives affect participation rates.8 ,9 

RAND identified configurations of workplace wellness programs, based on whether and the extent to which programs offer three types of services: (1) screening to identify health risks, (2) lifestyle management services to reduce risks through encouraging healthier behavior, and (3) disease management services to support people who already have chronic conditions.  It found that roughly half of all employer wellness programs are limited in the extent and nature of services they offer.  Twenty percent of programs focus primarily on health screening and offer limited other wellness activities, while 34% are limited in screening services as well as other wellness services and interventions.  Only 13% of programs were characterized as comprehensive, offering extensive screening, disease management, and other lifestyle wellness services.  (See Table 2)

Table 2:  Workplace Wellness Program Configurations and Definitions
Program ConfigurationDefinition % of Programs
LimitedLimited services across all three components34%
ComprehensiveExtensive services across all three components13%
Screening-focusedBroad range of screening services but limited lifestyle- and disease-management services20%
Intervention-focusedBroad range of lifestyle-and disease management services but limited screening21%
Prevention-focusedBroad range of screening- and lifestyle-management services but limited disease management12%
SOURCE: RAND Employer Survey 2012, in S. Mattke, et al., Workplace Wellness Programs Study, Santa Monica, CA: RAND Corporation, RR-254-DOL, 2013.

With respect to cost savings, RAND observed strong employer confidence in the effectiveness of wellness programs to save money, while also observing that fewer than half of employers engage in formal evaluation of wellness program impacts.  Analyzing results of programs that did collect data, RAND found that overall, wellness programs reduced average health care costs by about $30 per member per month, but 87% of savings were attributable to disease management programs that focus interventions on individuals with already-diagnosed conditions in order to reduce complications and related health care utilization.  Lifestyle management wellness programs (e.g., promoting exercise or healthier nutrition) accounted for 13% of health care savings.  RAND also found statistically significant that behavioral changes associated with workplace wellness programs, though changes were small and not clinically significant.  For example, wellness-fitness program participants were found to increase the number of days per week during which they exercise at least 20 minutes by 0.15 days, compared to nonparticipants.  Participants in wellness-weight control programs were found to lose about 1 pound over the first three years, on average, compared to nonparticipants.

With respect to the impact of financial incentives, the report observed a median participation rate of 40% across all wellness program types, then compared the experience of limited wellness programs (for example, that are largely screening focused) with programs that offer more extensive lifestyle and disease management activities and services.  It found that financial incentives are associated with a significant increase in employee participation in wellness programs overall, by about 20 percentage points, but noted that “building a better programs is almost as effective.”  Among programs that use no financial incentives, the median participation rate in comprehensive programs was 52%, compared to 20% in limited programs (e.g., that offer health screening only.)   The report found no evidence of cost savings among participants in lifestyle programs that use incentives; instead, utilization among lifestyle program participants increased slightly in the first year of participation.  Use of financial incentives was associated with decreased participation in disease management programs.  Finally, the report also noted that financial incentives can have unintended consequences of shifting cost to employees with poor health.

Another national survey conducted by the Employee Benefits Research Institute (EBRI) explored factors affecting employee decisions to participate in wellness programs, with results that were generally consistent with the RAND study.  Participating employees most often cited a desire to improve health and convenience of the workplace wellness program as the reason for joining a wellness program (70-77%).  Financial incentives were cited less often (50-58%).  Among top reasons cited by those declining to participate, 69% said they could make wellness changes on their own, 56% said they did not have enough time to participate, 43% said the program was not conveniently located for them, and 33% worried their employers would learn their personal health information.

Discussion

The final EEOC wellness rules seek to harmonize ADA and GINA requirements with ERISA/ACA regulations governing health-contingent wellness programs.  New standards will take effect on January 1, 2017.  Questions remaining to be answered about the future impact of these rules include:

Will expanding permitted use of financial incentives in participatory wellness programs promote the use of health-contingent wellness programs?  Today more than half of large employers offer HRAs and/or biometric screening that would allow them to set and monitor health targets for their workers, but so far few have adopted ACA-authorized health-contingent wellness programs that incentivize workers to meet targets.  Concerns related to the ADA and GINA may have be a factor discouraging large firms from offering health-contingent wellness programs.  Now that final EEOC rules have been issued, it remains to be seen whether the number of health-contingent wellness programs may grow.  On the other hand, because the ADA and GINA wellness financial incentives apply to both participatory and health-contingent wellness programs, and specifically also apply to wellness programs offered by employers that don’t offer any group health plan benefits, the number of workers who are incentivized to provide health information to workplace wellness programs in general could also grow.

Will expanding permitted use of financial incentives in all workplace wellness programs change information collection practices by workplace wellness programs?  Many workplace wellness programs routinely obtain passive consent from participants to share their personal health information with other business partners or to use such information for other purposes, such as marketing.  Final ADA and GINA rules prohibit workplace wellness programs from conditioning participation incentives on a requirement that individuals authorize the sale, exchange, sharing, transfer, or other disclosure of their personal health and genetic information, except as otherwise permitted under the standard for reasonably designed wellness programs.  The final rules explicitly do not restrict wellness programs from collecting only the minimum necessary health or genetic information to directly support specific wellness program activities, or prohibit workplace wellness programs from acquiring personal health information or genetic information from other sources, such as patient claims data and medical records data.  It remains to be seen whether wellness program information collection practices change under this standard, or whether attitudes toward workplace wellness programs and individuals’ willingness to participate in them change as a result.

The potential for workplace wellness programs to improve health and save costs continues to hold great appeal for employers and policymakers, alike.  The challenge is to balance this potential with protections to ensure programs do not discriminate against people with health problems or compel disclosure of health information people want to keep private.  As new regulatory standards take effect and workplace wellness programs evolve, so will the balancing of these important goals.

Endnotes

  1. Parallel provisions under the Public Health Service Act apply to employer plans not subject to ERISA. ↩︎
  2.  Under the rule, “reward” is defined to include the avoidance of a penalty. ↩︎
  3.  Kaiser Family Foundation, Health Research and Educational Trust, 2015 Employer Health Benefits Survey.  Available at http://ehbs.kff.org   ↩︎
  4.  71 Federal Register at 75018-75019. ↩︎
  5.  The 2015 Kaiser Family Foundation, Health Research and Educational Trust Employer Health Benefits Survey asked additional and new questions about the use of incentives in workplace wellness programs.  As a result, statistics reported in the 2015 survey often are not comparable to previous year’s findings. ↩︎
  6. Kaiser Family Foundation, Health Research and Educational Trust, 2015 Employer Health Benefits Survey. Available at http://ehbs.kff.org ↩︎
  7. Covered worker refers to employees covered by the group health plan, not necessarily participating in a wellness program.  Covered workers are a subset of the total number of workers in a firm.  Among firms offering health benefits in 2014, 62% of workers were covered by health benefits. ↩︎
  8.  S. Mattke et al., A Review of the US Workplace Wellness Market, 2012; S. Mattke et al., Workplace Wellness Programs Study, 2013; S. Mattke et al., Workplace Wellness Programs: Services Offered, Participation, and Incentives, 2014. ↩︎
  9. The RAND reports included findings from a national survey of employer-sponsored wellness programs, as well as case studies and data from a smaller sample of programs.  RAND followed a similar methodology to the Kaiser/HRET survey and found a similar incidence of wellness programs. In some cases, findings of the two surveys appear different because the RAND survey did not include firms with fewer than 50 employees, while the KFF/HRET survey included firms with as few as 3 employees.  In addition, the KFF/HRET data for large firms reflect those with 200 or more employees, while RAND large firm data describe those with more than 1,000 employees. ↩︎

Following Some Withdrawals, More Counties Could Have One ACA Marketplace Insurer in 2017

Published: May 16, 2016

Source

Kaiser Family Foundation analysis of data from Healthcare.gov; state-based exchange enrollment websites and rate filings; and news reports of market entrants and exits.

Aprenda sobre seguros médicos: los videos en español

Published: May 11, 2016

El seguro de salud, explicado: ¡los YouToons lo tienen cubierto! desglosa conceptos de seguros como primas, deducibles y redes de proveedores.  Explica cómo las personas pagan por su cobertura y cómo obtener cuidado médico y medicamentos recetados con distintos tipos de seguros de salud, incluyendo HMOs y PPOs.


Los videos están escritos y producidos por la Kaiser Family Foundation, con la producción creativa y animación de Free Range Studios.  La narradora es Pamela Silva Conde, periodista ganadora de seis premios Emmy y co conductora del ciclo de la cadena Univision Primer Impacto.


5 things to know about Obamacare’s (likely) premium hikes

Author: Larry Levitt
Published: May 11, 2016

In this guest column for Vox, the Kaiser Family Foundation’s Larry Levitt examines several key factors behind the expected premium rate increases for the Affordable Care Act’s marketplace plans in 2017 and what they mean for the stability of the marketplace.

Medicare Advantage 2016 Spotlight: Enrollment Market Update

Authors: Gretchen Jacobson, Giselle Casillas, Anthony Damico, Tricia Neuman, and Marsha Gold
Published: May 11, 2016

Issue Brief

The number and share of Medicare beneficiaries enrolled in Medicare Advantage has steadily climbed over the past decade, and this trend in enrollment growth is continuing in 2016. The growth in enrollment has occurred despite reductions in payments to plans enacted by the Affordable Care Act of 2010 (ACA).1  As of 2016, the payment reductions have been fully phased-in in 78 percent of counties, accounting for 70 percent of beneficiaries and 68 percent of Medicare Advantage enrollees.

This Data Spotlight reviews national and state-level Medicare Advantage enrollment trends as of March 2016 and examines variations in enrollment by plan type and firm. It analyzes the most recent data on premiums, out-of-pocket limits, Part D cost sharing, and plans’ quality ratings. Key findings include:

  • Medicare Advantage enrollment has increased in virtually all states over the past year. Almost one in three people on Medicare (31% or 17.6 million beneficiaries) is enrolled in a Medicare Advantage plan in 2016 (Figure 1). The penetration rate exceeds 40 percent in 5 states.
Figure 1: Total Medicare Private Health Plan Enrollment, Among the Individual and Group Markets, 2008-2016
  • Over 3 million enrollees (18%) are in a group plan in 2016.
  • UnitedHealthcare and Humana together account for 39 percent of enrollment in 2016; enrollment continues to be highly concentrated among a handful of firms, both nationally and in local markets. If Aetna acquired Humana with no divestitures in 2016, the combined firm would account for 25 percent of Medicare Advantage enrollees nationwide.
  • On average, premiums paid by enrollees were relatively constant between 2015 and 2016 ($37 per month in 2016 versus $38 per month in 2015), although premiums vary widely across states, counties, and plan types.
  • Medicare Advantage plans, unlike traditional Medicare, are required to provide an out-of-pocket limit (not to exceed $6,700) for services covered under Parts A and B. In 2016, the average enrollee had an out-of-pocket limit of $5,223 – nearly $1,000 higher than it was in 2011 ($4,313). More than one-third of all enrollees in Medicare Advantage prescription drug plans in 2016 (37%) are in plans with limits at the maximum.

Nationwide Enrollment

In 2016, 17.6 million beneficiaries – 31 percent of the Medicare population – are enrolled in a Medicare Advantage plan (Figure 2). Total Medicare Advantage enrollment grew by about 0.9 million beneficiaries, or 5 percent, between 2015 and 2016. Although this is a slower rate of growth in percentage terms than any year since 2006, the growth reflects the ongoing expansion of the position Medicare Advantage plays in the Medicare program. The growth in Medicare Advantage enrollment reflects both the influence of seniors aging on to Medicare as well as small shifts in the larger pool of beneficiaries in traditional Medicare switching to Medicare Advantage plans.2 

Figure 2: Total Medicare Private Health Plan Enrollment, 1999-2016

As has been the case each year since 2007, about two-thirds (64%) of Medicare Advantage enrollees are in HMOs in 2016 (Figure 3). Almost one-third of enrollees are in PPOs – with more in local PPOs (23%) than regional PPOs (7%) – and the remainder are in Private Fee-For Service (PFFS) plans (1%) and other types of plans (4%), including cost plans and Medicare Medical Savings Accounts (MSAs).

Figure 3: Distribution of Enrollment in Medicare Advantage Plans, by Plan Type, 2016
  • Enrollment in HMOs increased by 0.6 million to 11.3 million beneficiaries in 2016 (Figure 4 and Table A1).
Figure 4: Total Medicare Advantage Enrollment, by Plan Type, 2007-2016
  • Enrollment in local PPOs and regional PPOs increased by 0.1 million each, with 4.1 million beneficiaries in local PPOs and 1.3 million beneficiaries in regional PPOs 2016.

A key difference between an HMO and a PPO is that the latter provides enrollees with more flexibility to see providers outside of the plan’s provider network. Local PPOs, like HMOs, are required to serve areas no smaller than a county, whereas regional PPOs are required to serve areas defined by one or more states with a uniform benefit package across the service area.

  • PFFS Plans. Enrollment in PFFS plans (0.2 million) has slowly declined since MIPPA of 2008 required PFFS plans in most parts of the country to have networks of providers, and today, about 1 percent of all Medicare Advantage enrollees are in these plans. Among PFFS plan enrollees, 26 percent are in counties in which PFFS plans are exempted from network requirements.

Group Enrollment

Most Medicare beneficiaries who enroll in Medicare Advantage plans do so as individuals, but a small number enroll through groups, comprised largely of plans sponsored by unions and employers for retirees. Under these arrangements, employers or unions contract with a Medicare Advantage insurer and Medicare pays the insurer a fixed payment per enrollee to provide benefits covered by Medicare, and the employer or union, and often the retiree as well, pays a premium for any additional benefits or lower cost-sharing.3  About 3.2 million of the 17.6 million enrollees (18%) are in a group plan in 2016 (Figure 5 and Table A2). Employers (and their retirees) appear to continue to favor local PPOs over HMOs, which contrasts with the individual market, with almost double the number of group plan enrollees in local PPOs compared to HMOs.

Figure 5: Medicare Advantage Enrollment in the Individual and Group Markets, by Plan Type, 2008-2016

While the national share of Medicare Advantage enrollees in group plans has never been very large, in some states, the share of Medicare Advantage enrollees in group plans is much larger than average, including West Virginia (54%), Michigan (49%), Kentucky (41%), Illinois (41%), and Maryland (31%). In Ohio, enrollment in group plans dropped between 2015 and 2016, due to the Ohio Public Employees Retirement System’s decision to terminate its group Medicare Advantage plan, and instead provide a defined contribution that its retirees can use to help pay for an individual Medicare Advantage, Medigap, or other Medicare supplement plan.4 

Historically, group Medicare Advantage plans have received higher Medicare payments, on average, than plans in the individual Medicare Advantage market.5  However beginning in 2017, CMS will be changing its payment methodology for group plans with the goal of more closely aligning payments with the average individual plan bid.6  This change will be fully phased-in by 2018 and is expected to lower payments to group plans as the Medicare Payment Advisory Commission (MedPAC) has recommended in the past.

Medicare Advantage Enrollment Growth by State

In 2016, enrollment increased in all states in 2015, with the exception of Ohio where enrollment declined by 8 percent, in large part to the Ohio Public Employees Retirement System pulling out of the Medicare Advantage group market and ceasing to sponsor a Medicare Advantage plan (Table 1). In 9 states (DE, IA, MD, ME, MS, MT, ND, NH, and SD) and the District of Columbia, enrollment increased by more than 10 percent – double the national average – including four states (DE, IA, ND, and NH) in which enrollment increased by more than 20 percent. All of these states have Medicare Advantage penetration rates far below the national average with relatively few enrollees and their growth rates are sensitive to small changes in enrollment.

Table 1. Medicare Advantage Enrollment and Penetration Rate, by State, 2015-2016
State2015 Total Enrollment2016 Total EnrollmentChange in Total Enrollment,2015-2016Percent Change in Enrollment,2015-20162015 Penetration Rate2016 Penetration Rate
Total U.S.16,761,67317,625,200863,5275%31%31%
Alabama238,091257,21819,1278%25%26%
Alaska5693N/AN/A<1%<1%
Arizona425,454442,28216,8284%38%38%
Arkansas114,326121,5437,2176%19%20%
California2,127,6662,244,709117,0436%38%39%
Colorado281,467293,27511,8084%37%36%
Connecticut157,692165,7228,0305%25%26%
Delaware13,84116,7922,95121%8%9%
District of Columbia11,03312,2921,25911%13%14%
Florida1,570,8451,670,26699,4216%40%41%
Georgia460,670508,16147,49110%31%33%
Hawaii110,465113,4512,9863%46%46%
Idaho87,83790,4352,5983%32%31%
Illinois371,007405,75634,7499%18%19%
Indiana264,104279,33815,2346%23%24%
Iowa81,54198,79017,24921%14%17%
Kansas61,60067,7336,13310%13%14%
Kentucky212,948229,91616,9688%25%26%
Louisiana232,445249,92017,4758%30%31%
Maine66,30775,1168,80913%22%24%
Maryland76,37588,99812,62317%8%9%
Massachusetts233,084246,01812,9346%19%20%
Michigan595,239621,11825,8794%32%32%
Minnesota480,474510,71330,2396%53%55%
Mississippi76,77685,2088,43211%14%15%
Missouri311,364337,11925,7558%28%29%
Montana34,75839,2004,44213%18%19%
Nebraska34,98237,1692,1876%11%12%
Nevada146,094157,37911,2858%33%34%
New Hampshire17,29520,7563,46120%7%8%
New Jersey222,846245,65122,80510%15%16%
New Mexico113,807120,0996,2926%31%32%
New York1,212,2391,243,71431,4753%37%37%
North Carolina512,924547,07934,1557%29%30%
North Dakota17,87821,6273,74921%15%18%
Ohio811,503748,125-63,378-8%38%34%
Oklahoma111,013116,4895,4765%17%17%
Oregon323,765339,46115,6965%44%44%
Pennsylvania1,001,8641,022,46220,5982%40%40%
Rhode Island71,00972,9541,9453%35%35%
South Carolina209,812224,13014,3187%23%23%
South Dakota26,40031,1584,75818%17%20%
Tennessee412,042440,39428,3527%34%35%
Texas1,098,6781,174,62175,9437%31%32%
Utah113,034120,2377,2036%33%34%
Vermont8,9849,6716878%7%7%
Virginia206,427219,38212,9556%16%16%
Washington348,467360,71212,2454%30%30%
West Virginia99,454103,8054,3514%24%25%
Wisconsin388,732410,77122,0396%38%38%
Wyoming2,0712,079N/AN/A2%2%
NOTE: Includes employer-sponsored plans, special needs plans, and other private plans. N/A indicates based on too few (less than 50) enrollees to report. Total U.S. includes Puerto Rico. Between March 2015 and March 2016, the CMS Division of Consumer Assessment and Plan Performance improved the determinations used to assign Medicare beneficiaries to geographic areas in their monthly Medicare Advantage Penetration files. This edit fixed an undercount of approximately 1% of actual Medicare enrollment, potentially making prior-year penetration rates look comparatively higher.

SOURCE: Authors’ analysis of CMS Medicare Advantage enrollment and Landscape files, 2015-2016.

In most states, the majority of enrollees are in HMOs; however, in 9 states (AK, HI, IL, IN, IA, KY, MI, MT, and WV), the majority of enrollees are in local PPOs (Table A1). Most of these states (MI, IL, and HI being exceptions) are heavily rural and also have Medicare Advantage penetration rates below the national average. Additionally, in a few states (MN, ND, and SD), the preponderance of private plan enrollees are in cost plans, which are paid differently from Medicare Advantage plans and allow enrollees to see any Medicare provider (and pay the cost-sharing they would pay in traditional Medicare).

Enrollment Growth by County, based on Medicare Spending Quartiles. Over the years, Congress and various Administrations have made a number of changes to payment and participation rules for plans. Many of these changes have revolved around plan payment levels, seeking to balance plan participation and plan choices for beneficiaries with parity in payments between traditional Medicare and Medicare Advantage. The ACA reduced payments to all plans, and varied payment policy with the level of traditional Medicare spending in counties, grouped into four quartiles. In 2017, when payments are fully phased in, the payments will range from 95 percent of traditional Medicare spending for counties in the top quartile of Medicare spending to 115 percent of traditional Medicare spending for counties in the bottom quartile of Medicare spending, and 100 percent and 107.5 percent of Medicare spending in the two middle quartiles.

As of 2016, payment reductions have been fully implemented in 78 percent of all counties nationwide; these counties account for 70 percent of all Medicare beneficiaries nationwide and 68 percent of all Medicare Advantage enrollees. The payment changes authorized by the ACA will be fully phased-in in all states in 2017.

The year-to-year changes in penetration rate continue to be similar across the four quartiles (Table A3). Similar to prior years, the penetration rate grew by 6 percent in both the highest quartile counties and in the lowest quartile counties, and by 7 percent each in the two middle quartiles between 2011 and 2016. Overall penetration is also similar across the quartiles (ranging from 28% to 35%) and does not appear to be correlated with payment differences by quartile of traditional Medicare spending.

Medicare Advantage Penetration

In 23 states, at least 30 percent of Medicare beneficiaries are enrolled in Medicare private plans, including 5 states (FL, HI, MN, OR, and PA) in which at least 40 percent of beneficiaries are enrolled in Medicare private plans (Figure 6). These five states account for 21 percent of all Medicare private plan enrollees. While Medicare Advantage enrollment is increasing in many states, Medicare Advantage enrollment continues to be very low (less than 10 percent of Medicare beneficiaries) in 6 states (AK, DE, MD, NH, VT, and WY). This variation reflects the history of managed care in the state, the uneven prevalence of employer-sponsored insurance for retirees, and growth strategies pursued by various Medicare Advantage sponsors, among other factors.

Figure 6: Share of Medicare Beneficiaries Enrolled in Medicare Private Plans, by State, 2016

Within states, Medicare Advantage penetration varies across counties. For example, 44 percent of beneficiaries in Los Angeles County, California are enrolled in Medicare Advantage plans compared to only 11 percent of beneficiaries in Santa Cruz County, California.

Premiums

Medicare Advantage enrollees are responsible for paying the Part B premium, in addition to any premium charged by the plan. The Medicare Advantage premium paid by enrollees reflects the difference between the plan’s costs of providing Part A and B benefits and any supplemental benefits offered, and the federal payment to the plan for Part A and B benefits. Plans receive a percentage of the difference between their bid and the maximum federal payment (known as a rebate) and are required to use this amount to offer extra benefits, reduce cost sharing, or reduce the Part B premium. If the plan includes the Medicare Part D prescription drug benefit, as most plans do, the plan may also use the rebate to reduce the Part D premium. This brief analyzes premiums for Medicare Advantage plans that offer prescription drug benefits (MA-PDs) because the vast majority (89%) of Medicare Advantage enrollees is in MA-PDs and Medicare Advantage enrollees who seek Part D prescription drug benefits are, for the most part, required to get them through their plan if the plan offers prescription drugs.

The average MA-PD enrollee pays a monthly premium of about $37 in 2016, about $1 per month (1%) less than in 2015 (Figure 7). 7  Actual premiums paid by enrollees vary widely, across and within counties, by plan type and other plan characteristics. Average premiums range from $28 per month for HMO enrollees to $63 per month for local PPOs and $76 per month for PFFS plan enrollees (Table A4). Since the ACA was enacted in 2010, average Medicare Advantage premiums paid by HMO enrollees and local PPO enrollees have decreased and average premiums paid by regional PPOs and PFFS enrollees have increased.

Figure 7: Weighted Average Monthly Premiums for Medicare Advantage Prescription Drug Plans, Total and by Plan Type, 2010-2016

Zero Premium Plans

In 2016, as in prior years, most Medicare beneficiaries (81%) had a choice of at least one “zero premium” MA-PD8  plans that charge no additional premium for coverage, other than the monthly Part B premium. Between 2015 and 2016, the share of enrollees in zero premium MA-PDs remained relatively unchanged (48% in 2015 versus 49% in 2016), about the same share as in 2010 (Figure 8). Similar to prior years, a larger share of HMO enrollees is enrolled in zero premium plans (59%) than regional PPO enrollees (38%) or local PPO enrollees (22%). No zero premium PFFS plans were offered in 2015 or 2016 (Table A4).

Figure 8: Share of Enrollees in Medicare Advantage Prescription Drug Plans with Zero Premium, Total and by Plan Type, 2010-2016

Premium Variation Across States

Comparing premiums across states is complicated by the fact that premiums reflect many factors, including the underlying costs of care in a given county relative to the national average, the level of payments to Medicare Advantage plans in the area, and firms’ strategy about whether to use plans’ rebates to offer extra benefits, reduce cost-sharing, or lower premiums. Additionally, as previously discussed, premiums vary across plan types and enrollment by plan type varies across states.

Average monthly MA-PD premiums paid per enrollee range from $7 (Florida) to $138 (Minnesota, which is mainly cost rather than risk-based plans plans), relative to the $37 per month average premium in 2016 (Figure 9).9  Average monthly premiums exceed $70 in seven states: Hawaii, Massachusetts, Michigan, Minnesota, North Dakota ($123; not displayed in exhibit), Pennsylvania, and Idaho. In contrast, average monthly premiums are less than $20 in seven states: Arizona, Iowa, Florida, Louisiana, Missouri, Nevada, and Texas. (States with fewer than 50,000 Medicare Advantage enrollees are not displayed in the exhibit.)

Figure 9: Weighted Average Monthly Premiums for Medicare Advantage Prescription Drug Plans, by State, 2016

Premiums also vary greatly within a state since plans and federal payments to plans vary by county. For example, MA-PD enrollees pay an average of $3 per month in Los Angeles County, California but $64 per month in San Francisco County, California. Similarly, MA-PD enrollees pay, on average, $18 per month in Queens, New York but $75 per month in Albany, New York.

Cost Sharing

Medicare Advantage plans are required to provide all Medicare covered services, and have some flexibility in setting cost-sharing for specific Medicare-covered services. In addition, since 2011 Medicare Advantage plans have been required to limit enrollees’ out-of-pocket expenditures for services covered under Parts A and B – in contrast with traditional Medicare.

Out-Of-Pocket Limits

In 2011, CMS began requiring all Medicare Advantage plans to limit enrollees’ out-of-pocket expenditures for Part A and B in-network services to no more than $6,700 annually, and recommended a limit of $3,400 or lower.10 

In 2016, the average out-of-pocket limit an MA-PD enrollee faces is $5,223, up from $5,041 in 2015 and $4,313 in 2011 (Figure 10). More than half of all enrollees (52%) are in plans with limits above $5,000 in 2016, up from 46 percent in 2015. More than one-third of all enrollees in 2016 (37%) are in plans with limits at the $6,700 maximum, as compared to 32 percent in 2015 and 17 percent in 2011 (data not shown).

Figure 10: Average Out-of-Pocket Limit for Enrollees in Medicare Advantage Prescription Drug Plans, 2011-2016

HMO enrollees have generally had lower out-of-pocket limits than enrollees in local PPOs or regional PPOs, and this remains the case in 2016 (Figure 11). Virtually all regional PPO enrollees (99%) and nearly two-thirds of local PPO enrollees (62%) are in plans with limits above $5,000 in 2016. In comparison, 45 percent of HMO enrollees are in plans with limits above $5,000 in 2016. Yet, across all plan types, the share of enrollees in plans with limits above $5,000 has greatly increased and, similarly, the share of enrollees in plans with limits at or below the recommended limit has decreased across all plan types since 2011.

Figure 11: Out-of-Pocket Limits for Enrollees in Medicare Advantage Prescription Drug Plans, by Plan Type, 2011-2016

Part D Cost Sharing

The standard Medicare Part D benefit in 2016, for both stand-alone prescription drug plans (PDPs) and MA-PDs, has a $360 deductible and 25 percent coinsurance up to an initial coverage limit of $3,310 in total drug costs, followed by a coverage gap (the so-called “donut hole”) where beneficiaries pay a larger share of total costs until their total out of pocket Part D spending reaches $4,850. After exceeding this catastrophic threshold, beneficiaries pay 5 percent of the cost of drugs.11 

Part D Deductibles

Both free-standing (stand-alone) prescription drug plans (PDPs) and Medicare Advantage plans have the flexibility to vary the cost-sharing design of their Part D benefit; however, CMS limits the plans’ deductibles and in 2016 the deductible cannot exceed $360. In 2016, just 14 percent of MA-PD enrollees are in a plan with the maximum Part D deductible. Half (50%) are in plans with no Part D deductible and the rest (36%) have deductibles less than $360 (Figure 12). Since sponsors of MA-PDs can use their rebate dollars and bonus payments to lower Part D costs, enrollees in MA-PDs historically have had lower Part D deductibles (and premiums) than enrollees in PDPs.12  Among Medicare Advantage enrollees, those in HMOs (58%), followed by local PPOs (37%), are most likely to be in a plan with no deductible.

Figure 12: Enrollment in Medicare Advantage Prescription Drug Plans, by Part D Deductible and Plan Type, 2016

Medicare Advantage Enrollment, by Firm

Enrollment by Firm

Medicare Advantage enrollment tends to be highly concentrated among a small number of firms (Figure 13). In 2016, six firms or affiliates accounted for about three-quarters (73%) of the market, including UnitedHealthcare, Humana, Blue Cross Blue Shield (BCBS) affiliated plans, Kaiser Permanente, Aetna, and Cigna. UnitedHealthcare, Humana, and the BCBS affiliates together account for just over half (54%) of Medicare Advantage enrollment. Enrollment in UnitedHealthcare’s plans grew more than any other firm, increasing by more than 360,000 beneficiaries between 2015 and 2016 (Table A5).

Figure 13: Medicare Advantage Enrollment, by Firm or Affiliate, 2016

Firms differ in how they position themselves in the market, including the plan types they offer. Almost all of Kaiser Permanente’s enrollees (95%) are in HMOs with the remainder (5%) in cost plans (Figure 14). In contrast, enrollment in UnitedHealthcare and Humana plans is mostly in HMOs, but also includes significant shares in local PPOs and regional PPOs. Humana’s distribution of enrollment across plan types continues the shift from earlier years when a much larger share of Humana’s enrollees was in PFFS plans. Enrollment in BCBS plans is split between HMOs (46%) and local PPOs (41%), with the remainder in regional PPOs and other plan types including PFFS plans.

Figure 14: Distribution of Medicare Advantage Enrollees in the Firms and Affiliates with the Highest Enrollment, by Plan Type, 2016

Market Concentration by State

In most states, a few firms dominate Medicare Advantage enrollment (Figure 15). Similar to prior years, in every state other than New York, the three largest firms or BCBS affiliates account for at least 50 percent of enrollment. In 37 states and the District of Columbia, at least 75 percent of enrollees are in plans offered by one of three firms.

Figure 15: Combined Market Share of the Three Firms or Affiliates with the Largest Number of Medicare Advantage Enrollees by State, 2016

In 13 states, one company has more than half of all Medicare Advantage enrollment – an indicator that these markets may not be very competitive (Table A6). With the exception of North Dakota and South Dakota, all of these states are dominated by either UnitedHealthcare, Humana, or BCBS affiliated plans. (Medica Holding Company’s plans dominate Medicare Advantage enrollment in the Dakotas.)

UnitedHealthcare has the largest share of enrollment in 19 states and is among the top three firms in an additional 18 states and the District of Columbia. Humana has the largest enrollment in 10 states and is among the top 3 firms in another 19 states. Plans offered by BCBS affiliates have the most enrollees in 9 states and are among the top firms in another 16 states. Kaiser Permanente’s presence is more geographically focused than other major national firms, with a heavy concentration in California, Colorado, the District of Columbia and Maryland. Kaiser Permanente has more enrollees than any other firm in California, the District of Columbia and Maryland. In some states, locally operated plans play a much larger role than the national firms, and include EmblemHealth (CT), Martin’s Point Health Care (ME), Tufts Associated HMO (MA), New West (MT), Presbyterian Healthcare Services (NM), and Medica Holding Company (ND and SD).

Potential Effects of Proposed Mergers

Enrollment in Medicare Advantage plans has been highly concentrated within a handful of firms throughout its history. If the acquisition of Humana by Aetna and the acquisition of Cigna by Anthem are approved, then Medicare Advantage enrollment could become more concentrated, particularly if few divestitures are required.

If no divestitures are required in the acquisition of Humana by Aetna, then the combined firm would account for 25 percent of Medicare Advantage enrollment nationwide – more than UnitedHealthcare, which accounts for 21 percent of enrollment this year (Table A7). In 2016, Aetna’s total (individual and group) enrollment increased by 100,000 whereas Humana’s stayed flat because large increases in enrollment in individual Humana plans were offset by a decline in enrollment in group Humana plans due to the Ohio Public Employees Retirement System terminating their contract with Humana.

The acquisition of Cigna by Anthem would have a less visible impact on the national Medicare Advantage market. In 2016, Anthem had about 410,000 enrollees in BCBS licensed Medicare Advantage plans and about 150,000 in other plans. Nationwide, Anthem accounts for 3 percent of all Medicare Advantage enrollment and Cigna accounts for another 3 percent, so the combined entity would reflect about 6 percent of Medicare Advantage enrollment, if no divestitures were required. However, the effects of mergers are likely to vary substantially across states and even within states based on locality depending on where Medicare Advantage firms offer their plans and how many beneficiaries are enrolled in them. For example, Anthem (which was formerly known as Wellpoint) gained scale when it merged with BCBS licensees in a number of states. It now offers its Medicare Advantage plans through its BCBS affiliated plans (offered in CA, CO, CT, GA, IN, KY, ME, MO, NH, NV, NY, OH, VA, and WI),13  as well as through independently licensed products.

Star Quality Ratings

For many years, CMS has posted quality ratings of Medicare Advantage plans to provide beneficiaries with additional information about plans offered in their area. All plans are rated on a 1 to 5 star scale, with 1 star representing poor performance, 3 stars representing average performance, and 5 stars representing excellent performance. CMS assigns quality ratings at the contract level, rather than for each individual plan, meaning that each plan covered under the same contract receives the same quality rating (and most contracts cover multiple plans of the same type). Since 2012, Medicare Advantage plans with 4 or more stars and plans without ratings have been receiving bonus payments based on quality ratings.14  Beneficiaries can enroll in a plan with 5 stars at any time during the year, not just during the annual open enrollment period.

Between 2013 and 2016, the share of enrollees in plans with 4 or more stars has steadily increased, from 37 percent in 2013 to 68 percent in 2016 (Figure 16). Much of the increase in enrollment in plans with four or more stars has occurred in the plans with 4 or 4.5 stars, while the share of enrollees in plans with 5 stars has been relatively stable.

Figure 16: Enrollment in Medicare Advantage Contracts, by Contracts’ Star Quality Rating, 2013-2016

Notably, while a larger share of beneficiaries is in a Medicare Advantage plan with relatively high star ratings, seniors have said in focus groups that they do not use the star ratings to select their plan.15  Nonetheless, the star ratings may be correlated with factors that seniors do use to select their plan, including provider networks, and plan benefits and costs, and thus may be correlated with enrollment.

Discussion

Enrollment in Medicare Advantage plans continues to grow nationally, by state, and across quartiles of traditional Medicare spending, despite concerns about the reductions in payments enacted in the ACA. Medicare Advantage premiums have remained relatively flat. However, plans’ limits on out-of-pocket costs have steadily grown, increasing by almost $1,000 on average since 2011, indicating that enrollees with significant medical needs have less financial protection in plans than they have in the past. Additional work is needed to understand plans’ cost-sharing and provider networks, including changes over time and variation across plans. A key concern is whether beneficiaries have the information they need to make fully informed health plan choices from one year to the next, taking into account changes in their plan’s coverage and/or provider network, and changes in their own health care needs.

Looking to the future, both the Congressional Budget Office and the Health and Human Services (HHS) Office of the Actuary (OACT) project that Medicare Advantage enrollment and penetration rate will continue to grow over the next decade, with CBO projecting that about 41 percent of Medicare beneficiaries will be enrolled in Medicare Advantage in 2026. Enrollment will likely grow more in some parts of the country than in others, reflecting the diversity of markets and the coverage decisions of beneficiaries. This growth may prompt some to question at what point the balance between traditional Medicare and Medicare Advantage will tip in favor of Medicare Advantage, with the preponderance of beneficiaries in Medicare Advantage plans, and what this will mean both for beneficiaries in traditional Medicare and those in Medicare Advantage.16 

Gretchen Jacobson, Giselle Casillas, and Tricia Neuman are with the Kaiser Family Foundation; Anthony Damico is an independent consultant; and Marsha Gold is a Senior Fellow Emeritus with Mathematica Policy Research and independent consultant.

Appendices

Appendix A: Special Needs Plans

Special Needs Plans (SNPs) restrict enrollment to specific types of beneficiaries with significant or relatively specialized care needs, including beneficiaries: (1) dually eligible for Medicare and Medicaid (D-SNPs); (2) requiring a nursing home or institutional level of care (I-SNPs); or (3) with severe chronic or disabling conditions (C-SNPs.)

Enrollment in SNPs increased modestly from 2.0 million to 2.1 million beneficiaries between 2015 and 2016 (Figure A1 and Table A8). In 2016, SNP enrollees account for about 12 percent of total Medicare Advantage enrollment, but account for a larger share of the Medicare Advantage enrollment in some states. In five states and the District of Columbia, enrollment in SNPs comprises more than one-fifth of Medicare Advantage enrollment (35% in DC, 28% in SC, 22% in AZ, 21% in AR, and 20% in AL and MS; data not shown).

Figure A1: Number of Beneficiaries in Special Needs Plans, by Type, 2006 – 2016

Similar to prior years, most SNP enrollees are in HMOs (86%), with 11 percent enrolled regional PPOs and 3 percent in local PPOs. The majority of SNP enrollees (82%) are in plans serving those dually eligible for Medicare and Medicaid (D-SNPs). Enrollment of dually eligible beneficiaries in D-SNPs varies greatly by state, and is particularly prevalent in Hawaii (50%) and Arizona (40%) (Table A8).

Separately, several states are undertaking demonstrations with CMS to improve the alignment of Medicare and Medicaid for dually eligible beneficiaries using a capitated model, with the first state (Washington) beginning enrollment in its demonstration in July 2013. As of March 2016, more than 400,000 dual eligibles were enrolled in the demonstrations (Table A9). Most of these enrollees are not included in the SNP enrollment statistics provided here because they operate under unique authority and CMS classifies them as demonstrations. Minnesota is an exception because the demonstration uses its existing D-SNPs to improve the administrative alignment of Medicare and Medicaid in the state’s D-SNPs. In most states operating demonstrations for dual eligibles, enrollment in D-SNPs has increased since the demonstrations began in 2013. In the few states in which enrollment in D-SNPs has declined since 2013 (CA, MI, and MN), the decline has been much smaller than the total enrollment in the state demonstration. As a consequence, in all states operating demonstrations, the total number of dual eligibles in capitated Medicare arrangements has increased since 2013. It is unclear whether D-SNPs will continue to operate alongside the demonstrations in these states or how the demonstrations will affect the growth in D-SNP enrollment over time.

Appendix B: Tables

Table A1. Medicare Advantage Enrollment by State and Plan Type, 2016
StateTotalDistribution of Enrollment, by State and Plan Type
% in HMOs% in Local PPOs% in Regional PPOs% in PFFS Plans% in Cost Plans% in Other Plans
Total U.S.17,625,20064%23%7%1%3%<1%
Alabama257,21861%33%6%<1%0%<1%
Alaska930%100%0%0%0%0%
Arizona442,28292%6%2%1%<1%0%
Arkansas121,54342%16%26%16%0%<1%
California2,244,70996%3%0%<1%<1%<1%
Colorado293,27581%9%0%1%8%1%
Connecticut165,72286%11%3%0%0%0%
Delaware16,79255%44%0%0%0%1%
District of Columbia12,29215%36%0%0%49%0%
Florida1,670,26671%7%22%<1%<1%<1%
Georgia508,16132%44%22%2%0%0%
Hawaii113,45141%56%3%0%0%0%
Idaho90,43556%43%0%1%0%0%
Illinois405,75645%52%2%1%<1%0%
Indiana279,33824%57%18%1%0%<1%
Iowa98,79030%60%0%1%9%<1%
Kansas67,73343%48%2%6%0%<1%
Kentucky229,91620%56%22%1%0%0%
Louisiana249,92087%5%8%<1%0%<1%
Maine75,11663%32%0%5%0%0%
Maryland88,99831%25%0%0%44%<1%
Massachusetts246,01876%18%4%0%0%1%
Michigan621,11839%56%4%1%0%<1%
Minnesota510,71323%7%0%<1%69%0%
Mississippi85,20853%16%29%2%0%0%
Missouri337,11966%21%11%2%0%<1%
Montana39,2004%91%0%5%0%0%
Nebraska37,16959%24%<1%17%<1%<1%
Nevada157,37989%11%0%0%0%0%
New Hampshire20,75651%30%0%19%0%0%
New Jersey245,65174%25%<1%0%0%<1%
New Mexico120,09964%35%0%1%0%<1%
New York1,243,71473%16%8%2%<1%<1%
North Carolina547,07944%49%6%1%0%<1%
North Dakota21,6270%7%0%<1%92%1%
Ohio748,12553%38%7%<1%1%<1%
Oklahoma116,48966%27%3%4%0%<1%
Oregon339,46163%36%0%<1%0%<1%
Pennsylvania1,022,46263%35%1%1%0%<1%
Rhode Island72,95494%4%2%0%0%<1%
South Carolina224,13030%20%46%4%0%<1%
South Dakota31,158<1%22%0%1%76%0%
Tennessee440,39469%29%2%0%0%<1%
Texas1,174,62158%24%13%2%2%<1%
Utah120,23782%18%0%0%0%0%
Vermont9,67111%18%52%19%0%0%
Virginia219,38240%25%12%13%9%1%
Washington360,71286%14%0%<1%0%<1%
West Virginia103,8058%82%5%5%0%0%
Wisconsin410,77148%32%4%3%13%1%
Wyoming2,0798%18%0%69%0%5%
NOTE: Total U.S. includes Puerto Rico. Includes employer-sponsored plans, special needs plans, and other private plans.  Other includes MSAs and demonstration plans.SOURCE: Authors’ analysis of CMS Medicare Advantage enrollment and Landscape files, 2016.
8873 - Table A2 -1616

 (click on table image to enlarge) –

8873 - Table A3 -1616

 (click on table image to enlarge) –

Table A4. Weighted Average Premiums and the Share of Enrollees with Zero Premium in Medicare Advantage Prescription Drug Plans(MA-PDs), 2010-2016
2010201120122013201420152016
Weighted Average Monthly Premiums for MA-PDs
Total$44$39$35$35$35$38$37
HMOs$36$34$29$27$27$28$28
Local PPOs$66$59$53$57$59$65$63
Regional PPOs$29$23$26$29$32$36$37
PFFS Plans$55$43$42$51$63$68$76
Share of Enrollees in MA-PDs with Zero Premium
Total48%53%56%55%56%48%49%
HMOs59%62%65%67%66%59%59%
Local PPOs23%23%29%24%25%18%22%
Regional PPOs48%63%59%49%54%39%38%
PFFS Plans15%23%29%17%17%0%0%
NOTE: Excludes SNPs, employer-sponsored (i.e., group) plans, demonstrations, HCPPs, PACE plans, and plans for special populations. Includes only Medicare Advantage plans that offer Part D benefits. The total includes cost plans (not shown separately), as well as plans with zero premiums. The premiums for a subset of sanctioned plans were not available in 2011; these plans were excluded from this analysis. Excludes beneficiaries with unknown county addresses and beneficiaries in territories other than Puerto Rico.SOURCE: Authors’ analysis of CMS’s Landscape Files for 2010–2016 and March Enrollment files for 2010-2016.

8873 - Table A5 -1616

 (click on table image to enlarge)

8873 - Table A6 -1616

 (click on table image to enlarge)

Table A7. Medicare Advantage Market Share by Firm, by State, 2016
StateTotal Medicare Advantage EnrollmentMedicare Advantage Penetration RateHumanaMedicare Advantage Market ShareAetnaMedicare AdvantageMarket ShareCombinedAetna-HumanaMarket ShareCignaMedicare AdvantageMarket ShareAnthemMedicare Advantage Market ShareCombined Anthem-Cigna Market Share
Total U.S.17,625,20031%18%7%25%3%3%6%
Alabama257,21826%20%1%21%23%<1%23%
Alaska93<1%39%39%
Arizona442,28238%12%1%13%12%3%14%
Arkansas121,54320%35%7%42%2%2%
California2,244,70939%3%1%4%4%4%
Colorado293,27536%13%1%14%<1%<1%
Connecticut165,72226%0%21%21%8%8%
Delaware16,7929%10%44%53%34%34%
District of Columbia12,29214%0%7%7%8%8%
Florida1,670,26641%36%6%42%3%2%5%
Georgia508,16133%22%10%32%9%1%9%
Hawaii113,45146%12%<1%12%
Idaho90,43531%9%<1%9%
Illinois405,75619%25%11%36%5%<1%5%
Indiana279,33824%37%3%40%1%15%16%
Iowa98,79017%20%36%56%
Kansas67,73314%42%43%86%1%1%
Kentucky229,91626%60%2%62%16%16%
Louisiana249,92031%65%1%66%
Maine75,11624%6%22%29%3%3%
Maryland88,9989%2%8%10%16%16%
Massachusetts246,01820%<1%1%1%<1%<1%
Michigan621,11832%9%2%11%
Minnesota510,71355%6%<1%7%
Mississippi85,20815%63%1%64%13%13%
Missouri337,11929%20%29%48%<1%2%2%
Montana39,20019%14%<1%15%
Nebraska37,16912%14%33%47%
Nevada157,37934%33%4%37%4%4%
New Hampshire20,7568%15%2%17%12%12%
New Jersey245,65116%0%26%26%<1%3%3%
New Mexico120,09932%13%1%14%2%2%
New York1,243,71437%2%5%7%6%6%
North Carolina547,07930%33%10%43%2%2%
North Dakota21,62718%7%0%7%
Ohio748,12534%16%25%41%25%25%
Oklahoma116,48917%28%3%31%
Oregon339,46144%1%<1%1%
Pennsylvania1,022,46240%4%21%25%5%<1%5%
Rhode Island72,95435%<1%<1%
South Carolina224,13023%44%2%46%5%<1%5%
South Dakota31,15820%16%6%23%
Tennessee440,39435%30%1%31%21%2%23%
Texas1,174,62132%24%13%37%10%3%12%
Utah120,23734%6%8%15%
Vermont9,6717%<1%2%2%
Virginia219,38216%60%5%65%3%3%
Washington360,71230%9%<1%9%<1%<1%
West Virginia103,80525%70%16%86%
Wisconsin410,77138%18%<1%18%1%1%
Wyoming2,0792%3%9%11%
NOTE: Totals may not sum to 100% due to rounding. Includes employer-sponsored plans, special needs plans, and other private plans. Total U.S. includes Puerto Rico. Blank cells indicate no plans offered. Anthem includes BCBS plans and other plans.SOURCE: Authors’ analysis of CMS Medicare Advantage enrollment and Landscape files, 2016.
Table A8.   Enrollment in Special Needs Plans (SNPs), by Plan Type and State, 2016
StateEnrollment in Special Needs PlansTotal Dual Eligibles (in 2014)% of Dual Eligibles in D-SNPs
TotalDual eligibles(D-SNPs)Institutional(I-SNPs)Chronic or disabling conditions (C-SNPs)
Total U.S.1,852,0851,482,05055,439314,59611,063,74013%
Alabama51,36551,1032620222,74023%
Alaska000017,4200%
Arizona96,38980,1562,19214,041199,18040%
Arkansas25,70512,87712,828138,4809%
California191,776145,8602,45143,4651,424,50010%
Colorado12,2789,4172,77289112,2208%
Connecticut17,22214,3102,9120181,1208%
Delaware2,23298852072430,4403%
District of Columbia4,2534,0458012832,58012%
Florida301,744232,5813,84065,323819,22028%
Georgia98,08052,1202,54143,419330,80016%
Hawaii20,06820,0680039,86050%
Idaho2,1202,1200045,9805%
Illinois14,24911,5619441,744402,6203%
Indiana3,1301,720753657205,5801%
Iowa000091,9200%
Kansas28502285771,5400%
Kentucky7,2466,093791,074198,6403%
Louisiana33,41931,08402,335218,10014%
Maine2,6672,563010496,4803%
Maryland12,4435,6012,8703,972148,4804%
Massachusetts37,92437,580132212320,92012%
Michigan12,48912,3841689330,8404%
Minnesota36,59136,59100149,66024%
Mississippi16,67514,69701,978172,0209%
Missouri27,36211,65331415,395199,4006%
Montana33330027,420<1%
Nebraska11110045,340<1%
Nevada9,99805149,48460,2000%
New Hampshire28280035,120<1%
New Jersey16,30914,2111,898200229,6606%
New Mexico13,44313,142301086,00015%
New York218,678201,44416,474760900,48022%
North Carolina25,30619,7642,4573,085345,2406%
North Dakota000017,5400%
Ohio17,36814,2941,1311,943376,0404%
Oklahoma15601560124,1200%
Oregon27,87222,1937484,931128,18017%
Pennsylvania124,470111,4313,3839,656469,58024%
Rhode Island1,610111,599043,360<1%
South Carolina62,13322,518039,615164,72014%
South Dakota000022,8800%
Tennessee79,56179,56100285,10028%
Texas162,745130,21022932,306740,94018%
Utah8,0368,0360039,62020%
Vermont000030,8800%
Virginia5,3791,7371633,479204,9001%
Washington26,22624,5741,6520200,04012%
West Virginia3713710093,240<1%
Wisconsin24,64021,3091,8281,503180,02012%
Wyoming000012,3800%
NOTE: Excludes Puerto Rico. Blank cells indicate no plans offered.SOURCE: Authors’ analysis of CMS Medicare Advantage enrollment and Landscape files, 2016. Number of dual eligibles by state is derived from the CMS Chronic Conditions Data Warehouse standard analytic files for 2014.
Table A9. Enrollment in Dual Eligible Special Needs Plans and Financial/Administrative Alignment Demonstrations, by State, 2016
StateEnrollment in Dual Eligible Special Needs Plans (D-SNPs)Enrollment in Financial Alignment Demonstration
20132016Change,2013-2016
Total U.S.1,099,1001,482,050382,950365,826
Alabama38,28151,10312,8220
Alaska0000
Arizona68,49580,15611,6610
Arkansas9,18912,8773,6880
California190,668145,860-44,808126,057
Colorado8,4449,4179730
Connecticut4,61214,3109,6980
Delaware7339882550
District of Columbia1,7564,0452,2890
Florida135,100232,58197,4810
Georgia17,50052,12034,6200
Hawaii15,44220,0684,6260
Idaho6622,1201,4580
Illinois5,61711,5615,94448,192
Indiana2,9981,720-1,2780
Iowa7260-7260
Kansas0000
Kentucky6836,0935,4100
Louisiana18,35431,08412,7300
Maine2,5532,563100
Maryland5,4805,6011210
Massachusetts23,61637,58013,96412,524
Michigan15,49012,384-3,10634,177
Minnesota36,97536,591-38436,591
Mississippi9,33614,6975,3610
Missouri8,38311,6533,2700
Montana033330
Nebraska1,07311-1,0620
Nevada120-120
New Hampshire1228160
New Jersey23,74514,211-9,5340
New Mexico6,07613,1427,0660
New York124,216201,44477,2285,801
North Carolina10,58519,7649,1790
North Dakota0000
Ohio11,75414,2942,54062,177
Oklahoma0000
Oregon19,27122,1932,9220
Pennsylvania93,372111,43118,0590
Rhode Island11110
South Carolina9,21322,51813,3051,418
South Dakota0000
Tennessee51,76079,56127,8010
Texas87,476130,21042,73448,010
Utah7,4978,0365390
Vermont0000
Virginia6351,7371,10227,470
Washington16,98824,5747,5860
West Virginia443713270
Wisconsin14,27821,3097,0310
Wyoming0000
NOTE: Excludes Puerto Rico. Blank cells indicate no plans offered. Excludes dual eligible beneficiaries enrolled in financial/administrative alignment demonstrations who are missing state designation. All enrollment is from March of the respective year.SOURCE: Authors’ analysis of CMS Medicare Advantage enrollment and Landscape files, 2013 and 2016.

Endnotes

  1. The ACA reductions in payments to plans will be fully implemented in 2017. ↩︎
  2. G. Jacobson, P. Neuman, and A. Damico. “At Least Half of New Medicare Advantage Enrollees Had Switched From Traditional Medicare During 2006-11,” Health Affairs, vol. 34 no. 1, p. 48-55, January 2015. Also see G. Jacobson, T. Neuman, and A. Damico. “Medigap Enrollment Among New Medicare Beneficiaries: How Many 65-Year Olds Enroll In Plans With First-Dollar Coverage?” Washington DC: Kaiser Family Foundation, April 2015. Available at: https://modern.kff.org/medicare/issue-brief/medigap-enrollment-among-new-medicare-beneficiaries/, Last accessed June 5, 2015. ↩︎
  3. F. McArdle, T. Neuman and J. Huang. “Retiree Health Benefits at the Crossroads”. Washington DC: Henry J. Kaiser Family Foundation, April 2014. Available at: https://modern.kff.org/medicare/report/retiree-health-benefits-at-the-crossroads/. ↩︎
  4. Sutherly, B. “OPERS Retirees Face Big Changes.” The Columbus Dispatch. November 27, 2015. Available at: http://www.dispatch.com/content/stories/local/2015/11/27/opers-retirees-face-big-changes.html. ↩︎
  5. Medicare Payment Advisory Commission “Chapter 13. The Medicare Advantage Program: Status Report” in Report to Congress: Medicare Payment Policy, Washington DC, March 2015. pp 313-343. ↩︎
  6. Centers for Medicare and Medicaid Services, “Announcement of Calendar Year (CY) 2017 Medicare Advantage Capitation Rates and Medicare Advantage and Part D Payment Policies and Final Call Letter,” April 4, 2016. Available at: https://www.cms.gov/Medicare/Health-Plans/MedicareAdvtgSpecRateStats/Downloads/Announcement2017.pdf. ↩︎
  7. In the fall of 2015, we calculated that beneficiaries who were enrolled in Medicare Advantage plans at that time would pay a premium of $41 per month in 2016, compared to $38 per month in 2015, which assumed they remained in the same plan. Among Medicare Advantage enrollees in 2016, the average premium actually paid by enrollees ($37 per month) is slightly lower than the amount estimated in the fall, with the difference in estimates reflecting both changes in beneficiaries enrolled in Medicare Advantage plans from 2015 to 2016 and shifts by enrollees among plans and plan types. ↩︎
  8. G. Jacobson, M. Gold, A. Damico, T. Neuman, and G. Casillas. “Medicare Advantage 2016 Data Spotlight: Overview of Plan Changes,” Washington DC: Henry J. Kaiser Family Foundation, December 2015. Available at: https://modern.kff.org/medicare/issue-brief/medicare-advantage-2016-data-spotlight-overview-of-plan-changes/. ↩︎
  9. In Minnesota, 69% of private plan enrollment is in cost plans, which have higher average premiums than Medicare Advantage plans. ↩︎
  10. Limits were required for regional PPOs since they were first authorized in 2006. ↩︎
  11. J. Hoadley, J. Cubanski, and T. Neuman, “Medicare Part D: A First Look At Plan Offerings in 2016” Kaiser Family Foundation, October 2015. ↩︎
  12. J. Hoadley, J. Cubanski, and T. Neuman, “Medicare Part D at Ten Years: The 2015 Marketplace and Key Trends, 2006-2015,” Kaiser Family Foundation, October 2015. ↩︎
  13. See https://www.anthem.com/health-insurance/about-us/anthem-overview. ↩︎
  14. CMS conducted a demonstration between 2012 and 2014 that provided bonus payments to the vast majority of plans. For more information, see G. Jacobson, T. Neuman, A. Damico and J. Huang, “Medicare Advantage Plan Star Ratings and Bonus Payments in 2012,” Kaiser Family Foundation, November 2011. Available at: https://modern.kff.org/medicare/report/medicare-advantage-2012-star-ratings-and-bonuses/. ↩︎
  15. G. Jacobson, C. Swoope, M. Perry, and M.C. Slosar. “How are Seniors Choosing and Changing Health Insurance Plans?” Kaiser Family Foundation, May 2014. Available at: https://modern.kff.org/medicare/report/how-are-seniors-choosing-and-changing-health-insurance-plans/. ↩︎
  16. T. Neuman, G. Casillas, and G. Jacobson. “Medicare Advantage and Traditional Medicare: Is the Balance Tipping?” Washington DC: Henry J. Kaiser Family Foundation, October 2015. Available at: https://modern.kff.org/report-section/medicare-advantage-and-traditional-medicare-is-the-balance-tipping-issue-brief/. ↩︎

Survey Of Non-Group Health Insurance Enrollees Early Release Methodology

Published: May 10, 2016

The Kaiser Family Foundation (KFF) Survey of Non-Group Health Insurance Enrollees is the third in a series of surveys examining the views and experiences of people who purchase their own health insurance. The survey was designed and analyzed by researchers at KFF. SSRS collaborated with KFF researchers on sample design and weighting, and supervised the fieldwork. KFF paid for all costs associated with the survey.

The survey was conducted by telephone from February 9 through March 26, 2016 among a random sample of 786 adult U.S. residents who purchase their own insurance. The findings presented in this chart are based on a subset of the full survey sample that obtained coverage from a state or federal Health Insurance Marketplace (N=512). Computer-assisted telephone interviews conducted by landline and cell phone were carried out in English and Spanish by SSRS. Respondents were considered eligible for the survey if they met the following criteria:• Between the ages of 18-64• Currently covered by health insurance that they purchase themselves or purchased insurance that would begin in the next month• Not covered by health insurance through an employer, COBRA, Medicare, Medicaid, a parent’s plan, or the U.S. military or VA• If a small business owner, the health insurance they purchase is only for themselves and/or their family, and does not cover non-related employees of their business

Because the study targeted a low-incidence population, the sample was designed to increase efficiency in reaching this group, and consisted of three parts: (1) respondents reached through random digit dialing (RDD) landline and cell phone (N=142); (2) respondents reached by re-contacting those who indicated in a previous RDD survey that they either purchased their own insurance or were uninsured (N=234); (3) respondents reached as part of the SSRS Omnibus survey (N=410), a weekly, nationally representative RDD landline and cell phone survey. All RDD landline and cell phone samples were generated by Marketing Systems Group.

A multi-stage weighting process was applied to correct for the sample design, and to ensure an accurate representation of the national population of non-group enrollees ages 18-64 by age, gender, education, race/ethnicity, region, population density, marital status, and phone use.

All statistical tests of significance account for the effect of weighting. The margin of sampling error (MOSE) including the design effect is plus or minus 5 percentage points for results based on those with Marketplace plans. For other subgroups the margin of sampling error may be higher.