KFF designs, conducts and analyzes original public opinion and survey research on Americans’ attitudes, knowledge, and experiences with the health care system to help amplify the public’s voice in major national debates.
A new Kaiser Family Foundation report finds that donor governments provided US$1.3 billion in bilateral funding for family planning programs in low- and middle-income countries in 2015, essentially matching 2014 levels in real terms (after accounting for exchange rate fluctuations and inflation). In current U.S. dollars, however, 2015 funding was 6 percent below the 2014 level, largely due to the appreciation of the U.S. dollar.
When measured in their currency of origin, the report finds five donors actually increased funding, while three donors decreased, and two donors remained flat.
The U.S. was the largest donor, providing US$638 million, or nearly half of all bilateral funding for family planning programs in 2015. The U.K. (US$270 million) was the second largest bilateral donor, followed by the Netherlands (US$166 million), France (US$69 million), and Sweden (US$66 million).
Among the ten donor countries profiled in the analysis, eight made commitments at the London Summit on Family Planning in 2012; seven of the eight are on track towards fulfillment of these commitments.
This analysis is being released at the same time as Family Planning 2020’s (FP2020) annual report on progress toward goals agreed upon at the 2012 London Summit on Family Planning.
2015 marks the fourth year that the Kaiser Family Foundation has been analyzing donor government funding for family planning, tracking progress against commitments made at the 2012 London Summit on Family Planning.1 After steady increases since the Summit, funding for bilateral family planning activities remained essentially flat in 2015 in real terms (after adjusting for the effects of exchange rate fluctuations and inflation). However, in current U.S. dollars, 2015 funding (US$1.3 billion) was 6% below the 2014 level. The decrease in current U.S. dollars was largely due to a complex set of factors, primarily the appreciation of the U.S. dollar, but also to real declines by several donors. In addition to bilateral funding, donor governments also contributed US$392.6 million in core contributions to the United Nations Population Fund (UNFPA) in 2015, a decrease of US$78.9 million (-17%) below 2014 levels, similarly due to the appreciation of the U.S. dollar. Among the donor governments profiled, eight made specific commitments as part of the London Summit, seven of which are on track to meet these commitments.
Key findings include:
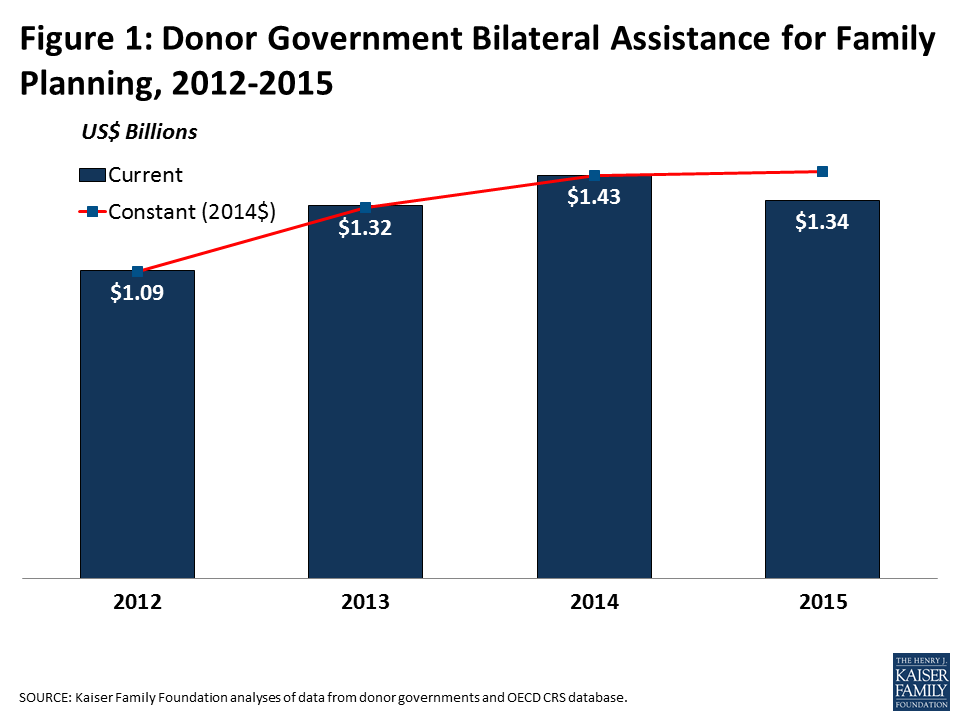
In 2015, donor governments provided US$1.3 billion for bilateral family planning programs, essentially matching the 2014 level (US$1.4 billion) when measured in real terms (after adjusting for the effects of exchange rate fluctuations and inflation). In current dollars, 2015 funding was 6% below (-US$88.6 million) 2014, and essentially a return to 2013 levels, though still above the 2012 baseline (see Table 1 and Appendix 1).
The decline, when measured in current U.S. dollars, is due to a complex set of factors, primarily the significant appreciation of the U.S. dollar, resulting in the depreciation of most other donor currencies, but also to real declines by several donors. In their currency of origin, five donors (Denmark, France, Germany, the Netherlands, and Sweden) increased, while funding from three donors (Australia, Norway, and the U.K.) declined. Funding from the U.S. and Canada remained flat. Despite the real declines by several donors, when the effects of the exchange rate fluctuations are removed, 2015 funding essentially matches 2014 levels.
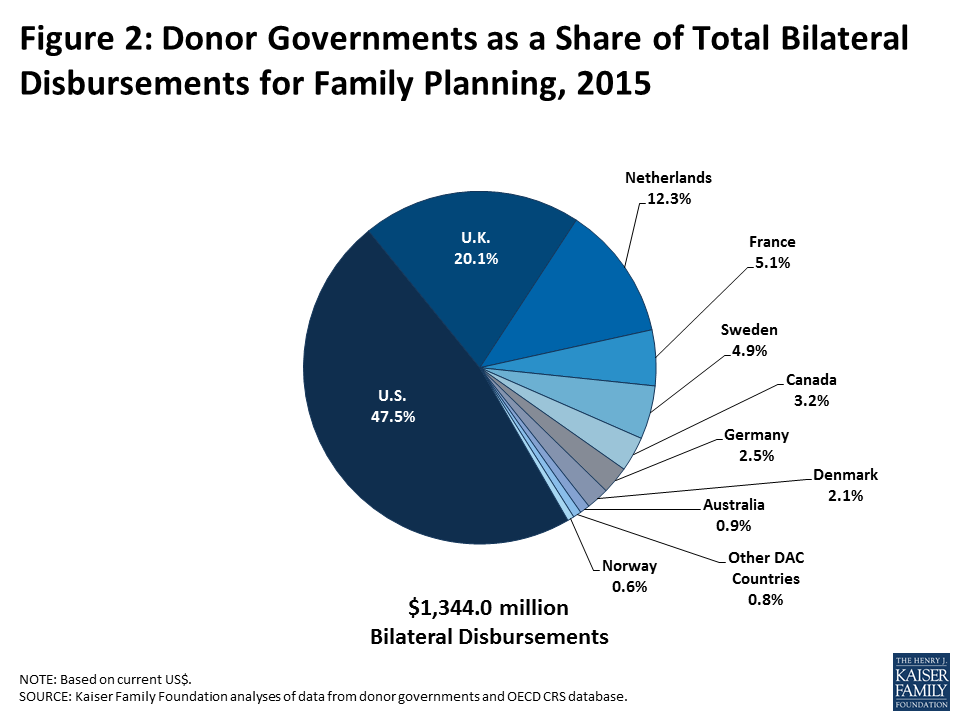
The U.S. was the largest bilateral donor to family planning in 2015, providing US$638.0 million or almost half (47%) of total bilateral funding. The U.K. (US$269.9 million, 20%) was the second largest donor, followed by the Netherlands (US$165.8 million, 12%), France (US$68.6 million, 5%), and Sweden (US$66.0 million, 5%). Funding trends for family planning have been primarily driven by the two largest donors, the U.S. and U.K., which have accounted for approximately two-thirds of total funding between 2012 and 2015.
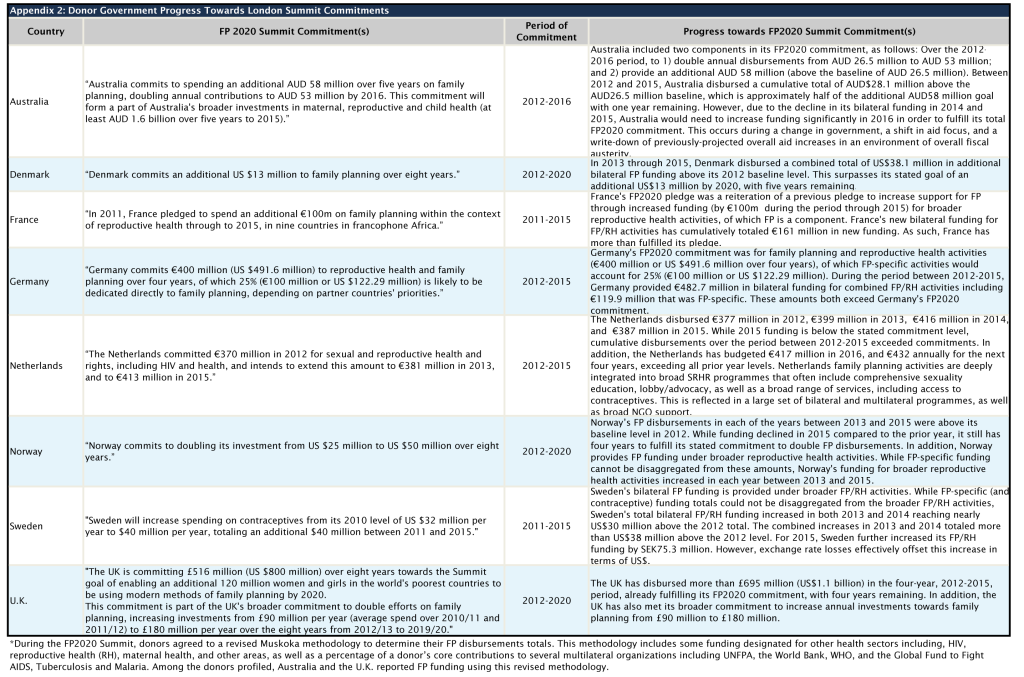
Among the 10 donors profiled, 8 made commitments during the 2012 London Summit on Family Planning: Australia, Denmark, France, Germany, the Netherlands, Norway, Sweden, and the U.K., of which all but one are on track towards fulfilling these commitments. Australia had made progress in prior years, but due to recent declines would need to significantly increase funding in order to fulfill its commitment (see Appendix 2).
In addition to donor contributions to UNFPA that are earmarked for family planning, and are therefore counted as bilateral funding above, the donors examined also provided US$392.6 million in core contributions to UNFPA. This too was a decline – US$78.9 million below the 2014 level (US$471.5 million). Similar to bilateral funding, much of this decline can be attributed to the appreciation of the U.S. dollar. In fact, when measured in the currency of origin, all of the donors profiled essentially maintained their contribution to UNFPA’s core resources at the prior year level, with the exception of Denmark, which increased funding. Among the donor governments profiled, Sweden provided the largest core contribution to UNFPA in 2015 (US$57.4 million), followed by Norway (US$55.6 million), the Netherlands (US$39.7 million), and Denmark (US$35.7).2
Table 1: Donor Government Bilateral Disbursements for Family Planning, 2012-2015 (in current US$, millions)
Country
2012
2013
2014
2015
Difference
2014 – 2015
2012 – 2015
Australia
$43.2
$39.5
$26.6
$12.4
$-14.2(-53.4%)
$-30.8(-71.3%)
Canada
$41.5
$45.6
$48.3
$43.0
$-5.3(-11%)
$1.5(3.6%)
Denmark
$13.0
$20.3
$28.8
$28.1
$-0.7(-2.4%)
$15.1(116.2%)
France
$49.6
$37.2
$69.8
$68.6
$-1.2(-1.7%)
$19(38.3%)
Germany
$47.6
$38.2
$31.3
$34.0
$2.7(8.6%)
$-13.6(-28.6%)
Netherlands
$105.4
$153.7
$163.6
$165.8
$2.2(1.3%)
$60.4(57.3%)
Norway
$3.3
$20.4
$20.8
$8.1
$-12.7(-61.1%)
$4.8(145.5%)
Sweden
$41.2
$50.4
$70.2
$66.0
$-4.2(-6%)
$24.8(60.2%)
U.K.
$252.8
$305.2
$327.6
$269.9
$-57.7(-17.6%)
$17.1(6.8%)
U.S.
$485.0
$585.0
$636.6
$638.0
$1.4(0.2%)
$153(31.5%)
Other DAC Countries*
$11.0
$29.5
$9.0
$10.1
$1.1(12.4%)
$-0.9(-7.7%)
Total
$1,093.6
$1,325.0
$1,432.7
$1,344.0
$-88.6 (-6.2%)
$250.4 (22.9%)
*Austria, Belgium, Czech Republic, European Union, Finland, Greece, Iceland, Ireland, Italy, Japan, Korea, Luxembourg, New Zealand, Poland, Portugal, the Slovak Republic, Slovenia, Spain, and Switzerland.
Report
Introduction
At the London Summit on Family Planning (FP2020), the global community made commitments totaling US$2.6 billion in additional funding for family planning by 2020 (see Box 1). With the commitment period of several donors coming to an end in 2015 and with 2016 marking the halfway point towards fulfillment of the FP2020 goals, it is important to assess the progress made as well as plans moving forward. The status of global funding for family planning takes on added relevance as donors navigate additional budgetary and other pressures, including the ongoing refugee crisis and other competing demands, as well as the effects of Brexit.
Box 1: London Summit on Family Planning
In July 2012, the U.K. Government and the Bill & Melinda Gates Foundation, in partnership with UNFPA, civil society organizations, developing countries, donor governments, the private sector, and multilateral organizations met at the London Summit on Family Planning (FP2020) and made commitments aimed at improving access to voluntary family planning services.
London Summit on Family Planning Goals & Outcomes: “By 2020, the goal is to deliver contraceptives, information, and services to a total of 380 million women and girls in developing countries so they can plan their families.”
Sustain coverage for the estimated 260 million women in the world’s poorest countries who are currently using contraceptives (as of June 2012); and
Provide family planning for an additional 120 million women in these countries.
The Summit resulted in stated commitments totaling US$2.6 billion in additional funding for family planning activities from all sources (donor governments, non-governmental organizations, philanthropies, multilateral organizations, and domestic resources).
While funding from all sources – domestic public and private spending, donor government bilateral assistance, multilateral organizations, and private philanthropy (see Box 2) – is needed to help fulfill international family planning goals and commitments, donor governments provide a significant share of the total.3 Following the London Summit, the Kaiser Family Foundation conducted an analysis of donor government funding for family planning activities in 2012 to establish a FP funding baseline that could be used to track funding levels over time as well as specific donor government progress in meeting the Summit’s commitments.
Box 2: Other Sources of Funding for FP in Low- & Middle-Income Countries
In addition to donor governments, there are three other major funding sources for family planning assistance: multilateral organizations, the private sector, and domestic resources.
Multilateral Organizations: Multilateral organizations are international organizations made up of member governments (and in some cases private sector and civil society representatives), who provide both core contribution support and donor-directed funding for specific projects. Core support from donors is pooled by the multilateral organization which in turn directs its use, such as for family planning. Donor-directed or earmarked funding, even when provided through a multilateral organization, is considered part of a donor’s bilateral assistance.
The primary multilateral organization focused on family planning is the United Nations Population Fund (UNFPA), which estimates that it spent US$341 million (US$92 million from core resources and US$249 million from non-core resources), or 42.7% of its total resources, on family planning activities in 2015.4 Another important source of multilateral assistance for family planning is the World Bank which provides such funding under broader population and reproductive health activities. In 2014, the World Bank estimates that it spent US$251 million on population and reproductive health, an increase of US$30 million above the 2013 level (US$221 million).5 With the creation of the Global Financing Facility (GFF), the World Bank is expected to play an increasingly important role in supporting family planning activities.
Private Sector: Foundations (charitable and corporate philanthropic organizations), corporations, faith-based organizations, and international non-governmental organizations (NGOs) provide support for FP activities in low- and middle-income countries not only in terms of funding, but through in-kind support; commodity donations; and co-investment strategies with government and other sectors. For instance, the Bill & Melinda Gates Foundation has become a major funder of global health efforts, including family planning activities, and is a core partner of FP2020. In 2015, the Gates Foundation provided US$148 million for family planning.6
Domestic Resources: Domestic resources include spending by country governments that also receive international assistance for FP and spending by households/individuals within these countries for FP services. Such resources represent a significant and critical part of the response. Since the London Summit, a total of 36 low- and middle-income countries have made specific commitments to increase their family planning spending.
This report provides an analysis of donor government bilateral funding for family planning activities in 2015 compared to prior year levels. It includes data from the 29 governments who were members of the Organisation for Economic Co-operation and Development (OECD), Development Assistance Committee (DAC) in 2015.7 Data were collected directly from ten donors, who represent approximately 99% of bilateral family planning funding, and are profiled in this report: Australia, Canada, Denmark, France, Germany, the Netherlands, Norway, Sweden, the U.K., and the U.S. Data for the remaining DAC members was obtained from the OECD Credit Reporting System (CRS). For purposes of this analysis, family planning services were defined to include the following activities as specified in the CRS: “counseling; information, education and communication (IEC) activities; delivery of contraceptives; capacity building and training.”8 Bilateral totals include actual funding amounts provided (e.g., cash transfers) as well as other types of transactions and activities (e.g., technical assistance), products (e.g., commodities), and donor government earmarked contributions to multilateral organizations (e.g. contributions to the Global Programme to Enhance Reproductive Health Commodity Security at UNFPA).
Where bilateral family planning funding was included as part of broader reproductive and maternal health activities or other non-health-sector activities, we worked directly with donor governments to identify family planning specific amounts to the extent possible (see Methodology for more information). Where it was not possible to disaggregate FP funding from broader reproductive and maternal health activities, the estimated level of family planning funding may be an overestimate. At the same time, some family planning funding provided under non-health-sectors remains largely unidentified, likely resulting in an underestimate of total family planning funding.
Findings
Bilateral Assistance
In 2015, donor governments disbursed9 US$1,344.0 million in bilateral funding for family planning activities (see Table 1, Figure 1 & Appendix 1), essentially flat compared to 2014 when measured in real terms (adjusting for the effects of exchange rate fluctuations and inflation). However, when measured in current U.S. dollars, 2015 was a decrease of US$88.6 million (-6%) below 2014 levels (US$1,432.7 million) and essentially a return to 2013 levels (US$1,325.0 million). The decline, when measured in current U.S. dollars, is due to a complex set of factors, primarily the significant appreciation of the U.S. dollar in 2015, which resulted in the depreciation of most other donor currencies, but also to real declines (in currency of origin) by several donors. Among the donors profiled, five (Denmark, France, Germany, the Netherlands, and Sweden) actually increased FP funding in 2015 – when measured in their currencies of origin, while funding from three donors (Australia, Norway, and the U.K.) declined. Funding from two donors (Canada and the U.S.) remained flat. Despite the decline in 2015 compared to 2014, donor government bilateral assistance for family planning is still approximately US$250 million above the 2012 baseline (US$1,093.6 million).
Figure 1: Donor Government Bilateral Assistance for Family Planning, 2012-2015
The United States (US$638.0 million) was the largest bilateral donor in 2015 accounting for almost half (47%) of total bilateral assistance (see Figure 2). The U.K. (US$269.9 million, 20%) was the second largest bilateral donor, followed by the Netherlands (US$165.8 million, 12%), France (US$68.6 million, 5%), and Sweden (US$66.0 million, 5%).
Figure 2: Donor Governments as a Share of Total Bilateral Disbursements for Family Planning, 2015
While the majority of donor governments increased family planning funding between 2012 and 2015, recent trends have been largely driven by the two largest donors, the U.S. and U.K., which have accounted for approximately two-thirds of total funding over the period.
Progress Towards FP2020 Commitments
Eight of the donor governments profiled in this analysis made multi-year commitments at the FP2020 Summit in 2012: Australia, Denmark, France, Germany, the Netherlands, Norway, Sweden, and the U.K. (see Appendix 2). Data collected for 2012-2015 indicate that seven of the eight donors have either fulfilled or are on track to fulfill their FP2020 commitment including: Denmark, France, Germany, the Netherlands, Norway, Sweden, and the U.K. Australia, whose commitment period ends in 2016, had made progress, but due to recent declines, would need to significantly increase family planning funding in 2016 in order to fulfill its commitment.
Donor Contributions to UNFPA
While the majority of donor government assistance for family planning is provided bilaterally, donors also provide support for family planning activities through contributions to the United Nations Population Fund (UNFPA) (see Box 3).10 Most of UNFPA’s funding is from donor governments, which provide funding in two ways: 1) donor directed or earmarked contributions for specific activities (e.g. donor contributions to the Global Programme to Enhance Reproductive Health Commodity Security at UNFPA), which are included as part of bilateral funding; and 2) general contributions to “core” activities that are untied and meant to be used for both programmatic activities (family planning, population and development, HIV-AIDS, gender, and sexual and reproductive health and rights) and operational support as determined by UNFPA.
Box 3: United Nations Population Fund (UNFPA) Mission, Goals, & London Summit on Family Planning Commitment
Created in 1969, UNFPA supports sexual and reproductive health activities in many low- and middle-income countries and was a key partner in the London Summit on Family Planning.
UNFPA Goal: “The goal of UNFPA is to deliver a world a world where every pregnancy is wanted, every childbirth is safe and every young person’s potential is fulfilled. To accomplish this, UNFPA works to ensure that all people, especially women and young people, are able to access high quality sexual and reproductive health services, including family planning, so that they can make informed and voluntary choices about their sexual and reproductive lives.”11
UNFPA Mandate:
“Build the knowledge and the capacity to respond to needs in population and family planning;
Promote awareness in both developed and developing countries of population problems and possible strategies to deal with these problems;
Assist their population problems in the forms and means best suited to the individual countries’ needs; and
Assume a leading role in the United Nations system in promoting population programmes, and to coordinate projects supported by the Fund.”12
UNFPA London Summit on Family Planning Commitment: “UNFPA will double the proportion of its resources focused on family planning from 25% to 40 % based on current funding levels, bringing new funding of at least US$174 million per year from core and noncore funds. This will include a minimum of US $54 million per year, from 2013-2019, in increased funding for family planning from UNFPA’s core resources.”
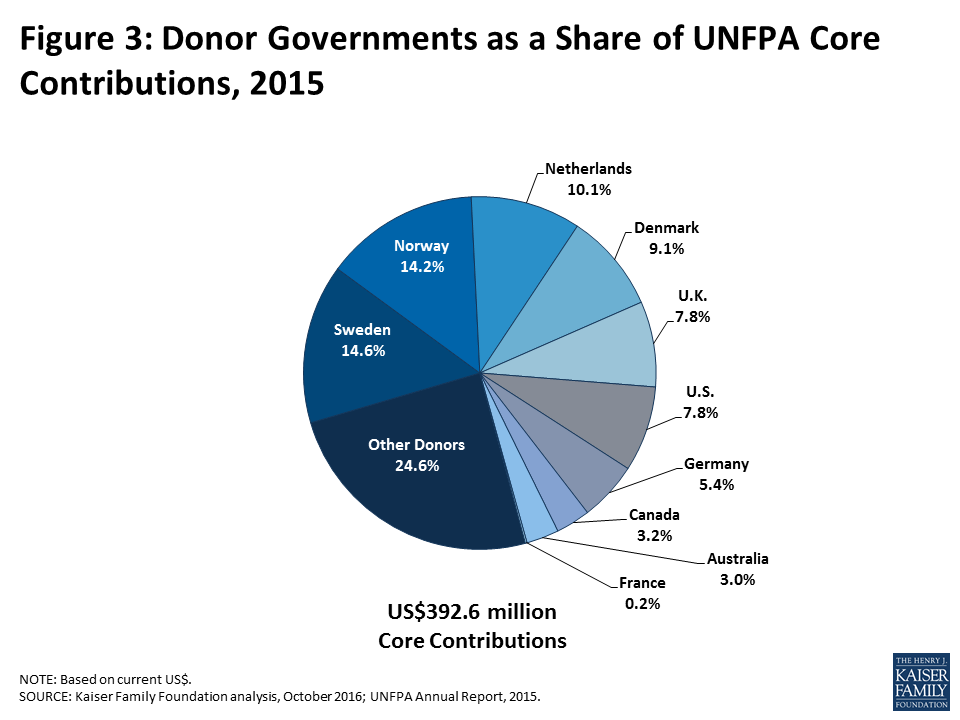
In 2015, donor governments provided US$392.6 million in core contributions to UNFPA, a decrease of US$78.9 million (-17%) below 2014 levels (US$471.5 million). Similar to bilateral funding, much of this decline can be attributed to the appreciation of the U.S. dollar. In fact, when measured in the currency of origin, all of the donors profiled essentially maintained their contribution to UNFPA’s core resources at the prior year level, with the exception of Denmark, which increased funding. Sweden provided the largest core contribution to UNFPA in 2015 (US$57.4 million), followed by Norway (US$55.6 million), the Netherlands (US$39.7 million), and Denmark (US$35.7) (see Figure 3 and Table 2).13 Among the ten donors profiled, two provided a larger contribution to UNFPA’s core resources than their total bilateral disbursement for family planning: Denmark and Norway.
Figure 3: Donor Governments as a Share of UNFPA Core Contributions, 2015
Table 2: Donor Government Contributions to UNFPA (Core Resources), 2012-2015 (in current US$, millions)
Country
2012
2013
2014
2015
Difference
2014 – 2015
2012 – 2015
Australia
$14.9
$15.6
$13.9
$11.7
$-2.2(-15.8%)
$-3.2(-21.5%)
Canada
$17.4
$16.0
$14.0
$12.4
$-1.6(-11.5%)
$-5(-28.7%)
Denmark
$44.0
$40.4
$41.9
$35.7
$-6.2(-14.8%)
$-8.3(-18.9%)
France
$0.5
$0.0
$0.0
$0.6
–
$0.1(20%)
Germany
$20.7
$24.0
$24.7
$21.3
$-3.4(-13.8%)
$0.6(2.9%)
Netherlands
$49.0
$52.4
$48.4
$39.7
$-8.7(-18%)
$-9.3(-19%)
Norway
$59.4
$70.6
$69.1
$55.6
$-13.5(-19.5%)
$-3.8(-6.4%)
Sweden
$66.3
$65.8
$70.3
$57.4
$-12.9(-18.3%)
$-8.9(-13.4%)
U.K.
$31.8
$31.5
$33.1
$30.8
$-2.3(-6.8%)
$-1(-3.1%)
U.S.
$30.2
$28.9
$31.1
$30.8
$-0.3(-1%)
$0.6(2%)
Other Donors
$98.0
$108.8
$125.0
$96.6
$-28.4(-22.7%)
$-1.4(-1.4%)
Total
$432.2
$454.0
$471.5
$392.6
$-78.9 (-16.7%)
$-39.6 (-9.2%)
Conclusion
After several years of funding increases since the 2012 London Summit on Family Planning, donor government funding for family planning was essentially flat in 2015 in real terms, and fell when measured in current U.S. dollars. While the decline was primarily driven by the appreciation of the U.S. dollar, some donors did reduce funding, as measured in their currencies of origin. At the same time, seven of the eight profiled who made commitments at the London Summit, have either fulfilled or are on track towards fulfilling their commitments. Still, as donor commitment periods come to an end and given the uncertainty associated with the value of the U.S. dollar, it is unclear what the scope of support for family planning will be going forward.
Methodology
Methodology
Bilateral and multilateral data on donor government assistance for family planning (FP) in low- and middle-income countries were collected from multiple sources. The research team collected the latest bilateral assistance data directly for 10 governments: Australia, Canada, Denmark, Germany, France, the Netherlands, Norway, Sweden, the United Kingdom, and the United States during the first half of 2016. Data represent the fiscal year 2015 period for all governments. Direct data collection from these donors was desirable because they represent the preponderance of donor government assistance for family planning and the latest official statistics – from the Organisation for Economic Co-operation and Development (OECD) Creditor Reporting System (CRS) (see: http://www.oecd.org/dac/stats/data) – which are from 2014 and do not include all forms of international assistance (e.g., funding to countries such as Russia and the Baltic States that are no longer included in the CRS database). In addition, the CRS data may not include certain funding streams provided by donors, such as FP components of mixed-purpose grants to non-governmental organizations. Data for all other OECD DAC member governments – Austria, Belgium, the European Commission, Finland, Greece, Ireland, Italy, Japan, Korea, Luxembourg, New Zealand, Portugal, Spain, and Switzerland – who collectively accounted for less than 2 percent of bilateral family planning disbursements, were obtained from the OECD CRS and are from calendar year 2014.
For purposes of this analysis, funding was counted as family planning if it met the OECD CRS purpose code definition: “Family planning services including counselling; information, education and communication (IEC) activities; delivery of contraceptives; capacity building and training.” Where it was possible to identify funding amounts, family-planning-related activities funded in the context of other official development assistance sectors (e.g. education, civil society) are included in this analysis. Project-level data were reviewed for Canada, Denmark, France, Germany, the Netherlands, Norway, and Sweden to determine whether all or a portion of the funding could be counted as family planning. Family-planning-specific funding totals for the United States were obtained through direct data downloads and communications with government representatives. Funding attributed to Australia and the United Kingdom is based on a revised Muskoka methodology as agreed upon by donors at the London Summit on Family Planning in 2012. Funding totals presented in this analysis should be considered preliminary estimates based on data provided by representatives of the donor governments who were contacted directly.
It was difficult in some cases to disaggregate bilateral family planning funding from broader reproductive and maternal health totals, as the two are sometimes represented as integrated totals. In addition, family-planning-related activities funded in the context of other official development assistance sectors (e.g. education, civil society) have in the past remained largely unidentified. For purposes of this analysis, we worked closely with the largest donors to family planning to identify such family-planning-specific funding where possible. In some cases (e.g. Canada), specific FP percentages were recorded for mixed-purpose projects. In other cases, it was possible to identify FP-specific activities by project titles in languages of origin, notwithstanding less-specific financial coding. In still other cases, detailed project descriptions were analyzed. (see Appendix 1 for detailed data table).
Bilateral funding is defined as any earmarked (FP-designated) amount and includes family planning-specific contributions to multilateral organizations (e.g. non-core contributions to the Global Programme to Enhance Reproductive Health Commodity Security at UNFPA). U.S. bilateral data correspond to amounts disbursed for the 2015 fiscal year. UNFPA contributions from all governments correspond to amounts received during the 2014 calendar year, regardless of which contributor’s fiscal year such disbursements pertain to.
With some exceptions, bilateral assistance data were collected for disbursements. A disbursement is the actual release of funds to, or the purchase of goods or services for, a recipient. Disbursements in any given year may include disbursements of funds committed in prior years and in some cases, not all funds committed during a government fiscal year are disbursed in that year. In addition, a disbursement by a government does not necessarily mean that the funds were provided to a country or other intended end-user. Enacted amounts represent budgetary decisions that funding will be provided, regardless of the time at which actual outlays, or disbursements, occur. In recent years, most governments have converted to cash accounting frameworks, and present budgets for legislative approval accordingly; in such cases, disbursements were used as a proxy for enacted amounts.
UNFPA core contributions were obtained from United Nations Executive Board documents. UNFPA estimates of total family planning funding provided from both core and non-core resources were obtained through direct communications with UNFPA representatives. Other than core contributions provided by governments to UNFPA, un-earmarked core contributions to United Nations entities, most of which are membership contributions set by treaty or other formal agreement (e.g., United Nations country membership assessments), are not identified as part of a donor government’s FP assistance even if the multilateral organization in turn directs some of these funds to FP. Rather, these would be considered as FP funding provided by the multilateral organization, and are not considered for purposes of this report.
The fiscal year period varies by country. The U.S. fiscal year runs from October 1-September 30. The Australian fiscal year runs from July 1-June 30. The fiscal years for Canada and the U.K. are April 1-March 31. Denmark, France, Germany, the Netherlands, Norway, and Sweden use the calendar year. The OECD uses the calendar year, so data collected from the CRS for other donor governments reflect January 1-December 31. Most UN agencies use the calendar year and their budgets are biennial.
All data are expressed in US dollars (USD). Where data were provided by governments in their currencies, they were adjusted by average daily exchange rates to obtain a USD equivalent, based on foreign exchange rate historical data available from the U.S. Federal Reserve (see: http://www.federalreserve.gov/) or in some cases from the OECD. Data obtained from UNFPA were already adjusted by UNFPA to represent a USD equivalent based on date of receipts.
Appendices
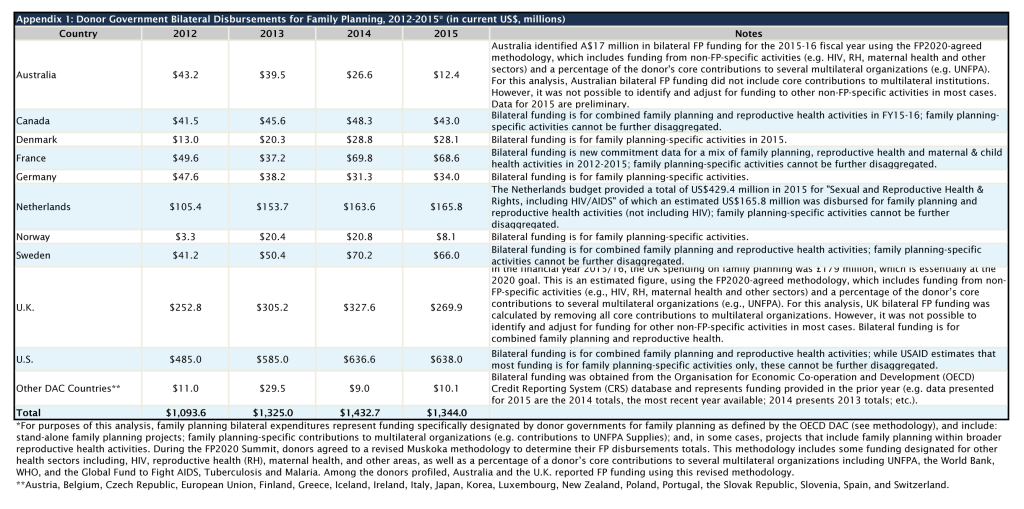
Appendix 1: Donor Government Bilateral Disbursements for Family Planning, 2012-2015* (in current US$, millions)Appendix 2: Donor Government Progress Towards London Summit Commitments
Endnotes
The Kaiser Family Foundation initiated a family planning resource tracking project in 2013, adapting the methodology it has long used to track donor government spending on HIV. Since 2002, the Joint United Nations Programme on HIV/AIDS (UNAIDS) and the Kaiser Family Foundation have been tracking donor government assistance for HIV in low- and middle-income countries by the donor government members of the Organization for Economic Co-operation and Development’s (OECD) Development Assistance Committee (DAC). For the methodological approach used to monitor donor government spending on HIV see: https://modern.kff.org/global-health-policy/report/financing-the-response-to-aids-in-low/. ↩︎
In 2014, Finland provided the third largest core contribution (US$60.4 million) to UNFPA, followed by the Netherlands. ↩︎
UNFPA, Financial Resource Flows for Population Activities Report 2011, 2013. ↩︎
UNFPA, Direct communication, September, 2016. UNFPA methodological note: “When accounting for Family Planning expenses, it is crucial to take into account the cross-cutting nature of this area of work. Family Planning is strictly inter-linked with other areas in which UNFPA operates such as integrated services on sexual and reproductive health, HIV/AIDS, gender equality and reproductive rights, adolescents and youth, data and analysis. For example, family planning is an integral part of the activities to provide or support integrated SRH services, such as post-partum family planning, post-abortion family planning, family planning services for HIV positive individuals, etc. UNFPA’s focus on adolescents and youth includes access to contraceptives information and services for adolescents through advocacy, comprehensive sexuality education or youth-friendly services. When UNFPA supports countries in advocating for gender equality and promoting reproductive rights, especially for marginalized women and girls, family planning services are the top priority on the agenda. Family planning is closely linked with population policies and strategies, and UNFPA assists governments to link family planning with population dynamics, while developing national strategies and build reliable population data and analysis. In light of these inter-linkages, the family planning expense hereby reported also takes into account the family planning component of expense that, while predominantly conducted under some other areas of UNFPA mandate, still contribute to the achievement of family-planning related results.” ↩︎
World Bank, Direct communication, August, 2014. ↩︎
Bill & Melinda Gates Foundation, Direct communication, September, 2016. ↩︎
Includes funding from 28 DAC member countries and the European Commission (EC). ↩︎
A disbursement is the actual release of funds to, or the purchase of goods or services for, a recipient. An enactment represents a budgetary decision that funding will be provided, regardless of the time at which an actual outlays, or disbursement, occurs. Therefore, disbursements in any given year may include funds committed (enacted) in prior years and in some cases, not all funds committed (enacted) during a government fiscal year are disbursed in that year. While most donor governments examined disburse enacted amounts within the same year, the U.S. government does not and may disburse enactments over multiple years. For instance, in FY 2013, U.S. bilateral enacted funding for family planning activities totaled $615.1 million, while disbursements totaled $585 million. ↩︎
In 2015, Finland, which was not directly profiled in this analysis, provided the fifth largest core contribution ($38.0 million) to UNFPA, followed by the U.S. ↩︎
The annual growth rate in per-person retail drug spending for people with coverage through a large employer was relatively low (between 0 and 5% each year for the past decade) until spiking to 13.0% in 2014. This slideshow explores prescription drug spending for people who are covered by large employer health plans.
A new Kaiser Family Foundation analysis finds that average annual out-of-pocket prescription drug spending for workers and family members decreased from a recent high of $167 in 2009 to $144 in 2014. Most of the decline in out-of-pocket spending occurred between 2009 and 2012 and is likely due to generic substitution for popular drugs that lost patent protection. The decline in out-of-pocket-spending continued from 2012 to 2014 with nearly two-thirds of the decline during this period attributable to the Affordable Care Act provision requiring most plans to cover contraception without cost sharing.
At the same time, the relatively small share of people spending more than $1,000 a year out-of-pocket on prescription drugs rose in the past decade, from 1 percent in 2004 to 2.8 percent in 2014, and their spending accounted for a third (33%) of all out-of-pocket drug spending by enrollees in large-employer plans in 2014, the study finds.
Focusing on drug spending for people who are insured through a large employer’s health plan, the analysis examined a sample of claims from large employer plans contained in the Truven Health Analytics MarketScan Commercial Claims and Encounters Database.
Other findings include:
Mirroring the national trend, average retail drug spending by employer plans spiked in 2014, rising 13 percent after growing relatively slowly for the previous nine years. Health plans absorbed much of the increase over the decade, spending an average $909 a year per person on prescription drugs in 2014, compared to $584 in 2004.
After the ACA began requiring plans to make birth control available without cost sharing, the percentage of women of reproductive age with out-of-pocket contraceptive spending fell sharply, from 22 percent in 2012 to 3.7 percent in 2014.
In an average month in 2014, about 0.5 percent — or approximately 375,000 people — covered by large-employer plans spent more than $250 on prescription drugs. Democratic presidential candidate Hillary Clinton has proposed a $250 per-month cap on out-of-pocket prescription drug spending.
The analysis is based on a sample of claims obtained from the Truven Health Analytics MarketScan Commercial Claims and Encounters Database, which has claims information provided by large employers and health plans, from the years 2004 through 2014. The analysis for each is limited to claims for enrollees with more than six months of enrollment in that year and claims paid on a fee-for-service basis. With these limitations, the number of enrollees in the sample varied from about 785,000 in 2004 to over 15.3 million in 2014.
Public Ranks Drug Costs and Sufficient Provider Networks Ahead of Affordable Care Act Changes as Health Care Priorities for Next President and Congress to Address
Most Say They Favor a “Public Option” to Compete with Private Marketplace Plans, But Views Are Malleable After Hearing Pro and Con Arguments
As the 2016 campaign nears its end, the latest Kaiser Health Tracking Poll examines the public’s view on health care priorities for the next president and Congress. Overall, Americans rank addressing high prescription drug costs and ensuring adequate provider networks in insurance plans among their top health care priorities.
Health care itself is not playing a major role in the election, as the poll finds the candidates’ characteristics, the economy and jobs, and foreign policy ranking are the top factors behind voters’ decision. The poll looks beyond the election to assess the public’s top health care priorities once the results are known.
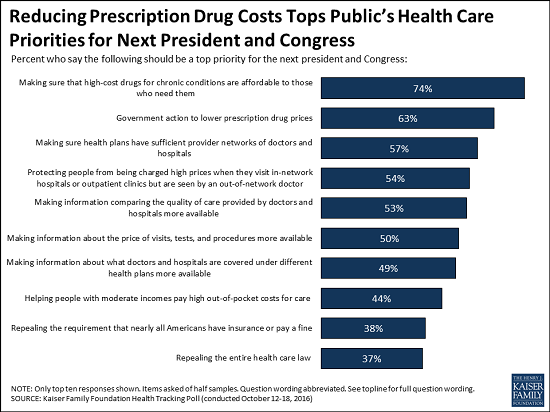
Making sure that high-cost drugs for chronic conditions are affordable to those who need them is viewed as a “top priority” by three quarters (74%) of the public, including large majorities of Democrats, Republicans and independents. In addition, nearly two-thirds (63%) of the public say government action to lower prescription drug prices is a top priority. Other top priorities include making sure health plans have sufficient doctor and hospital networks (57%) and protecting people from high charges when they visit an in-network hospital but are seen by an out-of-network doctor (54%).
Fewer cite various changes to the Affordable Care Act as top priorities for the next president and Congress, such as helping people with moderate incomes pay high out-of-pocket costs for medical care (44%), repealing the law entirely (37%), and repealing specific provisions requiring nearly all Americans to have health insurance or pay a fine (38%) and requiring employers with 50 or more workers to pay a fine if they don’t offer health insurance to their workers (29%). Among Republicans, however, repealing the Affordable Care Act entirely remains a top issue, ranking second among health care priorities.
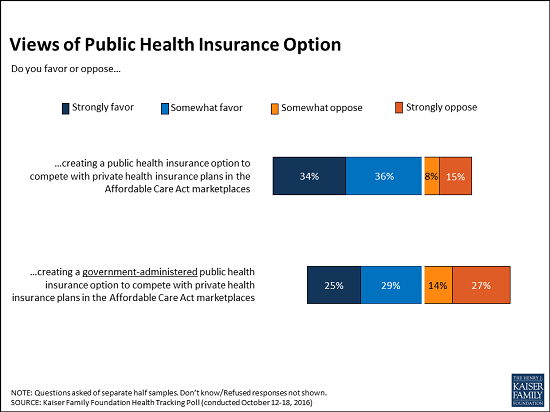
The poll also examines the public’s views of a public health insurance option to compete with private plans in the Affordable Care Act’s marketplaces, an idea being floated as some private insurers have decided to stop selling plans in many areas. While most Americans initially say they favor creating a public health insurance option to compete with private plans, how such a proposal is described and labeled significantly impacts level of support.
For example, when half of the sample are asked whether they favor or oppose creating a public health insurance option, 70 percent express a favorable view while one-fourth (24%) oppose. When the other half are asked whether they favor or oppose creating a government-administered public health insurance option, about half (53%) say they favor such a plan while 41 percent oppose.
In addition, some people’s opinion about a public option can shift when presented with arguments being made by those on the other side. For instance, one-fifth (21%) shifts their opinion from favor to oppose after hearing the argument often made by opponents that doctors and hospitals would be paid less, and 27 percent shifts to oppose after hearing that the government plan would have an unfair advantage over private insurers.
On the other side, about one in ten changes their stance from oppose to favor after hearing that the public option could help drive down costs through increased competition (13%), provide more choices to people getting insurance through the marketplaces (11%), or could be the only insurance option for people in areas where private insurers may not offer marketplace plans (11%).
When asked specifically about the future of the Affordable Care Act, the public remains divided. About one-third (32%) want the next president and Congress to repeal the entire law, and a similar share (31%) want Washington to expand what the health care law does. One in five (18%) want to see the law implemented as is, while 9 percent want to see it scaled back. There are huge partisan divisions on this question, with large majorities of Republicans and voters supporting Donald Trump wanting the entire law repealed or scaled back, and large majorities of Democrats and voters supporting Hillary Clinton wanting it expanded or implemented as is.
With the Affordable Care Act’s fourth open enrollment period for marketplace coverage beginning Nov. 1, the tracking poll examines the public’s view on the 2010 health care law, including which groups they think are better and worse off as a result of this legislation, and what sources they go to for information about the law.
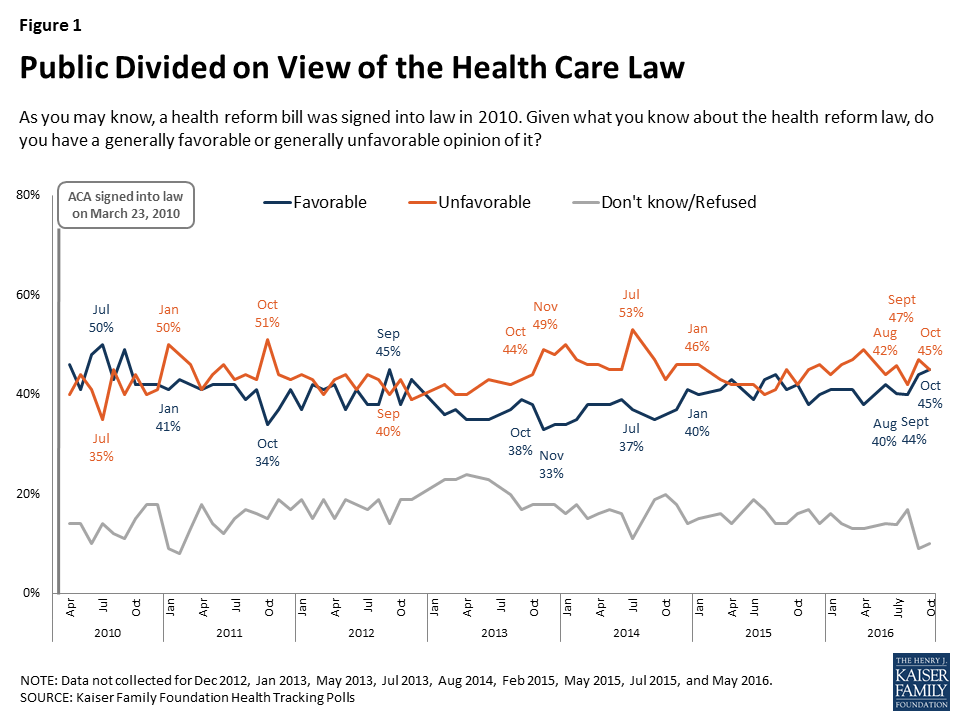
The public overall this month is evenly divided on the Affordable Care Act, with 45 percent reporting both a favorable and an unfavorable view. These views are largely stable, with few people changing their minds when presented with the other side’s arguments.
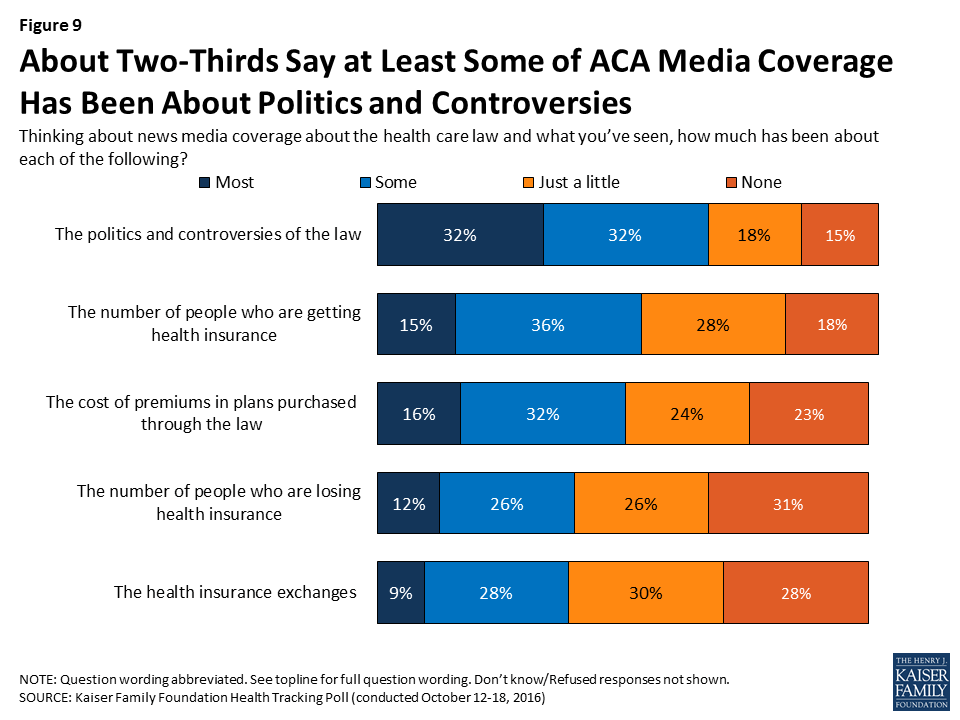
Overall, two-thirds (64%) of Americans say at least some of the news coverage they’ve seen about the health care law has been about politics and controversies. About half (51%) of Americans say at least some of the coverage has been about the number of people who are getting health insurance, higher than the share that says at least some has been about the number of people losing insurance (38%). Slightly less than half (47%) say at least some of the coverage has been about the cost of premiums in plans purchased through the law. To view all of the poll’s ACA-related findings, see the corresponding Data Note.
Designed and analyzed by public opinion researchers at the Kaiser Family Foundation, the poll was conducted from October 12-18 among a nationally representative random digit dial telephone sample of 1,205 adults. Interviews were conducted in English and Spanish by landline (424) and cell phone (781). The margin of sampling error is plus or minus 3 percentage points for the full sample. For results based on subgroups, the margin of sampling error may be higher.
With the Affordable Care Act’s fourth open enrollment period beginning on November 1st, this Data Note examines the public’s view on the 2010 health care law, including which groups they think are better and worse off as a result of this legislation, and what sources they go to for information about the law. The findings illustrate that in the six years since its passage, Americans not only remain divided on their opinions of the health care law but also in their perceptions of how the legislation is affecting different groups. In addition, the majority of Americans say the news coverage about the health care law has focused on the politics and controversies of the law while fewer say the news coverage has been about different aspects of the law’s implementation.
The Future of the Affordable Care Act
The October Kaiser Health Tracking Poll finds Americans’ opinions of the health care law remain divided, with equal shares (45 percent) saying they have a favorable view as saying they have an unfavorable view. Partisans differ in their attitudes towards the health care law, with the majority of Democrats expressing a favorable view (76 percent) while the majority of Republicans express an unfavorable one (83 percent). Independents lean negative, with 38 percent expressing a favorable view and 52 percent expressing an unfavorable view.
Figure 1: Public Divided on View of the Health Care Law
Americans’ Opinions of the ACA Are Largely Stable, Unswayed by Arguments
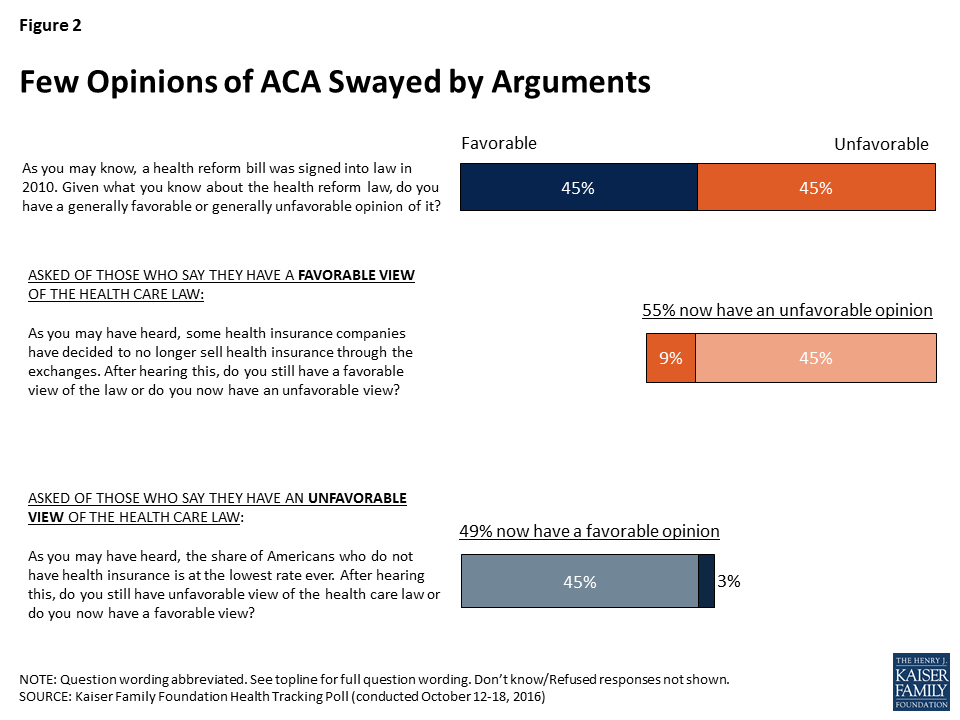
More than six years since the passing of the ACA, it appears that most Americans have largely stable attitudes towards the law, with few being persuaded from their opinions after hearing arguments for or against it. For example, a relatively small share (9 percent, overall) shift their opinion from favorable to unfavorable after hearing that some health insurance companies have decided to no longer sell health insurance through the exchanges or marketplaces. On the other hand, an even smaller share (3 percent, overall) shift their opinion from unfavorable to favorable after hearing that the share of Americans who do not have health insurance is at the lowest rate ever.
Figure 2: Few Opinions of ACA Swayed by Arguments
Perceived Increase in Costs Among Reasons Why Individuals Have Unfavorable Opinions of the ACA
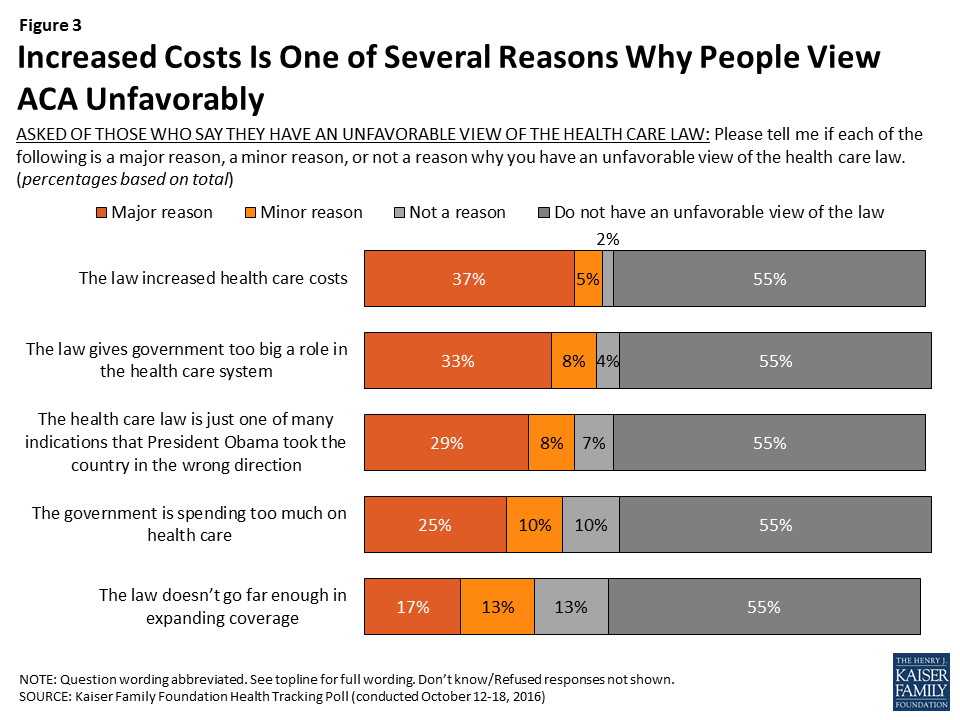
When individuals with an unfavorable view of the health care law are asked about a number of reasons why they dislike the law, a large share – nearly four in ten Americans overall – say a major reason is because they feel the law increased health care costs. This is closely followed by those who say their unfavorable view is because they believe the law gives government too big a role in the health care system (33 percent) or say that it is just one of many indications that President Obama took the country in the wrong direction (29 percent). One-fourth of Americans say a major reason why they have an unfavorable view of the health care law is because they believe the government is spending too much on health care. A smaller share of the public (17 percent) say a major reason why they view the law unfavorably is because the law doesn’t go far enough in expanding coverage. When asked the main reason for why they view the law unfavorably, similar shares say it is because the law gives government too big a role in the health care system (14 percent, overall) as say it is the law increased health care costs (11 percent) or say the health care law is just one of many indications that President Obama took the country in the wrong direction (12 percent).
Figure 3: Increased Costs Is One of Several Reasons Why People View ACA Unfavorably
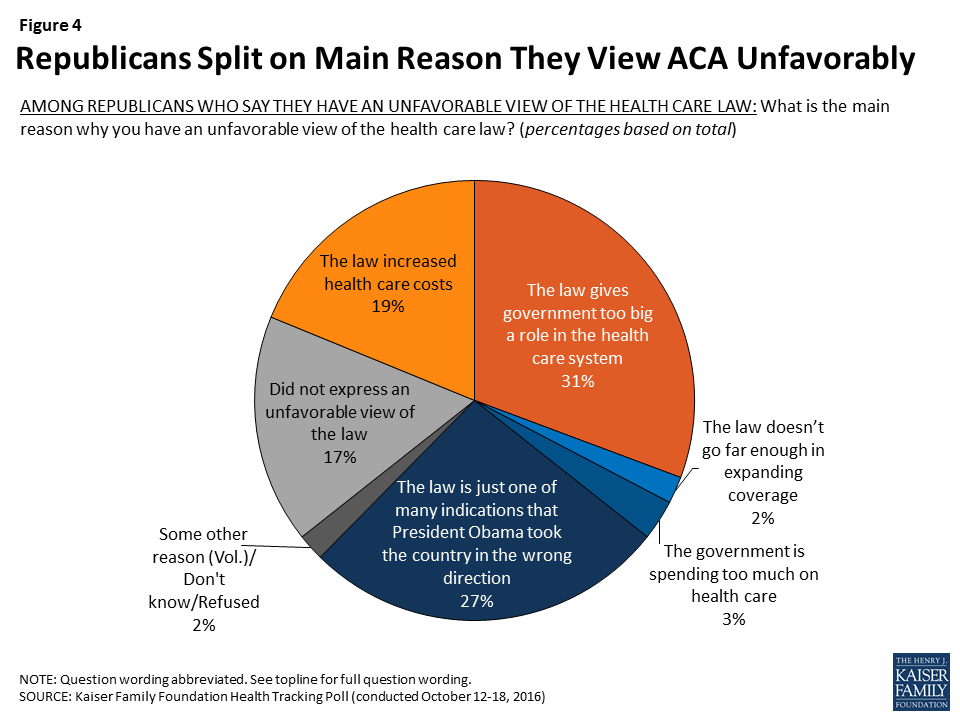
Focusing specifically on Republicans, the vast majority of whom have an unfavorable view of the law, when asked the main reason why they have an unfavorable view of the health care law, about three in ten said it is because they believe the law gives government too big a role in the health care system (31 percent) or say it is just one of many indications that President Obama took the country in the wrong direction (27 percent).
Figure 4: Republicans Split on Main Reason They View ACA Unfavorably
Perceptions Vary in How ACA Is Impacting Populations
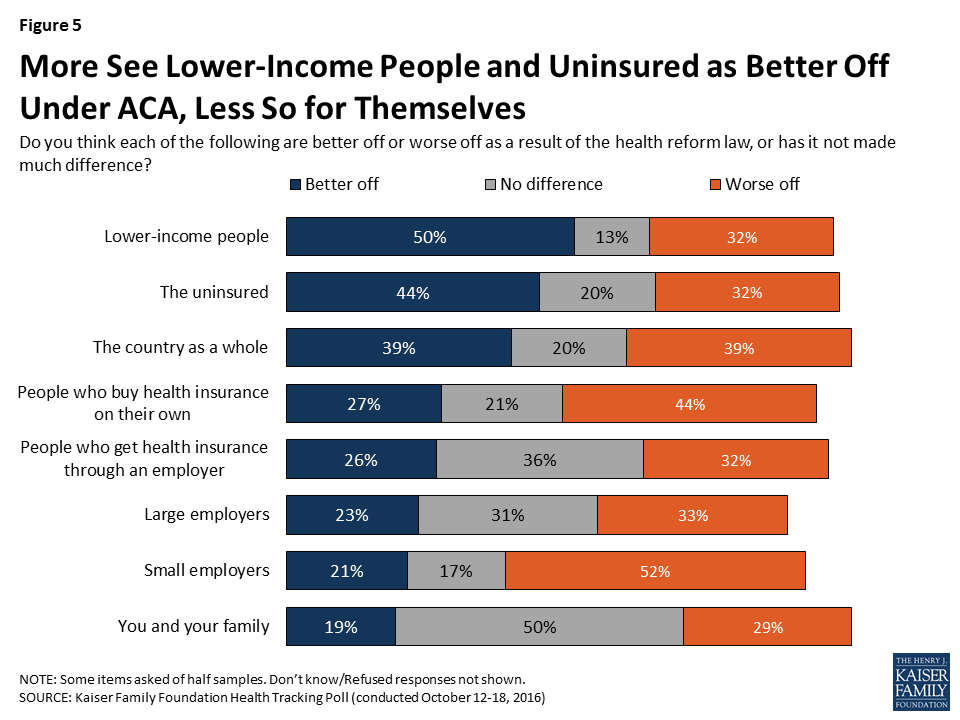
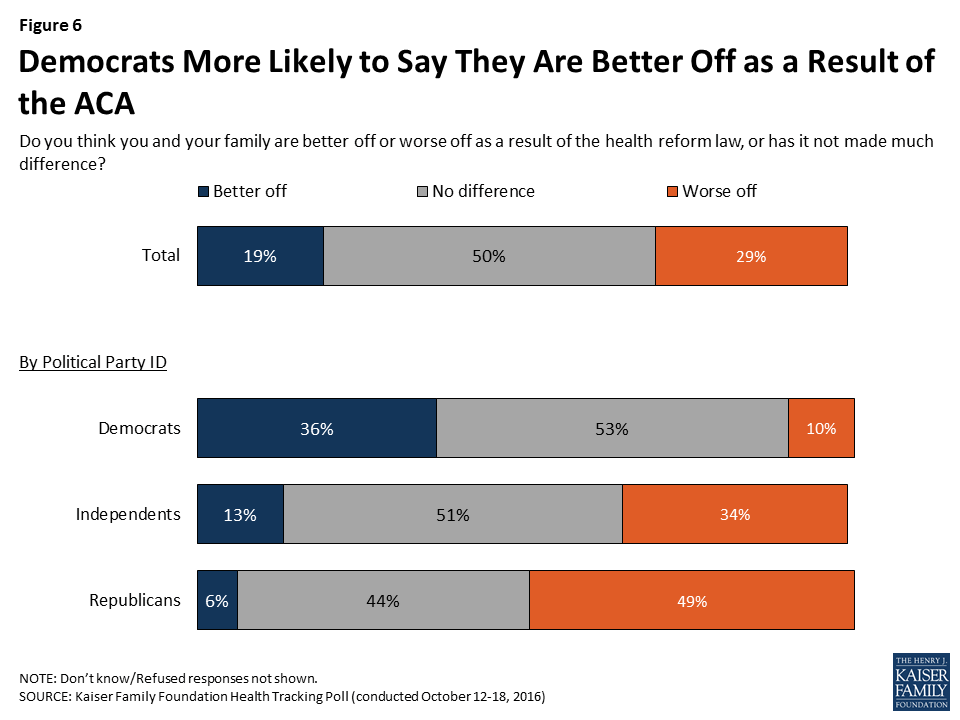
While many Americans perceive some of the key groups targeted by the ACA (lower-income people and the uninsured) as “better off” as a result of the health care law, the public is less positive on how other groups – including they, themselves – are faring. More of the public say that lower-income people (50 percent) and the uninsured (44 percent) are “better off” as a result of the health care law, than say they are “worse off” (32 percent, for both). This is in contrast with larger shares saying small employers and people who buy their own health insurance are “worse off” than say they are “better off.” Attitudes towards large employers, people who get health insurance through an employer, and the country as a whole are more mixed with similar shares thinking they are “better off” as “worse off.” When asked if they and their families are better or worse off as a result of the health care law, half say the law has not made much of a difference while 29 percent say they are “worse off” and 19 percent say they are “better off.”
Figure 5: More See Lower-Income People and Uninsured as Better Off Under ACA, Less So for Themselves
Perceived impacts of the law are largely driven by partisanship, with larger shares of Democrats saying most of these groups are “better off” than independents or Republicans. For example, about one-third of Democrats (36 percent) say they and their family are “better off” as a result of the health care law compared to 13 percent of independents and 6 percent of Republicans. In addition, two-thirds (67 percent) of Democrats say the country as a whole is “better off” while this view is shared by 35 percent of independents and 9 percent of Republicans.
Figure 6: Democrats More Likely to Say They Are Better Off as a Result of the ACA
Sources of Recent Information About the ACA
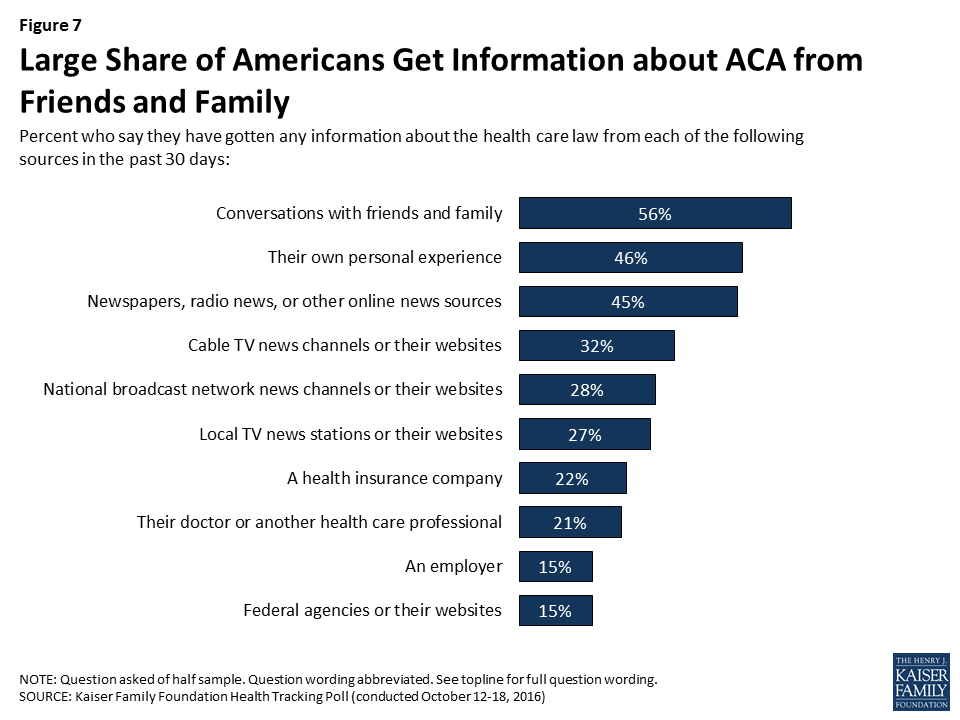
More than half (56 percent) of the public say they have gotten information about the health care law in the past 30 days from conversations with friends and family. This is followed by nearly half who say they have gotten information from their own personal experiences (46 percent) or have gotten information from newspapers, radio, or other online news sources (45 percent). Fewer report getting information about the health care law from other types of media including cable TV news (32 percent), national broadcast network news (28 percent), and local TV news (27 percent). Less than one in four report getting information from a health insurance company (22 percent), their doctor or another health care professional (21 percent), an employer (15 percent), or a federal agency such as the Department of Health and Human Services (15 percent).
Figure 7: Large Share of Americans Get Information about ACA from Friends and Family
Which Sources Do People Trust?
While relatively few Americans report getting information about the health care law from doctors and nurses or federal agencies, these are the sources most of the public trusts for information on the health care law. About half (49 percent) of individuals report they would trust the information from doctors and nurses “a lot” while 43 percent say they trust information from federal agencies. This is followed by one-third who say they would trust information from their local pharmacist. About one in five Americans say they would trust information from their friends and family (23 percent), a health insurance company (23 percent), their local place of worship (22 percent), or an employer (21 percent). Finally, relatively small shares of the public say they would trust the information they get from the news media or social networking sites (8 percent and 2 percent, respectively).
Figure 8: More Americans Trust Medical Professionals over Other Sources of Information on ACA
Majority of Americans Say News Coverage of ACA Focuses on Politics and Controversies
Overall, two-thirds (64 percent) of Americans say the news coverage they’ve seen about the health care law has been about the politics and controversies of the law. About half (51 percent) of Americans say at least some of the coverage has been about the number of people who are getting health insurance, higher than the share that says at least some of the coverage has been about the number of people losing insurance (38 percent). Slightly less than half (47 percent) say at least some of the coverage has been about the cost of premiums in plans purchased through the law, and 38 percent say at least some coverage has been about the health insurance exchanges.
Figure 9: About Two-Thirds Say at Least Some of ACA Media Coverage Has Been About Politics and Controversies
As the presidential election continues to dominate the attention of most Americans, the candidates themselves, the economy and jobs, and foreign policy rank as top factors in voters’ decisions, with health care following far below. However, the vast majority of voters say there are differences between the two presidential candidates’ views on health care, although more feel they have a good understanding of what Democratic presidential nominee Hillary Clinton is proposing in the health care arena than Republican presidential nominee Donald Trump.
When thinking about health care priorities for the next president and Congress to address, dealing with the high price of prescription drugs tops the public’s list while issues specific to the Affordable Care Act (ACA), such as repealing provisions of the law or repealing the law entirely, are viewed as top priorities by fewer Americans.
The public remains divided on what’s next for the ACA with about equal shares saying the law should be repealed as saying it should be expanded. As discussions about the challenges facing the ACA marketplaces continue, about two-thirds of Americans say they favor creating a public health insurance option to compete with private health insurance plans in the ACA marketplaces, but support for this is relatively malleable, with attitudes shifting after hearing counterarguments.
With the ACA’s fourth open enrollment period beginning on November 1st, the corresponding Data Note examines the public’s view on the future of the 2010 health care law, which groups they think are better off as a result of this legislation, and what sources they go to for information about the law.
The 2016 Presidential Election
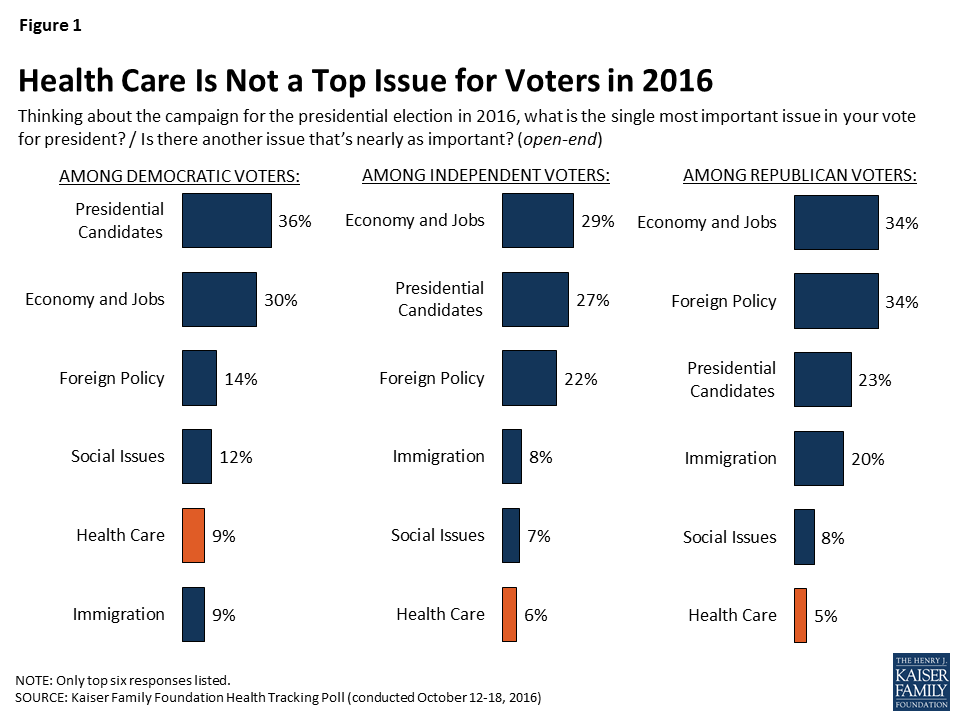
With less than two weeks until Election Day, the October Kaiser Health Tracking Poll finds that when asked in their own words the single most important issue in their vote for president, voters offer the candidates themselves, the economy and jobs, and foreign policy rank as top factors in their decisions. On the other hand, a much smaller number of voters – regardless of party – volunteer health care as the most important issue. The poll finds that about one-third of Democratic voters (36 percent) say the candidates themselves are the most important issue in their vote. For Republican voters, the economy and jobs (34 percent) and foreign policy (34 percent) are volunteered most often. Similar shares of independent voters mention the presidential candidates (27 percent) and the economy and jobs (29 percent).
Figure 1: Health Care Is Not a Top Issue for Voters in 2016
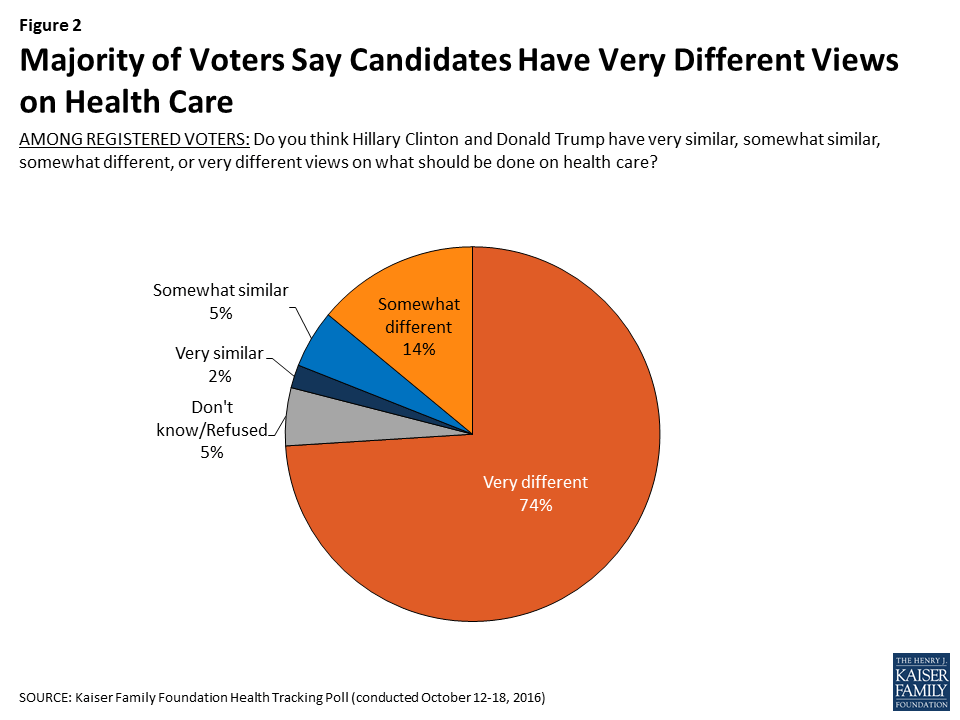
While health care is playing a limited role in voters’ decisions, the majority of voters say the two presidential candidates have different views on what should be done on health care. Nearly nine in ten voters say the candidates’ views on what should be done on health care are either “very different” (74 percent) or “somewhat different” (14 percent), with fewer than one in ten saying they are either “very” or “somewhat” similar (2 percent and 5 percent, respectively).
Figure 2: Majority of Voters Say Candidates Have Very Different Views on Health Care
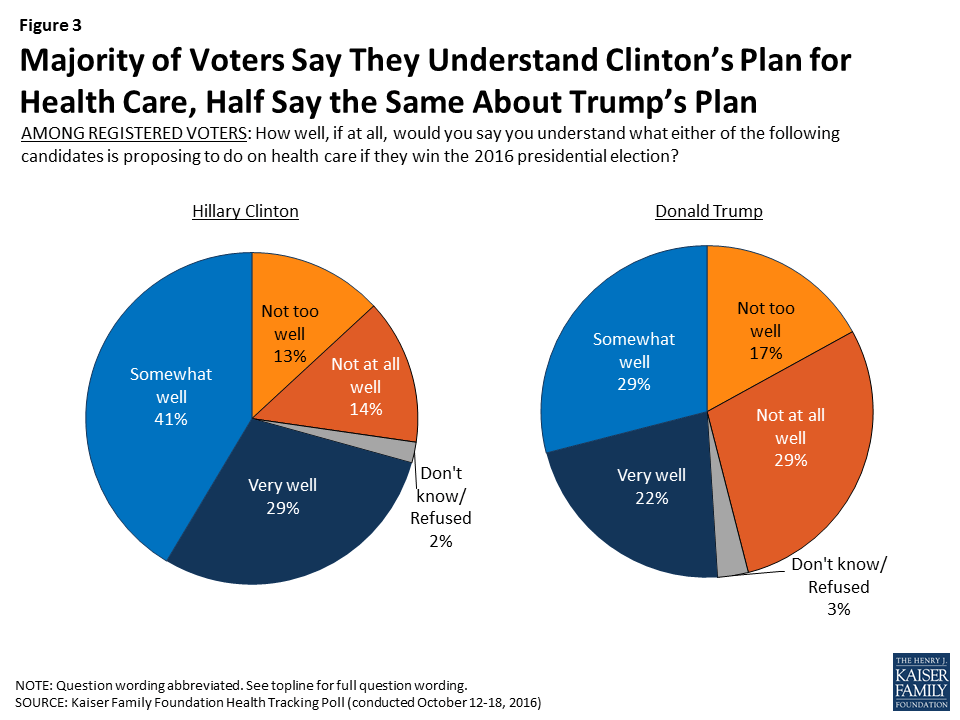
Although discussion of health care policies on the campaign trail has been somewhat limited, seven in ten (71 percent) voters say they understand (either “very well” or “somewhat well”) what Hillary Clinton is proposing to do on health care if she wins the election while fewer (51 percent of voters) say the same of Donald Trump.
Figure 3: Majority of Voters Say They Understand Clinton’s Plan for Health Care, Half Say the Same About Trump’s Plan
Health Care Priorities for the Next President and Congress
This month’s Kaiser Health Tracking Poll also examines the public’s attitudes on which health care issues should be a priority for the next president and Congress. Making sure high-cost drugs for chronic conditions, such as HIV, hepatitis, mental illness and cancer, are affordable to those who need them is viewed as a “top priority” by 74 percent of the public and majorities of individuals across party lines. In addition, the majority of the public say government action to lower prescription drug prices is a top priority (however, larger shares of Democrats and independents than Republicans view this as a top priority). Issues specific to the ACA, such as repealing provisions of the law or repealing the law entirely, are viewed as top priorities by fewer Americans. However, repealing the ACA is seen as a top priority by six in ten Republicans – ranking second in top priorities among this group.
Table 1: Top Health Care Priorities for the Next President and Congress
Percent who say each of the following should be a top health care priority for the next President and Congress
Total
Democrats
Independents
Republicans
Making sure that high-cost drugs for chronic conditions, such as HIV, hepatitis, mental illness and cancer, are affordable to those who need them
74%
84%
73%
68%
Government action to lower prescription drug prices
63
75
64
49
Making sure health plans have sufficient provider networks of doctors and hospitals
57
62
54
53
Protecting people from being charged high prices when they visit hospitals or outpatient clinics covered by their health plan but are seen by a doctor not covered by their plan
54
60
56
43
Making information comparing the quality of health care provided by doctors and hospitals more available to patients
53
59
54
42
Making information about the price of doctors’ visits, tests, and procedures such as hip replacements and MRIs more available to patients
50
52
51
45
Making information about what doctors and hospitals are covered under different health insurance plans more available
49
53
46
50
Helping people with moderate incomes pay high out-of-pocket costs for medical care
44
51
42
39
Repealing the requirement that nearly all Americans have health insurance or else pay a fine
38
27
39
51
Repealing the entire health care law
37
17
40
60
Repealing the requirement that employers with 50 or more workers pay a fine if they don’t offer health insurance
29
29
29
28
Reducing the amount of financial assistance available to help people buy health insurance in order to save the government money
25
24
27
18
Eliminating a tax on higher cost employer-sponsored health plans, also called Cadillac plans, that helps pay for the health care law
24
27
22
22
NOTE: Items asked of half samples.
Next Steps for the Health Care Law
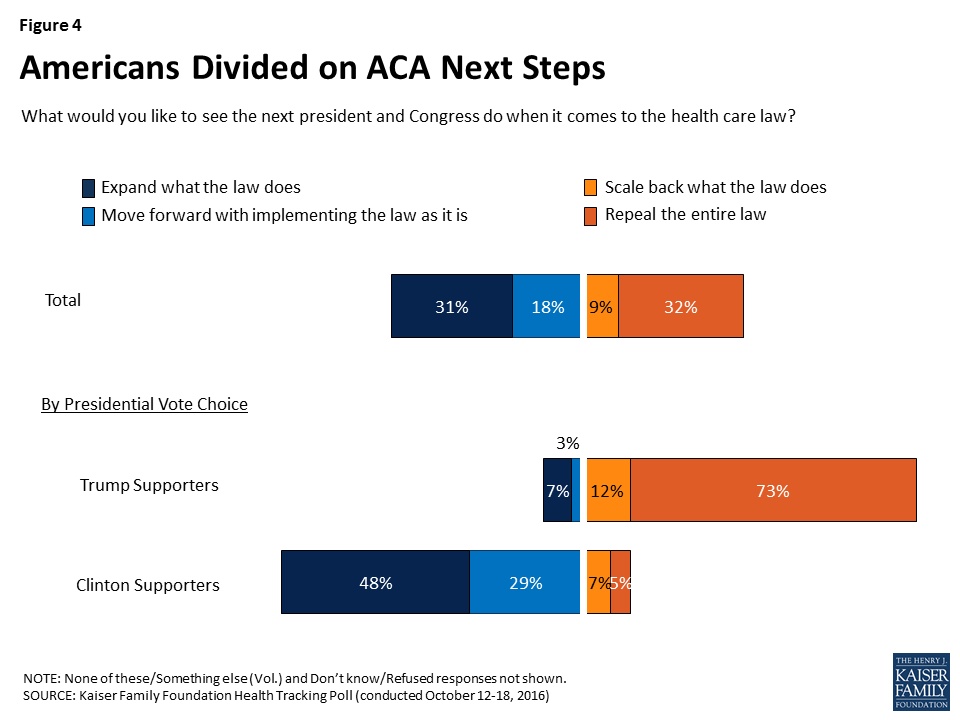
When it comes to the future of the Affordable Care Act, the public is divided on what they want to see the next president and Congress do. About one-third (32 percent) of the public want to see the next president and Congress repeal the entire law which is similar to the share (31 percent) who want to see the next administration expand what the health care law does. One in five (18 percent) say they want to see the next president and Congress move forward with implementing the law as it is while 9 percent want to see the next administration scale back what the law does.
Figure 4: Americans Divided on ACA Next Steps
Voters who currently support Democratic presidential candidate Hillary Clinton are also more likely to say they want to see the next president and Congress expand the law (48 percent) or move forward with implementing the law as it is (29 percent) than voters who currently support Republican presidential candidate Donald Trump (7 percent and 3 percent, respectively). Three-fourths (73 percent) of Trump supporters say they want to see the next president and Congress repeal the entire law. These differences mirror overall partisan differences with larger shares of Democrats (48 percent) wanting to see the law expanded than independents (31 percent) and Republicans (9 percent).
Public Health Insurance Option
Decisions by insurers to no longer sell coverage through some ACA marketplaces have spurred renewed discussions of establishing a public health insurance option in an effort to address potential gaps in access to health insurance plans through the marketplace. Overall, about two-thirds (62 percent) of Americans favor a public health insurance option to compete with private health insurance plans in the ACA marketplaces; however, how the proposal is described and labeled affects the level of support.
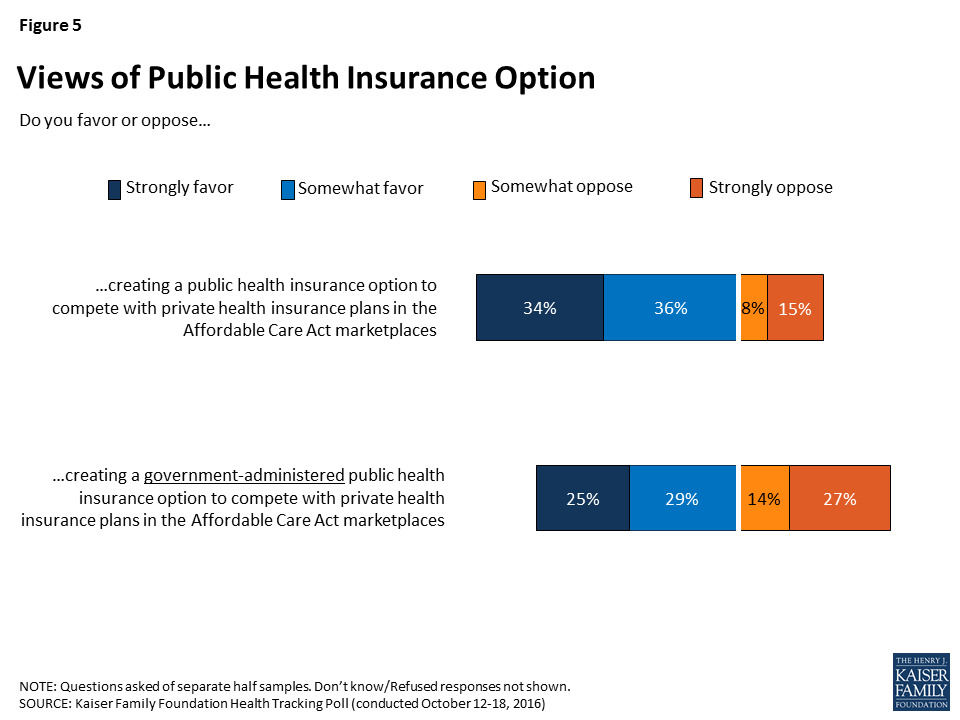
When half of the sample are asked whether they favor or oppose creating a public health insurance option, 70 percent express a favorable view while one-fourth (24 percent) oppose. When the other half of the sample are asked whether they favor or oppose creating a government-administered public health insurance option, about half (53 percent) say they favor such a plan while 41 percent oppose.
Figure 5: Views of Public Health Insurance Option
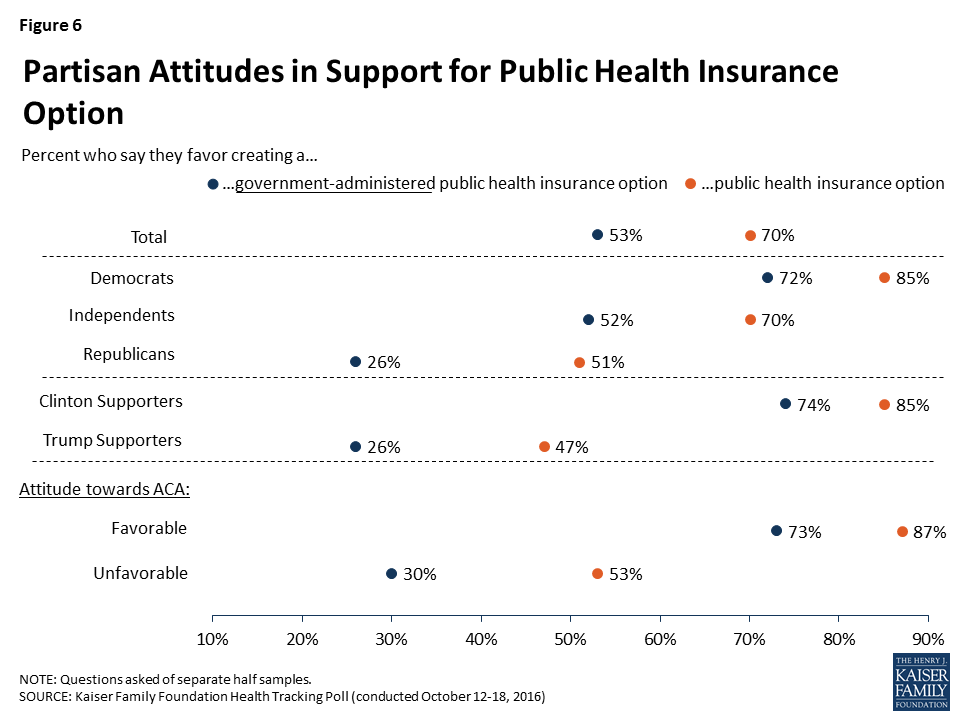
Across all partisan groups, the inclusion of the detail of “government-administered” in the question wording decreases favorability – yet, to varying degrees. Majorities of Democrats, Clinton supporters, and individuals with a favorable view of the ACA say they favor both a government-administered public health insurance option and a public health insurance option. Among independents, a majority (70 percent) favor a public health insurance option but fewer (52 percent) favor creating a government-administered public health insurance option. Smaller shares of Republicans, Trump supporters, and individuals who have an unfavorable view of the ACA favor either proposal. However, the share who favor a government-administered public health insurance option is significantly smaller than those who favor a public health insurance option.
Figure 6: Partisan Attitudes in Support for Public Health Insurance Option
How Flexible Are Americans’ Opinions of a Public Option?
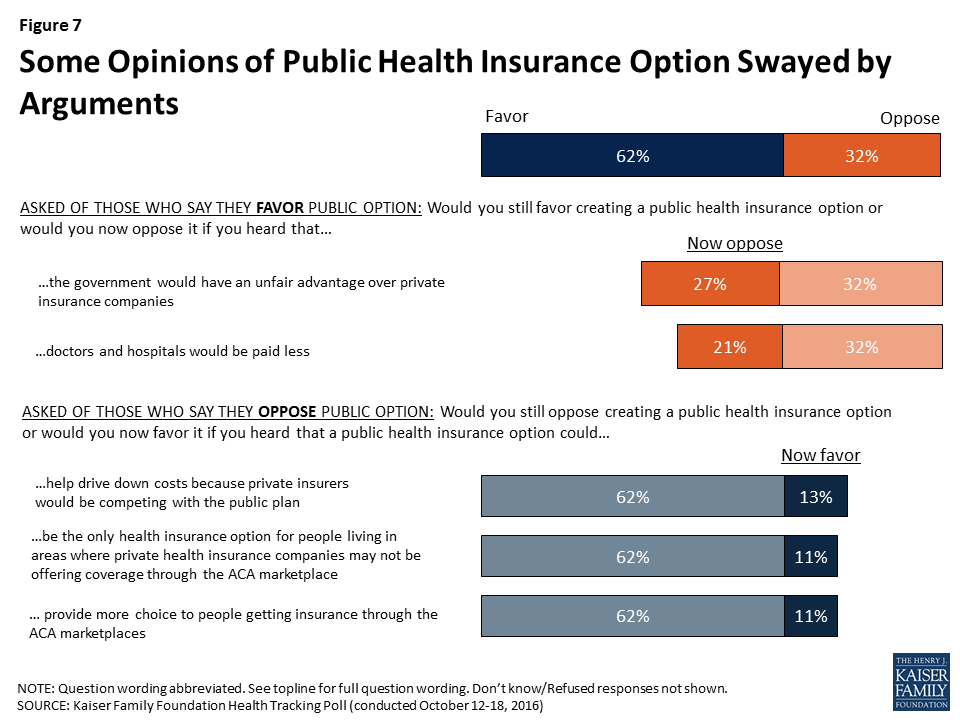
Until recently, there had been little public discussion or details of a public health insurance plan. Therefore, it is unsurprising that for some, attitudes on this issue can be swayed when they hear messages being made from the alternative viewpoint. For instance, 21 percent overall shift their opinion from favor to oppose after hearing the argument often made by opponents of the proposal that doctors and hospitals would be paid less under a public health insurance plan, and one-fourth (27 percent) of the public shifts their opinion to oppose when hearing that the government would have an unfair advantage over private insurance companies. On the other side of the debate, some of those who originally say they oppose a public health insurance option are also persuaded by hearing arguments often made by supporters of the proposal. About one in ten change their stance from oppose to favor after hearing that the public health insurance option could help drive down costs because private insurers would be competing with the public plan (13 percent), provide more choice to people getting insurance through the ACA marketplaces (11 percent), or be the only health insurance option for people living in areas where private health insurance companies may not be offering coverage through the ACA marketplaces (11 percent).
Figure 7: Some Opinions of Public Health Insurance Option Swayed by Arguments
Kaiser Health Policy News Index: October 2016
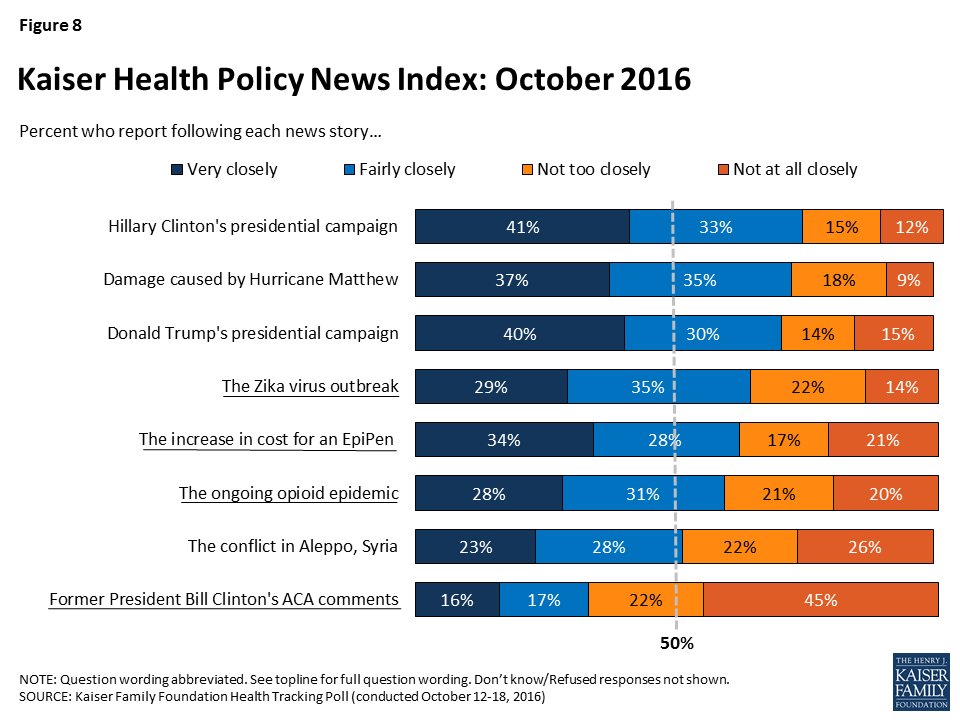
The October Kaiser Health Tracking Poll finds the 2016 presidential campaign and Hurricane Matthew dominating the public’s attention during the past month. Nearly three-fourths of Americans say they were closely following news stories about Hillary Clinton’s presidential campaign (73 percent), the damage caused by Hurricane Matthew in the Atlantic Ocean (72 percent), and Donald Trump’s presidential campaign (70 percent). Fewer Americans report closely following the top health stories during the month, with two-thirds closely following news about the Zika virus outbreak, 61 percent following news about the increase in cost for an EpiPen, and 59 percent following news about the ongoing opioid epidemic. Smaller shares report closely following news about the conflict in Aleppo, Syria (51 percent) or former President Bill Clinton’s remarks about the Affordable Care Act (33 percent).
Figure 8: Kaiser Health Policy News Index: October 2016
Methodology
This Kaiser Health Tracking Poll was designed and analyzed by public opinion researchers at the Kaiser Family Foundation (KFF). The survey was conducted October 12-18, 2016, among a nationally representative random digit dial telephone sample of 1,205 adults ages 18 and older, living in the United States, including Alaska and Hawaii (note: persons without a telephone could not be included in the random selection process). Computer-assisted telephone interviews conducted by landline (424) and cell phone (781, including 476 who had no landline telephone) were carried out in English and Spanish by Princeton Data Source under the direction of Princeton Survey Research Associates International (PSRAI). Both the random digit dial landline and cell phone samples were provided by Survey Sampling International, LLC. For the landline sample, respondents were selected by asking for the youngest adult male or female currently at home based on a random rotation. If no one of that gender was available, interviewers asked to speak with the youngest adult of the opposite gender. For the cell phone sample, interviews were conducted with the adult who answered the phone. KFF paid for all costs associated with the survey.
The combined landline and cell phone sample was weighted to balance the sample demographics to match estimates for the national population using data from the Census Bureau’s 2014 American Community Survey (ACS) on sex, age, education, race, Hispanic origin, and region along with data from the 2010 Census on population density. The sample was also weighted to match current patterns of telephone use using data from the July-December 2015 National Health Interview Survey. The weight takes into account the fact that respondents with both a landline and cell phone have a higher probability of selection in the combined sample and also adjusts for the household size for the landline sample. All statistical tests of significance account for the effect of weighting.
The margin of sampling error including the design effect for the full sample is plus or minus 3 percentage points. Numbers of respondents and margins of sampling error for key subgroups are shown in the table below. For results based on other subgroups, the margin of sampling error may be higher. Sample sizes and margins of sampling error for other subgroups are available by request. Note that sampling error is only one of many potential sources of error in this or any other public opinion poll. Kaiser Family Foundation public opinion and survey research is a charter member of the Transparency Initiative of the American Association for Public Opinion Research.
The Affordable Care Act (ACA) requires most private health insurance plans to provide coverage for a broad range of preventive services including Food and Drug Administration (FDA) approved contraceptives and services for women, as prescribed. Since the implementation of this provision in 2012, some nonprofit and for profit employers with religious objections to contraceptives have brought legal challenges to this rule. For many women today, their contraceptive coverage depends on their employer or when they purchased their individual insurance plan.
Who has a plan that includes contraceptive coverage?
Women who have a non-grandfathered health insurance plan through an employer (either their own, their spouse’s or their parent’s) that does not have a religious objection to providing coverage for contraceptives are insured for the full range of prescribed FDA approved contraceptives without cost-sharing.
Women who work for religiously-affiliated nonprofits such as universities or health systems that have a religious objection to contraception typically have coverage for contraceptive services, although the employer will not have to pay for this coverage. Eligible nonprofits that object can file for an “accommodation” to the rule by either completing the EBSA 700 self-certification form or notifying HHS in writing about their objection (also providing the plan name, type and contact information for the health plan or the third party administrator). The accommodation releases these nonprofit employers from the requirement of paying for contraceptive coverage, and assures that the employees and their dependents are still able to obtain full coverage for contraceptives directly from the insurer as they are entitled to by federal law. A series of lawsuits, however, have been filed by nonprofit religiously affiliated employers, claiming that the federal accommodation and the notification to insurers violates their religious beliefs by making them “complicit” in the provision of contraceptive coverage to their workers. On May 16, 2016 the Supreme Court issued a decision in the consolidated case of Zubik v. Burwell – vacating and remanding the cases back to the lower courts with instructions to the parties to work it out. Nine Courts of Appeal have considered challenges to the accommodation. Eight Courts have ruled that the nonprofits are not substantially burdened by the accommodation. Only the 8th Circuit has ruled that the accommodation violates RFRA. All of the lower courts will re-hear the cases and issue new decisions.
In July 2016, the Departments of Health and Human Services (HHS), Labor and Treasury issued a Request for Information (RFI) inviting public comments on “whether there are alternative ways (other than those offered in current regulations) for eligible organizations that object to providing coverage for contraceptive services on religious grounds to obtain an accommodation, while still ensuring that women enrolled in the organization’s health plans have access to seamless coverage of the full range of Food and Drug Administration-approved contraceptives without cost sharing.” The Department of Justice notified the Courts of Appeal to take no action while the department receives comments on the RFI. For cases involving fully insured plans and self-insured plans (excluding church plans), the government will notify the insurance issuers and third-party administrators that they have an “obligation to make or arrange separate payments for contraceptives without cost to or involvement by plaintiffs.”
In a major case involving for profit employers, Hobby Lobby v. Burwell, the Supreme Court ruled that “closely held” corporations may exclude contraceptives from their health plans if their owners have sincerely held religious objections as determined by a court. On July 10, 2015 HHS issued rules requiring closely held corporations to comply with an accommodation rather than allowing an exemption. Hobby Lobby and other similar corporations are now required to notify their insurer or HHS of their objections to contraceptive coverage so that the insurer can still provide the contraceptive coverage directly to the employees and their dependents. These regulations have the effect of restoring contraceptive coverage to workers employed by closely held corporations with religious objections.
Who may not have contraceptive coverage in their plan?
Women who work for a house of worship that objects to contraceptive coverage do not have guaranteed coverage for the full range of FDA approved contraceptives. Houses of worship are exempt from the contraceptive coverage requirement. Women enrolled in student health plans may not have contraceptive coverage without cost-sharing because the rules for student health plans depend on whether the college has a self-insured plan or a fully insured plan. Colleges or universities that purchase insurance from a health insurance company are required to provide contraceptive coverage for women. Religious institutions of higher education with objections to providing contraceptive services are eligible for an accommodation and do not have to pay for coverage, but faculty, staff and students will still have no-cost contraceptive coverage provided by the health insurance company. Student health plans that are self-insured, however, may not be required to cover contraceptive services without cost-sharing because it’s up to states to set that policy, and not federal law, in the cases of self-insured student plans.
Women enrolled in grandfathered plans may not have contraceptive coverage. Grandfathered health plans are plans that were in existence on March 23, 2010 and have stayed basically the same. These plans are not required to provide all of the benefits, including preventive health services, required of other health plans. In 2016, 23% of covered workers were enrolled in a grandfathered health plan.
In this post for The JAMA Forum, the Kaiser Family Foundation’s Larry Levitt discusses the concept of allowing insurers to sell health plans across state lines and how such a proposal could affect people with pre-existing conditions.