Aiming for Fewer Hospital U-turns: The Medicare Hospital Readmission Reduction Program

Authors: Cristina Boccuti and Giselle Casillas
Published: Mar 10, 2017

Issue Brief

For Medicare patients, hospitalizations can be stressful; even more so when they result in subsequent readmissions. While many readmissions are unavoidable, researchers have found wide variation in hospitals’ readmission rates, suggesting that patients admitted to certain hospitals are more likely to experience readmissions compared to other hospitals.1  A number of studies show that hospitals can engage in several activities to lower their rate of readmissions, such as clarifying patient discharge instructions, coordinating with post-acute care providers and patients’ primary care physicians, and reducing medical complications during patients’ initial hospital stays.2 

Through Congressional direction and previous Administration initiatives, Medicare has begun implementing incentives to reduce hospital readmissions. One example, and the focus of this Issue Brief, is the Hospital Readmission Reduction Program (HRRP), which financially penalizes hospitals with relatively high rates of Medicare readmissions.3  This Issue Brief, updated with new estimates for 2017, describes the HRRP, analyzes the program’s impact on Medicare patients and hospitals, examines the decline in national readmission rates, and discusses implementation issues that policymakers have raised.

Main Findings

  • Total Medicare penalties assessed on hospitals for readmissions will increase to $528 million in 2017, $108 million more than in 2016. The increase is due mostly to more medical conditions being measured. Hospital fines will average less than 1 percent of their Medicare inpatient payments.
  • For 2017, 78 percent of Medicare patient admissions are projected to be in hospitals receiving either no readmission penalty or penalties of less than 1 percent of the hospital’s Medicare inpatient payments. Fewer than 2 percent of Medicare patient admissions will be in hospitals receiving the maximum financial penalty.
  • Nationally, beneficiary readmission rates started to fall in 2012, and have continued to drop since then, suggesting that hospitals and clinicians may have adopted new, system-wide interventions soon after the HRRP was enacted by the ACA.
  • Across all five years of the HRRP, certain types of hospitals are more likely than others to incur penalties. These include hospitals with relatively higher shares of low-income beneficiaries and major teaching hospitals. Congress recently enacted legislation to incorporate a socioeconomic adjustment in how hospital performance is measured, based on each hospital’s share of inpatients who are dually qualified for Medicare and full Medicaid. The implementation of this methodology will need to consider several key policy issues.

Background: Defining a hospital readmission

Generally speaking, a hospital readmission occurs when a patient is admitted to a hospital within a specified time period after being discharged from an earlier (initial) hospitalization. For Medicare, this time period is defined as 30 days, and includes hospital readmissions to any hospital, not just the hospital at which the patient was originally hospitalized. Medicare uses an “all-cause” definition of readmission, meaning that hospital stays within 30 days of a discharge from an initial hospitalization are considered readmissions, regardless of the reason for the readmission. This all-cause definition is used in calculating both the national average readmission rate and each hospital’s specific readmission rate. Starting in 2014, CMS began making an exception for planned hospitalizations (such as a scheduled coronary angioplasty) within the 30-day window; these are no longer counted as readmissions.

The current focus in the HRRP is on readmissions occurring after initial hospitalizations for selected conditions—namely, heart attack, heart failure, pneumonia, chronic obstructive pulmonary disease (COPD), elective hip or knee replacement, and coronary artery bypass graft (CABG). CMS also collects hospitals’ overall readmission rates (regardless of initial diagnoses), but these overall rates are not currently used in the HRRP to calculate readmissions penalties.

The first five years of the Hospital Readmission Reduction Program

The HRRP was established by a provision in the Affordable Care Act (ACA) requiring Medicare to reduce payments to hospitals with relatively high readmission rates for patients in traditional Medicare. Starting in 2013 as a permanent component of Medicare’s inpatient hospital payment system (i.e., not a temporary demonstration project), the HRRP applies to most acute care hospitals. Exempt hospitals include psychiatric, rehabilitation, long term care, children’s, cancer, and critical access hospitals, as well as all hospitals in Maryland.4 

Under the HRRP, hospitals with readmission rates that exceed the national average are penalized by a reduction in payments across all of their Medicare admissions—not just those which resulted in readmissions. Before comparing a hospital’s readmission rate to the national average, CMS adjusts for certain demographic characteristics of both the patients being readmitted and each hospital’s patient population (such as age and illness severity). After these adjustments, CMS calculates a rate of “excess” readmissions, which links directly to the hospital’s readmission penalty—the greater each hospital’s rate of excess readmissions, the higher its penalty.5  Each year, CMS releases each hospital’s penalty for the upcoming year in the Federal Register and posts this information on its Medicare website.

For the first year, fiscal year 2013, the maximum penalty was 1 percent of the hospital’s base Medicare inpatient payments, increasing to 2 percent for 2014, and was fully phased-in at 3 percent starting in 2015 (Table 1).6  When calculating each hospital’s readmission rate, CMS uses three full years of hospital data. Accordingly, the upcoming 2017 penalties were based on hospital readmissions that occurred from July 2012 through June 2015.

Table 1: The first five years of the Hospital Readmission Reduction Program
Year penalties appliedFY 2013FY 2014FY 2015FY 2016FY 2017
Performance (measurement) periodJune 2008-July 2011June 2009-July 2012June 2010-July 2013June 2011-July 2014June 2012-July 2015
Diagnoses of initial hospitalizationHeart attackHeart failurePneumoniaHeart attackHeart failurePneumoniaHeart attackHeart failurePneumoniaCOPDHip or knee replacementHeart attackHeart failurePneumoniaCOPDHip or knee replacementHeart attackHeart failurePneumonia (expanded)*COPDHip or knee replacementCABG
Penalties: Percentage reduction in base payments on all Medicare inpatient admissions
Maximum rate of penalty1%2%3%3%3%
Average hospital payment adjustment(among all hospitals)-0.27%-0.25%-0.49%-0.48%-0.58%
Average hospital penalty(among penalized hospitals only)-0.42%-0.38%-0.63%-0.61%-0.74%
Percent of hospitals penalized64%66%78%78%79%
Percent of hospitals at max penalty8%0.6%1.2%1.1%1.8%
CMS estimate of total penalties$290 million$227 million$428 million$420 million$528 million
NOTES: *Additional types of pneumonia diagnoses added for 2017. Penalties are applied to each hospital in the year shown, based on performance during the preceding 3-year measurement period. Penalties assessed as reductions in base payments on all Medicare inpatient admissions, and do not apply to added payment adjustments, such as graduate medical education payments. Analysis excludes hospitals not subject to HRRP, such as Maryland hospitals and other hospitals not paid under the Medicare Hospital Inpatient Prospective Payment System, such as psychiatric hospitals. COPD: Chronic obstructive pulmonary disease. Estimates of total penalties reflect CMS’s published corrections for 2013 and 2014. CABG: coronary artery bypass grafting. FY: fiscal year.SOURCE: Kaiser Family Foundation analysis of CMS Final Rules and Impact files for the Hospital Inpatient Prospective Payment System.

For penalties levied in 2013 and 2014, CMS focused on readmissions after initial hospitalizations for three selected conditions: heart attack, heart failure, and pneumonia. For penalties levied in 2015, CMS added COPD, and elective hip or knee replacement.  For 2017 penalties, CMS expanded the types of pneumonia cases that were assessed and calculated readmission rates following CABG surgery.

total fines will increase in 2017 to over $500 million, due to higher average penalties resulting from more medical conditions being measured

Across all hospitals, the average 2017 penalty will be a 0.58-percent reduction in base Medicare payments for all inpatient admissions.  Among only penalized hospitals, the average fine will be a 0.74-percent reduction in Medicare inpatient payments, a 13-percentage point increase from the prior year (Table 1). With these increases, CMS estimates that total penalties across all hospitals will total $528 million, $108 million more than in 2016. The share of hospitals receiving a penalty has remained relatively flat (78 to 79 percent) over the past three years.

The increase in average and total penalties for 2017 is due mostly to a larger number of medical conditions included in the calculations for the 2017 readmission penalty.  Specifically, as described above, CMS added CABG and expanded the cohort of pneumonia diagnoses to the list of initial diagnoses eligible for assessing hospital performance on readmissions.  A similar increase in average penalties occurred in 2015 when CMS added two diagnoses (COPD and hip or knee replacement) to the list of initial diagnoses being assessed for readmission, which was found to play a larger role in penalty increases than phasing in the maximum penalty.

A second reason that average penalties have not fallen stems from the statutory requirement that penalty assessments be based on average hospital performance, rather than on fixed targets.  In other words, CMS assesses hospital penalties based on a curve, resulting in a certain percentage of hospitals always be penalized, regardless of improvements in national readmission rates.  Advantages and disadvantages of changing this formula are discussed later in this brief.

Most Medicare patients stay in hospitals with either no penalty or penalties less than 1 percent of their Medicare inpatient payments

For a patient perspective, our analysis finds that for 2017, most beneficiaries will stay in hospitals with low to no penalties.  Specifically, we estimate that 78 percent of beneficiary stays in 2017 will be in hospitals that scored well enough during their previous measurement period to receive either no penalty or penalties equaling less than 1 percent of the hospital’s Medicare inpatient payments. (Figure 1).  Conversely, 22 percent of beneficiary stays will be in hospitals that will receive fines greater than 1 percent of their Medicare payments for inpatient admissions. About 1 percent of Medicare admissions will occur in hospitals that will receive the maximum penalty, a 3-percent reduction in Medicare payments across all inpatient admissions.
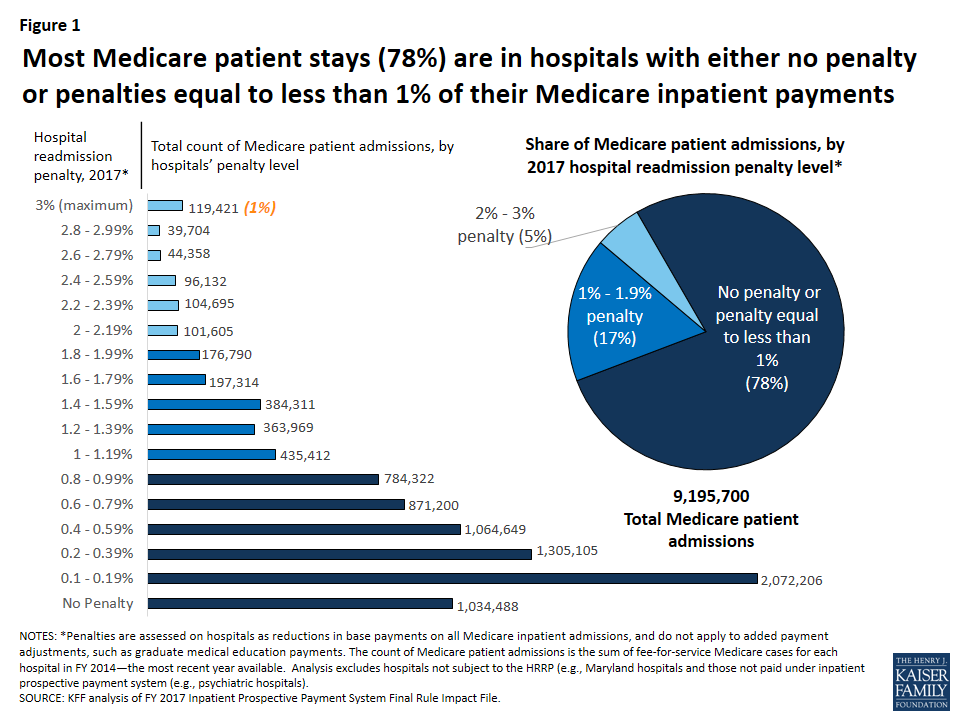
Figure 1: Most Medicare patient stays (78%) are in hospitals with either no penalty or penalties equal to less than 1% of their Medicare inpatient payments
Readmission penalties continue to vary by hospital characteristics

Analysis of the variation in penalties by type of hospital suggests that Medicare beneficiaries who go to certain types of hospitals—namely major teaching hospitals and hospitals with relatively greater shares of low-income beneficiaries—are more likely to stay in penalized hospitals and hospitals with higher penalties (Table 2).  This finding is consistent with previous research.7  To some degree there is overlap among these two types of hospitals, as major teaching hospitals often serve as safety-net hospitals with higher proportions of low-income patients.  Across all years, hospitals with the smallest share of low-income beneficiaries (quartile 1) are the least likely to be assessed any penalty at all.  For 2017, 66 percent of hospitals in the lowest quartile of low-income patients (as determined by beneficiaries with Social Security Income) will be fined a readmission penalty compared with 86 percent among hospitals with the highest share of low-income beneficiaries.  Rural hospitals also have higher rates of being penalized and higher average penalties. Variations in penalty rates by hospital characteristics have persisted across all five years of the program, although differences were greater in the first year when the maximum penalty was only 1 percent (see Appendix Table for analysis of earlier years).

Table 2: Variation in penalties by hospital characteristics, 2017
Hospital type% of hospitals% of Medicare patient admissionsAverage hospital penaltyPenalty:% reduction inbase payments on all Medicare inpatient admissions% of hospitals with any penalty% of hospitals at maximum penalty
All100%100%-0.58%79%1.8%
Rural/urban
Urban75%89%-0.57%80%1.5%
Rural25%11%-0.64%77%2.7%
Teaching status
Major teaching9%18%-0.66%93%1.0%
Other teaching22%37%-0.57%84%1.1%
Nonteaching68%45%-0.58%75%2.2%
Size
<100 beds39%10%-0.50%65%2.6%
100-299 beds42%42%-0.67%87%1.6%
300+ beds20%49%-0.57%90%0.6%
Proportion of patients who are low-income, Medicare
Quartile 1 (Lowest)24%20%-0.47%66%2.3%
Quartile 225%30%-0.56%81%1.5%
Quartile 325%30%-0.64%86%1.1%
Quartile 4 (Highest)25%20%-0.69%86%2.5%
NOTES: The low-income Medicare patient proportion is derived from hospital ratios of Supplemental Security Income (SSI) patient days, with the 4th quartile having the highest ratio of low-income patient days. The percent of hospitals in each group is for 2016. The percent of patient admissions is from based on the March 2015 update of the FY 2014 MedPAR. Analysis excludes hospitals not subject to HRRP because they are not paid under the Medicare Hospital Inpatient Prospective Payment System (e.g., Maryland hospitals, psychiatric hospitals). Penalties assessed as reductions in base payments on all Medicare inpatient admissions, and do not apply to added payment adjustments, such as graduate medical education payments.SOURCE: Kaiser Family Foundation analysis of CMS Final Rules and Impact Files for the Hospital IPPS; CMS SSI calculations are from 2014 claims run out.
Readmission rates for Medicare patients started to fall in 2012—when CMS began measuring them for the penalty program—and have declined further since

CMS has been posting individual hospital readmission rates on its Hospital Compare website, in addition to other measures of quality and patient satisfaction, since 2009. Designed for use by Medicare consumers as well as researchers, this website also provides comparisons of each hospital’s Medicare readmission performance to the national average by indicating whether the hospital is “better/worse/no different” than the U.S. National rate. In addition to readmissions following hospitalizations for selected diagnoses, the Hospital Compare website started reporting each hospital’s overall Medicare readmission rates.

Analysis of this database shows that 2012 marks the first measurable declines in readmissions (Figure 2).  Specifically, when the three-year moving average of hospital readmission rates began including data from 2012, the rates fell across all three diagnosis categories, and have continued through subsequent measurement periods.8  These notable drops started after Congress enacted the HRRP in the ACA, suggesting that hospitals may have initiated new interventions to lower their readmission rates during the measurement period leading up to the fines, which started in 2013. Additionally, other clinician activities outside the hospitals may have contributed to the decline in readmissions. With the decline in the rate of readmissions, the Department of Health and Human Services estimates 565,000 fewer Medicare patient readmissions from April 2010 through May 2015.9 
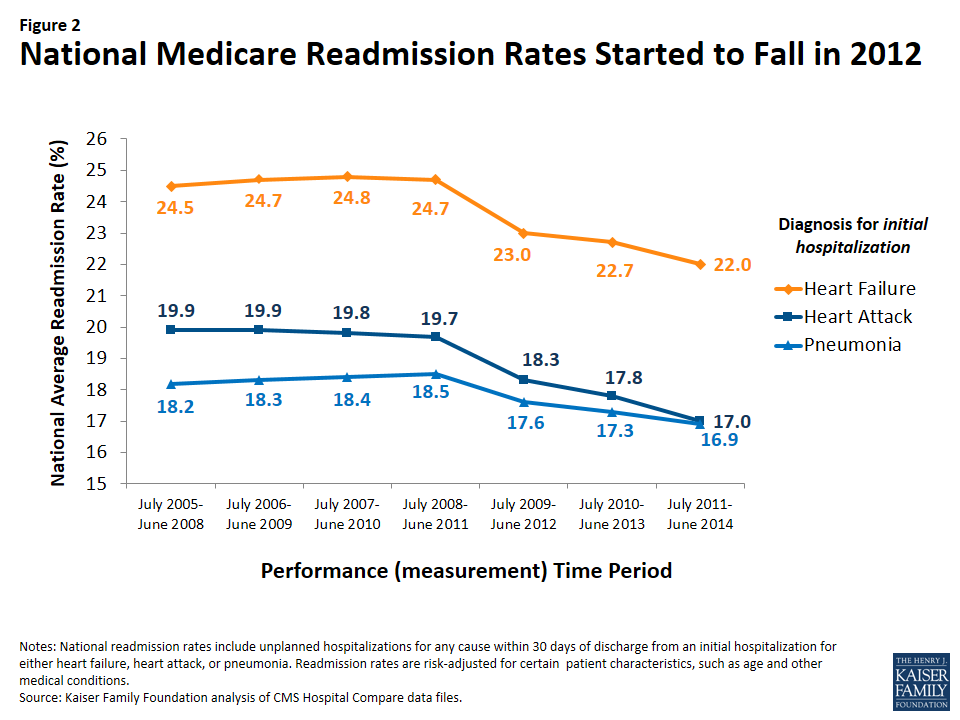
Figure 2: National Medicare Readmission Rates Started to Fall in 2012

Despite the reduction in readmission rates, average HRRP penalties have not declined, as shown earlier in Table 1. A main reason that declines in national readmission rates do not necessarily translate to lower fines is that penalty calculations are based on average hospital performance, rather than on fixed targets, as required by law. In other words, CMS must assess hospital penalties based on a curve, resulting in a certain percentage of hospitals always being penalized, regardless of improvements in national readmission rates.  Advantages and disadvantages of changing this formula are discussed below.

Ongoing policy issues

Concerns raised by researchers and hospital representatives have prompted policymakers to consider refinements to the implementation of the HRRP and look for ways to engage other health care providers and patients. Some of the refinements under discussion include changes in the way hospital measures are risk-adjusted, setting hospital performance targets, and engaging other providers.

  • Risk-adjustment. While Medicare’s readmission measures are adjusted for demographic characteristics associated with higher rates of hospital readmissions (such as age), the initial HRRP statute did not allow adjustments to the penalty calculations based on socioeconomic or community-level factors.  However, subsequent to recommendations by the National Quality Forum (NQF) and the Medicare Payment Advisory Commission (MedPAC) to adjust for socioeconomic status, Congress recently modified the method that CMS will use to assess hospital performance, as outlined in the recently passed 21st Century Cures Act.10   Specifically, the new law directs the Secretary of Health and Human Services to divide hospitals into peer groups based on similar shares of inpatients who qualify for both Medicare and full Medicaid and then determine each hospital’s performance on readmissions relative to its peer group.  This change will be effective fiscal year 2019, but the law also allows for the Secretary to consider implementing additional risk adjustments in the future.CMS has previously raised concerns regarding socioeconomic adjustment—namely, the potential that softening penalties for hospitals with lower-income patients could hold those hospitals to a lower standard, and unintentionally weaken incentives to improve health outcomes for disadvantaged patients.11   In part, the peer group methodology may address some of this concern.  However, depending on how the hospital peer groups are divided in the new adjustment methodology, further complicating issues could arise, due to state variation in the criteria for Medicaid eligibility among seniors and people with disabilities.
  • Moving goalposts for multiple measures. Hospital performance in the HRRP is essentially graded on a curve because the calculations for determining penalties are based on comparisons to the national average, with future modifications based on hospital peer groups, as described above.  Therefore, for each measure, if the national rate of Medicare readmissions declines—the main goal of the HRRP—then it is possible for hospitals to improve their readmission rates, but still be penalized.  Also, the shifting penalties do not capture hospital performance across all initial hospitalization diagnoses—sometimes referred to as a hospital-wide or all-condition readmission measure.On the one hand, some suggest that if Medicare established fixed target rates for an all-condition readmission measure, hospitals might have an easier time understanding the HRRP, embracing interventions to achieve those targets, and would not risk some readmissions being double-counted (in the case of CABG and heart failure, for example).12   On the other hand, others could argue that a fixed target for all conditions might mitigate the level of hospital improvement because it would establish a minimum performance, rather than encourage hospitals to keep up with the average for each of the selected diagnoses, especially relevant when the average improves.
  • Other providers play a role. Hospital administrators and policymakers have noted that incentives to reduce readmissions should not rest on hospitals alone because other providers and the patients themselves may play important roles in this effort.  Further, hospitals may have little to no control over the care that patients receive after they are discharged from an inpatient stay.  While researchers readily acknowledge that many readmissions are not preventable, studies show that hospitals can engage in collaborative activities to lower their number of readmissions, such as clarifying patient discharge instructions, coordinating with post-acute care providers, and reducing medical complications during the patients’ initial hospital stays.13 

Discussion

Our analysis finds that most Medicare patient admissions (78%) for 2017 will occur in hospitals receiving either no readmission penalty or penalties of less than 1 percent of their Medicare inpatient revenue. Given the stress and problems that patients experience when readmitted to a hospital, it may be reassuring that most beneficiary stays are in hospitals with relatively lower readmission rates.  While hospitals with higher penalty rates account for a considerably smaller proportion of beneficiary inpatient stays, to the extent that higher readmission rates signal concerns about care quality and discharge planning, patients going to higher-penalty hospitals may be at greater risk for related problems.

Overall, national readmission rates in traditional Medicare, started to decline in 2012 and have continued along that path in subsequent years. This timing suggests that hospitals may have started to implement strategies to lower their readmissions in response to the enactment of the HRRP, with the understanding that the financial penalties (starting in 2013) would be based on performance in prior years.  Further, because the declines are seen for multiple conditions, multipronged and system-based efforts to reduce readmissions are likely, rather than limited improvements in selected clinical treatments.14   Moreover, the fact that the lower readmission rates have been sustained across several years also suggests that system-wide improvement have played a role.  Simultaneously, other providers in the community may have also started focusing more attention on ways to lower hospital readmissions among their patients.

Despite these declines, our study shows that readmission rates and penalties continue to be higher among hospitals that have higher proportions of low-income Medicare patients, consistent with research conducted by MedPAC, NQF, and others.15  Health care providers and policymakers have noted that socioeconomic factors may often play a role in access to home and community support services aiding a patient’s recovery after hospitalizations.  For example, lower-income communities and families may have limited resources for reliable transportation to take patients to follow-up medical appointments, assistance with patient mobility and daily living needs during recovery, and access to foods that meet patients’ special dietary needs.  Further examination of ways to address patient and community needs in lower income areas may offer insights into ways to lower hospital readmissions among patients in hospitals with higher shares of low-income patients.

In light of the socioeconomic issues that have been raised about the HRRP, Congress recently required a new “peer group” method for assessing hospital performance that categorizes hospitals based on their proportion of inpatients who are dually eligible for Medicare and full Medicaid. While this new method aims to identify hospitals serving low-income Medicare patients, the significant variation between states in Medicaid eligibility criteria (such as income thresholds and asset limits) raises several issues.16  For example, hospitals in states with relatively stricter Medicaid eligibility criteria for seniors and people with disabilities are likely to have lower average incomes among their patients dully covered by Medicare and Medicaid—and potentially higher readmission rates—than hospitals in states with more generous Medicaid eligibility criteria. Therefore, penalties based on readmission rates within the peer groups may not fairly account for patient income if the peer groups span across states.

Similarly, any future changes to the structural financing of the Medicaid program, such as block grant proposals recently discussed in Congress, could have varying effects on states’ ability to provide Medicaid coverage to low-income seniors and people with disabilities.17   This could further complicate the ability of the HRRP to identify comparable hospital peer groups, if based exclusively on their share of inpatients dully eligible for Medicare and Medicaid.

Finally, because the HRRP affects Medicare payments to hospitals, its effect on Medicare patients is generally indirect.  To the extent that the financial penalties encourage hospitals to implement activities designed to improve care quality and lower their rate of preventable readmissions, the penalty program could be beneficial to Medicare patients and the Medicare program.  Alternatively, some have noted that reducing financial resources to lower-performing hospitals could have a negative impact on their delivery of patient care.  Regarding beneficiaries’ out-of-pocket expenses, a hospital’s penalty status has no direct effect on beneficiaries’ cost sharing during inpatient stays. For readmissions in particular, the inpatient hospital deductible ($1,316 in 2017) is waived, but beneficiaries do face other out-of-pocket liabilities—mostly in the form of coinsurance for separately billed physician services received during their stay—as they would in all inpatient stays.18 

In the coming years

With the enactment of the HRRP in the ACA, the aim to reduce preventable hospital readmissions has gained traction among providers and policymakers.  Moreover, key programs, such as Accountable Care Organizations (ACOs), bundled-payment initiatives, and medical home programs, include provider incentives to lower hospital readmissions, either directly or indirectly.  For a description of these models and a summary of the available evidence on spending and quality outcomes, see Payment and Delivery System Reform in Medicare: A Primer on Medical Homes, Accountable Care Organizations, and Bundled Payments.  Additionally, the Community-based Care Transitions Program, also enacted by the ACA, is designed to assess ways that local organizations might partner with hospitals to improve patients’ transitions to other settings, such as skilled nursing facilities or the patients’ home.19   Also, in traditional Medicare, CMS has recently started allowing physicians to bill Medicare for “transitional care management” after a beneficiary’s discharge from a hospital or other health care facility, in an effort to reimburse physicians for follow-up activities that could reduce readmissions and other complications.

As more results become available from Medicare’s payment and delivery system reforms a key question continues to be whether and how care improves for patients with the greatest health care needs—often those who have been hospitalized one or more times during the year.  Reductions in hospital readmission may be a likely outcome on which to focus and may help policymakers identify which models to pursue more broadly.  A continuing decline in preventable readmission rates would help slow the growth in Medicare spending and may also signal improved care for patients during and after their hospitalizations.

Appendix

Appendix Table: Variation in penalties by hospital type, 2013-2017
Hospital type% of hospitals% of Medicare patientsAverage hospital payment adjustment% of hospitals with any penalty% of hospitals at max penalty
20132014201520162017201320142015201620172013 (-1%)2014 (-2%)2015 (-3%)2016 (-3%)2017 (-3%)
All100%100%-0.27%-0.25%-0.49%-0.48%-0.58%64%66%78%78%79%8.0%0.6%1.2%1.1%1.8%
Rural/urban
Urban75%89%-0.26%-0.23%-0.46%-0.46%-0.57%65%66%78%79%80%7.1%0.1%0.8%0.9%1.5%
Rural25%11%-0.30%-0.31%-0.57%-0.51%-0.64%62%65%79%77%77%11.5%1.9%2.2%1.7%2.7%
Teaching status
Major teaching9%18%-0.43%-0.34%-0.51%-0.50%-0.66%86%87%92%92%93%16.5%0.4%3.0%0.0%1.0%
Other teaching22%37%-0.26%-0.22%-0.44%-0.45%-0.57%68%66%79%81%84%5.8%0.1%3.0%0.4%1.1%
nonteaching68%45%-0.26%-0.25%-0.50%-0.48%-0.58%61%63%76%76%75%8.2%0.8%1.5%1.5%2.2%
Size
<100 beds39%10%-0.22%-0.23%-0.45%-0.42%-0.50%50%53%66%65%65%7.8%1.4%2.3%2.1%2.6%
100-299 beds42%42%-0.30%-0.28%-0.55%-0.54%-0.67%74%75%87%86%87%8.2%0.2%0.6%0.8%1.6%
300+ beds20%49%-0.31%-0.25%-0.43%-0.45%-0.57%71%73%85%87%90%9.5%0.0%0.2%0.0%0.6%
Proportion of patients who are low-income, Medicare
Quartile 1 (Lowest)24%20%-0.18%-0.15%-0.43%-0.41%-0.47%49%51%67%66%66%4.3%0.4%1.7%1.8%2.3%
Quartile 225%30%-0.24%-0.22%-0.46%-0.47%-0.56%61%62%81%79%81%5.4%0.0%0.2%1.0%1.5%
Quartile 325%30%-0.31%-0.28%-0.53%-0.52%-0.64%73%73%84%85%86%8.0%0.4%1.0%0.5%1.1%
Quartile 4 (Highest)25%20%-0.37%-0.36%-0.54%-0.52%-0.69%77%78%84%85%86%14.7%1.3%1.8%1.4%2.5%
NOTES: The low-income Medicare patient proportion is derived from hospital ratios of Supplemental Security Income (SSI) patient days, with the 4th quartile having the highest ratio of low-income patient days. The percent of hospitals in each group is for 2016. The percent of patient admissions is from based on the March 2015 update of the FY 2014 MedPAR. Analysis excludes hospitals not subject to HRRP because they are not paid under the Medicare Hospital Inpatient Prospective Payment System (IPPS) (e.g., Maryland hospitals, psychiatric hospitals).SOURCE: Kaiser Family Foundation analysis of CMS Final Rules and Impact Files for the Hospital IPPS; CMS’s SSI calculations are from 2014 claims run out.

Endnotes

  1. Jencks, S. F. et al., “Hospitalizations among Patients in the Medicare Fee-for-Service Program,” New England Journal of Medicine Vol. 360, No. 14: 1418-1428, 2009.; Epstein, A. M. et al., “The Relationship between Hospital Admission Rates and Rehospitalizations,” New England Journal of Medicine Vol. 365, No. 24: 2287-2295, 2011. ↩︎
  2. Ahmad, F. S. et al., “Identifying Hospital Organizational Strategies to Reduce Readmissions,” American Journal of Medical Quality Vol. 28, No. 4: 278-285, 2013.; Silow-Carroll, S. et al., “Reducing Hospital Readmissions: Lessons from Top-Performing Hospitals,” Commonwealth Fund Synthesis Report, New York: Commonwealth Fund, 2011.; Jack, B. W. et al., “A Reengineered Hospital Discharge Program to Decrease Hospitalization: A Randomized Trial,” Annals of Internal Medicine Vol. 50, No. 3: 178-187, 2009.; and Kanaan, S. B., “Homeward Bound: Nine Patient-Centered Programs Cut Readmissions,” Oakland, CA: California HealthCare Foundation, 2009. ↩︎
  3. Other examples include several of the payment delivery system reforms launched by the CMS Innovation Center, including Pioneer Accountable Care Organizations (ACOs), bundled-payment initiatives, and the Independence at Home demonstration, all of which include provider incentives to lower hospital admission and readmission rates, either directly or indirectly.  Additionally, the Community-based Care Transitions Program, also enacted by the ACA, is designed to assess ways that community-based organizations might partner with hospitals to improve patients’ transitions to other settings, such as skilled nursing facilities or the patients’ home. ↩︎
  4. Maryland hospitals have a longstanding Medicare waiver that exempt them from the IPPS and allows Maryland to set all-payer rates for its hospital services. ↩︎
  5. Hospitals’ excess readmission ratios are also weighted by Medicare’s cost for admissions with the given initial diagnosis. ↩︎
  6. Penalties assessed as reductions in base payments on all Medicare inpatient admissions, and do not apply to added payment adjustments, such as graduate medical education payments. ↩︎
  7. Sheingold, S., R. Zuckerman, and A. Shartzer, “Understanding Medicare Hospital Readmission Rates and Differing Penalties Between Safety-net and Other Hospitals,” Health Affairs, 35, No.1, January 2016; Kahn, C., T. Ault, L. Potetz, T. Walke, J. Chambers, and S. Burch, “Assessing Medicare’s Hospital Pay-For-Performance Programs And Whether They Are Achieving Their Goals,” Health Affairs, 34, No.8, August 2015; Joynt, K. and A. Jha, “A Path Forward on Medicare Readmissions” New England Journal of Medicine Vol. 368, No. 13, 2013; Medicare Payment Advisory Commission, “Chapter 4: Refining the Hospital Readmissions Reduction Program,” Report to the Congress: Medicare and the Health Care Delivery System, June 2013. ↩︎
  8. Research using quarterly data shows declines occurred for some measures earlier. See Zuckerman, R. S. Sheingold, J. Orav, J. Ruhter, and A. Epstein, “Readmissions, Observations, and the Hospital Readmissions Reduction Program,” New England Journal of Medicine, Vol. 374, No.16, 2016; ↩︎
  9. Obama, B., “United States Health Care Reform: Progress to Date and Next Steps,” Journal of American Medicine (July 11 2016). ↩︎
  10. Medicare Payment Advisory Commission, “Chapter 4: Refining the Hospital Readmissions Reduction Program,” Report to the Congress: Medicare and the Health Care Delivery System, June 2013; National Quality Forum, “Risk Adjustment for Socioeconomic Status or Other Sociodemographic Factors,” Technical Report, August 15, 2014. ↩︎
  11. Final Rule for 42 CFR Parts 405, 412, 413, and 489—scheduled to be published in the Federal Register on August 22, 2016. Federal Register Vol. 79, No. 163: 49659-50536, 2014. ↩︎
  12. This issue and other complexities with the penalty formula are discussed in Medicare Payment Advisory Commission, “Chapter 4: Refining the Hospital Readmissions Reduction Program,” Report to the Congress: Medicare and the Health Care Delivery System, June 2013; Lynn, Joanne and Steve Jencks, “A Dangerous Malfunction in the Measure of Readmission Reduction,” MediCaring.org, August 26, 2014. More recently, MedPAC submitted relevant comments to CMS on the IPPS proposed rule http://medpac.gov/-documents-/comment-letters ↩︎
  13. See studies listed in endnote 2. ↩︎
  14. While hospital readmission rates among Medicare patients has declined, some other types of hospital rates have increased, including outpatient emergency room visits and observation stays.  Medicare claims analysis by Gerhardt et al (2014) suggests that reductions in readmissions in 2012 were largely independent from these other types of hospital uses. (Gerhardt, G., A. Yemane, K. Apostle, A. Oelschlaeger, E. Rollins, and N. Brennan. 2014. “Evaluating Whether Changes in Utilization of Hospital Outpatient Services Contributed to Lower Medicare Readmission Rate.” Medicare & Medicaid Research Review 4(1), E1-E13.) ↩︎
  15. Medicare Payment Advisory Commission, “Chapter 4: Refining the Hospital Readmissions Reduction Program,” Report to the Congress: Medicare and the Health Care Delivery System, June 2013; National Quality Forum, “Risk Adjustment for Socioeconomic Status or Other Sociodemographic Factors,” Technical Report, August 15, 2014. Sheingold, S., R. Zuckerman, and A. Shartzer, “Understanding Medicare Hospital Readmission Rates and Differing Penalties Between Safety-net and Other Hospitals,” Health Affairs, 35, No.1, January 2016; Kahn, C., T. Ault, L. Potetz, T. Walke, J. Chambers, and S. Burch, “Assessing Medicare’s Hospital Pay-For-Performance Programs And Whether They Are Achieving Their Goals,” Health Affairs, 34, No.8, August 2015; Joynt, K. and A. Jha, “A Path Forward on Medicare Readmissions” New England Journal of Medicine Vol. 368, No. 13, 2013; ↩︎
  16. Watts, M., E. Cornachione, M. Musumeci, “Medicaid Financial Eligibility for Seniors and People with Disabilities in 2015. Kaiser Family Foundation (March 2016)  https://modern.kff.org/medicaid/report/medicaid-financial-eligibility-for-seniors-and-people-with-disabilities-in-2015/ ↩︎
  17. For further information on Medicaid reform proposals, such as block grants and per capita caps, see: Rudowitz, Robin, “5 Key Questions: Medicaid Block Grants & Per Capita Caps,” Kaiser Family Foundation, January 31, 2017. https://modern.kff.org/medicaid/issue-brief/5-key-questions-medicaid-block-grants-per-capita-caps/ ↩︎
  18. In general, beneficiaries are not responsible for an inpatient deductible if admitted to a hospital within 60 days of a prior hospitalization. ↩︎
  19. Based on a subset of participating CBCT organizations, preliminary results find that a small number of organizations were able to achieve reductions in readmissions. Further analysis is expected to highlight both successful and unsuccessful strategies and techniques. (Econometrica, Inc, “Evaluation of the Community-based Care Transitions Program,” submitted to CMS (May 2014). ↩︎
Health Affairs Blog: Medicare Premium Support Proposals Could Increase Costs for Today’s Seniors, Despite Assurances

Authors: Tricia Neuman and Gretchen Jacobson
Published: Mar 9, 2017

In a Health Affairs blog post, Tricia Neuman and Gretchen Jacobson of the Kaiser Family Foundation examine how proposals to convert Medicare to a premium support system could lead to higher Medicare premiums and cost-sharing for seniors currently enrolled in the program, even if today’s seniors are “grandfathered” and the new system is phased-in for people ages 55 and younger. The blog post explains how today’s seniors could face higher health care costs, if older beneficiaries are separated, at least actuarially, from younger ones. Lawmakers could implement policies to prevent cost increases for seniors, but doing so would reduce Medicare savings, a key objective of many premium support proposals.

Testimony: The Status of Health and Health Care Disparities in the United States

Author: Samantha Artiga
Published: Mar 8, 2017

On March 8, 2017, Samantha Artiga, director of the Disparities Policy Project at the Kaiser Family Foundation, testified before the U.S. House Subcommittee on Labor, Health and Human Services, Education, and Related Agencies as part of its hearing entitled Public Witnesses Day. Her testimony addressed the status of health and health care disparities in the U.S. at a time of transformation in the nation’s health care system, both through the Affordable Care Act and, more recently, as Congress considers a repeal of the law and further changes to health care.

News Release

The American Health Care Act: New House GOP Bill Summary and Interactive Maps of Its Effects on Tax Credits

Published: Mar 7, 2017

The Kaiser Family Foundation today issued a summary of the Republican House leadership’s March 6 proposed Affordable Care Act (ACA) replacement bill, the American Health Care Act, that can be compared in 17 key policy areas to the ACA and several other proposed replacement plans.

In addition, the Foundation updated its interactive maps that compare county-level estimates of premium tax credits consumers would receive under the Affordable Care Act (ACA) in 2020 with what they’d receive under the new House GOP plan. The maps include 2020 premium tax credit estimates by county for current ACA marketplace enrollees at age 27, 40, or 60 with an annual income of $20,000, $30,000, $40,000, $50,000, $75,000, or $100,000.

Additional analyses related to the new legislation and its implications are forthcoming. Previous reports related to key aspects of ACA replacement plans, including Medicaid per-capita caps, variations in state Medicaid spending, and high-risk pools, are also available at kff.org.

Views of Governors and Insurance Commissioners on ACA Repeal and Changes to Medicaid: Responses to a Congressional Request for State Input on Health Reform

Authors: Samantha Artiga, Jennifer Tolbert, Petry Ubri, and Robin Rudowitz
Published: Mar 3, 2017

Executive Summary

This brief summarizes publicly available responses from governors and insurance commissioners in 35 states, including DC, to a request from members in the House of Representatives for state input on health care reform. Among the 35 state responses, 18 had a Republican governor at the time of the response, while 17 had a Democratic governor. The responses provide insight into the views of governors and insurance commissioners on repeal and replacement of the Affordable Care Act (ACA) and the changes Congress is considering making to the financing and structure of Medicaid. The findings do not reflect views of all states and represent general themes of perspectives of governors and insurance commissioners. Key findings include:

Respondents have mixed views on the ACA and potential repeal and replacement of the ACA. While some state leaders are in clear support of the ACA or ACA repeal, others have a more mixed perspective, recognizing both benefits of the ACA and opportunities for continued improvement. Respondents point to several key benefits of the ACA, including coverage gains, improved health and health care, and economic benefits. Key areas of concern about the ACA include the balance of federal and state authority, instability in the individual market and rising premiums, and sustainability of Medicaid enrollment growth.

Most respondents (29 of 35) expressed cautions or concerns about repeal, which are shared among both Republicans and Democrats and those who oppose and support repeal. The most frequently cited concerns are the potential for coverage losses, increased market instability, and loss of federal funding and increased costs for states. Many respondents who support repeal but still express concerns suggest it is important for replacement to occur at the same time as repeal and for there to be adequate transition time to implement changes. They also stressed the importance of maintaining some provisions during an interim or transitionary period to prevent against market instability and coverage losses.

Most respondents from Democratic states highlighted concerns about capped financing for Medicaid; 6 of the 18 Republican respondents cited general support for capped financing, subject to key caveats. Key concerns respondents cited about a capped financing structure included it shifting risks and costs to states; leading states to make difficult choices about program cutbacks in eligibility, benefits, and/or provider payments; and locking historic program choices and state variation in place. While 6 respondents from Republican-led states were generally supportive of a capped structure, they outlined suggestions for how the cap should be structured that are not consistent with previous and emerging federal cap proposals. For example, some suggested that the cap be responsive to changing economic conditions and/or be reviewed annually. Moreover, these respondents generally did not tie capped financing to a reduction in federal funds.

Many of the respondents from Republican states (11 of 18) cited interest in increased state flexibility in Medicaid, while most respondents from Democratic states did not provide specific comments on flexibility. However, across states, some respondents asserted that increased flexibility should not be tied to reductions in federal financing and/or felt that states already had sufficient flexibility for innovation within existing program rules. The scope of increased flexibility respondents called for varied widely. In general, respondents wanted greater flexibility to charge enrollees premiums and cost sharing, to provide more limited benefits, and to reduce or limit eligibility and enrollment. Some also indicated interest in increased flexibility related to provider payments and delivery systems, as well as other areas, such as care and payment for dual-eligible beneficiaries and prescription drug coverage. Such changes to federal standards and state options affect the extent of accountability for the federal investment in the program and the scope of nationwide protections available for enrollees.

Nearly all respondents from states with a Republican governor (16 of 18), called for returning authority to the states to regulate insurance markets. In contrast, most Democratic respondents supported the insurance market changes made by the ACA and cautioned that altering these rules could lead to market instability and loss of coverage. In addition to enhanced regulatory authority in general, some respondents called for specific changes to essential benefit requirements and premium rating rules. Among the 12 respondents who provided comments on the individual mandate, most of the 10 respondents who opposed the mandate suggested it be replaced with continuous coverage provisions to protect against adverse selection. Slightly less than half of state respondents (15 of the 35) wanted the federal government to maintain financial assistance for consumers either through the transition to a replacement plan or as part of a replacement plan. While many Democratic respondents did not specifically call for maintaining financial assistance in a replacement plan, they noted the importance of tax credits to the coverage gains achieved under the ACA.

Few respondents expressed interest in provisions to allow the sale of insurance across state lines, expand the use of Health Savings Accounts (HSAs), or create state high-risk pools, which are key elements of Republican ACA replacement proposals. Most respondents did not provide comments on the sale of insurance across state lines and those that did had mixed views. Five suggested that this practice would increase competition in the markets and expand consumer choice, while three expressed concerns it would undermine their regulatory authority. Only four respondents suggested expanding the use of HSAs, although it was not clear if they believed HSAs should be used in lieu of or in addition to tax credits. Twelve respondents indicated they would consider setting up a high-risk pool, but nearly all of these respondents noted that the pools would need to be adequately funded at the federal level.

Issue Brief

Introduction

In December, Republican Leaders in the House of Representatives sent a letter to governors and insurance commissioners requesting their views on health care reforms, including changes to the Affordable Care Act (ACA) and Medicaid. This brief analyzes publicly available responses identified from governors and/or insurance commissioners from 35 states, including the District of Columbia. These responses provide insight into state perspectives on the ACA, the potential repeal and replacement of the ACA, as well as fundamental changes Congress is considering making to the financing and structure of Medicaid. (Separate letters requesting state input also have been sent by Republican and Democratic Members of the Senate Finance Committee. However, this analysis does not include responses provided to these requests.)

Who Responded to the Letters?

Respondents included a mix of governors and/or insurance commissioners in 34 states and the Mayor of the District of Columbia (Appendix Table 1). In 21 states only the governor provided a response, in 6 states only the insurance commissioner provided a response, while both the governor and insurance commissioner provided responses in the remaining 8 states. The scope of responses varied, with some including answers to all questions included in the request and others offering more general recommendations and views. Most of the general responses were provided by states with Democratic governors who support the ACA. Several associations, including the American Academy of Actuaries, the National Governors Association, the Republican Governors Association, and the Democratic Governors Association also provided responses, which are summarized in Appendix B. In addition, state senators in one state and legal services advocates in another state provided responses, but these were excluded from the analysis.

Among the 35 states that provided responses, 18 had a Republican governor at the time of the response while 17 had a Democratic governor. In Louisiana, both the governor and insurance commissioner provided responses. The governor is a Democrat, while the independently elected insurance commissioner is a Republican. Since the responses were provided, four states had a change in governorship (DE, NH, VT, and WV). In New Hampshire and Vermont, this change resulted in a change of the political affiliation of the governor from Democrat to Republican; there was no change in the political affiliation of the governor in Delaware or West Virginia, which both retained Democratic leadership.

Three-fourths (26 of 35) of the states that responded have adopted the ACA Medicaid expansion to low-income adults. Just under half of responding states (17 of 35) have State-Based Marketplaces—5 of which use the federal Healthcare.gov platform—while 14 rely fully on the Federally-Facilitated Marketplace and 4 use a Partnership model.

Findings

This brief provides an overview of the perspectives expressed by governors and insurance commissioners in the responses related to the potential repeal and replacement of the ACA broadly as well as potential changes to Medicaid financing and state flexibility and to private insurance markets. (See Appendix Tables 2-4 for a summary of responses in each topic area.) The findings do not reflect views of all states since not all states responded to the request. Moreover, views on some topics are limited to a smaller subset of states, since not all respondents provided comments related to each area. For example, responses provided by insurance commissioners generally did not include comments specific to Medicaid financing and flexibility. Lastly, in some cases, it was difficult to categorize a respondent’s viewpoint because of the nuanced nature of the responses. As such, the findings presented here should be interpreted as general themes of the perspectives among governors and insurance commissioners on these topics. They do not represent a comprehensive analysis of state stances on potential policy changes.

Views on the ACA and ACA Repeal

The House members’ request did not specifically ask about views on the ACA or ACA repeal. However, a number of respondents provided information on the effects of the ACA in their state as well as their views on ACA and repeal and replacement of the ACA. Some respondents were in clear support of the ACA and opposed to repeal, while others supported complete repeal. However, a number of respondents had mixed views, recognizing both benefits and improvements that have occurred as a result of the ACA as well as remaining challenges and continued opportunities for improvement.

Positive Effects of ACA

Most state responses (23 of the 35) cited positive effects of the ACA. This group included all respondents from Democratic-led states at the time of the response and 6 of the 18 respondents from Republican-led states. It also included a mix of respondents who support the ACA overall as well as some that support repeal of the ACA but still point to positive aspects that they believe should be retained. For example, although Governor Kasich in Ohio indicated support for a “thoughtful strategy to repeal and replace the ACA,” he strongly recommended that states be able to retain the Medicaid expansion to adults and its enhanced federal matching funds. Respondents pointed to positive effects of the ACA in several key areas:

  • Coverage gains and increased affordability of coverage. Respondents emphasized that the ACA had led to gains in coverage and reduced uninsured rates, in a number of cases noting that their state uninsured rate had reached a historic low. In particular, they pointed to enrollment gains through the Medicaid expansion and the Marketplaces as well as coverage increases from the provisions allowing dependents to stay on their parents’ coverage until age 26 and the prohibition on exclusion of pre-existing conditions from coverage. Respondents also noted that the Marketplace subsidies have increased the affordability of coverage for consumers and led to increased competition among insurers.

As a result of health care reform, 5 million more Californians now have health insurance. The uninsured rate in California has gone down from 17.2 percent in 2013 to a historic low of 7.4 percent in 2016. Equally impressive, California has created competitive markets in our exchange—Covered California—and in Medi-Cal [Medicaid], resulting in lower costs, increased efficiency and improved quality.

Governor Brown, Democrat, California

  • Improved health and health care. Respondents highlighted a number of ways the ACA has improved health and health care for their state residents. These improvements included increased access to and utilization of care, particularly preventive care, as well as improvements in quality of care. Some respondents noted that increased access and utilization had led to diagnoses of conditions and improvements in health and well-being. Several respondents specifically highlighted improved access to and use of behavioral health care and noted that this access has been central to their state’s ability to address substance use disorders, particularly the growing opioid epidemic.

Ohioans who became eligible for coverage through the expansion reported that it was easier for them to keep or find work, and most reported better health and financial security as a result of obtaining coverage.”

Governor Kasich, Republican, Ohio and Mary Taylor, Lieutenant Governor, Director, Department of Insurance

The NH Health Protection Plan [Medicaid expansion] has also been crucial in helping address New Hampshire’s opioid crisis, a public health emergency in our state and in many others.”

Former Governor Hassan, Democrat, New Hampshire

  • Positive economic effects. Economic benefits cited in responses included state savings, revenue growth, and new jobs. Several respondents also pointed to reductions in uncompensated care among hospitals as a result of coverage growth under the ACA.

“In just this first fiscal year, Louisiana will save $184 million and will save an estimated $330 million next year… [the ACA has] expand[ed] coverage… create[d] tens of thousands of jobs across state… [and] has provided hundreds of new jobs in the health care sector, and infusions of new capital into health care and related services.” –Governor Bel Edwards, Democrat, Louisiana

Challenges with the ACA

Challenges with the ACA were cited in 21 of the 35 state responses. All 18 respondents from states with Republican governors at the time of the response cited challenges, as well as respondents from 3 states (CT, LA, and WV) with Democratic governors. However, for Louisiana, the concerns were expressed by the insurance commissioner, who is an independently elected Republican. Respondents citing challenges included a mix of those who support repeal as well some that support the ACA, but recognize opportunities for continued improvement. Respondents pointed to challenges in several areas:

  • Balance of federal and state authority. The most frequently cited issue was that the ACA had shifted too much control of health insurance to the federal government and that greater authority and flexibility should be given back to states to regulate and manage their insurance markets. A number of respondents also commented that the law had increased the regulatory burden on states.

“The one-size-fits-all approach in Obamacare is failing our country—states must be empowered to be the epicenters of innovation.”

Governor Bevin, Republican, Kentucky

  • Limited access and choice and remaining affordability challenges. Some respondents indicated that the ACA had caused insurers to leave the individual market leading to more limited access and choice for consumers. Respondents also pointed to continuing premium increases that contribute to remaining affordability challenges for coverage and the prevalence of narrow network plans that limit access to providers.

“Costs are skyrocketing, people have not been able to keep their doctors and many people have fewer doctors to choose from.”

Governor Scott, Republican, Florida

  • Sustainability of Medicaid enrollment growth. Respondents in a few states pointed to significant enrollment growth in Medicaid under the Medicaid expansion and noted concerns about ongoing sustainability of the program.
Concerns About Repealing the ACA

Across both parties, most respondents (29 of the 35) highlighted concerns or cautions about repealing the ACA. All 17 responses from states with a Democratic governor at the time of the response noted cautions or concerns about repeal, as did 12 of the 18 responses from states with a Republican governor at the time of the response. Respondents included some that support repeal but are still concerned about potential negative consequences. Many of these respondents stressed the importance of replacement occurring at the same time as repeal and the need for adequate transition time to minimize potential negative effects. Some respondents indicated they could implement changes quickly, but others suggested it could take up to several years.

“…any discussion of repeal, must also include discussion of what replace will look like. I have been clear: I don’t want to see any Arizonans have the rug pulled out from under them.”

Governor Ducey, Republican, Arizona

Respondents’ cautions and concerns about repeal of the ACA focused on several key areas:

  • Potential coverage losses and increased costs to consumers. The most frequently cited concern was that repeal could lead to coverage losses for individuals covered through the Medicaid expansion and Marketplaces. Some respondents also noted the potential for losses among those covered due to other provisions, such as the extension of dependent coverage up to age 26 and the prohibition on exclusion of pre-existing conditions. Similarly, respondents expressed concern that repeal could lead to increased costs to consumers due to coverage losses, loss of the Marketplace subsidies, and price increases among insurers.

“While we agree that there are significant opportunities for improving the ACA, we caution the new administration in making any swift changes that will destabilize the market or upend the gains made to coverage for New Mexico residents.”

John G. Franchini, Superintendent of Insurance, New Mexico

  • Marketplace instability. Another commonly expressed concern was that repeal could contribute to instability in the insurance marketplaces. In particular, a number of respondents who generally support repeal were concerned about potential instability in the short-term or during a transition period. Several of these respondents suggested that allowing consumers to maintain coverage and subsidies during a transitionary period and ensuring that the federal government fully funds risk adjustment and risk corridor programs will be important to maintaining stability. Respondents also requested changes to market rules related to special enrollment periods and grace periods as immediate steps that could help stabilize the markets. Other respondents who generally oppose repeal were more broadly concerned that repeal would significantly disrupt or destroy individual insurance markets.
  • Loss of federal funding/increased state costs. A number of respondents cited concerns that loss of federal funding under the ACA, particularly for the Medicaid expansion, would shift costs to states and threaten the stability of their state budgets as well as their ability to provide health and other public services. Several respondents also noted specific concerns about the potential loss of ACA investments in prevention and public health as well as the potential to lose the enhanced federal matching rate for CHIP that was provided under the ACA. Respondents also noted that repeal could lead to increases in uncompensated care for hospitals.

“…the health of our state budget and local economy is dependent on ACA funding… These federal dollars support jobs across the state while improving the lives of Minnesotans who have health insurance as a result of these programs.”

Governor Dayton, Democrat, Minnesota

  • Jeopardizing state delivery reform initiatives. Several respondents were concerned that repeal of the ACA would disrupt or impede their progress with delivery and payment reform initiatives they had embarked on in recent years, including initiatives in Medicaid.
  • Administrative costs/burden. Some respondents also indicated they had made significant investments and improvements in their Medicaid eligibility and enrollment systems and processes under the ACA. They noted that moving back to old standards would lead to wasted investments and increased administrative complexity and costs.

“The Nevada Department of Health and Human Services invested approximately $95 million dollars to upgrade eligibility determination systems, and the state’s Medicaid Management Information System… To adopt another system that disregards these investments will have an adverse effect on our healthcare system, waste millions of dollars and cost hundreds of Nevadans their jobs.”

Governor Sandoval, Republican, Nevada

Views on Medicaid Financing and Flexibility

One specific question outlined in the House members’ request was what key administrative, regulatory or legislative changes would help states reduce costs and improve health outcomes in their Medicaid program. The Administration and Republican leaders in Congress have called for changes to fundamentally restructure Medicaid financing a block grants or per capita cap. These proposals are often designed to achieve federal budget savings by setting federal funding limits below the levels that would be expected if current law were to stay in place. In exchange for these federal caps, proposals could provide states increased flexibility to design and administer their programs. Changes to federal rules and state options for Medicaid would affect the extent of accountability for the federal investment in the program and the scope of nationwide enrollee protections.

Medicaid Financing Structure

Just over half of the state responses (18 of 35) included comments on Medicaid financing, particularly the potential to move to a block grant or per capita cap financing structure. The remaining 17 state responses did not include comments on Medicaid financing.

Most respondents that commented on Medicaid financing (12 of 18) indicated concerns about a capped financing structure. Most of those expressing concerns (10 of 12) were from states with a Democratic governor at the time of response. The most frequently cited concern was that a cap would transfer risk and costs to the state and that capped financing would lead to states having to make difficult decisions about program cutbacks in eligibility, benefits, or provider payments. A few respondents highlighted concerns that a cap could lock historic state program choices and variation in place, potentially penalizing states that run more efficient Medicaid programs.

“…[T]his policy change will result in the single largest transfer of risk ever from the federal government to the states.”

Governor Ducey, Republican, Arizona

“These proposals would shift the cost of providing health care to Colorado’s most vulnerable citizens on our limited state budget or force us to make difficult cuts. We should not be forced to choose between providing hardworking older Coloradans with blood pressure medication or children with their insulin.”

Governor Hickenlooper, Democrat, Colorado and Marguerite Salazar, Commissioner of Insurance

Respondents in 6 of the 18 Republican states indicated general support for capped financing, but most included suggestions on how a cap should be structured that are not consistent with federal proposals. For example, suggestions included limiting capped financing to only certain parts of the Medicaid population (e.g., excluding seniors and people with disabilities), having the cap allow for enhanced funding during economic downturns, reviewing the cap annually, and ensuring that the cap does not disadvantage states that have not taken up certain program options, like the Medicaid expansion. Many of these suggestions are not consistent with previous and emerging federal cap proposals, which increase by a set amount each year and are not responsive to changing economic conditions or annual review. Moreover, while Governor Kasich in Ohio pointed out that the implications of capped financing would depend on many details, including how funds are allocated across states, the growth in funding over time, and which federal requirements remain in place, other respondents’ who indicated general support for capped financing did not reference the potential for a cap to be tied to reductions in federal funding. Lastly, some respondents citing support for capped financing noted that it would take time to transition to a new financing structure.

“Don’t disadvantage states that haven’t yet fully utilized certain programs, including expansion. States like Utah that have been fiscally prudent and careful not to act too quickly should not be penalized in the allocation of funding in the future. All states should begin any new process on a level playing field.”

Governor Herbert, Republican, Utah

State Medicaid Flexibility

Among the 35 state responses, 14 respondents, most from Republican states, indicated interest in increased state Medicaid flexibility. Two respondents (CT and MN) indicated that they were able to innovate within the existing program options. Four respondents, including two of those calling for increased flexibility (MA and MT), asserted that increased flexibility should not be tied to financing changes that would shift costs to states. The remaining 18 respondents did not provide comments on flexibility within Medicaid.

“Increased flexibility for states is a political imperative in places like Montana, but that flexibility should not be conflated with funding structures that will ultimately threaten the health of our state budget and reduce access to healthcare for tens of thousands of vulnerable Montanans.”

Governor Bullock, Democrat, Montana

There was wide variation in scope of increased flexibility called for among respondents interested in increased flexibility. Some called for maximum state flexibility to design their programs, while others had more limited requests focused on specific areas. Areas where respondents provided suggestions for increased flexibility included:

  • Premiums and cost sharing. In particular, they cited interest in the ability to charge more populations premiums and cost sharing, to charge higher amounts, and to disenroll and lock individuals out of coverage due to unpaid monthly contributions.
  • Benefits. Some specifically noted interest in eliminating coverage of non-emergency transportation, scaling back coverage currently provided to children under the Early and Periodic, Screening, Diagnostic, and Treatment (EPSDT) benefit, and more flexibility around behavioral health services. A few respondents also pointed to interest in targeting benefits by population, although states currently have options to do this under existing law. A few wanted more flexibility to use premium assistance to serve enrollees.
  • Eligibility, including enrollment caps and work requirements. Three states specifically called for the ability to freeze or cap enrollment (AZ, TN, and UT) and four (AL, AZ, TN, and UT) requested the ability to institute work requirements as a condition of eligibility. Other areas of interest were more flexibility to choose which groups are covered and to establish income standards, elimination of hospital-based presumptive eligibility, and elimination of the maintenance of effort provision that requires states to maintain eligibility levels for children until 2019.
  • Provider payments and delivery systems. States already have substantial flexibility to determine how they pay providers and deliver care to Medicaid enrollees. Specific types of increased flexibility requested by respondents included the ability to negotiate rates with Federally-Qualified Health Centers, fewer requirements to provide a choice of plan to enrollees in managed care arrangements, fewer requirements related to network adequacy, and the ability to mandatorily enroll high-need groups into managed care that are currently excluded from mandatory enrollment.
  • Other areas of increased flexibility respondents highlighted included care and payment for dual eligible beneficiaries, provision of long-term care services, prescription drug coverage, and alignment of Medicaid with other programs. Some of the specific requests included eliminating the exclusion of Medicaid payments for services provided to patients in mental health and substance use disorder residential treatment facilities (i.e., the IMD exclusion), increased flexibility to provide community-based long-term care services, eliminating states’ responsibility for Medicare Part B and Part D costs, allowing states to require dual eligible beneficiaries to enroll in Special Needs Plans and managed care, providing states greater ability to exclude drugs from formularies, and providing options for states to align Medicaid eligibility with Marketplace eligibility or eligibility for other programs, such as the Supplemental Nutrition Assistance Program.

Waivers

Republican respondents in 10 of the 35 states cited interest in increased flexibility and/or streamlined processes to make changes through Section 1115 waivers. Specific comments included providing a pathway for waivers to become permanent and eliminating or reducing renewal requirements for waivers, allowing other states to replicate waiver changes approved for other states, and providing expedited and streamlined approval processes for waivers and state plan amendments. A number of these respondents also called for more general reductions in regulatory requirements and state reporting requirements.

Although the request specifically asked about state plans to pursue a 1332 waiver, most respondents (20 of the 35) did not provide comments on 1332 waivers. Seven respondents indicated they are or would potentially consider pursuing a 1332 waiver or that they supported maintaining 1332 waiver authority. In contrast, eight respondents indicated that they are not planning to utilize this authority. Several respondents indicated that the current rules related to 1332 waivers are too restrictive, limiting their interest in pursuing a waiver.

Views on Private Insurance

The House members’ request included several questions related to what legislative and regulatory changes would assist states in increasing insurance options; lowering costs; and stabilizing individual, small group, and large group insurance markets. The request also included a question on whether states would consider operating a high risk pool. Republican leaders in Congress are seeking to rollback or alter many of the insurance market reforms enacted by the ACA, particularly guaranteed issue provisions, the essential health benefit requirements, and age rating rules. They would replace the individual mandate with continuous coverage provisions and would retain tax credits but base them on age instead of income. Republican replacement plans also include proposals to permit the sale of insurance across state lines, encourage the use of Health Savings Accounts (HSAs), and implement state high-risk pools as mechanisms to increase access to insurance.

Insurance market regulation

Among the 35 state responses, 19 respondents, including 16 of the 18 respondents from Republican states, requested enhanced authority to states to regulate the individual, small, and large group insurance markets. In contrast, most Democratic respondents supported the insurance market changes made by the ACA and cautioned that altering these rules could lead to market instability and loss of coverage. Most of the respondents calling for increased state regulatory authority noted that states regulated these markets prior to the ACA and are better able to develop rules that will meet the specific needs of their residents. Some states wanted return of full authority over these insurance markets, while others requested additional state flexibility within an overall federal framework.

“…[O]ur overarching request with regards to crafting a replacement for the [ACA] is straightforward: return power to the states to manage their private insurance markets and enhance their healthcare systems.”

Governor Hutchinson, Republican, Arkansas

Some respondents identified specific areas where they sought additional flexibility or enhanced regulatory authority, including:

  • Essential health benefits and plan design. Some respondents called for elimination of the essential health benefits requirement established by the ACA, arguing that states should be allowed to define benefit standards. Others wanted greater flexibility within federal benefit standards to design plans tailored to consumer needs.
  • Premium rating rules. Some respondents also wanted the ability to increase the age rating band from the 3 to 1 ratio specified in the ACA to 5 to 1, which is the ratio many states had in place prior to the ACA. Other respondents wanted flexibility to set rating areas and categories. Respondents in two states, Idaho and Nevada, called for elimination of the prohibition on health status rating.
  • Selling insurance across state lines. Although permitting the sale of insurance across state lines is included in some Republican ACA replacement proposals, most respondents did not provide comments on this approach. The eight respondents who commented had mixed views. Five respondents from Republican states (AZ, AR, FL, GA, and OK), representing a mix of states with limited insurer participation and those with more robust insurance markets, suggested that this practice would increase competition in the markets and expand consumer choice. In contrast, three respondents (CA, ID, and ND) expressed concerns that this approach would undermine their regulatory authority.

“Allow insurance companies to sell across state lines. This will reduce costly state-to-state administrative expenses created by the current system, and allow for more competition in the marketplace.

Governor Scott, Republican, Florida

“We support states being able to protect their consumers from practices contrary to state law; states must retain the ability to enforce state law in regard to any carrier or product sold in that state.”

Governor Otter, Republican, Idaho

Coverage requirements and financial assistance

Respondents in 10 Republican states opposed the individual mandate or wanted to replace it with other mechanisms to encourage enrollment, while respondents in 2 states indicated interest in being able to maintain the mandate. Respondents in the remaining 23 states did not comment on the individual mandate; however, a number of respondents noted the importance of guranteed coverage provisions for which the individual mandate was intended to support. Most respondents who oppose the mandate (7 of 10) suggested it be replaced with provisions to encourage people to maintain continuous coverage and protect against adverse selection in the market. These continuous coverage provisions include premium discounts for maintaining coverage without a break, paying a higher premium for later enrollment, or adding a waiting period for coverage of pre-existing conditions following a break in coverage.

“A repeal of the individual mandate alone… will further erode the individual market by reducing the number of insurers who offer plans, limit the products offered, and increase premiums… [it] must be balanced with appropriate measures to restrict individuals from gaming the system by accessing insurance only when care is needed.”

Governor Herbert, Republican, Utah

Respondents in 15 of the 35 states wanted the federal government to maintain financial assistance for consumers, either through the transition to a replacement plan or as part of a replacement plan. This group included 12 of the 18 respondents from Republican states. Respondents noted that tax credits are important for making coverage affordable to consumers and that loss of the credits could lead to coverage losses and disruptions. While many Democratic respondents did not comment specifically on maintaining financial assistance in a replacement plan, they noted the importance of tax credits to the coverage gains achieved under the ACA.

“Importantly, tax credits and cost-sharing reductions serve a vital function in diversifying the risk pool of individuals who purchase insurance…Any change that eliminates these tax credits and cost-sharing reductions would raise the cost of insurance premiums to levels that would be unaffordable for most eligible New Mexico households.”

Superintendent of Insurance Franchini, New Mexico

Although Republican replacement plans propose expanding the use of HSAs as a vehicle to increase access to insurance, only four respondents, all from Republican states, suggested expanding the use of HSAs. These four states did not indicate whether they wanted expanded HSA options to be in lieu of or in addition to tax credits. The remaining 31 respondents did not include any comments specific to HSAs.

State High Risk Pools

A total of 12 respondents, nearly all from Republican states, indicated they would consider setting up a high-risk pool, while 4 respondents highlighted concerns about high-risk pools. The remaining 19 respondents did not include comments on high-risk pools. Nearly all respondents who indicated they would consider establishing a high-risk pool (11 of 12), noted that it would need to be adequately funded at the federal level. Respondents in four states indicated that they would be opposed to or concerned about state high risk pools. These states alluded to previous unsuccessful experiences with state high risk pools due to high premiums and deductibles as well as limits on coverage of pre-existing condtions. In addition, the New Mexico Insurance Superintendent noted that, while the state continues to operate a high risk pool, it has not protected the state’s individual market from large premium increases, suggesting that these pools alone will not address adverse selection in the markets.

“We may consider recreating a high risk pool, but would need to see Congressional legislative language… we would be hesitant to stand up a new high-risk pool with only state resources and without assistance from the federal government.”

Governor Haslam, Republican, Tennessee

Conclusion

In sum, these 35 state responses to the House members’ request provide insight into state perspectives on potential repeal and replacement of the ACA, as well as fundamental changes Congress is considering making to the financing and structure of Medicaid. The analysis shows that state leaders have varied views on ACA repeal and replacement and potential changes to Medicaid. Many of these views fall along party lines, but some views are shared across parties and those who support and oppose repeal. State responses illustrate the ongoing balance between states and the federal government. State perspectives, even among Republicans, were not fully aligned with Republican proposals at the federal level in a number of key areas. As proposals continue to develop, the balance between federal and state roles and priorities will be a key factor that will have implications for federal accountability, state flexibility, and the extent of protections provided to individuals nationwide.

Appendix

Appendix Table 1: Characteristics of Respondents to House Members’ Request
StateRespondentPolitical Affiliation ofGovernor at Time of ResponseImplemented Medicaid Expansion?Marketplace Structure*
GovernorInsurance Commissioner
Total: 352914Republican: 18Democrat: 1726FFM: 14SBM: 12SBM-FP: 5Partnership: 4
AlabamaYRepublicanFFM
ArizonaYRepublicanYFFM
ArkansasYYRepublicanYSBM-FP
CaliforniaYYDemocratYSBM
ColoradoYYDemocratYSBM
ConnecticutYYDemocratYSBM
DelawareYYDemocratYPartnership
District of Columbia**YDemocratYSBM
FloridaYRepublicanFFM
GeorgiaYRepublicanFFM
IdahoYRepublicanSBM
IllinoisYRepublicanYPartnership
KentuckyYRepublicanYSBM-FP
LouisianaYYDemocrat***YFFM
MarylandYRepublicanYSBM
MassachusettsYRepublicanYSBM
MinnesotaYDemocratYSBM
MontanaYDemocratYFFM
NevadaYRepublicanYSBM-FP
New HampshireYDemocrat****YPartnership
New MexicoYRepublicanYSBM-FP
New YorkYDemocratYSBM
North DakotaYRepublicanYFFM
OhioYYRepublicanYFFM
OklahomaYRepublicanFFM
OregonYDemocratYSBM-FP
PennsylvaniaYDemocratYFFM
Rhode IslandYDemocratYSBM
TennesseeYRepublicanFFM
UtahYRepublicanFFM
VermontYDemocrat****YSBM
VirginiaYDemocratFFM
WashingtonYYDemocratYSBM
West VirginiaYDemocratYPartnership
WisconsinYRepublicanFFM
NOTES: *This column describes whether a state has elected to use the Federally-facilitated Marketplace (FFM), establish a Marketplace in partnership with the federal government (Partnership), establish a State-based Marketplace that uses the federal platform (SBM-FP) or establish and operate its own State-based Marketplace (SBM). *The affiliation for the District of Columbia is for Mayor, not Governor. ***In Louisiana, the Insurance Commissioner is an elected position. The Insurance Commissioner who provided a response for Louisiana is Republican. ****In New Hampshire and Vermont, the Governorship switched after the response was provided, which resulted in a change in the political party of these states’ governors from Democrat to Republican.SOURCE: Kaiser Family Foundation analysis of responses provided to request from members of the House of Representatives for state input on health reform.


Appendix Table 2:Comments from Governors and Insurance Commissioners on ACA and ACA Repeal
StateImplemented Medicaid Expansion?Cited Positive Effects of ACACited Concerns with ACACited Concerns/Cautions About Repeal of ACA
Total: 3526232129
Democratic Governor: 171617317
CaliforniaYYY
ColoradoYYY
ConnecticutYYYY
DelawareYYY
District of ColumbiaYYY
Louisiana*YYYY
MinnesotaYYY
MontanaYYY
New YorkYYY
New Hampshire**YYY
OregonYYY
PennsylvaniaYYY
Rhode IslandYYY
VirginiaYY
Vermont**YYY
WashingtonYYY
West VirginiaYYYY
Republican Governor: 181061812
AlabamaYY
ArizonaYYY
ArkansasYY
FloridaY
GeorgiaY
IdahoYY
IllinoisYYY
KentuckyYY
MarylandYYY
MassachusettsYYYY
NevadaYYYY
New MexicoYYYY
North DakotaYYY
OhioYYYY
OklahomaYY
TennesseeY
UtahYYY
WisconsinYY
NOTES: *In Louisiana, both the Democratic governor and the independently elected Republican insurance commissioner provided responses. **In New Hampshire and Vermont, the governorship switched after the response was provided, which resulted in a change in the political party of these states’ governors from Democrat to Republican.SOURCE: Kaiser Family Foundation analysis of responses provided to request from members of the House of Representatives for state input on health reform.


Appendix Table 3:Comments from Governors and Insurance Commissioners on Medicaid Financing and Flexibility and Waivers
StateCapped Medicaid FinancingState Medicaid FlexibilityIncrease Section 1115 Waiver Flexibility/ Streamline ProcessesSection 1332 Waivers
Total: 35Concerns: 12Support: 6NC: 17Increase: 14Can already innovate: 2Do not tie to reduced financing: 4NC: 18Yes: 10NC: 25Support: 7No plans: 8NC: 20
Democratic Governor: 17Concerns: 10Support: 0NC: 7Increase: 3Can already innovate: 2Do not tie to reduced financing: 3NC: 11Yes: 0NC: 17Support: 2No plans: 2NC: 13
CaliforniaConcernsNCNCNC
ColoradoConcernsIncreaseNCSupport
ConnecticutConcernsCan already innovateNCNC
DelawareNCNCNCNo plans
District of ColumbiaNCNCNCNC
Louisiana*ConcernsDo not tie to reduced financingNCNo plans
MinnesotaConcernsCan already innovate; Do not tie to reduced financingNCSupport
MontanaConcernsIncrease; Do not tie to reduced financingNCNC
New YorkConcernsNCNCNC
New Hampshire**ConcernsNCNCNC
OregonConcernsNCNCNC
PennsylvaniaNCNCNCNC
Rhode IslandNCNCNCNC
VirginiaNCNCNCNC
Vermont**NCNCNCNC
WashingtonConcernsNCNCNC
West VirginiaNCIncreaseNCNC
Republican Governor: 18Concerns: 2Support: 6NC: 10Increase: 11Can already innovate: 0Do not tie to reduced financing: 1NC: 7Yes: 10NC: 8Support: 5No plans: 6NC: 7
AlabamaNCIncreaseYesNo plans
ArizonaConcernsIncreaseYesNo plans
ArkansasSupport, w/ caveatsIncreaseYesNo plans
FloridaSupport, w/ caveatsIncreaseYesNC
GeorgiaNCNCNCNC
IdahoNCNCNCNo plans
IllinoisNCNCNCNC
KentuckySupportIncreaseYesSupport
MarylandNCNCNCNC
MassachusettsConcernsIncrease, Do not tie to reduced financingYesSupport
NevadaNCIncreaseYesSupport
New MexicoNCNCNCSupport
North DakotaNCNCNCNC
OhioSupport, w/ caveatsIncreaseNCNC
OklahomaNCNCYesSupport
TennesseeNCIncreaseYesNo plans
UtahSupport, w/ caveatsIncreaseYesNo plans
WisconsinSupportIncreaseNCNC
NOTES: *In Louisiana, both the Democratic governor and the independently elected Republican insurance commissioner provided responses. **In New Hampshire and Vermont, the governorship switched after the response was provided, which resulted in a change in the political party of these states’ governors from Democrat to Republican.NC indicates no comments provided on that topic or response could not be classified based on the comments provided.“Support w/caveats” indicates cases in which the respondent cited support for capped financing but included qualifications regarding how the cap should be structured.SOURCE: Kaiser Family Foundation analysis of responses provided to request from members of the House of Representatives for state input on health reform.


Appendix Table 4:Comments from Governors and Insurance Commissioners on Changes to Private Insurance
StateIncrease State Regulatory AuthoritySale of Insurance Across State LinesIndividual MandateMaintain Financial Assistance for ConsumersExpand HSAsHigh Risk Pools
Total: 35Yes: 19NC: 16Support: 5Oppose: 3NC: 27Oppose Mandate: 3Alternative Approach: 7Maintain Mandate: 2NC: 23Support: 11In Transition: 4NC: 20Yes: 4NC: 31Consider: 12Concerns: 4NC: 19
Democratic Governor: 17Yes: 3NC: 14Support: 0Oppose: 1NC: 16Oppose Mandate: 0Alternative Approach: 0Maintain Mandate: 1NC: 16Support: 2In Transition: 1NC: 14Yes: 0NC: 17Consider: 2Concerns: 2NC: 13
CaliforniaNCOpposeMaintainSupportNCConcerns
ColoradoNCNCNCNCNCNC
ConnecticutYesNCNCNCNCNC
DelawareNCNCNCNCNCConcerns
District of ColumbiaNCNCNCNCNCNC
Louisiana*YesNCNCIn transitionNCConsider w/federal funds
MinnesotaNCNCNCNCNCNC
MontanaNCNCNCNCNCNC
New YorkNCNCNCNCNCNC
New Hampshire**NCNCNCNCNCNC
OregonNCNCNCNCNCNC
PennsylvaniaNCNCNCNCNCNC
Rhode IslandNCNCNCNCNCNC
VirginiaNCNCNCNCNCNC
Vermont**NCNCNCNCNCNC
WashingtonNCNCNCNCNCNC
West VirginiaYesNCNCSupportNCConsider w/federal funds
Republican Governor: 18Yes: 16NC: 2Support: 5Oppose: 2NC: 11Oppose Mandate: 3Alternative Approach: 7Maintain Mandate: 1NC: 7Support: 9In Transition: 3NC: 6Yes: 4NC: 14Consider: 10Concerns: 2NC: 6
AlabamaYesNCAlternativeSupportYesConsider w/federal funds
ArizonaYesSupportNCIn transitionNCConsider w/federal funds
ArkansasYesSupportOpposeSupportNCConsider w/federal funds
FloridaYesSupportAlternativeSupportYesNC
GeorgiaYesSupportOpposeNCNCConsider w/federal funds
IdahoYesOpposeAlternativeSupportNC Consider w/federal funds
IllinoisNCNCNCNCNCNC
KentuckyYesNCOpposeSupportNCConsider
MarylandYesNCNCNCNCNC
MassachusettsYesNCMaintainSupportNCConcerns
NevadaYesNCNCNCNCConsider w/federal funds
New MexicoYesNCAlternativeSupportNCConcerns
North DakotaYesOpposeNCIn transitionNCNC
OhioYesNCAlternativeNCYesNC
OklahomaYesSupportAlternativeSupportYesConsider w/federal funds
TennesseeYesNCNCNCNCConsider w/federal funds
UtahYesNCAlternativeIn transitionNCConsider w/federal funds
WisconsinNCNCNCSupportNCNC
NOTES: *In Louisiana, both the Democratic governor and the independently elected Republican insurance commissioner provided responses. **In New Hampshire and Vermont, the governorship switched after the response was provided, which resulted in a change in the political party of these states’ governors from Democrat to Republican.NC indicates no comments provided on that topic or response could not be classified based on the comments provided.SOURCE: Kaiser Family Foundation analysis of responses provided to request from members of the House of Representatives for state input on health reform.


Appendix B: Summary of Responses from Associations

Four associations (American Academy of Actuaries, Democratic Governors Association, National Governors Association, and the Republican Governors Association) responded to Congress’ request for input. Key takeaways from the associations include:

American Academy of Actuaries. The American Academy of Actuaries urges Congress to consider the potential adverse consequences of repealing provisions of the ACA, including the individual mandate and enrollee subsidies, without also enacting a replacement approach at the same time. They express concern that a repeal of major provisions of the ACA would lead to loss of enrollment, affordability challenges, and market instability. They note that offering pre-existing condition protections requires incentives for enrollment; eliminating provisions that encourage enrollment would threaten sustainability; and increasing risks or eliminating cost-sharing reduction reimbursements could cause an increase in insurer withdrawals from the market.

Democratic Governors Association. The Democratic Governors Association opposes a repeal of the Affordable Care Act, including its Medicaid expansion, citing concerns over financial stability and health of states. They note that repealing the ACA would result in loss of coverage, shift of costs to state governments, economic uncertainty, loss of consumer protections provided under the ACA, and increases in uncompensated care. The letter also highlights the role of Medicaid and its expansion on increased coverage and combatting the opioid use epidemic.

National Governors Association. The National Governors Association highlights the need to work in a bipartisan manner to build a more efficient health care system, put patients first, and address the underlying issues of unsustainable health care spending. They urge Congress to consider incorporating Governors’ suggestions throughout the legislative process; consider reforms to private health insurance that provide meaningful state flexibilities; maintain a meaningful federal role in the Medicaid financing partnership that does not shift costs to states; protect states from unforeseen financial risks; maintain predictability in health reform legislation; and support the continuation of innovative state health care programs that rely on federal funding.

Republican Governors Association. The Republican Governors Association seeks to advance alternatives to the ACA. They also highlight concerns about the quality and sustainability of the Medicaid program. The Republican Governors Association seeks to reflect on state flexibilities gained in recent years and factors inhibiting state innovation to respond to the unique needs of Medicaid beneficiaries.

News Release

Polling Data Note: Beyond the ACA, the Affordability of Insurance Has Been Deteriorating Since 2015

Published: Mar 2, 2017

The debate about the future of the Affordable Care Act and its individual insurance marketplaces may be taking the focus off the affordability challenges facing the broader population, most of whom get their health coverage through employers, Medicare or Medicaid.

New survey findings from the Kaiser Family Foundation show that health care has become somewhat less affordable even among those with health insurance. Since 2015, larger shares of people with health insurance say they have a difficult time affording their health care costs: from 27 percent to 37 percent for premiums, 34 percent to 43 percent for deductibles, and from 24 percent to 31 percent for copays and prescription drugs.

pollingchartmarch1

Other findings include:

  • About three in 10 adults (29%) report someone in their household has had problems paying medical bills in the past year, often with real consequences. For example, among those reporting problems paying medical bills, seven in 10 (73%) report cutting back spending on food, clothing, or basic household items, while about six in 10 report using up all or most of their savings (61%) or taking an extra job or working more hours (58%) to pay their bills.
  • Concerns about cost are also affecting whether and when some people seek health care. For example, a quarter (27%) of the public says that they or a family member living in their household put off or delayed getting health care they needed in the past year due to costs, and nearly as many say they skipped a recommended medical test or treatment (23%) or did not fill a prescription (21%).
  • Nearly half of Americans (45%) say they would have difficulty paying an unexpected $500 medical bill. This includes those who say they wouldn’t be able to pay it at all (19%), those who would put it on a credit card and pay it off over time (20%) and those who would have to borrow money from a bank, payday lender, family or friends (7%). Among the uninsured and those with lower incomes, more than three in ten say they would not be able to pay a $500 bill at all.
  • Significant shares of the public say they are “very worried” about not being able to afford health care services they think they need (25%), losing their health insurance (22%), or not being able to afford prescription drugs (21%). Overall, half say they are at least somewhat worried that they won’t be able to afford needed health care services.

The data note draws on previously unreported data from Kaiser Health Tracking Polls conducted in December and February. Designed and analyzed by public opinion researchers at the Kaiser Family Foundation, the polls were conducted from December 13-19, 2016 and February 13-19, 2017 among nationally representative random digit dial telephone samples of 1,204 and 1,160 adults, respectively. Interviews were conducted in English and Spanish by landline and cell phone. The margin of sampling error is plus or minus 3 percentage points for the full samples. For results based on subgroups, the margin of sampling error may be higher.

News Release

KFF Analysis: Average Health Insurance Tax Credit for Consumers Would Be at Least a Third Lower Under Currently Discussed Replacement Plans than the ACA

Tax Credits in Proposals Also Would Increase More Slowly Over Time Than Under ACA

Published: Mar 1, 2017

A new analysis from the Kaiser Family Foundation estimates that the average health insurance premium tax credit received by consumers in 2020 would be at least 36 percent lower under replacement proposals being discussed by Republicans in Congress than under the Affordable Care Act.

The average tax credit also would increase more slowly under replacement proposals, the analysis finds: In the House Discussion Draft alternative to the ACA, which has been recently discussed in media reports, the average tax credit for current ACA marketplace enrollees would rise from an estimated $2,957 in 2020 to $3,729 in 2027. By comparison, the average tax credit under the ACA would be $4,615 in 2020, increasing to $6,648 in 2027. 

Figure 3: Over time, the average tax credit received under Republican replacement plans would grow slower than under the ACA

The new analysis provides estimates of average 2020 tax credits for people who were enrolled in ACA marketplace plans as of 2017, including average credits for those with low, middle, and high incomes at ages 27, 40, and 60, and in markets with low-, average, and high-cost health insurance premiums.

It finds that people with lower incomes, who are older, or who live in markets with higher premiums would receive larger tax credits under the ACA than under replacement proposals. By contrast, people with higher incomes, who are younger, or who live in areas with lower premiums would benefit more from alternative plans.

Both the Affordable Care Act and leading alternative proposals rely on refundable tax credits – reductions in what is owed in federal income tax — to help people pay premiums for health insurance plans in the individual market. However, proposals such as the House Discussion Draft and the “Empowering Patients First Act,” introduced by Rep. Tom Price before he became U.S. Secretary of Health and Human Services, calculate credit amounts differently than the health law.

The ACA takes family income, local cost of insurance, and age into account; and tax credit increases are based on premium growth over time. People with incomes over 400 percent of the federal poverty level are ineligible for financial assistance under the ACA. Under replacement proposals, tax credits vary only with the enrollee’s age, and increases are based on inflation.

How Affordable Care Act Repeal and Replace Plans Might Shift Health Insurance Tax Credits is available on kff.org

Poll Finding

Kaiser Health Tracking Poll: Future Directions for the ACA and Medicaid

Authors: Ashley Kirzinger, Elise Sugarman, and Mollyann Brodie
Published: Feb 24, 2017

Findings

KEY FINDINGS:

  • The latest Kaiser Health Tracking Poll finds attitudes towards the Affordable Care Act (ACA) have shifted with a larger share reporting a favorable opinion towards the law (48 percent) than reporting an unfavorable opinion (42 percent). This is the highest level of favorability of the ACA measured in more than 60 Kaiser Health Tracking Polls since 2010 and is largely driven by a change in the views of independents, among which 50 percent now view the law favorably.
  • Despite this shift in overall favorability, the public remains divided on what they would like lawmakers to do when it comes to the 2010 health care law with 47 percent wanting lawmakers to vote to repeal the law compared to 48 percent who say they should not vote to repeal it. Of those who want to see Congress vote to repeal the law, a larger share say they want lawmakers to wait to vote to repeal the law until the details of a replacement plan have been announced (28 percent) than say Congress should vote to repeal the law immediately and work out the details of a replacement plan later (18 percent).
  • Republican lawmakers have also discussed possible changes to Medicaid – to either a per capita allotment program or to giving states the option to receive federal Medicaid funding in the form of a block grant. When examining these two proposed changes to Medicaid, more Americans (65 percent) would prefer to see Medicaid continue as it is today than either of the offered alternatives to the current federal funding structure.
  • The vast majority of Americans say it is either “very important” (55 percent) or “somewhat important” (29 percent) for ACA replacement plans to ensure that states that have received federal funds to expand Medicaid continue to receive those funds, with majorities of Democrats (95 percent), independents (84 percent), and Republicans (69 percent) saying it is important.

The February 2017 Kaiser Health Tracking Poll finds that Americans have concerns about the shifting landscape of health care in this country. Six in ten (62 percent) Americans say that when it comes to health care, things in this country have pretty seriously gotten off on the wrong track, compared to three in ten who say things are generally going in the right direction.

Figure 1: Six in Ten Say When It Comes to Health Care, Things in U.S. Have Gotten Off on the Wrong Track

These results are consistent across demographic groups with roughly twice as many individuals – regardless of party identification or health status – saying things are on the wrong track as saying things are headed in the right direction. This month’s survey examines two specific policy areas that may be driving these concerns: the future of the Affordable Care Act and Medicaid.

Future Directions for the Affordable Care Act

With lawmakers debating the future of the Affordable Care Act (ACA), the latest Kaiser Health Tracking survey finds that more Americans now have a favorable view of the health care law (48 percent) than have an unfavorable opinion (42 percent).

Figure 2: More Americans Now Have a Favorable View of the Health Care Law than Have an Unfavorable View

Attitudes towards the ACA are largely viewed through a partisan lens with about seven in ten Republicans and about seven in ten of those who approve (either somewhat or strongly) of the way President Trump is handling his job reporting an unfavorable opinion towards the law (74 percent and 69 percent, respectively). This compares to a majority of both Democrats and those who disapprove of President Trump reporting a favorable view of the law (73 percent and 71 percent).

Figure 3: View of Affordable Care Act Varies by Party Affiliation and Trump Approval

The Shifting Attitudes of Independents

The latest shift in favorability of the law is largely driven by the views of independents, among whom a larger share now say they have a favorable opinion (50 percent) of the law than an unfavorable opinion (39 percent). This is the first survey since 2010 that has found a larger share of independents reporting a favorable view than an unfavorable view.1 

Figure 4: A Larger Share of Independents Now Say They Have Favorable Opinion of the ACA

Repealing and Replacing the Affordable Care Act

As lawmakers debate replacement plans for the ACA, Americans are divided on what they want to see lawmakers do with the health care law, with 48 percent saying they do not want Congress to vote to repeal the law and 47 percent saying they want Congress to vote to repeal it. Of those who want to see Congress vote to repeal the law, a larger share say they want lawmakers to wait to vote on repeal until the details of a replacement plan have been announced (28 percent) than say Congress should vote to repeal the law immediately and work out the details of a replacement plan later (18 percent). These findings are similar to the results from the December 2016 Kaiser Health Tracking Poll.2 

Figure 5: Americans Divided on ACA Repeal and Replacement

Attitudes on the ACA’s next steps are largely partisan with the vast majority of Democrats (78 percent) saying they do not want Congress to vote to repeal the health care law compared to about half of independents and 16 percent of Republicans who say the same. On the other hand, while the majority of Republicans want to see Congress vote to repeal the law, fewer want them to vote to repeal the law immediately (31 percent) than want them to wait until they have the details of a replacement plan announced (48 percent). With more than half of Republicans (64 percent) wanting lawmakers to do something other than immediate repeal of the ACA, this is a clear indication of the challenge facing Republican lawmakers.

Table 1: Next Steps for the ACA

Percent who would like to see lawmakers do each of the following with the 2010 health care law:

TotalDemocratsIndependentsRepublicans
Should not vote to repeal48%78%47%16%
Should vote to repeal (NET)47184682
Wait to vote to repeal the law until the details of a replacement plan have been announced2883148
Vote to repeal the law immediately and work out the details of a replacement plan later1891431
Don’t know/Refused6575

How ACA Repeal Efforts Are Affecting Americans

As Americans watch their elected leaders debate repeal and replacement plans for the ACA, more feel worried (56 percent) and hopeful (53 percent) than confused (45 percent), angry (38 percent), or enthusiastic (33 percent).

Figure 6: More Americans Are “Worried” and “Hopeful” About Current Plans to Repeal Health Care Law than “Angry” or “Enthusiastic”

Related to the partisan nature of the health care law and current repeal efforts, Democrats (81 percent) are more likely to say they feel “worried” about current plans than independents (57 percent) and Republicans (26 percent). Republicans, on the other hand, are more likely to report feeling “hopeful” than independents and Democrats (78 percent compared to 55 percent and 30 percent, respectively). An equal share of independents report feeling “worried” (57 percent) as report feeling “hopeful” (55 percent).

Underscoring that perceptions sometimes exceeds the impact of what policies may or may not be, half of Americans (48 percent) are either “very worried” (26 percent) or “somewhat worried” (22 percent) that they or someone in their family will lose their health insurance coverage if the health care law is repealed and replaced, compared to 51 percent of those who are not worried. A larger share of Democrats and independents report being worried about losing their health insurance than Republicans (70 percent, 51 percent, and 17 percent, respectively). In addition, 67 percent of those who disapprove of President Trump say they are worried about losing their coverage under an ACA replacement plan, as do one-fourth of those who approve of President Trump.

Figure 7: Worries over Losing Coverage Vary by Party Affiliation and Trump Approval

Individuals in families with ongoing health needs and individuals who report being in fair or poor health are more likely to be worried about losing their health insurance coverage if the ACA is repealed and replaced. Among those who report being in fair or poor health, 64 percent say they are either “very” or “somewhat” worried about losing their health insurance coverage compared to 44 percent of those in excellent, very good, or good health. About half (55 percent) of individuals with a chronic health condition that requires ongoing medical treatment also report being worried about losing their coverage compared to 41 percent of those without ongoing health needs.

Table 2: Health Status Affects How Worried Individuals Are About Losing Coverage
How worried, if at all, are you that you or someone in your family will lose your health insurance coverage if the health care law is repealed and replaced? TotalHealth StatusOngoing Health Needs
Excellent/ Very Good/ GoodFair/PoorNoYes
Worried (NET)48%44%64%41%55%
Not worried (NET)5155355944
NOTE: Don’t know/Refused responses not shown.

Future Directions for Medicaid

Republican lawmakers’ plans to repeal and replace the 2010 health care law also include proposed changes to Medicaid – the program that provides coverage for medical care and long-term care services to low-income people. Overall, nearly six in ten Americans (56 percent) say Medicaid is either “very” or “somewhat” important to them and their family; however, this does vary by party identification with larger shares of Democrats (62 percent) and independents (57 percent) reporting that the program is important than Republicans (43 percent).

Figure 8: More than Half of Americans Say Medicaid Is Important for Their Family; Fewer Republicans Say So

In addition, over half of Americans report some connection to the Medicaid program, either because they personally have received some assistance from Medicaid (26 percent) or they have close friends or family who have (31 percent).

Figure 9: Over Half Report Some Connection To Medicaid

Proposed Changes to Federal Funding for Medicaid

Currently, Medicaid is jointly financed by federal and state governments, with each state deciding how to structure benefits, eligibility, and care delivery within guidelines set by the federal government. The federal government matches state spending on an open-ended basis but Republican lawmakers are proposing two alternatives to this current structure: per capita allotments and block grants.

Medicaid Per Capita Allotment vs. Block Grant Proposal

Under a Medicaid per capita cap, the federal government would set a limit on how much to reimburse states per enrollee. When provided with the option of keeping Medicaid largely as it is today or changing to a per capita allotment program, Americans largely prefer the status quo with two-thirds saying the program should continue as it is today with the federal government guaranteeing coverage, setting standards and benefits, and matching state spending. About a third (31 percent) say, instead, Medicaid should be changed to a per capita allotment structure rather than matching state Medicaid spending.

Another option that has been proposed by Republican lawmakers calls for giving states the option to receive federal Medicaid funding in the form of a block grant. Under a block grant structure, the federal government would limit the amount it gives states to help pay for Medicaid coverage but could allow states more flexibility in determining which groups of people and what services are covered under the program. Here again, most Americans prefer the status quo, with 63 percent saying the program should continue as it is today while 32 percent say Medicaid should be changed to a block grant structure.

When examining these two proposed changes to Medicaid, more Americans (65 percent) would prefer to see Medicaid continue as it is today than either of the offered alternatives to the current federal funding structure.

Figure 10: Two-Thirds of Americans Say Medicaid Should Continue Largely As It Is Today

Six in ten Republicans support the per capita allotment proposal while about half of Republicans support changing Medicaid to a block grant program.

Table 3: Proposed Changes to Medicaid

Which of these descriptions comes closer to your view of what Medicaid should look like in the future?

TotalDemocratsIndependentsRepublicans
OPTION AMedicaid should largely continue as it is today, with the federal government guaranteeing coverage for low-income people, setting standards for who states cover and what benefits people get, and matching states’ Medicaid spending as the number of people on the program goes up or down (NET)65%88%65%39%
OPTION BMedicaid should be changed so that instead of matching state Medicaid spending, the federal government limits how much it gives states to help pay for Medicaid coverage but lets states decide which groups of people and what health care services they want to cover.32133553
Medicaid should be changed so that instead of matching state Medicaid spending, the federal government limits how much it gives states to help pay for Medicaid coverage on a per person basis but lets states decide which groups of people and what health care services they want to cover.3183157
NOTE: OPTION B items were asked of separate half samples.

Vast Majority of Americans Think Continuing Federal Funding for Medicaid Expansion is Important

Medicaid is also one of the primary ways the Affordable Care Act expanded coverage to millions more low-income, uninsured adults. The vast majority of Americans say it is either “very important” (55 percent) or “somewhat important” (29 percent) for ACA replacement plans to make sure that states that have received federal funds to expand Medicaid continue to receive those funds – with majorities of Democrats (95 percent), independents (84 percent), and Republicans (69 percent) saying it is important.

Table 4: Majorities of Democrats, Independents, and Republicans Say Continued Federal Funding for Medicaid Expansion Is Important

If lawmakers decide to repeal and replace the 2010 health care law, how important is it to you that a replacement plan makes sure states that received federal funds to expand Medicaid continue to receive those funds?

TotalDemocratsIndependentsRepublicans
Important (NET)84%95%84%69%
    Very important55775531
    Somewhat important29172938
Not important (NET)1541528
    Not too important73812
    Not at all important81715
Don’t know/Refused1111

Attitudes Towards Continued Federal Funding for Medicaid Expansion in States That Have Expanded Medicaid

The vast majority (87 percent) of individuals living in the 16 states that have expanded Medicaid and have a Republican governor say it is either “very” or “somewhat” important that a replacement plan makes sure states that received federal funds to expand Medicaid continue to receive those funds. This is similar to the share of those living in Medicaid expansion states with Democratic governors (85 percent) and more than those living in states without Medicaid expansion (80 percent).

Figure 11: Large Majorities Say Continued Funding for Medicaid Expansion Is Important

Medicaid Spending Compared to Other National Priorities

Reflecting the high regard the public holds for Medicaid, Americans are generally opposed to cutting back federal spending on the program. Overall, about half of Americans want to keep federal spending on Medicaid the same, while 36 percent want to increase spending and 12 percent want to decrease spending.

Figure 12: Few Americans Want Decreased Spending on Medicaid

With the exception of increased spending on education, partisans have largely different spending priorities. Majorities of Democrats (81 percent), independents (66 percent), and Republicans (57 percent) would like to see the president and Congress increase spending on education; yet, that is where the consensus ends with a  majority of Republicans calling for increased spending on national defense and about half of Democrats calling for increased spending on each of the three major entitlement programs – Medicare, Social Security, and Medicaid.

Table 5: Partisans Differ on Spending Priorities

Percent who want to see the president and Congress increase spending on each of the following:

TotalDemocratsIndependentsRepublicans
Education67%81%66%57%
Social security47535336
Medicare43514435
National defense39203963
Medicaid36474022
Financial help for individuals to buy private health insurance32403226
Foreign aid91782
NOTE: Some items asked of separate half-samples.

While partisans may have different spending priorities, even among Republicans, few want to see Medicaid spending decreased (19 percent).

Which Sources Does the Public Trust?

President Trump’s administration has frequently lamented the accuracy of news from major news organizations. Therefore, this month’s Tracking Poll aims to find out if there are sources that Americans trust when it comes to news about proposed changes to the U.S. health care system. Overall, six in ten (59 percent) Americans say there is a source in the news media that they trust compared to 39 percent who say there is no source that they trust for information about proposed changes to the health care system. One-fifth of all Americans say they most trust a cable news network for information about proposed changes to the U.S. health care system, with 10 percent of those saying they trust Fox News, 8 percent saying they trust CNN, and 3 percent saying they trust MSNBC. Smaller shares of Americans say they most trust national broadcast news (6 percent), national newspapers (5 percent), public television or radio (4 percent), local television or radio news (4 percent), and the internet (4 percent).

Figure 13: One in Five Americans Trust Cable News Most for Information about Proposed Changes to the Health Care System

When it Comes to Health Care News, Americans Are Divided on What Sources They Trust

When it comes to information about proposed changes to the U.S. health care system, Americans are more likely to say they trust their Congressional representative (55 percent), their friends and family (51 percent), and local (53 percent) and national news organizations (51 percent) than say the same about information from President Trump (42 percent) or social networking sites, such as Facebook and Twitter (16 percent). While fewer than half of Americans say they trust information about proposed changes to the U.S. health care system from President Trump “a lot” or “some,” about one-fourth of Americans do say they trust information from the President “a lot” (23 percent) which may be an indication of the current divisive political environment. In fact, about half of Republicans say they trust information from President Trump “a lot” compared to 19 percent of independents and 4 percent of Democrats.

Figure 14: Majority of Americans Trust Some Sources of Information on Changes to the Health Care System

Methodology

This Kaiser Health Tracking Poll was designed and analyzed by public opinion researchers at the Kaiser Family Foundation (KFF). The survey was conducted February 13-19, 2017, among a nationally representative random digit dial telephone sample of 1,160 adults ages 18 and older, living in the United States, including Alaska and Hawaii (note: persons without a telephone could not be included in the random selection process). Computer-assisted telephone interviews conducted by landline (389) and cell phone (771, including 464 who had no landline telephone) were carried out in English and Spanish by Princeton Data Source under the direction of Princeton Survey Research Associates International (PSRAI). Both the random digit dial landline and cell phone samples were provided by Survey Sampling International, LLC. For the landline sample, respondents were selected by asking for the youngest adult male or female currently at home based on a random rotation. If no one of that gender was available, interviewers asked to speak with the youngest adult of the opposite gender. For the cell phone sample, interviews were conducted with the adult who answered the phone. KFF paid for all costs associated with the survey.

The combined landline and cell phone sample was weighted to balance the sample demographics to match estimates for the national population using data from the Census Bureau’s 2015 American Community Survey (ACS) on sex, age, education, race, Hispanic origin, and region along with data from the 2010 Census on population density. The sample was also weighted to match current patterns of telephone use using data from the January-June 2016 National Health Interview Survey. The weight takes into account the fact that respondents with both a landline and cell phone have a higher probability of selection in the combined sample and also adjusts for the household size for the landline sample. All statistical tests of significance account for the effect of weighting.

The margin of sampling error including the design effect for the full sample is plus or minus 3 percentage points. Numbers of respondents and margins of sampling error for key subgroups are shown in the table below. For results based on other subgroups, the margin of sampling error may be higher. Sample sizes and margins of sampling error for other subgroups are available by request. Note that sampling error is only one of many potential sources of error in this or any other public opinion poll. Kaiser Family Foundation public opinion and survey research is a charter member of the Transparency Initiative of the American Association for Public Opinion Research.

GroupN (unweighted)M.O.S.E.
Total1160±3 percentage points
Half Sample A586±5 percentage points
Half Sample B574±5 percentage points
Party Identification
   Democrats375±6 percentage points
   Republicans324±6 percentage points
   Independents348±6 percentage points
Presidential Approval
   Approves of President Trump495±5 percentage points
   Disapproves of President Trump590±5 percentage points
Health Status
    Excellent/Very good/Good938±4 percentage points
    Fair/Poor217±8 percentage points
Ongoing Health Needs
   Individuals with ongoing health needs605±5 percentage points
   Individuals without ongoing health needs551±5 percentage points
Medicaid Expansion + Governor
   States that expanded Medicaid with Republican governors311±7 percentage points
   States that expanded Medicaid with Dem. or Ind. governors388±6 percentage points
   States that have not expanded Medicaid461±5 percentage points

Endnotes

  1. On average, individuals who identify as political independents have accounted for about one-third of the total sample in Kaiser Health Tracking Polls. ↩︎
  2. A Kirzinger, B Wu, M Brodie, Kaiser Health Tracking Poll: Health Care Priorities for 2017. https://modern.kff.org/health-costs/poll-finding/kaiser-health-tracking-poll-health-care-priorities-for-2017/ ↩︎
News Release

Amid Repeal Debate, Public Views Obamacare More Favorably Than Unfavorably

Public Remains Split on Repeal but a Small Share, Including 31% of Republicans, Favor Repeal Without Replace

Published: Feb 24, 2017

Large Majorities Want to Continue Federal Funding for Medicaid Expansion; Two Thirds Favor Current Federal Role over Block Grants or Per-Capita Caps

As President Trump and Congress weigh repealing the Affordable Care Act, the latest Kaiser Health Tracking Poll finds more Americans viewing the law favorably than unfavorably (48% compared to 42%). This is the highest level of favorability measured in more than 60 Kaiser Health Tracking Polls conducted since 2010.

tracking-poll-for-tiff2

The shift largely reflects more favorable views among independents, who now are more likely to view the law favorably (50%) than unfavorably (39%). Most Democrats (73%) continue to view the law favorably while most Republicans (74%) view it unfavorably.

In spite of these more favorable views, the public remains divided along partisan lines on whether Congress should (47%) or should not (48%) repeal the law. At the same time, more of those who favor repeal want lawmakers to wait until the details of a replacement plan are known (28% overall) than want Congress to repeal immediately and work out the replacement’s details later (18% overall).

Even among Republicans, while the majority want to see Congress vote to repeal the law – fewer want them to vote to repeal the law immediately (31%) than want them to wait until they have the details of a replacement plan announced (48%), and 16 percent of Republicans do not want the law repealed at all.

tifftrackingpoll1

When asked how they feel about the repeal-and-replace debate, more say worried (56%) and hopeful (53%) than confused (45%), angry (38%) or enthusiastic (33%).

Underscoring that perceptions sometimes exceed the impact of what policies may or may not do, nearly half (48%) of the public says they worry that they or someone in their family will lose their health insurance if the law is repealed and replaced.

When asked about health care generally, twice as many Americans say it has gotten off on the wrong track (62%) as say it is headed in the right direction (30%). This view prevails among Democrats, Republicans and independents alike – a rare instance of partisan agreement on health care. The share of those who say health care in this country has gotten off on the wrong track is similar to other national estimates of the direction of the country more generally.

Majorities Favor Current Federal Funding for Medicaid to Limiting Federal Support

Medicaid is also one of the primary ways the Affordable Care Act expanded coverage to millions more low-income, uninsured adults. The vast majority (84%) say it is either “very” or “somewhat” important for any replacement plan to ensure that states that received federal funds to expand Medicaid continue to receive those funds. This includes majorities of Democrats (95%) independents (84%) and Republicans (69%).

The vast majority (87%) of residents in the 16 states that expanded their Medicaid programs that now have Republican governors say it is important to continue to receive those funds – similar to the share in expansion states with Democratic or independent governors (85%) and more than in states that chose not to expand their Medicaid programs (80%).

mollybrodiechart

As part of some plans to repeal and replace the 2010 health care law, Congressional leaders are also considering structural changes to Medicaid, which provides coverage for medical care and long-term care services to low-income people. The federal government today matches state spending on an open-ended basis but Republican lawmakers are weighing limiting federal funds through per-capita caps or block grants.

When asked to choose, two-thirds (66%) of the public prefers the status quo compared to about one third (31%) who favor the per-capita cap approach, which would limit federal funding on a per-person basis while giving states more flexibility over who and what services to cover. Similarly, more favor the status quo (63%) over a shift to Medicaid block grants (32%) that would limit federal funding while giving states greater control over who and what to cover under Medicaid.

Such concerns about reduced Medicaid funding likely reflect the public’s personal experiences with the program with nearly six in 10 (56%) reporting some connection with the Medicaid program, either because they personally have received some assistance from Medicaid (26%) or they have close friends or family who have (31%).

Nearly six in 10 overall (56%) say Medicaid is important to them and their family, though this varies by party identification.  Democrats (62%) and independents (57%) are more likely to consider Medicaid important than are Republicans (43%).

Who does the public trust for information about the nation’s health care system?

With President Trump and top White House officials regularly criticizing the accuracy of news from major news organizations, this month’s poll also looks at which sources of information Americans trust most about changes to the nation’s health care system.

The survey finds Americans are more likely to say they trust their Congressional representatives (55%) their friends and family (51%), and local (53%) and national news organizations (51%) than President Trump (42%) or social networking sites such as Facebook and Twitter (16%).

While fewer than half of Americans say they trust information about proposed changes to the U.S. health care system from President Trump “a lot” or “some,” one-fourth of Americans do say they trust information from the President “a lot” (23 percent) which may be an indication of the current divisive political environment.

Designed and analyzed by public opinion researchers at the Kaiser Family Foundation, the poll was conducted from February 13-19 among a nationally representative random digit dial telephone sample of 1,160 adults. Interviews were conducted in English and Spanish by landline (389) and cell phone (771). The margin of sampling error is plus or minus 3 percentage points for the full sample. For results based on subgroups, the margin of sampling error may be higher.

News Release

How Does Medicaid Work and What’s at Stake Under a Block Grant or Per Capita Cap?: A Video Slideshow

Published: Feb 23, 2017

A new video slideshow from the Kaiser Family Foundation explains how Medicaid works now and what is at stake as policymakers in Washington consider converting program financing to a block grant or per capita cap.

The 3-minute video describes how Medicaid is financed under current law, whom it covers and how spending is distributed across various groups of enrollees, including children, adults, seniors, and people with disabilities. It shows, for instance, that although seniors and people with disabilities comprise about a quarter of Medicaid enrollees, they account for nearly two-thirds of Medicaid spending because they have more complex health needs and therefore higher per person costs.

Proposals to convert Medicaid to a block grant or per capita cap financing could reduce federal Medicaid spending over time and be tied to increased flexibility for states in how they run their Medicaid programs. However, the video slideshow also explains how such proposals may shift costs to states, beneficiaries and providers, as well as limit states’ ability to respond to changes in medical costs and/or demand for Medicaid.