KFF designs, conducts and analyzes original public opinion and survey research on Americans’ attitudes, knowledge, and experiences with the health care system to help amplify the public’s voice in major national debates.
Revamping traditional Medicare’s benefit design and restricting “first-dollar” supplemental coverage could reduce federal spending, simplify cost sharing, protect against high medical costs, decrease out-of-pocket spending for many beneficiaries, and provide more help to those with low incomes — but would be unlikely to achieve all of these goals simultaneously, finds a new analysis by the Kaiser Family Foundation.
The analysis, which draws upon policy parameters put forth by the Congressional Budget Office, the Medicare Payment Advisory Commission and other organizations, examines a general approach to reforming Medicare that has been a focus of Congressional hearings and featured in several broader debt reduction and entitlement reform proposals, including the House GOP health plan released last week.
The Foundation’s new report models four different options for a modified benefit design, rather than a specific existing proposal. Each of the four options includes a single deductible, modified cost-sharing requirements, a new cost-sharing limit, and a prohibition on first-dollar Medigap coverage. The analysis projects how spending by beneficiaries, Medicare, Medicaid, and other payers would change under each option, if implemented in 2018. The results shed light on the policy tradeoffs inherent in alternative approaches to modifying deductibles and cost-sharing requirements under traditional Medicare, particularly in the context of budget discussions. Among the findings from analysis of the four options:
The impact on federal spending ranges from an estimated $5.5 billion in savings in 2018 under one option to $8.8 billion in additional spending under another option.
Beneficiaries collectively would save under all four options, but the option with the largest aggregate beneficiary savings ($3.8 billion in 2018) triggers the biggest increase in federal spending.
Under each option, some beneficiaries would be expected to pay less relative to current law in 2018, while others would pay more. The share expected to pay less ranges from 21 percent to 44 percent, while 25 percent to 35 percent would be expected to pay more, depending on policy choices, such as the level of the deductible and cost-sharing limit. The rest would see no change.
Policy options that provide additional assistance to some low-income beneficiaries are unlikely to simultaneously produce meaningful federal savings, and could generate higher federal costs depending on how many low income beneficiaries are made eligible for new cost-sharing assistance.
The analysis was conducted by researchers at the Kaiser Family Foundation and Actuarial Research Corporation and is part of ongoing work by the Foundation to examine the effects of proposed Medicare changes on the program’s beneficiaries, the federal budget and other stakeholders.
Proposals to modify the benefit design of traditional Medicare have been frequently raised in federal budget and Medicare reform discussions, including in the June 2016 House Republican health plan as part of a broader set of proposed changes to Medicare.1 Typically, benefit design proposals include a single deductible for Medicare Part A and B services, modified cost-sharing requirements, and a new annual cost-sharing limit, combined with restrictions on “first-dollar” Medigap coverage. Some proposals also include additional financial protections for low-income beneficiaries. Objectives of these proposals may include reducing federal spending, simplifying Medicare cost sharing, providing people in traditional Medicare with protection against catastrophic medical costs, providing low-income beneficiaries with additional financial protections, and reducing the need for beneficiaries to buy supplemental coverage.
This report examines the expected effects of four options to modify Medicare’s benefit design and restrict Medigap coverage, drawing on policy parameters put forth in recent years by the Congressional Budget Office (CBO), the Medicare Payment Advisory Commission (MedPAC), and other organizations. For each option, we model the expected effects on out-of-pocket spending for beneficiaries in traditional Medicare, and assess how each option is expected to affect spending by the federal government, states, employers and other payers, assuming full implementation in 2018. The model is calibrated to CBO’s traditional Medicare and Medicare Advantage 2018 enrollment projections. Details on data and methods are provided in the Appendix.
Option 1 would establish a single $650 deductible for Medicare Part A and Part B services, modify cost-sharing requirements, add an annual $6,700 cost-sharing limit to traditional Medicare, and limit the extent to which Medigap plans could cover the deductible. Option 2 aims to reduce the spending burden on beneficiaries relative to Option 1 by reducing the deductible to $400 and the cost-sharing limit to $4,000. Option 3 aims to provide additional financial protection to some low-income beneficiaries by providing them with full Medicare cost-sharing subsidies under the modified benefit design. Option 4 aims to make the modified benefit resign more progressive by income-relating the deductible and cost-sharing limit.
Key Findings
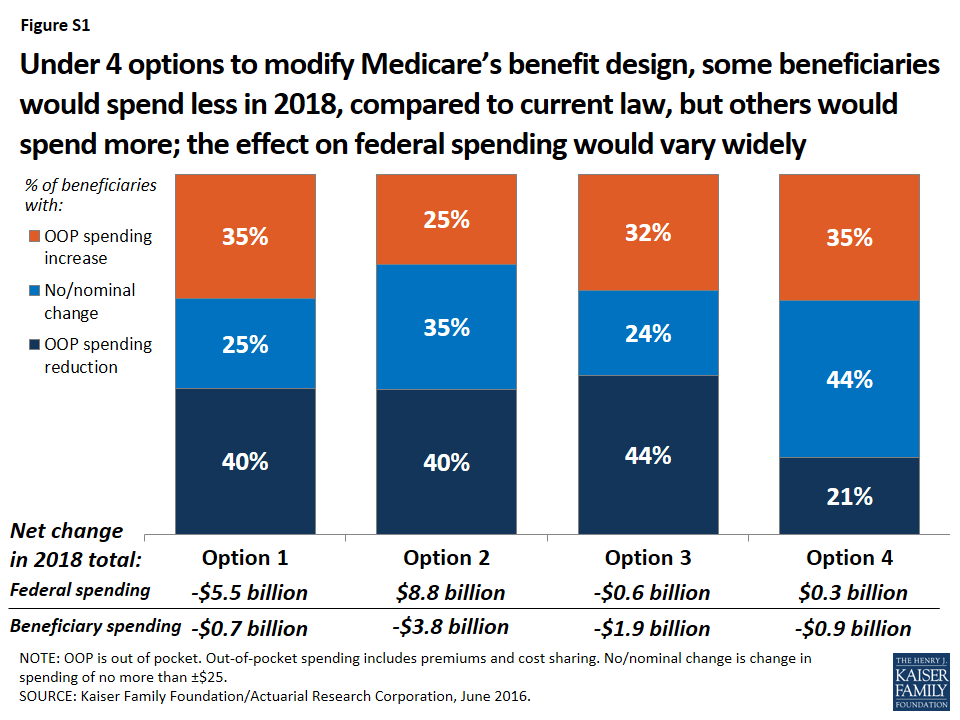
Proposals to modify the benefit design of traditional Medicare have the potential to decrease—or increase—federal spending and beneficiaries’ out-of-pocket spending, depending upon the specific features of each option (Figure S1). These options can be designed to maximize federal savings, limit the financial exposure of beneficiaries, or target relief to beneficiaries with low-incomes, but not simultaneously. Among the four options modeled, Option 1 is expected to produce the greatest federal savings (-$5.5 billion) but minimal aggregate savings for beneficiaries (-$0.7 billion), while exposing more than three million low-income beneficiaries to higher out-of-pocket costs, compared to current law. Conversely, Option 2 would provide greater financial protections and savings for beneficiaries, but result in a substantial increase in federal spending. And under each of the four options, some beneficiaries would be better off relative to current law, while others would not fare as well.
Figure S1: Under 4 options to modify Medicare’s benefit design, some beneficiaries would spend less in 2018, compared to current law, but others would spend more; the effect on federal spending would vary widely
Modifying Medicare’s benefit design, with a single $650 Part A/B deductible, a new $6,700 cost-sharing limit, varying cost-sharing amounts, and restrictions on first-dollar Medigap coverage (Option 1) would reduce net federal spending by an estimated $5.5 billion and state Medicaid spending by $2.1 billion, with a more modest reduction of $0.7 billion in beneficiary spending in 2018. Just over one-third (35%) of beneficiaries would face higher costs under the modified benefit design, including 3.4 million beneficiaries with incomes below 150% of poverty,2 while 40% of beneficiaries in traditional Medicare would see savings.
A similar approach, but with a lower deductible ($400) and cost-sharing limit ($4,000) (Option 2) would produce higher net savings for beneficiaries (-$3.8 billion) and for state Medicaid programs (-$3.8 billion) than Option 1, but would substantially increase net federal spending by an estimated $8.8 billion in 2018. A smaller share of beneficiaries would face spending increases compared to Option 1 (from 35% down to 25%).
Fully subsidizing Medicare cost sharing for a subset of low-income beneficiaries (Option 3) would provide valuable financial help to some (but not all) low-income beneficiaries, but would eliminate nearly all the federal savings associated with the modified benefit design under Option 1. Compared to Option 1, a smaller share of low-income beneficiaries with incomes below 150% poverty would face higher out-of-pocket costs (from 36% down to 23%) and a larger share would face lower costs (from 25% up to 40%). This option would result in larger aggregate savings for beneficiaries than Option 1 (-$1.9 billion), but lower net federal savings (-$0.6 billion) and similar state Medicaid savings (-$2.0 billion) in 2018. As modeled, eligibility for subsidies under this option is narrowly defined (see page 3 for details) and only modestly improves upon existing subsidy programs for some low-income beneficiaries; expanding eligibility would help more low-income beneficiaries, but would also increase federal spending.
Income-relating the deductible and cost-sharing limit (Option 4) would increase the progressivity of the modified benefit design, providing greater financial protection to beneficiaries with lower incomes and less financial protection to those with higher incomes. The lowest deductible and cost-sharing limit ($325 and $3,350, respectively) would apply to all traditional Medicare beneficiaries with incomes less than 150% of poverty, regardless of assets or supplemental coverage status, which results in a larger number of low-income beneficiaries receiving financial subsidies than under Option 3. Compared to Option 1, a smaller share of beneficiaries in traditional Medicare would see lower out-of-pocket costs in 2018 (from 40% down to 21%), even though more low-income beneficiaries would be helped. This option would reduce total beneficiary spending by an estimated $0.9 billion, while modestly increasing net federal spending by $0.3 billion in 2018 and reducing state Medicaid spending by $4.4 billion.
Conclusion
Our analysis shows that options to modify the benefit design of traditional Medicare combined with restrictions on first-dollar supplemental coverage vary widely in their impact on spending by the federal government, beneficiaries, and other payers. Aggregate changes in spending depend on the specific features of each option, including the level of the deductible and cost-sharing limit and whether additional financial protection is provided to low-income beneficiaries.
Some beneficiaries in traditional Medicare would be better off under each option than under current law, but others would not fare as well in a given year. The impact on beneficiaries’ out-of-pocket spending for premiums and cost sharing would depend on a number of factors, including beneficiaries’ use of services, whether or not they have supplemental coverage, and their incomes.
In general, adding a cost-sharing limit would provide valuable financial protection to a relatively small share of the Medicare population that incurs catastrophic expenses in any given year, although a larger share of beneficiaries would be helped by this provision over multiple years.3 Some beneficiaries could see savings due to lower premiums for Medicare and Medigap, but those without supplemental coverage may be more likely to incur higher spending because of cost-sharing increases.
Options designed to reduce the impact on out-of-pocket spending, whether for all beneficiaries in traditional Medicare or only for those with low incomes, can be expected to produce lower federal savings or could actually increase federal spending relative to current law. An income-related benefit design would be more progressive than if the same amounts applied to all beneficiaries regardless of income, and could be structured in a way to achieve aggregate savings for beneficiaries or the federal government, but at the same time, it would most certainly increase the complexity of the program for beneficiaries and program administrators.
Proposals to modify Medicare’s benefit design have the potential to produce federal savings, reduce aggregate beneficiary spending, and reduce spending by other payers, including spending by states on behalf of beneficiaries who are dually eligible for Medicare and Medicaid, and by employers who provide supplemental coverage to retirees. Such proposals could also simplify the program, provide beneficiaries with valuable protection against catastrophic expenses, add additional financial protections for low-income beneficiaries, and reduce the need for beneficiaries to purchase supplemental insurance. As this analysis demonstrates, however, it will be difficult for policymakers to achieve all of these ends simultaneously.
Report: Introduction
Proposals to modify the benefit design of traditional Medicare have been frequently raised in federal budget and Medicare reform discussions, including in the June 2016 House Republican health plan as part of a broader set of proposed changes to Medicare.4 Typically, Medicare benefit design proposals would establish a single deductible for Medicare Part A and Part B services (rather than two separate deductibles for these services, as is the case today), modify cost-sharing requirements for various Medicare-covered services, add an annual cost-sharing limit to traditional Medicare, and impose restrictions or surcharges on Medicare supplemental insurance (Medigap) policies.5 These proposals typically do not incorporate or make changes to the Medicare Part D prescription drug program.
Modifying the benefit design of traditional Medicare has generated interest among policymakers, perhaps partly because this approach to Medicare reform can achieve different objectives, including reducing federal spending, simplifying Medicare’s cost-sharing requirements, providing people in traditional Medicare with protection against catastrophic medical expenses, providing low-income beneficiaries with additional financial protections, and reducing the need for beneficiaries to obtain Medicare supplemental coverage (Medigap).
The specific objectives that could be achieved through any given Medicare benefit redesign proposal depend on the features of the design. Such features would have a substantial effect on expected outcomes, including the share of beneficiaries facing lower or higher out-of-pocket costs; the amount of Medicare savings or additional spending; and the change in spending by other payers, including Medicaid, Medigap, and employers who offer retiree health benefits. For example, setting an annual cost-sharing limit at a relatively low level would reduce costs for a larger share of beneficiaries than if the limit were set relatively high, but a lower cost-sharing limit would result in higher costs to Medicare. These features are also important in determining the extent to which a modified Medicare benefit design would provide relief from—or add to—the financial burden of health care costs for Medicare beneficiaries, half of whom lived on annual incomes below $24,150 in 2014.6
In 2011, we released an analysis of a proposal to modify Medicare’s benefit design in combination with restrictions on Medigap coverage, based on a set of parameters from the Congressional Budget Office (CBO).7 The modified benefit design included a single Part A/B deductible of $550, an annual cost-sharing limit of $5,500, uniform coinsurance of 20 percent for Medicare-covered services, and restrictions on “first-dollar” Medigap coverage, modeled as if fully implemented in 2013. The most recent House Republican proposal includes a similar set of parameters, to be implemented in 2020, although it does not specify the exact dollar amounts for the deductible or the cost-sharing limit. The results from our 2011 modeling of these parameters showed that, overall, more beneficiaries would see their out-of-pocket costs increase rather than decrease under this benefit design, although the spending effects would vary based on beneficiaries’ health status and other characteristics.
Since we conducted our previous analysis, a number of modifications to the basic benefit redesign approach described by CBO have been suggested. One alternative put forward by the Medicare Payment Advisory Commission (MedPAC) and others would charge varying service-specific copayments, rather than a uniform coinsurance rate, for most Medicare-covered services, similar to the cost-sharing structure in Medicare Advantage plans.8 For example, rather than adding a new coinsurance requirement for home health services, MedPAC included a $150 copayment per episode, which would limit the financial burden of the new cost-sharing requirement on beneficiaries who need extensive home health care. Other benefit design modifications have also been proposed, including varying the deductible and cost-sharing limit by income,9 exempting physician visits from the deductible,10 and providing additional financial protections to low-income beneficiaries.11 In addition, a number of options have been suggested for restricting supplemental coverage, including a premium surcharge on Medigap policies and employer retiree plans.12
This report updates our earlier work with an analysis of the effects on beneficiaries and payers of four options to modify the benefit design of traditional Medicare and restrict Medigap coverage, assuming full implementation in 2018 (Table 1).
Table 1: Features of Medicare’s Benefit Design Under Current Law and Four Benefit Design Options,Modeled as if Fully Implemented in 2018
Part A/B deductible(options exclude physician office visits from deductible)
Separate deductiblesPart A: $1,360 in 20181Part B: $170 in 20181
$650
$400
Same asOption 1
Income-related deductibles (% of poverty):Up to 150%: $325150-800%: $650800-900%: $750900-1000%: $8501,000%+: $950
Part A/Bcost-sharing limit (does not apply to Part D)
N/A in traditional Medicare ($6,700 maximum in Medicare Advantage in 2016)
$6,700
$4,000
Same asOption 1
Income-relatedcost-sharing limits(% of poverty):Up to 150%: $3,350150-800%: $6,700800-900%: $7,500900-1000%: $8,5001,000%+: $9,500
Medigap coverage restrictions
N/A2
Medigap covers 50% of the Part A/B deductible
Same asOption 1
Same asOption 1
Same asOption 1
Low-income provisions
Medicaid helps pay Medicare premiums and/or cost sharing for some low-income beneficiaries
Same ascurrent law
Same ascurrent law
Medicare covers 100% of cost sharing (deductible, cost-sharing limit, and copayments) for SLMB, QI, and Part D LIS beneficiaries3
For beneficiaries up to 150% of poverty:Part A/B deductible: $325Part A/B cost-sharing limit: $3,350
Cost-sharing amounts4
Part A: daily copayments for long-term hospital and SNF stays–Part B: 20% coinsurance for most services
Hospital: $750/stayOutpatient: $130/visitPrimary care visit: $25Specialist visit: $50Part B drugs: 20%Imaging: $130/studySNF: $95/dayDME: 20%Hospice: 0%Home health: $140/episode5
Same asOption 1
No cost sharing for SLMB, QI, and Part D LIS beneficiaries3Same asOption 1 for all other beneficiaries
Same asOption 1
NOTE: N/A is not applicable. SNF is skilled nursing facility. DME is durable medical equipment. 12018 projections from the 2016 Medicare Trustees report. 2Under current law, beginning in 2020, the sale of Medigap policies that cover the Part B deductible for newly-eligible Medicare beneficiaries will be prohibited. 3Applies to beneficiaries who are Specified Low-Income Medicare Beneficiaries (SLMB), Qualified Individuals (QI), or enrolled in the Part D Low-Income Subsidy (LIS) program who are not already receiving assistance with Medicare cost-sharing requirements from Medicaid or Medicare Savings Programs. 4No cost sharing for preventive services or wellness visit, as under current law. 5Modeled as 5 percent coinsurance.SOURCE: Kaiser Family Foundation, June 2016.
The main features of Option 1, the basic benefit redesign option,13 are:
A single $650 deductible for services covered under Medicare Parts A and B. The cost of physician visits would not be subject to the deductible, which aims to mitigate the effects of a de facto increase in the deductible for beneficiaries who primarily use Part B services only (that is, people who have no hospitalizations in any given year).14
A $6,700 annual cost-sharing limit on services covered under Medicare Parts A and B (excluding costs under the Part D drug benefit). This feature aims to provide financial protection to beneficiaries in traditional Medicare who have very high medical costs, with the cost-sharing limit set to match the limit required in all Medicare Advantage plans.
Various cost-sharing amounts for Medicare-covered services, including a new cost-sharing requirement for home health services.15
Prohibiting Medigap policies from covering 50 percent of the Part A/B deductible, but no other restrictions on Medigap coverage. This approach is similar to the Medigap provision included in the Medicare Access and CHIP Reauthorization Act of 2015 (MACRA), which applies exclusively to new Medicare beneficiaries.16
We also evaluated three modifications to the basic benefit redesign option described above:
Option 2, the lower deductible and cost-sharing limit option: Similar to Option 1, but lowers the deductible to $400 and the cost-sharing limit to $4,000 for all traditional Medicare beneficiaries. The aim of Option 2 is to reduce the share of beneficiaries who face spending increases, relative to Option 1, by lowering the deductible, and to increase the share of beneficiaries with a spending reduction by lowering the annual cost-sharing limit.
Option 3, the low-income subsidies option: Similar to Option 1, but adds full Medicare cost-sharing subsidies (paid by Medicare) for beneficiaries in traditional Medicare who are enrolled in the Specified Low-Income Medicare Beneficiary (SLMB), Qualified Individual (QI), or Part D Low-Income Subsidy (LIS) program and do not receive assistance with Part A and Part B cost-sharing requirements from Medicaid or the Medicare Savings Programs. The vast majority of these beneficiaries have incomes below 150 percent of the federal poverty guidelines17 and limited assets.18 The aim of Option 3 is to reduce the spending burden associated with the modified benefit design under Option 1 for some low-income beneficiaries. We estimate that 2.3 million traditional Medicare beneficiaries would receive these additional subsidies in 2018. However, Option 3, as modeled, does not subsidize all low-income Medicare beneficiaries and assumes no woodwork effect. For example, it excludes beneficiaries who are eligible for but not enrolled in SLMB, QI, or LIS, and those with incomes below 150 percent of poverty but assets above program eligibility levels.
Option 4, the income-related option: Similar to Option 1, but modifies the deductible and cost-sharing limit based on income, with a lower deductible and cost-sharing limit for those with incomes less than 150 percent of poverty ($325/$3,350), ranging up to $950/$9,500 for those with incomes greater than 1,000 percent of poverty. As modeled, the lowest deductible and cost-sharing limit apply to all traditional Medicare beneficiaries with incomes less than 150 percent of poverty, regardless of assets or supplemental coverage status, and therefore covers a larger number of low-income beneficiaries than the subsidies provided under Option 3. The aim of Option 4 is to increase the progressivity of the modified benefit design, compared to the deductible and cost-sharing limit that do not vary by income under Option 1.
The discussion below first examines the overall effects of Option 1, the basic benefit redesign option, compared to current law, assuming full implementation in 2018. This discussion highlights the expected effects on beneficiaries in traditional Medicare in terms of aggregate out-of-pocket spending on cost sharing and premiums, the share with higher or lower out-of-pocket costs, and expected changes in average per capita out-of-pocket spending, as well as the expected effects on payers (the federal government, including Medicare; state Medicaid programs; employers; and other payers). We then describe how these effects would change based on the benefit design modifications in Options 2-4.
Report: Overview Of Methods
Our analysis relies on a model developed by the Actuarial Research Corporation (ARC) to assess the spending effects of options to modify Medicare’s benefit design and restrict supplemental coverage, assuming full implementation in 2018. The model is primarily based on individual-level data from the Medical Expenditure Panel Survey (MEPS), which are calibrated to match aggregate Congressional Budget Office (CBO) Medicare spending and enrollment estimates and projections. To evaluate the effect of providing additional financial assistance to low-income beneficiaries, the model incorporates estimates and projections of the number of beneficiaries enrolled in Medicaid, Medicare Savings Programs, and the Part D Low Income Subsidy (LIS) program from the Medicare Chronic Conditions Data Warehouse and of the income distribution of beneficiaries from the DYNASIM model developed by The Urban Institute.
We first developed a current-law baseline for 2018 by identifying Medicare reimbursements for each individual in traditional Medicare (excluding beneficiaries enrolled in Medicare Advantage plans), inferring the individual’s cost-sharing obligations under current law, and dividing those obligations between the individual and their supplemental insurer as appropriate. We calculated Medicare and supplemental plan premiums and added these amounts to beneficiaries’ out-of-pocket costs. Next, we simulated the effects of benefit design changes by modifying cost-sharing obligations according to the benefit design features and by changing Medigap coverage and costs. We assumed that beneficiaries would use less (or more) care as cost sharing increases (or decreases) for specific services and that some beneficiaries would switch into or out of traditional Medicare, Medigap, or Medicare Advantage in response to the benefit design changes.
Although MEPS includes Medicare beneficiaries who are enrolled in Medicare Advantage, we excluded this group when evaluating the individual-level spending effects of the benefit design options because the options modify traditional Medicare. The model does incorporate indirect effects on aggregate Medicare Advantage spending and enrollment, based on the assumptions that changes in traditional Medicare reimbursement would be reflected in Medicare Advantage payments, and that aggregate Medicare Advantage payments will change to the extent that some beneficiaries switch between traditional Medicare and Medicare Advantage.
Modeling of this type involves some degree of uncertainty and invariably requires a number of assumptions. A discussion of limitations and assumptions following the discussion of findings. Details on data and methods are provided in the Appendix.
Report: Findings
What are the expected effects on beneficiaries of a modified medicare benefit design combined with restrictions on medigap coverage?
Compared to current law, the modified Medicare benefit design and restrictions on Medigap first-dollar coverage under Option 1 would result in net savings of $0.7 billion in 2018 for beneficiaries in traditional Medicare, in the aggregate. This amount includes an estimated $4.3 billion increase in cost sharing for Medicare-covered services that occurs even with the addition of an annual cost-sharing limit, in part due to the higher deductible for Part B services compared to current law. The aggregate increase in cost sharing is offset by an estimated $5.0 billion reduction in premiums for Medicare Part B and Medigap (Table 2).
Table 2: Change in Expected Annual Total Health Care Spending for Various Payers Under Four Medicare Benefit Design Options if Fully Implemented in 2018
Light blue shading indicates largest spending reduction of the 4 options
Tan shading indicates largest spending increase of the 4 options
Total health care spending
Net change
-$8.8
-$1.5
-$5.9
-$6.1
Spending1
$4.8
$15.1
$4.9
$9.4
Savings2
-$13.5
-$16.6
-$10.8
-$15.4
Federal spending
Net change
-$5.5
$8.8
-$0.6
$0.3
Medicare
-$3.0
$14.1
$1.8
$5.9
Medicaid (federal)
-$2.8
-$5.0
-$2.7
-$5.9
TRICARE
$0.3
-$0.3
$0.3
$0.2
Beneficiary spending
Net change
-$0.7
-$3.8
-$1.9
-$0.9
Cost sharing
$4.3
$1.1
$2.8
$3.2
Premiums
-$5.0
-$4.8
-$4.7
-$4.1
Other payer spending
Net change
-$2.6
-$6.5
-$3.4
-$5.4
State Medicaid
-$2.1
-$3.8
-$2.0
-$4.4
Employers
$0.2
-$1.3
-$0.4
$0.04
Other supplemental insurers3
-$0.6
-$1.4
-$1.0
-$1.0
NOTE: 1Spending amounts are the sum of increases in federal, beneficiary, and other payer categories. 2Savings amounts are the sum of decreases in federal, beneficiary, and other payer categories. 3Other supplemental insurers includes Veterans’ Administration; Indian Health Service; Workers Compensation; other federal, state, and local sources; and other unclassified/unknown sources.SOURCE: Kaiser Family Foundation/Actuarial Research Corporation, June 2016.
On a per capita basis, Part B premiums are expected to decrease under the basic benefit redesign option by $50 in 2018 (Table 3). This change corresponds to a projected reduction in Part B spending, which mainly reflects an increase in the deductible for beneficiaries who use only Part B services and an increase in cost sharing for certain services. Changes in Part B spending affect beneficiary Part B premiums because the standard Part B premium is set to cover 25 percent of program costs.19
Table 3: Change in Expected Annual Per Capita Premiums by Traditional Medicare Beneficiaries Under Four Medicare Benefit Design Options if Fully Implemented in 2018
NOTE: Estimates are rounded to the nearest $10.SOURCE: Kaiser Family Foundation/Actuarial Research Corporation, June 2016.
Medigap premiums are also expected to decrease under the basic benefit redesign option by $200 per person in 2018. This is primarily because both the new cost-sharing limit in traditional Medicare and the prohibition on first-dollar Medigap coverage would reduce the amount of claims to be paid by Medigap (Table 3). Under this option, Medigap policyholders would be responsible for half ($325) of the Part A/B deductible, however, which would more than offset the amount of the premium reduction for those who incur even modest medical expenses and which could also lead to reductions in utilization by policyholders.
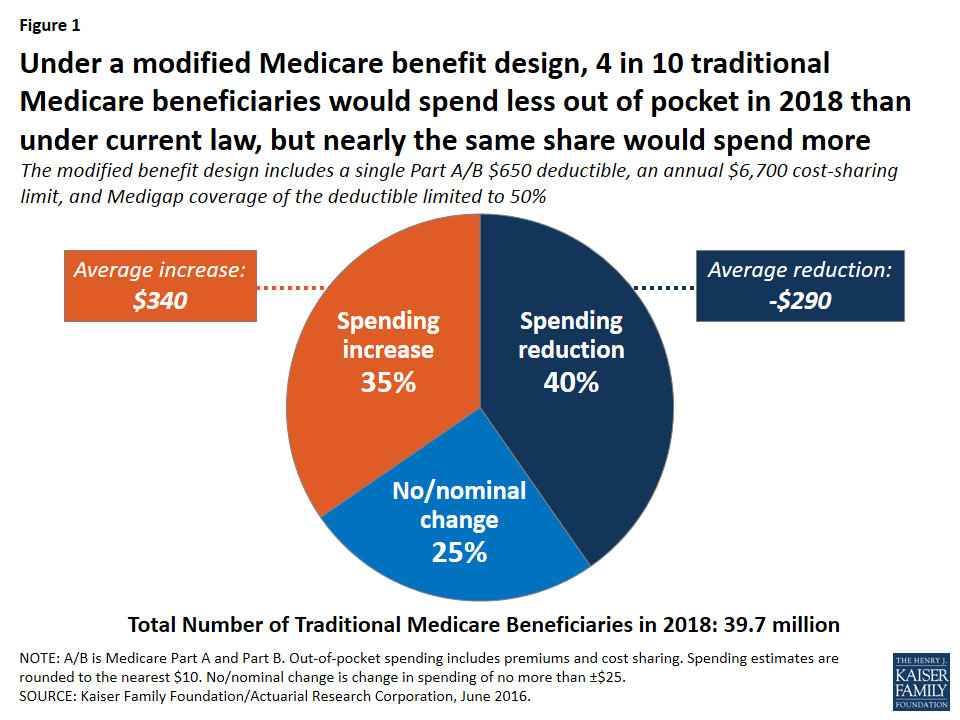
Although beneficiaries in traditional Medicare overall would see aggregate savings under the basic benefit redesign option, the spending effects at the individual level would vary, with some people expected to face higher costs and others expected to see lower costs compared to current law (Figure 1):
Figure 1: Under a modified Medicare benefit design, 4 in 10 traditional Medicare beneficiaries would spend less out of pocket in 2018 than under current law, but nearly the same share would spend more
Overall, 40 percent of beneficiaries in traditional Medicare (16.0 million) are expected to see a reduction in out-of-pocket spending (including both premiums and cost sharing), averaging -$290 per person.
Another 35 percent (13.7 million) would experience a spending increase, averaging $340 per person; this group includes 3.4 million beneficiaries with incomes below 150 percent of poverty, as discussed below.
The remaining 25 percent (10.0 million) would experience no or only a nominal change in spending.
Some beneficiaries are expected to face higher out-of-pocket costs under the basic benefit redesign option as a result of the higher single A/B deductible relative to the deductible for Part B services under current law. At the same time, the new annual $6,700 cost-sharing limit in traditional Medicare would benefit 5 percent of traditional Medicare beneficiaries who are expected to exceed this limit in 2018. (Even more (11 percent) would benefit from a lower $4,000 limit, as under Option 2, discussed below.) Because of supplemental coverage, however, not all beneficiaries with high levels of cost sharing would directly benefit from the cost-sharing limit. For example, beneficiaries who are also enrolled in Medicaid and most Medigap policyholders already receive coverage for Medicare’s cost-sharing requirements.
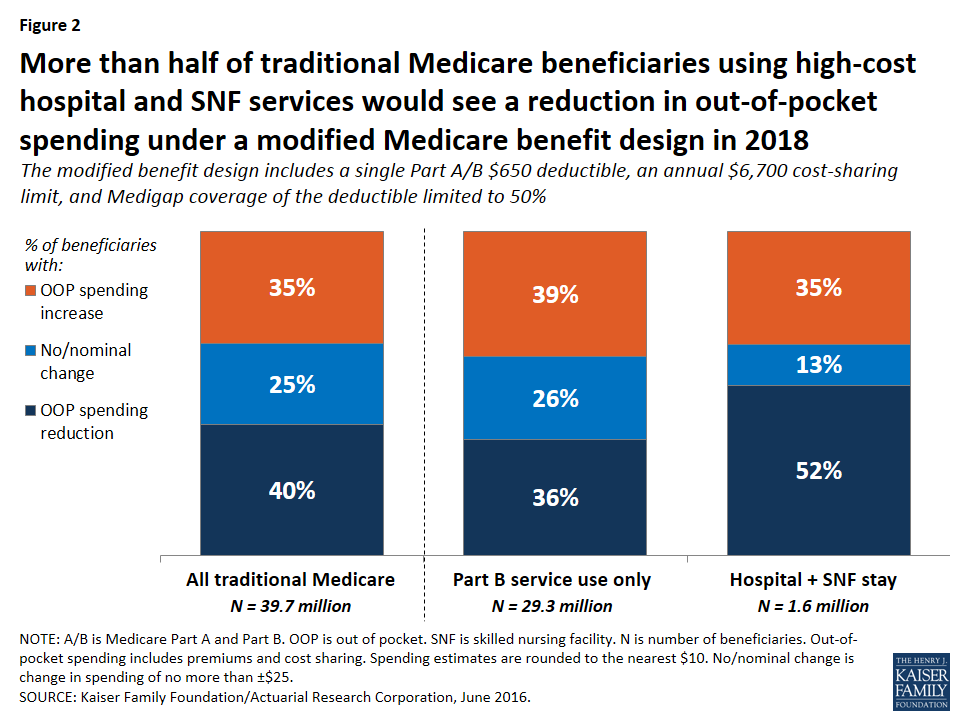
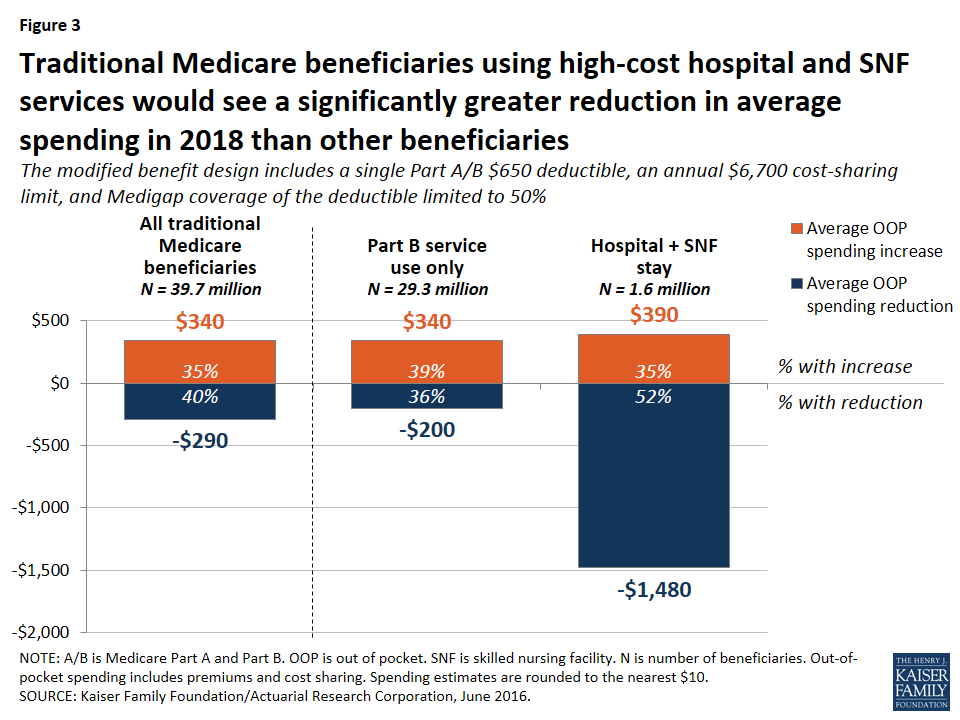
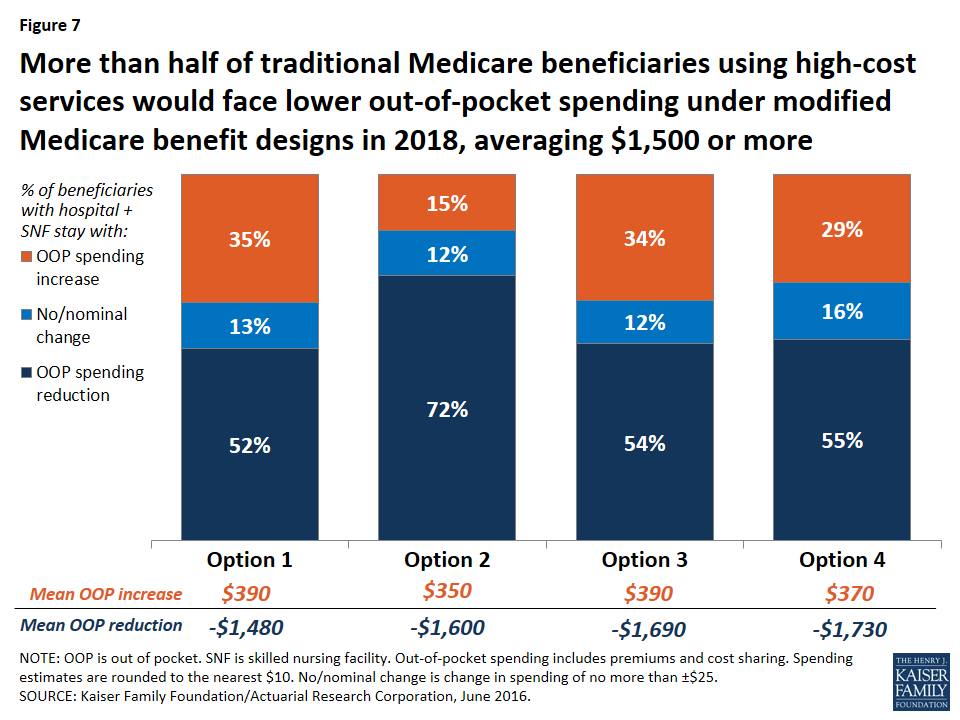
Expected out-of-pocket spending effects by service use. Out-of-pocket spending changes would also vary depending upon a beneficiary’s use of services, with people using high-cost services benefitting more under the basic benefit redesign option, in general, than those using lower-cost services. Although beneficiaries who use costly services represent only a small share of the total traditional Medicare population, a larger share of these beneficiaries are expected to see a reduction in out-of-pocket spending than beneficiaries overall, and their average out-of-pocket cost savings are expected to be far greater. For example, just over half (52 percent) of beneficiaries who have an inpatient stay followed by a skilled nursing facility (SNF) stay would see a reduction in out-of-pocket spending under Option 1, versus 40 percent of all beneficiaries (Figure 2). More notably, average out-of-pocket cost savings among this group are estimated to be substantially greater than the overall average (-$1,480 per person versus -$290 overall) (Figure 3).
Figure 2: More than half of traditional Medicare beneficiaries using high-cost hospital and SNF services would see a reduction in out-of-pocket spending under a modified Medicare benefit design in 2018Figure 3: Traditional Medicare beneficiaries using high-cost hospital and SNF services would see a significantly greater reduction in average spending in 2018 than other beneficiaries
In contrast, among beneficiaries who use only Part B services (that is, those without a hospitalization, SNF stay, or other Part A service use)—a group that accounts for a majority of traditional Medicare beneficiaries—nearly four in 10 (39 percent) would pay more under the basic benefit redesign option compared to current law, a somewhat larger share than among beneficiaries overall (35 percent). These beneficiaries would face an average out-of-pocket spending increase that is the same as traditional beneficiaries overall ($340).
Expected out-of-pocket spending effects by income. The “near poor” (that is, beneficiaries with incomes between 100-150 percent of poverty) are not expected to fare as well under the basic benefit redesign option as those with lower or higher incomes, in terms of the share facing lower spending and average expected changes in spending. Among near-poor beneficiaries, 25 percent are expected to see lower out-of-pocket costs and 36 percent would face higher costs compared to current law (Figure 4). Altogether, 3.4 million traditional Medicare beneficiaries with incomes less than 150 percent of poverty would face higher out-of-pocket spending under the basic benefit redesign option compared to current law. This includes 1.8 million near-poor beneficiaries (36 percent, similar to the share of higher income beneficiaries facing a spending increase) and 1.6 million of those with incomes less than 100 percent of poverty (22 percent, a smaller share because many of the lowest-income beneficiaries receive assistance from Medicaid with Medicare cost-sharing requirements under current law).
Figure 4: A smaller share of lower-income traditional Medicare beneficiaries would see a reduction in out-of-pocket spending in 2018 under a modified Medicare benefit design than those with higher incomes
Among beneficiaries expected to see an increase in out-of-pocket spending, the average increase is expected to be larger among the near-poor group ($430) than among those with higher incomes ($330) or lower incomes ($350). The increase would be largest for near-poor beneficiaries because this group is less likely than higher-income beneficiaries to have supplemental coverage (such as employer or Medigap coverage) which would help enrollees with any increases in Medicare cost-sharing requirements.20 Moreover, beneficiaries with incomes above the federal poverty guidelines do not qualify for financial assistance from Medicaid to help pay Medicare Part A and Part B cost-sharing requirements, as many of those with the lowest incomes do under current law. As a result, the “near poor” would be disproportionately affected by increases in cost-sharing requirements under the basic benefit redesign option.
The share of beneficiaries expected to see a reduction in spending under the basic benefit redesign option increases with income. A smaller share of poor and near-poor beneficiaries would see a reduction in out-of-pocket spending in 2018 under the basic benefit redesign option than those with higher incomes (more than 150 percent of poverty) (19 percent, 25 percent, and 49 percent, respectively). While a smaller share of lower-income beneficiaries would see out-of-pocket cost savings, their average savings would be larger than savings among those with higher incomes (-$710, -$500, and -$220, respectively).
How would the basic benefit redesign option affect aggregate spending by Medicare, Medicaid, and other payers?
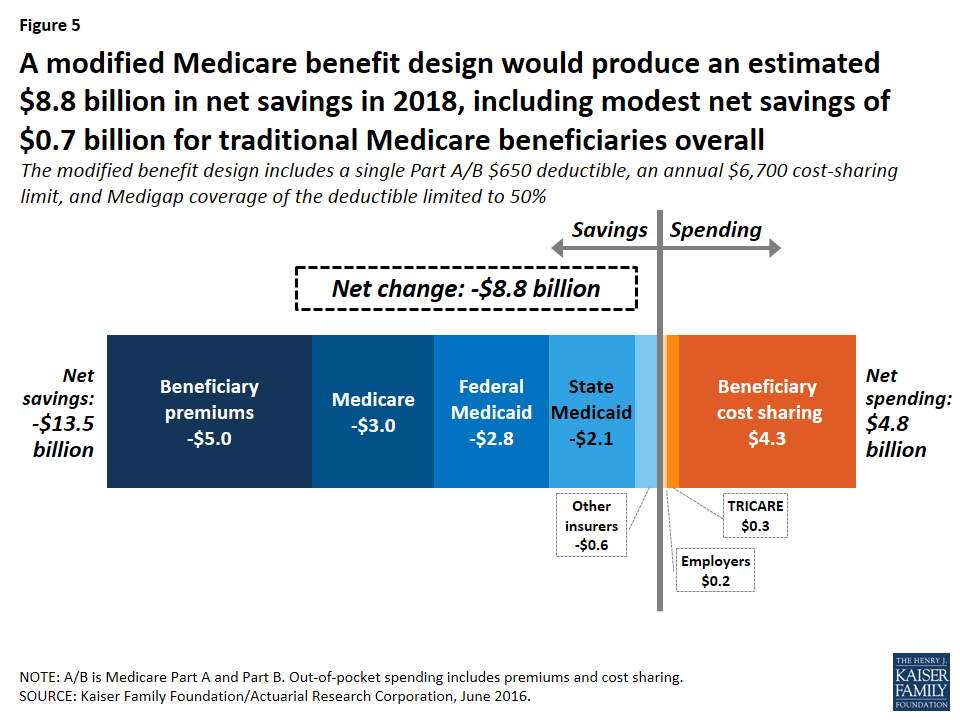
Overall, the basic benefit redesign option is expected to result in net total health care savings of $8.8 billion in 2018, including an estimated $5.5 billion in net federal savings, $2.6 billion in net savings to other payers, and $0.7 billion in net beneficiary savings (Figure 5; Table 2).
Figure 5: A modified Medicare benefit design would produce an estimated $8.8 billion in net savings in 2018, including modest net savings of $0.7 billion for traditional Medicare beneficiaries overall
Net federal savings (-$5.5 billion) includes estimated savings for Medicare (-$3.0 billion) and Medicaid (-$2.8 billion), offset somewhat by modestly higher TRICARE spending ($0.3 billion).
Other payers are projected to see a net spending reduction of $2.6 billion, with a $2.1 billion reduction in state Medicaid spending and a $0.6 billion reduction in spending by other supplemental insurers, offset somewhat by a $0.2 billion increase in employer spending.
Medicare spending. Medicare is expected to achieve estimated net savings of $3.0 billion under the basic benefit redesign option compared to current law, even with an increase in Medicare spending for some higher-cost services due to the new cost-sharing limit, including for inpatient and SNF services (Table 4).
Table 4: Change in Expected Annual Medicare Benefit Payments Under Four Medicare Benefit Design Options if Fully Implemented in 2018
Spending effects, by type of service (in billions)
NOTE: Estimates do not sum to net change in Medicare spending for each option, as shown in Table 2, because they exclude aggregate spending changes for Medicare Advantage and Part B premiums.SOURCE: Kaiser Family Foundation/Actuarial Research Corporation, June 2016.
The net reduction in Medicare spending under the basic benefit redesign option is due to several factors.
First, the single deductible for services covered under Parts A and B would mean a higher deductible than under current law for the majority of traditional Medicare beneficiaries who do not use Part A inpatient services; this change would shift costs from Medicare to beneficiaries.
Second, the higher deductible (relative to the current-law Part B deductible) is expected to reduce beneficiaries’ utilization of Part B physician and other outpatient services and would thereby reduce Medicare spending for these services.
Third, the new copayment on home health services under the basic benefit redesign option is expected to reduce utilization and spending for these services.
Fourth, the restriction on Medigap coverage of the deductible would expose Medigap policyholders to a portion of their upfront costs for Medicare-covered services, which would in turn reduce their use of services and Medicare spending for beneficiaries with Medigap.
Federal and state Medicaid spending. Net Medicaid spending is expected to be lower under the basic benefit redesign option, with an estimated $2.8 billion reduction in federal Medicaid spending and a $2.1 billion reduction in state Medicaid spending in 2018. This reduction is mainly due to the new cost-sharing limit under Medicare, which would shift costs from Medicaid to Medicare for high-cost beneficiaries who are dually eligible for both programs. Lower Part B premiums would also reduce Medicaid costs for beneficiaries who are dually eligible for Medicare and Medicaid, because Medicaid currently pays Part B premiums for this group (along with Medicare cost-sharing requirements for many, but not all, dually eligible beneficiaries).
Employer spending. Costs to employers would increase by an estimated $0.2 billion in 2018 under Option 1. This would occur because employers would cover a portion of the new cost-sharing requirements, such as the higher Medicare deductible for beneficiaries without a hospitalization, on behalf of those with retiree coverage.
How would alternative benefit design options affect spending by beneficiaries and by medicare, medicaid, and other payers?
We evaluated the effects of three alternatives to the modified benefit design and Medigap coverage restrictions in Option 1:
Option 2, the lower deductible and cost-sharing limit option, is similar to the basic benefit redesign option, but with a lower deductible and cost-sharing limit to reduce the share of beneficiaries facing spending increases and to increase the share of beneficiaries with a spending reduction, relative to Option 1.
Option 3, the low-income subsidies option, has the same features as the basic benefit redesign option, and also provides full Medicare cost-sharing subsidies to a subset of low-income beneficiaries to reduce the spending burden associated with the modified benefit design for these beneficiaries.
Option 4, the income-related option, is similar to the basic benefit redesign option, but modifies the deductible and cost-sharing limit based on income, with lower amounts for people with lower incomes and higher amounts for those with higher incomes, to increase the progressivity of the modified benefit design.
The following discussion compares how the effects on beneficiaries and spending by payer under Option 1, are expected to change under the alternative options described above, assuming full implementation in 2018.
Option 2: Lowering the deductible and cost-sharing limit for services covered under Medicare parts a and b
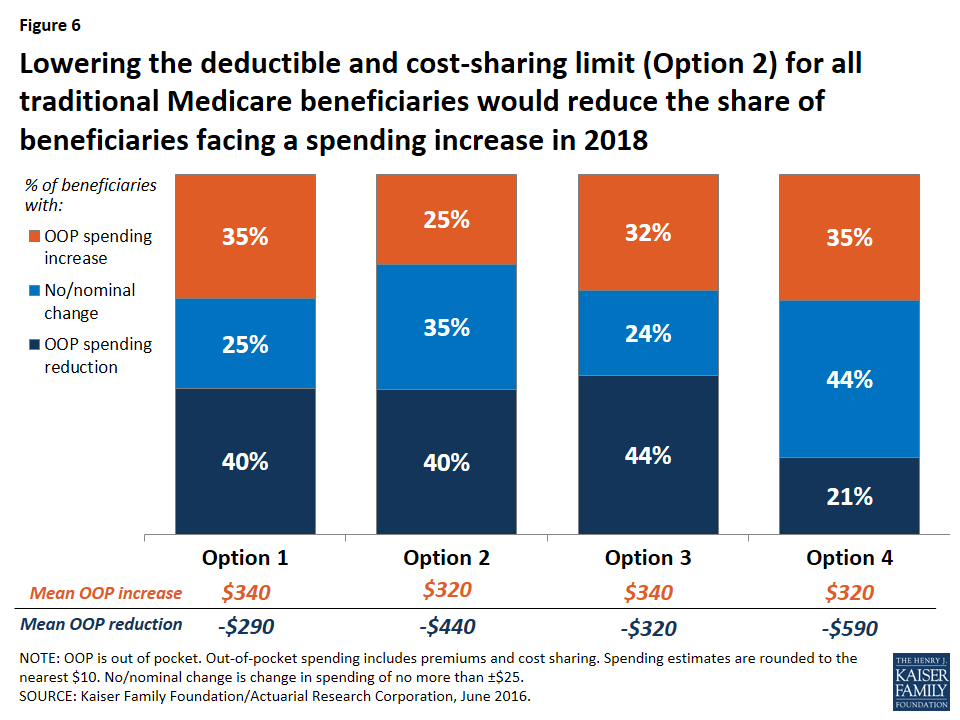
Expected effects on out-of-pocket spending. Compared to the basic benefit redesign option, lowering the deductible and cost-sharing limit to $400 and $4,000, respectively, for all traditional Medicare beneficiaries (Option 2) would reduce the share of beneficiaries facing a spending increase (from 35 percent to 25 percent) and increase average savings among those facing a spending reduction (from -$290 to -$440) (Figure 6).
Figure 6: Lowering the deductible and cost-sharing limit (Option 2) for all traditional Medicare beneficiaries would reduce the share of beneficiaries facing a spending increase in 2018
Modifying the basic benefit redesign by lowering the deductible and cost-sharing limit would be particularly likely to benefit sicker beneficiaries, who would be more likely to reach the cost-sharing limit than other beneficiaries. For example, among those with both a hospital and SNF stay, the lower deductible and cost-sharing limit option would reduce the share who are expected to face an increase in their out-of-pocket costs by twenty percentage points (from 35 percent to 15 percent) and increase the share who are expected to see a reduction in their out-of-pocket costs by the same amount (from 52 percent to 72 percent), relative to the basic benefit redesign option (Figure 7).
Figure 7: More than half of traditional Medicare beneficiaries using high-cost services would face lower out-of-pocket spending under modified Medicare benefit designs in 2018, averaging $1,500 or more
Expected effects on aggregate beneficiary spending. In terms of the aggregate effects on beneficiaries, savings are largest under Option 2 (-$3.8 billion), with its lower deductible and cost-sharing limit, compared to all other options. Net savings to beneficiaries under Option 2 is comprised of a $1.1 billion increase in spending on cost sharing offset by a $4.8 billion reduction in premium spending. On the one hand, the Part B premium would increase under the lower deductible and cost-sharing limit option, versus a decrease under the basic benefit redesign option (see Table 3 above). This is because with a lower deductible under Option 2, beneficiaries are expected to use more services than they would under the basic benefit redesign option, and Medicare would pay for a higher proportion of it, which would lead to higher Part B spending and, therefore, higher Part B premiums. In contrast, Medigap and employer premiums would be lower under Option 2 than under the basic benefit redesign option. This is because the lower deductible and cost-sharing limit would reduce the liability of supplemental insurers, which would be expected to result in lower premiums. These decreases would offset the more modest increase in Part B premiums, resulting in an aggregate reduction in premium spending by beneficiaries under the lower deductible and cost-sharing limit option.
Expected effects on aggregate spending by other payers. Lowering the deductible and cost-sharing limit would produce the largest aggregate savings to beneficiaries of the four options considered in this report, but it would also more than offset any federal savings from the basic benefit redesign option, resulting in an increase in federal spending of $8.8 billion (Figure 8). Net total health care savings would also be lower under the lower deductible and cost-sharing limit option (Option 2) than under the basic benefit redesign option (Option 1) (-$1.5 billion instead of -$8.8 billion), largely as a result of an expected increase in service use by beneficiaries and higher Medicare spending above the annual cost-sharing limit (see Table 2 above).
Figure 8: Compared to current law, net federal spending increases the most and net beneficiary spending decreases the most in 2018 when the deductible and cost-sharing limit are reduced (Option 2)
Option 3: Fully-subsidized Medicare cost sharing for certain low-income beneficiaries
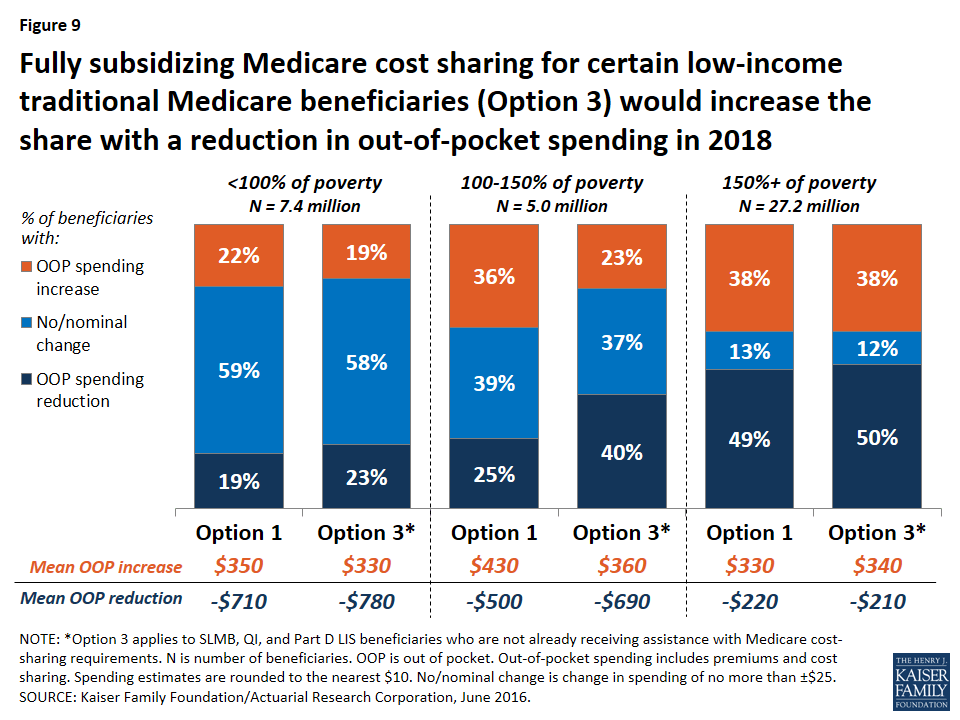
Expected effects on out-of-pocket spending. Relative to the basic benefit redesign option, the low-income subsidies option (Option 3) compares favorably for lower-income beneficiaries in traditional Medicare, especially those with incomes between 100-150 percent of poverty. For this group of near-poor beneficiaries, providing a full subsidy for Medicare’s cost-sharing requirements would decrease the share expected to face a spending increase by 13 percentage points (from 36 percent under the basic benefit redesign option to 23 percent under the low-income subsidies option) and increase the share expected to face a reduction in spending by 15 percentage points (from 25 percent under the basic benefit redesign option to 40 percent under the low-income subsidies option) (Figure 9). The average out-of-pocket spending increase for beneficiaries in this group (among those facing an increase) would also be lower under the low-income subsidies option than under the basic benefit redesign option ($360 versus $430), and the average out-of-pocket spending reduction (among those facing a reduction) would be higher (-$690 versus -$500).
Figure 9: Fully subsidizing Medicare cost sharing for certain low-income traditional Medicare beneficiaries (Option 3) would increase the share with a reduction in out-of-pocket spending in 2018
Although “near poor” beneficiaries are the intended target group for the low-income subsidies option—specifically, beneficiaries enrolled in SLMB, QI, and Part D LIS, the vast majority of whom have incomes below 150 percent of poverty and limited assets—the analysis still shows that some low-income beneficiaries are expected to see higher costs under Option 3. This is because, as modeled, the option does not provide cost-sharing subsidies to all beneficiaries with incomes below 150 percent of poverty, such as those who are eligible for but not receiving SLMB, QI, or LIS, and those who are eligible for these programs based on their incomes but whose assets are too high to qualify. The model also assumes no woodwork effect and does not account for a potential increase in enrollment in SLMB, QI, or LIS from beneficiaries who are eligible but not currently enrolled. Providing full Medicare cost-sharing subsidies to more low-income beneficiaries would reduce the share of beneficiaries facing higher costs under this option, though it would also increase federal spending relative to the effects we observed (see the discussion of spending effects below).
Option 3, the low-income subsidies option, would lead to more modest improvements for those below 100 percent of poverty, because many (although not all) of these beneficiaries already receive assistance with Medicare’s cost-sharing requirements through Medicaid or Medicare Savings Programs. Not surprisingly, providing additional cost-sharing assistance to low-income beneficiaries would not substantially affect out-of-pocket spending changes among beneficiaries with incomes above 150 percent of poverty, relative to the basic benefit redesign option, because eligibility for SLMB, QI, and Part D LIS generally extends only to beneficiaries with incomes up to 150 percent of poverty.
Expected effects on aggregate spending. Adding low-income protections to the modified benefit design would increase aggregate beneficiary savings (from -$0.7 billion under the basic benefit redesign option to -$1.9 billion under the low-income subsidies option) but generate lower net federal savings (-$0.6 billion under the low-income subsidies option versus -$5.5 billion under the basic benefit redesign option) (see Table 2 above). In contrast to the basic benefit redesign option, total Medicare spending would increase under the low-income subsidies option (from a -$3.0 billion reduction under Option 1 to a $1.8 billion increase under Option 3)—and it would have increased by an even larger amount had we modeled the participation of a larger group of low-income beneficiaries beyond those receiving SLMB, QI, or Part D LIS.21 However, as modeled, it would still be the case that federal Medicaid spending would decrease under Option 3, more than offsetting the increase in aggregate Medicare spending. And with lower-income beneficiaries expected to use more services due to the new cost-sharing subsidies, net health care savings would be lower under the low-income subsidies option compared to the basic benefit redesign option (-$5.9 billion versus -$8.8 billion).
Option 4: Income-related deductible and cost-sharing limit
Expected effects on out-of-pocket spending. Compared to the basic benefit redesign option, Option 4, with income-related deductibles and cost-sharing limits, would decrease the share of traditional beneficiaries overall who are expected to face a spending reduction by nearly 20 percentage points (from 40 percent under the basic benefit redesign option to 21 percent under the income-related option) and increase the share expected to face no or a nominal change in spending by the same amount (from 25 percent to 44 percent), while having no effect on the share expected to face a spending increase (see Figure 6 above).
The effects of the income-related benefit design option would vary by income group, as designed. Option 4 would help a larger number of low-income beneficiaries than Option 3, the low-income subsidies option, because, as modeled, the lowest levels of the deductible and cost-sharing limit ($325/$3,350) under Option 4 would apply to all traditional Medicare beneficiaries with incomes less than 150 percent of poverty, regardless of assets or supplemental coverage status, as opposed to just a subset of low-income beneficiaries who would receive subsidies under Option 3. But those low-income beneficiaries who receive full Medicare cost-sharing subsidies under Option 3 would not benefit as much from the income-related benefit design (Option 4), since they would still face some cost-sharing responsibility under the income-related option.
Lower-income beneficiaries would be helped somewhat more under the income-related option than under the basic benefit redesign option (Table 5). This is due to the lower deductible and cost-sharing limit they would face relative to higher-income beneficiaries under the income-related option. In particular, a somewhat smaller share of beneficiaries with incomes below 100 percent of poverty and between 100-150 percent of poverty are expected to see an increase in out-of-pocket spending under the income-related option than under the basic benefit redesign option (18 percent versus 22 percent, and 30 percent versus 36 percent, for the two income groups respectively). But for beneficiaries with incomes between 100-150 percent of poverty, an even smaller share (23 percent) would face a spending increase under the low-income subsidies option (Option 3).
A smaller share of beneficiaries with incomes below 150 percent of poverty are expected to see a spending reduction under the income-related option compared to the basic benefit redesign option (although the average spending reduction would be larger), while a larger share of low-income beneficiaries would face no or a nominal change in spending. The reason for this is that the Part B premium would not fall as much under the income-related option than under the basic benefit redesign option (-$20 versus -$50) because aggregate Part B spending would be larger under the income-related option and premiums are set to cover a portion of total Part B spending. For some low-income beneficiaries, the benefit of having the lower deductible and cost-sharing limit under the income-related option compared to the basic benefit redesign option would more than offset the higher Part B premium. For others, such as those who use relatively few services, the higher Part B premium under the income-related option would be the more relevant factor in determining their change in cost sharing relative to current law.
Table 5: Distribution of Traditional Medicare Beneficiaries by Poverty Level, by Change in Expected Annual Out-of-Pocket Spending and Average Change in Spending Under Four Medicare Benefit Design Options in 2018
Percent of beneficiaries by change in OOP spending
NOTE: OOP is out of pocket. Out-of-pocket spending includes premiums and cost sharing. Spending estimates rounded to nearest $10. 1No/nominal change is change in spending of no more than ±$25.SOURCE: Kaiser Family Foundation/Actuarial Research Corporation, June 2016.
Expected effects on aggregate spending. Although aggregate beneficiary spending would be similar under the basic benefit redesign option and the income-related option (-$0.7 billion and -$0.9 billion, respectively), introducing an income-related deductible and cost-sharing limit would erase net federal savings (from a $5.5 billion reduction under the basic benefit redesign option to an increase of $0.3 billion under the income-related option). This is the result of Medicare paying for a much greater share of spending above the new cost-sharing limit for a subset of low-income beneficiaries. While this would help some low-income beneficiaries, it would simply displace Medicaid spending for certain dually eligible beneficiaries (with the reduction in Medicaid spending being divided between the states and the federal government). Finally, because aggregate beneficiary cost sharing would be lower under the income-related option relative to the basic benefit redesign option, it is expected that beneficiaries would use more services under the income-related option. The net effect would be to lower total health care savings (from -$8.8 billion under the basic benefit redesign option to -$6.1 billion under the income-related option), as was also the case under the lower deductible and cost-sharing limit option (Option 2) and the low-income subsidies option (Option 3).
Report: Limitations And Assumptions
Limitations
An important limitation of this single-year analysis is that it does not consider or evaluate the potential long-term effects on health outcomes or the long-term spending effects of the Medicare benefit design options. Our model incorporates the assumption that as beneficiary cost sharing increases, beneficiaries would use fewer services, which could produce short-term savings to Medicare but which could also result in poor (or worse) health outcomes—thereby increasing costs to Medicare over the longer term. It is outside the scope of our analysis to determine whether beneficiaries would forgo necessary or unnecessary services, and the extent to which this would affect their health or expenses over the longer term, but previous research has suggested the existence of secondary (and unintended) effects of increasing cost sharing on both patients and insurers.22 For example, Trivedi and coauthors found that Medicare Advantage plans that nearly doubled copayments for ambulatory care experienced increases in hospitalizations, especially for enrollees with certain chronic conditions.23 Chandra and coauthors also found increases in hospitalizations after a large retiree health plan introduced copayments for physician services and increased copayments for pharmaceuticals.24 We also do not evaluate or incorporate any potential substitution effects that might offset certain reductions in utilization. For instance, beneficiaries who use fewer home health services because of new cost sharing might use more physical therapy or physician visits.
Based on the available evidence, it was not possible to model these longer-term effects with any degree of confidence. As a result, our model may overestimate the amount of savings to Medicare and underestimate the cost to beneficiaries that could result from increased cost sharing in the long run—for instance, if beneficiaries simply substitute some types of care for other services, or if their health deteriorates, requiring additional care in the future. At the same time, the single-year analysis could underestimate the share of beneficiaries with high out-of-pocket costs who could experience spending reductions associated with the new annual cost-sharing limit.25 These are important areas to explore in future research.
MEPS does not include beneficiaries in long-term care facilities, a group that tends to use a relatively large amount of services. Therefore, our model may understate the number of beneficiaries who would benefit from a cost-sharing limit. Another caveat is that many beneficiaries in long-term care facilities are dually eligible for Medicaid and Medicare. As a result, our model may understate the effects on Medicaid spending associated with the benefit redesign options. Altogether, only 5 percent of Medicare beneficiaries are in long-term care facilities, so we do not expect that including this population would have a substantial effect on our outcomes.
Assumptions
Modeling programmatic and policy reforms involves some degree of uncertainty and invariably requires a number of assumptions that may oversimplify individual decisions and responses, while averaging out variations in circumstances. We nonetheless took this approach to develop a greater understanding of the possible effects of reforming Medicare’s benefit design on beneficiaries and spending.
Full implementation in 2018. We modeled full implementation as of January 1, 2018 to assess the effects of Medicare benefit redesign options if implemented in one year, rather than phased in over time. We recognize the administrative challenges of implementing such changes by then. We also acknowledge possible legal issues associated with prohibiting first-dollar coverage for current Medigap policyholders rather than an approach that only applies to new policyholders (as in the new Medigap restrictions included in MACRA).
Changes in utilization. We assumed that an increase in cost sharing would cause beneficiaries to use fewer services (and vice-versa). To model this assumption, we used “induction factors” based on those used by the Health Care Financing Administration (HCFA, now the Centers for Medicare & Medicaid Services, or CMS), which in turn were based on the RAND Health Insurance Experiment. Specifically, for every $1 increase in cost sharing, we assumed that total spending would decline by $0.70 for physician and outpatient services, by $0.50 for home health care, and by $0.20 for inpatient hospital and SNF services.26
No changes in Medicaid eligibility. We assumed that Medicaid eligibility would not change under any of the benefit redesign options. State Medicaid programs currently pay all or a portion of Medicare’s cost-sharing requirements on behalf of beneficiaries who are enrolled in both programs. Because benefit redesign would alter beneficiaries’ cost-sharing obligations, it would subsequently affect Medicaid expenditures. For example, introducing a cost-sharing limit would shift spending from Medicaid to the Medicare program. If Medicaid programs chose to scale back coverage for optional populations in response to these changes, then our analysis would understate the spending effects of these options for low-income beneficiaries.
No erosion of employer-sponsored or other supplemental coverage. We assumed that the benefit redesign options would not affect the share of enrollees’ cost-sharing liabilities (including premiums, if applicable) covered by ESI and other supplemental coverage. We also assumed that the options would not affect employer offer rates or take-up rates by retirees. If some employers decided to drop retiree health benefits altogether, retirees would likely incur higher out-of-pocket costs and subsequently use fewer services, resulting in a decrease in Medicare spending. The magnitude of the effect on employer spending would depend on how much employers reduced coverage and how many employers did so. If employers or other supplemental payers were to make changes in coverage by shifting some, if not all, of the additional cost-sharing requirements onto beneficiaries—and therefore no longer covered the same share of beneficiary spending as under current law—we would expect savings to supplemental insurers and higher costs for beneficiaries with this coverage, relative to the effects we observe.
No effect on retirement decisions. We assumed the benefit redesign options would not affect retirement decisions in the short term. If changes in Medicare’s benefit design prompted workers to delay retirement and remain covered by employer-sponsored insurance as their primary source of coverage, out-of-pocket spending would decline for younger workers if their employer policies’ cost-sharing rules are more generous than the redesigned Medicare benefit, and Medicare spending would decline somewhat if Medicare then became the secondary payer for these workers rather than the primary payer. In this case, employer costs could increase.
Changes in Medicare Advantage and Medigap enrollment. We assumed that changing traditional Medicare’s benefit design—most importantly, with the addition of an annual cost-sharing limit—would lead to changes in Medicare Advantage and Medigap enrollment. Our switching assumptions are shown in Table 6. We used the estimates in the third column (“benefit redesign plus Medigap coverage restrictions”) for all four options in this report.
Table 6: Share of Medicare Advantage and Medigap Enrollees Switching Coverage Under Medicare Benefit Redesign Options in 2018
Benefit redesign only
Medigap coverage restrictions only
Benefit redesign plus Medigap coverage restrictions
% of Medicare Advantage enrollees switching to traditional Medicare
2.4%
No effect
2.4%
% of Medigap enrollees switching to traditional Medicare
2.4%
0.8%
3.2%
% of Medigap enrollees switching to Medicare Advantage
No effect
3.1%
3.2%
SOURCE: Kaiser Family Foundation/Actuarial Research Corporation, June 2016.
The switching assumptions are expressed as a percent of current law enrollment in that supplemental type. The pool of possible switchers consists of an estimated 36.4 million beneficiaries in 2018: 21.3 million Medicare Advantage enrollees (58 percent of the pool), 9.5 million Medigap enrollees (26 percent), and 5.7 million traditional Medicare beneficiaries with no supplemental coverage (16 percent).
The literature does not provide clear guidance on how to establish these “switching” parameters. Our estimates are based on the reasoning described below.
Enrollment switches under Medicare benefit redesign. One reason why beneficiaries might choose to purchase Medigap coverage or enroll in Medicare Advantage is that traditional Medicare currently lacks protection from catastrophic medical expenses through a cost-sharing limit. Thus, we assume that adding a cost-sharing limit to traditional Medicare would induce a small share of Medigap enrollees to disenroll (2.4 percent) and a small share Medicare Advantage enrollees to switch to traditional Medicare (2.4 percent).
Enrollment switches under Medigap coverage restrictions. Because the restrictions would only apply to Medigap, we assume that some Medigap enrollees (3.1 percent) would switch to Medicare Advantage where they would still have the option of paying a premium (as applicable) for more generous coverage. We also assume that because some beneficiaries purchase Medigap policies in order to avoid the hassle of paying medical bills directly, a small share of Medigap enrollees (0.8 percent) would drop this coverage and revert to traditional Medicare only if coverage restrictions were imposed on Medigap plans.
Enrollment switches under the combined options. For all four options in this report that combine benefit redesign plus Medigap coverage restrictions, we added the estimates for each separate option and increased the total slightly to incorporate the effects of compounding.
In general, we do not expect Medicare benefit redesign options to have a dramatic effect on switching between coverage types. Because the switching effects we modeled are small relative to overall Medicare enrollment, even moderate changes in these assumptions are not likely to affect the direction of or conclusions drawn from our main outcomes of interest. However, if a larger share of Medigap enrollees drop their Medigap policies and switched to traditional Medicare only (or to Medicare Advantage) in response to the modified benefit design, then federal savings would be of larger magnitude, while more beneficiaries would see spending reductions since the former Medigap policyholders would no longer be paying Medigap premiums. If a larger share of Medicare Advantage enrollees switched to traditional Medicare, then we would expect to see greater federal savings, to the extent that payments made to Medicare Advantage plans are slightly higher than what traditional Medicare would pay per beneficiary. It is not possible to quantify more specifically what spending effects we would observe under different switching assumptions. The magnitude of the effect on spending would depend on the specific benefit design option under consideration, since the overall effects are highly sensitive to design details, such as the deductible amount and the cost-sharing limit, for example.
Take-up of new subsidies for low-income beneficiaries. We assume that all Medicare beneficiaries who are SLMBs, QIs, and Part D LIS enrollees who are not already receiving full cost-sharing assistance from Medicaid or Medicare Savings Programs would automatically receive the new 100 percent cost-sharing subsidies. However, Option 3, as modeled, does not subsidize all low-income Medicare beneficiaries. We did not include other low-income beneficiaries who might be eligible for but are not enrolled in SLMB, QI, or LIS, and beneficiaries with incomes below 150 percent of poverty but assets above program eligibility thresholds. Including these low-income beneficiaries would increase federal spending on this option relative to the current effects estimated by the model, but would also increase the share of low-income beneficiaries who would experience spending reductions under the modified benefit design that includes low-income subsidies.
Report: Discussion
This report examines the effects on beneficiaries and spending of a proposal to modify the benefit design of traditional Medicare and place restrictions on “first-dollar” supplemental Medigap coverage that is frequently raised in the context of federal budget and Medicare reform discussions. The analysis also examines the effects of alternative approaches, including lowering or income-relating the deductible and cost-sharing limit, and providing cost-sharing subsidies to a subset of low-income beneficiaries.
Our analysis of the four options that we modeled shows that each would reduce out-of-pocket spending by some beneficiaries in traditional Medicare but increase spending by others, with variation in expected spending depending on the deductible and cost-sharing limits specified under each option and whether additional financial protections are provided to low-income beneficiaries. In our analysis, beneficiaries with lower incomes fared relatively poorly compared to higher-income beneficiaries under the basic modified benefit design, as measured by the effect on their out-of-pocket costs. Subsidizing Medicare cost sharing for a subset of low-income beneficiaries would reduce the spending burden for these beneficiaries associated with changes to Medicare’s benefit design, but the tradeoff is that federal savings would not be as large as under the modified benefit design alone.
The effects on beneficiaries’ spending would also depend on their use of services. In general, adding a cost-sharing limit would provide valuable financial protection to a relatively small share of the Medicare population that incurs catastrophic expenses in any given year, although a larger share of beneficiaries would be helped by this provision over multiple years.27 The single deductible for Parts A and B would reduce the deductible amount paid by the relatively small share of sicker beneficiaries who are hospitalized in any given year, but would increase the deductible amount for the majority of healthier beneficiaries who use physician and outpatient services, but who are not hospitalized in any given year. The expected reduction in out-of-pocket spending for relatively sicker beneficiaries would be substantial compared to current law, while the increase in spending for relatively healthier beneficiaries would be more modest.
Overall, our analysis shows that savings to the federal government can be achieved by modifying Medicare’s benefit design in part by shifting spending onto beneficiaries in the form of higher cost sharing, such as by charging a higher deductible for Part B-covered services relative to current law. Higher beneficiary cost sharing also would likely lead beneficiaries to use fewer services, which would produce federal savings. Conversely, federal savings would not be as large under more generous alternatives to the modified benefit design that offer greater financial protections to some low-income beneficiaries, and there would likely be an increase in federal spending if these protections were extended to a larger group of low-income beneficiaries than we modeled in our analysis. And federal spending can be expected to increase substantially compared to current law when the deductible is set at a relatively low level and when greater protection is extended to beneficiaries with high costs in the form of a lower cost-sharing limit.
Policy Implications
Our analysis shows the expected effects of a set of four specific Medicare benefit design options, and these options could be modified by policymakers in any number of ways, with the expected effects likely to vary depending on the specific benefit design decisions that are made. Indeed, our analysis shows that the aggregate effects on spending—overall, and for beneficiaries, Medicare, and other payers, including Medicaid and employers—depend on the specific features of the four benefit design options we modeled, such as the amount of the deductible and cost-sharing limit, whether additional financial protections are provided to low-income beneficiaries (and how many low-income beneficiaries receive subsidies), and whether the deductible and cost-sharing limit vary by income. Aggregate and individual-level savings would also vary depending on policy decisions made with regard to the treatment of supplemental coverage, and whether the restrictions imposed on the generosity of supplemental coverage are relatively tight or loose.28
Drawing on the results of our analysis, policymakers could choose to mitigate some of the less desirable effects of implementing a modified Medicare benefit design in several ways. For example, to avoid a large increase in the deductible that would otherwise be incurred by the majority of relatively healthy beneficiaries for Part B-covered services, policymakers could exempt current beneficiaries from the cost-sharing changes under the modified benefit design and phase it in over time for people who gain Medicare eligibility in the future. A phased-in approach to implementation would ease the financial impact on beneficiaries associated with shifting to the new benefit design, but would reduce shorter-term savings to Medicare and introduce a layer of complexity in administering a program with different sets of cost-sharing rules applied to different cohorts of beneficiaries in traditional Medicare.
In our analysis, beneficiaries with lower incomes fared relatively poorly compared to higher-income beneficiaries under the basic modified benefit design, as measured by the effect on their out-of-pocket costs. To mitigate the cost impact for beneficiaries with lower incomes, policymakers could consider providing additional financial assistance in the form of Medicare cost-sharing subsidies, similar to the approach used in the Part D LIS program, or charging income-related deductibles and cost-sharing limits. This latter approach provides greater financial protection to beneficiaries with lower incomes and less financial protection to those with higher incomes, but implementing income-related Medicare benefits could pose operational challenges, making Medicare potentially more complex for beneficiaries to understand and for the government to administer.29
Providing subsidies for Medicare cost sharing to low-income beneficiaries would offer valuable financial assistance to a vulnerable population. However, Option 3, as modeled, does not subsidize all low-income Medicare beneficiaries. We did not include those who might be eligible for but are not enrolled in SLMB, QI, or LIS, and beneficiaries with incomes below 150 percent of poverty but assets above program eligibility thresholds. With older research showing only a small share of eligible beneficiaries enrolled in Medicare’s existing subsidy programs,30 providing financial protections for low-income beneficiaries under a modified Medicare benefit design may be more effective if done in conjunction with an outreach campaign to identify as many eligible beneficiaries as possible. Including more low-income beneficiaries than we modeled, however, would increase federal spending on this option relative to the current effects estimated by the model. But it would offer important financial protections for many beneficiaries who might otherwise face spending increases they could not afford in the absence of cost-sharing subsidies.
Adding an annual cost-sharing limit would be a significant improvement to the traditional Medicare program, and would level the playing field between traditional Medicare and Medicare Advantage. Even so, under current proposals, the limit applies only to costs for services covered under Parts A and B, not to costs under the Part D drug benefit. Part D has a separate catastrophic coverage threshold ($4,850 in out-of-pocket costs in 2016), above which beneficiaries are required to pay 5 percent of their total drug costs. If Medicare were to maintain two separate cost-sharing limits, one for Parts A and B and another for Part D, the modified benefit design would be out of step with the catastrophic coverage protections required for Marketplace plans today, which limit annual cost sharing under individual policies to $6,850 in 2016.
Conclusion
Our analysis shows that proposals to modify Medicare’s benefit design have the potential to produce federal and Medicare savings, reduce aggregate beneficiary spending, and reduce spending by other payers, including spending by employers for retiree health plans and by states on behalf of beneficiaries who are dually eligible for Medicare and Medicaid. Such proposals could also simplify the program, provide beneficiaries with valuable protection against catastrophic expenses, add additional financial protections for low-income beneficiaries, and reduce the need for beneficiaries to purchase supplemental insurance. As this analysis demonstrates, however, it will be difficult for policymakers to achieve all of these ends simultaneously.
Juliette Cubanski, Tricia Neuman, and Gretchen Jacobson are with the Kaiser Family Foundation. Zachary Levinson is an independent consultant. Monica Brenner and James Mays are with Actuarial Research Corporation.
Appendix: Methodology
Data
The model’s primary data source is the 2009-2012 Medical Expenditure Panel Survey (MEPS), an annual survey of households and medical providers conducted by the Agency for Healthcare Research and Quality. This dataset includes individual-level information on demographics, income, health status and conditions, use of medical care, health expenses, and insurance coverage for nonelderly and elderly people. We supplemented the MEPS-based analysis with 2009-2011 data from the Medicare Current Beneficiary Survey (MCBS), a nationally representative survey of Medicare beneficiaries sponsored by the Centers for Medicare & Medicaid Services, to impute additional information where needed (for example, for SNF use and spending) and to validate some of our results (for example, the spending distribution by payer).
Although MEPS includes Medicare beneficiaries who are enrolled in Medicare Advantage, we excluded this group when evaluating the individual-level spending effects of the benefit design options because the options modify traditional Medicare. The model does incorporate indirect effects on aggregate Medicare Advantage spending and enrollment, based on the assumptions that changes in traditional Medicare reimbursement would be reflected in Medicare Advantage payments, and that aggregate Medicare Advantage payments will change to the extent that some beneficiaries switch between traditional Medicare and Medicare Advantage.
We aligned the poverty distribution to conform to the income and poverty distribution in the 2011 DYNASIM microsimulation model developed by researchers at The Urban Institute, with additional refinements using a CBO distribution of Part B enrollees by poverty status and Medicaid enrollment from 2004. We estimated the number of enrollees in the Medicare Savings Programs (with and without Medicaid) and the Part D Low Income Subsidy (LIS) program, using the Chronic Conditions Data Warehouse (2011 data) and CBO total enrollment counts, to determine the number of beneficiaries receiving cost-sharing assistance versus assistance with their Part B and/or Part D premiums only, projected to 2018, in order to model the effects of options to extend additional financial protections to low-income beneficiaries in traditional Medicare.
We used MEPS to assign beneficiaries to one of five supplemental coverage groups: 1) traditional Medicare only; 2) Medicaid; 3) employer-sponsored insurance (ESI), including TRICARE; 4) Medigap; and 5) other insurers, including Veterans’ Administration (VA), Indian Health Service, Worker’s Compensation, other federal, state, and local sources, and unclassified/unknown sources. Beneficiaries who listed more than one supplemental insurer were assigned to the coverage source they had for the most months during the calendar year. Enrollment estimates under the current-law baseline and the four options are provided in Table A1.
Calculating changes in cost sharing
The analysis looks exclusively at spending associated with Medicare-covered services. We excluded spending on non-Medicare covered services—such as dental care and other specific procedures, providers, or visit types that Medicare does not cover—from the MEPS data prior to conducting the analysis. As a survey of the non-institutionalized population, MEPS also does not include data for long-term services and supports. We began by estimating, at the individual level, what share of Medicare-covered services would be covered by the beneficiary and what share would be covered by each payer under current law in 2018. We controlled the MEPS Medicare channel of payment (i.e., Medicare reimbursement) by service to data from the August 2015 update31 of the CBO March 2015 Medicare baseline32 for Medicare benefits spending, with refinements at the
Table A1: Enrollment in Traditional Medicare, Medicare Advantage, and Other Types of Coverage under Current Law and Four Medicare Benefit Design Options if Fully Implemented in 2018
NOTE: N/A is not applicable. 1The number of traditional Medicare beneficiaries under Options 1-4 includes 0.5 million beneficiaries who switch from Medicare Advantage to traditional Medicare, but who are not included in the analysis of individual-level cost-sharing effects due to differences in the cost-sharing structure of each coverage type. 2Applies to beneficiaries enrolled in SLMB, QI, and Part D LIS who are not already receiving assistance with Medicare cost-sharing requirements from Medicaid or Medicare Savings Programs. 3Beneficiaries with incomes below 150 percent of poverty would have a lower deductible and cost-sharing limit under Option 4 than those with higher incomes.SOURCE: Kaiser Family Foundation/Actuarial Research Corporation, June 2016.
service and aged/disabled level (where available) based on the 2015 Medicare Trustees report33 and the 2013 Medicare & Medicaid Statistical Supplement.34 Total covered charges for each service in the record are then calculated based on the controlled Medicare reimbursement amount and the cost sharing for the service corresponding to the utilization data in the record. In this way, spending for each record is limited to Medicare-covered services only. The cost sharing (total covered charges minus Medicare spending) is distributed across the beneficiary and third-party payers according to their respective shares of total cost sharing for that service. To determine an individual’s out-of-pocket spending liability, we applied Medicare cost-sharing rules under current law to each beneficiary’s spending to divide the amount between Medicare and the beneficiary. Next, cost-sharing obligations were distributed among beneficiaries and supplemental insurers based on the share covered by each in the baseline.
We then applied alternative cost-sharing requirements under the Medicare benefit redesign options to determine shifts in the amount and distribution of spending for Medicare, beneficiaries, and other payers. (See the last section in this appendix for an example of how we model changes in the distribution of cost sharing under current law versus benefit redesign.) We first calculated the impact of the new cost-sharing rules on each individual’s exposure to cost sharing holding utilizationconstant. We also subject any increased cost sharing to the supplemental insurance the individual has, assuming insurers pay the same percentage of cost sharing under the benefit redesign options that they pay under current law. We then adjusted these calculations to account for changes in utilization and spending that would be expected to occur in response to cost-sharing changes, based on research showing that individuals tend to reduce their use of services, and thereby their spending, when their exposure to cost sharing increases (and vice-versa). The magnitude of these adjustments are described below. After making these adjustments and determining the new spending levels for each beneficiary, we recalculated the share of spending covered by each payer.
Because Medicaid is jointly-financed by the federal and state governments, we divided spending between the two payers based on current average spending patterns, with the federal government covering 57 percent of Medicaid spending on average and states covering the remaining 43 percent.35
Calculating changes in premiums
We estimated total spending by Medigap plans on Medicare-covered services and derived an expected average premium using current administrative expense loads and profit rates. We adopted a similar approach for ESI premiums, using a different administrative expense load and assuming employers would pick up half of the additional expenses, with the other half converted into a base premium. Using data from the Person Round Plan (PRPL) file in MEPS, we looked at deciles of Medigap and ESI premium amounts and used this information to make adjustments to the base premiums. We then randomly distributed these varying levels of premiums to enrollees’ records. It is important to note that for the purposes of this analysis, our emphasis is on the magnitude of changes in out-of-pocket spending (including premiums), rather than on absolute levels.
Medicare Part B premiums. Part B premiums are adjusted annually to cover 25 percent of the total predicted Part B costs for that year. However, the actual amount of premiums paid by enrollees is complicated by issues such as the income-related premium. We thus determined the Part B premium under modified benefit design options by adjusting the total premiums paid—taken from the CBO March 2015 Medicare Baseline, adjusted for the August 2015 update—by the percent change in Part B spending calculated by the model. The Part B premium was then adjusted to reflect beneficiaries’ incomes. We used a similar adjustment to CBO’s estimate for the federal share of premiums paid by Medicaid on behalf of beneficiaries dually eligible for Medicare and Medicaid.36
Supplemental insurance premiums. For supplemental insurance, we calculated premiums based on the insurers’ total spending on Medicare-covered services and related administrative expenses.
Medigap: Medigap plans were assumed to set premiums in order to cover Medigap costs (including administrative expenses) as well as a constant rate of profit. Thus, the Medigap premium was simply total Medigap expenses divided by the number of enrollees.
Employer-sponsored coverage: Employers were assumed to cover half of their employees’ expenses. The other half was converted into a uniform premium.
TRICARE, Medicaid, and other insurers: We assumed no premiums for these groups. TRICARE does not charge its enrollees a premium, and premiums are prohibited for most Medicaid enrollees. We also assumed that other supplemental insurers do not charge a premium because this category is primarily VA, Worker’s Compensation, and other federal and state programs.
Administrative expenses. For every dollar of spending, we assumed that payers would spend the following amounts on administrative costs: $0.017 and $0.015 for Medicare Part A and Part B, respectively; $0.052 for Medicaid; $0.25 for Medigap; $0.15 for ESI; and $0.10 for TRICARE and other insurers. These figures are based on the 2015 Trustees Report, CBO’s March 2015 Medicare Baseline, and data from the National Association of Insurance Commissioners (NAIC). Because administrative expenses vary by payer, benefit redesign options that change the distribution of spending also change total administrative costs. For instance, an option that shifts spending from Medicare to Medigap plans would also increase administrative expenses because the latter spends more on administration than the former.
Modeling changes in the distribution of cost sharing under current law versus a modified Medicare benefit design
Suppose we have a record for a Medicare beneficiary enrolled in an employer-sponsored retiree health plan who has one inpatient stay under 60 days, two primary care physician (PCP) visits, and three specialist visits. Under current law, total costs for these services are distributed among payers as follows (Table A2):
Table A2: Example of Distribution of Total Costs Under Current Law in 2018
Total spending
Medicare spending
Beneficiaryout-of-pocket spending
Private spending
Inpatient services
$10,500
$9,124
$688
$688
Physician services
$3,500
$2,663
$83.68
$753.12
TOTAL
$14,000
$11,787.20
$771.68
$1,441.12
SOURCE: Kaiser Family Foundation/Actuarial Research Corporation, June 2016.
Under current law, for inpatient services, this beneficiary is responsible for the Part A deductible ($1,376 in 2018, according to the 2015 Medicare Trustees Report), which the MEPS record shows is split evenly between beneficiary out-of-pocket and private spending ($688 each). For physician services, the beneficiary is responsible for the Part B deductible ($171 in 2018, according to the 2015 Medicare Trustees Report), along with 20 percent of costs above the deductible: (($3,500 – $171) x 0.2) + $171 = $836.80. The MEPS record shows that the beneficiary pays 10 percent ($83.68) and the employer plan pays the rest ($753.12).
To model the Medicare benefit redesign with a single A/B deductible of $650, a $6,700 cost-sharing limit, and varying copayments by service, we first apply the $650 deductible amount to inpatient services only, since physician visits are exempt from the deductible.
The cost-sharing amount for inpatient services is $750 per inpatient stay. For physician services, cost sharing is $25 for each of the two PCP visits plus and $50 for each of the three specialist visits for a total of(2 x $25) + (3 x $50) = $200. Adding the deductible to the inpatient copayment produces a total cost sharing for inpatient of $650 + $750 = $1,400. Note that if other services had been used, the combined deductible would have been split pro-rata across the applicable services. This method enables us to retain the underlying cost-sharing distributions for each service as well as apply induction effects by service.
For inpatient services, the total cost sharing is split evenly, as under current law, between beneficiary out-of-pocket and private spending ($700 each), and for physician services, 10 percent ($20) of the cost sharing is paid out of pocket (as per the MEPS record under current-law cost-sharing rules). Thus, under the new benefit design, the beneficiary’s total costs would be distributed among payers as follows (Table A3):
Table A3: Example of Distribution of Total Costs Under Medicare Benefit Redesign in 2018
Total spending
Medicare spending
Beneficiaryout-of-pocket spending
Private spending
Inpatient services
$10,500
$9,100
$700
$700
Physician services
$3,500
$3,300
$20
$180
TOTAL
$14,000
$12,400
$720
$880
SOURCE: Kaiser Family Foundation/Actuarial Research Corporation, June 2016.
A Better Way: Our Vision for a Confident America, June 22, 2016. ↩︎
An alternative approach would add enhanced Medicare benefits as a separate part of the program, sometimes referred to as Medicare Part E, Medicare Extra, or Medicare Essential. See, for example, Karen Davis et al., “Medicare Essential: An Option to Promote Better Care and Curb Spending Growth,” Health Affairs, May 2013. ↩︎
See, for example, Medicare Payment Advisory Commission (MedPAC), June 2012 Report to the Congress: Medicare and the Health Care Delivery System, Chapter 1: Reforming Medicare’s Benefit Design, June 2012, available at http://www.medpac.gov/documents/reports/jun12_ch01.pdf. ↩︎
See, for example, Bipartisan Policy Center, A Bipartisan Rx for Patient-Centered Care and System-Wide Cost Containment, April 2013. ↩︎
MedPAC, Reforming Medicare’s Benefit Design, June 2012. ↩︎
The actuarial value of the modified benefit design under Option 1 is roughly equivalent to the actuarial value of the current law benefit design under traditional Medicare. The per capita reimbursement is $10,149 under current law and $10,050 under Option 1, a difference of about -1 percent. Dividing benefits per capita by the associated covered charges, which change slightly from current to future law, the actuarial values for both Option 1 and Medicare’s current law benefit design are 85 percent. ↩︎
The combined deductible for Part A and Part B services would be lower than the current-law deductible for Part A services but higher than the current-law deductible for Part B services. ↩︎
This cost-sharing structure is similar to the illustrative benefit design put forward by MedPAC, based on the cost-sharing structure of Medicare Advantage plans. The cost-sharing amounts shown in Table 1 are not the same as suggested by MedPAC because they have been updated using trends in reimbursement by type of service to 2018 levels and to ensure cost-sharing neutrality under the modified benefit design, as under the MedPAC illustrative option. See MedPAC, Reforming Medicare’s Benefit Design, June 2012. ↩︎
Beginning in 2020, MACRA prohibits the sale of Medigap policies that cover the Part B deductible for newly-eligible Medicare beneficiaries. In the 2015 Medicare Trustees report, the Part B deductible was projected to be $196 in 2020. Existing enrollees or currently eligible beneficiaries may keep or continue to be offered policies that cover the Part B deductible. ↩︎
Hereafter, we use the word ‘poverty’ to refer to the federal poverty guidelines. ↩︎
Each program has specific income and asset eligibility requirements. In some states, beneficiaries with incomes above 150 percent of poverty are eligible for SLMB. ↩︎
Beneficiaries with higher incomes (more than $85,000 for individuals and $170,000 for married couples) pay a higher percentage of Part B program costs, ranging from 35 percent to 80 percent, depending on their incomes. ↩︎
Supplemental insurance typically covers a portion of Medicare’s cost-sharing requirements, thereby reducing the additional costs that beneficiaries would otherwise pay when they seek medical care. ↩︎
The model does not incorporate potential savings to Medicare associated with possible reductions in disproportionate share hospital (DSH) payments that might be made under current law on behalf of some low-income beneficiaries who would benefit from the cost-sharing subsidies under Option 3, due to the difficulty in estimating the possible magnitude of this effect. ↩︎
Amal Trivedi, Husein Moloo, and Vincent Mor, “Increased Ambulatory Care Copayments and Hospitalizations among the Elderly,” New England Journal of Medicine, January 2010. ↩︎
Amitabh Chandra, Jonathan Gruber, and Robin McKnight, “Patient Cost-Sharing, Hospitalization Offsets, and the Design of Optimal Health Insurance for the Elderly,” National Bureau of Economic Research Working Paper Series, March 2007. ↩︎
See the American Academy of Actuaries, “Medical Savings Accounts: Cost Implications and Design issues,” May 1995, Table II-2A, available at http://www.actuary.org/pdf/health/msa_cost.pdf. We used a slightly more conservative estimate for inpatient care (0.2 instead of 0.3). ↩︎
In an analysis not presented in this report, we modeled the addition of a 20 percent Medigap premium surcharge paid by policyholders in combination with the modified Medicare cost-sharing parameters under Option 1. The analysis showed that the surcharge would generate an estimated $3.0 billion in revenues in 2018, and, in conjunction with other changes to Medicare’s benefit design, would produce federal savings of $8.1 billion, relative to current law. Federal savings would be higher than under Option 1, which includes a restriction on Medigap coverage of the deductible, solely due to the surcharge revenues. In fact, Medicare savings are modestly lower with a Medigap premium surcharge than with Medigap coverage restrictions, because a coverage restriction is expected to lead Medigap policyholders to reduce their service use somewhat, but this would be less of a factor with a premium surcharge. ↩︎
Medicare Payment Advisory Commission, Report to the Congress: Medicare Payment Policy, Chapter 5, “Increasing Participation in the Medicare Savings Programs and the Low-Income Drug Subsidy,” March 2008, available at www.medpac.gov/documents/mar08_ entirereport.pdf. ↩︎
Congressional Budget Office, An Update to the Budget and Economic Outlook: 2015 to 2025, August 2015, available at https://www.cbo.gov/publication/50724. ↩︎
Current per 2013 Medicaid 64 (CMS administrative data). ↩︎
Based on CBO estimates, we assume that federal Medicaid spending covers 57 percent of Part B premiums on behalf of Medicaid enrollees and states pay the rest. This is the same assumption we make about cost-sharing coverage. ↩︎
Together Medicaid and the Children’s Health Insurance Program (CHIP) play an important role in providing health coverage for children in families with low and moderate incomes. This brief summarizes the role Medicaid and CHIP play in providing coverage to children, discusses the importance of Medicaid and CHIP for children’s health and well-being, provides an overview of the eligibility for coverage of the remaining uninsured children, and raises issues impacting the future of children’s coverage. It shows:
Medicaid and CHIP are central sources of coverage for the nation’s children, covering nearly four in ten children nationwide. Medicaid and CHIP play a particularly important coverage role for low-income children and children of color. Medicaid’s size and scope is broader compared to CHIP, covering 36.1 million children in 2014, with CHIP covering another 8.1 million children at some point during the year. Enrollment in Medicaid and CHIP has positive impacts on children and families, including improving children’s access to health care services and providing financial protections for families.
Despite consistent coverage gains for children, which have reduced their uninsured rate to a record low of 6%, an estimated 5 million children remain uninsured. About half of remaining uninsured children live in just seven states, mostly in the South and West. Hispanic and American Indian and Alaskan Native children are at least twice as likely to remain uninsured compared to White children, and two-thirds (65%) of the remaining uninsured children are eligible for Medicaid or CHIP.
Going forward, sustaining and advancing coverage gains for children will hinge in part on the future of CHIP as well as outreach and enrollment efforts and state adoption of policy options. CHIP funding was extended through September 30, 2017 as part of the Medicare Access and CHIP Reauthorization Act (MACRA), so Congress will again consider options around CHIP and children’s coverage. Without CHIP, some children would retain Medicaid coverage, others could get coverage through the Marketplace and others may become uninsured. Targeted outreach and enrollment efforts to reach uninsured children and continued adoption of state policy options to expand eligibility and streamline enrollment and renewal can help advance new coverage gains for children in the future.
Issue Brief
The Role of Medicaid and CHIP for Children
Medicaid and CHIP are central sources of coverage for the nation’s children. Enacted in 1965 under Title XIX of the Social Security Act, Medicaid was created to provide health care coverage to blind and disabled individuals and families with dependent children receiving cash assistance. It has expanded over time, particularly for children. CHIP was created in 1997 to provide coverage to uninsured children in families with incomes above Medicaid eligibility levels. Under CHIP, states are permitted to use funds to create a separate CHIP program, expand their Medicaid program, or adopt a combination approach.1 CHIP helped spur efforts to expand eligibility to reach more low-income children, adopt strategies to simplify enrollment and renewal, and conduct outreach and enrollment efforts.
Medicaid’s size and scope is broader compared to CHIP. In 2014, Medicaid covered 36.1 million children and another 8.1 million children were covered through CHIP at some point during the year.2 Historically, children have accounted for about 21% of Medicaid spending for services; therefore, if the proportion of spending on children remained constant, an estimated $96 billion of the $458 billion in total Medicaid spending for services would be for children in 2014,3, 4 more than 7 times higher than CHIP expenditures of $13.5 billion in FY 2014.5
Both Medicaid and CHIP are federal matching programs; however, the CHIP match rate is higher than Medicaid and CHIP financing is capped. Under both programs, the federal government matches eligible state spending according to a formula that relies on states’ relative per capita income. The federal match rate for Medicaid ranges from 50% to 74% across states as of FY 2015.6 To encourage participation among the states when CHIP was enacted, the federal government provided enhanced (relative to Medicaid) matching payments for CHIP, which were further increased under the ACA. In FY 2015, prior to the ACA increase, the CHIP match rate ranged from 65% to 81% across states.7 Under Medicaid, federal matching funds are guaranteed with no pre-set limits. Tied to this financing guarantee, Medicaid provides an entitlement to coverage and states are prohibited from imposing enrollment caps or waiting lists. In contrast, federal funds under CHIP are capped nationwide and each state operates under an allotment. Under separate CHIP programs, beneficiaries are not entitled to coverage and at various times, states have imposed caps and waiting lists to control CHIP spending.
Both Medicaid and CHIP provide broad benefits and cost-sharing protections for low-income children. Children enrolled in Medicaid receive a comprehensive benefit package that includes the Early and Periodic Screening, Diagnosis and Treatment (EPSDT) benefit, long-term care, many rehabilitative services, and services provided at Federally Qualified Health Centers (FQHCs). Under EPSDT, children are guaranteed comprehensive coverage including access to physical and mental health therapies, dental and vision care, personal care services and durable medical equipment. Given the limited incomes of enrollees, states generally are prohibited from imposing premium and cost-sharing for children enrolled in Medicaid with family incomes under 150% FPL. Compared to Medicaid, states have more flexibility around benefits and cost-sharing in separate CHIP programs. However, in both Medicaid and CHIP, total premium and cost-sharing expenses cannot exceed 5% of family income. As of 2016, 4 states had premiums or enrollment fees for children in Medicaid and 3 states charged cost sharing for Medicaid children, while 26 states required premiums or enrollment fees and 25 states charged co-payments for children in CHIP.8
Children with Medicaid coverage have significantly better access to care than uninsured children, and their access is comparable to privately covered children (Figure 1).9 Children with Medicaid coverage are more like to have a usual source of care, well-child check-up and a specialist visit compared to uninsured children, and their access along these measures is similar to children with private insurance. Data also show children with Medicaid are less likely to delay or forgo care due to cost, to have gone more than two years without seeing a doctor, to have unmet dental need due to cost, and to have gone more than two years since visiting a dentist compared to uninsured children.10
Figure 1: Access to Care for Children by Health Insurance Status, 2014
Studies show that Medicaid and CHIP lead to improved health outcomes and other improvements for children and parents are satisfied with their child’s coverage. Some studies have found that Medicaid and CHIP coverage contribute to improved health outcomes, including reductions in avoidable hospitalizations and positive impacts on child mortality.11 Research also suggests that Medicaid and CHIP coverage contributes to improvements in school performance and long-term educational attainment, including increased college attendance.12 In addition, evidence shows that Medicaid and CHIP enrollment has a positive impact on future wages and reduces early adulthood mortality.13 Parents report that they are thankful for Medicaid and CHIP and have peace of mind knowing their children are covered.14 In particular, they appreciate the affordability of the coverage.15 Recent poll data show that when presented with a hypothetical situation of being uninsured and needing medical care, a large majority (88 percent) say that they would enroll an eligible child in Medicaid.16
Recent Legislation Related to Children’s Coverage
The Affordable Care Act (ACA) continued and bolstered efforts to cover children through Medicaid and CHIP. The ACA protects the gains achieved in children’s coverage by requiring states to maintain eligibility thresholds for children that are at least equal to those they had in place at the time the law was enacted through September 30, 2019. The ACA also established a minimum Medicaid eligibility level of 133% FPL for all children up to age 19. Prior to the ACA, the federal minimum for children ages 6 to 18 was 100% FPL; 21 states transitioned older children from CHIP to Medicaid in 2014 as a result of this change. In addition, the ACA required states to provide Medicaid to children aging out of their foster care system up to age 26. Moreover, the ACA enhanced enrollment in Medicaid and CHIP by establishing new streamlined processes, eliminating waiting periods in Medicaid, limiting waiting periods in CHIP, and increasing outreach and enrollment efforts. Lastly, the ACA increased the CHIP matching rate by 23 percentage points from 2016 through 2019, up to a maximum of 100%. In FY 2017, the CHIP match ranged from 88% to 100% with 12 states receiving 100% match.17
In April 2015, the Medicare Access and CHIP Reauthorization Act (MACRA) extended funding for CHIP through September 30, 2017 without changing the basic structure of the program.18 This two year extension included authorization to implement the 23 percentage point increase to the enhanced federal match for CHIP. MACRA also provided increased funding for outreach and enrollment grants for states by $40 million in FY 2016 and FY 2017. In addition to funding, MACRA extended until September 2017 Express Lane Eligibility authority for states, which facilitates enrollment and renewal of eligible children.
Current Children’s Medicaid/CHIP Eligibility and Participation
As of January 2016, Medicaid and CHIP provide coverage to children with a median eligibility level at 255% FPL.19 Nineteen states, including DC, cover children in families with incomes at or above 300% FPL, while only three states limit eligibility to children in families with incomes less than 200% FPL (Figure 2).20 Arizona was the only state with enrollment closed in its separate CHIP program, which has been closed since 2010. However, enrollment in Arizona’s separate CHIP program is scheduled to reopen in late 2016. Even with the ACA’s Medicaid expansion to low-income adults, the median eligibility level for children (255% FPL) is much higher compared to that for parents (138% FPL), other adults (138% FPL), and pregnant women (205% FPL).21
Figure 2: Income Eligibility Levels for Children in Medicaid/CHIP, January 2016
Participation in Medicaid and CHIP is high with nine in ten (91%) children who are eligible enrolled in coverage.22 As of 2014, 32 states had over 90% of eligible children enrolled and the participation rate for eligible children was near or above 80% in all states. Reflecting ongoing outreach and enrollment efforts, the share of eligible children who are enrolled has increased over time, from 82% in 2008 to 91% in 2014. Between 2013 and 2014, there were larger increases in participation rates in states that adopted the ACA Medicaid expansion to low-income adults in 2014 compared to states that did not expand in 2014 (3.0 percentage points vs. 1.8 percentage points). The expansion to adults may have contributed to increased coverage among previously eligible children as a result of broad outreach and enrollment efforts associated with the expansion. Even with these high participation rates, there remain opportunities to further increase coverage by enrolling eligible children who remain uninsured.
Coverage for Children Today
The children’s uninsured rate has fallen by more than half from 14% in 1997 to a historic low of 6% in 2014 (Figure 3).23 This decline reflects expansions in eligibility for Medicaid and CHIP over time, combined with efforts to streamline enrollment and renewal and outreach and enrollment campaigns. Children have had much larger gains in coverage than adults over time. Largely due to availability of public coverage through Medicaid and CHIP, children continued to gain coverage during the recent economic downturn when the uninsured rate for adults (for whom Medicaid eligibility is much more limited) climbed.
Figure 3: Uninsured Rates Among Nonelderly Adults and Children, 1997-2014
As of 2014, 94% of the over 78.1 million children in the United States had coverage, with nearly four in 10 covered by Medicaid and CHIP.24,25 Over half of children (52%) had private insurance, including an employer sponsored health plan, Marketplace insurance, or other non-group health coverage (Figure 4). Another nearly four in ten (39%) children were covered through Medicaid and CHIP.
Figure 4: Health Insurance Coverage of Children, 2014
Medicaid and CHIP play a particularly important role in covering children in low-income families and children of color.26 More than three-quarters (76%) of children in families with incomes below the poverty level are enrolled in Medicaid and CHIP, and over half (56%) of children in families with incomes between 100% and 199% FPL are enrolled in Medicaid and CHIP.27 The programs also play a substantial role for children of color, covering more than half of all Black, Hispanic, and American Indian and Alaska Native children (Figure 5).28
Figure 5: Percent of Children with Medicaid/CHIP Coverage by Income and Race, 2014
An estimated 5 million children remain uninsured as of 2015, and a child’s risk of being uninsured varies based on his or her race and ethnicity and where he or she lives. Hispanic and American Indian and Alaska Native children are at least twice as likely to be uninsured compared to White children (Figure 6). Hispanic families face a range of barriers to enrollment in coverage, including complex eligibility rules for immigrants, language barriers, and concerns about negative impacts on immigration status from enrolling in health coverage.29,30 American Indian and Alaska Native families also face specific barriers to enrollment including mistrust of federal and state governments, certain cultural beliefs, and a preference for relying on Indian Health Services (IHS) services for care or the belief that the federal government should fund all needed care through IHS.31 Across states, children’s uninsured rates range from at or less than 5% in 23 states, including DC, to at or above 11% in 7 states (Alaska, Arizona, Colorado, Nevada, Oklahoma, Texas, and Utah) (Figure 7). Almost half (49%) of all uninsured children live in just seven states (Arizona, California, Florida, Georgia, New York, North Carolina, and Texas).32
Figure 6: Uninsured Rates for Children by Race/Ethnicity, 2014Figure 7: Uninsured Rates for Children by State, 2014
Nearly two in three (65%) uninsured children are eligible for Medicaid or CHIP (Figure 8).33 An additional 5% of uninsured children are eligible for assistance to purchase health insurance through Marketplaces. The remaining 30% of uninsured children are ineligible for financial assistance due to income or an offer of employer sponsored insurance in the family, or because they do not qualify for coverage based on immigration status. Undocumented children are not eligible for public coverage. In addition, lawfully residing immigrant children in the country for less than five years are not eligible for Medicaid or CHIP unless a state has taken option to waive this five year waiting period. As of January 2016, 29 states had taken up this option in Medicaid or CHIP.34 Since then, Florida and Utah also adopted this option.
Figure 8: Eligibility for ACA Coverage Among Uninsured Children as of 2015
The majority of the 3.2 million children that remain uninsured but are eligible for Medicaid or CHIP are in low-income families and are children of color, and roughly one in four is in fair or poor health (Figure 9). While the vast majority of uninsured but eligible children have a full or part-time worker in the family (83%), 78% live in low-income families.35 Nearly two-thirds (63%) of the remaining uninsured children who are eligible for Medicaid or CHIP are children of color, including more than one in three (39%) who are Hispanic. Almost a quarter (24%) of children who remain uninsured but eligible for Medicaid or CHIP are in fair or poor health.36 Uninsured children eligible for Medicaid or CHIP are almost evenly split between states adopting the ACA’s Medicaid expansion for low-income adults (53%) and not currently adopting the expansion (47%).37 More than one in three (37%) uninsured but eligible children live in just four states (California, Florida, New York, and Texas).38
Figure 9: Distribution of Uninsured Children who are Eligible for Medicaid/CHIP by Family Income, Race/Ethnicity, and Health Status, 2015
Issues for the Future
Sustaining Children’s Coverage Gains
The outcome of the next CHIP reauthorization debate will have implications for sustaining children’s coverage gains. As stated above, MACRA extended CHIP funding through September 2017. Without additional CHIP funding, children in Medicaid expansion CHIP programs would retain Medicaid coverage since the ACA maintenance of eligibility provisions for children in Medicaid and CHIP are in place through FY 2019. Other children could move to coverage through the Marketplace and others may become uninsured. There are a number of options on the table including extending CHIP, expanding Medicaid, permitting CHIP-financed Marketplace subsidies, enhancing Marketplace coverage, or broadening state innovation waivers.
The debate around CHIP reauthorization is likely to focus more broadly on key issues for children’s coverage, including benefits and out of pocket costs. One option that may be considered would be to transition children from CHIP to Marketplace coverage. While Marketplace coverage may generally be comparable to CHIP, Marketplace coverage may lack dental, vision, and habilitative services, in addition to other services specific for children with special health needs.39 In addition, analyses show Marketplace coverage costs can greatly exceed the 5% of household income allowable under Medicaid or CHIP.40, 41Affordability of coverage is a primary concern for parents.42 Moreover, under current rules, some children are not eligible for tax credits in the Marketplace because a parent may have access to “affordable” employer coverage; however, the affordability test for employer coverage is based on a calculation of the individual coverage relative to a workers wages (not the cost of a family policy). This situation is referred to as the “family glitch” and leaves children uninsured.
Continuation of federal financing to support children’s coverage is a key for maintaining coverage gains. The availability of federal financing has been instrumental in attaining high levels of coverage for children. Extending CHIP or financing children’s coverage through new or alternative mechanisms will be key to sustaining coverage gains to date. More broadly, debate about funding for children’s coverage could arise at the same time Congress may consider options to reform Medicaid financing and reduce federal spending. Since Medicaid has been the primary program for children’s coverage, proposed changes to Medicaid may have bigger implications for sustaining children’s coverage.
Continuing to Advance Children’s Coverage
Targeting outreach and enrollment efforts to hard-to-reach populations may help reduce remaining disparities in children’s coverage. As indicated above, some groups of children, including Hispanic and American Indian and Alaska Native children, remain at higher risk of being uninsured. Developing targeted outreach and enrollment efforts to overcome these barriers will be key for reducing ongoing disparities in coverage for these children. Moreover, it is important for efforts to continue over the course of the year, since enrollment in Medicaid and CHIP is not limited to the open enrollment period of the Marketplaces. The Centers for Medicare and Medicaid Services (CMS) has provided several rounds of grant funding to support outreach activities to reach eligible but uninsured children. One June 13, 2016, CMS announced it will provide $32 million to community organizations to support efforts to reach out to families with children eligible for Medicaid and CHIP through its current grant cycle.43
States have the opportunity to reach more uninsured children by adopting policy options that expand children’s eligibility for Medicaid and CHIP and facilitate enrollment and renewal. For example, additional states could take up the option to eliminate the five year waiting period for lawfully present immigrant children in Medicaid or CHIP. States also can expand coverage for former foster youth from other states. While the ACA requires all states to provide Medicaid coverage to youth who were in foster care in the state up to age 26, it is a state option to extend coverage to former foster youth from other states.44 As of January 2016, 13 states had taken up this option. States also can expand CHIP coverage to dependents of state employees, which 15 of the 36 states with separate CHIP programs had done as of January 2016.45 States have several options available to facilitate enrollment and renewal of eligible children. For example, as of January 2016, 18 states were providing presumptive eligibility for children in Medicaid or CHIP, 10 states were using Express Lane Eligibility to enroll or renew children in Medicaid or CHIP based on findings from other programs, 5 states were using SNAP data to facilitate enrollment or renewal of children, and 32 states were providing 12-month continuous eligibility to children.46 In June 2016, CMS provided an information bulletin that highlights the existing tools available to states to support enrollment and retention of eligible children and resources available to states to support implementation of these options.47
Conclusion
In sum, Medicaid and CHIP are a central source of coverage for low-income children. The broad benefits and financial protections afforded under Medicaid and CHIP enable children’s access to health care services that lead to improvements in health outcomes and other areas of their lives. Reflecting continued coverage gains over time, Medicaid and CHIP cover nearly one in four children today, and children’s uninsured rate has fallen to a record low. However, despite these gains, an estimated five million children remained uninsured as of the beginning of 2015 and disparities in coverage continue based on a child’s race/ethnicity and where a child lives. Nearly two-thirds of remaining uninsured children are eligible for Medicaid and CHIP, suggesting that continued coverage gains can be achieved through targeted outreach and enrollment efforts. States also can enhance children’s access to coverage by adopting options that expand children’s eligibility for Medicaid and CHIP and that facilitate enrollment and renewal in the programs. Looking ahead, the future of CHIP will have important implications for children’s coverage after 2017. As policy options are considered it will be important to consider how they affect the benefits and cost sharing of coverage options for children.
Endnotes
According to CMS, as of May 2015, 2 states operate separate CHIP programs, 9 states operate Medicaid expansion CHIP programs, and 40 states operate combination programs. “Children’s Health Insurance Program,” Centers for Medicare and Medicaid Services, accessed April 26, 2016, https://www.medicaid.gov/chip/downloads/chip-map.pdf. ↩︎
Kaiser Family Foundation State Health Facts. Data Source: Urban Institute analysis of CM Form 64 data as of June 2015, accessed May 5, 2016 https://modern.kff.org/medicaid/state-indicator/total-medicaid-spending/. Estimate of spending for children in FY 2014 is the share of children’s spending in FY 2011 multiplied by Medicaid spending in FY 2014 without DSH spending. ↩︎
Kaiser Family Foundation State Health Facts. Data Source: CHIP Spending by State, 2014, MACPAC, 2015, analysis of Medicaid and CHIP Budget Expenditure System (MBES/CBES) data from the Centers for Medicare & Medicaid Services as of March 6, 2015, access May 6, 2016, https://modern.kff.org/other/state-indicator/total-chip-spending/. ↩︎
David Brown, Amanda Kowalski, and Ithai Lurie, Medicaid as an Investment in Children: What is the Long-Term Impact on Tax Receipts? (Washington, DC, National Bureau of Economic Research, January 2015), http://www.nber.org/papers/w20835. ↩︎
Michael Perry and Julia Paradise, Enrolling Children in Medicaid and SCHIP: Insights from Focus Groups with Low-Income Parents (Washington, DC, Kaiser Commission on Medicaid and the Uninsured, Kaiser Family Foundation, May 2007), https://modern.kff.org/wp-content/uploads/2013/01/7640.pdf. ↩︎
Kaiser Family Foundation estimates based on analysis of the March 2015 ASEC Supplement to the CPS. ↩︎
Kaiser Family Foundation analysis based on 2015 Medicaid eligibility levels updated to reflect state Medicaid expansion decisions as of January 2016 and 2015 Current Population Survey data. ↩︎
Kaiser Family Foundation analysis based on 2015 Medicaid eligibility levels updated to reflect state Medicaid expansion decisions as of January 2016 and 2015 Current Population Survey data. ↩︎
This brief provides an overview of recent trends in Medicaid and CHIP enrollment as of January 2016, based on data from the Centers for Medicare and Medicaid Services (CMS) produced as part of its Performance Indicator Project.1 The project was designed to provide timely data on Medicaid and CHIP eligibility and enrollment that are intended to help strengthen data-driven program management and oversight efforts at both the national and state level (an overview of the data can be found in Appendix A). They also provide insight into Medicaid and CHIP eligibility and enrollment experiences as the ACA is implemented. This brief examines data as of January 2016 to be able to look at two full years of data post implementation of the major coverage provisions in the Affordable Care Act (ACA). All available months of data are available here: Total enrollment, Child enrollment.) The data show:
As of January 2016, 72.9 million people were enrolled in Medicaid and CHIP. Over two-thirds of enrollees resided in states that have implemented the ACA Medicaid expansion.
Between Summer 2013 and January 2016, there was a net increase of nearly 15.5 million or 27% enrolled in Medicaid and CHIP among the 49 states reporting data for both periods. Most of this growth occurred in year one. Most of this growth was in large states in the West that implemented the Medicaid expansion.
Expansion states experienced significantly greater enrollment growth over the two year period, although there was variation across states. States that implemented the Medicaid expansion experienced over three times greater enrollment growth compared to states where the Medicaid expansion is not in effect (36% vs. 12%). Over the period, growth ranged from a high of 95% in Kentucky to slight decline in Wyoming and Nebraska.
Children account for a greater share of total Medicaid and CHIP enrollment in nearly all states that have not expanded Medicaid compared to states that have expanded. Reflecting higher eligibility levels for children, children accounted for a greater share of total Medicaid and CHIP enrollees in non-expansion states compared to states that have implemented the expansion to adults (68% vs. 44%).
Key Findings
As of the end of January 2016, 72.9 million people were enrolled in Medicaid or CHIP coverage nationwide. Over two-thirds (50.1 million of the 72.9 million) of all Medicaid and CHIP enrollees resided in states that have implemented the Medicaid expansion (Figure 1). A combination of expansion and non-expansion states have the highest Medicaid enrollment. California, New York and Texas account for just about one-third of all Medicaid enrollment. Together with Florida, Illinois, Ohio, Pennsylvania, and Michigan these eight states account for just over half of all Medicaid enrollment. (See Appendix Table B for state tables on enrollment.)
Figure 1: Medicaid and CHIP Enrollment by Expansion Status, January 2016
Between Summer 2013 and January 2016, there was a net increase of nearly 15.5 million people enrolled in Medicaid and CHIP among the 49 states reporting data for both periods. Most of this growth was in large states that implemented the Medicaid expansion (Figure 2). Overall, 82% of the net enrollment growth occurred in expansion states, and 48% was in the West, reflecting sizeable enrollment gains in large western states like California and recent expansion decisions in Montana and Alaska. Half (50%) of the 15.5 million net increase is attributable to growth in six expansion states (CA, NY, WA, KY, OH, and CO), with California accounting for 29% of the overall net growth. Changes in total enrollment over this period reflect varied factors including both net gains in enrollment and changes in the number of states reporting data.2
Figure 2: Total Net Medicaid and CHIP Enrollment Growth by Medicaid Expansion Status and Region, Summer 2013 to January 2016
States that expanded Medicaid have experienced significantly greater net Medicaid and CHIP enrollment growth since prior to the beginning of open enrollment than states that have not expanded. Nationally, total Medicaid and CHIP enrollment grew by 27% between Summer 2013 and January 2016. Growth was over three times higher (37%) in states that implemented the expansion compared to states where the Medicaid expansion is not in effect (12%) (Figure 3). However, there is significant variation in total growth across individual states from a high of 95% growth in Kentucky to slightly negative growth in Wyoming and Nebraska. (Figure 4)
Figure 3: Change in Total Medicaid and CHIP Enrollment Compared to Summer 2013Figure 4: Percent Change in Total Medicaid and CHIP Enrollment by State between Summer 2013 and January 2016
Most growth occurred in the first year, with growth rates tapering off from January 2015-January 2016. Across all states, enrollment had increased by 20% compared in January 2015, to the Summer baseline data. Growth rates tapered in the following year to 7% with cumulative growth of 27% over the period. Across all states that implemented the expansion in January 2014, growth rates have slowed in the second year of implementation. (Figure 5)
Figure 5: Percent Change in Total Medicaid and CHIP Enrollment by State between Summer 2013 and January 2016 in States that Adopted the Medicaid Expansion as of January 1, 2014
Children account for a greater share of total Medicaid and CHIP enrollment in nearly all states that have not expanded Medicaid. Among the 46 states reporting data for child and total enrollment as of January 2016, children made up just over half (53%) of total Medicaid and CHIP enrollment. They accounted for over two-thirds of total enrollment (68%) in states that have not expanded Medicaid compared to well under half (44%) among the states that have expanded and enrolled many new adults (Figure 6). The pattern is reflective of the fact that children’s eligibility levels are higher than those for adults in states that have not expanded.
Figure 6: Child Enrollment as a Share of Total Medicaid and CHIP Enrollment by State, January 2016
Between January 2014 (the earliest children data reported) and January 2016, child enrollment increased by 1.9 million or 8% across the 36 states reporting data for both periods. Growth was 8% cumulative between January 2014 and January 2016 with a 6% increase in the first year and a 2% increase in the second year. Percent change over the two year period ranged from an increase of 23% in North Carolina to a decrease of 9% in Wyoming.
Conclusion
Data show that there has been significant net growth in Medicaid and CHIP enrollment since the major ACA coverage expansion went into effect, and states that have expanded Medicaid have experienced significantly greater growth compared to non-expansion states. Growth rates appear to be tapering off in year two following the implementation of the ACA.
Reflecting higher eligibility levels for children, children make up a greater share of total Medicaid and CHIP enrollees in non-expansion states compared to states that have expanded to adults. As a broader set of performance data is reported over time, the data will provide greater understanding of state Medicaid and CHIP eligibility and enrollment experiences, although they will not provide information on the number of newly eligible adults enrolled through the ACA Medicaid expansion. The performance data will complement other data initiatives at the federal level as well as additional reporting at the state level to provide more comprehensive and timely information on Medicaid and CHIP eligibility and enrollment that can support data-driven quality-improvement efforts and overall program management and oversight efforts at both the national and state level.
Appendices: Appendix A: Data Overview
At the end of 2013, CMS implemented a new eligibility and enrollment Performance Indicator Project for state Medicaid and CHIP programs, establishing 12 Medicaid and CHIP eligibility and enrollment performance indicators for states to report (listed at the end of the data overview. To date, CMS has reported a limited set of the indicators, including total Medicaid and CHIP enrollment, and enrollment of children in Medicaid and CHIP. Average monthly data for Summer 2013 are provided as a comparison point prior to the ACA major coverage expansions. Child enrollment data are only reported for January 2014 forward. Key definitions of the data are included below:
Pre-ACA Average Monthly Medicaid/CHIP Enrollment: The average number of individuals enrolled in Medicaid and CHIP for each month during the July-September, 2013 period using an average of enrollment numbers submitted by the states for each month in this period. Not all states submitted three months of data; the average is calculated using any months of baseline data that were provided. The unit of measurement is individuals enrolled as of the last day of the reporting period (month).
Post-ACA Medicaid/CHIP Monthly Enrollment: The total unduplicated number of individuals enrolled in Medicaid and CHIP as of the last day of each reporting period, including those with retroactive, conditional, and presumptive eligibility. This indicator is a point-in-time count of total program enrollment, and is not solely a count of those newly enrolled during the reporting period. This number includes only those individuals who are eligible for comprehensive benefits (e.g., emergency Medicaid, family planning-only coverage and limited benefit dual eligible individuals are excluded). Medicaid Section 1115 demonstration populations are included as long as the benefits and networks are comprehensive. CHIP children subject to a waiting period or premium lock-out period are considered eligible but not enrolled and are not included. Data are subject to change based on subsequent CMS enrollment reports. Other reporting on Medicaid and CHIP enrollment by states and researchers may include some beneficiaries excluded in these data (because comprehensive coverage is not provided), or may use a different methodology.
California changed its methodology by removing some limited benefit groups from enrollment beginning in September 2015, which lowered both the pre-ACA monthly enrollment as well as California’s monthly enrollment. However, California data reported for August 2015 and earlier months (as well as the related pre-ACA monthly enrollment) was not updated to reflect this change in methodology.
In this brief, data through January 2016 are used to show change for the two year period since the implementation of the coverage provisions in the ACA. The trends in Medicaid and CHIP enrollment since Summery 2013 reflect a combination of factors including state Medicaid expansion decisions, the Marketplace enrollment periods, and broader factors such as the economic environment. As of June 2016, 32 states, including DC, have adopted the Medicaid expansion for low-income adults. In most of these states, coverage under the expansion went into effect January 1, 2014, although coverage went into effect at later dates in six states – Michigan (April 1, 2014), New Hampshire (August 15, 2014,) Pennsylvania (January 1, 2015), Indiana (February 1, 2015), Alaska (September 1, 2015), and Montana (January 1, 2016). Louisiana has adopted the Medicaid expansion but implementation will begin in July 2016; as a result, the data in this brief do not reflect the Medicaid expansion in Louisiana. Eligibility for parents remains very limited in most states that have not expanded and adults without dependent children are not eligible for coverage in all but one non-expansion state.
While CMS may expand the scope of eligibility and enrollment indicators reported over time, the data will not provide information on the number of newly eligible adults enrolled through the ACA Medicaid expansion. States are reporting enrollment data, including counts of newly eligible adults, as part of the revised CMS federal match claiming forms (MBES data CMS-64 forms). A number of states have not been able to report enrollment data including California through the MBES data.3
Medicaid and CHIP Eligibility and Performance Indicators–
Applications, Transfers, and Renewals
1. Total Number of Medicaid and CHIP Applications Received in Previous Week2. Total Number of Medicaid and CHIP Applications Received in Previous Month3. Total Number of Medicaid and CHIP Applications Received through Transfers from Marketplace4. Total Number of Accounts up for Renewal
Determinations
5. Total Number of Individuals Determined Eligible for Medicaid or CHIP6. Total Number of Individuals Determined Ineligible for Medicaid or CHIP
Efficiency of Application Processing
7. Processing Time for Eligibility Determinations8 .Total Number of Applications and Redeterminations Pending a Determination
Enrollment
9. Total Enrollment
Call Center Operations
10. Total Call Center Volume11. Average Caller Wait Time12. Rate of Abandoned Calls
Appendices: Appendix B: Cms Enrollment Data By State
Appendix Table 1: Total Medicaid and CHIP Monthly Enrollment, Summer 2013 and January 2016
State
Implementing Medicaid Expansion?
Monthly AverageJuly – Sept. 2013
January 2016
Percent Change,Summer 2013and January 2016
United States
—
56,392,477
72,894,836
27%
Alabama
N
799,176
896,668
12%
Alaska
Y – September 2015
122,334
142,301
16%
Arizona
Y
1,201,770
1,670,422
39%
Arkansas
Y
556,851
850,426
53%
California
Y
7,755,381
12,259,866
58%
Colorado
Y
783,420
1,336,161
71%
Connecticut
Y
NR
756,725
NR
Delaware
Y
223,324
243,750
9%
District of Columbia
Y
235,786
265,548
13%
Florida
N
3,104,996
3,576,943
15%
Georgia
N
1,535,090
1,786,428
16%
Hawaii
Y
288,357
341,274
18%
Idaho
N
238,150
282,207
18%
Illinois
Y
2,626,943
3,143,856
20%
Indiana
Y – February 2016
1,120,674
1,450,637
29%
Iowa
Y
493,515
605,467
23%
Kansas
N
378,160
398,272
5%
Kentucky
Y
606,805
1,182,852
95%
Louisiana
Y – July 2016
1,019,787
1,074,896
5%
Maine
N
NR
279,528
NR
Maryland
Y
856,297
1,177,043
37%
Massachusetts
Y
1,296,359
1,682,675
30%
Michigan
Y – April 2014
1,912,009
2,339,419
22%
Minnesota
Y
873,040
1,087,569
25%
Mississippi
N
637,229
700,536
10%
Missouri
N
846,084
951,734
12%
Montana
Y – January 2016
148,974
208,754
40%
Nebraska
N
244,600
238,099
-3%
Nevada
Y
332,560
600,854
81%
New Hampshire
Y – July 2014
127,082
191,812
51%
New Jersey
Y
1,283,851
1,755,259
37%
New Mexico
Y
457,678
737,850
61%
New York
Y
5,678,417
6,446,670
14%
North Carolina
N
1,595,952
2,019,528
27%
North Dakota
Y
69,980
89,639
28%
Ohio
Y
2,341,481
2,911,402
24%
Oklahoma
N
790,051
789,536
0%
Oregon
Y
626,356
1,064,700
70%
Pennsylvania
Y – January 2016
2,386,046
2,785,001
17%
Rhode Island
Y
190,833
279,520
46%
South Carolina
N
889,744
939,344
6%
South Dakota
N
115,501
118,568
3%
Tennessee
N
1,244,516
1,580,851
27%
Texas
N
4,441,605
4,733,134
7%
Utah
N
294,029
313,733
7%
Vermont
Y
161,081
191,441
19%
Virginia
N
935,434
976,271
4%
Washington
Y
1,117,576
1,781,588
59%
West Virginia
Y
354,544
548,197
55%
Wisconsin
N
985,531
1,045,752
6%
Wyoming
N
67,518
64,130
-5%
# States Reporting:
—
49
51
49
NOTES: NR- Data not reported. All states that have adopted the Medicaid expansion did so in Jan 2014 unless otherwise noted in the table.SOURCE: CMS, Medicaid & CHIP: Monthly Application and Eligibility Reports, Oct 2013 – Jan 2016
Appendix Table 2: Total Medicaid and CHIP Child Enrollment, January and January 2016
State
Implementing Medicaid Expansion?
January 2014
January 2016
Percent Change,Jan 2014 – Jan 2016
Child Enrollment as Share of Total Enrollment, Jan 2016
United States
—
23,002,580
29,073,489
5%
54%
Alabama
N
572,891
640,576
12%
73%
Alaska
Y – September 2015
72,990
70,241
-4%
58%
Arizona
Y
NR
NR
NR
NR
Arkansas
Y
NR
432,691
NR
52%
California
Y
NR
NR
NR
NR
Colorado
Y
521,062
577,887
11%
48%
Connecticut
Y
NR
300,570
NR
41%
Delaware
Y
100,714
104,358
4%
44%
District of Columbia
Y
NR
NR
NR
NR
Florida
N
2,076,132
2,292,762
10%
67%
Georgia
N
NR
1,211,139
NR
70%
Hawaii
Y
143,899
136,205
-5%
43%
Idaho
N
181,082
200,356
11%
69%
Illinois
Y
NR
1,488,571
NR
48%
Indiana
Y – February 2016
696,562
712,412
2%
59%
Iowa
Y
NR
228,745
NR
45%
Kansas
N
NR
289,107
NR
71%
Kentucky
Y
527,034
475,918
-10%
43%
Louisiana
Y – July 2016
724,246
758,881
5%
72%
Maine
N
128,110
118,871
-7%
42%
Maryland
Y
567,867
585,518
3%
51%
Massachusetts
Y
583,723
633,077
8%
39%
Michigan
Y – April 2014
1,024,050
967,146
-6%
43%
Minnesota
Y
427,164
485,015
14%
47%
Mississippi
N
428,745
487,818
14%
69%
Missouri
N
509,173
545,594
7%
63%
Montana
Y – January 2016
108,019
102,923
-5%
62%
Nebraska
N
158,177
157,129
-1%
67%
Nevada
Y
NR
265,496
NR
49%
New Hampshire
Y – July 2014
87,055
92,289
6%
54%
New Jersey
Y
744,535
816,839
10%
49%
New Mexico
Y
NR
NR
NR
NR
New York
Y
2,320,379
2,366,899
2%
38%
North Carolina
N
1,126,665
1,256,336
12%
68%
North Dakota
Y
NR
39,900
NR
46%
Ohio
Y
1,162,668
1,282,648
10%
44%
Oklahoma
N
507,824
521,195
3%
64%
Oregon
Y
399,782
427,667
7%
41%
Pennsylvania
Y – January 2016
1,264,811
1,282,627
1%
51%
Rhode Island
Y
NR
110,321
NR
41%
South Carolina
N
578,153
653,584
13%
66%
South Dakota
N
78,165
80,097
2%
68%
Tennessee
N
NR
NR
NR
NR
Texas
N
3,245,861
3,429,655
6%
74%
Utah
N
232,107
205,744
-11%
70%
Vermont
Y
67,765
69,355
2%
39%
Virginia
N
648,786
660,836
2%
68%
Washington
Y
738,337
767,557
4%
47%
West Virginia
Y
203,216
207,363
2%
40%
Wisconsin
N
NR
488,890
NR
47%
Wyoming
N
44,831
44,681
0%
65%
# States Reporting:
—
36
46
36
46
NOTES: NR- Data not reported. Total growth in child enrollment for January 2014 and January 2016 is based on 36 states reporting data for January 2014 and January 2016.SOURCE: CMS, Medicaid & CHIP: Monthly Application and Eligibility Reports, Oct 2013 – Jan 2016
Connecticut does not report data for Summer 2013 or for February and April 2014; Maine does not report data for Summer 2013 and February through April 2014; North Dakota does not report data for February through June 2014; and Vermont does not report data for November 2014. Moreover, the number of states with the Medicaid expansion in effect changes over the time period, with Michigan moving from non-expansion to expansion status in April 2014, New Hampshire shifting to expansion status in July 2014 and Pennsylvania shifting to expansion status in January 2016. Additionally, Medicaid expansion coverage in Indiana became effective February 2016, after the reporting period. ↩︎
The House GOP health care plan released this week proposes a broad range of changes to Medicaid, including a “per capita cap” approach to program financing or a block grant, based on state choice. A new issue brief from the Kaiser Family Foundation provides an overview of how a per capita cap financing structure could work, including implications for the federal government, state governments, beneficiaries and health care providers.
In addition to explaining how a per capita cap approach differs from current law, the Foundation’s new brief examines Medicaid per capita cap provisions included in two other Republican proposals — the House Budget Resolution, and the Health Accessibility, Empowerment and Liberty Act of 2016 (the HAELA bill).
The House Republican Plan (“A Better Way”) released on June 22, 2016, includes a proposal to convert federal Medicaid financing from an open-ended entitlement to a per capita allotment or a block grant (based on a state choice).1 This proposal is part of a larger package designed to replace the Affordable Care Act (ACA) and reduce federal spending for health care. Often tied to deficit reduction, proposals to convert Medicaid’s financing structure to a per capita cap or block grant have been proposed before. Such changes represent a fundamental change in the financing structure of the program with major implications for beneficiaries, providers, states and localities. Key things to understand about a per capita cap include the following:
How a per capita cap works. Under a Medicaid per capita cap, the federal government would set a limit on how much to reimburse states per enrollee. Unlike a block grant approach, which provides a set amount of federal spending regardless of enrollment, payments to states would reflect changes in enrollment. A per capita cap model would not account for changes in the costs per enrollee beyond the growth limit. To achieve federal savings, the per capita growth amounts would be set below the projected rates of growth under current law.
Key design challenges. Key challenges in designing a per capita cap proposal include determining the base per enrollee amounts, setting the annual growth rates, and making decisions about new state flexibility versus maintaining federal core requirements and state accountability.
Implications of a per capita cap. A per capita cap could control federal outlays while giving states additional flexibility and budget predictability. Implementing a per capita cap could be administratively difficult and could maintain current inequities in per enrollee costs across states. Pre-set growth rates cannot easily account for changes in costs of medical services, patient acuity or epidemics. If costs are above per enrollee amounts, costs could be shifted to states, providers and beneficiaries. States may have incentives to reduce Medicaid payment rates and restrict benefits; with changes in federal law, states could also restrict eligibility for high-cost enrollees and shift costs to beneficiaries through premiums or cost sharing.
Looking ahead, per capita cap proposals are likely to be debated in Congress and as part of the elections in the context of broader health care changes as well as deficit reduction.
Issue Brief
Introduction
Medicaid is administered by states within the parameters of federal rules, but financing is shared by states and the federal government. Federal Medicaid financing for states is open-ended, with the federal government matching state spending according to a pre-determined formula. This structure has resulted in significant variation across state Medicaid programs and has been the source of tensions over the balance between federal standards and state flexibility and over Medicaid costs and financing. Over time, some have proposed Medicaid reforms, often tied to broader deficit reduction efforts, that would alter this structure, For example, Congress has debated proposals to eliminate the Medicaid matching structure and limit federal spending through a block grant or through per capita or beneficiary caps. Such changes represent a fundamental change in the financing structure of the program that would have major implications for beneficiaries, providers, states and localities.
Congress is again focused on options to reform Medicaid financing to achieve federal savings. In response to a request by congressional committee chairs with interest in Medicaid, the Medicaid and CHIP Payment and Access Commission (MACPAC) released a report to analyze and evaluate Medicaid financing reforms that would reduce federal and state outlays. In response to a request by the ranking members of these committees, the report also assess the effects of financing reforms on states, enrollees, providers, and plans.2
In addition, in June 2016, the House Republicans put forth a proposal to convert Medicaid to a per capita cap or a block grant. The House Budget Resolution released in spring 2016 as well as legislation (the Health Accessibility, Empowerment and Liberty Act of 2016 or HAELA) put forth by Congressman Pete Sessions (R-Texas) and Senator Bill Cassidy (R-Louisiana) also include variations of a Medicaid per capita cap.
This fact sheet examines five key questions:
What are the Medicaid financing and eligibility rules under current law?
What is a per capita cap?
What are key challenges in designing a per capita cap?
What are the key provisions in the current proposals?
What are the implications of a per capita cap?
What are the Medicaid financing rules under current law?
Under current law, Medicaid provides a guarantee to states for federal matching payments with no pre-set limit. The federal share of Medicaid is determined by a formula set in statute that is based on a state’s per capita income. The formula is designed so that the federal government pays a larger share of program costs in poorer states. The federal share (FMAP) varies by state from a floor of 50% to a high of 74% in 2016, and states may receive higher FMAPs for certain services or populations. In 2014, the federal government paid about 60% of total Medicaid costs with the states paying 40%.3 Each quarter, states report their Medicaid costs (for qualified beneficiaries and services) to the federal government, and the federal government matches those costs at the state’s matching rate.
To participate in Medicaid and receive federal matching dollars, states meet core federal requirements. States must provide certain core benefits (e.g. hospital and physician and nursing home services) to core populations (e.g. poor pregnant women and children) without imposing waiting list or caps. States may also receive federal matching funds to cover “optional” services (e.g., adult dental care) or “optional” groups (e.g., elderly with high medical expenses). States also have discretion as to how to purchase covered services (e.g., fee-for-service or managed care) and the amounts they pay providers. Based on program flexibility, spending per Medicaid enrollee varies significantly across eligibility groups and states.4
What is a Medicaid per capita cap?
Under a Medicaid per capita cap, the federal government would set a limit on how much to reimburse states per enrollee. Under this model, a per-beneficiary federal cap (either total or by population group) would be determined for a base year. Each year, the per enrollee cap would be adjusted annually based on a federally-determined growth limit. A state’s total federal Medicaid funding limit for each subsequent year would be determined by multiplying the base year per capita amount, the growth limit percentage, and enrollment. To achieve federal savings, the per capita growth amounts would be set below the projected rates of growth under current law.
Payments to states would reflect changes in enrollment but not changes in the costs per enrollee beyond the growth limit. For example, should Medicaid enrollment increase due to tough economic times, as was seen in the Great Recession, the payments to states would be higher; however if enrollment declines, the federal payments to states would be lower. Details about state matching requirements are not clear in current proposals. State matching dollars could be required to draw down federal dollars up to the per capita cap, but after reaching the cap, states could be responsible for additional costs. Health care costs of the population, including changes due to an increase in the prevalence of chronic disease or new technology would not be factored into the payments for states.
Table 1 compares key Medicaid program elements under current law and a per capita cap.
Table 1: Current Medicaid Program Financing Compared to Per Capita Cap Financing
Current Program
Per Capita Cap
Entitlement to Coverage
Federal core coverage requirements for children to 133% FPL, pregnant women to 133% FPL, parents to old welfare standards, and elderly and people with disabilities tied to Supplemental Security Income or 75% FPL
ACA coverage to nearly all adults up to 138% FPL
State options to provide coverage above core requirements
Guaranteed coverage for all eligible, no waiting list or caps
Federal core requirements could be changed from current law; instead of core requirements, federal government could impose lower and upper limits for eligibility
ACA could be repealed
States could have options on eligibility but may not be able to access federal matching dollars for coverage beyond upper limits
Assumes that once eligibility limits are established, no waiting lists or caps
State / Federal Funding
Federal funds based on FMAP formula in the law (floor of 50% to a high of 74% in 2016). Enhanced matching for newly eligible under the ACA and for some specific services
Guaranteed to match state spending with no cap
Adjusts to changes in program needs, costs and enrollment
Federal share of payments would be capped with pre-set amount per enrollee (total or by population group)
Unclear about requirements for state matching dollars
States may incur costs beyond those covered by federal per enrollee payments
Adjusts for changes in enrollment
Funding typically indexed to pre-set growth amount that does not account for changing program needs or costs
What are key challenges in designing a per capita cap?
The key design questions and challenges in developing a per capita cap proposal are tied to decisions about methodology used to calculate the base spending per enrollee, the allowable growth rate for spending per enrollee, and what federal core requirements could be changed.
Setting the Base Spending Per Enrollee. Determining the base spending per enrollee in a per capita model would involve a number of decisions. Policy makers may include or exclude certain Medicaid payments (such as disproportionate share hospital payments (DSH) or Medicare premium amounts) and may include or exclude “partial benefit” enrollees (those who may be eligible for limited benefits such as family planning or home and community-based services only).
Per capita caps could be based on per enrollee spending for each state or nationally; similarly, there could be one per enrollee spending base or separate base amounts for each eligibility group. If the cap were to use a historical spending per enrollee by state as the base, states effectively would be locked into their policy choices, and inequalities between the different Medicaid programs would become permanent. On the other hand, implementing a uniform per capita cap across states would likely result in large changes in the distribution of funds across states. Some proposals may include provisions to attempt to address these issues.
Based on current flexibility in the Medicaid program, there is considerable variation in per enrollee costs across eligibility groups and across states. Total spending per full benefit enrollee ranged from a low of $4,010 in Nevada to $11,091 in Massachusetts in FY 2011.5 (Figure 1) Spending for the elderly and individuals with disabilities may be more than four times the spending for an adult and more than seven times spending for an average child covered by the program.6 (Figure 2) In addition, even within a given state and eligibility group, per enrollee costs may vary significantly, particularly for individuals with disabilities.
Figure 1: Spending per full-benefit Medicaid enrollee, FY 2011Figure 2: Average per capita Medicaid spending varies widely across eligibility groups and states, FY 2011
Currently, the latest administrative data to examine per enrollee spending in Medicaid is from FY 2011. Reliable data to determine the base per enrollee spending may be significantly lagged.
Growth Rates. To achieve federal savings, most proposals for a per capita cap set the amount of growth in per enrollee spending below current projections. Research shows Medicaid spending growth primarily has been driven by rising Medicaid enrollment. Spending growth per enrollee in Medicaid has been low compared to other payers: in particular, Medicaid per enrollee costs have been lower than private insurance.7 (Figure 3) Applying uniform growth rates across states in per enrollee spending could have different implications across states since per enrollee growth varies widely by state. Some proposals may tie per enrollee caps to gross domestic product (GDP) or inflation. GDP is a broad measure of national economic activity; therefore, during economic downturns, GDP may grow slowly or not at all. Looking back over the 2000-2011 period shows a wide range in growth rates across states and eligibility groups. (Figure 4)
Figure 3: Average annual spending varies across Medicaid and other benchmarks, 2000-2011Figure 4: Growth in Medicaid spending varies widely across eligibility groups and states
Core Requirements. Medicaid financing reform proposals are often tied to changes in core requirements for Medicaid, which could give states additional flexibility. Proposals may include changes to minimum standards for eligibility or benefits. In addition, proposals could set maximum eligibility or benefits wherein the federal government would not reimburse for coverage or benefits beyond those specified in the law (compared to current law where states have the option to provide coverage and benefits beyond core requirements and still receive federal match). Key questions arise over the requirements for state spending and how states would be held accountable for use of federal Medicaid funds.
What are key provisions in the current proposals?
As noted above, current proposals that include a Medicaid per capita cap are the House Republican Plan, the House Budget Resolution8 and HEALA.9
House Republican Plan. The House Republican Plan would transition current Medicaid financing to a per capita allotment (or states could choose a block grant option). Beginning in 2019, states would receive a federal allotment that would be based on the product of the state’s per capita allotment for the four major beneficiary categories—aged, blind and disabled, children, and adults—and the number of enrollees in each of those four categories. The allotments would be determined based on each states’ total Medicaid spending for each group for full-year enrollees in 2016, adjusted for inflation. Similar to CHIP, states would draw down federal dollars up to the allotment based on the traditional FMAP rules. Payments including DSH and graduate medical education would be excluded from the allotments. State decisions to expand Medicaid under the ACA would be locked-in as of January 1, 2016.
States that have already expanded Medicaid under the ACA would be able to retain those dollars, but would be given flexibility to shift dollars to other populations. The enhanced FMAP for the expansion population would be phased down to match the states’ traditional match rate. States could transition “able-bodied” adults from Medicaid into commercial coverage with a tax credit or employment-based coverage. The plan would maintain the CHIP program but revert back to the original enhanced match rates in place prior to the ACA. The plan specifies new options for states to impose premiums and work requirements. The plan would also allow states to impose waiting lists and limited benefit plans for eligibility groups that are not mandatory coverage groups. The plan would also allow states to limit participation of entities or persons who perform elective abortions.
States that opt for a block grant would receive a set amount of funds to finance their programs determined by a base year (assuming those enrolled in the new expansion group are enrolled in other coverage types). States would be required to provide coverage to elderly and disabled individuals who are described as mandatory populations under current law.
While designed to reduce federal spending, the House Republican plan does not specify any set budget targets.
House Budget Resolution. The House Budget Resolution would allow states to choose between a block grant and a per capita cap option in place of the current Medicaid financing. Under the per capita cap option, per enrollee spending amounts would be set for the four eligibility groups (elderly, the blind and individuals with disabilities, nondisabled adults, and children). A per-person payment amount would be established to account for the average cost of care, per enrollee, in each of these four principal categories, and would be indexed to a predetermined growth rate. The Federal government would then provide Medicaid funds to the States based on the total number of enrollees in each category. It is not specified if the per enrollee amounts would vary across states and what the growth rate would be. Overall, the House proposal seeks to achieve $3 trillion in savings from the repeal of the Affordable Care Act (ACA) and the Medicaid financing reforms.
HAELA Bill. The HAELA bill is proposed legislation and therefore has more details than the budget resolution about how the per capita proposal would be implemented. The legislation specifies four enrollee categories (elderly, blind or disabled, children (to age 21) and adults. Per beneficiary amounts would be set for each category for each state and increased by inflation in the first year, then by projected changes in gross domestic product plus one percentage point. In years 4 through 10, the proposal would transition states to a corridor around a national average per enrollee amount by allowing for higher growth for low spending states and lower growth for high spending states for each category. Federal payments would be limited to cover only expenditures for individuals up to 100% FPL. The federal government would pay the higher of 75% or the traditional FMAP. Certain Medicaid payments including Medicare premium payments and vaccines for children would not be part of the per beneficiary amount but would be reimbursed separately according to existing law. The legislation also includes an option to have states receive federal funds to cover all Medicare services for duals. The proposal creates early chronic care bonus payments for states of up to $1 billion per year).
What are the implications of a per capita cap?
A per capita cap could control federal outlays while giving states additional flexibility and budget predictability. The motivation of per capita cap proposals is often tied to deficit reduction and limiting federal Medicaid spending over time. The amount of federal savings as well as the implications for states, providers and beneficiaries would be largely affected by federal savings targets that may drive decisions about allowable growth rates. Proponents argue that these proposals could be combined with changes in the law to grant states additional flexibility. Unlike a block grant approach, a per capita cap does adjust for changes in enrollment.
Implementing a per capita cap could be administratively difficult and could maintain current inequities in per enrollee costs across states. A key issue in implementing a per capita cap would be determining the base per enrollee costs. As noted above, this is challenging because national Medicaid administrative data is currently severely lagged; the most current data available is for FY 2011. In addition, data show enormous variation across states in per enrollee spending. Per capita cap proposals could lock-in these inequities based on previous policy choices; alternatively, moving to a more uniform per enrollee amount could result in large shifts in federal financing across states.
Pre-set growth rates cannot account for changes in costs of medical services, patient acuity or epidemics. Unlike Medicaid’s current financing structure, the per capita cap does not easily account for changes in costs related to advances in medical technology, increases in costs of prescription drugs, the continued aging of the population, and the increased prevalence of chronic conditions. All of these changes could increase treatment costs beyond what might be accounted for in a per capita growth rate. Costs associated with natural disasters and epidemics, like HIV/AIDS, also could not be factored into pre-determined per capita cap amounts.
If federal Medicaid payments are limited, costs could be shifted to states, providers or beneficiaries. While some states may increase state spending or achieve some program efficiencies to offset reduced federal payments, states also may consider options to reduce spending.
States may have incentives to reduce Medicaid payment rates and restrict benefits. Given state requirements to balance their budgets (and resulting difficulty in increasing state spending in a given year), states may seek to restrict Medicaid spending to operate their programs within federal caps. Lower payment levels in Medicaid have contributed to its relatively low costs.10 During economic downturns, states are likely to further restrict provider rates.11 Low reimbursement rates can contribute to issues around access to care and provider participation. In addition, states have a great deal of flexibility to design benefit packages. Similar to provider rates, states often restrict benefits during tight budget times. While a per capita cap may create additional incentives to increase efficiency, because states pay for a share of the program under current law there already are incentives to control costs. States have also focused on efforts to control pharmacy costs, implement delivery and payment reforms and rebalance the delivery of long-term services from institutional to more community-based care to control costs and better deliver care. Many payment and delivery system reforms often involve upfront investments to potential gain out year benefits. Limited federal financing could hinder these reforms.
New flexibility could result in eligibility restrictions and cost shifts to beneficiaries. As noted above, a per capita cap proposal could also come with changes to federal core requirements or additional flexibility for states. If federal eligibility rules were changed, states could have incentives to restrict eligibility or make it more difficult for high-cost individuals with more complex needs to enroll. Without the ACA requirements to streamline enrollment, states could also impose barriers that would limit enrollment. Other changes in federal law could allow states to impose premiums or monthly fees on beneficiaries. Research shows that this has a negative effect on enrollment and access to care for low-income beneficiaries.12 The House Republican plan specifies that states would have options to impose premiums and work requirements and to provide limited benefits, waiting lists and premiums for non-mandatory populations.
Looking Ahead
Moving to a per capita cap would be a major transformation to how Medicaid financing works. Proponents of per capita cap proposals argue that this structure could reduce federal spending and promote flexibility for states. However, such policies may be difficult to implement and may result in cost shifts to states if pre-determined growth rates are lower than expected program spending. Pre-set growth rates cannot account for changes in medical costs or health care epidemics or emergencies. With limited federal financing states may turn to restrictions in provider rates and benefits, and with changes to federal requirements states could impose eligibility restrictions or policies to shift costs to beneficiaries. Per capita cap proposals are likely to be debated in Congress and as part of the elections in the context of broader health care changes as well as deficit reduction.
Medicaid is the nation’s primary public health insurance program covering over 70 million Americans with low incomes. Each year, states make a range of policy changes to Medicaid to comply with new federal rules and to address an array of policy goals. Medicaid programs also operate within state budgets, requiring a constant focus on cost control that is heightened during economic downturns. For 15 years, the Kaiser Commission on Medicaid and the Uninsured (KCMU) and Health Management Associates (HMA) have conducted annual surveys of Medicaid programs across the country. The National Association of Medicaid Directors (NAMD) has formally collaborated on this project since 2014. A look back at this work shows three key findings:
Economic changes have significant effects on Medicaid programs. During economic downturns, program spending and enrollment rise as demand for Medicaid coverage increases and declines in state revenue growth slows result in additional pressure to control costs. States often turn to provider rate cuts and benefit restrictions to control Medicaid spending. Federal fiscal support during the last recession helped states mitigate some program cuts; maintenance of eligibility provisions helped protect eligibility as demand peaked.
States have generally moved to expand Medicaid eligibility and streamline enrollment processes over time. Even before the Affordable Care Act (ACA), several states implemented coverage expansions through demonstration waivers as well as enrollment simplifications, which helped states reduce the uninsured and later became the foundation for coverage expansions under the ACA. Over time, states have also adopted more targeted expansions, some as a result to changes in federal law. Federal fiscal relief during the last recession was tied to Maintenance of Eligibility requirements that were extended under the ACA. The ACA expanded Medicaid to nearly all non-elderly adults with income at or below 138% of the federal poverty level (FPL) with 100% federal funding through 2016 phasing down to 90% in 2020 and beyond. The Supreme Court ruling on the ACA in June 2012 effectively made the Medicaid expansion optional for states; to date 32 states including the District of Columbia have adopted the expansion. In addition, the ACA required all states to simplify, modernize and coordinate their enrollment processes.
Medicaid is a dynamic program, with states constantly implementing initiatives to transform how care is delivered and to increase value. Over time, there has been a dramatic shift in how care is delivered from primarily fee-for-service systems to predominantly managed care. States continue to expand the use of managed care as well as implement a range of emerging payment and delivery system reforms. The ACA also provided new options to better coordinate care for high need populations, to better integrate physical and behavioral health and to help states rebalance their long-term care programs in favor of community-based services and supports. In addition, states have focused on efforts to control pharmacy costs.
This brief provides a look back at the enrollment and spending trends as well as the multitude of policy actions taken by states across key areas: eligibility and application processes; provider rates and taxes; benefits, pharmacy and long-term care since as well as highlighting more recent data on managed care and delivery system reforms collected as part of this annual survey. Looking ahead, the survey will continue to capture the evolution of the Medicaid program with a focus program changes during economic cycles as well as innovations in payment and delivery system reform.
Introduction
Medicaid is the nation’s primary public health insurance program for people with low incomes covering over 70 million Americans. The Medicaid program is jointly-funded by states and the federal government; the federal government guarantees matching funds to states for qualifying Medicaid expenditures. States are guaranteed at least $1 in federal matching funds for every $1 they spend of their own funds on the program with poorer states receiving more. (For more on Medicaid financing and its role in state budgets, see this resource.) Participation in Medicaid in voluntary, but states that participate must design and administer their own Medicaid programs within federal requirements. Within these parameters, states can choose to cover optional groups and benefits and have substantial discretion to determine how care is delivered as well as how and how much providers are paid. Medicaid programs have also continued to evolve over time, responding to new options made available through federal law, new technology and changes in the health care marketplace.
States have responded to program options in different ways, reflecting wide variation across states in their health care marketplace, culture, traditions, priorities and fiscal capacity, and as a result program variation across the states is significant. To help capture these changes, the Kaiser Commission on Medicaid and the Uninsured and Health Management Associates have conducted annual in-depth surveys for the past 15 years of changes taking place in Medicaid programs across the country. While the survey has changed over time to capture emerging policy issues, the reports have consistently captured information about Medicaid in five key areas:
Spending and enrollment,
Eligibility and application/renewal processes;
Benefits including pharmacy and long-term care;
Provider rates and taxes/fees; and more recently
Managed care and other payment and delivery system reform efforts.
This brief reviews trends across different policy areas and highlights where federal changes imposed new requirements. Because all states have to comply with new requirements (like the ACA enrollment simplifications) these changes are not counted as state policy actions.
Additional detail is included in the Appendix; state level data can be accessed in the following data collection.
Background
State Medicaid programs are affected by a changes in economic conditions and federal policy among other factors. During the period of this survey, two factors in particular have had widespread effects – the Great Recession and the Affordable Care Act.
During the Great Recession, states faced historic declines in state tax revenue. (Exhibit 1) In response, Congress has twice passed temporary increases to the FMAP rates to help support states during economic downturns, most recently in 2009 as part of the American Recovery and Reinvestment Act (ARRA.) The ARRA-enhanced match rates was the largest source of federal fiscal relief to states, providing over $100 billion in additional federal funds over 11 quarters, ending in June 2011.1 Event with this fiscal relief, the effects of the recession on state budgets and Medicaid programs lingered long after the recession was officially over.
Exhibit 1: States have experienced historic declines in tax revenue during the Great Recession and have slowly improved.
The Affordable Care Act (ACA) made several changes to the Medicaid program. Some of the most significant changes related to eligibility and application/renewal policy. Specifically, the ACA expanded Medicaid eligibility to nearly all non-elderly adults with income at or below 138% of the federal poverty level (FPL) – about $16,245 for an individual in 2015. This expansion established a new coverage pathway for millions of uninsured adults who were previously excluded from Medicaid, beginning January 1, 2014. The law also provided for 100% federal funding of the expansion through 2016, with the federal match rate declining gradually from 95% in 2017, 94% in 2018, 93% in 2019 and 90% in 2020 and all future years. However, the Supreme Court ruling on the ACA in June 2012 effectively made the Medicaid expansion optional for states. The ACA required all states to make changes to streamline and simplify the enrollment process, providing no wrong door to coverage between Medicaid, CHIP and the Marketplace that represent historic change for the program. The ACA also provided new options and resources to support state efforts in delivery system and payment reform as well as serve more people in the community-based settings rather than in institutions.
Issue Brief: Section 1: Medicaid Spending And Enrollment Trends
Medicaid is a countercyclical program; Medicaid spending and enrollment growth patterns generally follow the economic cycles. Over the past 15 years, Medicaid enrollment increased substantially during two major recessions, reflecting the countercyclical nature of the program. During economic downturns, when individuals lose their jobs and incomes decline, more people qualify and enroll in Medicaid, which in turn drives increases in total Medicaid spending. As economic conditions improve, Medicaid enrollment growth slows in the absence of other policy changes. This held true in recent years for Medicaid spending and enrollment growth – spending and enrollment growth peaked in SFY 2002 (during an economic downturn), slowed in SFYs 2006 and 2007, and then peaked again in SFY 2009 during the Great Recession. As economic conditions improved, Medicaid enrollment and spending slowed in SFY 2011 through SFY 2013.2
The Medicaid program is jointly funded by states and the federal government; the federal government guarantees matching funds to states for qualifying Medicaid expenditures. In 2016, the federal match rate ranged from a floor of 50% to 74% with poorer states receiving a higher match rate. Because of this structure, total spending growth and state spending on Medicaid tends to grow at similar rates. Exceptions occur when there are changes in federal law that affect matching rates. For example, the magnitude of the federal fiscal relief in ARRA resulted in historic declines in state spending for Medicaid in 2009 and 2010. However, the expiration of this relief resulted in higher state Medicaid spending growth in SFY 2012 compared to growth in federal Medicaid spending. More recently, the change in the Medicaid match rate tied to the ACA Medicaid expansion has resulted in a divergence in growth rates for total and state Medicaid spending.
Implementation of the major ACA coverage expansions resulted in sharp increases in Medicaid enrollment in SFY 2014 and 2015. A second driver of Medicaid spending and enrollment trends is policy changes. Medicaid enrollment increased substantially in SFY 2014 and SFY 2015 as the major ACA coverage expansion went into effect. While virtually all states saw enrollment growth, differential effects occurred across states that adopted the Medicaid expansion and those that did not. Medicaid enrollment growth in expansion states far exceeded growth in non-expansion states. Across the 29 states that had expanded3 in SFY 2015, enrollment increased on average by 18 percent, driven by enrollment among adults qualifying under expansion which were fully federally funded. For SFY 2016, enrollment growth was projected to slow across all states, driven by projected slower growth in expansion states.
State spending on Medicaid grew at a much slower rate than total Medicaid spending driven by the influx of federal dollars for the ACA Medicaid expansion.
Total Medicaid spending grew in tandem with enrollment growth, increasing substantially in expansion states. However, state spending grew at a much slower rate than total spending in expansion states due to the higher match rate for the expansion population. For states that expand Medicaid, the federal government pays 100 percent of Medicaid costs of those newly eligible under the Medicaid expansion for calendar years 2014-2016. The federal share gradually phases down to 90 percent in 2020 and thereafter, well above traditional FMAP rates. In contrast, non-expansion states saw total spending and state spending grow in tandem.
Issue Brief: Section 2: Eligibility And Application/renewals
While required to cover core groups of enrollees, states have the flexibility to cover additional groups. The federal core minimum eligibility standards have expanded incrementally over time, mostly for children and pregnant women, as the Medicaid program separated from welfare. Moreover, many states have utilized the flexibility to extend eligibility to additional groups including children and individuals in need of nursing home care. Given this flexibility there is variation in eligibility levels across states. Federal policy changes have also had a significant effect on state activity in terms of eligibility standards and application and renewal processes – such as the Maintenance of Eligibility, options made available under CHIPRA as well as the ACA.
Over the course of the past decade, states have made a number of eligibility expansions.
Some states implemented broad coverage expansions prior to the data tracking in this survey like Arizona, Hawaii, Massachusetts, New York, Oregon and Vermont. A number of states implemented more limited coverage expansions during our survey tracking through demonstration waivers including Illinois, Iowa, Indiana, Oklahoma, Maine Maryland, Utah and Wisconsin. These coverage initiatives helped to address state priorities to reduce the uninsured and later became the foundation for coverage expansions under the ACA. In addition, some states implemented more targeted eligibility expansions such as reductions or eliminations of asset tests, adoption of options for the working disabled (such as TWIIAA), as well as expanding coverage those aging out of foster care. Other expansions stemmed from new options under the Children’s Health Insurance Program Reauthorization Act (CHIPRA) and the ACA, such as those listed below.
Following CHIPRA, a number of states adopted federal options to expand coverage to pregnant women and children subject to the five-year bar.
ACA allowed seven states (Connecticut, District of Columbia, California, Colorado, Minnesota, New Jersey and Washington) to implement early expansions either through state plan amendments or through Section 1115 waivers ahead of the ACA Medicaid expansion in SFY 2014.
The number of states reporting eligibility standard expansions spiked in SFY 2014 as 26 states adopted the Medicaid expansion, increasing income eligibility for adults up to 138% FPL. New Hampshire, Pennsylvania and Indiana adopted the expansion in SFY 2015 and Alaska and Montana adopted in SFY 2016.4 As of 2016, 32 states (including DC) have adopted the expansion. 52
States have also implemented an array of simplifications to the application and renewal process. These efforts have included implementing or expanding the use of online applications, allowing individuals to self-declare their income, increasing the amount of time between redeterminations from 6 months to 12 months, removing face-to-face requirements and working with other agencies to share data. New options and requirements related to enrollment processes were included in CHIPRA and the ACA.
Enrollment options made available under CHIPRA included electronic data matching with the SSA to verify citizenship (instead of asking for paper documentation) and express lane eligibility (allowing states to enroll or renew children’s coverage by relying on information from other public programs like TANF or SNAP.)6
All states were required to streamline and simplify the enrollment process beginning in 2014. These changes include: a transition to the use of Modified Adjusted Gross Income (MAGI) to determine financial eligibility for children, pregnant women, parents and low-income adults; elimination of the asset limits for these same groups, and development of streamlined application, enrollment, and renewal processes coordinated across Medicaid and other health programs.7
Protections put in place during the recession and continued with the ACA prevented states from making restrictions eligibility and enrollment processes.
Prior to ARRA, eligibility and enrollment procedures have also been used by states as cost control measures. In the years leading up to the Great Recession, a few states made notable restrictions to eligibility standards, such as:
Tennessee restricted eligibility in its waiver in SFY 2006 resulting in the elimination of coverage for 171,000 adults following other eligibility reductions and freezes implemented in SFYs 2003 and 2005.
Missouri reduced eligibility standards across groups (adults, aged and disabled) in SFY 2006. Most notable restriction was reducing the income eligibility level for low-income parents from 75% FPL to AFDC income level (about 23% FPL) affecting 46,000 adults.
Florida eliminated full-benefit Medicaid coverage for 70,000 Medicare beneficiaries in the optional Medicaid for Aged or Disabled program in SFY 2006. A waiver program was created to cover individuals in the MEDS-AD program who were not eligible for Medicare.
Washington eliminated 12-month continuous eligibility affecting 350,000 children in SFY 2004. (Reinstated in SFY 2006)
Some states also reported changes to the application and renewal processes that made it more difficult for beneficiaries to enroll and renew coverage (e.g. instituting face-to-face requirements, increasing documentation requirements, requiring more frequent redeterminations, etc.)
However, Maintenance of Eligibility (MOE) provisions were established under ARRA that prohibited states from making cuts to eligibility standards or imposing more restrictive enrollment and renewal processes than those in effect July 1, 2008. The MOE provisions were extended under the ACA. States generally could not make restrictive changes to eligibility standards or enrollment procedures for adults until January 1, 2014 and MOE provisions are in effect for children through 2019. Therefore, only a few states (largely those with waiver renewals) reported eligibility or enrollment restrictions during this period.
Maintenance of Eligibility Requirements
As a condition of accepting additional federal fiscal relief through the ARRA, states were required to ensure that the eligibility standards, methodologies, or procedures under its Medicaid State Plan as well as under any waivers or demonstration programs were not more restrictive than those in effect on July 1, 2008. The ARRA enhanced funding and MOE requirements expired on June 30, 2011, but the ACA extended the ARRA MOE provisions. For adults, these provisions were extended through 2014 (when Marketplaces became operational) and for children through October 2019. Because of the link between eligibility for Medicaid LTC services and Medicaid eligibility generally, states were prevented from making some long-term care changes such as reducing occupied HCBS waiver capacity.8 Exceptions to the MOE requirements included: States were not required to renew waiver coverage that was expiring (Arizona in SFY 2011); and states could restrict eligibility for non-pregnant, non-disabled adults with incomes that exceed 133 percent of the federal poverty level if the state certified that they projected a budget shortfall (Hawaii, Illinois, Maine, Minnesota and Wisconsin in SFY 2013).
Issue Brief: Section 3: Benefits, Pharmacy And Long Term Care
As a condition of participation in the Medicaid program, states are required to provide a core set of “mandatory” benefits, but states have a great deal of flexibility in determining what optional benefits to cover as well as the amount, duration and scope of benefits covered under the program. Children generally have access to a broader benefit package due to EPSDT (early periodic screening diagnostic and treatment) requirements, but Medicaid benefits can vary widely for adults covered under the program. One optional benefit for adults that all states have elected to cover is pharmacy. States have developed extensive programs to manage this benefit and continue to further refine their policies over time. Another area of focus for state Medicaid programs is long-term care. Medicaid is the nation’s primary payer for long-term services and supports (LTSS) covering a continuum of services ranging from home and community-based services (HCBS) to institutional care provided in nursing facilities. LTSS represents about one-third of Medicaid spending and balancing institutional and community-based care is an important focus for state policymakers.9
Benefits
Benefit actions are influenced by economic trends; more states adopt restrictions during downturns and expand or restore benefits as conditions improve. During the Great Recession and its aftermath, the number of states reporting at least one benefit restriction increased, particularly in SFYs 2010 and 2011.
However, as economic conditions improved, more states reported benefit restorations and expansions than restrictions.
Changes to dental coverage as well as other optional benefits are particularly affected by economic conditions. For example, 16 states restricted or eliminated adult dental coverage in SFY 2003 and SFY 2004; nine of those states restored at least partial dental coverage the following years. During the Great Recession, 19 states reported dental restrictions in SFY 2010 through SFY 2012; eight of these states then reported some restorations in SFY 2013 – SFY 2016.
A number of states have added or expanded behavioral health benefits in recent years.10 Since 2012, half of states (25) have added or expanded behavioral health services. This includes actions to expand mental health services and or substance abuse services.
Pharmacy
Pharmacy cost-containment has always been a focus of state Medicaid programs, but intensified in response to changes in federal law and industry trends. From 2003-2005, nearly every state implemented policies designed to slow the growth in Medicaid spending for prescription drugs. In January 2006, the implementation of the Medicare prescription drug benefit reduced total state Medicaid drug expenditures by almost half. At the same time, the rate of growth in the cost of prescription drugs abated and the intense Medicaid focus on pharmacy cost containment began to diminish. Since 2015, however, a combination of rising drug prices, particularly for specialty drugs, and increasing enrollments (as a result of ACA coverage expansions) have refocused state attention on pharmacy reimbursement and coverage policies.
The majority of states have had preferred drug lists and supplemental rebates in place since SFY 2007. Fewer states have implemented limits on the number of prescriptions. Changes to these traditional tools increased in the years leading up to the Medicare prescription drug benefit (Part D) and during the Great Recession. As Medicaid pharmacy programs have matured and the economy has improved, fewer states have made changes to these traditional tools.
Long Term Care
States have steadily expanded community-based long-term care options over time. Each year over the past decade, more than half of states have reported HCBS expansions to serve more people in the community. The number of states reporting HCBS expansions increased leading up to the Great Recession and declined slightly during the Great Recession and immediately afterward. As economic conditions improved, the number of states reporting community-based expansions has increased; nearly all states reported expansions in SFY 2015 and planned such action for SFY 2016.
The most common policy action to expand the number of people served in the community was through HCBS waivers and state plan amendments (SPA).6 Examples include expanding the number of slots available in existing 1915(c) waivers, establishing new waivers, reducing waiting lists. In recent years, states have also expanded the number of people served through 1915(i) SPAs. States have also used PACE11 expansions as a tool to expand the number served in the community; state PACE activity has picked up in recent years.
More states are building balancing incentives into managed care contracts as states increasingly adopt MLTSS. 6 The number of states with managed long-term services and supports (MLTSS) programs has increased in recent years. By 2012, nearly a third of states operated an MLTSS program.12 As part of MLTSS contracts, states have increasingly built into their MLTSS programs with an expectation of increasing beneficiary access to HCBS in lieu of institutional care.
A few states each year have also expanded the services available under HCBS waivers and through HCBS-related state plan benefits. 6 In addition to serving more people in the community, states can expand the services offered under HCBS waivers or enhance or add state plan services such as personal care, home health and private duty nursing. While not an area of intense activity, a few states each year have added or expanded these services.13
States have also been taking advantage of options created or expanded by the ACA.
In addition to the major coverage expansions, the ACA created and expanded states with additional options to expand the number of beneficiaries served in the community. These include the 1915(i) SPA, as described earlier, was expanded and altered by the ACA as well as the Balancing Incentives Program (BIP) and the Community First Choice (CFC) option.
HCBS State Plan. Twelve states had at least 1 1915(i) SPA in place in SFY 2014 while 4 states (including 2 states that already had implemented a 1915(i) SPA) reported adopting a 1915(i) SPA in SFY 2015. An additional 5 states reported plans to add a 1915(i) SPA in SFY 2016.14
Balancing Incentives Program (BIP). As of October 2015, 21 states had applications approved under the program.15 The program expired in September 2015.
Community First Choices (CFC). Four states had adopted the CFC option in SFY 2014; 2 states adopted the option in SFY 2015. Four states reported plans to adopt the option in SFY 2016.16
ACA LTSS Options
HCBS State Plan (1915(i)). This option allows states to offer HCBS through a Medicaid SPA rather than through a Section 1915(c) waiver. As a result of changes made in the ACA, income eligibility for this option was extended up to 300 percent of the maximum SSI federal benefit rate and states were permitted to target benefits to specific populations and offer the same range of HCBS under Section 1915(i) as are available under Section 1915(c) waivers. Unlike Section 1915(c) waivers, however, states are not permitted to cap enrollment or maintain a waiting list and, if offered, the benefit must be available statewide. If enrollment exceeds the state’s projections, the state may tighten their Section 1915(i) needs-based eligibility criteria, subject to advance notice and grandfathering of existing beneficiaries.=Balancing Incentives Program. Beginning in October 2011, BIP made enhanced Medicaid matching funds available to certain states that meet requirements for expanding the share of LTSS spending for HCBS (and reducing the share of LTSS spending for institutional services). Funding was available through September 2015. To qualify, states must have devoted less than 50 percent of their LTSS spending to HCBS in FFY 2009, develop a “no wrong door/single entry point” system for all LTSS, create conflict-free case management services, and develop core standardized assessment instruments to determine eligibility for non-institutionally based LTSS.=Community First Choices (1915(k)). Beginning in October 2011, states electing this state plan option to provide Medicaid-funded home and community-based attendant services and supports will receive an FMAP increase of six percentage points for CFC services. However, the final federal rule implementing this option was not released by CMS until May 2012, inhibiting state take-up of this option prior to FY 2013.
Issue Brief: Section 4: Provider Rates And Taxes
Provider Rates
States have a great deal of flexibility to determine the methodology and amount to reimburse providers. According to federal rules, “provider payment rates must be consistent with efficiency, economy, and quality of care and sufficient to enlist enough providers so that care and services are available under the plan at least to the extent they are available to the general population in the geographic area.” Over the 15 years, Medicaid programs have made a number of changes to provider rates; some trends have emerged.
State fiscal conditions have a direct impact on Medicaid provider rates. During economic downturns, states often turn to provider rate cuts to control costs, and when the economy improves, states may restore cuts or work to improve rates. During the Great Recession and its aftermath, the number of states reporting at least one provider rate restriction increased while the number of states reporting at least one provider rate increase declined. More states reported rate restrictions compared to increases for at least one provider rate between SFY 2010 and SFY 2012.
Economic downturns may have different impacts across provider types.
Institutional providers like hospitals and nursing facilities were more likely to experience rate freezes and not cuts during economic downturns. For this survey, rate freezes for these provider types are counted as rate restrictions. In most years, a small number of states imposed actual rate cuts for these providers rather than freezes. 2, 3 Climbing out of the recession, many states have maintained freezes for these providers. The number of states with inpatient hospital restrictions (including freezes) has outpaced the number of states increasing rates even after the downturn. 2
The number of states reporting rate increases for physicians or dentists increased during the recession and has increased after the recession. 4 However, federal policy also influenced some ambulatory care provider rates that are not reflected in this data (See box).17
Managed care rates are generally bolstered by the federal requirement that state capitation rates for MCOs must be “actuarially sound.” MCO rate changes have been affected by economic trends like other Medicaid payment rates, though the number of states reporting MCO rate increases has remained more consistently positive than for other provider types. 5
ACA Primary Care Increase
The ACA required increased Medicaid payment rates for primary care services to Medicare rates from January 2013 through December 2014. The federal government funded 100 percent of the difference between Medicaid rates that were in effect as of July 1, 2009 and the full Medicare rates for these two years. The significance of this rate differential varied greatly across states; a 2012 survey of Medicaid physician fees showed that in a small number of states, Medicaid rates for physician services were already at Medicare rates while other states paid sixty percent or less of Medicare rates. After December 2014, states could elect to continue the increased rate at their regular match rate. About one-third of states reported continuing the rate increase either fully or partially in FY 2015 and FY 2016 while other states reported rate increases unrelated to the ACA primary care rate increase.
Provider Taxes
Provider taxes are imposed by states on health care services where the burden of the tax falls mostly on providers, such as a tax on inpatient hospital services or nursing facility beds. Provider taxes or fees can be imposed on a number of providers or classes of services. In the past, states were able to use provider taxes and other state financing arrangements increase the effective federal matching. However, legislation enacted in 1991 restricted the use of provider taxes to curb such practices. Under current regulations, states may use provider tax revenues to help finance the state share of Medicaid spending only when the tax meets three requirements: it must be broad-based, uniformly imposed, and cannot hold providers harmless from the burden of the tax.18
Provider taxes have become an integral source of financing for Medicaid. States have used provider taxes to support eligibility, benefit and provider rate increases or to help mitigate provider rate cuts. More recently, at least seven states reported plans to use increased provider taxes to fund all or part of the state cost of the ACA Medicaid expansion that will start in CY 2017 when the 100 percent federal match for the expansion starts to decline.19 States have been more likely to impose or increase provider taxes to help fund the state share of Medicaid during economic downturns.
States have increased the number of provider taxes over time. At the beginning of SFY 2004, a total of 35 states had at least one provider tax in place. Over the next decade, a majority of states imposed new taxes or fees and/or increased existing tax rates and fees to raise revenue to support Medicaid. Since SFY 2013, all but one state (Alaska) has had at least one provider tax in place.
In SFY 2015, nearly two-thirds of states have 3 or more provider taxes in place. 7
Nursing facility taxes have historically been the most common type of tax though the use of hospital and ICF-ID taxes has increased notably over time. 8
Legislation has been proposed to curtail the use of provider taxes. Under current regulations, states may not use provider tax revenues for the state share of Medicaid spending unless the tax meets certain requirements including that providers cannot be held harmless from the burden of the tax.20 Federal regulations create a safe harbor from the hold-harmless test for taxes where collections are 6.0 percent or less of net patient revenues.21 Recent legislative proposals have suggested lowering the safe harbor threshold from 6.0 percent to 5.5 percent. In 2015, a total of 24 states estimated that at least one provider tax above this 5.5 percent threshold.22
Issue Brief: Section 5: Managed Care And Delivery System Reform
Managed care has become the predominant delivery system for Medicaid in most states, as Medicaid programs have increasingly turned to managed care as a means to help ensure access, improve quality and achieve budget certainty. As of July 2015, a total of 48 states used some form of managed care to serve the Medicaid population, including 39 states (including DC) that contracted with risk-based managed care organizations (MCOs) to serve their Medicaid enrollees.
States have also increased their focus on new and emerging models of delivery system and payment reform efforts, such as patient-centered medical homes, health homes accountable care organizations among others.
Over the last 15 years, Medicaid delivery systems have significantly shifted to managed care. States have continued to expand their use of managed care by expanding geographically to new regions, adding new populations, making managed care enrollment mandatory for new populations among other changes. States have also been shifting from primary care case management programs (PCCMs) to MCOs. As of July 2015, 21 states with Medicaid MCOs reported at least 75 percent of all Medicaid beneficiaries were enrolled in MCOs.
A growing number of states are focusing on integration of physical health, behavioral health and long-term services and supports (LTSS) under the umbrella of managed care. In SFY 2015, most states with MCOs had pharmacy services carved-in for the populations covered by their MCOs23 as well as dental services (for both children and adults in those states that cover this benefit for adults). There was more variation in managed care’s role in the delivery of behavioral health, though more states are looking at carving such services into MCO contracts.
Additionally, more states are exploring capitated arrangements for long term services and supports though this varies significantly.
With greater utilization of MCOs has come greater focus on quality performance. All states with MCO programs track one or more quality measures and require other health plan quality activities to improve health care outcomes and plan performance. A majority (23 states) publicly reported or required MCOs to publicly report quality metrics (e.g., a “report card”), and over one-third had pay-for-performance provisions, capitation withholds, and performance bonuses or penalties in place in SFY 2014 as well.
In SFY 2015, a total of 21 states implemented new or expanded quality initiatives and 19 states planned to do so in FY 2016. The most common new or expanded initiative in SFYs 2015 and 2016 was managed care payment withholds tied to quality performance.
States are also adopting other payment and delivery reforms including patient-centered medical homes, health homes accountable care organizations among others. Nearly half of states had PCMHs in place in SFY 2013. Additionally, twelve states had at least 1 health home, an option made available under the ACA, in place in SFY 2013 and 4 states had Accountable Care Organizations in place in SFY 2013. Interest in all of these options has been growing; one-third to almost half of states have reported actions to expand or newly implement these reforms either in conjunction with or independently of managed care contracts.
A few states have also implemented episodes of care payment structures as well as other payment reforms under DSRIP waivers. States also continue to explore these and other innovations in payment and delivery system reform with a heightened focus on integration of physical and behavioral health services, social determinants of health and population health.
Issue Brief: Conclusion
Medicaid is the nation’s primary public health insurance program for people with low incomes covering over 70 million Americans. Each year, states make a range of policy changes to Medicaid to comply with new federal rules and to address an array of policy goals. Reviewing the annual survey findings over the last 15 years shows just how dynamic and ever-changing Medicaid programs are, as they continue to evolve and respond to changes in the economy, state budgets and priorities, new opportunities and the needs of the beneficiaries they serve. The ACA brought historic changes to Medicaid eligibility and enrollment that built upon earlier actions taken in some states to expand coverage as well as simplify and streamline enrollment processes. Looking ahead, states will likely continue to pursue innovations in delivery system and payment reform, taking advantage of new federal support and innovations in technology. Future surveys will continue to track changes in enrollment and spending as well continued changes related to delivery and payment reforms as well as other key state policy changes in Medicaid.
Appendix
For fifteen years, the Kaiser Commission on Medicaid and the Uninsured and Health Management Associates (in collaboration with the National Association of Medicaid Directors in recent years) have conducted annual in-depth surveys of changes taking place in Medicaid programs across the country. Each year, the survey is conducted from June through August; Medicaid directors and staff provided data for this report in response to a written survey and a follow-up telephone interview. They are asked about policy actions that have been taken in the past state fiscal year (SFY) and actions planned for the coming fiscal year. For most states, the fiscal year runs from July 1 through June 30. For example, SFY 2006 for most states ran from July 1, 2005 through June 30, 2006. Exceptions include AL, DC, and MI (October 1 through September 30), NY (April 1 through March 31) and TX (September 1 through August 31). All 50 states and DC completed surveys and participated in telephone interview discussions each year. Copies of these reports can be found on the KFF Medicaid Budget Survey Archives.
Data included in this issue brief and its related data collection reflect information collected for the each fiscal year. Adopted policies are sometimes delayed or not implemented due to complex administrative or computer system changes, advance notice requirements, lack of approval from CMS or other legal, fiscal, or political considerations. Therefore, adopted actions should not be taken as final until they are implemented.
These surveys seek to capture policy changes states elect to make; changes required under federal law are not counted (though may be noted in some tables as (nc) or “not counted”.)
Over time the survey has evolved, reflecting the ever-changing nature of Medicaid. For example, the first few years of this survey work coincided with an economic downturn, and therefore the report focused on cost containment. As economic conditions improved and states shifted their focus, the survey did so as well, dedicating more effort to capturing innovations and expansions. Questions are refined and reworked; some questions eliminated while others added. Certain questions have been asked consistently to allow for trending. For this report, data from prior surveys have been pulled together in one place. Because of changes in policy and refinement of questions, counts included here may not match the original report. Below are some further notes for each of the policy sections.
Spending and Enrollment
Total Medicaid spending includes all payments to Medicaid providers for Medicaid covered services provided to enrolled Medicaid beneficiaries. In addition, total Medicaid spending includes special payments to “disproportionate share hospitals” (“DSH payments”) that subsidize uncompensated care for persons who are uninsured and unreimbursed costs related to care for persons on Medicaid. Not included in total Medicaid spending are Medicaid administrative costs and federally mandated state “Clawback” payments to Medicare (Pursuant to federal law, state have paid Clawback payments since 2006 to help finance the Medicare Part D prescription drug benefit for beneficiaries who are dually enrolled in both Medicare and Medicaid.) States are asked to exclude costs for the Children’s Health Insurance Program (CHIP.) Total Medicaid spending includes payments financed from all sources, including state funds, local contributions and federal matching funds. Historical state Medicaid spending refers to all non-federal spending, which may include local funds and provider taxes and fees as well as state general fund dollars. State spending for FYs 2014-2016 collected as part of this survey reflect state spending, largely state general fund dollars.
Spending and enrollment data reported here are annual rates of growth for Medicaid enrollment. The growth rates were calculated as weighted averages across all states, and for states based on state decisions to implement the ACA Medicaid expansion in 2014, 2015 or 2016. For FYs 2014, 2015 and 2016, average annual Medicaid spending growth was calculated using weights derived from the most recent state Medicaid expenditure data for fiscal year 2014, based on estimates prepared for KCMU by the Urban Institute using CMS Form 64 reports, adjusted for state fiscal years. These data were also used for historic Medicaid spending. Medicaid enrollment average annual growth rates for SFYs 2015 and 2016 were calculated using weights based on Medicaid and CHIP monthly enrollment data for June 2014 published by CMS. Historical enrollment trend data reflects the annual change from June to June of monthly enrollment data for Medicaid beneficiaries collected from states.24 Medicaid enrollment average annual growth rates for SFY 2014 were calculated using the June 2013 enrollment data that is used for the historical trend.
Eligibility Standards and Application and Renewal.
Eligibility Standards – For the purposes of this survey, eligibility standards refer to changes to income standards, asset tests, retroactive eligibility, treatment of asset transfers or income, enrollment caps or buy-in options (including Ticket to Work and Work Incentive Improvement Act or the DRA Family Opportunity Act.) Policy changes are classified as expansions or restrictions based upon the beneficiary’s perspective. While the ACA Medicaid expansion was a mandatory change, it was made effectively optional by the June 2012 Supreme Court ruling; therefore adoption of the ACA Medicaid expansion was counted as an eligibility expansion. With the new options available starting in January 2014 (Medicaid expansion and Marketplace subsidies) states made changes to some existing Medicaid coverage pathways (waivers extending coverage over 138 % FPL, coverage for pregnant women over 138% FPL, Breast and Cervical Cancer Treatment Program, Family Planning and Medically Needy) that were included in reports, but not counted as restrictions.
Application and Renewal – For the purposes of this survey, application and renewal refer to changes in forms, verification or face to face interview requirements, frequency of redeterminations or renewals, new online enrollment systems among other changes. Policy changes are counted as simplifications or restrictions based upon the beneficiary’s perspective. All states were required to implement a number of enrollment simplifications in January 2014 under the ACA. Given the number and scope of these changes, surveys conducted in 2014 onward no longer asked states to report changes in application and renewal policy.
Provider Rates
States are only asked to report the direction of provider rate changes for select provider types; they do not reflect the magnitude of the changes nor levels. Restrictions refer to provider rates that are reduced compared to the previous year for all providers except inpatient hospitals and nursing facilities. These two provider types are more likely than other provider types asked about in the survey to have inflationary adjustment built into their rates. Therefore, for these two provider types, freezes as well as cuts are counted as restrictions. Increases refer to rates being higher than the year before. Because all states were required to increase payment rates for primary care physicians in calendar year 2013 and 2014 (the difference being funded with federal dollars) this survey did not capture primary care rate changes for affected periods; rates for specialists were still captured during this period.
Provider Taxes/Fees
Each year, states are asked to report provider taxes that are in place, new or being eliminated. The way this question has been asked ask changed over time; states were originally asked to list provider taxes in their state. In later years, states were asked about common provider tax types (Nursing Facilities, Inpatient Hospitals and Intermediate Care Facilities for those with Intellectual Disabilites (ICF-IDs). Because of this, there may appear to be breaks in trend data in the early years that may not reflect changes in policy but incomplete data.
In July 2009, CMS changed policy regarding the use of provider taxes on MCOs that restricted their use. A number of states either eliminated such taxes, sometimes replacing them with premium taxes that were not Medicaid provider taxes. This survey relies on state reporting to differentiate between Medicaid provider taxes on MCOs and other taxes; however, it is possible that some states misreported such taxes. In this survey, MCO taxes reported by states for all periods were moved into “other” counts.
Benefits
Policy changes are counted as expansions/enhancements or restrictions/eliminations based upon the beneficiary’s perspective. Changes that were required under federal policy (e.g. covering tobacco cessation services for pregnant women, free-standing birth centers, coverage of the essential health benefits for the ACA Medicaid expansion population) were not counted as changes but may have been reported in tables as (nc).
Two types of benefits – pharmacy and HCBS services – are not included in benefit counts in this report as they are counted in other sections. Pharmacy has long been treated this way in final reports. However, this is a change for HCBS services. Up through SFY 2012, changes to LTSS benefits were often counted as long-term care actions. Starting in 2013, such actions were counted as benefit changes. For this report and in future reports, HCBS benefit changes (which include 1915i, 1915k, HCBS waiver services, state plan home health, personal care and private duty nursing) are counted as long term care actions. Additionally, changes to pharmacy benefits are not included in the benefit counts, but reported as pharmacy actions.
Guidance issued in 2013 clarified that autism-related benefits were required coverage under EPSDT. Such actions reported in that year and years earlier were not counted as benefit changes in this report or its related data collection.
Pharmacy –Pharmacy cost containment actions can include any cost-containment action; only certain ones (changes to the state Preferred Drug List, Changes to Supplemental Rebates and Script Limits) were asked consistently over time. Starting in SFY 2007, states were asked about these same select pharmacy tools being in place; this was not asked in previous years.
Long Term Care – The surveys have asked about expansions and restrictions on both community and institutional benefits. However, in recent years, the survey has moved away from counting restrictions on institutional benefits as these were often completed as part of actions to shift more people into the community. Therefore, expansions on the number of people served in the community can be trended but not restrictions. Up through SFY 2012, changes to LTSS benefits were often counted as long-term care actions. Starting in 2013, such actions were counted as benefit changes. For this report and in future reports, HCBS benefit changes (which include 1915i, 1915k, HCBS waiver services, state plan home health, personal care and private duty nursing) are counted as long term care actions.
Managed Care and Delivery System Reform
This section of the survey has undergone considerable refinement. In the early years of the survey, changes to managed care (such as adding new groups, expanding to new regions, etc.) included changes to both PCCM and MCOs; such changes were not differentiated between the two systems. Therefore, these changes cannot be trended over all surveys. Medicaid managed care trend data is available in the Medicaid and CHIP section of State Health Facts.
Endnotes
To be eligible for ARRA funds, states could not restrict eligibility or tighten enrollment procedures in Medicaid or CHIP.
Vic Miller, Impact of the Medicaid Fiscal Relief Provisions in the American Recovery and Reinvestment Act (ARRA) (Washington, DC: Kaiser Commission on Medicaid and the Uninsured, October 2011), https://modern.kff.org/medicaid/issue-brief/impact-of-the-medicaid-fiscal-relief-provisions/. ↩︎
Spending growth rates during SFYs 2011 through 2013 were affected by the end of the ARRA-enhanced matching rate. States shifted spending from SFY 2012 to SFY 2011 in order to take advantage of the higher match rate (which ended June 30, 2011.) In addition to this, states increased their cost containment efforts in response to the expiration of the enhanced match rates (which resulted in increased state costs.) ↩︎
A total of 29 states were implementing the ACA Medicaid expansion in FY 2015, up from 26 states in the previous year (FY 2015 additions include: New Hampshire, Pennsylvania and Indiana). Alaska and Montana expanded in SFY 2016. ↩︎
Since the survey, Louisianau2019s governor enacted an executive order to adopt the Medicaid expansion. Plans are to implement the Medicaid expansion in Louisiana beginning July 2016. ↩︎
With new coverage available through the Marketplace, seven states (California, Iowa, Massachusetts, New Mexico, New York, Rhode Island and Vermont) eliminated Medicaid coverage in their waivers for adults with incomes over 138 percent FPL in SFY 2014. The following year, Connecticut reduce parent eligibility from 200 percent FPL to 155 percent FPL; Minnesota and New York shifted some populations to new Basic Health Plan programs as well. Additionally, some non-expansion states (Indiana, Oklahoma, Wisconsin and Maine) that had limited benefit coverage waivers also reduced eligibility down to 100 percent FPL. ↩︎
CHIPRA also provided an opportunity for states to earn performance bonuses for enrolling children already eligible but not enrolled; in order to qualify, states had to meet specific enrollment targets and adopt certain enrollment/renewal simplifications. ↩︎
Simplifications to the application and renewal process were further spurred by the availability of enhanced match for states made available under the ACA. Specifically, matching rates for new eligibility and enrollment systems was increased from 50 percent to 90 percent; the matching rate for maintenance and operations was increased from 50 percent to 75 percent. This rule was originally in effect through December 2015 but was recently made permanent. ↩︎
Under the ARRA MOE, CMS determined that the following actions would be considered violations of the MOE requirements:nnIncreasing stringency in institutional level of care (LOC) determination processes that results in individuals losing actual or potential eligibility for Medicaid pursuant to institutional eligibility rules or in the special eligibility group for HCBS waiver participants under 42 CFR 435.217;nAdjusting cost neutrality calculations for section 1915(c) waivers from the aggregate to the individual, resulting in individuals being dropped from waiver coverage or hindered from moving out of an institutional setting;nReducing occupied waiver capacity for section 1915(c) HCBS waivers, or reducing or eliminating section 1915(c) waiver slots that were funded by the legislature but unoccupied as of July 1, 2008.nnThese standards were maintained under the ACA MOE, but CMS also notified states that it would be possible to increase institutional LOC criteria without violating the MOE if an alternative eligibility pathway to Medicaid HCBS services was created for all individuals that would have previously been able to gain eligibility under the original LOC. CMS offered the following examples of how this could be done: utilize the Section 1915(i) HCBS State Plan Option to extend HCBS benefits to individuals who would have been eligible under former LOC levels; or, use Section 1115 demonstration waiver authority to offer different levels of care for receipt of HCBS and institutional services, ensuring that the available capacity for Medicaid eligibility remains unchanged. CMS also noted that HCBS waivers are time limited and that the ACA MOE requirement does not require a state to renew a waiver that is expiring. Thus, a state may discontinue an HCBS waiver when it expires or may request a renewal at the end of the approved waiver period, with modifications, without creating an MOE issue. ↩︎
In some earlier years, benefit expansions for autism-related services were counted as expansions (PA -2009, MI-2013, MO-2013 and WA-2013.) However, CMS released guidance in X date that clarified that states are required to cover these services under EPSDT. For this analysis and in recent years, such changes are not counted as expansions, but included in appendix tables as (nc.) ↩︎
PACE is a capitated managed care benefit for the frail elderly provided by a not-for-profit or public entity that features a comprehensive medical and social service delivery system. It uses a multidisciplinary team approach in an adult day health center supplemented by in-home and referral services in accordance with participant’s needs. In recent years, the number of states reporting increasing the number served in the community through this option has increased. ↩︎
Between SFYs 2010 and 2012, 20 states enacted restrictions on home and community-based services such as personal care services and home health often by imposing utilization controls (increasing prior authorization, reducing service hours, etc.) ↩︎
The ACA primary increase changes are not reflected in this data as they were required changes; physician rate increases reflected here only include changes to rates other than those required under this part of the ACA. ↩︎
The seven states that reported plans at the time of the survey to use provider taxes or fees to fund all or part of the state costs for the ACA Medicaid expansion were Arizona, California, Colorado, Indiana, Kentucky, Nevada and Ohio. Plans are subject to change. ↩︎
Some of these states have small carve-outs for certain drugs or drug classes (e.g., HIV/AIDS drugs, medications for hepatitis C, mental health drugs, etc.) ↩︎
This Visualizing Health Policy infographic provides details on cancer spending and outcomes in the United States. The U.S. cancer mortality rate, 203 deaths per 100,000 population, was slightly lower than in comparable countries in 2010. Among cancers, lung cancer is the largest contributor to disease burden for both men and women. The United States spent $124 billion to treat cancer in 2012, which accounted for about 7% of the nation’s disease-based health expenditures. However, growth in cancer spending contributed slightly more than 6% to the nation’s medical services expenditure growth between 2000 and 2012, while the top 3 diseases contributed 36%. During that time, per capita spending on cancer increased 5%, which was slightly lower than the average for all diseases. Cancer medications were among the top three for specialty drug spending in 2015, behind medications for inflammatory conditions and multiple sclerosis.