Similar but Not the Same: How Medicare Per Capita Spending Compares for Younger and Older Beneficiaries
Issue Brief
Medicare is most commonly known as a health insurance program for people ages 65 and older, but, since 1973, the program has also provided coverage to millions of people with permanent disabilities who are younger than age 65.1 People under age 65 qualify for Medicare after they receive Social Security Disability Insurance (SSDI) payments for 24 months. Younger adults with end-stage renal disease (ESRD) and amyotrophic lateral sclerosis (ALS) are eligible for Medicare as soon as they begin receiving SSDI benefits. Over time, the share of Medicare beneficiaries under age 65 has more than doubled, from 7% (1.7 million people) in 19732 to 16% (9.1 million) this year.3
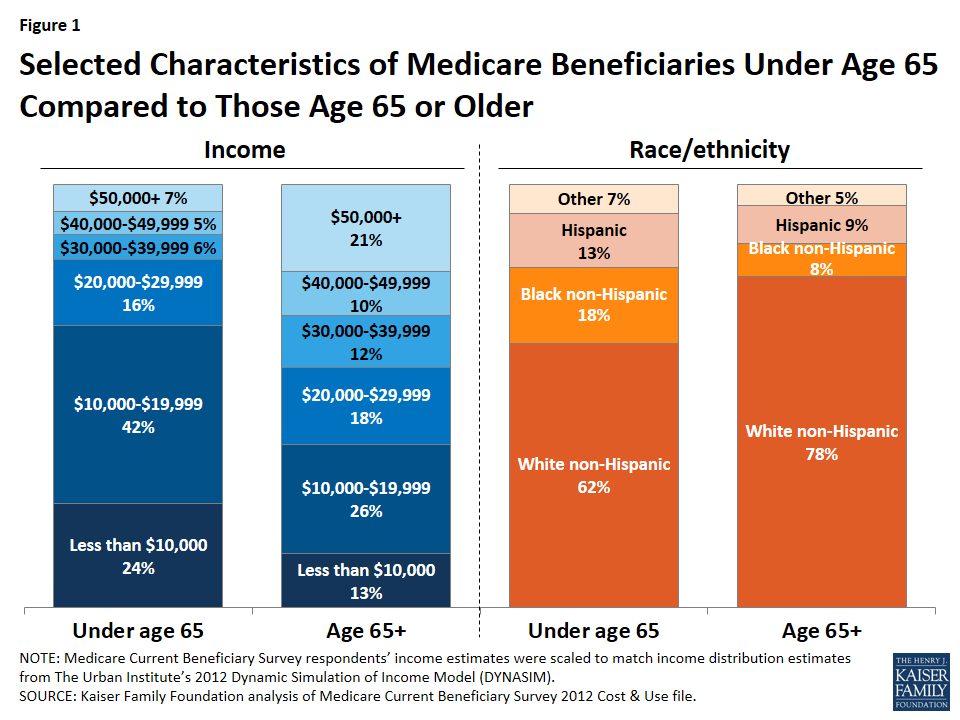
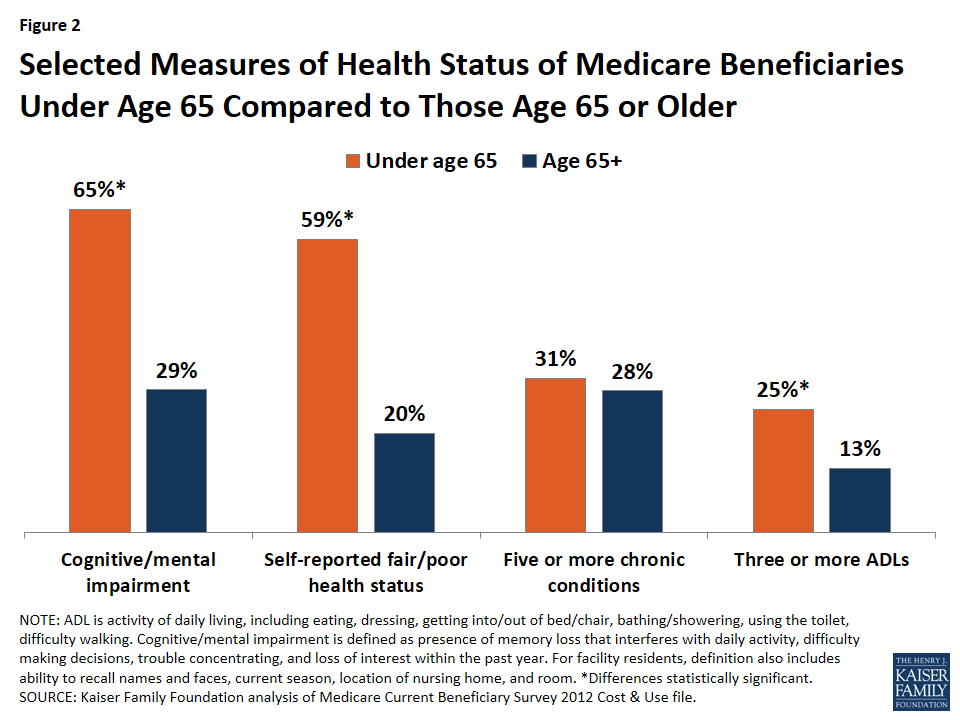
Medicare beneficiaries under age 65 with disabilities differ from beneficiaries age 65 and older in several ways.4 In 2012, nearly two-thirds of all younger Medicare beneficiaries (65%) had a cognitive or mental impairment, compared to 29% of seniors. Nearly 6 in 10 (59%) reported their health status as fair or poor and almost the same share (58%) reported having one or more limitations in their activities of daily living, compared to 20% and 34% of seniors, respectively. In 2014, half of all Medicare beneficiaries under age 65 lived on income less than $17,050, one third less than median income of $26,150 among beneficiaries age 65 and older.5
Differences in health status between younger and older Medicare beneficiaries suggest that Medicare spending could also differ for these two groups. In 2014, Medicare beneficiaries under age 65 accounted for 18% of the 38.5 million beneficiaries in traditional Medicare (excluding Medicare Advantage enrollees), and a somewhat higher share (23%) of total traditional Medicare spending that year.6 Per capita spending also could vary for these two groups, both overall and by type of service. This data note compares average per capita Medicare spending and service use for beneficiaries under age 65 to spending among those over age 65.7 The analysis is based on data from a 5% sample of Medicare claims for services covered under Parts A, B, and D for traditional Medicare beneficiaries from the Chronic Conditions Data Warehouse (CCW) of the Centers for Medicare & Medicaid Services (CMS) from 2000 to 2014. The analysis excludes beneficiaries enrolled in Medicare Advantage because comparable data on Medicare spending by service are not available for these enrollees.8 ,9
Findings
Average Medicare per capita spending on Part A and Part B services is only modestly higher for beneficiaries under age 65 than those over 65. Average total spending is higher for beneficiaries under age 65, mainly due to Part D prescription drug spending.
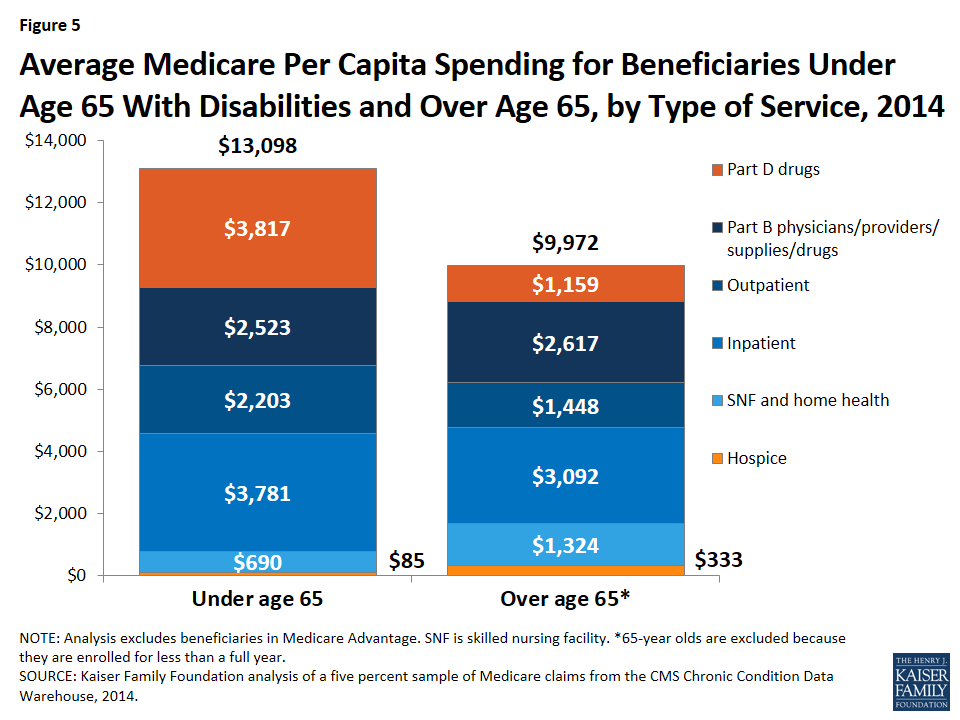
- Medicare per capita spending for beneficiaries younger than age 65 averaged $13,098 in 2014, nearly one third more than average per capita Medicare spending for beneficiaries over age 65 ($9,972) (Figure 1). Excluding Part D drug spending, the difference narrows considerably, to $9,281 for beneficiaries under age 65 and $8,814 for those over age 65, on average.
- Since 2000, per capita spending for Medicare-covered services under Part A and Part B has been similar for beneficiaries under and over age 65. Beginning in 2006, with the start of the Medicare Part D prescription drug benefit, average total per capita Medicare spending for those under age 65 surpassed that of beneficiaries over age 65, due to higher Part D spending among younger beneficiaries. (Figure 2)
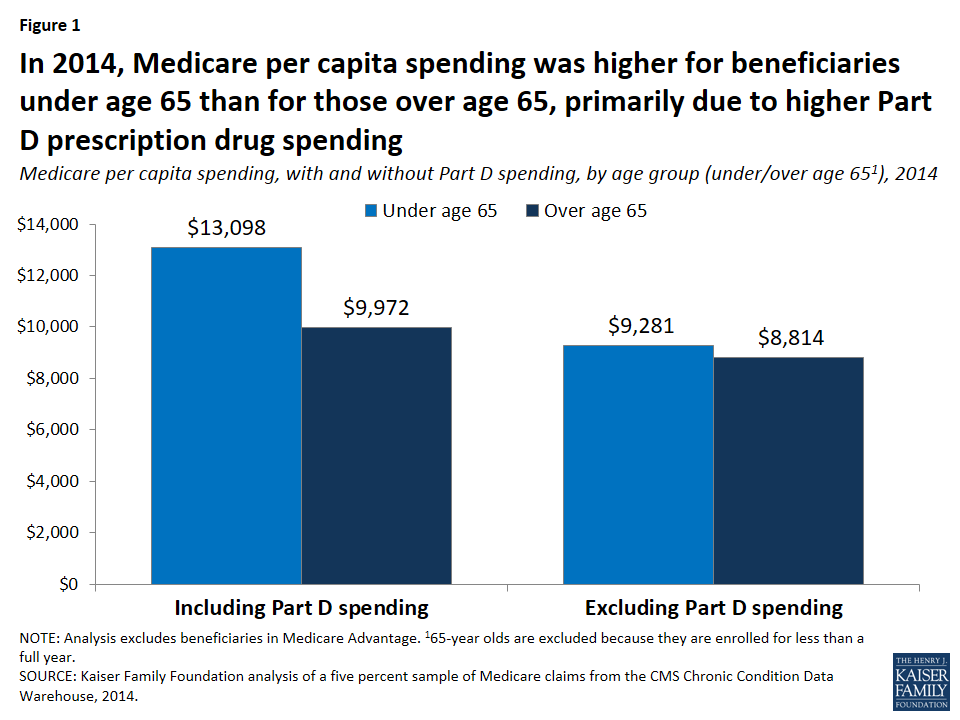
Figure 1: In 2014, Medicare per capita spending was higher for beneficiaries under age 65 than for those over age 65, primarily due to higher Part D prescription drug spending 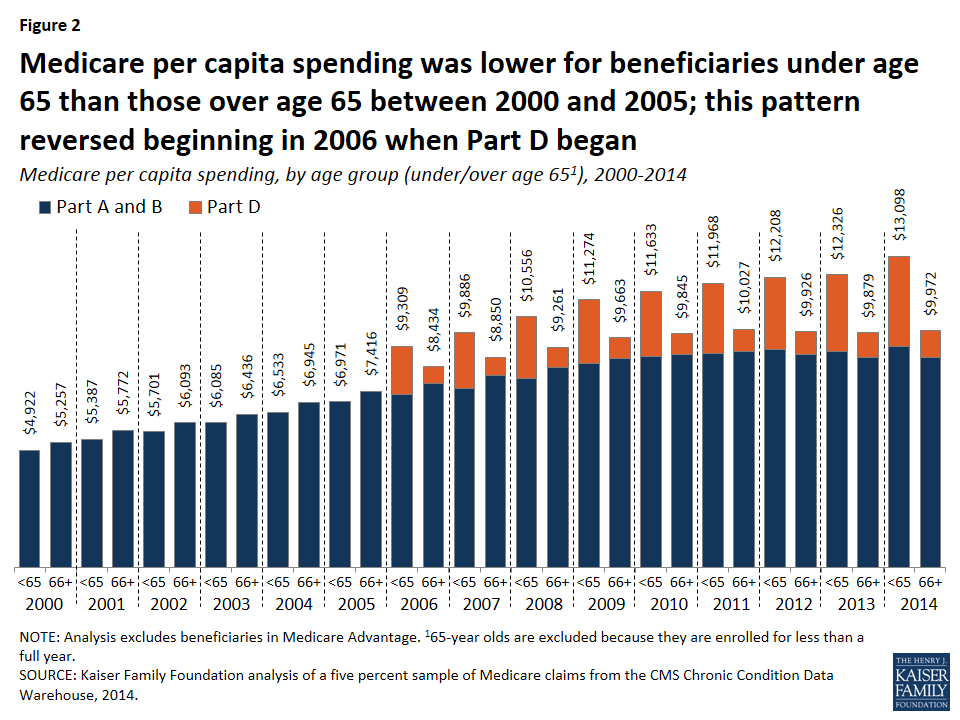
Figure 2: Medicare per capita spending was lower for beneficiaries under age 65 than those over age 65 between 2000 and 2005; this pattern reversed beginning in 2006 when Part D began
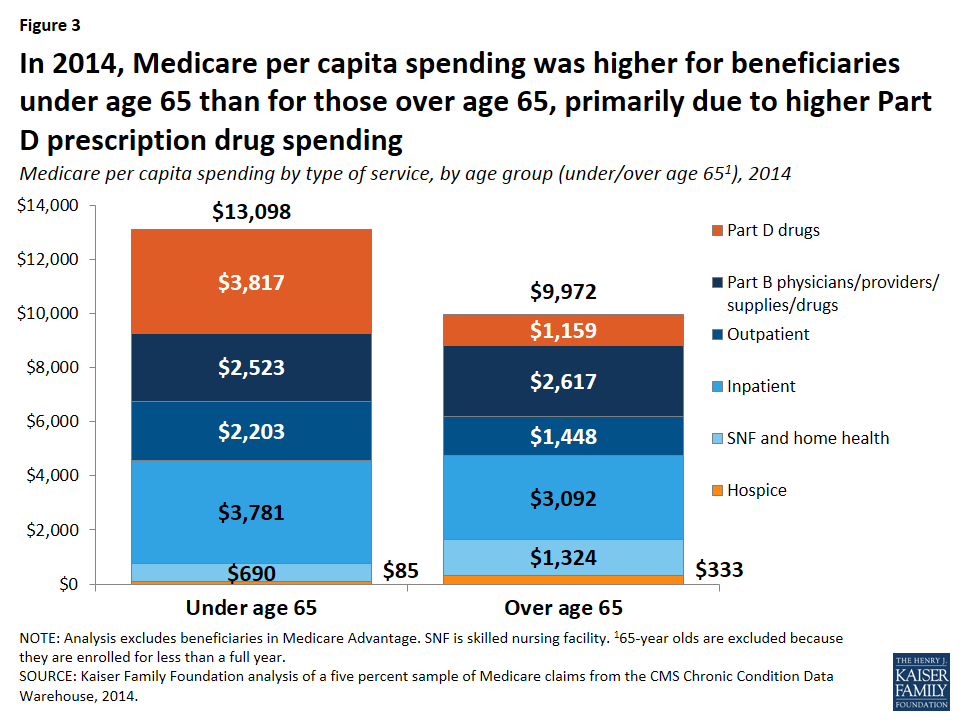
The pattern of spending by type of service is different for beneficiaries under age 65 with disabilities than for those over age 65. On average, beneficiaries under age 65 have higher per capita spending for drugs covered under Part D and for inpatient and outpatient services, but lower spending on post-acute and hospice care than beneficiaries over age 65.
- In 2014, average Medicare per capita spending on outpatient Part D prescription drugs was more than three times larger for beneficiaries under age 65 ($3,817) than for those over age 65 ($1,159).10 Part B drug spending, however, was somewhat lower among those under age 65 ($287) than those over age 65 ($360). (Figure 3; Table 1) The pattern of much higher Part D drug spending but somewhat lower Part B drug spending by beneficiaries under age 65 compared to those over age 65 could be because a considerable share of total Part B drug spending is for drugs used to treat cancer and its side effects,11 which may be more likely to be used by older beneficiaries.12
- Medicare per capita spending on hospital inpatient and outpatient services was higher among beneficiaries under age 65 ($3,781 and $2,203, respectively) than among older beneficiaries ($3,092 and $1,448) in 2014.
- Conversely, average Medicare per capita spending for post-acute care (skilled nursing facility and home health services) was half as much for younger beneficiaries with disabilities than for those over age 65 in 2014 ($690 versus $1,324). Although a similar share of both groups of beneficiaries used inpatient services in 2014, smaller shares of beneficiaries under age 65 used post-acute care services than those over age 65.13
- Similarly, average Medicare per capita spending on hospice care was considerably lower for beneficiaries under age 65 than those over age 65 ($85 versus $333). This is partly because the death rate is lower among beneficiaries under age 65 than among those over age 65,14 and because roughly half as many younger Medicare beneficiaries who died in 2014 used hospice services than older beneficiaries who died that year.15
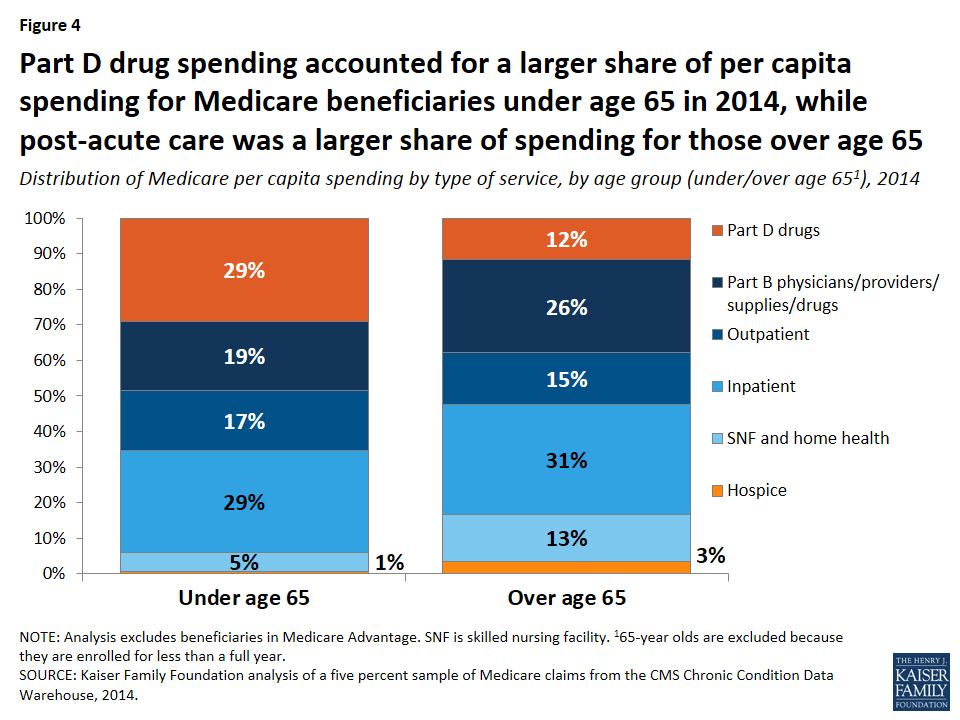
Part D prescription drug spending accounts for a much larger share of total spending for beneficiaries under age 65 than older beneficiaries, while post-acute care spending accounts for a larger share of spending among beneficiaries over age 65.
- Part D drug spending accounted for 29% of per capita spending among beneficiaries younger than age 65 in 2014, but just 12% of per capita spending for beneficiaries over age 65. (Figure 4; Table 1)
- Post-acute care services (skilled nursing facility and home health services) comprised a much smaller share of total per capita spending for beneficiaries under age 65 than those over age 65 (5% versus 13%).
- Inpatient and outpatient services accounted for similar shares of per capita spending in 2014 for both beneficiaries under age 65 (29% and 17%, respectively) and those over age 65 (31% and 15%, respectively).
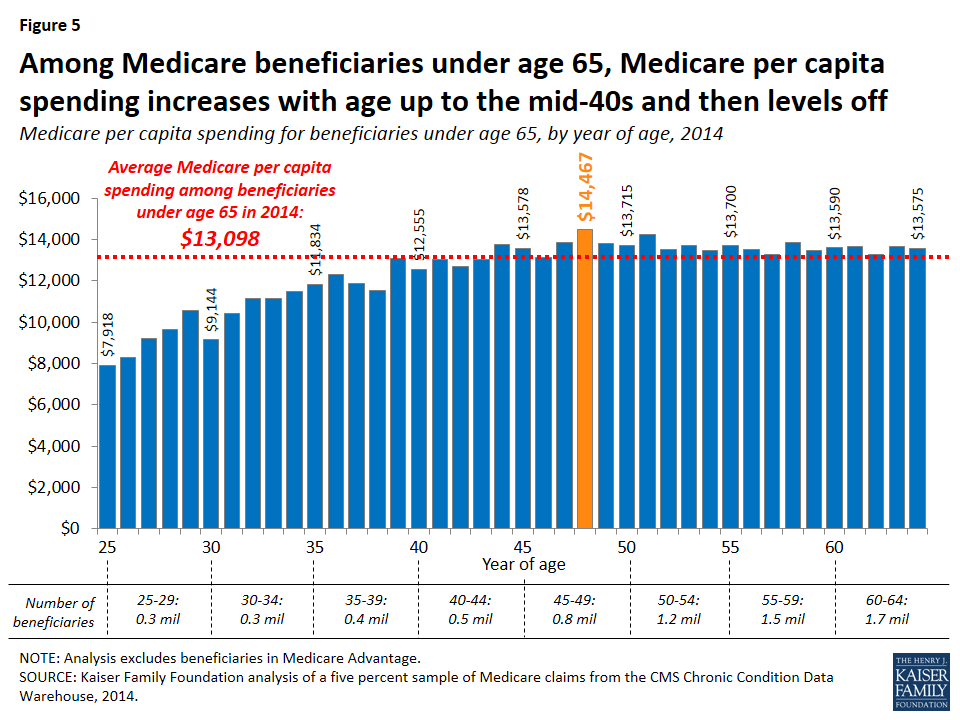
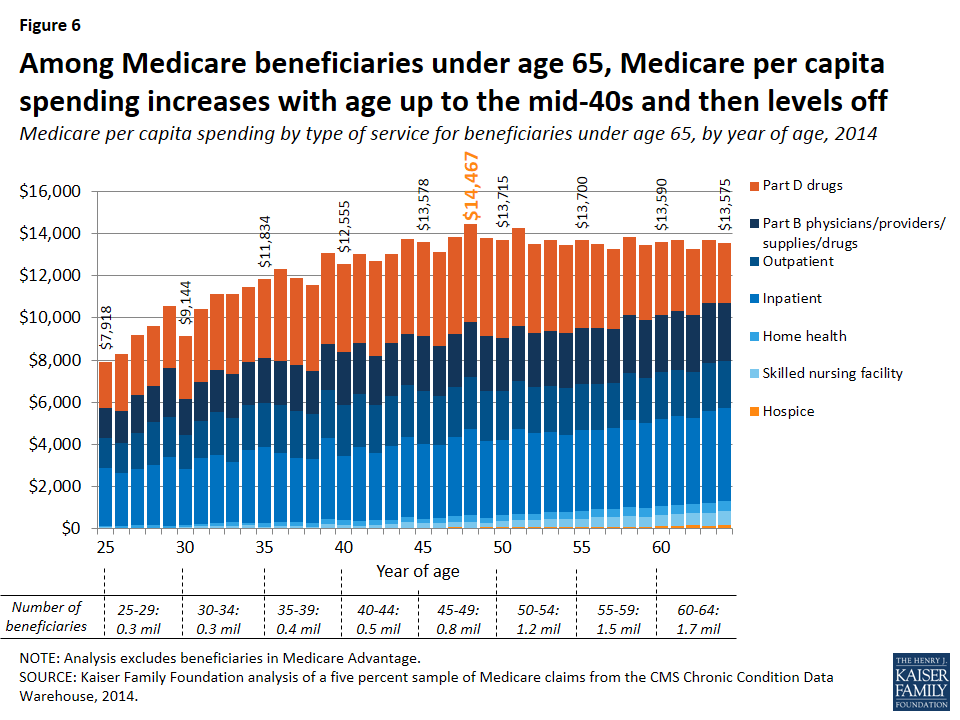
Among beneficiaries under age 65, Medicare per capita spending increases with age until beneficiaries reach their 40s and then generally levels off.
- In 2014, average per capita Medicare spending increased from $7,918 for 25 year-olds to $11,834 for 35 year-olds to $13,578 for 45 year-olds, leveling off at around that amount for beneficiaries between the ages of 45 and 64. (Figure 5; Table 1)
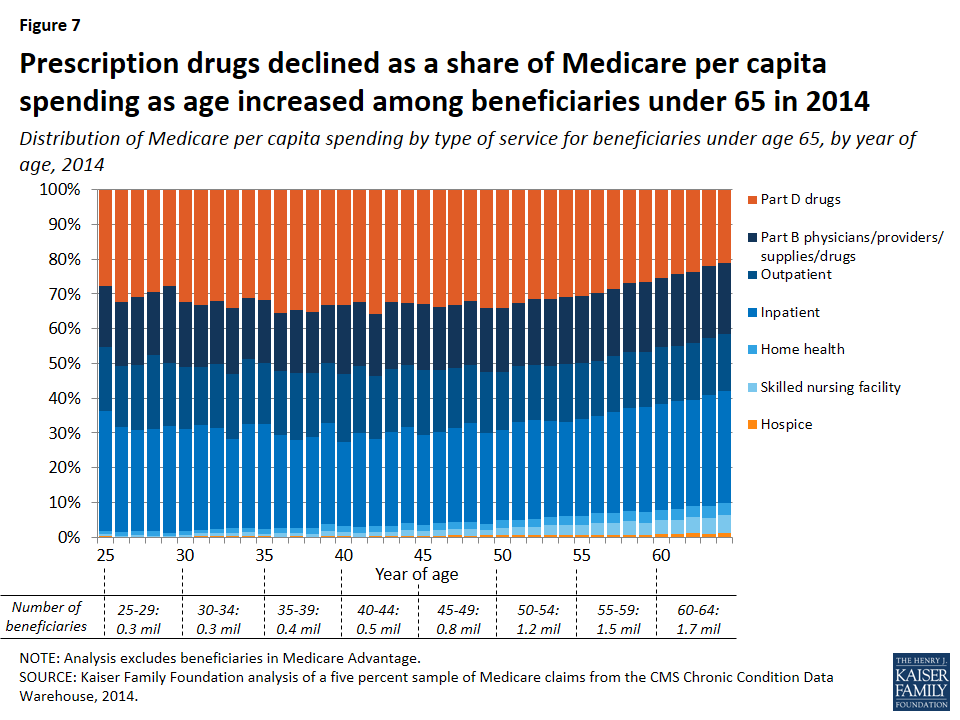
- Both in dollar amounts and as a share of total spending, Medicare per capita spending for inpatient, outpatient, and physician services is similar at different ages among beneficiaries younger than age 65, while per capita Part D prescription drug spending increases modestly but then declines as beneficiaries age. (Figures 6 and 7)
- Average per capita spending on skilled nursing facility, home health, and hospice services increases by year of age among beneficiaries under age 65, but these services account for a very small share of total Medicare spending for younger beneficiaries—ranging from less than 1% to 5% of total per capita spending for skilled nursing facility services, 1% to 3% for home health services, and around 1% for hospice services for beneficiaries as they age from 25 years old to 64 years old.
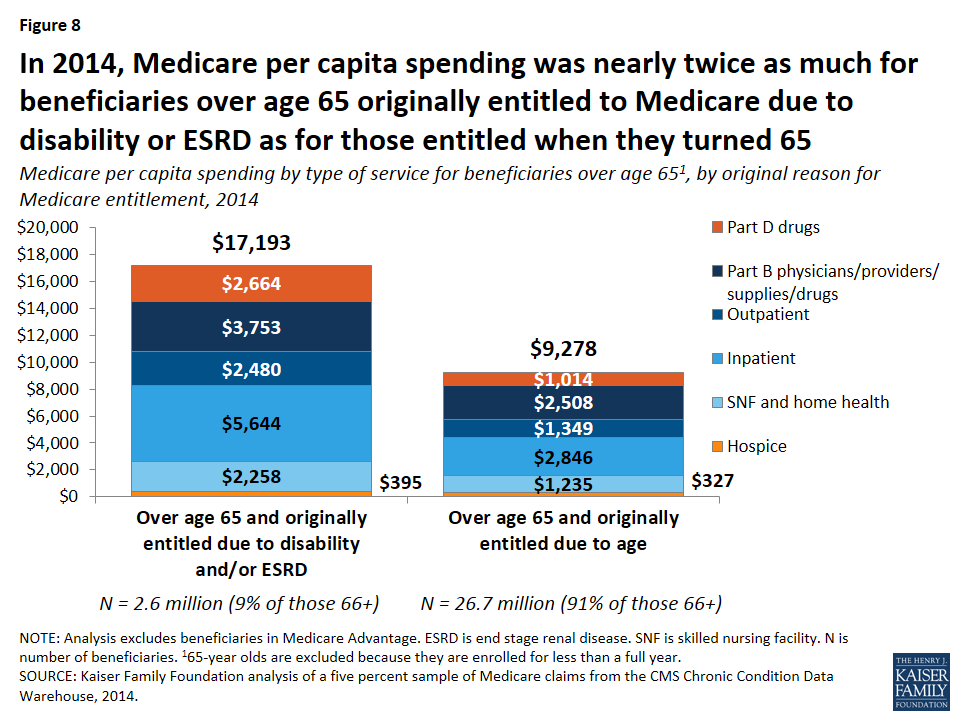
Among beneficiaries over age 65, Medicare per capita spending is nearly two times higher for those who initially qualified for Medicare before age 65 due to disability or ESRD.
Among beneficiaries over age 65, average Medicare per capita spending is considerably higher for those who originally qualified for Medicare before they turned 65 due to having a permanent disability, ESRD, or ALS, than for older beneficiaries who qualified for Medicare based on age alone. In 2014, 2.6 million traditional Medicare beneficiaries over age 65 (9% of all traditional Medicare beneficiaries over age 65) initially qualified for Medicare due to receiving disability insurance benefits, having ESRD, or both prior to turning age 6516 ; these beneficiaries had average spending of $17,193, nearly twice the level of average spending among the 26.7 million traditional Medicare beneficiaries over age 65 who first became entitled to Medicare when they turned 65 ($9,278) (Figure 8).
Discussion
Comparing Medicare per capita spending by beneficiaries under age 65 with disabilities and spending by those over age 65 shows a large difference between the two populations, primarily due to substantially higher Part D prescription drug spending for beneficiaries under age 65. Other spending differences by type of service—such as lower spending on post-acute care services and higher spending on inpatient and outpatient services among beneficiaries under age 65 compared to those over age 65—reflect variation in medical needs and treatment among beneficiaries at different years of age.
Contrary to what might be expected based on health status differences between Medicare beneficiaries under age 65 with disabilities and older beneficiaries, average Medicare per capita spending on services covered under Part A and Part B was only moderately higher among those under age 65 than over age 65 in 2014, and was in fact somewhat lower among younger beneficiaries between 2000 and 2011. Total per capita spending began to diverge more widely beginning in 2006 when the Part D prescription drug benefit took effect, with much higher average Part D spending among beneficiaries under age 65. These findings suggest that curtailing rising drug costs would have the effect of reducing the Medicare spending gap between beneficiaries under and over age 65.
While this analysis shows that younger beneficiaries with disabilities have similar spending patterns as older beneficiaries for Medicare-covered hospital and physician services combined, we are unable to examine spending for certain services not covered by Medicare that may be needed and used more often by younger beneficiaries with disabilities, in particular long-term services and supports and dental care. For these services, state Medicaid programs may be playing a much greater role for Medicare beneficiaries with disabilities than older beneficiaries. Addressing gaps in Medicare-covered benefits could help to address unmet needs for long-term services and supports and dental services that both younger and older beneficiaries may face—especially those who are not dually eligible for Medicare and Medicaid—but would also add to Medicare’s bottom line.
Juliette Cubanski and Tricia Neuman are with the Kaiser Family Foundation.Anthony Damico is an independent consultant.
Tables
| Table 1: Amount and Distribution of Medicare Per Capita Spending Overall and By Type of Service for Traditional Medicare Beneficiaries Under Age 65 and Over Age 65, 2014 | |||||
| Type of service | Part of Medicarecovering service | Under age 65 | Over age 651 | ||
| Amount | Percent of total | Amount | Percent of total | ||
| Total | $13,098 | 100.0% | $9,972 | 100.0% | |
| Part D drugs | D | 3,817 | 29.1% | 1,159 | 11.6% |
| Acute inpatient hospital | A | 3,141 | 24.0% | 2,722 | 27.3% |
| Outpatient hospital | A | 2,203 | 16.8% | 1,448 | 14.5% |
| Other inpatient hospital | A | 640 | 4.9% | 369 | 3.7% |
| Evaluation & management | B | 503 | 3.8% | 459 | 4.6% |
| Other Part B procedures | B | 370 | 2.8% | 524 | 5.3% |
| Skilled nursing facility | A | 366 | 2.8% | 826 | 8.3% |
| Physician office services | B | 365 | 2.8% | 416 | 4.2% |
| Home health | A or B2 | 324 | 2.5% | 499 | 5.0% |
| Part B drugs | B | 287 | 2.2% | 360 | 3.6% |
| Tests | B | 271 | 2.1% | 239 | 2.4% |
| Durable medical equipment | B | 225 | 1.7% | 132 | 1.3% |
| Other Part B services | B | 211 | 1.6% | 164 | 1.6% |
| Imaging | B | 130 | 1.0% | 171 | 1.7% |
| Hospice | A | 85 | 0.6% | 333 | 3.3% |
| Dialysis | B | 59 | 0.5% | 13 | 0.1% |
| Anesthesia | B | 52 | 0.4% | 53 | 0.5% |
| Ambulatory surgery center | B | 50 | 0.4% | 86 | 0.9% |
| NOTE: Analysis excludes beneficiaries in Medicare Advantage. 165-year olds are excluded because these beneficiaries are enrolled for less than a full year. 2Home health services can be covered under Part A or Part B depending on whether or not the services follow a hospital stay.SOURCE: Kaiser Family Foundation analysis of a five percent sample of Medicare claims from the CMS Chronic Conditions Data Warehouse, 2014. | |||||
| Table 2: Amount and Distribution of Medicare Per Capita Spending Overall and By Type of Servicefor Traditional Medicare Beneficiaries Under Age 65, by Year of Age, 2014 | ||||||||||||||||
| TOTAL PER CAPITA | Part D prescription drugs | Inpatient hospital | Outpatient hospital | Part B providers/ services/ supplies/drugs | Skilled nursing facility | Hospice | Home health | |||||||||
| AGE | Amount | % of total | Amount | % of total | Amount | % of total | Amount | % of total | Amount | % of total | Amount | % of total | Amount | % of total | Amount | % of total |
| All <65 | $13,098 | 100% | $3,817 | 29.1% | $3,781 | 28.9% | $2,203 | 16.8% | $2,523 | 19.3% | $366 | 2.8% | $85 | 0.6% | $324 | 2.5% |
| 25 | 7,918 | 100 | 2,185 | 27.6% | 2,730 | 34.5% | 1,464 | 18.5% | 1,403 | 17.7% | 43 | 0.5% | 21 | 0.3% | 71 | 0.9% |
| 26 | 8,282 | 100 | 2,676 | 32.3% | 2,497 | 30.1% | 1,455 | 17.6% | 1,527 | 18.4% | 29 | 0.4% | 0 | 0.0% | 99 | 1.2% |
| 27 | 9,199 | 100 | 2,836 | 30.8% | 2,690 | 29.2% | 1,697 | 18.4% | 1,817 | 19.8% | 55 | 0.6% | 4 | 0.0% | 101 | 1.1% |
| 28 | 9,623 | 100 | 2,846 | 29.6% | 2,827 | 29.4% | 2,046 | 21.3% | 1,727 | 18.0% | 37 | 0.4% | 5 | 0.0% | 134 | 1.4% |
| 29 | 10,578 | 100 | 2,943 | 27.8% | 3,246 | 30.7% | 1,925 | 18.2% | 2,324 | 22.0% | 41 | 0.4% | 7 | 0.1% | 92 | 0.9% |
| 30 | 9,144 | 100 | 2,964 | 32.4% | 2,675 | 29.3% | 1,632 | 17.8% | 1,711 | 18.7% | 61 | 0.7% | 8 | 0.1% | 93 | 1.0% |
| 31 | 10,408 | 100 | 3,455 | 33.2% | 3,147 | 30.2% | 1,729 | 16.6% | 1,857 | 17.8% | 97 | 0.9% | 24 | 0.2% | 100 | 1.0% |
| 32 | 11,117 | 100 | 3,570 | 32.1% | 3,216 | 28.9% | 2,067 | 18.6% | 2,002 | 18.0% | 101 | 0.9% | 28 | 0.2% | 134 | 1.2% |
| 33 | 11,150 | 100 | 3,793 | 34.0% | 2,854 | 25.6% | 2,084 | 18.7% | 2,116 | 19.0% | 103 | 0.9% | 28 | 0.3% | 171 | 1.5% |
| 34 | 11,474 | 100 | 3,582 | 31.2% | 3,456 | 30.1% | 2,119 | 18.5% | 2,020 | 17.6% | 136 | 1.2% | 31 | 0.3% | 131 | 1.1% |
| 35 | 11,834 | 100 | 3,757 | 31.7% | 3,596 | 30.4% | 2,080 | 17.6% | 2,133 | 18.0% | 66 | 0.6% | 35 | 0.3% | 167 | 1.4% |
| 36 | 12,301 | 100 | 4,358 | 35.4% | 3,292 | 26.8% | 2,266 | 18.4% | 2,064 | 16.8% | 139 | 1.1% | 16 | 0.1% | 165 | 1.3% |
| 37 | 11,876 | 100 | 4,097 | 34.5% | 3,033 | 25.5% | 2,256 | 19.0% | 2,184 | 18.4% | 99 | 0.8% | 28 | 0.2% | 178 | 1.5% |
| 38 | 11,549 | 100 | 4,049 | 35.1% | 3,030 | 26.2% | 2,129 | 18.4% | 2,041 | 17.7% | 86 | 0.7% | 12 | 0.1% | 202 | 1.7% |
| 39 | 13,079 | 100 | 4,323 | 33.1% | 3,829 | 29.3% | 2,268 | 17.3% | 2,181 | 16.7% | 184 | 1.4% | 53 | 0.4% | 241 | 1.8% |
| 40 | 12,555 | 100 | 4,162 | 33.1% | 3,021 | 24.1% | 2,462 | 19.6% | 2,501 | 19.9% | 162 | 1.3% | 32 | 0.3% | 215 | 1.7% |
| 41 | 13,013 | 100 | 4,186 | 32.2% | 3,506 | 26.9% | 2,528 | 19.4% | 2,410 | 18.5% | 135 | 1.0% | 18 | 0.1% | 230 | 1.8% |
| 42 | 12,712 | 100 | 4,540 | 35.7% | 3,155 | 24.8% | 2,316 | 18.2% | 2,281 | 17.9% | 140 | 1.1% | 50 | 0.4% | 231 | 1.8% |
| 43 | 13,034 | 100 | 4,208 | 32.3% | 3,544 | 27.2% | 2,354 | 18.1% | 2,523 | 19.4% | 161 | 1.2% | 48 | 0.4% | 195 | 1.5% |
| 44 | 13,747 | 100 | 4,494 | 32.7% | 3,811 | 27.7% | 2,425 | 17.6% | 2,454 | 17.9% | 260 | 1.9% | 41 | 0.3% | 262 | 1.9% |
| 45 | 13,578 | 100 | 4,448 | 32.8% | 3,515 | 25.9% | 2,534 | 18.7% | 2,594 | 19.1% | 197 | 1.5% | 58 | 0.4% | 232 | 1.7% |
| 46 | 13,114 | 100 | 4,434 | 33.8% | 3,447 | 26.3% | 2,325 | 17.7% | 2,381 | 18.2% | 205 | 1.6% | 55 | 0.4% | 267 | 2.0% |
| 47 | 13,831 | 100 | 4,587 | 33.2% | 3,752 | 27.1% | 2,370 | 17.1% | 2,515 | 18.2% | 255 | 1.8% | 68 | 0.5% | 284 | 2.1% |
| 48 | 14,467 | 100 | 4,653 | 32.2% | 4,102 | 28.4% | 2,438 | 16.9% | 2,632 | 18.2% | 271 | 1.9% | 51 | 0.4% | 319 | 2.2% |
| 49 | 13,802 | 100 | 4,681 | 33.9% | 3,610 | 26.2% | 2,405 | 17.4% | 2,567 | 18.6% | 182 | 1.3% | 92 | 0.7% | 263 | 1.9% |
| 50 | 13,715 | 100 | 4,684 | 34.1% | 3,556 | 25.9% | 2,307 | 16.8% | 2,502 | 18.2% | 283 | 2.1% | 67 | 0.5% | 316 | 2.3% |
| 51 | 14,250 | 100 | 4,630 | 32.5% | 4,017 | 28.2% | 2,273 | 15.9% | 2,609 | 18.3% | 328 | 2.3% | 75 | 0.5% | 318 | 2.2% |
| 52 | 13,510 | 100 | 4,243 | 31.4% | 3,827 | 28.3% | 2,165 | 16.0% | 2,561 | 19.0% | 322 | 2.4% | 80 | 0.6% | 312 | 2.3% |
| 53 | 13,703 | 100 | 4,313 | 31.5% | 3,778 | 27.6% | 2,183 | 15.9% | 2,621 | 19.1% | 402 | 2.9% | 72 | 0.5% | 335 | 2.4% |
| 54 | 13,449 | 100 | 4,151 | 30.9% | 3,667 | 27.3% | 2,217 | 16.5% | 2,609 | 19.4% | 368 | 2.7% | 98 | 0.7% | 339 | 2.5% |
| 55 | 13,700 | 100 | 4,176 | 30.5% | 3,838 | 28.0% | 2,195 | 16.0% | 2,660 | 19.4% | 389 | 2.8% | 95 | 0.7% | 347 | 2.5% |
| 56 | 13,526 | 100 | 4,015 | 29.7% | 3,771 | 27.9% | 2,168 | 16.0% | 2,639 | 19.5% | 478 | 3.5% | 82 | 0.6% | 372 | 2.8% |
| 57 | 13,246 | 100 | 3,776 | 28.5% | 3,857 | 29.1% | 2,126 | 16.0% | 2,561 | 19.3% | 457 | 3.5% | 94 | 0.7% | 374 | 2.8% |
| 58 | 13,844 | 100 | 3,727 | 26.9% | 4,118 | 29.7% | 2,238 | 16.2% | 2,721 | 19.7% | 526 | 3.8% | 103 | 0.7% | 412 | 3.0% |
| 59 | 13,450 | 100 | 3,556 | 26.4% | 4,042 | 30.1% | 2,147 | 16.0% | 2,723 | 20.2% | 447 | 3.3% | 101 | 0.8% | 434 | 3.2% |
| 60 | 13,590 | 100 | 3,464 | 25.5% | 4,147 | 30.5% | 2,241 | 16.5% | 2,674 | 19.7% | 540 | 4.0% | 115 | 0.8% | 410 | 3.0% |
| 61 | 13,674 | 100 | 3,327 | 24.3% | 4,253 | 31.1% | 2,167 | 15.8% | 2,808 | 20.5% | 563 | 4.1% | 126 | 0.9% | 430 | 3.1% |
| 62 | 13,289 | 100 | 3,136 | 23.6% | 4,073 | 30.6% | 2,174 | 16.4% | 2,718 | 20.5% | 595 | 4.5% | 169 | 1.3% | 424 | 3.2% |
| 63 | 13,672 | 100 | 2,983 | 21.8% | 4,376 | 32.0% | 2,263 | 16.6% | 2,842 | 20.8% | 624 | 4.6% | 134 | 1.0% | 451 | 3.3% |
| 64 | 13,575 | 100 | 2,854 | 21.0% | 4,383 | 32.3% | 2,236 | 16.5% | 2,775 | 20.4% | 693 | 5.1% | 167 | 1.2% | 466 | 3.4% |
| NOTE: Analysis excludes beneficiaries in Medicare Advantage.SOURCE: Kaiser Family Foundation analysis of a five percent sample of Medicare claims from the CMS Chronic Conditions Data Warehouse, 2014. | ||||||||||||||||
Endnotes
- This provision was included in the Social Security Amendments of 1972, with Medicare coverage effective July 1, 1973. ↩︎
- Centers for Medicare & Medicaid Services (CMS), 2013 Medicare & Medicaid Statistical Supplement, Table 2.1 Medicare Enrollment: Hospital Insurance and/or Supplementary Medical Insurance Programs for Total, Fee-for-Service and Managed Care Enrollees as of July 1, 2012: Selected Calendar Years 1966-2012. ↩︎
- CMS/Office of Enterprise Data and Analysis/Office of the Actuary, CMS Fact Facts, available at https://www.cms.gov/fastfacts/ ↩︎
- Except as noted, estimates in this paragraph are for 2012 and based on Kaiser Family Foundation analysis of the Medicare Current Beneficiary Survey 2012 Cost and Use file. ↩︎
- Gretchen Jacobson, Christina Swoope, Tricia Neuman, and Karen Smith, Income and Assets of Medicare Beneficiaries, 2014-2030, Kaiser Family Foundation, September 2015, available at https://modern.kff.org/medicare/issue-brief/income-and-assets-of-medicare-beneficiaries-2014-2030/. ↩︎
- Kaiser Family Foundation analysis of a five percent sample of Medicare claims from the CMS Chronic Conditions Data Warehouse, 2014. Total spending for traditional Medicare in 2014 was $390 billion. ↩︎
- The analysis excludes beneficiaries who are age 65 because some of these beneficiaries are enrolled for less than a full year; therefore, a full year of Medicare spending data is not available for all people at this year of age. ↩︎
- Medicare spending for Medicare Advantage enrollees takes the form of monthly capitation payments which are not based on actual service utilization. ↩︎
- As of 2013, the share of beneficiaries enrolled in Medicare Advantage was lower among beneficiaries under age 65 than among older beneficiaries (22% versus 29%); Medicare Payment Advisory Commission, A Data Book: Health Care Spending and the Medicare Program, June 2015, Chart 9-11, available at http://www.medpac.gov/documents/data-book/june-2015-databook-health-care-spending-and-the-medicare-program.pdf. ↩︎
- Total Part D spending includes payments by Part D plans for covered drugs and Low-Income Subsidy (LIS) payments for cost-sharing subsidies for eligible Part D enrollees. A disproportionate share of LIS subsidy recipients are beneficiaries under age 65. In 2014, three quarters of Medicare beneficiaries under age 65 and enrolled in Part D received LIS (76%), three times the share of those over age 65 and enrolled in Part D receiving LIS (23%) (based on Kaiser Family Foundation analysis of CCW data). ↩︎
- See Medicare Payment Advisory Commission, A Data Book: Health Care Spending and the Medicare Program, Section 10: Prescription Drugs, Chart 10-2, June 2015; Steven Sheingold, et al., “Medicare Part B Drugs: Pricing and Incentives,” ASPE Issue Brief, Department of Health and Human Services, Office of the Assistant Secretary for Planning and Evaluation, March 2016. ↩︎
- In 2014, 9% of traditional Medicare beneficiaries over age 65 had a diagnosis of breast, colorectal, endometrial, lung, or prostate cancer, compared to 2% of beneficiaries under age 65 (based on Kaiser Family Foundation analysis of CCW data). ↩︎
- In 2014, 17% of all traditional Medicare beneficiaries under age 65 used inpatient services, 2% used skilled nursing facility services, and 6% used home health services. This compares to 16%, 5%, and 10% (for each type of service, respectively) of beneficiaries over age 65 (based on Kaiser Family Foundation analysis of CCW data). ↩︎
- In 2014, 2% of all traditional Medicare beneficiaries under age 65 died, compared to 5% of beneficiaries over age 65 (based on Kaiser Family Foundation analysis of CCW data). ↩︎
- In 2014, 26% of all traditional Medicare beneficiaries under age 65 who died used hospice services, compared to 49% of beneficiaries over age 65 who died that year (based on Kaiser Family Foundation analysis of CCW data). ↩︎
- Beneficiaries with ALS are included in this group but not separately identifiable. ↩︎