KFF designs, conducts and analyzes original public opinion and survey research on Americans’ attitudes, knowledge, and experiences with the health care system to help amplify the public’s voice in major national debates.
Funding for HIV declined for 13 of 14 donor governments assessed in the analysis, in part due to the significant appreciation of the U.S. dollar that resulted in the depreciation of most other donor currencies. Yet even after accounting for this, funding declined for the majority of governments assessed.
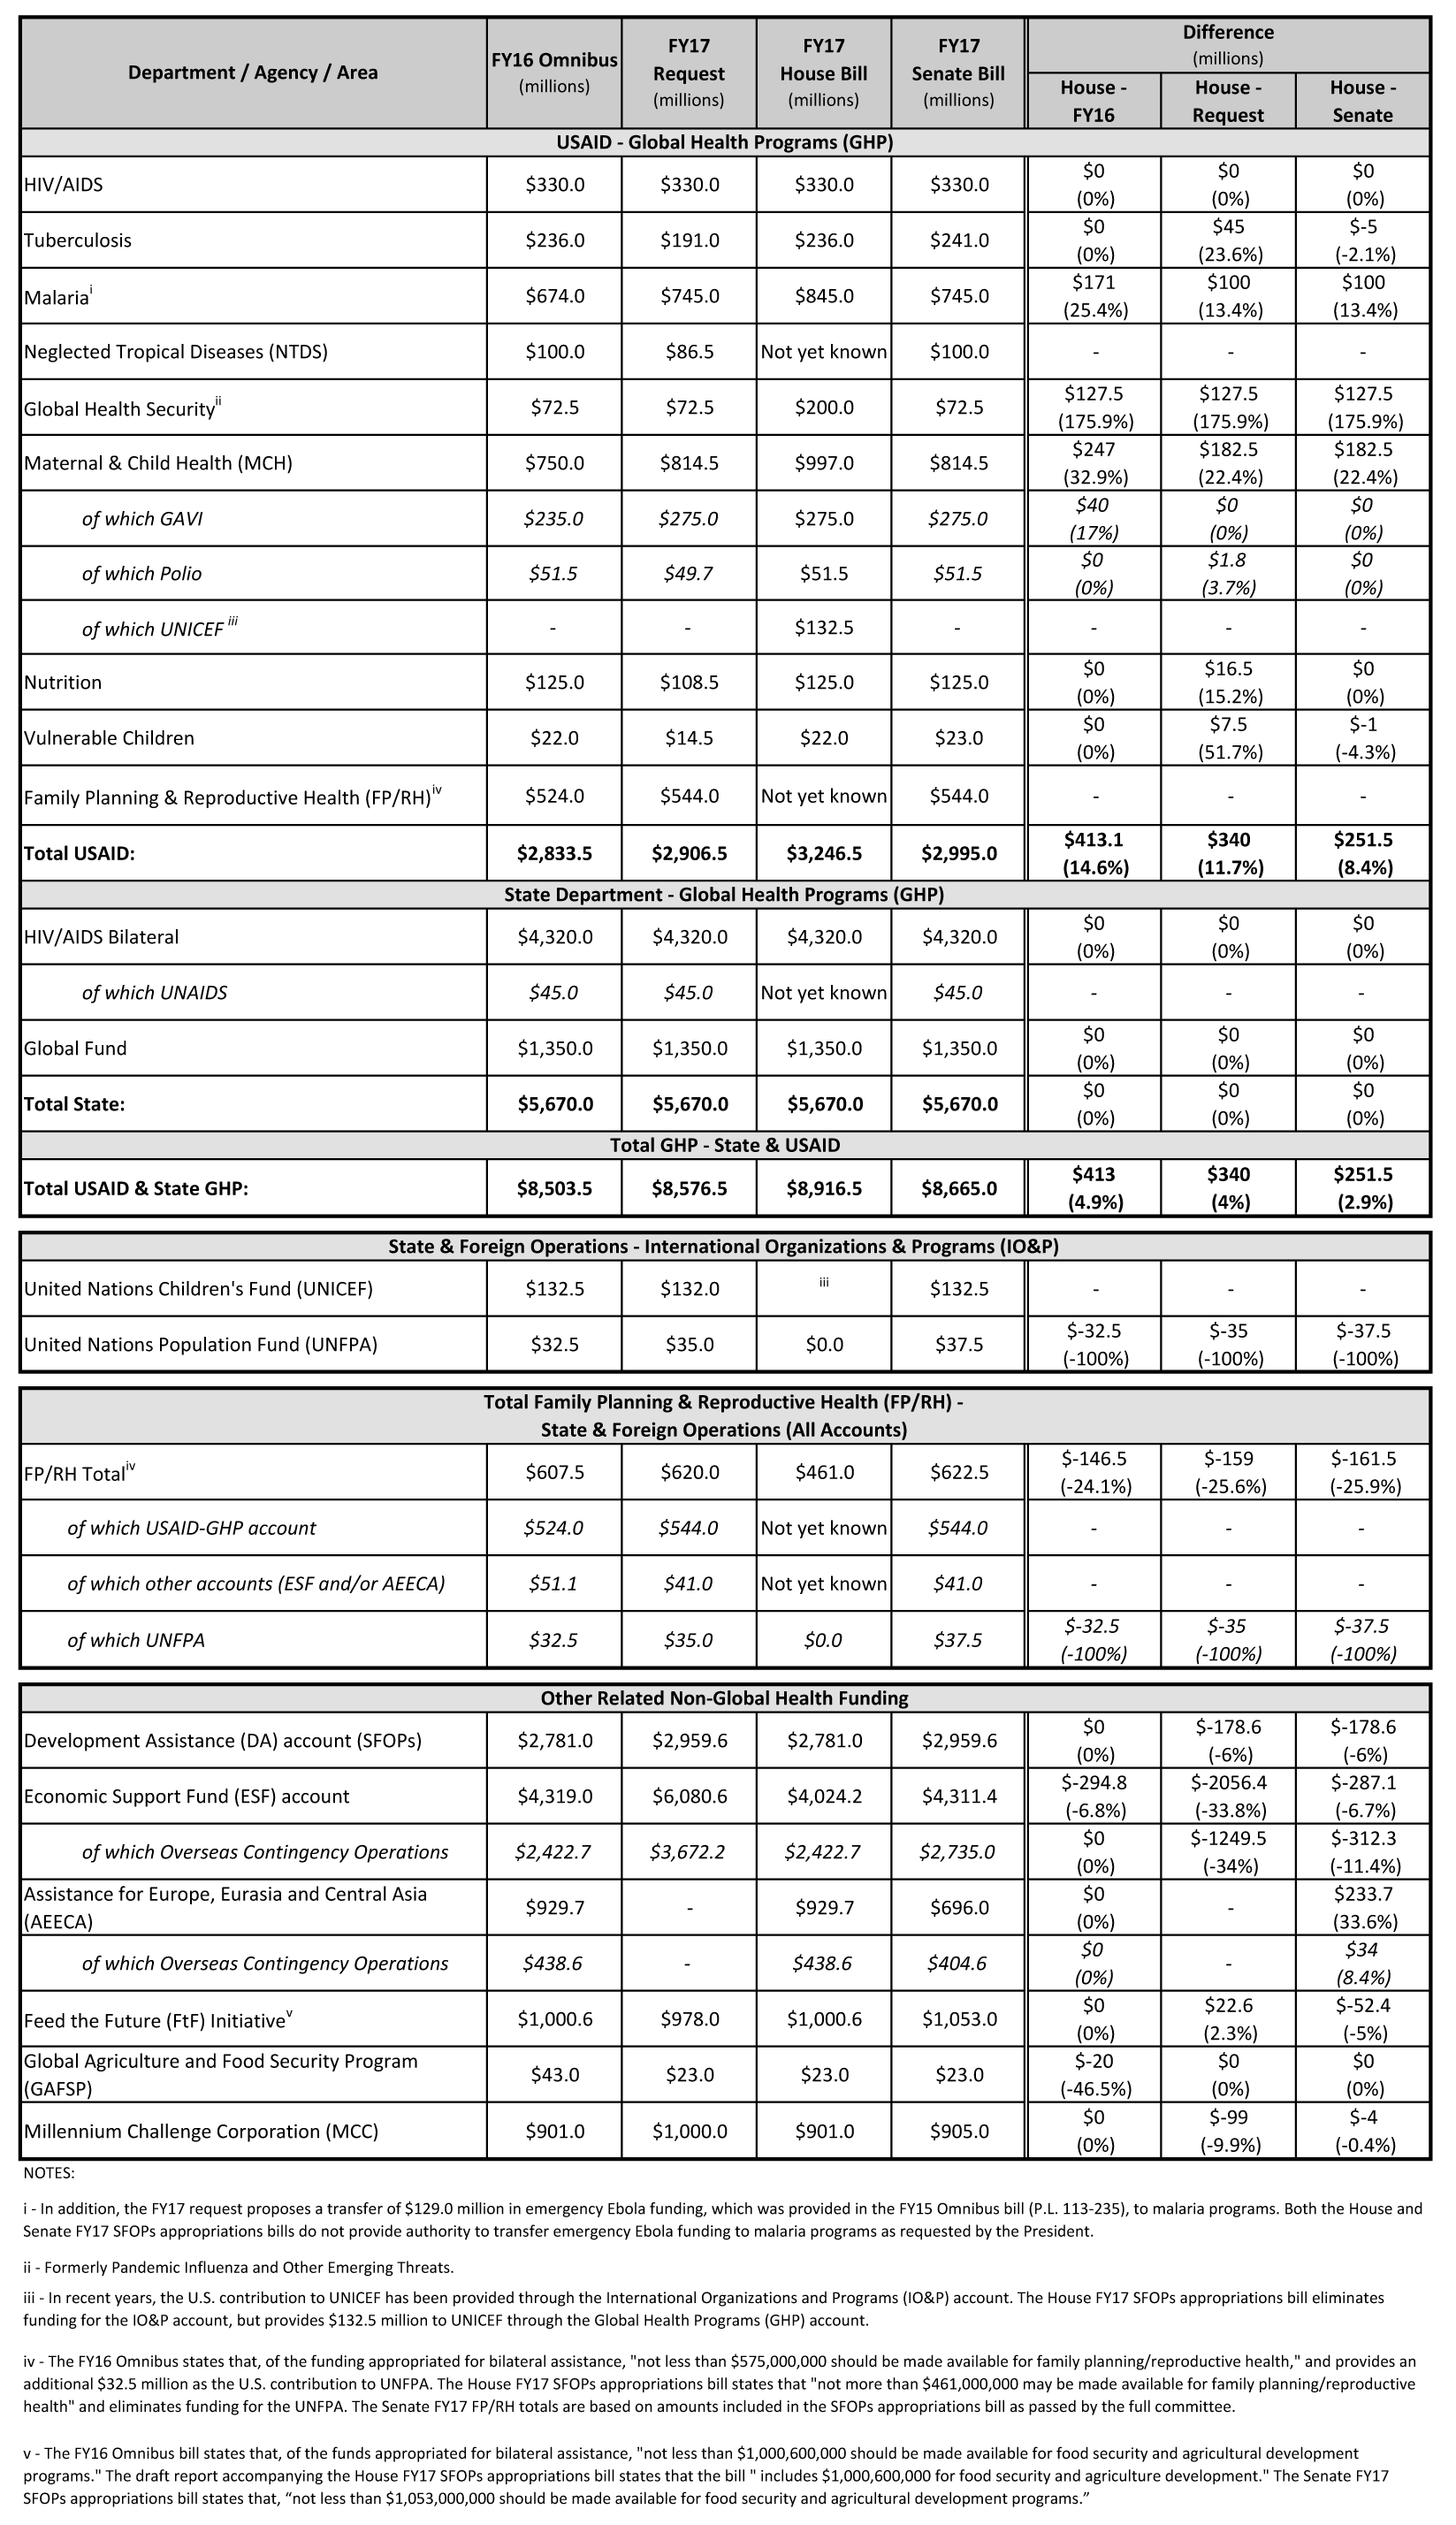
Total funding from the U.S. government fell from US$5.6 billion to US$5 billion, but this was mostly due to a timing issue as the U.S. shifted bilateral funds to 2016 while it implements new and expands existing programs. Without counting the US$411 million reduction in bilateral U.S. funding, most of which is expected to be provided in 2016, total funding declined overall by 8 percent.
“The decline in international funding for the HIV response is worrying,” said Luiz Loures, UNAIDS Deputy Executive Director. “Countries still need urgent support over the next few years to Fast-Track their responses to HIV, enabling them to end the AIDS epidemic by 2030 and save millions of lives. Diverting resources from the HIV response now will mean much greater human and financial costs over the long-term.”
The U.S. continued to provide the lion’s share of total funding (bilateral and multilateral) provided by donor governments (66.4%), followed by the U.K. (13%). France provided 3.7 percent of funding, Germany provided 2.7 percent, and the Netherlands provided 2.3 percent.
“2015 marked a drop in donor funding for HIV,” said Kaiser Family Foundation Vice President Jen Kates, Director of Global Health and HIV Policy. “Donors faced many competing funding demands, including humanitarian emergencies and the refugee crisis, all against a backdrop of fiscal austerity in a number of countries. Looking ahead, donor funding for HIV remains uncertain as leading donors face changes in political leadership and the world is still digesting the effects of Brexit.”
The new report, produced as a partnership between the Kaiser Family Foundation and UNAIDS, provides the latest data available on donor funding disbursements based on data provided by governments. It includes their bilateral assistance to low- and middle-income countries and contributions to the Global Fund as well as UNITAID.
The launch of several expensive hepatitis C drugs over the past few years has ushered the topic of high cost prescription drugs back into the public’s and policymakers’ attention. With over 70 million beneficiaries, many of whom have complicated health needs, Medicaid is one of the largest providers of prescription drugs in the United States. State Medicaid agencies have a variety of mechanisms to help control outpatient drug spending that they have been using widely for the past decade. However, new prescription drugs are always coming to market, and the health needs of the Medicaid population change over time, especially as enrollment grows because of ACA Medicaid expansion. As a result, it is helpful for policy makers to understand which drugs used by the Medicaid program are most expensive. In this issue brief, we determine the 50 most costly drugs before rebates used by the Medicaid program from January 2014 through June 2015. We then examine reasons why these drugs are so costly, as well as exploring case studies on opioids, hepatitis C drugs, and the drug Abilify. Key findings include the following:
Among the most commonly prescribed outpatient prescription drugs in Medicaid, the top five drugs are used for pain relief (hydrocodone-acetaminophen and ibuprofen), management of chronic illness (lisinopril and omeprazole), and antibiotics (amoxicillin). However, these drugs are not necessarily among the most costly used by Medicaid as many are inexpensive at the per prescription level.
Several drugs that are very costly at the per prescription level reflect Medicaid’s role in caring for individuals with substantial health needs. These include drugs to treat hemophilia (NovoSeven RT, Koate-DVI, Feiba), multiple sclerosis (HP Acthar), and rare infant diseases (Adagen). However, most of these drugs are not commonly used among the Medicaid population.
Aggregate drug costs to Medicaid reflect both frequency of use and per prescription cost. Among the most costly drugs in aggregate used by the Medicaid program are drugs used to treat costly illnesses for which Medicaid is a key source of coverage, including behavioral health conditions (Abilify and Vyvanse), hepatitis C (Sovaldi and Harvoni), and HIV (Truvada). Nearly three quarters of the 50 most costly drugs fall into five drug groups, the most prevalent of which is antivirals, which includes drugs used to treat HIV as well as hepatitis C drugs.
45 of the 50 most costly drugs fall into the high-cost category in part or primarily because they are frequently prescribed. Hydrocodone-acetaminophen and Suboxone, both opioids, a drug group which has garnered much public attention recently, fall into this category, as do several drugs used to treat ADHD.
Many of the most costly drugs have some form of regulatory and consequently market exclusivity, thus enabling the manufacturers to charge a premium price for the drug at the prescription level. Twenty-two of the most costly drugs are particularly expensive at the prescription level, including the most costly drug before rebates used by Medicaid over this period, Abilify (an atypical antipsychotic).
As states continue to implement an array of measures to control Medicaid prescription drug costs, they are challenged to balance costs with access to drugs needed by beneficiaries. This challenge is not unique to Medicaid alone but is a common issue throughout the U.S. healthcare system, as reflected by the attention in general given to the high cost of prescription drugs. While this analysis may not reflect Medicaid’s net expenditures for a particular drug, as it is unable to account for drug rebates, it provides insights into which drugs are driving Medicaid prescription drug expenditures and why.
Issue Brief
Introduction
With its list price of $84,000 per treatment, the launch of the hepatitis C drug Sovaldi in December 2013 garnered the public’s and policymakers’ attention and brought into the spotlight the issue of high-cost prescription drugs in the U.S. Most Americans now believe that prescription drugs are too expensive.1 With over 70 million beneficiaries,2 the Medicaid program is larger than any other public or private insurer.3 Many Medicaid beneficiaries have poorer health than enrollees in private coverage4 and need prescription drugs to manage their medical conditions. As a result, Medicaid prescription drug spending is sizeable: in 2014, Medicaid spent $27.3 billion on outpatient drugs.5 Over the years, states have implemented an array of measures to control utilization and spending for prescription drugs.6
In this issue brief, we look at which outpatient prescription drugs were most expensive to Medicaid in 2014 and 2015 and explore why. As described in more detail in Appendix B, we merge state drug utilization data (available from the Centers for Medicare and Medicaid Services, or CMS) with Wolters Kluwer Clinical Drug Information (WKCDI) data to determine the 50 most costly outpatient drugs to the Medicaid program from January 2014 through June 2015 in terms of aggregate spending before rebates.7 Then, using WKCDI as well as data from the Food and Drug Administration (FDA), we focus on common attributes among them and discuss policy implications.
Background
The Medicaid outpatient prescription drug benefit is not a mandatory benefit, but all states provide this benefit in their Medicaid programs. Typically, a Medicaid beneficiary receives a prescription from their physician and fills it at a pharmacy. Medicaid either reimburses the pharmacy for the prescription or pays a capitation fee to a managed care company that reimburses the pharmacy for the prescription.8 States then collect rebates for the drugs prescribed to their beneficiaries from the manufacturers and share this with the federal government.9 As a result of the Medicaid Drug Rebate Program created by Congress in 1991, all drug manufacturers must enter into a rebate agreement with the Secretary of Health and Human Services in return for Medicaid reimbursement for their prescription drugs.10 The rebate program was put into place to control the rising cost of drugs within Medicaid.11
In the early 2000s, as Medicaid spending for prescription drugs grew, states implemented a number of cost control measures in this area, such as supplemental rebates, preferred drug lists, and generic substitution. With the implementation of Medicare Part D (and the shift of drug costs for dually eligible beneficiaries from Medicaid to Medicare), Medicaid saw a large decline in prescription drug spending, and state activity in this area slowed.12 However, after years of slow growth, Medicaid spending on outpatient prescription drugs jumped 24% in 2014 to $27.3 billion, or about 6 percent of Medicaid spending.13 This increase in the growth rate is in large part due to increased enrollment resulting from Medicaid expansion and new high cost hepatitis C drugs.14
In January 2016, CMS released the Covered Outpatient Drugs final rule, which details drug reimbursement provisions outlined in the ACA, some of which were put into place to help states control drug spending. One such provision is the requirement that states must base drug ingredient cost reimbursement to pharmacies on the actual price of the drug, as opposed to using list prices.15 The previously used ingredient cost reimbursements, referred to as “Estimated Acquisition Costs,” often relied on “commercially published reference prices” which did not necessarily represent the actual cost of the drug to the pharmacy and were therefore susceptible to being manipulated.16 Many states had already made the change to using actual acquisition costs prior to the final rule.17 Despite this policy change, some drug manufacturers may still have the leverage to charge a high price for a drug due to lack of competition.
As states continue to grapple with controlling Medicaid prescription drug spending, many are focusing on high-cost “specialty drugs.” In FY 2015, over two-thirds of the states reported actions to refine and enhance their pharmacy programs in response to new and emerging specialty and high-cost drug therapies.18 However, it is unclear what role specialty drugs—or other types of drugs— play in Medicaid prescription drug spending. This analysis examines which drugs are the most costly to Medicaid and looks at common attributes of the most costly drugs. This information may be helpful as states undertake policy actions to balance high costs with high needs.
What Makes a Drug a High Cost to the Medicaid Program?
Aggregate drug costs to Medicaid reflect both frequency of use and per prescription costs. Among the most commonly prescribed outpatient prescription drugs in Medicaid, the top five drugs are used for pain relief (hydrocodone-acetaminophen and ibuprofen), management of chronic illness (lisinopril and omeprazole), and antibiotics (amoxicillin) (see Appendix Table A3). However, these drugs are not necessarily among the most costly to Medicaid as many are inexpensive at the per prescription level. Similarly, many drugs that are quite costly at the per prescription level are not commonly used by Medicaid enrollees. These drugs, which include drugs to treat hemophilia (NovoSeven RT, Koate-DVI, Feiba), multiple sclerosis (HP Acthar), and rare infant diseases (Adagen), reflect Medicaid’s role in caring for individuals with substantial health needs.
When we examined which drugs were high cost by assessing total Medicaid spending by drug name for each outpatient drug provided from January 2014 through June 2015,19 Abilify, Sovaldi, Vyvanse, Harvoni, and Truvada top the list, respectively (see Appendix Table A1). These are drugs to treat costly illnesses for which Medicaid is a key source of coverage, including behavioral health conditions (Abilify and Vyvanse), hepatitis C (Sovaldi and Harvoni), and HIV (Truvada).
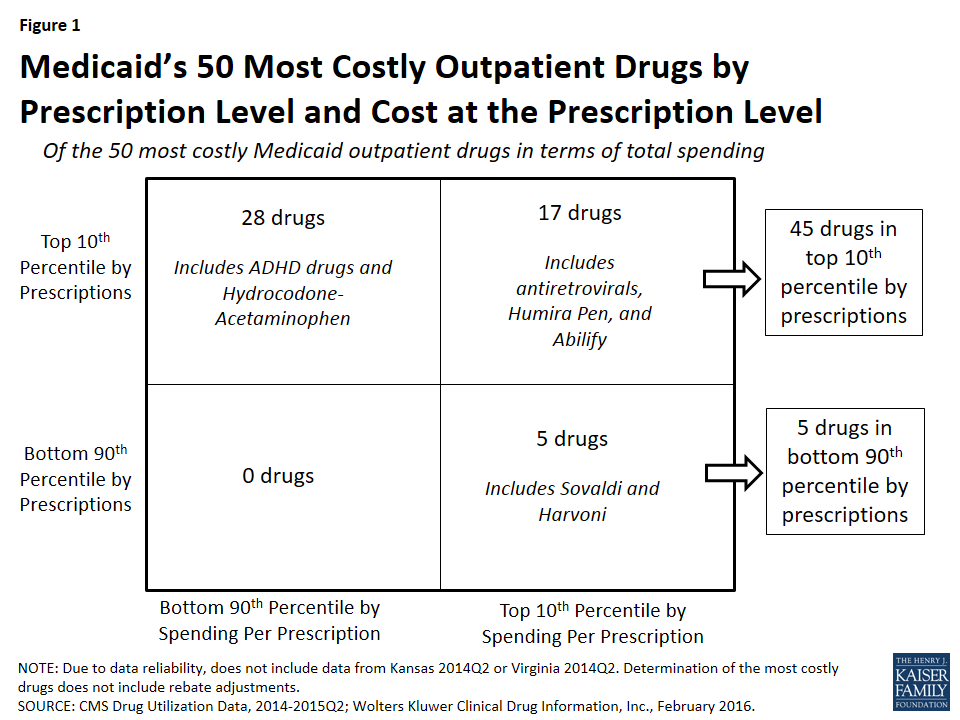
In Figure 1, we classify the 50 most costly (in aggregate) drugs in terms of how frequently prescribed and how expensive they are at the prescription level. If they are in the top 10th percentile of drugs by number of prescriptions, we identify them as “frequently prescribed.” If they were in the top 10th percentile of drugs by spending per prescription, we refer to them as an “expensive at the prescription level.”
Figure 1: Medicaid’s 50 Most Costly Outpatient Drugs by Prescription Level and Cost at the Prescription Level
We found that of the 50 most costly drugs, 45 fall into the high-cost category at least in part because they are very frequently prescribed. Over half (28) are frequently prescribed but not expensive at the prescription level. Among others, these drugs include treatments for ADHD and hydrocodone-acetaminophen, the most frequently prescribed drug in Medicaid over this period (Appendix Table A3 and “Case Study A: Opioids”).
A smaller number of the 50 most costly drugs (17) are both frequently prescribed and expensive prescriptions. Seven antiretrovirals included among the 50 most costly drugs fall into this group (Truvada, Atripla, Prezista, Stribild, Complera, Reyataz, and Isentress). Among others, this category also includes Abilify, an atypical antipsychotic and the most costly drug to Medicaid (Appendix Table A1), and Humira Pen, a drug used to treat arthritis.
The five remaining drugs are expensive at the prescription level but not in the top tenth percentile by prescriptions, and thus we have not defined them as being frequently prescribed.20 Among others, these drugs include the hepatitis C agents Sovaldi and Harvoni.
Case Study A: Opioids
Two opioids are included in Medicaid’s 50 most costly drugs. Hydrocodone-acetaminophen (the generic version of Vicodin), an opioid, is the most frequently prescribed drug in Medicaid over the January 2014 through June 2015 period and is among the 50 most costly drugs over that period (Appendix Tables A1 and A3). Although it provides relief to those experiencing severe pain, it also may be addictive.Also included in the 50 most costly drugs is Suboxone, another opioid used for the treatment of opioid use disorder. Suboxone is the brand-name for the combination drug buprenorphine/naloxone and is intended to be taken as a pill under the tongue; if administered intravenously, the naloxone produces opioid withdrawal symptoms as a deterrent for misuse. Both hydrocodone-acetaminophen and Suboxone fall into the top 50 most costly drugs due to their wide use; neither is in the top 10th percentile of spending per prescriptions. In fact, hydrocodone-acetaminophen is the least expensive drug at the prescription level among the 50 most costly drugs.
As a drug class, opioids were the second most prescribed drug group over the period of study and the most prescribed drug group in 2014 (data not shown). This high level of opioid prescriptions reflects the high level of use of opioids in the U.S. overall, which has been drawing more and more concern in recent years. More than six in ten drug overdoses in the U.S. involve an opioid and since 1999, opioid deaths overall and prescription opioid deaths in particular have quadrupled.21 The high rate of use, including the misuse and abuse, of opioids affects a cross-section of society. More than half of Americans know someone who has died from opioids, has been addicted to them or knows someone who has been, or has taken painkillers that were not prescribed for them or knows someone who has.22
Medicaid patients are prescribed opioids at twice the rate as other patients, and their risk of overdose is three to six times higher than other patients.23 States and the federal government are taking action to address this public health crisis (see Policy Implications) and one of the ways they are doing so is through the expansion of medication-assisted treatments, which is the use of FDA-approved medications such as Suboxone24 in combination with behavioral therapy.
Which Drugs are High Cost to Medicaid?
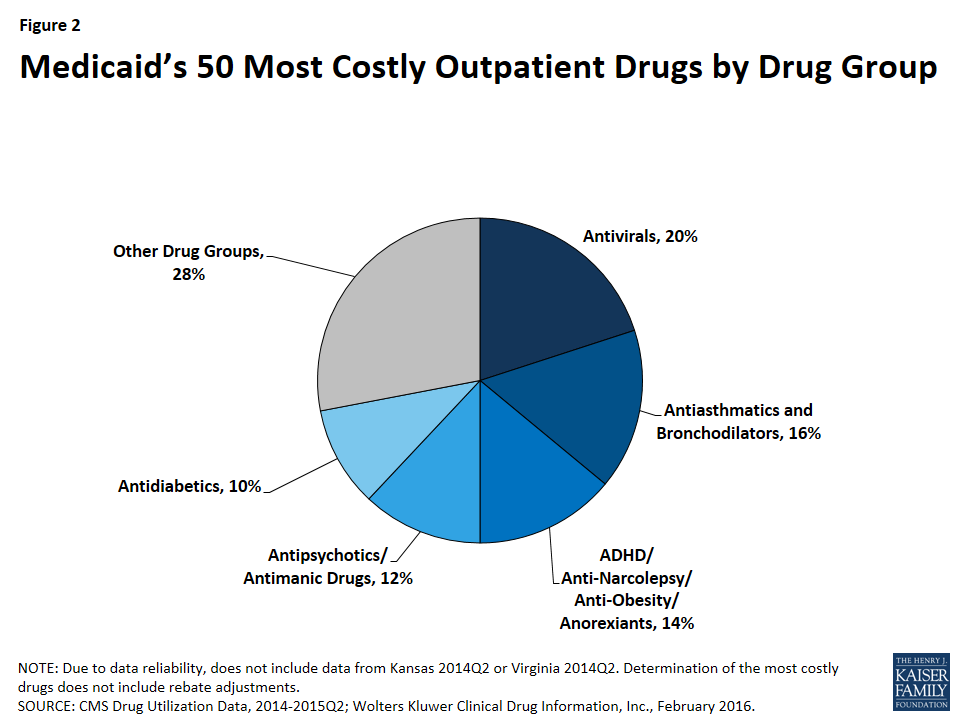
As shown in Figure 2, 72% (36) of the 50 most costly drugs are in five drug groups. Antivirals are the most common drug group among the most costly drugs, accounting for 20% of the top 50 drugs. The antivirals comprise seven antiretrovirals (drugs that are used primarily in the treatment of HIV), two hepatitis C agents, and one other type of antiviral. Reflecting the Medicaid population’s serious health needs, antiretrovirals are widely used in the program.25 Antiretrovirals are also costly on a per prescription basis. Hepatitis C agents are also costly on a per prescription basis but are not as frequently prescribed (Figure 1).
Figure 2: Medicaid’s 50 Most Costly Outpatient Drugs by Drug Group
Antiasthmatics and bronchodilators are the second most common drug group in the 50 most costly drugs, accounting for 16% of the top 50 drugs. These are drugs used in the treatment of asthma and chronic obstructive pulmonary disease (COPD). None of these drugs are among the most expensive per prescription, but all are very frequently prescribed.26
With 14% (7), ADHD/Anti-Narcolepsy/Anti-Obesity/Anorexients are the third most common drug group in the most costly drugs. Although the drug group implies that these drugs can be used for a variety of conditions, the seven drugs within this drug group all have a common indication of attention deficit hyperactivity disorder (ADHD). Like the antiasthmatics and bronchodilators, all of these drugs are frequently prescribed and none of them are as expensive at the prescription level (Appendix Table A1). This high prescription rate is in part attributable to the high incidence rate of ADHD/ADD among children in general, among children in Medicaid, and among foster children in Medicaid.27
Twelve percent (6) of the most costly drugs are antipsychotics. Abilify, the most costly drug to Medicaid, is included within this group. Five out of the six antipsychotics in the 50 most costly drugs are both frequently prescribed and expensive at the prescription level (Appendix Table A1). Antipsychotics are FDA-approved to treat schizophrenia and bipolar disorder; however, they are also frequently prescribed “off-label” for other conditions.28
At ten percent, antidiabetics are the fifth most common drug group among the most costly drugs, with five drugs in this class falling into the top 50 most costly Medicaid drugs. Four of these five antidiabetics are insulins. None of the antidiabetics are in the top tenth percentile of drugs by spending per prescription, although the price of insulin has been increasing in recent years.29 All antidiabetics are very frequently prescribed, reflecting the high number of people in Medicaid who have diabetes: prior to Medicaid expansion, about four million Medicaid beneficiaries were diagnosed with diabetes.30
Case Study B: Hepatitis C Agents
Hepatitis C is a bloodborne virus that often remains asymptomatic in a person for many years or decades but ultimately can cause cirrhosis and cancer of the liver. As many as 5.2 million people in the U.S. have the hepatitis C.31 It disproportionately affects baby boomers and those enrolled in public coverage programs including Medicaid, Medicare, the VA, and state and federal prison systems.32 The prevalence of hepatitis C among Medicaid beneficiaries reflects that the Medicaid population in general has higher health needs than those who are privately insured.33 After the FDA approved it in December 2013,34 Gilead Sciences launched hepatitis C agent Sovaldi at a list price of $84,000 per treatment. Sovaldi is taken in combination with another antiviral, usually ribavirin.35 In October 2014, the FDA approved Gilead’s Harvoni, which does not require another drug to be taken in combination with it,36 and has a list price of $94,500 per treatment. Sovaldi and Harvoni are Direct-Acting Antivirals, which are “breakthrough-therapies,” as the previous standard treatment had a much lower cure rate as well as serious side-effects.37 Although they attracted attention in large part because of their high cost, Sovaldi and Harvoni are not the most expensive outpatient drugs to Medicaid at the prescription level on the market (Appendix Table A2).
In response to the high aggregate cost of these drugs, a majority of state Medicaid programs implemented various restrictions to accessing hepatitis C agents, many of which were based on the progress of the disease in the patient. States have also required alcohol and drug use screenings, consultation with a specialist, once-in-a-lifetime treatment maximums, and favorable viral response to the initial treatment.38 In 2014, only 2.4% of Medicaid enrollees with hepatitis C were able obtain to Sovaldi, in part due to states’ actions.39 State Medicaid programs are permitted to require prior authorization, implement prescription limits, and exclude drugs that are prescribed for a purpose other than their indication. However, they are not permitted to ultimately exclude access to a covered outpatient drug prescribed in accordance with its labeling for a treatment where that drug is an improvement compared to other covered outpatient drugs in terms of “safety, effectiveness, or clinical outcome[s].”40 CMS has expressed concern over the manner in which state Medicaid programs are restricting these drugs, reminding them that they may only restrict covered outpatient drugs in ways consistent with statute.41
A number of lawsuits have been filed against different state Medicaid agencies alleging that the restrictions on hepatitis C treatments are illegal and have caused harm to the plaintiffs.42 In May 2016, a federal court ordered the Washington state Medicaid program to lift the disease severity restrictions on hepatitis C treatments, marking the first time that a federal court declared such state Medicaid program restrictions to hepatitis C drugs illegal.43 Shortly after, in response to legal action and threatened legal action, Florida and then Delaware each announced in June of 2016 that Medicaid beneficiaries with hepatitis C would have access to needed medication, regardless of their stage of liver damage.44
How Does Market Exclusivity Affect Price?
In the absence of competition, a manufacturer may be able to price a drug higher. Patents and regulatory exclusivity, put into place as an incentive for innovation, are ways that a manufacturer can protect their product against competition. Patents have a twenty year duration, but manufacturers generally obtain them while their product is in preclinical and clinical trials, well before the FDA approves their product and well before the product launches. As a result, the duration remaining on the manufacturer’s original patent once the drug launches is usually much shorter than 20 years.45 Separate from the patent system, a manufacturer is also able to obtain regulatory exclusivity for their product from the FDA. Many of the 50 most costly drugs have some form of regulatory exclusivity.
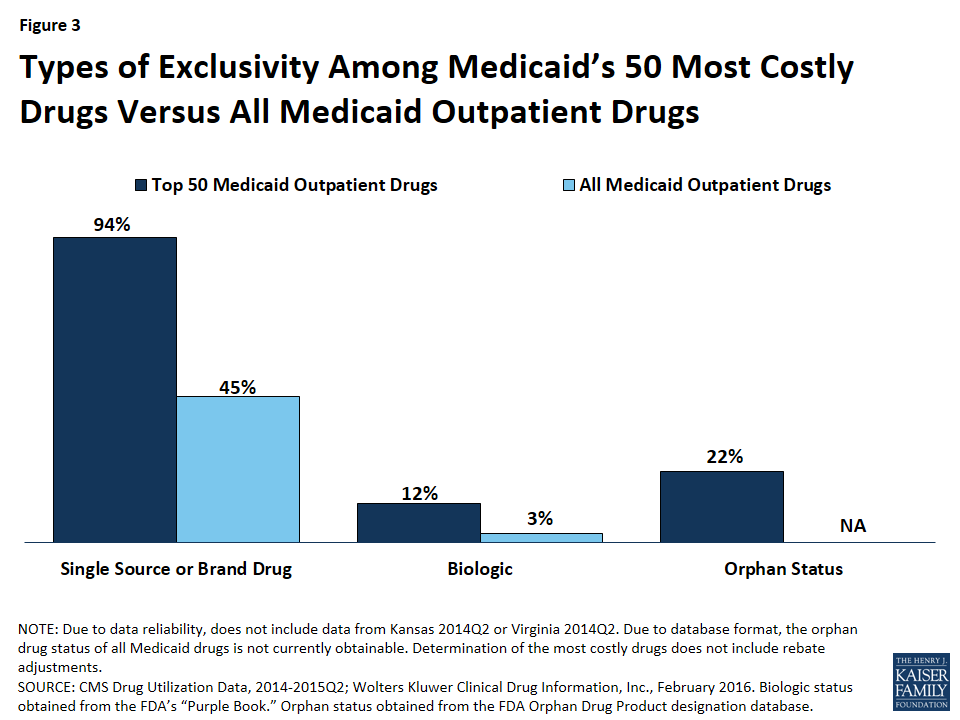
Figure 3: Types of Exclusivity Among Medicaid’s 50 Most Costly Drugs Versus All Medicaid Outpatient Drugs
Case Study C: Abilify
Abilify was Medicaid’s most costly drug from January 2014 through June 2015. It is an atypical antipsychotic,46 as are all of the antipsychotic drugs included in the 50 most costly drugs. The FDA approved Abilify in 2002.47 It is used in the treatment of schizophrenia, bipolar disorder, depression, and Tourette syndrome, and for symptoms of autistic disorder. Despite receiving two black-box warnings,48,49 doctors prescribed it and other atypical antipsychotics for additional diagnoses, such as anxiety and insomnia.50 Abilify was to lose patent protection in the spring of 2015, but shortly before that was to happen, the FDA approved it for the treatment of Tourette syndrome. Abilify’s manufacturer made efforts to stave off generic entry by trying to obtain an orphan drug designation for this new indication that would have ensured exclusivity through 2021, but ultimately they were unsuccessful, and the FDA-approved generic version of Abilify came onto the market in 2015.51 In the face of this loss of patent protection, its manufacturer increased the price of the drug, a strategy often seen before a brand drug’s patent expires.52
Brand Versus Generic Drugs
A brand drug is generally considered to be a drug that has received FDA approval after the manufacturer has proven the drug’s safety and efficacy. The FDA awards a regulatory exclusivity period of 3 or 5 years to brand drugs.53 Regulatory exclusivity provides the manufacturer with a degree of market exclusivity, enabling them to price the drug accordingly and providing incentive for them to market it as a non-commodity, which includes naming the drug with appealing brand name. Alternatively, a manufacturer can obtain FDA approval for their drug by proving that it is bioequivalent to a brand drug,54 skipping the long and expensive process of proving a drug is safe and effective. The FDA identifies these drugs as generic.55 They cannot enter the market while the corresponding brand still has exclusivity.56 Once generic drugs enter the market, the price of the drug usually falls due to competition.
Compared to all drugs reimbursed through Medicaid from January 2014 through June 2015, we found a disproportionate number of the 50 most costly drugs are brands, as opposed to being generics (Figure 3).57 Ninety-four percent of the 50 most costly drugs were available as brand-name drugs, compared to 45% of all drugs reimbursed by Medicaid.
Biologics
A biologic is a drug that is derived from an animal or microorganism. It is more complex than traditional small-molecule drugs synthesized in a lab.58 Because biologics are structurally very different from small molecule drugs and are approved through a different process,59 there was not automatically a structure in place for generic approvals resulting in an absence of a generic market to commoditize biologic drugs. However, as part of the ACA,60 biologics now have 12 years of regulatory exclusivity,61 with an abbreviated pathway for the biosimilars, the biologic equivalent of a generic, now in place. Although biosimilars are expected to lower the price of the original biologic, they are not expected to lower it to that degree that generics lower the price of the original small-molecule brand drug.62 In March 2015, the FDA approved its first biosimilar, Zarxio, and the drug launched the following September.63
We found that 12% (6) of the 50 most costly drugs in Medicaid were biologics, compared with 3% of outpatient drugs reimbursed through Medicaid overall (Figure 3). The 6 biologics in the 50 most costly drugs are Humira Pen (used to treat psoriasis and some types of arthritis), Synagis (used to prevent serious lung disease), Advate (used in the treatment of hemophilia), Enbrel SureClick (used to treat psoriasis and some types of arthritis), Neulasta (used to treat possible side effects of chemotherapy), and NovoSeven RT (used in the treatment of hemophilia). All of these 6 biologics are in the top 5th percentile in terms of Medicaid spending per prescription. Twenty-nine of the 50 most expensive drugs by spending per prescription are biologics, showing that although these drugs are often very expensive, they do not necessarily appear as large budget items for Medicaid because of lower utilization (Appendix Table A2).
Orphan Drugs
The FDA provides orphan drug designations to drugs that treat fewer than 200,000 people in the U.S. or those that treat a disease for which the manufacturer does not expect to recover the cost of the drug.64 Having an orphan drug designation entitles the sponsor to many benefits,65 including a seven-year period of regulatory exclusivity associated with the drug’s indication. The 1982 Orphan Drug Act has generated an increase in the number of drug designations targeting rare diseases.66 However, some argue that it is being used to create blockbuster drugs, as manufacturers slice more common diseases into subtypes affecting fewer than 200,000 Americans and gain an orphan drug designation for a subtype, with the drug ultimately being used widely for other conditions.67
We found that 22% (11) of the 50 most costly drugs had achieved an orphan drug designation at some point (Figure 3). This includes Abilify, the most costly drug to Medicaid. Nine of these 11 drugs were among Medicaid’s top 10th percentile of most prescribed drugs.
Specialty Drugs
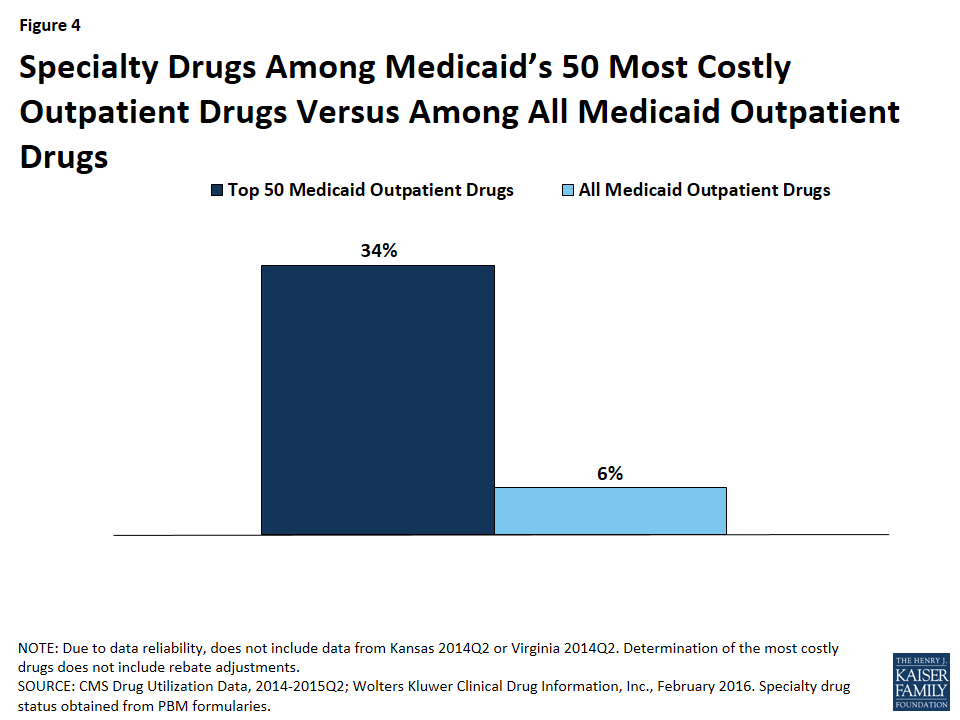
Although there is not one universally accepted definition, a specialty drug is generally considered to be a drug that requires difficult or unusual handling or is for a difficult-to-treat disease. Price is also often an indicator of a specialty drug.68 We found that a disproportionate number of drugs in the 50 most costly drugs are considered specialty drugs based on formulary review, with 34% (17) of the most costly drugs being considered specialty drugs, compared to 6% of all Medicaid covered outpatient drugs (Figure 3). Given that price factors into whether a drug is considered a specialty drug, it is not entirely surprising that so many of the most costly drugs are specialty drugs, and that many have a type of regulatory exclusivity. Of the 17 specialty drugs in the most costly drugs, none are multi-source generics (Appendix Table A1), and all but one are only available as branded single-source products with one labeler (data not shown). Six of the 17 specialty drugs are biologics, meaning that all biologics among the most costly drugs are considered specialty drugs (Appendix Table A1).
Figure 4: Specialty Drugs Among Medicaid’s 50 Most Costly Outpatient Drugs Versus Among All Medicaid Outpatient Drugs
Policy Implications
In this analysis, we found that although all of the most costly drugs to Medicaid are frequently prescribed, expensive at the prescription level, or both; a majority are frequently prescribed. Access to prescription drugs is crucial for the treatment of many conditions found in the Medicaid population, which is more likely to have health issues than the privately insured. Although the prescription drug benefit is not mandatory for states, all state Medicaid programs provide it to their Medicaid beneficiaries. However, it can be expensive, and states are forced to grapple with the costs of the benefit. Additionally, although state Medicaid programs may know a new drug is coming to market, they may not have a sense for how expensive it will be until it reaches the market. States have taken a number of actions to control the budgetary effects of high cost drugs, including implementing new prior authorization requirements and negotiating higher supplemental rebates and lower prices for certain drugs.69
Balancing Cost with Access
Often, drugs that are high-priced are “orphan drugs” that treat rare diseases, which are allowed longer exclusivity so that the manufacturer can earn a profit on the drug. Sovaldi and Harvoni attracted attention because they were priced like orphan drugs,70 but they are for diseases that are prevalent in the Medicaid population. As these drugs were coming to market, nearly all states expressed concern about how the cost of this treatment would affect their Medicaid spending.71 However, while high cost, these drugs are cures for most patients; they are more effective than the previous standard drug treatment for the disease;72 and a full treatment of Sovaldi or Harvoni is less costly than a liver transplant, 73 for which hepatitis C is the leading cause.74 It is important to take a broad view when considering prescription drug costs, as many costly drugs prevent expensive emergency department visits and hospital stays. Regardless, states felt that it was not feasible to provide this drug to every beneficiary with hepatitis C immediately.75 In response, CMS published guidance reminding state Medicaid programs that certain utilization controls are permissible, but when doing so, states must ensure that they are in compliance with statute.76
In general, states can help control the overall costs of drugs by monitoring utilization and aiming to ensure that drugs are not overprescribed to patients. For example, states can require prior authorization or use a preferred drug list to control access. However, states generally must cover FDA-approved drugs for their medically accepted indications.77 States may not replace unreasonable limits on access to medically necessary drugs, such as those that are contrary to the professional standard of care. Many states have attempted to balance the public health need for hepatitis C drugs with their high cost through the implementation of prior authorization and other requirements.78 Spending and utilization for hepatitis C agents is lower than it would have been without these restrictions, but some beneficiaries who need these drugs are unable to access them, and a number of lawsuits have been filed against different state Medicaid agencies challenging state policies that limit access contrary to generally accepted standard of care among medical professionals.
Monitoring High Utilization
Many of the most costly drugs to Medicaid are so costly because they are frequently prescribed, including hydrocodone-acetaminophen, an opioid. While there are many medically necessary reasons to prescribe this drug, there is also a great deal of evidence to suggest overutilization of opioids. There is much that states can do to address the misuse of opioids, such as undertaking provider education; removing methadone79 from the preferred drug lists; establishing clinical criteria for obtaining a methadone prescription; requiring step therapy, prior authorization, or prescription quantity limits; using drug utilization review80 measures to identify potential misuse of opioids; increasing access to and use of prescription drug monitoring program data, and implementing patient review and restriction programs.81 States have acknowledged the severity of this public health crisis, and nearly all have prescription monitoring programs in place.82 There are hundreds of proposals in legislatures to regulate clinics and prescription behavior.83 The federal government has awarded money to health centers to focus on opioid abuse,84 and in March the Centers for Disease Control and Prevention released opioid prescription guidelines.85 Also as part of its collection of Medicaid quality measures, CMS is beginning to collect information on the use of opioids from multiple providers among non-cancer patients.86
Opioids are not the only drug at risk of being overprescribed. Three of the seven ADHD/Anti-Narcolepsy/Anti-Obesity/Anorexients are amphetamines, which are stimulants and have a black box warning of “high potential for abuse.”87 There is also general concern over the use of antipsychotics among children enrolled in Medicaid. As part of its collection of Medicaid and CHIP quality measures, CMS is beginning to collect information on children prescribed more than one antipsychotic at a time.88 As states monitor opioid and other drug groups as a way to address public health needs, they may realize budget savings due to lower utilization as well.
Promoting Innovation
Although policy makers are concerned with the cost of the prescription drug benefit, they also are concerned with beneficiaries having access to cures and treatments, and part of enabling this is incentivizing the pharmaceutical industry to research and bring to market new and needed drugs. In the U.S., innovation in the pharmaceutical industry is incentivized through regulatory exclusivity. This analysis has shown that many high cost drugs have some form of regulatory exclusivity. As Congress searches for ways to encourage innovation, they also remain aware of the varying ability for different payers to sustain these incentives. Nonetheless, although different payers face different parameters than Medicaid when paying for prescription drugs, this struggle to balance incentivizing innovation with actually being able to pay for the prescribed drugs is not unique to Medicaid alone, but a common challenge across the entire U.S. health care system.
Single-Source or Brand (B) vs. Multi-Source Generic (G)
Drug Group
Medicaid Spending Per Prescription Percentile*
Number of Prescriptions Percentile**
1
Abilify
X
B
Antipsychotics/Antimanic Agents
90th
99th
2
Sovaldi
X
B
Antivirals
99th
75th
3
Vyvanse
B
ADHD/Anti-Narcolepsy/Anti-Obesity/Anorexiants
75th
99th
4
Harvoni
X
B
Antivirals
99th
75th
5
Truvada
X
B
Antivirals
90th
95th
6
Lantus
B
Antidiabetics
75th
95th
7
Methylphenidate HCl ER
B & G
ADHD/Anti-Narcolepsy/Anti-Obesity/Anorexiants
75th
99th
8
Atripla
X
B
Antivirals
95th
95th
9
Advair Diskus
B
Antiasthmatic and Bronchodilator Agents
75th
95th
10
Lantus SoloStar
B
Antidiabetics
75th
95th
11
Seroquel XR
B
Antipsychotics/Antimanic Agents
90th
95th
12
Latuda
B
Antipsychotics/Antimanic Agents
90th
95th
13
Humira Pen
X
X
X
B
Anti-Inflammatory Analgesics
95th
90th
14
Adderall XR
B
ADHD/Anti-Narcolepsy/Anti-Obesity/Anorexiants
75th
95th
15
Suboxone
X
B
Opioid Analgesics
75th
95th
16
Invega Sustenna
B
Antipsychotics/Antimanic Agents
90th
95th
17
Flovent HFA
B
Antiasthmatic and Bronchodilator Agents
75th
95th
18
Lyrica
B
Anticonvulsants
75th
95th
19
Spiriva HandiHaler
X
B
Antiasthmatic and Bronchodilator Agents
75th
95th
20
ProAir HFA
B
Antiasthmatic and Bronchodilator Agents
50th
99th
21
Symbicort
B
Antiasthmatic and Bronchodilator Agents
75th
95th
22
Intuniv
B
ADHD/Anti-Narcolepsy/Anti-Obesity/Anorexiants
75th
95th
23
Synagis
X
X
B
Passive Immunizing Agents
95th
90th
24
Prezista
X
B
Antivirals
90th
95th
25
Stribild
X
B
Antivirals
95th
90th
26
Advate
X
X
B
Hematological Agents
99th
75th
27
Ventolin HFA
B
Antiasthmatic and Bronchodilator Agents
50th
99th
28
Focalin XR
B
ADHD/Anti-Narcolepsy/Anti-Obesity/Anorexiants
75th
95th
29
Strattera
X
B
ADHD/Anti-Narcolepsy/Anti-Obesity/Anorexiants
75th
95th
30
Qvar
B
Antiasthmatic and Bronchodilator Agents
50th
95th
31
Januvia
B
Antidiabetics
75th
95th
32
Humalog
B
Antidiabetics
75th
95th
33
Complera
X
B
Antivirals
95th
90th
34
Reyataz
X
B
Antivirals
90th
90th
35
Copaxone
X
X
B
Psychotherapeutic and Neurological Agents
95th
75th
36
Duloxetine HCl
G
Antidepressants
50th
95th
37
Hydrocodone-Acetaminophen
B & G
Opioid Analgesics
25th
99th
38
Tamiflu
B
Antivirals
75th
95th
39
Nexium
B
Ulcer Drugs
75th
95th
40
Enbrel SureClick
X
X
X
B
Anti-Inflammatory Analgesics
95th
90th
41
Neulasta
X
X
X
B
Hematopoietic Agents
95th
90th
42
Novolog FlexPen
B
Antidiabetics
75th
95th
43
NovoSeven RT
X
X
X
B
Hematological Agents
99th
50th
44
Norditropin FlexPro
X
X
B
Endocrine and Metabolic Agents
95th
90th
45
Isentress
X
B
Antivirals
90th
90th
46
Divalproex Sodium ER
G
Anticonvulsants
50th
95th
47
Seroquel
B
Antipsychotics/Antimanic Agents
75th
95th
48
Budesonide
X
B & G
Antiasthmatic and Bronchodilator Agents
75th
95th
49
Invega
B
Antipsychotics/Antimanic Agents
90th
90th
50
Amphetamine-Dextroamphet ER
G
ADHD/Anti-Narcolepsy/Anti-Obesity/Anorexiants
50th
95th
*We calculated average spending before rebates per prescription for each drug over the 2014Q1-2015Q2 period and identified notable percentiles. Medicaid Spending Per Prescription Percentile reflects how expensive each drug is before rebates at the prescription level, with respect to other Medicaid-reimbursed drugs, with 99th being the most expensive.
**We summed the number of prescriptions for each drug over the 2014Q1-2015Q2 period and identified notable percentiles. Number of Prescriptions Percentile reflects how frequently prescribed each drug is, with respect to other Medicaid-reimbursed drugs, with 99th being the most prescribed.
Appendix Table A2: Medicaid’s Most Expensive Drugs by Spending per Rx, 2014Q1 – 2015Q2
Ranking
Drug Name
Average Medicaid SpendingBefore Rebates Per Rx
Specialty Drug
Biologic
Drug Group
1
NovoSeven RT
$58,843
X
X
Hematological Agents
2
Koate-DVI
$57,162
X
X
Hematological Agents
3
Feiba
$48,366
X
X
Hematological Agents
4
Adagen
$44,551
Miscellaneous Biologicals
5
HP Acthar
$43,877
X
Endocrine and Metabolic Agents
6
Vimizim
$40,571
X
X
Endocrine and Metabolic Agents
7
Myalept
$39,945
X
X
Endocrine and Metabolic Agents
8
Chenodal
$39,556
Gastrointestinal Agents
9
Carbaglu
$39,100
X
Endocrine and Metabolic Agents
10
Feiba NF
$36,418
X
X
Hematological Agents
11
Ruconest
$33,659
X
X
Hematological Agents
12
Gattex
$31,854
X
Gastrointestinal Agents
13
Cinryze
$31,640
X
X
Hematological Agents
14
Firazyr
$31,103
X
Hematological Agents
15
Alprolix
$30,743
X
X
Hematological Agents
16
Harvoni
$28,977
X
Antivirals
17
Novoeight
$28,897
X
X
Hematological Agents
18
Alphanate/VWF Complex/Human
$28,571
X
X
Hematological Agents
19
Juxtapid
$28,502
Antihyperlipidemics
20
Rixubis
$28,330
X
X
Hematological Agents
21
Cholbam
$27,422
Gastrointestinal Agents
22
Berinert
$26,890
X
X
Hematological Agents
23
Procysbi
$26,753
X
Genitourinary Agents
24
Sovaldi
$26,612
X
Antivirals
25
Orfadin
$26,562
Endocrine and Metabolic Agents
26
Actimmune
$26,480
X
X
Antineoplastics and Adjunctive Therapies
27
Cerdelga
$26,053
X
Hematopoietic Agents
28
Viekira Pak
$25,952
X
Antivirals
29
Ravicti
$25,840
X
Endocrine and Metabolic Agents
30
Hemofil M
$25,205
X
X
Hematological Agents
31
Eloctate
$24,906
X
X
Hematological Agents
32
Xyntha Solofuse
$23,846
X
X
Hematological Agents
33
Kalydeco
$22,750
X
Respiratory Agents
34
Zavesca
$22,653
X
Hematopoietic Agents
35
Mononine
$22,647
X
X
Hematological Agents
36
Ceprotin
$21,859
X
X
Hematological Agents
37
Yervoy
$21,354
X
X
Antineoplastics and Adjunctive Therapies
38
Olysio
$21,060
X
Antivirals
39
Kalbitor
$20,946
X
X
Hematological Agents
40
Incivek
$20,575
X
Antivirals
41
BeneFIX
$20,019
X
X
Hematological Agents
42
Kogenate FS
$20,017
X
X
Hematological Agents
43
Kynamro
$19,731
X
Antihyperlipidemics
44
Corifact
$19,539
X
X
Hematological Agents
45
Arcalyst
$19,014
X
X
Anti-inflammatory Analgesics
46
Lumizyme
$18,855
X
X
Endocrine and Metabolic Agents
47
Kogenate FS Bio-Set
$18,710
X
X
Hematological Agents
48
AlphaNine SD
$18,389
X
X
Hematological Agents
49
Ilaris
$18,133
X
X
Anti-inflammatory Analgesics
50
Supprelin LA
$18,113
X
Endocrine and Metabolic Agents
NOTE: This table reflects Medicaid spending before rebates per prescription. A course of treatment for an illness may require multiple prescriptions. For example, a full treatment course for Hepatitis C agents Sovaldi and Harvoni often lasts three months and may require multiple prescriptions.
Appendix Table A3: Medicaid’s Most Prescribed Drugs, 2014Q1 – 2015Q2
Ranking
Drug Name
Drug Group
1
Hydrocodone-Acetaminophen
Opioid Analgesics
2
Amoxicillin
Penicillins
3
Ibuprofen
Anti-inflammatory Analgesics
4
Lisinopril
Antihypertensives
5
Omeprazole
Ulcer Drugs
6
Azithromycin
Macrolides
7
Gabapentin
Anticonvulsants
8
Fluticasone Propionate
Nasal Agents
9
Metformin HCl
Antidiabetics
10
Levothyroxine Sodium
Thyroid Agents
11
Cetirizine HCl
Antihistamines
12
Montelukast Sodium
Antiasthmatic and Bronchodilator Agents
13
ProAir HFA
Antiasthmatic and Bronchodilator Agents
14
Amlodipine Besylate
Calcium Channel Blockers
15
Albuterol Sulfate
Antiasthmatic and Bronchodilator Agents
16
Loratadine
Antihistamines
17
Ventolin HFA
Antiasthmatic and Bronchodilator Agents
18
Simvastatin
Antihyperlipidemics
19
Sertraline HCl
Antidepressants
20
Tramadol HCl
Opioid Analgesics
21
Oxycodone-Acetaminophen
Opioid Analgesics
22
Trazodone HCl
Antidepressants
23
Vitamin D (Ergocalciferol)
Vitamins
24
Alprazolam
Antianxiety Agents
25
Atorvastatin Calcium
Antihyperlipidemics
26
Hydrochlorothiazide
Diuretics
27
Clonazepam
Anticonvulsants
28
Citalopram Hydrobromide
Antidepressants
29
Cyclobenzaprine HCl
Musculoskelatal Therapy Agents
30
Ranitidine HCl
Ulcer Drugs
31
Fluoxetine HCl
Antidepressants
32
Amoxicillin-Potassium Clavulanate
Penicillins
33
Prednisone
Corticosteroids
34
Clonidine HCl
Antihypertensives
35
Risperidone
Antipsychotics/Antimanic Agents
36
Sulfamethoxazole-Trimethoprim
Anti-Infective Agents
37
Cephalexin
Cephalosporins
38
Metoprolol Tartrate
Beta Blockers
39
Methylphenidate HCl ER
ADHD/Anti-Narcolepsy/Anti-Obesity/Anorexiants
40
Quetiapine Fumarate
Antipsychotics/Antimanic Agents
41
Ondansetron HCl
Antiemetics
42
Triamcinolone Acetonide
Nasal Agents
43
Naproxen
Anti-inflammatory Analgesics
44
Vyvanse
ADHD/Anti-Narcolepsy/Anti-Obesity/Anorexiants
45
Furosemide
Diuretics
46
Oxycodone HCl
Opioid Analgesics
47
Zolpidem Tartrate
Hypnotics/Sedatives/Sleep Disorder Agents
48
Aspirin EC Low Dose
Nonnarcotic Analgesics
49
Lorazepam
Antianxiety Agents
50
Pantoprazole Sodium
Ulcer Drugs
Appendices: Appendix B: Methodology
For our analysis of the 50 most costly drugs in the Medicaid program, we used 2014 and quarters one and two of 2015 State Drug Utilization Data available from CMS merged with data from Wolters Kluwer Clinical Drug Information, Inc (“WKCDI”).89 The State Drug Utilization Data is publicly available data used as part of the Medicaid Drug Rebate Program. This data provides information on the number of prescriptions, Medicaid spending, and cost-sharing for rebate-eligible Medicaid outpatient drugs at the National Drug Code (NDC) level. The WKCDI data provides product information for drug products. We accessed State Drug Utilization Data in February 2016 and used the most recent data available for all states. The WKCDI data is also from February 2016. The use of WKCDI data does not represent and should not be characterized as a WKCDI endorsement of any data, findings, or other content presented in this report.
We merged the State Drug Utilization Data and the WKCDI data at the NDC-level to consistently identify the drug name, as well as to incorporate brand versus generic status and the WKCDI Therapeutic Classifications System’s drug group. We classified single-source and multi-source, originator drugs as brand drugs. If a drug was available as both a brand and a generic, we categorized it as a brand when summarizing how many of the most costly drugs were brands and how many were generics. Using the Center for Drug Evaluation and Research List of Licensed Biological Products and the Center for Biologic Evaluation and Research List of Licensed Biological Products90 as of February 2016, we identified all biologics in the State Drug Utilization Data based on drug name. We looked up the orphan drug status of the 50 most costly drugs in Medicaid in the Orphan Drug Product designation database.91 To identify specialty drugs in the State Drug Utilization Data, we compiled a list using formularies from the top Medicaid pharmacy benefit managers.92 We identified specialty drugs using the drug name.
To determine the 50 most costly drugs to Medicaid, we summed total Medicaid spending before rebates by drug name over the 2014 quarter one through 2015 quarter two period. Due to data reliability, we were unable to include 2014 quarter two data from Kansas or Virginia. We also calculated average Medicaid spending per prescription and summed total prescriptions by drug name over this period. We ranked the drugs by spending per prescription and total prescriptions, calculated their percentiles, and identified a drug as “frequently prescribed” or “expensive at the prescription level” if it was in the top 10th percentile of either. We included the 50 most expensive drugs by spending per prescription and the 50 most prescribed drugs over the period in the Appendix tables. When reporting the former, we only included drugs with ten or more prescriptions to avoid any outliers in the data.
Limitations
This analysis does not include rebates, because this data is unavailable to the public at the NDC level. Rebates have a considerable effect on Medicaid drugs spending overall, but lower spending at the drug level at different rates.
Additionally, although Medicaid beneficiaries largely self-administer drugs that are prescribed in an outpatient setting, medical practitioners must administer some drugs. Although states are to collect drug rebates on all reimbursed outpatient drugs, regardless of whether they are physician- or self-administered, research has shown that not all states are collecting rebates on physician-administered drugs.93 Because biologics and other specialty drugs are often physician-administered, it is possible that the data reflects lower Medicaid spending and utilization of certain drugs of this kind.
In aggregate, the 50 most costly drugs compose about 40% of Medicaid drug spending before rebates over this period. ↩︎
This is the case for beneficiaries not also dually enrolled in Medicare. Since 2006, Medicare Part D has paid for outpatient prescriptions of beneficiaries dually enrolled in Medicaid and Medicare. ↩︎
This includes outpatient prescription drug spending for both managed care and fee-for-service, as well as incorporating rebates. Share of Medicaid spending does not include administrative or other non-personal care Medicaid spending. See National Health Expenditure Accounts, op. cit. ↩︎
Smith, Gifford, Ellis, Rudowitz, Snyder, and Hinton, op. cit. ↩︎
Spending does not include rebates. For further details see the methodology section in the appendix. ↩︎
Four out of five of these drugs are in the top quartile by prescriptions. The fifth is in the top 50th percentile by prescriptions. Although these drugs do not meet our definition of being “frequently prescribed,” they also are not rarely prescribed. ↩︎
Twenty-four percent of non-institutionalized Medicaid and CHIP enrollees had respiratory diseases in 2013 that incurred medical expenses. KFF analysis of 2013 Medical Expenditure Panel Survey (MEPS) household component, meps.ahrq.gov/mepsweb/. ↩︎
Louise Carton, Olivier Cottencin, Maryse Lapeyre-Mestre, Pierre Geoffroy, Jonathan Favre, Nicolas Simon, Regis Bordet, and Benjamin Rolland, “Off-Label Prescribing of Antipsychotics in Adults, Children, and Elderly Individuals: A Systematic Review of Recent Prescription Trends,” Current Pharmaceutical Design, 21, 23 (2015): 3280-3297, http://www.eurekaselect.com/132298/article. This practice of prescribing medications for uses not approved by the FDA is called “off-label prescribing” and is legal for non-controlled substances such as opioids. However, it is illegal for a pharmaceutical company to market the drug for off-label uses. See “Off-label Drug Use,” American Cancer Society, accessed July 6, 2016, http://www.cancer.org/treatment/treatmentsandsideeffects/treatmenttypes/chemotherapy/off-label-drug-use. ↩︎
Robert Field, “Regulation of Drugs and Health Care Products” in Health Care Regulation in America: Complexity, Confrontation, and Compromise, (Oxford, England: Oxford University Press, 2007), 115-140. ↩︎
Atypical antipsychotics are the second generation of antipsychotic drugs. They came onto the market in 1993, had fewer neurological side-effects than first generation antipsychotics, and were thought to be more effective in some schizophrenia symptoms. See Richard A. Friedman, “A Call for Caution on Antipsychotic Drugs,” New York Times, September 24, 2012, http://www.nytimes.com/2012/09/25/health/a-call-for-caution-in-the-use-of-antipsychotic-drugs.html. ↩︎
A boxed warning, commonly known as a “black box warning,” is a FDA warning added to the drug label describing serious or life-threatening risks. See “A Guide to Drug Safety Terms at the FDA,” FDA, accessed July 6, 2016, http://www.fda.gov/downloads/ForConsumers/ConsumerUpdates/UCM107976.pdf. It warns prescribing physicians to seriously consider the benefits of the drug given the known serious risks. Black box warnings can have an effect on the sales of the drug. See Lara Maggs and Aaron Kesselheim, “The Role of Black Box Warnings in Safe Prescribing Practices,” Health Affairs Blog, August 20 2014, http://healthaffairs.org/blog/2014/08/20/the-role-of-black-box-warnings-in-safe-prescribing-practices/. ↩︎
The FDA approved Abilify for treating children with Tourette syndrome in late 2014 and provided it with an orphan drug designation. Then, despite the sponsor not having applied for it, the FDA broadened Abilify’s designation to also include adults with Tourette syndrome, meaning that the population with the disease was too large for an orphan drug designation. Although Abilify’s manufacturer contested this, saying that the FDA could not provide a drug with a designation for which the sponsor had not applied, they were not successful in their bid. See Ed Silverman, “FDA Approves Generic Abilify After Unusual Legal Battle with Otsuka,” The Wall Street Journal, April 29, 2015, http://blogs.wsj.com/pharmalot/2015/04/29/fda-approves-generic-abilify-after-unusual-legal-battle-with-otsuka-2/. ↩︎
The 2014 Drug Trend Report, (Express Scripts, March 2015). ↩︎
If the New Drug Application (NDA) is for a drug with an active ingredient that the FDA has previously approved, but this drug is a new dosage form, new indication, or is now available as over-the-counter, the FDA approval grants a 3-year regulatory exclusivity period. If the drug contains chemical entities that have not previously been submitted to the FDA, the FDA generally grants a 5-year regulatory exclusivity period. The FDA provides an additional six months of exclusivity to sponsors who run pediatric studies on the submitted drug. See John Thomas, The Role of Patents and Regulatory Exclusivities in Pharmaceutical Innovation, (Washington DC: Congressional Research Service, January 7, 2013), http://www.ipmall.info/hosted_resources/crs/R42890_130107.pdf. ↩︎
The Drug Price Competition and Patent Term Restoration Act of 1984, usually referred to as the Hatch-Waxman Act, created this framework of bringing generic drugs to market by allowing sponsors to file Abbreviated New Drug Applications (ANDAs) where they proved bioequivalence. At the same time, the Hatch-Waxman Act incentivized innovation by rewarding sponsors of new molecular entities and other brand drugs with varying lengths of regulatory exclusivity. ↩︎
We considered a drug a brand-name drug if it was single-source, or if it was the originator product, but is now available from multiple sources. ↩︎
A manufacturer obtains FDA approval for a biologic through a Biologic License Approval (BLA) as opposed to an NDA or an ANDA. ↩︎
Specifically, the part of the ACA that creates a framework for the approval of biosimilars and regulatory exclusivity to the original biologic is referred to as the Biologics Price Competition and Innovation Act. Biosimilars are not bioequivalent to the previously approved FDA biologic, in contrast to generic drugs which are bioequivalent to previously approved small-molecule drugs. Instead, biosimilars must be highly similar and interchangeable with the previously approved biologics. ↩︎
It is possible that this may change in the future if the Trans-Pacific Partnership passes, as one point of negotiations between countries was the period of regulatory exclusivity for biologics. ↩︎
Zarxio is a biosimilar to Neupogen, a biologic used to stimulate white blood cell growth in the treatment of cancer, bone marrow transplants, and chemotherapy. (“Neupogen,” Drugs.com, accessed July 6, 2016, http://www.drugs.com/neupogen.html.) However, Neupogen was not one of the 50 most costly drugs, nor was it one of the 50 most expensive drugs per prescription (Appendix Table A2). ↩︎
Congress passed the Orphan Drug Act in 1982 to provide incentive for manufacturers to produce drugs for diseases rare enough that there had not previously been financial incentive to do so. Congress amended the law three times in the 80s, eventually arriving at these parameters for an orphan drug designation. See Gary Pulsinelli, “The Orphan Drug Act: What’s Right with It,” Santa Clara High Technology Law Journal, 5, 2. (January 1999): http://digitalcommons.law.scu.edu/cgi/viewcontent.cgi?article=1247&context=chtlj and “Developing Products for Rare Diseases & Conditions,” FDA, accessed July 6, 2016, http://www.fda.gov/ForIndustry/DevelopingProductsforRareDiseasesConditions/ucm2005525.htm. ↩︎
These benefits also include federal funding for clinical trials and tax breaks, as well as other advantages. See Aaron Kesselheim, “Innovation and the Orphan Drug Act, 1983-2009: Regulatory and Clinical Characteristics of Approved Orphan Drugs” in Rare Diseases and Orphan Products: Accelerating Research and Development, (Washington DC: Institute of Medicine, 2010), 291-308, http://www.ncbi.nlm.nih.gov/books/NBK56187/. ↩︎
“Assuring Medicaid Beneficiaries Access to Hepatitis C (HCV) Drugs,” op. cit. ↩︎
42 USC § 1396r-8(d). States may restrict certain drugs categorically, but hepatitis C agents are not on this list. Statute allows states to restrict weight loss or weight gain drugs; fertility drugs; cosmetic or hair growth drugs; cold or cough relief drugs; smoking cessation drugs; vitamins and minerals, except for prenatal use; non-prescription drugs, except for pregnant women; drugs where along with them, the manufacturer requires certain tests or services be provided by a designee; barbituates; benzodiazepines; and drugs for sexual or erectile dysfunction, unless these drugs are used for another approved condition. ↩︎
B.E. and A.R. v. Teeter, op. cit. and CMS, “Assuring Medicaid Beneficiaries Access to Hepatitis C (HCV) Drugs,” op. cit. ↩︎
Methadone is a type of opioid. It is used for the treatment of opioid use disorder, and more recently, for the treatment of pain. However, it is a “complex medication to prescribe for pain relief,” and as a treatment for pain is associated with a disproportionate share of opioid-related deaths. See Wachino, 2016, op. cit. ↩︎
Drug Utilization Reviews are a mechanism for state Medicaid programs to monitor beneficiaries’ prescriptions to prevent potential oversights that might harm beneficiaries, such as drug-disease contraindications or incorrect dosages. They are also a way for state Medicaid programs to identify overuse, abuse, or fraud within the prescription drug benefit. See “Drug Utilization Review,” CMS, accessed July 6, 2016, https://www.medicaid.gov/medicaid-chip-program-information/by-topics/benefits/prescription-drugs/drug-utilization-review.html. ↩︎
Wachino, 2016, op. cit. CMCS also outlines ways to increase the availability and administration of naloxone, a drug used to counteract opioid overdoses, as well as ways to expand treatments for opioid use disorder. ↩︎
We pulled formulary information from CVS CareMark, Express Scripts, and Optum Rx. ↩︎
“States Collection of Medicaid Rebates for Physician Administered Drugs,” (Washington DC: U.S. Department of Health and Human Services- Office of Inspector General, June 2011), http://oig.hhs.gov/oei/reports/oei-03-09-00410.pdf. For further discussion, see Bruen and Young, December 2014, op cit.
↩︎
Costly specialty drugs, such as those used to treat Hepatitis C and HIV, are among the most costly medications in state Medicaid programs, chiefly because of their high prices for a course of treatment, according to a new Kaiser Family Foundation analysis of Medicaid’s most costly outpatient drugs.
Abilify, an antiphsychotic used in the treatment of schizophrenia and bipolar disorder, was the most costly drug in state Medicaid programs overall in the new analysis, which examines the 50 most costly drugs to Medicaid before rebates (which bring down the final cost to the program and vary across drugs) between January 2014 and June 2015. The analysis explains that drugs can be costly to the program because each prescription costs a lot or because they are heavily prescribed — or both.
Hepatitis C drugs Sovaldi and Harvoni rank second and fourth in the analysis, mainly because of the high price for a course of treatment. These drugs cure Hepatitis C in the vast majority of patients and their use spiked over the period of the analysis following their introduction.
With over 70 million beneficiaries, many with complicated health needs, Medicaid is one of the largest providers of prescription drugs in the U.S., spending $27.3 billion on outpatient drugs (after rebates) in 2014. In addition to Abilify, Sovaldi and Harvoni, the top 5 most costly drugs for Medicaid overall before rebates included Vyvanse, used to treat ADHD, and Truvada, which is used to treat HIV.
The most prescribed drug in Medicaid programs was the opioid hydrocodone-acetaminophen, the generic form of the painkiller Vicodin. It ranked 37th in total cost before rebates due to its more modest price compared to other medications on the list.
The analysis uses State Drug Utilization Data from CMS and Wolters Kluwer Clinical Drug Information data to examine which drugs were the most costly for Medicaid, and why. It includes detailed breakouts of the most costly drugs overall, the most frequently-prescribed and the most expensive per prescription. The analysis also discusses policy implications as state Medicaid officials balance access to drugs with the cost to their programs.
On Health Care Issues, Voters Give Hillary Clinton a Substantial Edge Over Donald Trump
Opinion on the ACA Tilts Narrowly To Unfavorable Views, But Voters Lean Toward Democrats on Major Health Issues, Including Handling Drug Prices, Medicare, and the ACA’s Future
Most Americans Worry about Large Number of Zika Cases in U.S. Over Next Year
While the public tilts narrowly toward unfavorable views of the Affordable Care Act, presumptive Democratic nominee Hillary Clinton holds a clear advantage on health care issues over presumptive Republican nominee Donald Trump as the 2016 national political conventions approach, and voters generally, including independents, favor Democrats on health issues, the latest Kaiser Health Tracking Poll finds.
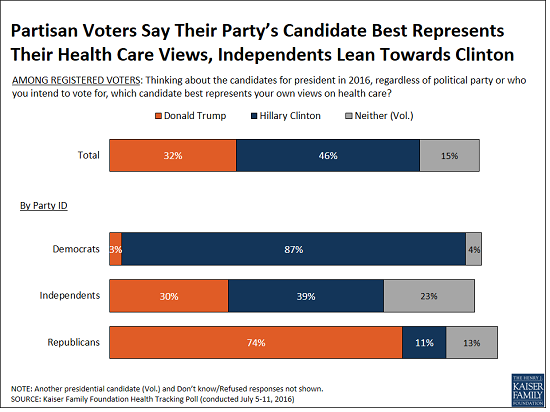
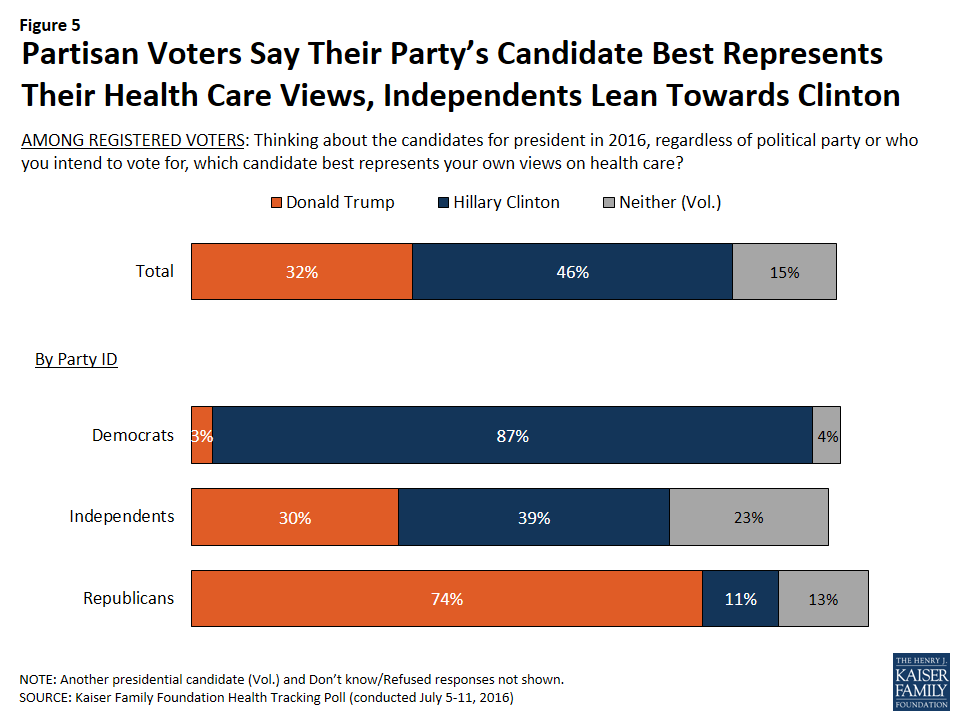
When asked which of the major party’s presumptive presidential nominees best represents their health care views, more voters choose Hillary Clinton (46%) than Donald Trump (32%), with 15 percent saying “neither.” Most partisans choose their party’s nominee, with a larger share of Republicans (11%) naming Hillary Clinton than Democrats naming Donald Trump (3%). Independent voters are slightly more likely to name Clinton (39%) than Trump (30%) as the candidate who best represents their views on health care, though nearly a quarter (23%) say “neither” does.
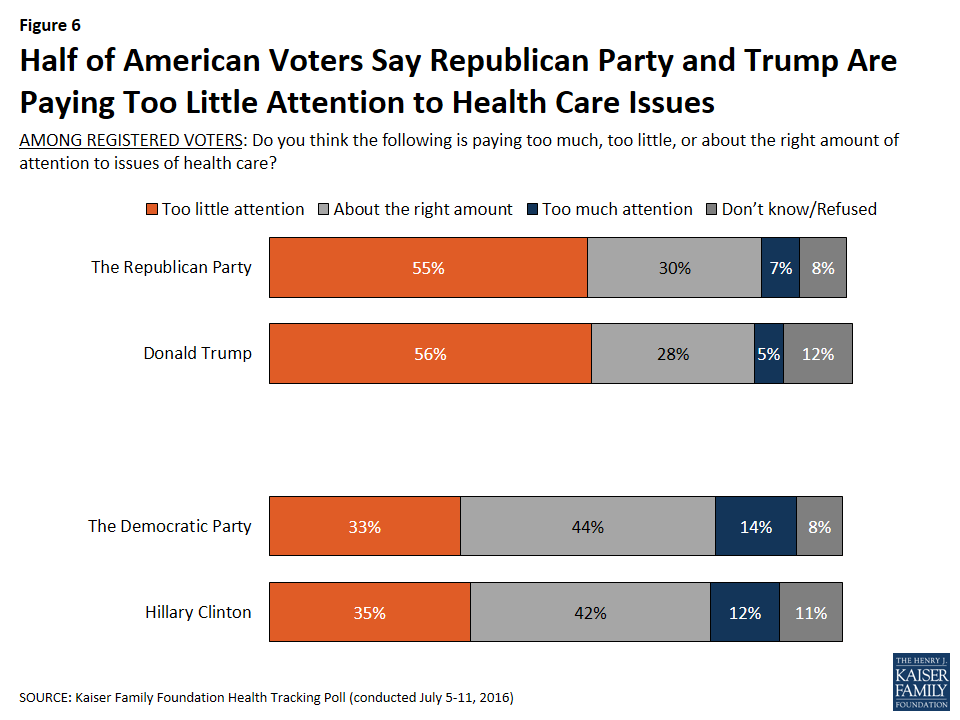
The survey also finds more than half (56%) of voters say Donald Trump is paying too little attention to health care issues. Fewer (35%) say the same about Hillary Clinton.
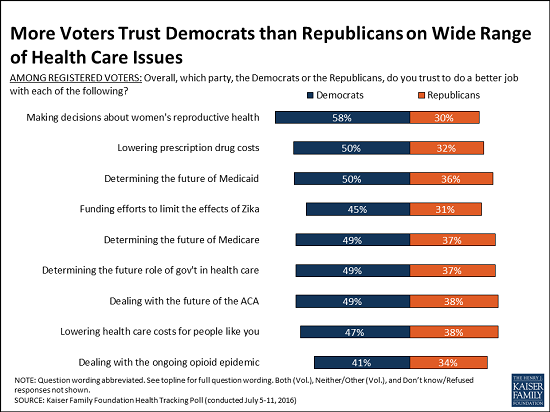
Voters are also more likely to say they trust Democrats than Republicans on a list of major national health care issues: women’s reproductive health choices, drug costs, Zika funding, Medicaid, Medicare, the government’s role in health care, the future of the Affordable Care Act, health care costs, and opioids. This again reflects the role of independents, who lean toward Democrats on each of these issues.
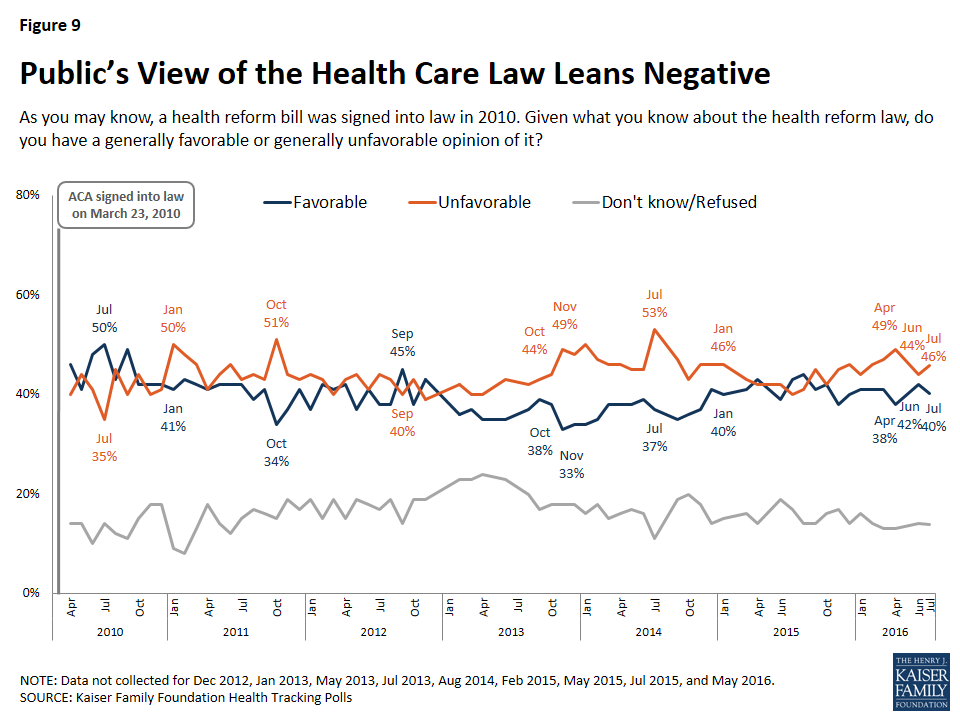
On the future of the Affordable Care Act, the poll finds an 11-percentage-point advantage for the Democratic Party over the Republican Party on who voters trust more (49% v. 38%). This gap exists even though voters have a somewhat negative view of the Affordable Care Act overall, with 47 percent viewing it unfavorably and 40 percent viewing it favorably. The public overall has similar views of the law (46% unfavorable, 40% favorable).
When it comes to determining the future of the Medicare program, 45 percent of senior voters say they trust the Democratic Party, compared to 41 percent for the Republican Party. Among female voters, about six in ten (62%) say they trust the Democratic Party to make decisions about women’s reproductive health compared to about one in four (27%) who say they trust the Republican Party. Democrats also hold advantages on three health issues currently in the news: lowering drug prices (an 18 percentage-point spread); Zika (14 points); and opioids (7 points).
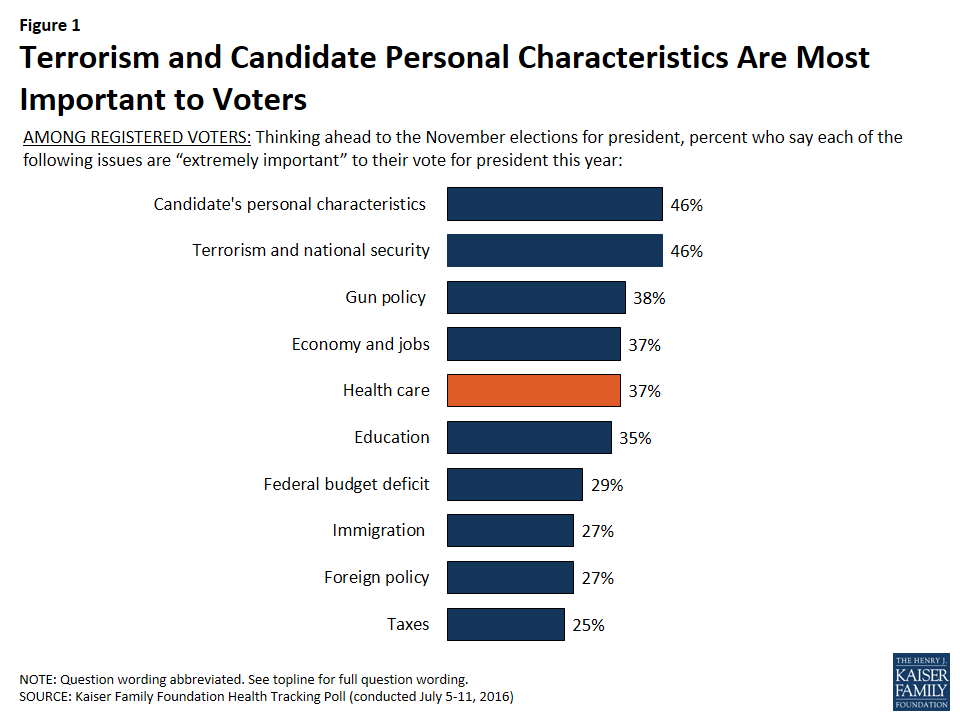
These differences do not necessarily mean that health will be a major factor in the election, according to the poll. When asked about factors that will influence their vote, nearly half of voters cite terrorism/national security (46%) as “extremely” important to their vote for president, but in a campaign which so far has not focused on policy, an equal share (46%) name the candidates’ personal characteristics, including leadership ability, character, values, and experience, as “extremely” important.
Health care, cited as “extremely” important by 37 percent of voters, is in a group of issues ranked further down the priority list, including gun policy (38%), the economy and jobs (37%), and education (35%). Democratic and Republican voters are about as likely to list health care as an extremely important issue this cycle, which contrasts with recent elections where Democrats were more likely to rank health care as a top issue.
Other findings include:
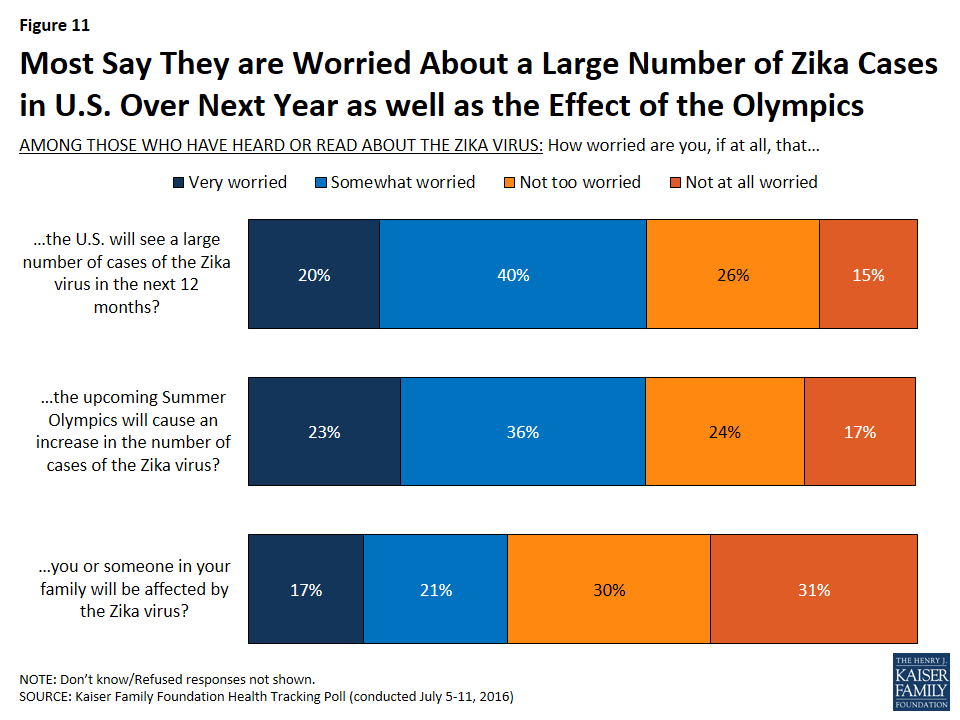
The survey finds the vast majority of Americans (89%) have heard or read about the Zika virus, up slightly from June. About six in ten of this group are at least somewhat worried that the U.S. will see a large number of Zika cases in the next year (59%) and that the upcoming Summer Olympics in Rio will cause an increase in cases (59%). Fewer (39%) worry that they or someone in their family will be affected by Zika.
Slightly more than four in 10 Americans (43%) say they know someone who has been addicted to prescription painkillers, including one in five (19%) who say they have a family member who has been addicted. These shares are little changed from April, when the poll probed deeper into public’s views and experiences with the opioid epidemic.
Designed and analyzed by public opinion researchers at the Kaiser Family Foundation, the poll was conducted from July 5-11 among a nationally representative random digit dial telephone sample of 1,212 adults. Interviews were conducted in English and Spanish by landline (426) and cell phone (786). The margin of sampling error is plus or minus 3 percentage points for the full sample. For results based on subgroups, the margin of sampling error may be higher.
In a campaign that so far has not been about policy issues, equal shares of voters name terrorism and national security, along with a candidate’s personal characteristics like leadership ability, character, values, and experience, as top voting considerations for the 2016 presidential election, with health care ranking further down the list with a cluster of other issues.
While overall attitudes of the ACA lean unfavorable, a larger share of voters say they trust the Democratic Party than say they trust the Republican Party to do a better job dealing with health care issues including determining the future of the ACA, Medicare, lowering prescription drug costs, and dealing with the opioid epidemic, with the widest issue advantage for either political party being women’s reproductive health.
Overall, the survey finds more voters say the Democratic Party (47 percent) than the Republican Party (35 percent) best represents their health care views. When asked which of the major party’s presumptive presidential nominees best represents their health care views, more voters choose Hillary Clinton (46 percent) than Donald Trump (32 percent).
Election Watch: The Role of Health Care Issues in the 2016 Presidential Election
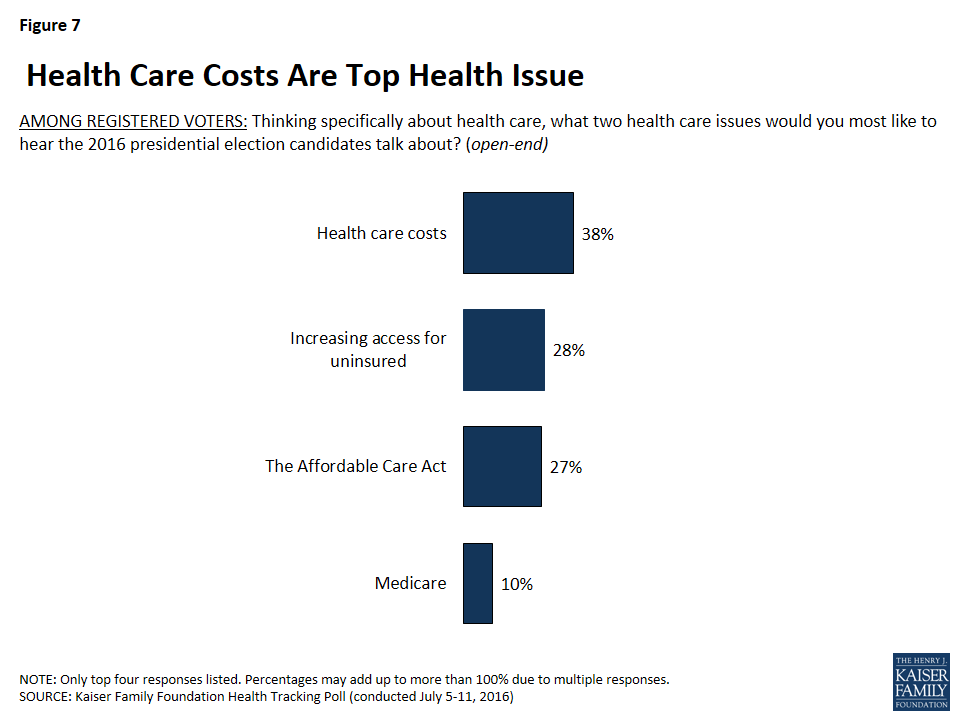
The presidential campaign is in full swing with candidates and political parties negotiating party platforms, frequent murmurings about possible vice presidential candidates, and party conventions starting in days. As part of Kaiser’s ongoing analysis of the role of health care issues in the political debate, the July Kaiser Health Tracking Poll examines the role that health care may play in the 2016 presidential election, how important health care is to voters, what health care issues voters would most like to hear the candidates discuss, and which party and candidates voters feel most closely aligned with on health care issues.
Terrorism is Top Issue For Voters, Large Shares Also Say Candidate’s Personal Characteristics Are Important
Terrorism and national security is the top issue for registered voters in the 2016 presidential election, according to the most recent tracking survey.1 Nearly half (46 percent) of all voters say terrorism and national security is “extremely” important to their vote for president. About four in ten voters (37 percent) say health care is “extremely” important, which is similar to the share of voters who say the same about gun policy (38 percent), education (35 percent), and the economy and jobs (37 percent). Smaller shares of voters in the presidential election say foreign policy, the federal budget deficit, immigration, and taxes are “extremely” important to their vote.
While a large share of voters say specific issues will be important to their vote for president, previous research demonstrates that voters also make their decision to support candidates based on other factors including their perceptions of the personal characteristics of the candidate – including their leadership ability, character, values, and experience. Slightly less than half (46 percent) of voters say a candidate’s personal characteristic are “extremely” important to their vote for president, which is the same as the share who say terrorism and national security is important. Unlike policy issues cited by voters, the share naming personal characteristics as important to their vote does not vary by party affiliation.
Figure 1: Terrorism and Candidate Personal Characteristics Are Most Important to Voters
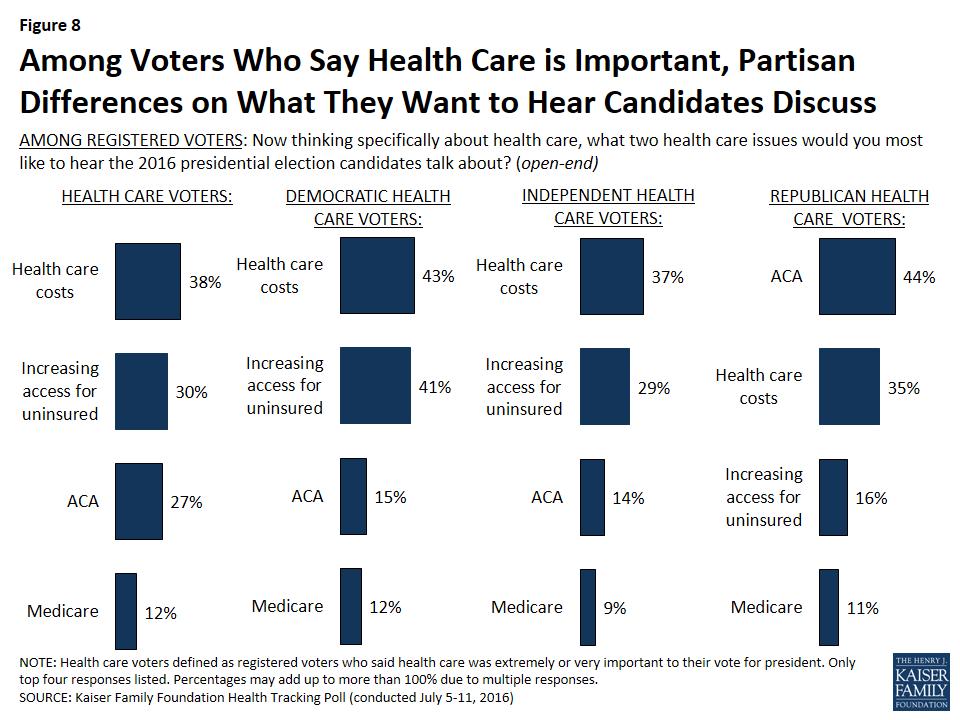
Across the factors that are important to voters, there are noticeable party differences. Nearly two-thirds (63 percent) of voters who identify as Republicans say terrorism and national security is “extremely” important to their vote compared to 40 percent of voters who identify as Democrats and 43 percent of independents. The top issues for Democratic voters are education (46 percent) and health care (42 percent). Among independent voters, terrorism and national security is the top issue (43 percent) but a larger share of independents say a candidate’s personal characteristics is important (46 percent) than who say the same about any other substantive policy issues.
Table 1: Top Issues for American Voters in 2016 Presidential Election
The percent who said the following are“extremely” important to their votefor president this year
All Registered Voters
Republican Voters
Democratic Voters
Independent Voters
Candidate Personal Characteristics
46%
45%
47%
46%
Terrorism and National Security
46
63
40
43
Gun Policy
38
40
40
35
Economy and Jobs
37
48
35
34
Health Care, including costs and the ACA
37
38
42
34
Education
35
25
46
35
The Federal Budget Deficit
29
42
17
29
Foreign Policy
27
29
25
29
Immigration
27
40
24
24
Taxes
25
34
20
24
NOTE: Question wording abbreviated. For full question wording, see topline.
Partisanship and Health Care
The July Tracking Survey also examines how voters view each political party and their prospective presidential candidates on health care issues.
Overall Party Differences on Health Care Issues
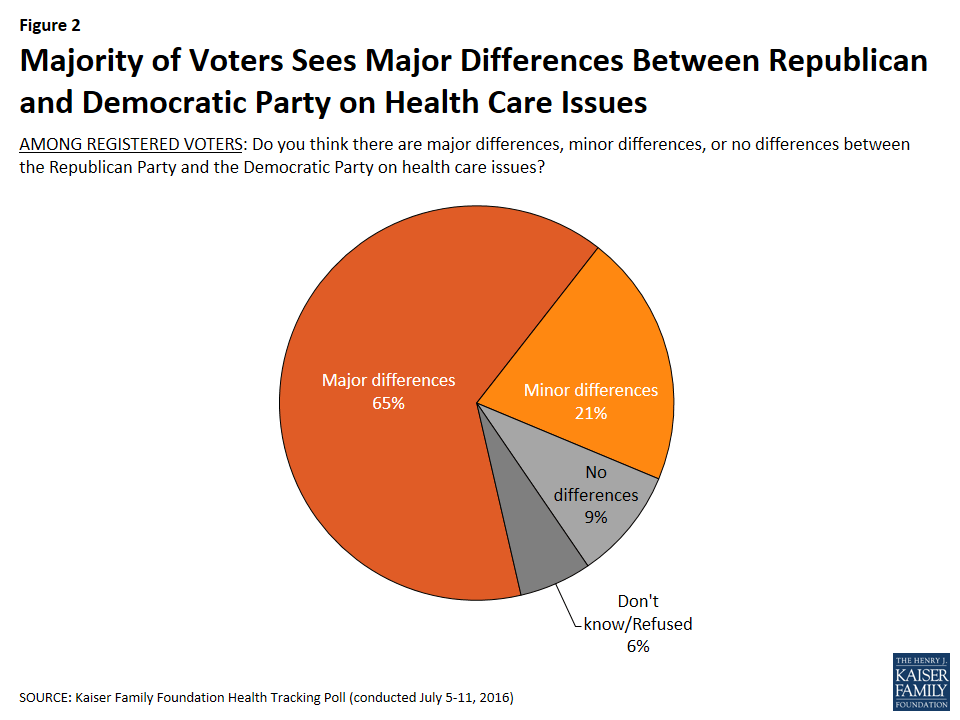
When it comes to perceptions of whether the two political parties differ on health care issues, 65 percent of voters say there are major differences between the parties with an additional 21 percent saying there are minor differences. Overall, majorities across political parties say there are major differences between the Republican Party and the Democratic Party on health care issues.
Figure 2: Majority of Voters Sees Major Differences Between Republican and Democratic Party on Health Care Issues
Voters Trust Their Own Political Party on Health Care Issues
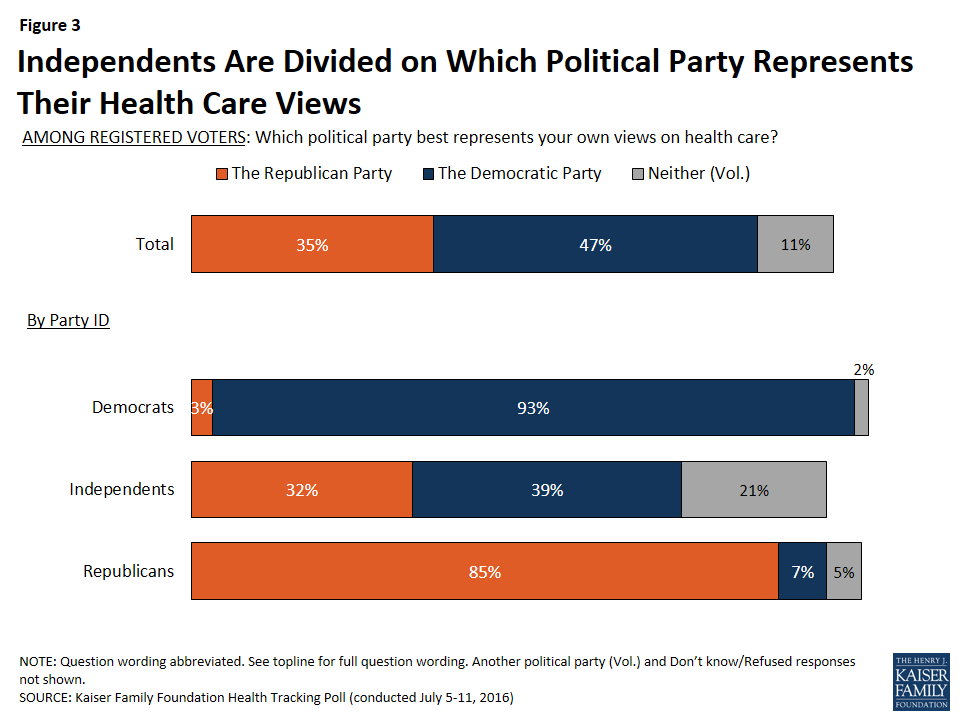
In general, 85 percent of Republican voters and 93 percent of Democratic voters say their own political party best represents their views on health care. Independents are much more closely divided with four in ten (39 percent) saying the Democratic Party best represents their health care views and one-third (32 percent) saying the Republican Party represents their views. In addition, one in five independents (21 percent) say that neither political party represents their own views on health care.
Figure 3: Independents Are Divided on Which Political Party Represents Their Health Care Views
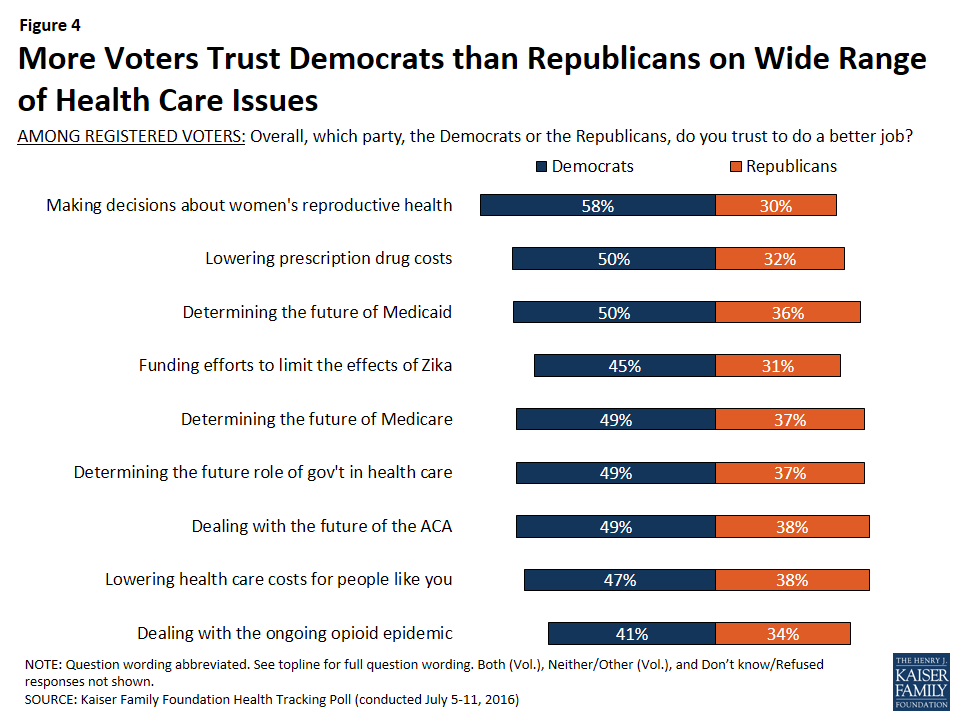
When asked which political party (the Republican Party or the Democratic Party) they trust to do a better job dealing with a series of health care issues, a larger share of voters say they trust the Democratic Party to do a better job than the Republican Party.
The widest issue advantage for either political party was women’s reproductive health, with voters saying at a margin of 2 to 1 that they trust the Democratic Party to do a better job of making decisions about women’s reproductive health choices and services than the Republican Party (58 percent compared to 30 percent). The Democratic Party also holds a significant advantage over the Republican Party when it comes to lowering the cost of prescription drugs (50 percent and 32 percent). Larger shares also say they trust the Democratic Party rather than the Republican Party on Zika funding (45 percent vs. 31 percent) and the opioid epidemic in the U.S. (41 percent vs. 34 percent).
Figure 4: More Voters Trust Democrats than Republicans on Wide Range of Health Care Issues
Higher shares of female voters and younger voters say they trust the Democratic Party than say they trust the Republican Party on all of these health issues, with the largest differences found on women’s health issues and lowering prescription drug costs. On these two issues, more than half of female voters and voters between the ages of 18 and 29 say they trust the Democratic Party compared to less than one-third of each group who say they trust the Republican Party. Among voters 65 and older, similar shares say they trust both parties on most health issues. For example, when it comes to determining the future of the Medicare program, similar shares of senior voters say they trust the Democratic Party (45 percent) and the Republican Party (41 percent).
Across all issues, vast majorities of both Republican voters and Democratic voters say they trust their own political party to do a better job handling each health care issue and very few say they trust the opposing party. For example, nine out of ten Democratic voters (91 percent) say they trust the Democratic Party to do a better job determining the future role of government in health care, while a similar share of Republican voters (87 percent) say they trust the Republican Party to do a better job.
With both Republican voters and Democratic voters saying they trust their own political party to do a better job handling each of the health care issues, independent voters’ views play an important role. Overall, larger shares of independent voters trust the Democratic Party than the Republican Party to do a better job of making decisions about women’s reproductive health (60 percent compared to 25 percent), lowering prescription drug costs (46 percent vs. 28 percent), and funding efforts to limit the effects of the Zika virus outbreak (42 percent vs. 24 percent). Independents are more split on whether they trust the Democratic Party or the Republican Party on the other issues, with similar shares saying they trust the Democratic Party and the Republican Party on dealing with the future of the 2010 health care law, lowering health care costs for people like them, and dealing with the opioid epidemic.
Table 2: Independent Voters Are More Likely to Trust Democratic Party on Some Health Care Issues
The percent who trust to do a better job…
Independent Voters Who Trust Republican Party
Independent Voters Who Trust Democratic Party
Making decisions about women’s reproductive health choices and services
25%
60%
Lowering the cost of prescription drugs
28
46
Funding efforts to limit the effects of the Zika virus
24
42
Determining the future of the Medicaid program
34
46
Determining the future of the Medicare program
35
44
Determining the future role of government in health care
36
44
Dealing with the future of the 2010 health care law
38
44
Lowering health care costs for people like you
36
42
Dealing with the ongoing opioid addiction epidemic
31
36
NOTE: Question wording abbreviated. For full question wording, see topline.
Views of the 2016 Presidential Candidates On Health Care
Majorities of Voters Say Their Party’s Candidate Represents Their Views on Health Care
When asked which presidential candidate best represents their own views on health care, nearly half of voters (46 percent) choose Hillary Clinton while about one-third (32 percent) say Donald Trump best represents their views. As expected, a vast majority of Democratic voters (87 percent) say Hillary Clinton best represents their own views on health care, while only 3 percent say Donald Trump. On the other side of the political spectrum, three-fourths of Republican voters (74 percent) say Donald Trump best represents their own views on health care, while one in ten (11 percent) say Hillary Clinton and 13 percent say neither candidate represents their views. More independent voters say Hillary Clinton best presents their health care views than Donald Trump — 39 percent compared to 30 percent – yet one in four (23 percent) say neither candidate represents theirs health care views.
Figure 5: Partisan Voters Say Their Party’s Candidate Best Represents Their Health Care Views, Independents Lean Towards Clinton
Large Shares of Voters Say Candidates and Political Parties Are Paying too Little Attention to Health Care Issues
With less than one week before the start of the 2016 presidential conventions,2 the majority of American voters say they are interested in what happens during the Republican National Convention (71 percent) and the Democratic National Convention (65 percent), and more than half of individuals from both parties say they care “a lot” about what is included in their party’s platform.
And while the political parties and their presumptive candidates, Donald Trump and Hillary Clinton, are working on defining their party’s 2016 platforms, slightly more than half of voters say the Republican Party and Donald Trump are paying too little attention to health issues. More than half of voters (56 percent) say Donald Trump is paying too little attention and 55 percent say the Republican Party is paying too little attention to health care issues. In contrast, about one-third of voters say Hillary Clinton (35 percent) and the Democratic Party (33 percent) is paying too little attention to health care issues, while about four in ten say the Democratic Party and Hillary Clinton are paying the right amount of attention.
Figure 6: Half of American Voters Say Republican Party and Trump Are Paying Too Little Attention to Health Care Issues
There are distinct partisan differences in these findings: larger shares of Republican voters say the Democratic Party and Hillary Clinton are paying too little attention, 43 percent and 44 percent, while large majorities of Democratic voters say the Republican Party and Donald Trump are paying too little attention, 71 percent and 75 percent. About half of independent voters say Donald Trump and the Republican Party are paying too little attention to health care issues, 54 percent each, compared to about four in ten who say the same about Hillary Clinton (40 percent) and the Democratic Party (37 percent).
Table 3: Larger Shares of Voters Say Republican Party and Donald Trump Are Paying Too Little Attention to Health Care Issues
Percent who say each of the following is paying too little attention to issues of health care
Total Voters
Republican Voters
Democratic Voters
Independent Voters
Republican Party
55%
36%
71%
54%
Donald Trump
56
33
75
54
Democratic Party
33
43
22
37
Hillary Clinton
35
44
21
40
Republicans Want to Hear Candidates Discuss ACA, Democrats Want to Hear About Health Care Costs
When asked specifically what health issues they want to hear the presidential candidates talk about, health care costs are mentioned more often than any other health issue (38 percent), followed by increasing access for uninsured (28 percent), the ACA (27 percent), and Medicare (10 percent).
Figure 7: Health Care Costs Are Top Health Issue
Four in ten Republican voters (41 percent) say they want to hear the 2016 presidential candidates talk about the ACA (of which 26 percent say they want to hear the candidates talk about repealing or opposing the law), compared to one-fourth of independent voters (26 percent) who want to hear the candidates discuss the ACA and only 15 percent of Democratic voters. By comparison, four in ten Democratic voters say they want the candidates to talk about health care costs (41 percent) and expanding health insurance coverage for the currently uninsured (40 percent). A larger share of independent voters (39 percent) say they want candidates to discuss health care costs than say they want the candidates to talk about expanding access to the uninsured (27 percent) or the ACA (26 percent).
While health care is currently not the top issue for voters, majorities of Republicans, Democrats, and independents say it is “extremely” or “very” important to their presidential vote choice (71 percent, 86 percent, and 75 percent, respectively). Among the individuals, regardless of party, who say health care is important to their vote for president this year, 38 percent say health care costs is the health issue they most want to hear the presidential candidates discuss, followed by increasing access to the uninsured (30 percent) and the ACA (27 percent). Similar to the partisan differences found among all voters, a higher share of Democratic voters who say health care is “extremely” or “very” important say they want to hear the candidates discuss health care costs more than any other issue; Republican health care voters want to hear the candidates discuss the ACA.
Figure 8: Among Voters Who Say Health Care is Important, Partisan Differences on What They Want to Hear Candidates Discuss
Americans’ Opinions of the Affordable Care Act
While the ACA remains a top health care issue for Republican voters, overall attitudes toward the law remained largely unchanged over the past month. The most recent survey finds 40 percent of Americans reporting favorable opinions of the health care law and 46 percent reporting unfavorable opinions.
Figure 9: Public’s View of the Health Care Law Leans Negative
Kaiser Health Policy News Index: July 2016
This month’s Health Policy News Index finds a large majority (83 percent) of the American public reports closely following news about the 2016 presidential campaigns, up slightly from 79 percent in June. This is similar to the share who say they have closely followed news this month about recent fatal police shootings of black men like Alton Sterling and Philando Castile3 (81 percent) and the share who report closely following news about terrorist attacks in Istanbul and Baghdad and other conflicts involving ISIS or other militant groups (78 percent). Congressional debate about gun control legislation also garnered significant attention in July, with nearly three-fourths of Americans (72 percent) saying they have followed news about it closely, while Britain’s vote to leave the European Union – Brexit – was closely followed by a smaller share (53 percent). Fewer Americans report following this month’s top health stories, with about half closely following the Zika virus outbreak and news about the ongoing opioid epidemic in the nation (52 percent each) and 46 percent closely following the Supreme Court decision regarding Texas abortion clinics.
Figure 10: Kaiser Health Policy News Index: July 2016
The Zika Virus Outbreak
The Kaiser Tracking Poll has been tracking the public’s awareness of the Zika virus since February 2016. The most recent survey finds that the vast majority of Americans (89 percent) have heard or read at least a little about the Zika virus, up slightly from June 2016.4 While the majority of those who have heard or read about the virus are not worried that they or someone in their family will be affected by the virus, six in ten are worried the U.S. will see a large number of cases of the virus (59 percent) and the upcoming summer Olympics will cause an increase in the number of cases (59 percent).
Figure 11: Most Say They are Worried About a Large Number of Zika Cases in U.S. Over Next Year as well as the Effect of the Olympics
The Ongoing Opioid Epidemic
On July 8th, the U.S. House of Representatives passed the Comprehensive Addiction and Recovery Act (CARA). This bill, which is also supported by the Senate and President Obama, is part of the government’s effort to combat the ongoing opioid epidemic in the U.S. Similar to results from the April,5 the June Tracking Poll finds that slightly more than four in ten Americans (43 percent) say they know someone who has been addicted to prescription painkillers, including one in five (19 percent) who say they have a family member who has been addicted.
Figure 12: Four in Ten Americans Know Someone Who Has Been Addicted to Prescription Painkillers
Methodology
This Kaiser Health Tracking Poll was designed and analyzed by public opinion researchers at the Kaiser Family Foundation (KFF). The survey was conducted July 5-11, 2016, among a nationally representative random digit dial telephone sample of 1,212 adults ages 18 and older, living in the United States, including Alaska and Hawaii (note: persons without a telephone could not be included in the random selection process). Computer-assisted telephone interviews conducted by landline (426) and cell phone (786, including 477 who had no landline telephone) were carried out in English and Spanish by Princeton Data Source under the direction of Princeton Survey Research Associates International (PSRAI). Both the random digit dial landline and cell phone samples were provided by Survey Sampling International, LLC. For the landline sample, respondents were selected by asking for the youngest adult male or female currently at home based on a random rotation. If no one of that gender was available, interviewers asked to speak with the youngest adult of the opposite gender. For the cell phone sample, interviews were conducted with the adult who answered the phone. KFF paid for all costs associated with the survey.
The combined landline and cell phone sample was weighted to balance the sample demographics to match estimates for the national population using data from the Census Bureau’s 2014 American Community Survey (ACS) on sex, age, education, race, Hispanic origin, and region along with data from the 2010 Census on population density. The sample was also weighted to match current patterns of telephone use using data from the January-June 2015 National Health Interview Survey. The weight takes into account the fact that respondents with both a landline and cell phone have a higher probability of selection in the combined sample and also adjusts for the household size for the landline sample. All statistical tests of significance account for the effect of weighting.
The margin of sampling error including the design effect for the full sample is plus or minus 3 percentage points. Numbers of respondents and margins of sampling error for key subgroups are shown in the table below. For results based on other subgroups, the margin of sampling error may be higher. Sample sizes and margins of sampling error for other subgroups are available by request. Note that sampling error is only one of many potential sources of error in this or any other public opinion poll. Kaiser Family Foundation public opinion and survey research is a charter member of the Transparency Initiative of the American Association for Public Opinion Research.
Group
N (unweighted)
M.O.S.E.
Total
1212
±3 percentage points
Registered Voters
Total RV
1015
±3 percentage points
Democratic RV
311
±6 percentage points
Republican RV
257
±7 percentage points
Independent RV
366
±6 percentage points
Female RV
419
±5 percentage points
RV 18-29 years of age
141
±9 percentage points
RV 65 and older
314
±6 percentage points
Health Care Voters
Total
918
±4 percentage points
Democratic Health Care Voters
266
±7 percentage points
Republican Health Care Voters
182
±8 percentage points
Independent Health Care Voters
268
±7 percentage points
Party Identification
Democrats
365
±6 percentage points
Republicans
295
±6 percentage points
Independents
450
±5 percentage points
Heard/Read Anything About
Zika virus
1107
±3 percentage points
Endnotes
The July Kaiser Tracking Poll was in the field from July 5th to July 11th, one week after the terrorist attacks at Istanbul’s airport and two days following the attacks in Baghdad which killed more than 200 civilians. During this week, there were also several domestic incidents, including police-involved shootings in Baton Rouge and Minnesota and the attack targeting police officers in Dallas on July 7th. ↩︎
The Republican National Convention starts on July 18th, 2016 and the Democratic National Convention starts on July 25th, 2016. ↩︎
The police-involved shooting of Alton Sterling in Baton Rouge, La. occurred on July 5th and the police-involved shooting of Philando Castille in Minnesota occurred on July 6th. The items were included in interviews beginning on July 7th. ↩︎
On May 18, 2016, the Department of Health and Human Services (HHS) published a final rule to implement Section 1557 of the Affordable Care Act (ACA), which prohibits discrimination in health coverage and care based on race, color, national origin, age, disability, and sex. These provisions incorporate existing federal non-discrimination law and policy and also contain some new protections. Key provisions include:
Extending protections against sex discrimination to health coverage and care for the first time and including gender identity discrimination within the definition of sex discrimination;
Codifying long-standing guidance regarding meaningful access for individuals with Limited English Proficiency, including the provision of free, accurate, and timely language assistance services;
Incorporating existing law that requires reasonable modifications, effective communication, and readily accessible buildings and information technology to avoid disability-based discrimination; and
Prohibiting discriminatory health insurance benefit designs and including specific coverage protections for transgender individuals.
The final rule does not:
Resolve whether Section 1557’s prohibition on sex discrimination extends to discrimination based on sexual orientation alone, although HHS notes that such discrimination is prohibited under Section 1557 when it is based on gender stereotypes; or
Set specific accessibility standards for medical equipment for people with disabilities, pending action by the U.S. Access Board.
HHS emphasizes Section 1557’s importance in achieving the ACA’s goals of expanding access to health care and insurance, noting that discrimination within these areas can contribute to poor health outcomes or coverage, increase health disparities among underserved communities, and negatively impact the distribution of health care resources. The final rule is effective on July 18, 2016, except for provisions that require changes to health insurance plan benefit design, which will take effect in the first plan year beginning on or after January 1, 2017.
Issue Brief
Introduction
On May 18, 2016, the Department of Health and Human Services (HHS) finalized regulations to implement Section 1557 of the Affordable Care Act (ACA).1 Section 1557 prohibits certain entities that administer health programs and activities from excluding an individual from participation, denying program benefits, or discriminating based on race, color, national origin, sex, age or disability.2 While Section 1557 has been in effect since the ACA’s enactment, these regulations mark the first time HHS has issued implementing guidance. In the preamble to the final rule, HHS emphasizes Section 1557’s importance in achieving the ACA’s overarching goal of expanding access to health care and insurance for all individuals, noting that discrimination within health programs can contribute to poor and inadequate health outcomes or coverage, exacerbate existing health disparities in underserved communities, and lead to insufficient and ineffective distribution of health care resources.3
Section 1557 seeks to coordinate existing federal non-discrimination laws, regulations, and policy as they apply to health coverage and care and to extend sex discrimination protections to health programs and activities. Specifically, the final rule incorporates the existing anti-discrimination tenants of Title VI (race, color and national origin), the Age Discrimination Act, and Section 504 (disability) as they apply to health care. It also extends the sex discrimination protections of Title IX, which only apply to educational programs, to health care. As such, it is the first federal civil rights law to prohibit discrimination on the basis of sex in health care. Moreover, the final rule defines sex discrimination to include discrimination on the basis of gender identity. In addition, the final rule codifies long-standing HHS policy guidance about the provision of language assistance services. The final rule is effective on July 18, 2016, except for provisions that require changes to health insurance benefit design, which will take effect in the first plan year beginning on or after January 1, 2017.4 This issue brief summarizes key provisions of the final rule.
Key Provisions of the Section 1557 Final Rule
Entities Subject to Section 1557’s Non-Discrimination Provisions
The final rule applies to health programs and activities that receive Federal financial assistance from HHS; health programs and activities administered by HHS, including the Federally-facilitated Marketplace; and State-based Marketplaces established under the ACA.5 Box 1 provides examples of the types of entities subject to Section 1557. While Section 1557 applies more broadly to all health programs and activities that receive federal funding through any agency, HHS limits its final rule to the programs that it has authority to enforce.6 HHS encourages other federal agencies to adopt the standards from its rule when applying Section 1557 to the health programs and activities that they administer.7
The final rule defines health programs and activities to include all operations of an entity that is principally engaged in the provision or administration of health-related services or health-related insurance coverage.8 Health programs and activities also include providing assistance obtaining health-related services or health-related insurance coverage.9 HHS interprets health programs and activities to include health education and research programs and reiterates that federal law already prohibits discrimination in federally funded research as well as in research at universities. The final rule extends non-discrimination protections to any research conducted within HHS as well as non-educational institutions. In the preamble, HHS recognizes that research projects are often limited in scope, and therefore, research protocol criteria that target or exclude certain groups are warranted when justified for subjects’ health or safety, the scientific study design, or the research purpose.10 The rule also applies to employee health benefit programs in limited circumstances.11
Box 1: Examples of the Types of Entities Subject to Section 1557
Health care providers, such as physicians’ practices, hospitals, community health centers, nursing facilities, home health agencies, clinical laboratories, residential or community-based treatment facilities, intermediate care facilities for people with intellectual/developmental disabilities, hospices, and organ procurement centers
Health-related schools and education and research programs
State agencies, such as Medicaid, CHIP, and public health
Health insurance issuers and third party administrators
Navigators
HHS programs, such as CMS, HRSA, CDC, IHS, SAMHSA, the Federally-facilitated Marketplace, and the Basic Health Program
State-based Marketplaces
Employers offering employee health benefit programs (in certain circumstances)
The final rule clarifies that Federal financial assistance includes not only funding received directly by covered entities but also premium and cost-sharing subsidies provided to individuals for coverage through the Federally-facilitated or State-based Marketplaces.12 As such, the rule applies to insurance carriers that offer plans through these Marketplaces. Moreover, the preamble clarifies that Section 1557 applies to all plans offered by these carriers, not just those available through the Marketplaces.13
Protections Against Discrimination Based on Sex
Section 1557 and HHS’s final regulations, for the first time, extend protections against discrimination based on sex to health coverage and care. Covered entities must provide individuals equal access to health programs and activities without discrimination based on sex, including pregnancy, false pregnancy, termination of pregnancy, recovery from childbirth or related medical conditions. Sex discrimination also includes sex stereotypes, including expectations about gender roles, which could be an important protection for lesbian, gay, bisexual, and transgender individuals, among others.14
Moreover, the final rule extends the definition of sex discrimination to include discrimination based on gender identity for the first timein the health care context.15 HHS clarifies that its inclusion of gender identity as part of sex discrimination includes gender expression and “transgender status”16 and encompasses individuals with non-binary gender identities.17
In the preamble to the final rule, HHS specifies that Section 1557’s prohibition on sex discrimination includes discrimination related to sexual orientation where the evidence establishes that the discrimination is based on gender stereotypes.18 The final rule does not resolve whether Section 1557’s prohibition on sex discrimination extends to discrimination based on an individual’s “sexual orientation status” alone.19 HHS notes that the law in this area is continuing to evolve and will consider issuing further guidance.20
Sex-specific health programs and activities are prohibited unless a covered entity can show that the sex-based classification is substantially related to the achievement of an important health-related or scientific objective.21 HHS expects that this standard will enable most health researchers to justify sex-specific clinical trials, such as those that test treatments for sex-specific conditions or that evaluate differences in responses to treatment regimens among the sexes.22 However, the rule does not offer a blanket allowance for all sex-specific research. If there is no scientific or clinical reason for a study to be restricted to one sex researchers would need to justify the reasons for this limitation.
The final rule does not include a blanket religious exemption related to Section 1557’s general prohibition against sex discrimination. Existing laws protecting religious freedom and belief, including provider conscience laws, the Religious Freedom Restoration Act, the ACA’s provisions regarding abortion services, and the ACA’s preventive health services regulations, continue to apply.23 The final rule clarifies that compliance with Section 1557 is not required if it would violate these laws.24
Prohibition Against Discrimination Based on National Origin
Section 1557 prohibits discrimination based on an individual’s place of origin, his or her ancestor’s place of origin, and his or her manifestation of the physical, cultural, or linguistic characteristics of a national origin group.25 The rule adopts the Equal Employment Opportunity Commission’s definition of national origin. While Section 1557 does not explicitly ban discrimination based on citizenship or immigration status, as opposed to national origin, HHS notes that Section 1557 does prohibit policies or practices related to citizenship or immigration status that disproportionately affect individuals of a particular national origin group even if those policies or practices are not explicitly discriminatory.26
Meaningful Access for Individuals with Limited English Proficiency (LEP)
Covered entities must take reasonable steps to provide meaningful access to each individual with LEP who is eligible to be served or likely to be encountered in their health programs and activities.27 The final rule incorporates existing Title VI regulations and HHS’s LEP policy guidance and outlines specific requirements related to provision of language assistance services. When assessing an entity’s compliance with this provision, the HHS Office of Civil Rights (OCR) will take into account and give substantial weight to the nature and importance of the health program or activity and the communication at issue to the person with LEP.28 OCR also will consider other relevant factors, including whether the entity has developed and implemented an effective written language access plan.29 HHS did not establish a minimum threshold for non-English languages in which entities must provide language assistance, and it did not require entities to have a language access plan in the final rule. However, as indicated, the creation of a written language access plan is one factor OCR will consider in evaluating compliance.
Covered entities must provide free, accurate, and timely language assistance services and protect the privacy and independence of an individual with LEP. Covered entities must offer a qualified interpreter when reasonable for oral communication and use a qualified translator for written content.30 Moreover, the entity can only rely on qualified bilingual/multilingual staff to communicate directly with individuals with LEP.31 The rule defines the knowledge, skills, and abilities of a qualified interpreter and a qualified translator who may provide these services as well as for qualified bilingual and multilingual staff.32 The rule also adds performance standards for video remote interpreting services.33 The rule specifies that individuals with LEP are not required to accept language assistance services,34 although the preamble clarifies that a provider may use a qualified interpreter to assist the provider in communicating with an individual with LEP who has refused language assistance services.35
An entity may not require an individual with LEP to provide his or her own interpreter.36 Moreover, the entity cannot rely on an adult accompanying the individual with LEP to interpret, except in emergency situations or when the individual specifically requests the adult to provide those services, the adult agrees to provide the assistance, and reliance on the adult is appropriate for the circumstances.37 Similarly, the entity may not rely on a minor child to interpret except in an emergency when no qualified interpreter is immediately available.38
Protections Against Discrimination Based on Disability
Covered entities must make reasonable modifications in policies, practices, and procedures to avoid disability-based discrimination, unless doing so would fundamentally alter the nature of the health program or activity.39 The final rule incorporates existing federal protections against disability-based discrimination from Section 504 of the Rehabilitation Act and the Americans with Disabilities Act (ADA).40
Covered entities must take appropriate steps to ensure effective communication with people with disabilities.41 To the extent that the ADA effective communication rules differ between Title II (which applies to state and local government) and Title III (which applies to places of public accommodation), HHS adopted the Title II rules for all entities subject to Section 1557. This requires Section 1557 covered entities to give “primary consideration” to the person with a disability’s choice of auxiliary aid or service.42 Auxiliary aids and services can include, as appropriate, qualified interpreters, a variety of assistive technology devices, and the provision of materials in alternative formats.43 The final rule clarifies that all covered entities, regardless of the number of employees, must provide appropriate auxiliary aids and services to people with impaired sensory, manual, or speaking skills, where necessary to afford those individuals an equal opportunity to benefit from the health program or activity.44
Buildings and facilities where health programs and activities are conducted must be constructed and altered in a way that is readily accessible to and useable by people with disabilities. Specifically, HHS generally adopts the 2010 ADA Standards for Accessible Design for new construction or alternations of facilities of covered entities that receive Federal funding and State-based Marketplaces.45
While Section 1557’s prohibition against disability-based discrimination in health programs and activities extends to medical equipment, HHS does not set specific accessibility standards in this area. The U.S. Access Board is still developing its standards for accessible medical equipment. In the meantime, HHS notes that providers must ensure that health programs and activities that involve the use of medical equipment are accessible to people with disabilities.46
Covered entities must make electronic and information technology in health programs and activities accessible to people with disabilities, unless doing so would create an undue financial or administrative burden or fundamentally alter the nature of the health program or activity.47 When providing an accessible electronic format creates an undue burden or fundamental alteration, covered entities still must provide information in another format that does not create an undue burden or fundamental alternation but that does ensure, to the maximum extent possible, that people with disabilities receive the benefits or services of the health program or activity provided through electronic or information technology.48
Prohibitions Against Discrimination in Health Coverage
The final rule outlines several protections against discrimination in health insurance coverage determinations and administration. Under Section 1557, covered entities may not take the following actions on the basis of race, color, national origin, sex, age or disability:
Deny, cancel, limit, or refuse to issue or renew a health insurance policy;49
Deny or limit coverage of a health insurance claim;50
Impose additional cost sharing or other limitations or restrictions on coverage;51 or
Use discriminatory marketing practices or insurance benefit designs.52
The final rule maintains that while health insurers cannot have coverage policies that operate in a discriminatory manner, they still may apply medical necessity rules when determining covered benefits.53 HHS also notes in the preamble that Section 1557 does not require insurers to cover any particular services.54 Provisions of the final rule that require changes in plan benefit design take effect in the first plan year on or after January 1, 2017. Such changes include covered benefits, benefits limitations or restrictions, and cost-sharing mechanisms such as coinsurance, copayments, and deductibles.55
While the final rule states that covered entities may not employ discriminatory benefit designs, it is silent on whether certain practices are discriminatory. For example, placing all drugs to treat a single medical condition on the plan’s highest cost-sharing tier has been challenged in an administrative complaint filed with the OCR (Box 2). In separate guidance, HHS has identified this practice as an example of potential discrimination, along with applying age limits to services that have been found clinically effective at all ages, and requiring prior authorization and/or step therapy for all or most medications in drug classes such as anti-HIV protease inhibitors and/or immune suppressants regardless of medical evidence.56
Box 2: Case Study: A Challenge Under Section 1557
On May 29, 2014, The AIDS Institute and the National Health Law Program filed an administrative complaint with HHS OCR.57 The complaint alleged that four Florida health insurers operating on the Federally-facilitated Marketplace violated Section 1557’s prohibition against discriminatory plan benefit design when they placed all drugs to treat HIV on the highest cost-sharing tier, sometimes with significant deductibles, thereby discouraging people with HIV/AIDS from selecting those insurers’ plans. OCR has not yet officially acted on the complaint; however, the insurers have reached individual agreements with the complainants to remedy HIV drug formulary placement.
The final rule includes specific coverage protections for transgender individuals. While the rule generally requires that covered entities treat individuals consistent with their gender identity, as described above, it specifies a limited exception. The exception prohibits entities from denying or limiting health services (or imposing additional cost-sharing on services) that are ordinarily or exclusively available to individuals of one sex or gender based on the fact that the individual’s sex assigned at birth, gender identity, or gender in a medical or health insurance plan record differs from the one to which such health services are ordinarily or exclusively available.58 For example, a covered entity may not deny an individual treatment for ovarian cancer where the individual could benefit medically from the treatment, based on the individual’s identification as a transgender male.59
The final rule also specifies requirements related to access to gender transition services. Specifically, an insurance plan may not categorically or automatically exclude or limit coverage for all health services related to gender transition or otherwise deny or limit coverage or deny a claim for specific health services related to gender transition, if such a policy results in discrimination against the individual seeking services.60 HHS notes that blanket exclusions of all gender transition services, which historically have been used by some Medicaid programs and health insurers, are now recognized as outdated and not based on current standards of care.61 However, the final rule does not affirmatively require covered entities to cover any particular procedure or treatment for transition-related care.62
Compliance with and Enforcement of Section 1557’s Non-Discrimination Provisions
Each entity applying for federal financial assistance must assure its compliance with Section 1557.63 Assurances also are required by Marketplace issuers and states seeking approval to operate a State-based Marketplace.64
Covered entities must post a notice regarding their non-discrimination policies by October 16, 2016.65 These notices must inform individuals about the bases of discrimination prohibited under Section 1557, the availability of free and timely auxiliary aids and services and language assistance services, how to access those services, contact information for the entity’s employee responsible for Section 1557 compliance, the entity’s Section 1557 grievance procedures, and OCR complaint procedures.66 Notices must be available to beneficiaries, enrollees, applicants, and members of the public.67 They must be printed in a conspicuously visible font and included in significant communications (such as handbooks and outreach publications68 ), in conspicuous physical locations where the entity interacts with the public, and in a conspicuous location on the covered entity’s website accessible from the homepage.69 Significant publications that are small-sized, such as postcards and tri-fold brochures, may include a shorter non-discrimination statement in lieu of the full notice.70 The final rule contains a sample notice and nondiscrimination statement.71
Covered entities must provide the notice in English and include taglines in the top 15 languages spoken by individuals with LEP within the state.72 Entities also may choose to post the notice in other non-English languages. Small-sized significant publications may include taglines in the top two non-English languages instead of 15.73 HHS will translate its sample notice and taglines into 64 languages.74
Covered entities that employ at least 15 people must adopt a grievance procedure that incorporates appropriate due process standards and provides prompt and equitable resolution of grievances under Section 1557.75 HHS and covered entities with more than 15 employees also must designate at least one employee to coordinate the entity’s efforts to carry out Section 1557 responsibilities, including the investigation of grievances.76 The final rule includes a sample grievance procedure.77 To ensure compliance with Section 1557, HHS will provide covered entities with a training curriculum on key provisions of the rule.78
Covered entities must take remedial action as required by the HHS OCR Director if they are found to have discriminated on any basis prohibited by Section 1557.79 If discrimination is not found, covered entities may also take voluntary actions to improve operations.80 OCR can enforce Section 1557 through informal mediation, reducing or eliminating a covered entity’s Federal financial assistance, or referring matters to the Department of Justice for litigation.81 The final rule also provides that private individuals and entities can sue in federal court to challenge alleged violations of Section 1557 by entities receiving Federal financial assistance and State-based Marketplaces.82 The final rule clarifies that compensatory damages are available for Section 1557 violations.83 Other existing federal, state, and local anti-discrimination laws also continue to apply.84
Looking Ahead
HHS’s final rule implementing the ACA’s Section 1557 nondiscrimination protections coordinates existing federal non-discrimination laws, regulations, and policy regarding race, color, national origin, age, and disability as they apply to health coverage and care. Section 1557 also extends sex discrimination protections to health care programs and activities and includes gender identity as a prohibited basis of discrimination. While the rule does not resolve whether sexual orientation should be a stand-alone basis for prohibited discrimination, HHS will recognize Section 1557 sex discrimination claims involving sexual orientation that are based on gender stereotypes. The rule codifies HHS’s long-standing policy guidance on language assistance services for individuals with LEP. It also incorporates existing provisions of Section 504 and the ADA to prohibit disability-based discrimination in health programs and activities, although it defers setting specific standards for accessible medical equipment pending forthcoming standards from the Access Board. The rule also prohibits insurers from using discriminatory benefit designs, although it does not identify specific actions that constitute discrimination such as the placement of all drugs to treat a single medical condition on the highest cost-sharing tier, which is the subject of a recent administrative complaint that is pending with OCR. The final rule takes effect on July 18, 2016, except that provisions that require changes to plan benefit design are effective in the first plan year beginning on or after January 1, 2017.85 HHS’s final rule is an additional tool to prevent and remediate discrimination in the health context, and HHS encourages other federal agencies that fund health programs and activities to adopt its standards to fully implement Section 1557.
42 U.S.C. § 18116; 45 C.F.R. § 92.101. In addition to prohibiting discrimination based on an individual’s own race, color, national origin, age, disability, or sex, Section 1557 also prohibits discrimination against an individual known or believed to have a relationship or association with someone else based on that other person’s race, color, national origin, age, disability, or sex. 45 C.F.R. § 92.209. For example, a primary care physician could not refuse to accept a new patient based on the disability status of one of the patient’s family members. 80 Fed. Reg. 54191. ↩︎
45 C.F.R. § § 92.2, 92.4. Consistent with the HHS Office for Civil Rights’ enforcement of other civil rights authorities, the definition of Federal financial assistance does not include Medicare Part B payments. 81 Fed. Reg. 31383. ↩︎
Unless the primary purpose of the Federal financial assistance is to fund employee health benefits, Section 1557 does not apply to an employer’s provision of employee health benefits where the provision of those benefits is the only health program or activity operated by the employer. 45 C.F.R. § 92.208; 81 Fed.Reg. 31437. ↩︎
45 C.F.R. § 92.201(b)(2). HHS does not outline minimum requirements for a language access plan but notes that effective plans often address how the entity will determine an individual’s primary language; identify a telephonic interpretation service; identify a translation service; identify the types of language assistance services that may be required; and identify any documents for which written translations should be routinely available. 81 Fed. Reg. 31415. ↩︎
HHS notes that whether Section 1557 applies to people with chronic conditions depends on whether an individual meets the final rule’s definition of disability, which is based on the ADA/504. 81 Fed. Reg. 31382. ↩︎
45 C.F.R. § 92.203(a). Most facilities already are subject to the 2010 Standards. Those that are not subject to the 2010 Standards as of July 18, 2016, have until January 18, 2018 to comply with those standards for new construction or alternations. 81 Fed. Reg. 32422-23. Construction or alteration that began before July 18, 2016 is deemed to comply with Section 1557 if it meets the 2010 Standards or the 1991 Standards, or the Uniform Federal Accessibility Standards but only if the facility was not covered by the 1991 or 2010 Standards. 45 C.F.R. § 92.203(b). ↩︎
45 C.F.R. § 92.204(a). Consistent with the ADA and Section 504, HHS notes that when determining whether an action is an undue burden, a covered entity must consider all resources available for use in the health program or activity’s funding or operation. 81 Fed. Reg. 31425. The final rule replaces the language defining electronic and information technology with a citation to the Section 508 regulation to ensure that the definition is consistent with other civil rights laws and is not outdated and unduly narrow. 45 C.F.R. § 92.4. ↩︎
45 C.F.R. § 92.8(b), (d), (f). Covered entities that serve individuals in more than one state may aggregate the number of individuals with LEP in those states to determine the top non-English languages spoken. 81 Fed. Reg. 31400. ↩︎
45 C.F.R. § 92.7(b). The preamble indicates that covered entities may use the same grievance procedures and individuals as used to comply with Section 504 and Title IX if their scope is broadened to include all bases of discrimination prohibited by Section 1557. 81 Fed. Reg. 31394. ↩︎
45 C.F.R. § 92.7(a). OCR will serve as the responsible employee for Section 1557 compliance in HHS programs and activities and the Federally-facilitated Marketplace. Id. ↩︎
Enrollment in Louisiana’s Medicaid expansion, which began on June 1st, got off to a rapid start, with 233,794 new enrollees by June 30th.1 This robust beginning was due in large measure to months of behind-the-scenes work aimed at leveraging information from existing state systems to facilitate swift and seamless Medicaid enrollment. The state identified groups of people already participating in state-administered programs who are eligible for Medicaid under the new expansion, and quickly enrolled them through a combination of automatic transfers and the use of a federal option that relies on data from the Supplemental Nutritional Assistance Program (SNAP) to significantly streamline enrollment. By using verified data on income and other eligibility factors available in state databases, Louisiana obviated the need for individuals to complete a separate Medicaid application or produce additional or duplicative verification documents.
Transfers from Existing Programs Contribute to Initial Medicaid Enrollment Count
The first month’s enrollees include a group of 197,000 people, the vast majority of whom were participants in two programs: Greater New Orleans Community Health Connection, or GNOCHC, which offered limited primary care in four New Orleans parishes, and Take Charge Plus, which offered family planning benefits. Participants in these programs were mailed notices in early May letting them know that they were automatically eligible for Medicaid and that they would not need to file an application. Except for individuals over age 65, who are not eligible under the expansion, the state added all individuals from these groups to Medicaid on May 28th, and by the week of June 6th they began receiving their health plan ID cards.
Facilitated Enrollment Using SNAP Data
Eligibility workers enrolled the remaining 43,306 people after determining their Medicaid eligibility. However, for a significant share of that group – 12,952 or 30% — the process was especially easy, since the state implemented another system-assisted strategy.2 Under a new opportunity that CMS made available to states in August 2015 , participants in SNAP who are under age 65 and meet specific criteria indicating they are certain to be eligible for Medicaid’s new Adult Group, can be enrolled based on their gross income as calculated by SNAP, without a separate Medicaid application. Louisiana is the first state in the nation approved by CMS to use this option, which further simplifies a targeted enrollment strategy offered to states in 2013. In the first few days the strategy was in effect, the state enrolled over 1,000 SNAP participants in Medicaid each day.
Following are the key steps Louisiana took to implement SNAP-assisted enrollment:
SNAP cohort is identified. First, the state conducted a detailed crosswalk of Medicaid and SNAP income-counting methodologies to identify differences that could rule out specific people from the “certain to be eligible” for Medicaid category. The Louisiana Department of Children and Family Services (the SNAP agency) transferred information on SNAP participants identified as certain to be eligible for Medicaid to the Department of Health and Hospitals (the Medicaid agency), which ran a data match to identify and eliminate from the group anyone who already had Medicaid coverage. As a result, the state identified a cohort of 105,000 individuals enrolled in SNAP who were eligible for the SNAP-assisted Medicaid enrollment process. These individuals were entered into the eligibility system as “pending” New Adult cases.
Canary yellow “offer letters” mailed to SNAP cohort. Beginning May 31, the Medicaid agency mailed an “offer letter,” in batches of 14,000 per day, to the SNAP cohort. The letter, enclosed in a bright, eye-catching, canary-yellow envelope, specifies the household members eligible to enroll in Medicaid and requests answers to four simple, yes-or-no questions needed to confirm Medicaid eligibility (see box). The letter also reminds individuals who may be enrolled in a qualified health plan (QHP) in the Marketplace, and who are getting the premium tax credit, that if they want to enroll in Medicaid, they must disenroll from the QHP or potentially face a penalty in the form of tax liability when they file a tax return next year.
Answer “Yes” or “No” to These Four Questions
Is anyone above listed as a dependent on an income tax return filed by someone who does not live with you?
Does anyone above file a tax return that claims someone as a dependent and that person does not live with you?
Does anyone above earn money from Delta Services Corps or AmeriCorps?
Is anyone under 18 years old and makes more than $525 a month?
SNAP participant responds. The letter asks the SNAP participant to affirm he or she wants Medicaid coverage by signing and returning the letter to the Medicaid agency by mail, fax or email. Individuals may also respond by phone and provide a telephonic signature.
Eligible SNAP participant is enrolled in Medicaid. When a response to the offer letter is received, a worker will check to see if the answer to all four questions is “No” (which is the case roughly 95% of the time), make sure there is a signature and verify that the SNAP case is still active. Other eligibility factors such as Louisiana residency and immigration status have been verified by SNAP and do not have to be repeated. U.S. citizenship is verified electronically. If all is in order, the “pending” status in the system is changed to “approved.” This process takes substantially less time than a full eligibility determination.
The state is drawing attention to the canary-yellow envelopes in public meetings and in the media. The state also expects to do another mailing to a “refreshed” list of people participating in SNAP as of July 1, and this time the state anticipates including a postage-paid reply envelope. Before sending the letters, the state will remove “stale” addresses based on returned mail. In addition, if a SNAP participant comes to a Medicaid application center to apply, the worker can check the state system to see whether the person appears with a pending status. If so, the worker can ask the four questions, rather than requiring the person to complete the full Medicaid application. Beginning July 1, this will become part of the routine Medicaid application process, so that SNAP participants, including children, can be enrolled using the streamlined procedure.
The SNAP Strategy in Action
“Lynnette,” a 45-year-old woman living in La Place, Louisiana had heard about the yellow envelopes on the news, but until one landed in her mailbox, she didn’t think the message was meant for her. She last had Medicaid 21 years ago when she was pregnant with her daughter. Since then she’s had health insurance off and on, and once she applied for Medicaid, but was turned down. That was a deep disappointment: Lynette is a diabetic who requires insulin. At $120 per month, that was something she just couldn’t afford. “It was a scary time,” she says. “I tried managing by watching my diet and exercising even when I just didn’t want to. But my sugar was never where it needed to be.” Lynnette developed circulation problems in her feet and now needs other medication as well. So when she opened the yellow envelope and learned that she could qualify for Medicaid, she was so excited. “It was so easy,” she said. “I answered the questions at the bottom of the form, scanned it and emailed it to the address they gave me. That was it. I really couldn’t believe it.”
A Sustainable Simplification
The new SNAP option that Louisiana is implementing carries distinct advantages over the strategy CMS made available in 2013. Under the earlier strategy, SNAP-assisted enrollment was most often a one-time event and was considered temporary, put in place as the ACA was being implemented, to help states overcome technological constraints and heavy workloads during the initial transition to their new systems. States could use the strategy for a given individual either at initial enrollment or renewal, but not both. Since states were not identifying SNAP participants “certain to be eligible” for Medicaid, they were required to conduct a full MAGI determination for SNAP participants they enrolled (or renewed) within 12 months. Even though a full eligibility determination would be required later, several states chose to adopt the option, and the first six participating states (AR, CA, IL, NJ, OR, WV) enrolled over 726,000 people during the first 14 months of implementation.3 The new strategy features a number of improvements: It is not considered a temporary measure, with CMS approval tied to the state experiencing systems challenges. Rather, it was conceived as an ongoing simplified process that can be used for both initial enrollment and subsequent renewals, as long as the individual continues to participate in SNAP.
Looking Ahead
With the SNAP-assisted enrollment strategy in place, Louisiana is looking at the future. The state is planning to activate the SNAP process for annual renewals and it is preparing to build the capacity to enable individuals to respond to the offer letter online. Ultimately, the process will be embedded into Louisiana’s routine Medicaid enrollment and renewal procedures. Whenever someone is approved for SNAP, the system will automatically generate information to be transferred to Medicaid. The state will then identify those not already enrolled in Medicaid and certain to be eligible, and send them the four questions. The state estimates that this innovation will save more than 52,000 FTE hours that would otherwise be spent by eligibility workers enrolling this population, saving the state over $1.5 million in estimated pay and benefits costs, in addition to any associated administrative costs.4 Louisiana’s adoption of system-assisted strategies have proved pivotal to facilitating rapid enrollment as the Medicaid expansion is being implemented. Incorporating the new procedures into the routine enrollment procedures will continue to streamline the process moving forward.
Louisiana Department of Health, administrative data extracted from MEDS (Medicaid Eligibility Data System), 7-1-2016. ↩︎
Louisiana Department of Health, “Louisiana Receives Approval for Unique Strategy to Enroll SNAP Beneficiaries in Expanded Medicaid Coverage,” (Louisiana Department of Health, June 2016), http://dhh.louisiana.gov/index.cfm/newsroom/detail/3838↩︎
Among beneficiaries who died in 2014, Medicare spent significantly more per person on medical services for seniors in their late sixties and early seventies than on older beneficiaries, according to a new data note from the Kaiser Family Foundation. The analysis comes at a time when physicians can now be reimbursed by Medicare for end-of-life care discussions with their patients.
The analysis of Medicare claims data through 2014 finds that among those who died in 2014, average Medicare spending per person peaked at age 73 ($43,353 in 2014) and generally declined after that to $33,381 among 85-year-olds and $27,779 among 90-year-olds. In contrast, Medicare per person spending increased with age among Medicare beneficiaries who lived through the entire year, peaking at age 97 ($14,620 in 2014) before declining.
The finding contradicts a popular assumption that Medicare, the federal health insurance program that covers 57 million seniors and people with disabilities, spends heavily on end-of-life medical care for the oldest beneficiaries.
While spending for beneficiaries who die in a given year is not a major component of Medicare spending, it does account for a disproportionate share of the total. In 2014, 4% of people on Medicare died that year, accounting for 13.5% of Medicare spending in 2014. Medicare spent nearly four times more on people who died in 2014($34,529 per person, on average) than on those who lived the entire year ($9,121), with a large share of the difference attributable to higher spending on inpatient hospital services. The share of total Medicare spending for people who die in a given year has actually dropped over time, from 18.6% of traditional Medicare spending in 2000 to 13.5% in 2014.
The analysis examines spending on traditional Medicare beneficiaries during the calendar year in which they died; it does not look back at spending in the full 12 months prior to their death. It also does not include spending on beneficiaries in Medicare Advantage, for whom data was not available.
Of the 2.6 million people who died in the U.S. in 2014,1 2.1 million, or eight out of 10, were people on Medicare,2 making Medicare the largest insurer of medical care provided at the end of life. Spending on Medicare beneficiaries in their last year of life accounts for about 25% of total Medicare spending on beneficiaries age 65 or older.3 The fact that a disproportionate share of Medicare spending goes to beneficiaries at the end of life is not surprising given that many have serious illnesses or multiple chronic conditions and often use costly services, including inpatient hospitalizations, post-acute care, and hospice, in the year leading up to their death.
This data note provides a snapshot of Medicare beneficiaries who died at some point in 2014 and spending at the end of life. It examines Medicare per capita spending in 2014 and trends since 2000, both overall and by type of service, for beneficiaries in traditional Medicare who died at some point during the year (referred to here as “decedents”) compared to those who lived for the entire year (referred to here as “survivors”). The analysis includes beneficiaries who are under age 65 with disabilities, those who qualified for Medicare due to having end-stage renal disease, and those who are age 65 or older.4 The analysis of per capita spending excludes beneficiaries enrolled in Medicare Advantage because data on Medicare spending, overall and by type of service, are not available for these enrollees.5 The analysis is based on data from a 5% sample of Medicare claims for services covered under Parts A, B, and D for traditional Medicare beneficiaries from the Centers for Medicare & Medicaid Services (CMS) Chronic Conditions Data Warehouse (CCW) from 2000 to 2014.
Findings
What are the characteristics of medicare beneficiaries who died at some point in 2014?
More than half of Medicare decedents were age 80 or older in 2014.
Of the more than 2.1 million Medicare beneficiaries who died at some point in 2014—representing 4.0% of the total Medicare population that year—over half (55%) were age 80 or older, which is more than double their share of the Medicare population overall (22%) (Figure 1). Just over half (52%) of decedents were women and eight out of 10 were non-Hispanic white (81%), roughly comparable to their shares of the overall Medicare population (54% and 77%, respectively).
Figure 1: More than half of Medicare beneficiaries who died at some point in 2014 were age 80 or older
More than seven in 10 (72%, or 1.5 million) Medicare decedents were in traditional Medicare in 2014, and the remainder (28%, or 0.6 million) were enrolled in Medicare Advantage plans, reflecting overall enrollment patterns in traditional Medicare and Medicare Advantage.
Diseases that were highly prevalent among decedents in traditional Medicare in 2014 include hypertension (67%), ischemic heart disease (53%), chronic kidney disease (51%), congestive heart failure (48%), Alzheimer’s disease or dementia (43%), diabetes (38%), and cancer (17%). The prevalence of each of these conditions was higher among beneficiaries who died at some point in 2014 than among beneficiaries overall, in some cases substantially higher (Table 1). For example, more than 4 in 10 decedents had Alzheimer’s or dementia, compared to only 9% of beneficiaries overall, and more half of decedents had ischemic heart disease, compared to one fourth of beneficiaries overall.
How does medicare per capita spending differ for decedents and survivors in 2014 and over time?
Average total Medicare per capita spending was nearly four times higher for beneficiaries in traditional Medicare who died at some point in 2014 than for those who lived the entire year.
Average Medicare per capita spending on services covered under Parts A, B, and D for traditional Medicare beneficiaries who died at some point in 2014 was $34,529—nearly four times higher than per capita spending for survivors ($9,121) and more than three times higher than the average among all beneficiaries in traditional Medicare ($10,126) (Figure 2).
Figure 2: Medicare per capita spending was nearly four times higher for decedents than survivors in 2014
In 2014, beneficiaries who died at some point during the year accounted for 4% of all beneficiaries in traditional Medicare, but 13.5% of traditional Medicare spending. This amount is disproportionate to the decedent share of beneficiaries overall, but it accounts for a relatively small share of total spending that year. This estimate is lower than the 25% estimate cited earlier because it is based on Medicare spending for people who died at some point in a given calendar year (in this case, 2014), rather than the last 12 months of spending for people who died.6
The share of total traditional Medicare spending on beneficiaries who died at some point during the year has decreased over time.
The share of total traditional Medicare spending on beneficiaries who died at some point during the year has dropped over time, from 18.6% in 2000 to 13.5% in 2014 (Figure 3). This drop is likely due to a combination of factors affecting total traditional Medicare spending over time and spending on decedents, including: growth in the number of Medicare beneficiaries overall, particularly in recent years as the baby boom generation ages on to Medicare, which means more younger, healthier beneficiaries, on average; longer life expectancy, which means people are living longer and dying at older ages (as seen in a decline in the share of traditional Medicare beneficiaries who die at some point in a given year—from 4.9% in 2000 to 4.0% in 2014); lower average per capita spending on older decedents compared to younger decedents (as described further below); and slower growth in the rate of annual per capita spending for decedents than survivors (also described further below).
Figure 3: The share of total traditional Medicare spending on traditional Medicare beneficiaries who died at some point in the year has declined over time
Between 2000 and 2014, the annual rate of growth in average Medicare per capita spending was lower among decedents than survivors.
Average Medicare spending among decedents was 80% higher per person in 2014 ($34,529) than in 2000 ($19,130), while average spending among survivors more than doubled between 2000 and 2014, from $4322 to $9,121 (Figure 4).
Figure 4: Medicare per capita spending roughly doubled for both decedents and survivors between 2000 and 2014
Although average per capita spending was higher for decedents than survivors in each year between 2000 and 2014, the average annual rate of growth in spending over this time period was lower for decedents (4.3%) than for survivors (5.5%).
What services account for the difference in medicare per capita spending between decedents and survivors?
Higher Medicare per capita spending among decedents than survivors in traditional Medicare is primarily driven by much higher spending on inpatient hospital services.
Spending on inpatient hospital services accounted for the largest amount of per capita Medicare spending by type of service among decedents in traditional Medicare in 2014 (Figure 5; Table 2), and was the primary reason for the substantial difference in spending between decedents and survivors. Per capita inpatient hospital spending among decedents was $17,574 in 2014, on average, seven times higher than among survivors ($2,497). Decedents also incurred much higher spending on post-acute care (skilled nursing facility (SNF) and home health services) and hospice care than survivors in 2014.
Figure 5: Spending on inpatient hospital services was 7 times higher among decedents than survivors in 2014
Inpatient hospital services accounted for the largest share of average Medicare per capita spending by type of service for traditional Medicare beneficiaries overall in 2014 (31%), but the share of per capita spending on inpatient hospital services was particularly large for decedents, accounting for just over half (51%) of total spending in 2014 (Figure 6).
Figure 6: Inpatient hospital care accounted for the largest share of per capita Medicare spending for decedents and survivors in 2014
For decedents, the next largest service categories were physicians, providers, and supplies combined and post-acute care (skilled nursing facilities and home health services), at 13% each, followed by hospice care (10%). For surviving beneficiaries in traditional Medicare, inpatient hospital services accounted for 27% of total per capita Medicare spending in 2014, followed closely by spending on physicians/providers/supplies (23%) and Part B and Part D prescription drugs (21%).
How does Medicare per capita spending differ for decedents under and over age 65, and what accounts for the difference in spending?
Medicare per capita spending was higher for decedents under age 65 in 2014 than for those over age 65.
Among decedents in traditional Medicare in 2014 who were younger than age 65, Medicare per capita spending was $41,950, on average (Figure 7). This amount is 25% more than average per capita spending among decedents over age 65 in 2014 ($33,676).
Figure 7: Average Medicare per capita spending was higher for decedents under age 65 than those over age 65 in 2014
The fact that Medicare per capita spending is higher for decedents under age 65 than those over age 65 is related to the fact that a larger share of traditional Medicare beneficiaries under age 65 who died at some point in 2014 is dually eligible for Medicare and Medicaid than of decedents who are over age 65, and their Medicare per capita spending is significantly higher, on average, than dually eligible beneficiaries over age 65. Among dually eligible decedents in 2014, average Medicare per capita spending among those under age 65 was $51,997, compared to $36,037 among those over age 65.
In terms of Medicare spending by type of service, higher per capita spending among decedents under age 65 than among those over age 65 was driven by higher spending on inpatient hospital services ($24,515 versus $16,701, respectively), along with higher spending on outpatient hospital, physician/providers/supplies, and Part B/D prescription drugs (Figure 8). By contrast, among decedents over age 65, spending was higher on post-acute care and hospice care.
Figure 8: Higher spending among decedents under age 65 than those over age 65 in 2014 was primarily due to higher spending on inpatient hospital services
How does medicare per capita spending differ among decedents over age 65?
Per capita Medicare spending generally declines with age among decedents in traditional Medicare who are over age 65.
Among decedents over age 65, Medicare per capita spending was highest for those in their early 70s and then declined with each year of age in 2014 (Figure 9). Among survivors over age 65, the opposite pattern occurred, with spending rising steadily with each year of age in 2014.
Figure 9: Medicare per capita spending for decedents over age 65 declined with age in 2014, while spending for survivors increased
What services account for the difference in spending by age among decedents over age 65?
The decline in Medicare per capita spending by age for decedents over age 65 in 2014 was mainly due to lower inpatient spending.
Per capita Medicare spending on inpatient hospital services decreased steadily with age among decedents in 2014 (Figure 10; Table 3), declining from more than $20,000 for decedents in their late sixties and seventies to around $10,000 or less among decedents older than age 90. In contrast, per capita spending for hospice services increased with age among decedents, from around $2,000 to $5,000 or more between the ages of 66 and 100. Spending on post-acute care (SNF and home health) also increased with advancing age.
Figure 10: Medicare spending declined with age for decedents over age 65 in 2014, mainly due to lower inpatient hospital spending
In contrast, spending increased with each year of age among survivors over age 65 in 2014, primarily due to increasing spending on post-acute and hospice care (Figure 11; Table 4). Inpatient hospital care was the costliest type of service for survivors in traditional Medicare up to the early nineties, after which age spending on post-acute care was the largest amount.
Figure 11: Spending increased with age among survivors over age 65 in 2014, due to higher spending on post-acute and hospice care
Discussion
Much attention has been focused lately on end-of-life care, the services patients receive at the end of life, and Medicare spending on these services. This analysis contributes a number of important findings to the discussion surrounding these issues.
Our analysis shows that Medicare per capita spending for beneficiaries in traditional Medicare who died at some point in 2014 was substantially higher than for those who lived the entire year, as might be expected. It also shows that Medicare per capita spending among beneficiaries over age 65 who die in a given year declines steadily with age. Per capita spending for inpatient services is lower among decedents in their eighties, nineties, and older than for decedents in their late sixties and seventies, while spending is higher for hospice care among older decedents. These results suggest that providers, patients, and their families may be inclined to be more aggressive in treating younger seniors compared to older seniors, perhaps because there is a greater expectation for positive outcomes among those with a longer life expectancy, even those who are seriously ill.
In addition, we find that total spending on people who die in a given year accounts for a relatively small and declining share of traditional Medicare spending. This reduction is likely due to a combination of factors, including: growth in the number of traditional Medicare beneficiaries overall as the baby boom generation ages on to Medicare, which means a younger, healthier beneficiary population, on average; gains in life expectancy, which means beneficiaries are living longer and dying at older ages; lower average per capita spending on older decedents compared to younger decedents; slower growth in the rate of annual per capita spending for decedents than survivors, and a slight decline between 2000 and 2014 in the share of beneficiaries in traditional Medicare who died at some point in each year.
This analysis focuses exclusively on beneficiaries in traditional Medicare, excluding the roughly one in three beneficiaries who are enrolled in Medicare Advantage plans,7 because comparable spending data for Medicare Advantage enrollees are not available. With research showing significant differences in certain demographic and health status characteristics between decedents in traditional Medicare and in Medicare Advantage,8 it is possible that spending and service use patterns may differ as well. While the majority of Medicare beneficiaries who died at some point in 2014 were in traditional Medicare, the inclusion of Medicare Advantage enrollees would provide a better understanding of whether and how the experiences of traditional Medicare and Medicare Advantage beneficiaries differ at the end of life.
Decisions pertaining to end-of-life care are among the most difficult for patients, families, and health care providers. The recent change in Medicare payment policy to reimburse physicians for conversations about advance care planning with their patients9 could bring about changes that better align services delivered with patient preferences and that also potentially reduce the costs associated with care at the end of life.
Juliette Cubanski, Tricia Neuman, and Shannon Griffin are with the Kaiser Family Foundation. Anthony Damico is an independent consultant.
Tables
Table 1: Prevalence of Selected Conditions Among Traditional Medicare Beneficiaries, 2014
Condition
All traditional Medicare beneficiaries
Decedents
Survivors
Hypertension
50%
67%
49%
Ischemic Heart disease
25%
53%
23%
Chronic Kidney Disease
15%
51%
14%
Anemia
20%
50%
19%
Congestive Heart Failure
12%
48%
11%
Alzheimer’s Disease/Dementia
9%
43%
8%
Diabetes
24%
38%
24%
Rheumatoid Arthritis/Osteoarthritis
27%
35%
26%
Chronic Obstructive Pulmonary Disease
10%
29%
9%
Depression
15%
27%
14%
Any Cancer
7%
17%
7%
Stroke/Transient Ischemic Attack
3%
11%
3%
NOTE: Excludes beneficiaries in Medicare Advantage.SOURCE: Kaiser Family Foundation analysis of a five percent sample of 2014 Medicare claims from the CMS Chronic Conditions Data Warehouse.
Table 2: Amount and Distribution of Average Medicare Per Capita Spending Overall and by Type of Service for Traditional Medicare Beneficiaries, 2014
Type of service
Part of Medicare covering service
All traditionalMedicare beneficiaries
Decedents
Survivors
Amount
Percent of total
Amount
Percent of total
Amount
Percent of total
Total
$10,126
100.0%
$34,529
100.0%
$9,121
100.0%
Part D drugs
D
1,590
15.7
1,352
3.9
1,600
17.5
Acute inpatient hospital
A
2,691
26.6
15,586
45.1
2,160
23.7
Outpatient hospital
A
1,531
15.1
2,536
7.3
1,490
16.3
Other inpatient hospital
A
402
4.0
1,988
5.8
337
3.7
Evaluation & management
B
446
4.4
2,026
5.9
381
4.2
Other Part B procedures
B
477
4.7
636
1.8
470
5.2
Skilled nursing facility
A
702
6.9
3,425
9.9
589
6.5
Physician office services
B
390
3.9
277
0.8
395
4.3
Home health
A or B1
443
4.4
1,231
3.6
410
4.5
Part B drugs
B
333
3.3
554
1.6
324
3.5
Tests
B
236
2.3
211
0.6
237
2.6
Durable medical equipment
B
143
1.4
190
0.6
141
1.6
Other Part B services
B
166
1.6
764
2.2
141
1.5
Imaging
B
157
1.6
264
0.8
153
1.7
Hospice
A
271
2.7
3,329
9.6
145
1.6
Dialysis
B
21
0.2
57
0.2
20
0.2
Anesthesia
B
51
0.5
81
0.2
50
0.5
Ambulatory surgery center
B
77
0.8
21
0.1
79
0.9
NOTE: Excludes beneficiaries in Medicare Advantage. Percentages may not sum to 100% due to rounding.1Home health services can be covered under Part A or Part B depending on whether or not the services follow a hospital stay.SOURCE: Kaiser Family Foundation analysis of a five percent sample of 2014 Medicare claims from the CMS Chronic Conditions Data Warehouse.
Table 3: Amount and Distribution of Average Medicare Per Capita Spending Overall and by Type of Service for Decedents in Traditional Medicare Over Age 65, by Age, 2014
TOTAL PER CAPITA
Inpatient hospital
Outpatient hospital
Part B providers/ services/ supplies
Part B andPart D prescription drugs
Skilled nursing facility
Hospice
Home health
AGE
Amount
% of total
Amount
% of total
Amount
% of total
Amount
% of total
Amount
% of total
Amount
% of total
Amount
% of total
Amount
% of total
All >65
$33,676
100%
$16,701
49.6%
$2,375
7.1%
$4,406
13.1%
$1,735
5.2%
$3,641
10.8%
$3,538
10.5%
$1,280
3.8%
66
38,840
100
22,289
57.4
3,842
9.9
5,493
14.1
2,614
6.7
1,907
4.9
1,849
4.8
846
2.2
67
40,843
100
23,265
57.0
3,701
9.1
5,657
13.9
2,734
6.7
2,375
5.8
2,158
5.3
954
2.3
68
42,314
100
24,111
57.0
4,130
9.8
5,607
13.3
2,696
6.4
2,321
5.5
2,412
5.7
1,038
2.5
69
40,692
100
23,101
56.8
3,797
9.3
5,751
14.1
2,473
6.1
2,160
5.3
2,385
5.9
1,024
2.5
70
40,753
100
22,557
55.3
3,772
9.3
5,599
13.7
2,817
6.9
2,631
6.5
2,281
5.6
1,096
2.7
71
43,316
100
23,942
55.3
3,942
9.1
5,941
13.7
2,856
6.6
2,950
6.8
2,550
5.9
1,135
2.6
72
41,381
100
22,520
54.4
3,664
8.9
5,757
13.9
2,587
6.3
2,901
7.0
2,789
6.7
1,162
2.8
73
43,353
100
23,652
54.6
4,124
9.5
6,133
14.1
2,655
6.1
3,091
7.1
2,547
5.9
1,150
2.7
74
40,939
100
22,079
53.9
3,548
8.7
5,592
13.7
2,568
6.3
3,432
8.4
2,515
6.1
1,206
2.9
75
41,909
100
22,994
54.9
3,432
8.2
5,791
13.8
2,332
5.6
3,334
8.0
2,856
6.8
1,171
2.8
76
40,882
100
22,034
53.9
3,149
7.7
5,649
13.8
2,522
6.2
3,173
7.8
3,028
7.4
1,327
3.2
77
40,758
100
21,851
53.6
3,007
7.4
5,660
13.9
2,426
6.0
3,575
8.8
2,956
7.3
1,282
3.1
78
39,014
100
20,223
51.8
2,960
7.6
5,395
13.8
2,219
5.7
3,672
9.4
3,278
8.4
1,268
3.3
79
39,760
100
20,954
52.7
2,976
7.5
5,526
13.9
2,031
5.1
3,758
9.5
3,222
8.1
1,293
3.3
80
36,841
100
18,710
50.8
2,572
7.0
4,800
13.0
1,896
5.1
3,858
10.5
3,549
9.6
1,456
4.0
81
36,640
100
19,396
52.9
2,393
6.5
4,986
13.6
1,806
4.9
3,642
9.9
3,073
8.4
1,344
3.7
82
34,938
100
17,408
49.8
2,694
7.7
4,552
13.0
1,591
4.6
3,962
11.3
3,300
9.4
1,431
4.1
83
32,969
100
16,081
48.8
2,144
6.5
4,372
13.3
1,542
4.7
4,199
12.7
3,263
9.9
1,368
4.1
84
32,880
100
15,595
47.4
2,269
6.9
4,252
12.9
1,526
4.6
4,168
12.7
3,724
11.3
1,347
4.1
85
33,381
100
16,105
48.2
2,009
6.0
4,304
12.9
1,523
4.6
4,399
13.2
3,620
10.8
1,422
4.3
86
30,634
100
14,388
47.0
1,759
5.7
3,885
12.7
1,407
4.6
4,123
13.5
3,789
12.4
1,285
4.2
87
30,831
100
14,249
46.2
1,644
5.3
3,935
12.8
1,365
4.4
4,204
13.6
3,940
12.8
1,495
4.9
88
30,009
100
13,841
46.1
1,627
5.4
3,701
12.3
1,167
3.9
4,393
14.6
3,839
12.8
1,440
4.8
89
29,655
100
12,998
43.8
1,496
5.0
3,612
12.2
1,387
4.7
4,437
15.0
4,274
14.4
1,451
4.9
90
27,779
100
12,030
43.3
1,500
5.4
3,454
12.4
1,118
4.0
4,199
15.1
4,064
14.6
1,415
5.1
91
25,592
100
10,717
41.9
1,307
5.1
3,136
12.3
963
3.8
3,799
14.8
4,329
16.9
1,341
5.2
92
26,276
100
10,740
40.9
1,220
4.6
3,118
11.9
961
3.7
4,151
15.8
4,662
17.7
1,424
5.4
93
24,270
100
9,627
39.7
1,213
5.0
2,774
11.4
835
3.4
3,960
16.3
4,568
18.8
1,293
5.3
94
25,443
100
9,867
38.8
1,091
4.3
2,883
11.3
922
3.6
4,503
17.7
4,864
19.1
1,313
5.2
95
23,181
100
9,129
39.4
1,046
4.5
2,691
11.6
940
4.1
3,690
15.9
4,538
19.6
1,147
4.9
96
22,668
100
8,107
35.8
1,123
5.0
2,548
11.2
855
3.8
3,652
16.1
5,068
22.4
1,317
5.8
97
21,491
100
7,768
36.1
1,000
4.7
2,223
10.3
750
3.5
3,192
14.9
5,475
25.5
1,083
5.0
98
20,259
100
7,344
36.2
893
4.4
2,130
10.5
814
4.0
3,091
15.3
4,816
23.8
1,170
5.8
99
19,011
100
6,740
35.5
771
4.1
2,107
11.1
684
3.6
2,930
15.4
4,739
24.9
1,041
5.5
100
18,471
100
5,926
32.1
813
4.4
1,688
9.1
773
4.2
2,279
12.3
6,247
33.8
745
4.0
101
16,564
100
5,288
31.9
825
5.0
1,604
9.7
842
5.1
1,958
11.8
5,163
31.2
885
5.3
102
18,739
100
5,714
30.5
570
3.0
1,876
10.0
841
4.5
2,203
11.8
6,188
33.0
1,348
7.2
103
17,714
100
4,488
25.3
516
2.9
1,338
7.6
467
2.6
3,015
17.0
6,727
38.0
1,163
6.6
104
14,985
100
4,932
32.9
1,206
8.0
1,469
9.8
961
6.4
2,243
15.0
3,438
22.9
736
4.9
NOTE: Excludes beneficiaries in Medicare Advantage. 65-year-olds are excluded from the analysis of spending by year of age because they are enrolled for less than a full year. Percentages may not sum to 100% due to rounding.SOURCE: Kaiser Family Foundation analysis of a five percent sample of 2014 Medicare claims from the CMS Chronic Conditions Data Warehouse.
Table 4: Amount and Distribution of Average Medicare Per Capita Spending Overall and by Type of Service for Survivors in Traditional Medicare Over Age 65, by Age, 2014
TOTAL PER CAPITA
Inpatient hospital
Outpatient hospital
Part B providers/ services/ supplies
Part B andPart D prescription drugs
Skilled nursing facility
Hospice
Home health
AGE
Amount
% of total
Amount
% of total
Amount
% of total
Amount
% of total
Amount
% of total
Amount
% of total
Amount
% of total
Amount
% of total
All >65
$8,839
100%
$2,441
27.6%
$1,404
15.9%
$2,154
24.4%
$1,509
17.1%
$691
7.8%
$179
2.0%
$461
5.2%
66
5,271
100
1,472
27.9
986
18.7
1,368
26.0
1,092
20.7
183
3.5
19
0.4
151
2.9
67
5,694
100
1,551
27.2
1,052
18.5
1,509
26.5
1,174
20.6
210
3.7
26
0.5
172
3.0
68
6,257
100
1,738
27.8
1,128
18.0
1,655
26.5
1,282
20.5
239
3.8
27
0.4
188
3.0
69
6,676
100
1,824
27.3
1,232
18.5
1,778
26.6
1,338
20.0
268
4.0
30
0.4
206
3.1
70
7,180
100
2,003
27.9
1,277
17.8
1,903
26.5
1,412
19.7
311
4.3
40
0.6
235
3.3
71
7,632
100
2,142
28.1
1,374
18.0
2,021
26.5
1,453
19.0
330
4.3
51
0.7
260
3.4
72
7,889
100
2,150
27.2
1,422
18.0
2,098
26.6
1,536
19.5
352
4.5
51
0.7
280
3.6
73
8,398
100
2,292
27.3
1,488
17.7
2,228
26.5
1,607
19.1
396
4.7
72
0.9
314
3.7
74
8,933
100
2,509
28.1
1,569
17.6
2,327
26.1
1,640
18.4
472
5.3
76
0.8
340
3.8
75
9,178
100
2,517
27.4
1,599
17.4
2,390
26.0
1,693
18.5
521
5.7
84
0.9
372
4.1
76
9,627
100
2,667
27.7
1,644
17.1
2,492
25.9
1,728
18.0
588
6.1
90
0.9
416
4.3
77
9,886
100
2,796
28.3
1,631
16.5
2,536
25.6
1,742
17.6
642
6.5
101
1.0
439
4.4
78
10,370
100
2,947
28.4
1,722
16.6
2,603
25.1
1,738
16.8
724
7.0
128
1.2
508
4.9
79
10,579
100
3,021
28.6
1,697
16.0
2,624
24.8
1,728
16.3
810
7.7
147
1.4
552
5.2
80
10,730
100
2,986
27.8
1,678
15.6
2,618
24.4
1,764
16.4
920
8.6
178
1.7
587
5.5
81
10,909
100
3,099
28.4
1,636
15.0
2,622
24.0
1,720
15.8
967
8.9
226
2.1
640
5.9
82
11,201
100
3,181
28.4
1,673
14.9
2,677
23.9
1,680
15.0
1,088
9.7
199
1.8
704
6.3
83
11,540
100
3,286
28.5
1,635
14.2
2,711
23.5
1,706
14.8
1,164
10.1
272
2.4
766
6.6
84
11,983
100
3,391
28.3
1,673
14.0
2,717
22.7
1,780
14.9
1,303
10.9
299
2.5
821
6.9
85
12,342
100
3,449
27.9
1,639
13.3
2,731
22.1
1,770
14.3
1,460
11.8
390
3.2
902
7.3
86
12,434
100
3,425
27.5
1,676
13.5
2,677
21.5
1,735
14.0
1,564
12.6
390
3.1
967
7.8
87
12,793
100
3,518
27.5
1,634
12.8
2,706
21.2
1,710
13.4
1,758
13.7
430
3.4
1,036
8.1
88
12,818
100
3,488
27.2
1,538
12.0
2,669
20.8
1,678
13.1
1,781
13.9
551
4.3
1,112
8.7
89
13,446
100
3,668
27.3
1,534
11.4
2,685
20.0
1,722
12.8
2,023
15.0
613
4.6
1,201
8.9
90
13,457
100
3,588
26.7
1,507
11.2
2,592
19.3
1,645
12.2
2,113
15.7
808
6.0
1,205
9.0
91
13,335
100
3,481
26.1
1,425
10.7
2,505
18.8
1,576
11.8
2,166
16.2
871
6.5
1,311
9.8
92
13,999
100
3,701
26.4
1,390
9.9
2,510
17.9
1,621
11.6
2,334
16.7
1,037
7.4
1,406
10.0
93
13,640
100
3,419
25.1
1,414
10.4
2,443
17.9
1,524
11.2
2,365
17.3
1,093
8.0
1,381
10.1
94
14,173
100
3,557
25.1
1,327
9.4
2,436
17.2
1,567
11.1
2,447
17.3
1,341
9.5
1,497
10.6
95
14,039
100
3,526
25.1
1,284
9.1
2,370
16.9
1,502
10.7
2,382
17.0
1,473
10.5
1,503
10.7
96
14,232
100
3,444
24.2
1,242
8.7
2,239
15.7
1,572
11.0
2,575
18.1
1,661
11.7
1,498
10.5
97
14,620
100
3,349
22.9
1,178
8.1
2,206
15.1
1,470
10.1
2,881
19.7
1,957
13.4
1,579
10.8
98
14,114
100
3,064
21.7
1,195
8.5
2,067
14.6
1,442
10.2
2,591
18.4
2,319
16.4
1,436
10.2
99
13,929
100
3,065
22.0
1,038
7.5
2,015
14.5
1,371
9.8
2,434
17.5
2,578
18.5
1,428
10.3
100
14,546
100
2,791
19.2
976
6.7
1,940
13.3
1,470
10.1
2,563
17.6
3,377
23.2
1,429
9.8
101
13,018
100
2,625
20.2
952
7.3
1,831
14.1
1,313
10.1
2,378
18.3
2,593
19.9
1,327
10.2
102
13,386
100
2,790
20.8
864
6.5
1,816
13.6
1,259
9.4
2,192
16.4
3,024
22.6
1,442
10.8
103
12,273
100
2,938
23.9
833
6.8
1,630
13.3
1,028
8.4
1,935
15.8
2,182
17.8
1,728
14.1
104
9,217
100
1,780
19.3
582
6.3
1,139
12.4
801
8.7
1,632
17.7
2,350
25.5
935
10.1
NOTE: Excludes beneficiaries in Medicare Advantage. 65-year-olds are excluded from the analysis of spending by year of age because they are enrolled for less than a full year.SOURCE: Kaiser Family Foundation analysis of a five percent sample of 2014 Medicare claims from the CMS Chronic Conditions Data Warehouse.
Endnotes
National Center for Health Statistics, Health, United States, 2015: With Special Feature on Racial and Ethnic Health Disparities, 2016, Table 19: “Leading causes of death and numbers of deaths, by sex, race, and Hispanic origin: United States, 1980 and 2014,” available at http://www.cdc.gov/nchs/data/hus/hus15.pdf#019. ↩︎
Kaiser Family Foundation analysis of a five percent sample of 2014 Medicare claims from the Centers for Medicare & Medicaid Services’ Chronic Conditions Data Warehouse. ↩︎
Gerald F. Riley and James D. Lubitz, “Long-Term Trends in Medicare Payments in the Last Year of Life,” Health Services Research April 2010; 45(2):565-576. ↩︎
We exclude beneficiaries who are exactly age 65 from the analysis of spending by year of age and spending comparisons between beneficiaries under age 65 and over age 65 because many are enrolled for less than a full year, resulting in less than an entire year of Medicare spending data. ↩︎
Medicare spending for Medicare Advantage enrollees takes the form of monthly capitation payments which are not based on actual service utilization. ↩︎
We are unable to examine spending data that spans the last 12 months of life for decedents in our analysis because we are unable to disaggregate spending data for a given beneficiary for periods of time less than one calendar year. Had we been able to calculate Medicare spending for a 12-month period for both survivors and dependents, the difference in per capita spending between decedents and survivors and the estimate of spending on decedents as a share of total Medicare spending would have been larger. ↩︎
Elena Byhoff, John A. Harris, and John Z. Ayanian, “Characteristics of Decedents in Medicare Advantage and Traditional Medicare,” Research Letter, JAMA Internal Medicine June 2016; Published online ahead of print: E1-3. ↩︎
The House Committee on Appropriations approved the FY 2017 State and Foreign Operations Appropriations bill and associated committee report, which includes funding for U.S. global health programs at the U.S. Agency for International Development (USAID) and the State Department (see table below) comprising a significant portion of U.S. funding for global health (total funding for global health is not currently available as some funding provided through USAID and DoD is not yet available).
Funding in the bill for the Global Health Programs (GHP) account, which includes the majority of global health funding, totaled $8.9 billion, $413 million (5%) above the FY16 enacted level, $340 million (4%) above the President’s FY17 request, and $252 million (3%) above the Senate FY17 SFOPs appropriations bill.
Funding for most global health programs under the GHP account increased in the House FY17 SFOPs appropriations bill compared to both the President’s FY17 Request and the FY16 enacted level including for the following program areas: tuberculosis, malaria, global health security, maternal and child health (MCH), nutrition, and vulnerable children. Funding for bilateral HIV programs as part of the President’s Emergency Plan for AIDS Relief (PEPFAR) and the U.S. contribution to The Global Fund to Fight AIDS, Tuberculosis and Malaria (Global Fund) matched the President’s request and the FY16 enacted level. Family Planning and Reproductive Health (FP/RH) was the only program that declined in the House FY17 SFOPs bill as funding was capped at $461 million, $159 million (-26%) below the President’s Request and $147 million (24%) below the FY16 enacted level. Funding for neglected tropical diseases (NTDs) was not specified in the bill.
While the House FY17 SFOPs appropriations bill provides increased funding for malaria ($845 million) through the GHP account compared to the President’s request ($745 million) and the FY16 enacted level ($674 million), the House bill does not provide the authority requested by the President to transfer an additional $129.0 million in emergency Ebola funding to malaria programs resulting in an overall total that is lower than the President’s Request.
The bill also included the following policy provisions:
• Reinstates the Mexico City Policy (also known as the “Global Gag Rule”)• Prohibits funding for the United Nations Population Fund (UNFPA)
Additional Information:- Learn more about the Senate SFOPs appropriations bill here.