KFF designs, conducts and analyzes original public opinion and survey research on Americans’ attitudes, knowledge, and experiences with the health care system to help amplify the public’s voice in major national debates.
Updated on February 22, 2017. Originally posted August 1, 2016.
In the debate over the future of the Affordable Care Act (ACA), proposals have emerged that would repeal or weaken rules prohibiting health insurance discrimination based on health status, instead offering high-risk pools as a source of coverage for people who would be uninsurable due to pre-existing conditions.
Last year, HR 2653 was introduced by members of the House Republican Study Committee to repeal the ACA and replace it with other changes, including state high-risk pools. This bill would authorize $50 million for seed grants to help states establish high-risk pools, and $2.5 billion annually for 10 years to help states fund high-risk pools. More recent ACA replacement proposals would modify ACA market rules to guarantee access to non-group coverage for individuals who maintain continuous coverage, but not necessarily for other individuals; several proposals also would provide grants to states to help fund high-risk pools.
For more than 35 years, many states operated high-risk pool programs to offer non-group health coverage to uninsurable residents. The federal government also operated a temporary high-risk pool program established under the ACA to provide coverage to people with pre-existing conditions in advance of when broader insurance market changes took effect in 2014. This issue brief reviews the history of these programs to provide context for some of the potential benefits and challenges of a high-risk pool.
Distribution and Persistence of Population Health Spending
In the U.S. and other developed nations, population health care spending is highly concentrated: in any given year, the healthiest 50% of the population accounts for less than 3% of total health care expenditures, while the sickest 10% account for nearly two-thirds of population health spending (Figure 1). Private health insurance pools risks so that premiums paid by most enrollees, who have low claims costs, help pay claims for the small share of enrollees with high costs.
Who is included in the high-cost and low-cost groups changes from year to year. Most people are healthy most of the time, but illness and injury can and do onset unexpectedly for millions of people. Some high-cost conditions, such as hemophilia or HIV, persist and require treatment for extended periods, even a lifetime. Other high-cost conditions may improve or resolve, allowing patients to return to low annual health care spending. In any given year, among the 50% least expensive people in a year, 73% will remain in that group for a second year; similarly, of people who are among the most expensive 10% of the population in one year, only 45% would still be in that group the following year.1
Figure 1: Concentration of Health Care Spending in U.S. Population
Prior to implementation of the ACA, insurers selling individual insurance commonly practiced medical underwriting, excluding people with pre-existing conditions or charging them higher premiums. Medical underwriting effectively excludes a large proportion of total health care spending from the insurance pool. This can permit less expensive policies for healthier individuals, but requires some other mechanism, such as high-risk pools, to help finance costs attributable to the sickest individuals if they are to be covered. Enrollee premiums can finance a portion of the cost of such programs, but by definition, significant additional funding will also be required because the cost of each person covered will be substantial. For example, based on the distribution illustrated in Figure 1, per person costs in the top 10th percentile are more than 100 times, on average, that of people in the bottom 50th percentile.
State High-Risk Pools
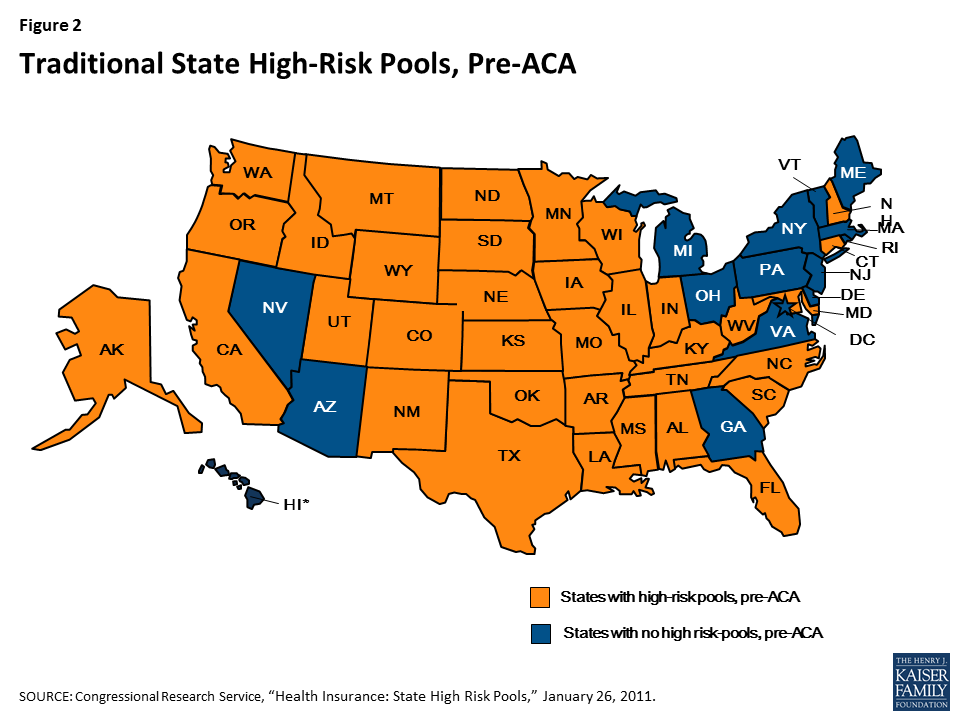
Prior to implementation of the ACA, 35 states offered high-risk pools as a source of non-group health insurance for eligible residents (Figure 2). The first pools were implemented by Minnesota and Connecticut in 1976; North Carolina implemented a high-risk pool in 2009. Pools offered eligibility to people in one or more of the following categories:
Medically eligible – Originally, high-risk pools were created to offer coverage to state residents with pre-existing conditions that made them uninsurable in the medically underwritten non-group health insurance market. Alabama was the only state high-risk pool that did not provide coverage to medically eligible individuals. (The Florida pool, which did provide such coverage, closed to new enrollment in 1991.)2 Medically eligible individuals had to demonstrate their application for individual health insurance had been denied or restricted, or – in about two-thirds of state pools with presumptively eligible medical conditions lists – that they had been diagnosed with an eligible condition.3
HIPAA eligible – Following enactment of the Health Insurance Portability and Accountability Act of 1996 (HIPAA) – a federal law requiring non-group coverage to be available on a guaranteed issue basis with no pre-existing condition exclusions to certain individuals who had lost group health plan coverage – most state high-risk pools extended eligibility to HIPAA-eligible individuals. One state, Alabama, opened its pool only to HIPAA-eligible individuals.4
HCTC eligible – The Trade Act of 2002 established a federal health coverage tax credit (HCTC) to subsidize HIPAA-like coverage for certain eligible individuals with trade-related job loss. Roughly two-thirds of state pools extended eligibility to HCTC-eligible individuals.
Medicare eligible – Finally, nearly two-thirds of state high-risk pools offered coverage to Medicare-eligible residents who needed supplemental coverage.
Figure 2: Traditional State High-Risk Pools, Pre-ACA
State High-Risk Pool Enrollment, Program Features, and Costs
Before HIPAA was enacted in 1996, there were 25 state high-risk pools with combined enrollment of 91,054.5 By the end of 2011, combined enrollment in 35 state high-risk pools reached 226,615. In four states (Maryland, Minnesota, Texas and Wisconsin) enrollment exceeded 20,000 individuals; in eleven states fewer than 2,000 individuals were enrolled. On average, state high-risk pool membership constituted about 2 percent of the number of non-group health insurance market participants that year.6 (Table 1)
Table 1. State High-Risk Pool Enrollment as Percent of Non-Group Market Enrollment, 2011
Alabama
0.1%
Kentucky
2.8%
Oklahoma
1.6%
Alaska
2.5%
Louisiana
1%
Oregon
5%
Arkansas
2.4%
Maryland
7.6%
South Carolina
1%
California
0.2%
Minnesota
10.2%
South Dakota
1%
Colorado
3.5%
Mississippi
2.4%
Tennessee
1%
Connecticut
1%
Missouri
1.2%
Texas
2.6%
Florida
0.02%
Montana
3.5%
Utah
2.5%
Idaho
1.3%
Nebraska
2.9%
Washington
1.1%
Illinois
3.4%
New Hampshire
3.8%
West Virginia
4.4%
Indiana
3.9%
New Mexico
9.9%
Wisconsin
6.8%
Iowa
1.8%
North Carolina
2%
Wyoming
3.4%
Kansas
1%
North Dakota
2.3%
Total
2.2%
SOURCE: KFF calculations based on NASCHIP enrollment data for 2011 and U.S. Census Bureau data, 2011 Current Population Survey
The potentially medically eligible population in high-risk pool states was likely much larger. A Kaiser Family Foundation study found that 27% of adults under the age of 65 have health conditions that, prior to the ACA, would have rendered them uninsurable if they had sought coverage in the non-group market.
Although no two traditional state-high risk pools were identical, nearly all adopted certain common features that tended to limit enrollment of eligible individuals.7 These included:
Premiums above standard non-group market rates – All state high-risk pools set premiums at a multiple of standard (i.e., typical or average) rates for medically underwritten coverage in the non-group market; in most states the pool premium was capped at 150%-200% of market rates. Nineteen pools provided low-income premium subsidies that varied in comprehensiveness. The Oregon pool, for example, discounted premiums 95% for enrollees with income up to 185% of the poverty level, while the New Hampshire pool provided a 20% premium discount for enrollees with income below 200% FPL. 8 Other pools required people to pay the full premium, regardless of income.
Pre-existing condition exclusions – Nearly all state high-risk pools excluded coverage of pre-existing conditions for medically eligible enrollees, usually for 6-12 months. This made coverage less attractive for people who needed coverage specifically for their pre-existing conditions. In nine states, (CT, ID, MS, MO, MT, NC, OK, TX, and WY) the exclusion period was 12 months; in Colorado and Indiana it was 3 months. The Alabama pool, which was only open for HIPAA-eligible individuals, did not impose pre-existing condition exclusion periods.9
Lifetime and annual limits – Thirty-three pools imposed lifetime dollar limits on covered services, most ranging from $1 million to $2 million. In addition, six pools imposed annual dollar limits on all covered services while 13 others imposed annual dollar limits on specific benefits such as prescription drugs, mental health treatment, or rehabilitation.10
High deductibles – Most pools offered a choice of plan options with different deductibles; in 29 programs, the plan option with the highest enrollment had a deductible of $1,000 or higher; in ten states it was $5,000 or higher.
A small number of states capped or closed enrollment to limit program costs, though enrollment caps were not allowed for HIPAA-eligible individuals. Limiting enrollment, directly or indirectly, was a key strategy to limit the cost of high-risk pools to states. By design, all state high-risk pools experienced net losses – that is, expenses greater than premium revenue. In 2011, net losses for 35 state high-risk pools combined were over $1.2 billion, or $5,510 per enrollee, on average.11 Most states financed net losses through an assessment on private non-group health insurance premiums; however, nearly all state high-risk pool assessments were offset by tax credits so that, in effect, general state revenue funding applied. A few states used other revenue sources – tobacco taxes and hospital assessments – to fund high-risk pool losses. In addition, in 2003-2010 federal grants were available intermittently, subject to appropriations, to help fund qualified state-high risk pools that met certain criteria. For the first two fiscal years (2003-2004) $80 million per year was appropriated; $75 million in grants was next awarded in 2006, followed by $49 million in 2008, $73.5 million in 2009, and $55 million in each of 2010 and 2011. In some years, a portion of federal grant funds was reserved for states that adopted supplemental consumer benefits such as low-income premium subsidies. Federal grants comprised between 2% and 12% of program expenses in states that received them.12
Federal Pre-existing Condition Insurance Program (PCIP)
The ACA established a temporary, national high-risk pool program, implemented in 2010, to offer coverage for uninsured individuals with pre-existing conditions until 2014, when private non-group policies would be available under new market rules prohibiting insurance discrimination based on health status. The law required PCIP enrollees to pay premiums and appropriated $5 billion to fund expected net losses during the program’s duration. Twenty-seven states opted to administer PCIP for their residents; the federal government operated PCIP for 23 states and D.C.
PCIP Enrollment, Program Features, and Costs
Program features under PCIP varied from state high-risk pools in several significant respects. Under the law, PCIP premiums were set at 100% of the standard risk rate for non-group health insurance in each state, meaning rates varied by age but were otherwise equivalent to what a typical person without a pre-existing condition would pay. Low income premium subsidies were not offered. PCIP did not impose annual or lifetime dollar limits on covered benefits. Annual out-of-pocket-cost sharing was capped at the level set for tax-favored high-deductible health plans ($6,050 in 2012) and a minimum actuarial value of 65% was established for program coverage (meaning patients were expected to pay, on average, 35% of their health expenses). In 42 states, the lowest deductible option offered in 2012 was at least $1,000.13
PCIP did not impose pre-existing condition exclusions. However, to prevent “crowd out” from existing state pools and other private insurance, PCIP eligibility was limited to individuals who had been uninsured for at least 6 months immediately prior to enrolling.
PCIP was operational in all 50 states by the fall of 2010. By late 2012, just over 100,000 individuals were enrolled and program expenses had consumed nearly half of the $5 billion appropriation. For the final 12-month period for which PCIP expense data were reported, net losses for the program were over $2 billion. (Table 2)
Table 2. PCIP Enrollment and Net Expenses, 2011-2013
In 2012, average per enrollee claims costs for PCIP were $32,108, or more than 2.5 times higher than average per enrollee claims costs ($12,471) under traditional state high-risk pools, all of which continued to operate that year.14 Compared to traditional state high-risk pool enrollees, PCIP enrollees tended to have more immediate and intensive health care needs, including higher hospital admissions, likely due to the six-month prior uninsurance requirement and lack of pre-existing condition exclusions.15 By contrast, many traditional state pool enrollees were HIPAA-eligible, meaning they had to have been continuously covered and were less likely to have put off needed treatment prior to joining the pool. Pre-existing condition exclusions would have limited traditional pool coverage of initial treatment costs of (or enrollment by) other non-HIPAA eligible individuals.16
In addition, PCIP premiums were based on standard rates for underwritten non-group coverage, while under traditional state pools, premiums were usually set at 150%-200% of standard market rates. As a result, enrollees under traditional state pools paid a greater share of their claims costs compared to PCIP enrollees. This meant that the loss ratio – the ratio of claims costs to premiums – would naturally be higher in PCIP compared to the traditional state pools. In 2011, claims under traditional state high-risk pools averaged 181% of pool premiums; that year, PCIP claims averaged 417% of premiums. By late 2013, the PCIP loss ratio had reached 600%.17
In the face of growing expenses, PCIP adopted a series of changes to limit program costs. In 2012 federally-administered programs switched to a less expensive provider network and negotiated additional discounts with targeted hospitals that treated large numbers of PCIP enrollees. State-run programs were required to achieve similar cost savings or transition to federal administration; 17 state programs transitioned in mid-2013. The federal PCIP program also consolidated plan options for 2013, eliminating those offering the lowest patient cost sharing. Even with these changes, program expenses were still projected to exceed appropriated funds before the end of 2013. In March 2013, new PCIP enrollment was suspended to ensure sufficient funds to pay claims for people already enrolled.18 PCIP enrollment peaked at nearly 115,000 in March 2013, then declined below 90,000 six months later.
Discussion
Nearly four decades of experience with high-risk pools suggests they have the potential to provide health coverage to a substantial number of people with pre-existing conditions. State high-risk pools that existed prior to passage of the ACA covered over 200,000 people at their peak, and the temporary PCIP pool created as part of the ACA covered over 100,000 individuals.
These high-risk pools likely covered just a fraction of the number of people with pre-existing conditions who lacked insurance, due in part to design features that limited enrollment. State pools typically excluded coverage of services associated with pre-existing conditions for a period of time and charged premiums substantially in excess of what a typical person would pay in the non-group market. PCIP had fewer barriers to enrollment – charging standard premiums with no pre-existing condition exclusions – but it did restrict signups to people who had been uninsured for a least six months.
Even with these limitations, the government subsidies required to cover losses in these high-risk pools were substantial – over $1 billion per year in the state pools and about $2 billion in the final year of PCIP. A high-risk pool with minimal barriers to enrollment could cost substantially more.
Endnotes
S Cohen and W Yu, “The Concentration and Persistence in the Level of Health Expenditures over Time: Estimates for the US Population, 2008-2009. AHRQ Statistical Brief #354, January 2012. ↩︎
NASCHIP, Comprehensive Health Insurance for High-Risk Individuals: A State-by-State Analysis, 2009/2010. ↩︎
NASCHIP, Comprehensive Health Insurance for High-Risk Individuals: A State-by-State Analysis, 2011/2012. ↩︎
Annual maximums applied under state high-risk pools included: AL: $10,000 for pharmacy benefit; AR: $4,000 for mental health/substance abuse benefit; CA: $75,000 for all benefits; CO: $3,000 for DME benefit; ID: $2,000 for rehab benefit, $5,000 for hospice benefit; $10,000 for DME benefit; IN: $50,000 for mental health/substance abuse, Plan 3 only; KS: $100,000 for all benefits; LA: $125,000 for all benefits; MS: $100,000 for pharmacy benefit; MT: $5,000 applies to DME, $4,000 applies to rehab benefit; NH: $10,000 applies to pharmacy, $5,000 applies to DME, $3,000 applies to mental health/substance abuse, various day limits apply to skilled nursing, rehab, home health; NC: $100,000 applies to injectable drugs; various day limits apply to skilled nursing, rehab; ND: $6,000 applies to DME benefit; OK: $4,000 applies to mental health and chemical dependency combined; SD: $2,000 applies to substance abuse, $900 applies to mental health treatments for non-biologically based conditions, $8,000 applies to DME benefit; TN: $200,000 for all benefits plus $100,000 for organ transplant; TX: $2,000 applies to rehab, $5,000 applies to home health, $10,000 applies to hospice, various day limits apply to skilled nursing care and mental health care; UT: $300,000 for all benefits; WV: $200,000 for all benefits. Source: NASCHIP, Comprehensive Health Insurance for High-Risk Individuals: A State-by-State Analysis, 2009/2010. ↩︎
To compute net losses for a given state, follow links to NASCHIP charts for Total Revenue by Pool, 2011 and Total Expenses by Pool, 2011; subtract the premium revenue for a state pool (first column in the Total Revenue by Pool, 2011 chart) from the total expenses for a state pool (last column in the Total Expenses by Pool, 2011 chart.) ↩︎
NASCHIP, Comprehensive Health Insurance for High-Risk Individuals: A State-by-State Analysis, 2011/2012. ↩︎
For example, in Colorado, enrollees in the state PCIP experienced 562 hospital admissions per 1,000 and used 5,174 inpatient days per 1,000, while enrollees in Colorado’s traditional high-risk pool experienced 137 hospital admissions per 1,000 and used 735 inpatient days per 1,000. See PCIP Annual Report, 2012. ↩︎
PCIP Annual Report, 2013. The report notes that various cost containment measures had been adopted prior to enrollment suspension, including switching to a more competitively priced provider networks, negotiating special discounts with hospitals treating a disproportionate share of PCIP enrollees, and requiring use of cost effective preferred pharmacies for specialty drugs. See also PCIP Data Report, March 2013, available at https://www.cms.gov/CCIIO/Resources/Forms-Reports-and-Other-Resources/Downloads/pcip-expenditures-3-31-2013.pdf↩︎
As Republicans in Washington pursue efforts to repeal and replace the Affordable Care Act, what do enrollees in ACA marketplaces and state Medicaid expansions who voted for President Trump want in a health care plan? The Kaiser Family Foundation asked some of them in six focus groups convened in December in Michigan, Ohio, and Pennsylvania — three with Trump voters enrolled in the ACA marketplaces and three with Trump voters in Medicaid.
Focus group participants shared both positive experiences and concerns about their coverage through the ACA. They discussed a range of issues including access to care, high deductibles, surprise medical bills and the cost of prescription medications. Trump voters on Medicaid were particularly satisfied with their coverage. Some of what participants said mirrored broader public sentiments about the U.S. healthcare system overall.
Focus group participants also said they knew few details about what might come next. Concerned about losing coverage, they wanted repeal and replacement of the ACA to happen at the same time. Several key themes emerged about what they wanted in an ACA replacement plan: more affordable coverage with both lower premiums and deductibles, access to a broad range of doctors and hospitals, greater transparency about what their plan covers and what services would cost, continued coverage of pre-existing conditions and elimination of the individual mandate. They expressed skepticism that high deductible plans with savings accounts would be affordable options for them.
Read the focus group report and watch the companion video. Also available is a recent op-ed in The New York Times authored by KFF President and CEO Drew Altman, based on his observations of the focus groups.
President Donald Trump and Republicans in Congress are moving to follow through on their campaign promise to repeal and replace the Affordable Care Act (ACA). To gain a better understanding of the personal experiences of Trump voters with health coverage provided through the ACA and the changes they hope to see in the health system moving forward, the Kaiser Family Foundation (KFF) held focus groups in December 2016 with Trump voters in cities in three battleground states (Michigan, Ohio, and Pennsylvania), who had coverage through the Marketplaces or through the Medicaid expansion. These Trump voters with personal experience with the ACA are not likely to be representative of people who gained coverage through the ACA generally, nor are they representative of all Trump voters. Following are key themes from the groups:
Perspectives of Trump Voters with Marketplace Coverage
Although some participants reported positive experiences with Marketplace coverage and found it affordable, many were overwhelmed by unaffordable, out-of-pocket costs associated with high deductibles. Participants were also frustrated by surprise medical bills and the high cost of prescription medications.
Improving the affordability of coverage (in terms of premiums and especially out-of-pocket costs) was Marketplace participants’ top priority for an ACA replacement plan. They also wanted access to a broader range of doctors and hospitals, simplification of health plan choices, greater transparency on coverage and costs, elimination of the individual mandate, continuation of ACA coverage of pre-existing conditions, and the ability to tailor coverage to fit their needs (even if sicker people would pay more for coverage).
Participants almost universally rejected the idea of low-premium, high-deductible plans coupled with Health Savings Accounts (HSAs), which are expected to be a key element of Republican replacement plans. They feared that the deductibles would be unaffordable, causing people to avoid seeking needed care, and felt that they would not be able to build up enough savings even with an HSA to cover the out-of-pocket costs associated with a high deductible plan.
Perspectives of Trump Voters Who Gained Coverage under ACA Medicaid Expansion
Medicaid participants faced more serious health issues and greater financial challenges than those in the Marketplace groups. Many suffered from health conditions that impacted their ability to function, and they were grateful for Medicaid coverage that provided them affordable access to needed care and medications.
Although most Medicaid participants did not associate their coverage with the ACA, they were happy with their coverage and were distressed about what would happen to them if their coverage were repealed.
While participants feared losing their coverage, they had mixed views of more minor changes such as charging small premiums to Medicaid enrollees or incentives for healthy behavior. However, given their tenuous financial situations, they were not supportive of lock-out periods for failure to pay the premiums on time.
Throughout the 2016 election season, Donald Trump campaigned heavily on a pledge to repeal and replace the Affordable Care Act (ACA), a program that he called a “complete and total disaster.” Now that he has taken office, President Trump and Republicans in Congress are moving to follow through on their pledge. Yet what remains unclear is the extent to which the various repeal and replacement proposals that are currently under discussion are in line with what the ordinary citizens who voted for Trump actually want.
In order to gain a better understanding of the personal experiences of Trump voters with health coverage provided through the ACA and the changes they would like to see in the health system moving forward, the Kaiser Family Foundation (KFF) held focus groups with individuals who voted for Trump in cities in three battleground states: Grand Rapids, Michigan; Columbus, Ohio; and Harrisburg, Pennsylvania. From December 12-20, 2016, KFF held two focus group sessions in each location, one with individuals who gained health coverage through the ACA Marketplaces and one with individuals who gained coverage through their state’s expansion of Medicaid to 138% of the Federal Poverty Level (FPL). Questions asked during each session focused on participants’ likes and dislikes about their current coverage, attitudes towards individual elements of the ACA, ideas for changes they would like to see in the health system moving forward, and reactions to various Republican ACA replacement proposals that are currently under discussion.
This report highlights and summarizes the range of perspectives expressed at the focus group sessions. We present findings from the Marketplace groups first, followed by those from the Medicaid groups.
Methods
The findings presented in this brief are based on six focus group discussions with Trump voters who were enrolled in coverage through the ACA conducted by the Kaiser Family Foundation and Belden Russonello Strategists in three cities from December 12-20, 2016 (the groups also included four individuals who were uninsured, but in the income range for subsidies in the Marketplace). Sites included Grand Rapids, Michigan; Columbus, Ohio; and Harrisburg, Pennsylvania. Two focus groups were held in each site, one with individuals who voted for Donald Trump in the Presidential election and who were enrolled in Medicaid (income below 138% FPL) and the other with individuals who voted for Trump who were enrolled in Marketplace coverage or uninsured (income 138% – 300% FPL). Annual income at 138% FPL was equal to $16,242 for an individual and $27,724 for a family of three in 2016. Annual income at 300% FPL was equal to $35,310 for an individual and $60,270 for a family of three in 2016.
Each focus group consisted of 7-9 participants, with a total of 48 participants including 23 covered by Medicaid, 21 covered through the Marketplace, and 4 who were uninsured. Participants were selected to provide a mix of demographic characteristics, including age, family status, and work status (Appendix A). Of the 48 participants, 31 were working full or part-time; all were high school graduates and 12 had college degrees. Among those with Marketplace coverage, all were receiving some level of subsidy and there was wide variation in the premiums they paid, ranging from $22 per month to $637 per month. On average, participants were receiving $450 per month in the premium tax credits to lower the cost of their coverage. Among Medicaid participants, 60% were uninsured prior to enrolling in Medicaid, for time periods ranging from a few months to 15 years.
Listening to Trump Voters with Marketplace Coverage
Marketplace participants faced some financial and health-related stress
Many Marketplace participants described finances as a source of stress in their lives. Three-quarters of participants were working full- or part-time, while about a quarter had retired or were caring for their children full-time. They described enjoying their jobs, but many felt they weren’t earning enough to be comfortable financially. Although some felt they were doing fairly well financially, most described themselves as just getting by.
Financial stress is always on the top of the list. Trying to get everything paid on time is very important to me and it can be stressful at times.
Participant, Harrisburg Marketplace
I do carpentry and construction. I remodel homes and business is booming. I don’t have any problem getting jobs.
Scott, Grand Rapids Marketplace
By and large, the Marketplace participants were healthy, mostly needing only annual check-ups; however, some were dealing with more serious illnesses. Less than a third of participants reported having an ongoing medical condition. Of those, most said they had high cholesterol or blood pressure or anxiety/depression that they were managing with medications. A few, however, had more serious conditions, including diabetes, cancer, and heart disease that required more intensive treatment. For those who were sicker, the out-of-pocket costs associated with needed care contributed to their financial stress.
I feel very blessed. I have no debt. My house is paid for. My credit cards get paid every month. I’m pretty healthy for an old fart. I’m feeling pretty blessed.
Margaret, Harrisburg Marketplace
The past two years have been difficult. I’ve had thyroid cancer for which I’ve had two surgeries. I’ve also been diagnosed with a tremor disorder, which is worsening and it affects my voice.
Shari, Harrisburg Marketplace
As far as our life, we were struck with a catastrophic illness with my son this year, so we are dealing with that and healthcare with him. That is our life.
Julia, Grand Rapids Marketplace
For some, Marketplace coverage was working well
Participants value health insurance, saying that it gives them peace of mind and protects them against financial disaster should they get sick. Many reported feeling vulnerable during periods without insurance when they were unable to get needed care. They view insurance as necessary to be able to afford treatment for chronic conditions, especially needed medications. Most also spoke of the financial security that insurance provides, knowing that it will cover expensive medical costs if they were to have an accident or face a major illness.
I would say [insurance is] very important because it gives you peace of mind knowing if any issues come up in your health that you’re not going to get broadsided with a huge bill or debt.
David, Grand Rapids Marketplace
Insurance for me just gives me peace of mind because I’m not worried about a $2,000 bill or a $200 bill. I’d be more worried about if I have to have heart surgery or cancer, something that’s a half a million dollars. Otherwise, I’m not too worried about it, but it gives me the peace of mind if any of that happened within our family then, okay. I’m covered.
Scott, Grand Rapids Marketplace
Some participants recounted positive experiences with Marketplace coverage, noting that their plans were affordable and even improving in cost over time. Perhaps not surprisingly, participants receiving the largest subsidies were the most likely to feel their coverage was working for them. They expressed concern about rising premiums in general, but they were insulated from those costs by premium subsidies which kept their costs affordable.
Last year’s insurance was not expensive out-of-pocket every month. It was like $76 after our tax credit, but it had a $13,600 deductible. When I signed up a week ago, or a couple weeks ago, we got a bigger credit and the plans were better.
Randy, Columbus Marketplace
I think in all honesty it’s working well. I mean, we’re very fortunate too that we don’t use the doctor very often…[My coverage] is, I can’t believe I’m going to say this, more affordable this year than it was last year.
Amy, Harrisburg Marketplace
The plan I have right now is very affordable…I get good discounts on my prescriptions. My wife and I do take some prescriptions…I have $20 copayments on doctor’s visits and things like that.
David, Grand Rapids Marketplace
But for many, Marketplace coverage has not lived up to expectations
Three years into the implementation of the Marketplaces, participants still seemed overwhelmed by their plan choices and confused about key aspects of their plans. They described having too many plan choices and not enough information to choose a plan that meets their needs. While some were savvy health care consumers, others seemed baffled by the complexity of their plans, unsure of the difference between a deductible and out-of-pocket maximum and unable to evaluate what their total costs will be if they need to go to the doctor or have a procedure done.
I do think that there needs to be some things tweaked. To go in there and go through this Marketplace, there’s a zillion choices…It’s almost like I’m supposed to be the expert, and I’m basically picking…just closing my eyes and picking a policy.
Beth, Grand Rapids Marketplace
Participants were particularly frustrated by unaffordable out-of-pocket costs associated with high deductibles. Every Marketplace participant reported having a plan with a deductible, even if they weren’t quite sure of the amount. Some participants could afford to choose plans with lower deductibles, but most felt their only choices were plans with higher deductibles because they could not afford the higher premiums. They worried about the out-of-pocket costs they would face when they sought care. Many said they could not get some of the care they needed because they could not afford it and others described feeling as if they were uninsured except for a catastrophic event.
I have to go based on what I can afford, which is awful. It’s an extremely high deductible…I can’t even tell you what it is because I purposely do not go to the doctor because I can’t afford it. I have insurance and I don’t use it.
Deborah, Columbus Marketplace
My daughter had a sprained MCL, so there’s all those payments for physical therapy that are going toward that deductible…Anything that happens to them [my children], it comes straight out of your pocket, so you have to…anticipate that if they get sick that you’re going to pay $80 for eardrops.
Cara, Columbus Marketplace
The high cost of prescription medications was a common complaint and many Marketplace participants did not believe their plan protected them from these costs. Several Marketplace participants were particularly burdened by high costs for needed medications, either because their plan did not cover the drugs they needed or because the costs were subject to the deductible. Parents of children with allergies were especially outraged at the high cost of the EpiPen. They blamed the pharmaceutical companies for the high prices, but wanted their health plans to shield them from the costs. Some recounted having to make difficult trade-offs each month between getting needed medications and paying rent or buying food. Others went to extraordinary lengths to access cheaper drugs, in one case traveling to Europe to purchase diabetes drugs at substantially lower costs.
You have to choose, do I pay my mortgage or do I pay the $800 medical bill that just came in the mail or do I pay for my medications that can be life sustaining or do I eat this week?
Shari, Harrisburg Marketplace
It’s frustrating because literally like for me to order insulin in the United States it’s a little box of five vials and that’s…it costs $953 for one box…So I can go to Poland and I can buy the exact same manufacturer. It’s Novalog, exact same box, everything. A cash price in Poland is 200 zloty’s, which is about $43. That’s their cash price…I save $8,000 a year by flying to Europe.
Donald, Harrisburg Marketplace
Participants also expressed frustration at receiving surprise medical bills for services they thought were covered. Overwhelmed by complex health plans that many did not understand, they were especially angry at receiving unexpected bills when they sought care, bills that they often struggled to pay. Whether because the costs were subject to their plan’s deductible or because a particular service or provider was not covered by the plan, participants described feeling vulnerable to unexpected and unaffordable health costs. For many, this uncertainty led them to avoid seeking care.
I think my biggest concern is that when I go to the doctor…I just go. Then I open up the mail, and I go, “Okay.” Could the bill be $20 or could it be $3,200? You don’t know.
Beth, Grand Rapids Marketplace
And then you’re done with treatment and then you get bills because insurance didn’t cover this. Tell me this in advance. Let me know this. It doesn’t make any sense to me.
Eric, Harrisburg Marketplace
Part of it for me is not knowing what I can and cannot do. So like I probably should have had physical therapy a long time ago but I held it off forever because I’m like, I don’t know what’s going to be covered, what I’m going to have to pay for, who I can go see.
Amy, Harrisburg Marketplace
Many were anxious about what repeal of the aca would mean for them, but they trusted President Trump to make things better
When asked about repealing the ACA, focus group participants said they wanted better coverage that is more affordable. Most participants were not following the debate over repealing the ACA very closely. Health care was not a major factor in their vote for President, but they believed President Trump understood their needs and would craft a plan that would work better for them. They commented that Trump had said little about the specifics of what would be included in any replacement plan, but what they heard from him was that he was going to make the coverage more affordable and that resonated with them.
I can’t really think of what he said that he’s going to replace it with. I don’t really know what’s coming. I would think if it’s something affordable it could be better.
Eric, Harrisburg Marketplace
My impression was that he was saying he was going to basically do an overhaul. He wanted to totally look at the system again and revamp it, and make changes, and make it better in some way. That’s the message that I heard.
Suzanne, Columbus Marketplace
>Concerned about losing their coverage, participants wanted repeal and replacement of the ACA to happen at the same time. Many worried about the implications of repealing the law without simultaneously replacing it. While some believed they would be able to purchase coverage similar to what they had prior to the ACA, others felt the market had changed so fundamentally that it would be hard to go back to that earlier time and that any plans would be unaffordable to them without subsidies. They worried that repealing the law without simultaneously replacing it would lead to market upheaval, creating chaos and the possibility they would lose their coverage. In contrast, some were confident that their coverage would continue while a replacement plan is crafted.
Would I get insurance somewhere else? Probably not…Right now, I’m going to a physical therapist for my wrist, and I don’t know how much that would cost out of pocket. As of right now, I think I would try to get a plan and money would just be really tight. I’d have to deal with it.
Participant, Columbus Marketplace
I think it would be chaotic. Because what are we going to do? If we’re not employed, we’ve got to go and buy it privately and a lot of us can’t afford it.
Participant, Harrisburg Marketplace
>
Nothing gets repealed overnight. So insurance companies would have plenty of time to prep for this. They would see it coming down the road. It’s not as if we wake up tomorrow, oh my God. Health insurance is gone…I don’t think it would be chaos. I think there would be preparation. I think the insurance companies would be ready for it.
Jason, Harrisburg Marketplace
What they want in a replacement plan
When asked what they would want in an ACA replacement plan, participants’ top priority was coverage that was more affordable—affordable premiums, but most importantly, affordable out-of-pocket costs. Participants who were struggling financially or just getting by wanted more help affording their coverage. Many did not view the current premium subsidies as sufficient because they still faced large out-of-pocket costs. While they were willing to pay copayments when they access care, they were united in their opposition to deductibles, which they felt put them at financial risk. They simply wanted to be able to take their children to the doctor when they were sick or go to the doctor themselves without having to worry about how much it would cost.
Every person should have access to insurance at a reasonable price. Our out-of-pocket and deductible costs shouldn’t bankrupt us, and preventive care and tests should be low cost.
Suzanne, Columbus Marketplace
Make it affordable, so I can bring my kids to the doctor when they need to go and not have to worry about all these expensive costs that are going to eat my paycheck up at the end of the week.
Jennifer, Grand Rapids Marketplace
They also wanted more help for people like them. Some participants felt left behind by the current system, especially those battling chronic or acute medical conditions. Burdened by their health care costs and feeling stretched financially, they did not view their subsidies as providing enough help. They were also aware of people with lower incomes getting coverage through Medicaid, which they viewed as a better deal, and resented not qualifying for more assistance themselves. At the same time, they felt this expanded Medicaid coverage was important and should be retained.
So that you can qualify for help when you’re a quote unquote middle class person. I mean, somebody that’s making $42,000 a year doesn’t make a lot of money. And if they have mouths to feed, that’s not a lot of money.
Margaret, Harrisburg Marketplace
It’s very frustrating and very angering when you do not qualify for Medicaid or any kind of further assistance program through the state or even local governments because you are in an income guideline [that is too high].
Shari, Harrisburg Marketplace
I think it [expanded Medicaid] is great because if you have somebody who is not on the bottom of the pay scale, but just a little bit higher, they’re still struggling to make ends meet. Why not help them out, so they can better their lives in a way and afford a better car, so they can drive to work, so they don’t miss so many days, so they can work more? I’m not opposed to that cycle.
Jennifer, Grand Rapids Marketplace
Access to doctors and hospitals was another priority for participants. In a replacement plan, participants wanted broader provider networks that would give them more options when choosing doctors and allow them to keep their same providers when they change insurance plans.
I would like to see the insurance plans allow more variety in who they can go and see, not just one doctor or two.
Participant, Columbus Marketplace
Every doctor should be in the plan. They don’t have you doctor shop. “Well, I don’t take this. I don’t take that. You’ve got to go to another whole office that takes that insurance.” Why can’t I just go to the doctor I’ve always been going to?
Jennifer, Grand Rapids Marketplace
Participants wanted simplification of health plan choices and greater transparency from the insurance companies. They complained that they lacked information needed to make an informed choice among available plans. Some wanted to see fewer choices with clear and simple explanations of the differences among the plans. In addition, they wanted clearer information on what the plan covered and what it did not as well as the costs of treatments and procedures, so they wouldn’t be hit with surprise medical bills when they access care. One participant described successfully shopping for a lower cost MRI; however, another participant said he could not get information on the costs of a procedure he needed that would be subject to his deductible.
I would think that just maybe lessen the choices, and so if you pay $200 a month this is what you’re going to get for coverage. If you pay $300 a month, this is what you’re going to get. If you pay $500 a month, this is what you’re going to get.
David, Grand Rapids Marketplace
It’s just not very cut and dry as to what you’re paying for. So with healthcare I would like to know what it is that’s covered and no surprises. Kind of like you go to a restaurant and there’s a menu. You know what you’re paying for, you know what you’re getting. Like everything should just be very clear cut.
Eric, Harrisburg Marketplace
Participants wanted to keep some provisions of the ACA, particularly the requirement to cover everyone regardless of health status. Most participants supported prohibiting insurers from denying people coverage based on their health status, especially those who themselves suffered from a medical condition or were at risk of developing one. However, a few expressed concern at the impact on premiums and other costs of this requirement.
I think it’s good that they can’t bar you for a pre-existing condition because I have a family history of cancer and diabetes. What if that’s going to happen to me?
Suzanne, Columbus Marketplace
I’m not sure because now you are forcing insurance companies to insure everybody…Especially if you’re going to have something that’s run by the government, I’ve got to share in everybody else’s cost. I may not have the condition, but other people do, and I’m still paying for it.
Scott, Grand Rapids Marketplace
I have a little different outlook now than I used to because of my son. He’s got a condition that’s going to last him all of his life now, so I want him to be able to get insurance when he becomes a working adult. I think that’s important.
Julia, Grand Rapids Marketplace
Universally, participants opposed the requirement to have health insurance or pay a fine, calling it “un-American”, even those who were otherwise happy with their coverage. While many understood the mandate was intended to encourage young and healthy people to sign up for coverage as a way to spread the cost of covering those who are sick across a broader population, they did not like being forced to purchase insurance. These Trump voters argued that policymakers needed to come up with a way to encourage broader participation that didn’t involve a mandate and fine.
I just don’t think you should be fined for not having insurance.
Ray, Columbus Marketplace
We live in America. For them to come in and say, “You’re going to have your insurance, and if you don’t like it, we’re going to fine you.” I was like, “That ain’t right.” If you don’t want to have something, you shouldn’t have to have it.
David, Grand Rapids Marketplace
As a way to lower costs, a number of participants wanted to be able to tailor coverage to fit their needs, even if it meant that people who are sicker would have to pay more for more comprehensive coverage. Further rejecting the concept of risk sharing, some talked about returning to pre-ACA policies that offered limited coverage, but were much cheaper. Especially in the face of rising premiums, several resented having to pay for coverage they don’t use. Some went so far as to describe the idea of people buying insurance that they don’t end up using as a tax on the healthy. These participants didn’t view health insurance in the same way that they view other types of insurance, like car insurance. They only wanted to pay for access to the services they expected to use during the year. While this view was not universal among the focus group participants, it was prevalent.
I think you pay a lot more than you ever receive. It would be great if you don’t use it, then you get some back. For being healthier, you get a bonus.
Julia, Grand Rapids Marketplace
Let’s say some young healthy person gets in and they never use their health insurance and they have to pay the premium every month. And it helps the cost, maybe in an ideal world, be lower for everybody. But then, it is really just a tax on the healthy people, and that doesn’t sit well with me.
Amy, Harrisburg Marketplace
I don’t like to think about what would happen if I do get hurt or something, but I’m not going to pay for the premiums if I’m not going to get sick.
Ben, Grand Rapids Marketplace
While generally advocating a more limited role for government in health care, participants wanted to see increased government regulation of the pharmaceutical and insurance industries. There was general anger directed at pharmaceutical companies, and to a lesser degree, insurance companies, over perceived price gouging. Many wanted the federal government to crack down on these companies to reign in rising health care costs.
I really think that the pharmaceutical companies and the insurance companies should be regulated more…That’s the number one thing that the government should be regulating is the price of drugs.
Eric, Harrisburg Marketplace
Views of Republican Proposals
Participants rejected the idea of high deductible plans, even when coupled with premium tax credits to cover the premium and Health Savings Accounts (HSAs) to save for out-of-pocket costs. When asked to react to aspects of several elements of Republican ACA replacement proposals that would provide consumers with access to high deductible plans coupled with HSAs, participants were highly concerned that the deductibles would be unaffordable and cause people to avoid seeking needed care, ultimately resulting in poorer health outcomes nationally. They did not consider a high deductible plan to be “real insurance”.
I don’t want that because I have health bills. I’m supposed to go to the doctor four or five times a year so…instead of getting a free catastrophic plan I would rather pay $150 a month and know that my insulin’s covered and know that my endocrinology visits are covered and stuff like that. So I would not be for just a catastrophic plan that’s free.
Donald, Harrisburg Marketplace
It would discourage our healthy nation. People would be resistant to go to the doctor, resistant to get the care they needed because it’s not covering anything and we would just be an unhealthier nation because of that.
Eric, Harrisburg Marketplace
I would rather pay a premium and have it actually be insurance in case something happens.
Amy, Harrisburg Marketplace
I just wouldn’t want that $7,000 deductible. I like having a $500 deductible.
Ray, Columbus Marketplace
While there was general support for the concept of an HSA, many did not understand what they were and said they did not have the savings, or would not be able to save enough during the year, to cover the out-of-pocket costs associated with a plan with a high deductible. Participants saw HSAs as a way to provide consumers with additional options for paying for care not covered by their health plans, not as the solution to high out-of-pocket costs. Participants who had experience with HSAs liked them; however, they had not used them to cover large deductibles and, in one case, a previous employer contributed to the account. These moderate income individuals and families did not have a lot of savings, if any, and worried over how they would save such a large amount of money each year. One participant said he could do it if he didn’t eat for a year. But, even those who were managing to save money during the year noted that they wouldn’t like having to use that money for health care.
So if you had something big that had to be taken care of to pay that out-of-pocket expense of $7,000, that’s a lot of money for most families. They can’t afford paying that deductible until their insurance kicks in. Yeah, it’s just not realistic.
Margaret, Harrisburg Marketplace
I have money saved, but I have two kids to put through college. I don’t plan on using that [money] for my everyday life expenses. If I want to buy another house, if I lose my job or something, but for just healthcare, I don’t intend on using that money for that.
Beth, Grand Rapids Marketplace
Participants also rejected the concept of basing tax credits solely on age regardless of income. When presented with a provision included in a number of Republican proposals that would provide tax credits based only on age, participants struggled to understand the implications of this approach—would it lead to higher costs for younger or older people? They noted that younger and older individuals could face the same financial constraints and that it would be unfair to ask anyone in either group to pay more than they could afford. Income-based subsidies seemed fairer to them. They did, however, want to see people rewarded with lower premiums for engaging in wellness activities, including getting check-ups, maintaining a healthy weight, and not smoking.
I just think if you’re poor, you shouldn’t get stuck paying for something you can’t afford. If it’s by income, you’ll get the subsidy, and you’ll get some help.
Participant, Columbus Marketplace
Have the insured be accountable for some things. Don’t smoke, exercise, get your annual physical, get your bloodwork done. Have some skin in the game if you will.
Beth, Grand Rapids Marketplace
Frustrated by the complexity and uncertainty of the current system as well as proposals to replace it, several participants advocated for a single-payer system modeled on the Canadian health care system. Expressing their belief that health care should be a right for all Americans, some participants argued that creating a single-payer system would be the most effective approach to addressing the health care access and affordability challenges that many Americans currently face.
I’m far from a socialist, but I think the only answer is a single-payer thing in this particular instance. People need to go to the doctor when they need to go to the doctor, and they don’t need to worry so much about it that they get sicker.
Randy, Columbus Marketplace
I want what Obama actually promised when he first got elected. I actually was a proponent of socialized medicine. Canada has it. Europe has it…I don’t think anybody in America should have to choose between eating, paying their mortgage, and getting healthcare. So I think it should be a right for every American citizen.
Eric, Harrisburg Marketplace
Listening to Trump Voters with Medicaid Coverage
Medicaid participants faced many financial and health challenges
Participants were struggling financially, juggling which bills to pay each month. While over half of Medicaid participants were working, they were working part-time and mostly in lower wage jobs. Some were unable to work because of health issues or because they were caring for their children or elderly parents. Most participants had income less than $20,000. Most said they had some or a lot of debt and described their financial situation as poor or just getting by. They struggled to pay their monthly bills, often having to weigh which bills to pay each month.
Do I pay the electric bill this month? Or is the gas bill more important? You’ve just got to figure out which one you can put off until they want to shut you off.
Melisa, Columbus Medicaid
Bills, bills, bills. Everything is…it used to go up a little and now stuff is going up a lot. Income is steady or going down. That’s been pretty stressful these last few years.
Rich, Harrisburg Medicaid
Many Medicaid participants were facing more serious health issues. Adding to the financial stresses in their lives, many participants were battling serious chronic and acute health issues requiring medication and ongoing doctors’ visits to manage. Common conditions included anxiety/depression; high cholesterol and blood pressure; and diabetes. However, several participants were battling much more serious conditions themselves or had children or spouses with more serious health conditions, such as cancer, rheumatoid arthritis, PTSD, and autism. In some cases, these conditions prevented participants from working at all or from working full-time. Many described needing ongoing medications to enable them to function.
My two children have a lot of health issues, and I have a lot of health issues stemming from my last pregnancy. So that’s always hard.
Elaine, Columbus Medicaid
I’ve got a tumor on my shoulder, so a lot of question marks as far as that is concerned; definitely a big deal for me.
J.T., Harrisburg Medicaid
Those with Medicaid were highly satisfied with their coverage
Medicaid coverage was essential to focus group participants’ health, financial stability, and success in other aspects of life. Their coverage enabled them to get the care they needed to manage chronic and other conditions and function in day-to-day life. For some participants, having Medicaid coverage enabled them to work or care for family members and, in one case, to start a business.
I was hurt at a job, and for the last five years I’ve been doing the battle. I had no insurance and couldn’t work…Without Obamacare coming through, and opening up the Medicaid rolls… I’ve had four surgeries in two years, and I’m getting back on my feet… So this insurance that they came up with we need it.
Dawn, Grand Rapids Medicaid
The pain that I was in I could barely function. At least I can function day-to-day…Yes, I’m thankful because it did affect a lot of my life. Without it I probably wouldn’t be able to sit here.
Dawn, Columbus Medicaid
My husband has recently started his own business doing appliance repair, and so during this transition of trying to establish that, having the coverage has helped us in our position to be able to do that.
Angela, Columbus Medicaid
Participants described their Medicaid coverage as affordable, providing them access to the care they need. They appreciated that they did not face deductibles or large out-of-pocket costs with Medicaid. Compared to when they had private insurance or were uninsured, several participants said they no longer put off care because they can’t afford it. Participants also described having access to trusted providers and coverage of treatment for chronic conditions.
When I worked and I had insurance coverage through my employer, the dental, I still had a deductible. I still had coinsurances. Because of the amount of issues that I have it was costly, so I would put it off because I didn’t have the money, even with insurance coverage. Now I go get it done because I don’t have to pay that with Medicaid. It’s covered.
Tawnya, Harrisburg Medicaid
I’m insured for the first time in probably 15 years through Medicaid… It’s nice you can have a provider, and you have a connection, and you can go in and get some fairly decent healthcare.
Susan, Grand Rapids Medicaid
Participants especially valued the access Medicaid provided to needed medications. Several participants had serious health conditions that could only be managed by expensive medications. Others needed less expensive drugs to treat anxiety or depression. In both cases, participants were grateful that they could access those medications with little to no cost sharing.
I’m going to need different steroid shots. Different visits to see the doctor and chiropractors and physical therapy, a lot of drugs that will help me to reduce my chronic pain on a daily basis… I can afford it now.
Iesha, Harrisburg Medicaid
I know I wouldn’t be able to afford my prescriptions [without Medicaid]. All the medicines that they have me on, the insulin and stuff, I would not be able to afford it.
Melisa, Columbus Medicaid
Medicaid participants worried about losing their coverage if the ACA were repealed
Many Medicaid participants did not associate their coverage with the ACA or realize their coverage might change if the ACA were repealed. Although almost all of the participants in the Medicaid focus groups became newly eligible for Medicaid coverage in 2014 due to their state’s expansion of the program under the ACA, most Medicaid participants did not realize that their coverage was related to the ACA. When asked about whether Obamacare has improved their own family’s coverage, many participants described their or their extended family members’ experiences with Marketplace coverage rather than the impact of expanded Medicaid eligibility on their immediate family’s situation. Similarly, many of the ideas that Medicaid participants offered initially about repeal and replace, as well as their understandings of Trump’s plans for replacing the ACA, focused on the private market rather than Medicaid.
I don’t know a whole lot about [the ACA]. I just know you have to be insured now. I couldn’t afford it. If I didn’t qualify for Medicaid, I’m not sure what I would do because then you have to pay a penalty if you don’t have it.
Sean, Columbus Medicaid
I just thought it was because I had a child that I was able to [qualify for Medicaid]. Because my son was on it before I was. Then come 2014, that’s when I signed up for it.
Sarah, Columbus Medicaid
Medicaid participants were happy with their coverage and wanted to keep it; they expressed concern when probed to think about what would happen if their Medicaid coverage were repealed. Medicaid participants who did realize that they gained coverage as a result of the ACA worried that the repeal and replace of the ACA would leave them without coverage. After learning about the link between their coverage and the ACA, those who did not initially understand the connection also voiced distress about the implications of repeal. Participants with Medicaid said not having coverage would affect their health and their ability to work, and many of those suffering from serious medical conditions said they weren’t sure how they would get needed care because they knew they couldn’t afford the costs of private insurance.
He said 100 times “Repeal and replace Obamacare,” but the repeal part did worry me. Only in that the reason that I have healthcare is because of something that was in Obamacare.
Kyle, Harrisburg Medicaid
Someone in my position, with the health issues I have, if I couldn’t go to the doctor, I wouldn’t be able to get around or do anything.
Melisa, Columbus Medicaid
Just considering my circumstances right now. I cannot imagine all the doctor bills in the last couple months, the meds, and testing I have to do, not having coverage. I have no idea how I would have pulled that off, or where I would have gone to get help.
J.T., Harrisburg Medicaid
Having healthcare through Medicaid has been a huge blessing for me and my family. We would not be able to afford insurance based on his income alone and in turn I would have to give up being a stay at home mom. I am committed to being a stay at home mom and nurturing and teaching my son to become a valuable member of society. Whereas Medicaid has allowed us to become small business owners (with the plan to employ others from the community when we reach that point) and for me to stay home with my son. Without Medicaid that would not be possible and we would be even more stretched to make ends meet.
Angela, Columbus Medicaid
Views of Republican Proposals
When asked to respond to Republican proposals that might alter their coverage, participants implored policymakers to listen to the experiences and needs of ordinary citizens, like themselves, who stand to be most directly impacted by changes to the ACA. Participants felt that after living under the ACA for multiple years and experiencing what for them was primarily the benefit of expanded coverage through Medicaid, they had recommendations to share that could be valuable to policymakers in the process of designing an ACA replacement proposal. From their perspective, policymakers are frequently out of touch with the lives of those whom their decisions affect. Although health care was not a major factor in their votes for President, they hoped that President Trump and Republicans in Congress would be attuned to their needs, particularly their need for broad coverage with no or very low out-of-pocket costs, as they make changes to the health care system.
We have to be confident that the room of people, whether it’s 9 people, 40 people, or 12 people, sitting around hashing out the tweaks that they’re going to do, that they all have the right input to make it work with the negatives and positives that we’ve already experienced for two years.
Rich, Harrisburg Medicaid
They’re so far out of touch with us and our day to day; they don’t know how we struggle…They’re too removed to actually see how it impacts.
J.T., Harrisburg Medicaid
Participants had mixed reactions to the idea of states charging Medicaid enrollees a premium of 2% of income up to $25, a policy that is already in place under waiver authority in some states. When asked whether they would be able to afford to pay 2% of their income toward a premium for Medicaid coverage, reactions were mixed. Some Medicaid participants felt that amount would be affordable and they would be willing to pay it, while others expressed cautious support under the condition that the premiums would go toward improved benefits and continued expansion of the Medicaid program. Echoing the concerns they voiced about struggles they often face paying monthly bills, others were not sure they would be able to afford it.
I would think it’s the best $25 I spent that month. I would not quibble at that.
Rich, Harrisburg Medicaid
Where does the money go? It sounds expensive. If you’re paying money, I guess you just want to know where it’s going.
Jordan, Columbus Medicaid
Is that helping the state out? Are they going to be able to continue expanding the program because some people are paying in a small amount? In which case I think that would be an excellent way to do it, and that’s a very reasonable expense per family. And if it helps continue the program, then all the more. If it ends up back at the insurance companies and the state is in the same spot of not having enough money or not being able to do it, then I would rather not pay anything.
Angela, Columbus Medicaid
Participants were not supportive of the idea of lock-out periods for failure to pay Medicaid premiums on time. After they were asked to react to the concept of Medicaid premiums, participants were then told that some states have paired Medicaid premiums with lock-out periods whereby failure to pay one month’s premium on time causes individuals to lose access to coverage for six months (or another state-specified period of time). Participants were surprised by the severity of that punishment and worried that losing coverage for even a limited period of time would have drastic consequences for their health and ability to function in everyday life. Because of their tenuous financial situations and challenges paying bills, they knew that unexpected events one month could prevent them from being able to pay their premium on time. Without grace periods or other leniency around the timing of premium payments, participants feared they could, at some point, be subjected to the lock-out period.
Six months is a long time. That’s a little much…There’s things that I need now to live day to day and be able to walk and sit for a long time…The thought is just scary to me for sure.
Iesha, Harrisburg Medicaid
I would think we’d get leeway. Maybe like a little grace period to be late, or maybe work something out with you if you thought you could double the payment the following month or pay the regular payment the following month.
Tawnya, Harrisburg Medicaid
The concept of healthy behavior incentives to reduce premiums was popular among Medicaid participants. Similar to those in the Marketplace groups, Medicaid participants felt that healthy behavior incentives would be good motivators for individuals to take steps to improve their health while simultaneously lowering their premium costs. They were careful to note, however, that they supported this concept only if the behaviors are incentivized—participants would not be in favor of penalties for failure to engage in the behaviors or meet specified health targets (e.g. weight-loss goals).
I think that should have been in effect years ago…If you know you’re going to save money just by walking a few miles a day, losing 10 pounds a month, who wouldn’t want to have that extra drive? Yes, I think that would be a great incentive to have.
Sarah, Columbus Medicaid
I actually kind of like the idea. I know my old job, I worked for Nationwide Insurance, they did a program like that. You get a physical once a year at Nationwide and then that gives you your premium. But then they give you a list of things that you can do to lower your premium. It can be as simple as talking to…a nutritionist over the phone, and that just lowered your premium $100. I like the idea.
Elaine, Columbus Medicaid
Incentivized, but not penalized. You have an incentive to lose weight, but they wouldn’t penalize you for not being able to lose weight.
Jason, Grand Rapids Medicaid
Conclusion
Focus group discussions with Trump voters with direct experience with ACA coverage demonstrated that while coverage is working well for some, others feel that the ACA is failing to provide them with affordable coverage. At the same time, these Trump voters were leery of key elements of Republican ACA replacement proposals that are presently under discussion. Participants were almost universally opposed to the idea of high-deductible plans (even when coupled with premium tax credits and HSAs), feeling that the deductibles would be unaffordable and bar them from accessing needed care and medications. They are looking for a replacement plan with lower out-of-pocket costs, not higher, that covers the services and medications they need.
Focus group participants who gained Medicaid coverage under the ACA’s expansion of the program found their coverage extremely affordable and were generally able to access needed care. They wanted to keep their coverage as it is and were concerned about proposals that would repeal the Medicaid expansion. Many depended on treatments and medications they were able to get through Medicaid to manage medical conditions. They worried that not having coverage would adversely affect their health and their ability to work and care for their families. While most Medicaid participants said they could afford to pay a small premium toward their coverage, absent significant subsidies to lower premiums and out-of-pocket costs, they would not be able to afford coverage in the private market.
The authors extend their deep appreciation to all the focus group participants for sharing their experiences to inform this project.
Individuals and organizations interested in showing the video at events or meetings should submit a video download request form. You will hear back from a representative of the Kaiser Family Foundation shortly.
If you would like to share the video online, please click the “share” link located in the top right corner of the video player. You are permitted to embed the video on websites and blogs without express permission, but you are not permitted to upload a copy of the video to websites, blogs or YouTube. Please follow the Foundation’s citation rules.
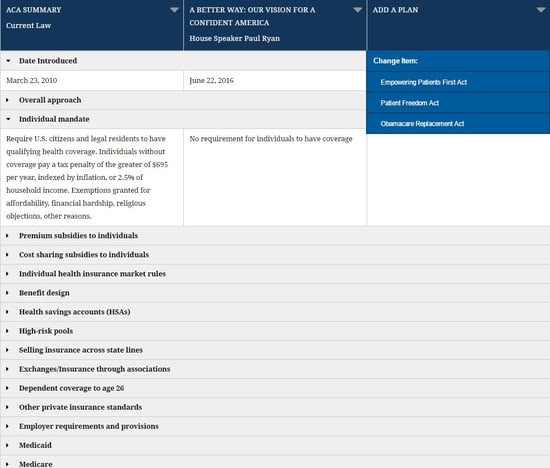
President Trump and Republicans in Congress have committed to repealing and replacing the Affordable Care Act. A new interactive tool from the Kaiser Family Foundation enables users to create side-by-side comparisons of major ACA alternative plans, now including 2017 proposals from Sen. Rand Paul and from Sen. Bill Cassidy.
With the tool, users can compare the plans’ approaches to more than a dozen key areas of health policy, including individual insurance market rules, requirements and provisions for employers, benefit design, Medicaid, and Medicare.
Detailed summaries of the Affordable Care Act and the following proposals are included:
Sen. Rand Paul’s Obamacare Replacement Act, 2017
Sen. Bill Cassidy’s Patient Freedom Act, 2017
House Speaker Paul Ryan’s A Better Way: Our Vision for a More Confident America, 2016
Empowering Patients First Act, 2015, introduced by Rep. Tom Price before he became secretary of Health and Human Services
Summaries of major new plans and updates to existing proposals will be added as they’re introduced.
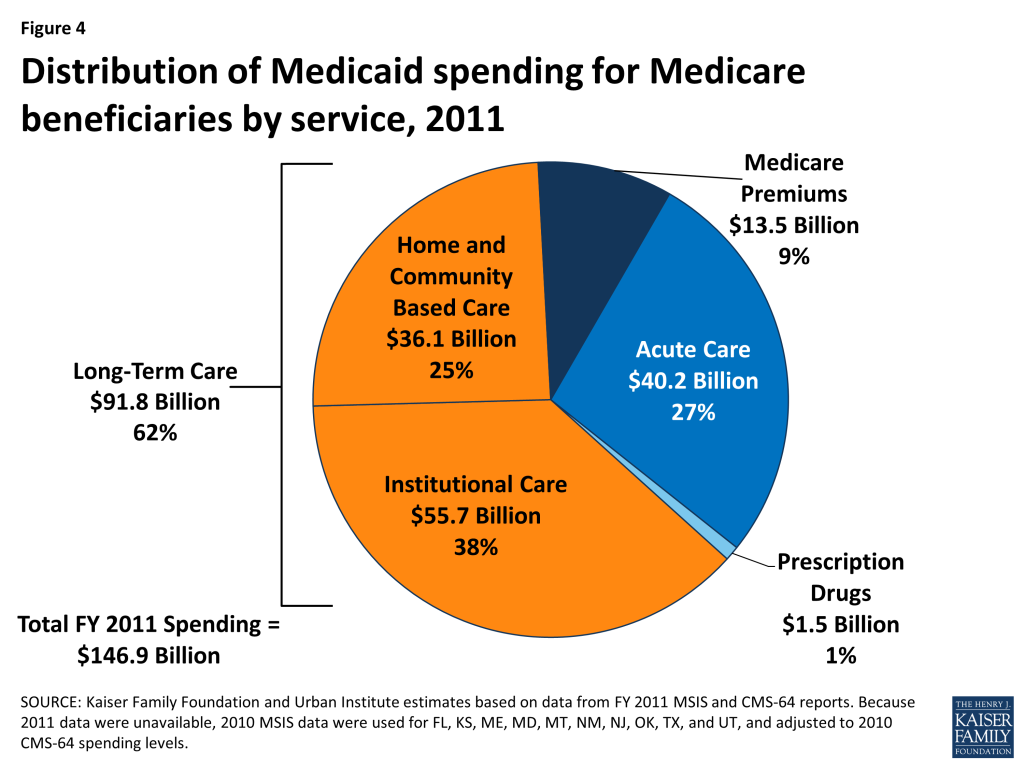
This brief describes the role that Medicaid plays for 10 million Medicare beneficiaries to help inform upcoming debates about proposals to restructure Medicaid financing in ways that could reduce federal funding.
What is Medicaid’s Role for Medicare Beneficiaries?
Medicaid covers needed services that Medicare does not, such as long-term care in nursing homes and the community. Medicaid also helps make Medicare affordable by covering Medicare premiums and/or cost-sharing, which can be high for people with low incomes.
Who are the Medicare Beneficiaries Who Receive Medicaid?
Nearly three in four Medicare beneficiaries who receive Medicaid have three or more chronic conditions, such as diabetes or heart disease, which can require regular doctor appointments, medication, and/or medical tests.
Over 60% of Medicare beneficiaries who receive Medicaid need help with daily self-care activities, such as eating, bathing, or dressing, which are important for independent living.
Nearly six in 10 Medicare beneficiaries who receive Medicaid have a cognitive or mental impairment, such as dementia, which can create the need for supports to live safely at home.
How Much Does Medicaid Spend on Medicare Beneficiaries?
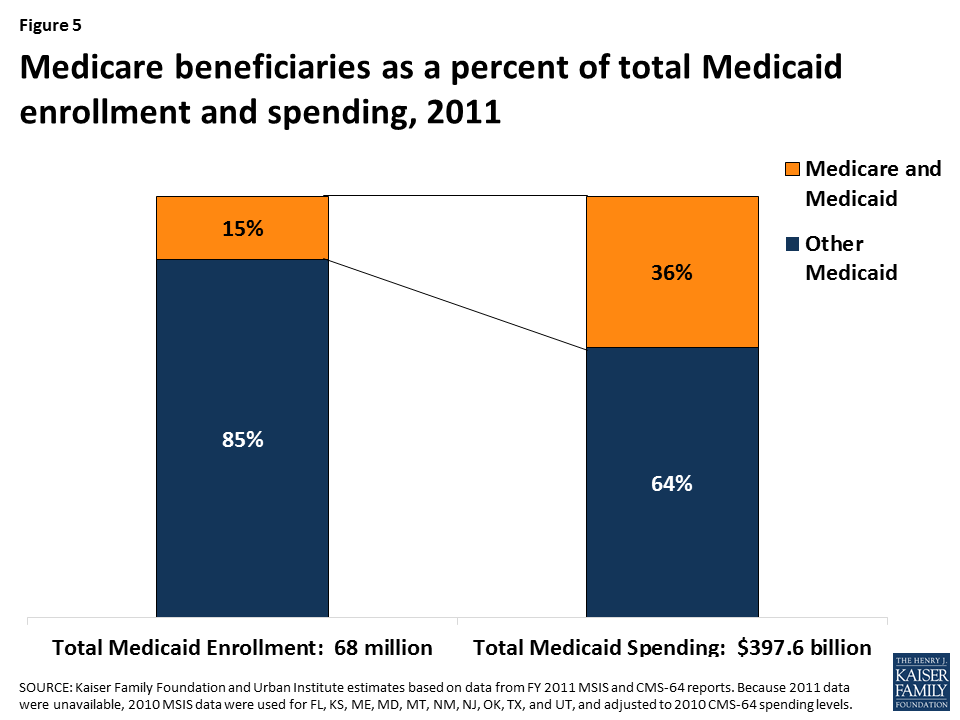
Medicare beneficiaries account for 15% of Medicaid enrollment but 36% of Medicaid spending, as a result of their more intensive health needs and service use compared to other Medicaid beneficiaries.
Nearly three-quarters of states devote more than 30% of their total Medicaid spending to Medicare beneficiaries, and spending for Medicare beneficiaries comprises more than 45% of Medicaid budgets in six states.
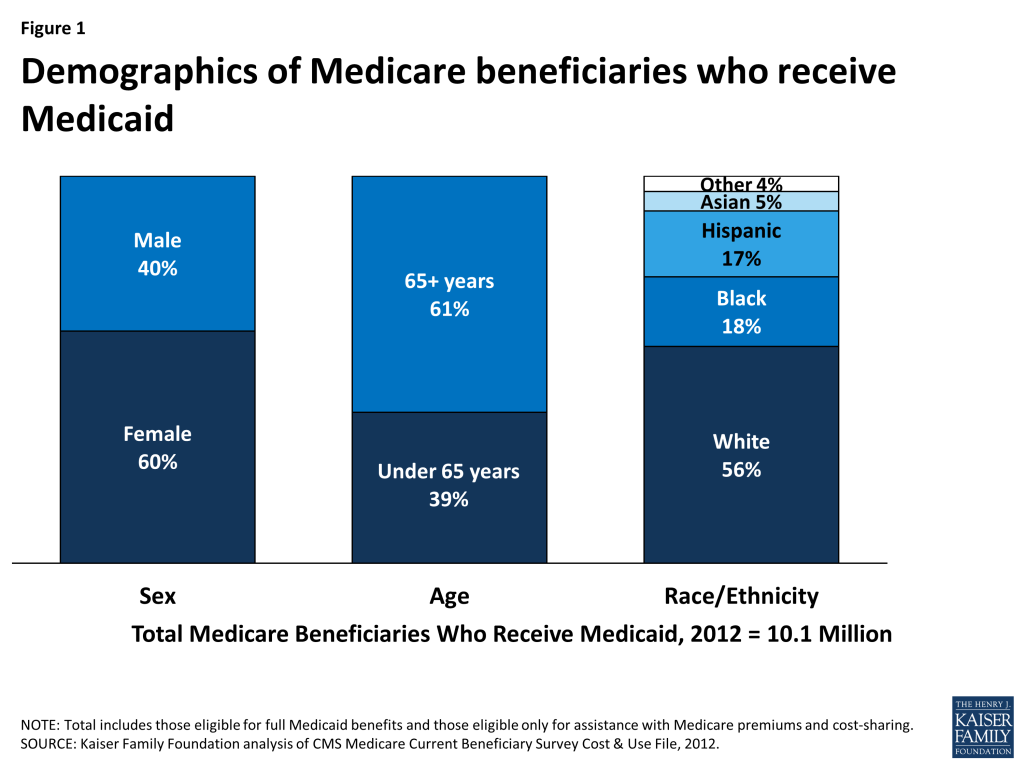
Medicaid is an important source of coverage for many Medicare beneficiaries. As of 2011, there are 10 million seniors and younger people with disabilities who receive Medicaid in addition to Medicare. They include frail seniors, people with chronic conditions such as diabetes and heart disease, and those with a variety of disabilities, such as dementia, multiple sclerosis, and mental illness.
President Trump and other GOP leaders have called for fundamental changes in Medicaid financing that could limit federal funding through a block grant or per capita cap, which may affect Medicare beneficiaries who receive Medicaid. In exchange for limits on federal funding, states could be offered increased flexibility beyond what is available under current law but may look to cuts to Medicaid eligibility, benefits, and provider reimbursement as a result of federal funding reductions. Medicare beneficiaries who receive Medicaid could be affected by potential cuts, as many of them have higher Medicaid spending relative to other populations due to their more intensive needs. This issue brief describes the role that Medicaid plays for Medicare beneficiaries. Medicaid enrollment and spending for Medicare beneficiaries by state is detailed in the Appendix.
Who are the Medicare Beneficiaries Who Receive Medicaid?
Most Medicare beneficiaries who receive Medicaid are female (60%), over age 65 (61%), and white (56%) (Figure 1). Medicare beneficiaries who receive Medicaid have low incomes and few assets and are typically poorer than other Medicare beneficiaries. Medicare beneficiaries who receive Medicaid have a work history, or for those with childhood onset disabilities (before age 22), qualify for Social Security Disability Insurance (SSDI) and Medicare based on the work history of a retired, deceased, or disabled parent. For examples, see Wanda and Don’s stories below.
Figure 1: Demographics of Medicare beneficiaries who receive Medicaid
Wanda, a senior living in Oklahoma
Wanda grew up in the aftermath of the Great Depression and helped run her family’s farm. She worked past age 65, but eventually had to retire when she needed hip replacement surgery. After her surgery, she spent two years in a nursing home but was eager to return to living in the community. With the services she receives from Medicaid, such as an in-home aide and home-delivered groceries, she was able to move into an apartment in a senior living community. Medicaid also provides transportation to her medical appointments and a case manager to help arrange for services and make sense of confusing paperwork. Wanda has degenerative joint disease in her lower back and poor circulation in her legs and takes medication for thyroid and blood pressure issues. Before receiving Medicaid, she did not have regular doctor visits because her Medicare coinsurance was too expensive for her to afford based on her limited income. She now has a regular doctor whom she likes very much. She describes herself as “the life of the party” and is grateful for the supports Medicaid provides that enable her to live in what she describes as a real “community” where people look out for each other.
Don, age 41, Michigan
Don was born with developmental disabilities and lived in group homes after his mother became too ill to care for him. He wanted more independence, and with the support of his sister who is his legal guardian, he was able to move into his own apartment. He receives SSDI based on his deceased mother’s work history as well as Medicare and Medicaid. Medicaid covers services that Medicare does not, such as dental and in-home caregivers who provide the support he needs to live safely and independently in the community.
Medicare beneficiaries who receive Medicaid tend to have greater medical needs and functional limitations than other Medicare beneficiaries. Nearly three in four Medicare beneficiaries who receive Medicaid have three or more chronic conditions, such as diabetes or heart disease, which can require regular doctor appointments, medication, and/or medical tests. Over 60% of Medicare beneficiaries who receive Medicaid need help with daily self-care activities, such as eating, bathing, or dressing, which are important for independent living. Nearly six in 10 Medicare beneficiaries who receive Medicaid have a cognitive or mental impairment, such as dementia, which can create the need for supports to live safely at home. About half of Medicare beneficiaries who receive Medicaid describe their health as fair or poor, more than double the rate among other Medicare beneficiaries (Figure 2).
Figure 2: Health and functioning of Medicare beneficiaries who receive Medicaid compared to other Medicare beneficiaries
How Do Medicare Beneficiaries Qualify for Medicaid?
To receive Medicaid benefits, including long-term care, Medicare beneficiaries may qualify for Medicaid through various pathways based on their low-income and age and/or disability. Although there is no Medicaid eligibility pathway dedicated to Medicare beneficiaries, there are several pathways through which they typically qualify. For example, all states generally must provide Medicaid to Supplemental Security Income (SSI) beneficiaries, and states can extend Medicaid eligibility for other seniors and people with disabilities up to 100% of the federal poverty level (FPL, $12,060 for an individual in 2017) (Figure 3). In addition, states can expand financial eligibility for people who need long-term care services, in nursing homes and/or in the community, up to three times the SSI benefit rate (equivalent to 219% FPL or $26,460/year for an individual in 2017). These pathways also generally have asset limits set by the state, which typically are at the SSI level of $2,000.
Figure 3: Medicaid eligibility pathways for seniors and adults with disabilities
Medicare beneficiaries who do not qualify for full Medicaid benefits may be eligible for Medicaid’s help with their financial obligations under Medicare. Through the Medicare Savings Programs, Medicaid covers Medicare premiums and/or cost-sharing for certain low-income Medicare beneficiaries. Specifically, Medicaid pays both Medicare premiums and cost-sharing for Qualified Medicare Beneficiaries (up to 100% FPL) and Medicare premiums for Specified Low-Income Medicare Beneficiaries (100-120% FPL, $12,060-$14,472/year for an individual in 2017) and Qualified Individuals (up to 135% FPL, $16,281/year for an individual in 2017). States also set asset limits for the Medicare Savings Programs, which are typically $7,280, although a few states have higher or no asset limits for their Medicare Savings Programs.
What Does Medicaid Provide for Medicare Beneficiaries?
Most Medicare beneficiaries who receive Medicaid (75%, or 7 million, in 2011) receive both full Medicaid benefits, including long-term care, and help with Medicare’s out-of-pocket costs. Medicare is their primary source of coverage for hospital and physician care, and Medicaid fills in gaps by covering services that Medicare does not, such as long-term care in the community and nursing homes. Long-term cares services are expensive, generally exceeding what people are able to afford out-of-pocket, and are the major benefit that Medicaid provides for these beneficiaries. State Medicaid programs also may cover other services that Medicare does not, such as vision, dental, or hearing, for adult Medicaid beneficiaries. In addition, Medicaid wraps around Medicare to cover Medicare’s out-of-pocket costs, such as premiums, deductibles, and co-payments, for acute care services, which can be high for people with low incomes.
Some Medicare beneficiaries do not qualify for full Medicaid benefits but receive Medicaid help with their Medicare premiums and cost-sharing. This group makes up the remaining 25% of the Medicare beneficiaries who receive Medicaid. Medicare’s out-of-pocket costs can be difficult to afford for people with low incomes. For example, in 2017, Medicare requires beneficiaries to pay a $1,316 deductible for inpatient hospital stays. Medicare beneficiaries also are responsible for 20% of Medicare-covered outpatient services after meeting a $183 deductible. In addition, the monthly premium for Medicare outpatient coverage is $134 per month in 2017, which alone is over 10% of monthly income for an individual at 100% FPL.
How Much Does Medicaid Spend on Medicare Beneficiaries?
As of 2011, Medicaid spent $147 billion on Medicare beneficiaries, with 62% of this spending devoted to long-term care services (Figure 4). Most long-term care spending for Medicare beneficiaries who receive Medicaid goes to institutions like nursing homes, with the remainder funding supports in the community. About one-quarter of Medicaid spending on Medicare beneficiaries went to acute care services. These include those for which Medicare is the primary payer, such as hospital, physician, lab, and x-ray services, and those that Medicaid covers but Medicare does not, such as vision, dental, and hearing services. Less than 10% of Medicaid spending for Medicare beneficiaries funded Medicare premiums.
Figure 4: Distribution of Medicaid spending for Medicare beneficiaries by service, 2011
Medicare beneficiaries account for 15% of Medicaid enrollment but 36% of Medicaid spending (Figure 5). Medicaid spending for Medicare beneficiaries is disproportionate to their enrollment as a result of their more intensive health care needs and service use.
Figure 5: Medicare beneficiaries as a percent of total Medicaid enrollment and spending, 2011
Medicaid spending on Medicare beneficiaries as a share of total Medicaid spending varies by state (Figure 6).Nearly three-quarters of states devote more than 30% of their total Medicaid spending to Medicare beneficiaries, and spending for Medicare beneficiaries comprises more than 45% of Medicaid budgets in six states. This variation is due to population differences among the states as well as state choices about eligibility and services. In addition, because the most current available data are from 2011, they do not reflect any changes in total state spending as a result of state adoption of the Affordable Care Act’s Medicaid expansion.
Figure 6: Medicaid spending for Medicare beneficiaries as a percent of total Medicaid spending by state, 2011
Looking Ahead
Because Medicaid spending for Medicare beneficiaries is disproportionate to their enrollment, policy changes that lead states to limit per enrollee Medicaid spending or cut costly services could especially affect these beneficiaries. Medicare beneficiaries who receive Medicaid are poorer than other Medicare beneficiaries, and many have intensive medical and long-term care needs as a result of old age, disability, and chronic illness. Medicare beneficiaries rely on Medicaid to cover expensive but necessary services, especially long-term care in the community and nursing homes, that are generally not available through Medicare or private insurance. They also depend on Medicaid to make Medicare affordable because Medicare’s out-of-pocket costs can be high for those with low incomes. In addition, because the share of state Medicaid budgets devoted to Medicare beneficiaries varies by state, any changes that limit federal Medicaid financing will impact individual states differently. Because changes to Medicaid’s financing structure could have significant consequences for enrollees and states, the potential implications warrant careful consideration for their impact on Medicare beneficiaries.
Appendix
Appendix
Table 1: Enrollment and Spending for Medicare Beneficiaries Who Receive Medicaid By State, FY 2011
State
Total Medicare Beneficiaries Receiving Medicaid(in 100s)
Medicare Beneficiaries Receiving Medicaid as a Share of:
Total Medicaid Spending on Medicare Beneficiaries(in millions)
Distribution of Medicaid Spending for Medicare Beneficiaries by Type of Service (in millions):
Medicaid Spending on Medicare Beneficiaries as % of Total Medicaid Spending
All Medicare Enrollees
All Medicaid Enrollees
Medicare Premiums
Medical Care
Long-Term Care
United States
9,972,300
21%
15%
$146,906
$13,489
$41,652
$91,765
36%
Alabama
212,100
24%
20%
$1,633
$250
$258
$1,125
35%
Alaska
15,100
22%
11%
$358
$22
$72
$264
27%
Arizona
146,400
15%
12%
$1,990
$203
$1,757
$31
22%
Arkansas
128,300
24%
18%
$1,703
$159
$652
$892
42%
California
1,294,400
26%
11%
$18,677
$2,248
$7,480
$8,949
34%
Colorado
77,500
12%
10%
$1,466
$95
$358
$1,013
34%
Connecticut
155,000
27%
20%
$2,977
$178
$439
$2,360
48%
Delaware
27,100
18%
11%
$369
$33
$67
$270
25%
DC
23,400
29%
10%
$520
$34
$89
$396
25%
Florida
675,500
19%
18%
$7,190
$1,122
$2,014
$4,054
39%
Georgia
303,900
24%
16%
$2,283
$295
$392
$1,596
29%
Hawaii
36,500
17%
13%
$606
$57
$491
$58
38%
Idaho
39,600
17%
15%
$499
$40
$143
$317
31%
Illinois
364,600
19%
12%
$3,997
$379
$902
$2,716
30%
Indiana
172,900
17%
14%
$2,584
$161
$629
$1,795
39%
Iowa
88,500
17%
15%
$1,532
$104
$351
$1,077
45%
Kansas
68,400
16%
17%
$1,106
$81
$178
$847
41%
Kentucky
194,100
25%
20%
$1,817
$212
$365
$1,241
31%
Louisiana
201,600
29%
16%
$1,962
$259
$333
$1,370
30%
Maine
104,000
38%
28%
$1,299
$114
$647
$539
52%
Maryland
119,800
15%
12%
$2,221
$186
$485
$1,549
29%
Massachusetts
255,100
23%
17%
$5,533
$407
$2,177
$2,949
41%
Michigan
290,700
17%
12%
$3,956
$389
$1,410
$2,157
32%
Minnesota
149,300
19%
14%
$3,397
$172
$1,103
$2,121
40%
Mississippi
162,200
32%
21%
$1,602
$201
$386
$1,014
37%
Missouri
187,200
18%
16%
$2,810
$177
$898
$1,736
36%
Montana
19,700
11%
15%
$399
$27
$73
$299
41%
Nebraska
44,300
16%
16%
$719
$42
$195
$482
42%
Nevada
50,500
14%
13%
$434
$72
$115
$247
28%
New Hampshire
34,500
15%
20%
$589
$24
$104
$462
46%
New Jersey
208,300
15%
20%
$4,300
$321
$846
$3,133
45%
New Mexico
69,100
21%
12%
N/A
$78
N/A
N/A
N/A
New York
839,300
28%
14%
$22,838
$1,278
$4,658
$16,902
43%
North Carolina
335,100
22%
17%
$3,346
$414
$784
$2,148
31%
North Dakota
16,300
15%
19%
$402
$11
$44
$348
56%
Ohio
345,300
18%
15%
$6,400
$383
$1,239
$4,779
41%
Oklahoma
119,700
19%
14%
$1,304
$133
$296
$875
30%
Oregon
108,500
17%
15%
$1,545
$142
$308
$1,094
35%
Pennsylvania
443,500
19%
18%
$7,317
$550
$877
$5,889
36%
Rhode Island
41,100
22%
19%
$760
$40
$434
$286
38%
South Carolina
160,200
20%
17%
$1,633
$172
$513
$948
34%
South Dakota
22,100
16%
16%
$264
$27
$46
$191
34%
Tennessee
279,100
26%
18%
$2,582
$335
$1,583
$663
31%
Texas
642,900
21%
13%
$7,438
$1,016
$2,255
$4,166
27%
Utah
30,200
10%
9%
$465
$33
$173
$259
25%
Vermont
30,000
26%
15%
$264
$6
$173
$86
21%
Virginia
191,700
16%
18%
$2,325
$223
$403
$1,700
34%
Washington
180,600
18%
13%
$2,271
$308
$278
$1,685
31%
West Virginia
87,200
23%
20%
$1,037
$107
$119
$812
36%
Wisconsin
168,300
18%
13%
$3,581
$164
$1,925
$1,493
49%
Wyoming
11,600
14%
13%
$258
$6
$76
$176
47%
NOTES: Medical care includes acute care and prescription drugs. New Mexico spending data, with the exception of Medicaid payments for Medicare premiums, is not reported due to data quality issues. Much of Arizona’s and Hawaii’s long-term care spending shows up as managed care spending, and cannot be separated out into acute care versus long-term care within managed care spending. As a result, not all long-term care spending in these states is being captured as long-term care spending.SOURCE: Kaiser Family Foundation and Urban Institute estimates based on data from FY 2011 MSIS and CMS‐64 reports. Because 2011 data were unavailable, 2010 MSIS data were used for Florida, Kansas, Maine, Maryland, Montana, New Mexico, New Jersey, Oklahoma, Texas, and Utah, and then adjusted to 2011 CMS‐64 spending levels. 2011 Medicare enrollment numbers from Centers for Medicare & Medicaid Services (CMS), CMS Program Statistics, accessed March 2016.
Significant changes to the Affordable Care Act (ACA) are being considered by lawmakers who have been critical of its general approach to providing coverage and to some of its key provisions. An important area where changes will be considered has to do with how people with health problems would be able to gain and keep access to coverage and how much they may have to pay for it. People’s health is dynamic. At any given time, an estimated 27% of non-elderly adults have health conditions that would make them ineligible for coverage under traditional non-group underwriting standards that existed prior to the ACA. Over their lifetimes, everyone is at risk of having these periods, some short and some that last for the rest of their lives.
One of the biggest changes that the ACA made to the non-group insurance market was to eliminate consideration by insurers of a person’s health or health history in enrollment and rating decisions. This assured that people who had or who developed health problems would have the same plan choices and pay the same premiums as others, essentially pooling their expected costs together to determine the premiums that all would pay.
Proposals for replacing the ACA such as Rep. Tom Price’s Empowering Patients First Act and Speaker Paul Ryan’s “A Better Way” policy paper would repeal these insurance market rules, moving back towards pre-ACA standards where insurers generally had more leeway to use individual health in enrollment and rating for non-group coverage.1 Under these proposals, people without pre-existing conditions would generally be able to purchase coverage anytime from private insurers. For people with health problems, several approaches have been proposed: (1) requiring insurers to accept people transitioning from previous coverage without a gap (“continuously covered”); (2) allowing insurers to charge higher premiums (within limits) to people with pre-existing conditions who have had a gap in coverage; and (3) establishing high-risk pools, which are public programs that provide coverage to people declined by private insurers.
The idea of assuring access to coverage for people with health problems is a popular one, but doing so is a challenge within a market framework where insurers have considerable flexibility over enrollment, rating and benefits. People with health conditions have much higher expected health costs than people without them (Table 1 illustrates average costs of individuals with and without “deniable” health conditions). Insurers naturally will decline applicants with health issues and will adjust rates for new and existing enrollees to reflect their health when they can. Assuring access for people with pre-existing conditions with limits on their premiums means that someone has to pay the difference between their premiums and their costs. For people enrolling in high-risk pools, some ACA replacement proposals provide for federal grants to states, though the amounts may not be sufficient. For people gaining access through continuous coverage provisions, these costs would likely be paid by pooling their costs with (i.e., charging more to) other enrollees. Maintaining this pooling is difficult, however, when insurers have significant flexibility over rates and benefits. Experience from the pre-ACA market shows how insurers were able to use a variety of strategies to charge higher premiums to people with health problems, even when those problems began after the person enrolled in their plan. These practices can make getting or keeping coverage unaffordable.
Table 1: Average Health Costs for Non-Elderly Adults With and Without Deniable Health Conditions, by Age Range, 2014
Age Range
Average Costs
With Deniable Condition
Without Deniable Condition
18-34
$5,190
$1,809
35-44
$6,371
$2,279
45-54
$10,195
$2,657
55-64
$11,537
$4,641
18-64
$8,853
$2,527
SOURCE: Kaiser Family Foundation analysis of data from the Medical Expenditure Panel Survey.
The discussion below focuses on some of the issues faced by people with health issues in the pre-ACA non-group insurance market. These pre-ACA insurance practices highlight some of the challenges in providing access and stable coverage for people and some of the issues that any ACA replacement plan will need to address. Many ACA replacement proposals have not yet been developed in sufficient detail to fully deal with these questions, or in some cases may defer them to the states.
We start by briefly summarizing key differences between the ACA and pre-ACA insurance market rules for non-group coverage that affect access and continuity of coverage. We then focus on pre-ACA access and continuity issues for three different groups: (1) people transitioning from employer coverage or Medicaid to the non-group market; (2) people with non-group coverage who develop a health problem; and (3) people who are uninsured (are not considered to have continuous coverage) who want to buy non-group coverage. After that, we discuss how medical underwriting and rating practices can segment a risk pool, initially and over time, and challenges that this poses for assuring continuous coverage. We end by reviewing some of the policy choices for addressing the challenges that have been raised.
Non-Group Insurance Market Practices Before the ACA
The ACA significantly simplified the rules for health insurance enrollment, rating and benefits in the non-group market. Generally, benefits are the same for all policies offered in a state, with four levels of cost sharing (bronze, silver, gold, and platinum). Insurers cannot consider a person’s health at enrollment or in determining their premium. People can enroll in any plan during an annual open enrollment period or other times under special circumstances (called special enrollment periods), such as the loss of prior coverage.
The ACA was a substantial departure from prior insurance practices in most states, where insurers had far more flexibility over enrollment, rating and benefits. State laws and practice varied — for example, a few states required insurers to accept all applicants and prohibited rating variation based on health, similar to the ACA — but this was not the norm. In most states, insurers were permitted to consider health in their enrollment and rating decisions. Some of the more important differences between ACA and pre-ACA market rules are described here. Their implications for providing access to coverage and assuring continuous and stable coverage are discussed in the next sections.
Medical Screening of Applicants. The first and most obvious difference is that insurers could ask applicants about their health and generally could deny coverage to people with health problems. They also could choose to accept the applicant at a higher premium, and, in many states, could accept the applicant but limit the terms of the coverage to exclude benefits related to a specified health condition (for example, an insurer could exclude benefits related to asthma). Underwriting decisions could vary with the type and level of coverage sought: an insurer could deny enrollment in a policy with a lower deductible to an applicant with a relatively minor condition, such as acne, but might accept them in a higher deductible plan or in a plan without drug coverage.As will be discussed in the next section, the Health Insurance Portability and Accountability Act (HIPAA) provided access to coverage for people with at least 18 months of prior coverage, if the most immediate prior coverage was in a group health plan (generally a plan offered pursuant to employment by a public or private employer, but not Medicaid or Medicare). Insurers were required to accept these applicants (called “HIPAA-eligible” individuals) without a pre-existing condition exclusion, but generally could charge them much higher rates than other applicants. States could specify an alternative coverage mechanism for HIPAA-eligible applicants; 38 states specified an alternative, with most specifying a state high-risk pool. HIPAA-eligible individuals without health problems could choose to apply for medically-underwritten non-group policies, but doing so made them subject to preexisting condition exclusion provisions (see Medical Underwriting and Pre-existing Condition Exclusion Provisions box below).
Multiple Rating Classes for Similar People in the Same Policy. Another difference is that premiums for people of the same age from the same place could be quite different for the same policy. Except for a differential for smoking, people of the same age from the same place face the same (unsubsidized) premium for the same plan under the ACA. Prior to the ACA, there were many rate classifications. For example, there could be a rate for new applicants who have no health conditions, there could be several “substandard” rate tiers for people with health problems, there could be different rates for people based on how long they have had the policy (durational rating, described more below, which means that a newly issued 40 year old would pay a lower rate than a 40 year old who bought the same policy two years prior), there could be different rates based on how the policy was purchased (through an agent, directly from the insurer, through a trade group), the person’s occupation, and others. Also, from year to year, the rates in each class could change by different percentages, increasing the differences for similar people in different rating classes.
Rating by Policy or Block. A third difference relates to how premiums are established for different policies offered by an insurer in a state. Under the ACA, where all policies cover the same essential health benefits, an average expected cost is estimated for all projected enrollees across all of an insurer’s non-group products in a state, and premiums for particular policies are determined on the objective differences (i.e., cost sharing and provider network) from the average cost. In contrast, prior to the ACA, premiums were established for each policy (or a group of policies, sometimes called a block) based on the expected claims costs for the people expected to be enrolled in that policy or block, projected over current and future years. Importantly, the experience of each policy or block is developed independent of the costs or results expected in other policies or blocks, which means that two policies that are almost the same could have very different premiums associated with them based on the anticipated costs of who is projected to be enrolled (and who has actually enrolled). As discussed more below, a policy or block of policies no longer for sale to new people (called a closed policy or block) would likely have much higher premiums for the same benefits than a policy currently available to new enrollees.2
Broad Variation in Benefits Across Policies. Another difference is that there was significant variation in the benefits covered by pre-ACA policies, including options that excluded entire classes of benefits such as prescription drugs or mental health. Under the ACA, all policies cover the same essential health benefits, with variations largely relating to cost sharing and network. Pre-ACA policies sometimes had annual or lifetime limits on specific or total benefits: for example, a policy might limit prescription benefits to $500 per year. Most states specified some benefits that needed to be covered or at least offered to applicants by insurers.
Limited Ability to Switch Among Non-Group Plans. A fifth difference relates the ability of a person with non-group coverage to switch policies without re-submitting to medical underwriting. Before the ACA, people who were accepted into a non-group policy were not necessarily able to switch into new non-group policies, at renewal or otherwise, either from their current insurer or from others, without passing medical underwriting. Insurers sometimes offered people the ability to elect different policies at renewal (usually the ability to take a policy with higher cost sharing to moderate a rate increase), but they were not required to do so and did not have to allow current policyholders to move to different policies.
Medical Underwriting and Pre-Existing Condition Exclusion Provisions
Prior to the ACA, insurers often used the health of individual enrollees in making decisions about their coverage. Medical underwriting is the process by which an insurer acquires information about the health of applicants for coverage and uses the information to make decisions about whether to offer coverage, what coverage to offer, and what premium to charge. Applicants for non-group coverage generally were required to answer a long series of questions about their health and health history, and often were required to provide authorization for the insurer to obtain their medical records. In the non-group market, insurers generally were permitted to use the information to decline the application, accept the applicant for a reduced scope of coverage, or accept the applicant at a higher premium.
A pre-existing condition exclusion provision is a contract term that permits an insurer to exclude coverage for benefits sought by an enrollee during a defined period after the coverage begins (for example, twelve months) if the insurer can show that the claim relates to a condition that existed before the policy was issued. State laws varied in defining pre-existing conditions for non-group coverage; for example, in how far an insurer could look back to detect the condition, or in whether the condition must have been actually treated or whether a reasonable person would have sought treatment. This exclusion allowed insurers to exclude benefits for pre-existing conditions that were not necessarily detected during the medical underwriting process.
While there are many other differences between ACA and pre-ACA non-group market rules (e.g., permitted cost sharing, limits on age rating), these have the most implications for providing access to and continuous coverage for people with health problems. Most fundamentally, medical screening divides people by health at initial enrollment, and the inability to switch policies can trap people who develop health problems into much more expensive coverage. The potential implications of this are discussed below.
Issues Raised by Pre-ACA Non-Group Market Rules for Access to Coverage and Continuous Coverage
To examine the issues raised by these pre-ACA market rules, we look at three different groups of people:
People transitioning from existing coverage and applying for non-group coverage
People with non-group coverage who develop health problems
People without recent prior coverage applying for non-group coverage
People Transitioning From Existing Coverage to Non-group Coverage
Assuring access to non-group coverage for people who maintain continuous coverage has been a priority for proponents of changing the ACA. One of the attributes of the ACA is that people who lose eligibility for coverage can obtain replacement coverage in the non-group market on the same terms as others covered in the market, without consideration of their health.
A large number of people who lose their coverage might want or need access to non-group coverage. Looking at the 2012 through 2013 period (the 24 months immediately prior to the ACA coverage expansion), about 32 million people with coverage lost it and became uninsured for some period. People without health problems leaving previous coverage generally could purchase underwritten policies in the market. Some, but not all, people with health problems who had previous coverage could qualify for designated non-group policies without regard to their health.
As noted above, prior to the ACA, federal law provided guaranteed access to non-group coverage for people with at least 18 prior months of continuous coverage if their most recent prior coverage was an employer plan and if they did not have a gap in coverage of more than 63 days. These HIPAA-eligible individuals qualified for specified policies (most often, coverage in a state high-risk pool, but sometimes designated plans offered by non-group insurers), with no pre-existing condition exclusion. Their premiums were almost always much higher than the rates charged to applicants who could pass medical underwriting.
The HIPAA non-group market provisions were perceived generally to have fairly limited effect, primarily because the coverage made available could be expensive. Several factors limited HIPAA’s effectiveness in assuring access to non-group coverage:
Eligibility. The guaranteed access and waiver of pre-existing condition exclusion provisions were available only to a limited group of people: those whose most recent previous coverage was involuntarily terminated and employment-based. Limiting the option to people leaving employer group plans left out people coming from public coverage such as Medicaid or who lost a prior non-group plan because they moved out of area served by their insurer. A few states expanded the requirement to include other types of coverage, but it was not the general rule. The provisions also left out people who wanted to switch plans within the non-group market, for example, because of network changes in their existing plan or if it had become unaffordable (discussed below).
Cost. Federal HIPAA portability provisions also did not limit the premiums that could be charged for the specified plans available to HIPAA-eligible people. Most states used a high-risk pool to serve HIPAA-eligible people, where premiums typically ranged from 125% to 200% of the estimated standard premiums for non-group coverage. With a couple exceptions, income-based subsidies were not available in high-risk pools, making it quite difficult for people with modest incomes. In states where insurers were required to make private policies available to HIPAA-eligible individuals, insurers often were able to charge much higher premiums to HIPAA-eligible individuals with health problems; for example, insurers could develop separate rating classes for HIPPA-eligible individuals who could meeting medical underwriting standards and those would could not. A few states limited the additional premium that could be charged to HIPAA-eligible individuals who could not pass medical underwriting.In addition, HIPAA only extended guaranteed availability to people after they had exhausted their eligibility for continuation coverage under COBRA or under state continuation laws. Continuation coverage can be expensive: COBRA premiums are 102% of the full cost of the employer plan for at least 18 months. Affording COBRA can be difficult for people who lost their job and may not have new work.The requirement to exhaust continuation coverage and the relatively high premiums served to limit the number of people who could afford to take advantage of the guaranteed availability opportunity under HIPAA. As discussed below, people who could pass medical underwriting could save these expenses and enroll in lower-cost plans, but they would not get the full benefits of having continuous coverage.
Combining Guaranteed Access and Waiver of Pre-Existing Condition Exclusion in the Same Provision. The law provided for guaranteed access to coverage and the waiver of pre-existing condition exclusion provisions only in specified policies, which tended to be quite expensive. HIPAA-eligible individuals who were healthy and could pass medical underwriting could get a non-group policy for much less than the policies offered generally to HIPAA-eligible people, but in choosing the cheaper policy they sometimes exposed themselves to a new pre-existing condition exclusion period, despite the fact that they had at least 18 months of continuous coverage. Many people may not even have understood that they were making this tradeoff.
A different kind of issue facing people leaving employer group coverage or Medicaid who wanted to maintain continuous coverage were the limits on benefits in many non-group policies. One of the significant changes in non-group coverage under the ACA was the establishment of a fairly comprehensive essential health benefit package. In particular, pre-ACA non-group policies had significant limits on mental health benefits (mental health parity requirements, which applied to employer-group plans for employers with more than 50 employees, did not apply to non-group coverage), and, unless required by states, typically excluded coverage for many policies, and also did not cover costs associated with pregnancy or routine delivery. Some state high-risk pools, which were the only options for HIPAA-eligible individuals with health problems, had tight limits on coverage for prescriptions.3 ,4
Prior to the ACA, non-group coverage was decidedly less comprehensive than employer group coverage. Substantial shares of non-group enrollees did not have coverage for routine maternity, substance abuse or mental health services, and it was not uncommon for policies to have relatively low annual benefit limits for prescription drugs or mental health services. Even though insurers were able to medically screen applicants in most instances, they still imposed significant limits on benefits where there is a greater chance of purchasers selecting coverage based on the need for particular services. Unlike the group market, where employers select levels of benefits for all their employees, insurers are wary of non-group purchasers who are willing to pay the relatively high cost for more comprehensive benefits. These benefit limits, along with the rating issues discussed in the next section, meant that the non-group market was not a good long-term coverage option for many people, including those who wanted to start a family or who developed mental health problems.
People enrolled in non-group coverage who develop health problems
Another aspect of maintaining continuous coverage is being able to keep the coverage you obtain on a reasonable basis. Prior to the ACA, non-group coverage generally was guaranteed renewable, which meant that enrollees had the right to renew their coverage (with certain limited exceptions) by paying their premiums. Insurers also generally were not permitted to vary renewal premiums based on an enrollee’s individual health or claims. Insurers, however, through selectively closing policies or blocks of business to new enrollees and through certain rating approaches, were able to access higher premiums than enrollees who developed health problems after they enrolled. As discussed above, people with non-group coverage generally were not able to switch carriers or move to a new policy (in an open block of business) unless they could pass medical screening. As a result, they could find themselves essentially locked into policies with escalating premiums that could be difficult to afford.
This can happen several ways. The medical underwriting process allows insurers to protect themselves from adverse selection (see The Issue of Adverse Selection box below), but it also produces complicated dynamics that can segment risk by health even after people in good health have been accepted into coverage. Medically screening new applicants, and declining applicants who are unhealthy, produces a group of healthy new enrollees whose expected claims costs over the short term could be meaningfully below the costs for an average mix of people. Prior to the ACA, the expected low costs for these enrollees would be reinforced because the group also would generally be subject to a pre-existing condition exclusion provision for the first year that eliminated coverage for claims for pre-existing health conditions not uncovered during the medical underwriting process. Over time, however, some of the group of enrollees would develop health problems, and the average costs of the group would grow each year; by year three or four after their enrollment the expected costs for the group would roughly equal the expected costs for an average mix of people. This is sometimes referred to as “underwriting wearing off.” An insurer, at any given time, will have a group of recently underwritten enrollees, with relatively low expected costs, and other groups enrolled for varying lengths of time, with the tendency for those enrolled longer to have worse average health. If an insurer closed these older products to new enrollees – and allowed healthy enrollees in them to sign up for new, medically-underwritten products – premiums for existing enrollees would escalate over time, and those with medical conditions would essentially be trapped into paying those higher premiums because they could not switch to other coverage.
The Issue of Adverse Selection
Prior to the ACA, insurers used medical underwriting in the non-group market to protect themselves and their policyholders from adverse selection. Unlike coverage offered to large employer groups, where insurers anticipate getting a mix of better and worse health risks when they accept a new group, non-group coverage is sold person-by-person. While virtually everyone wants to have health insurance, people with high or ongoing health needs are more likely to sign up at any given price, a tendency referred to as adverse selection. Adverse selection occurs not only in the decision of whether or not to purchase coverage, but also in decisions about how much coverage to get (people in poorer health tend to want more comprehensive benefits and less cost sharing) and in decisions about whether or not to keep coverage (people in better health are more likely to drop coverage or move to less coverage in the face of premium increases). The relatively high cost of health insurance makes adverse selection more acute (premiums can be a large portion of a monthly budget, so there is a tendency for healthier people to forgo coverage if they do not think they will need it). This is particularly an issue in the non-group market where enrollees pay the full premiums.
There are several ways insurers can reflect these differences in their rating and enrollment practice rates, and this a place where problems can occur for people who develop health problems after enrollment. One option is for insurers to combine the new and existing enrollees in blocks of business that are being actively marketed (called “open” here), so that low expected costs of new enrollees can help offset the higher costs of enrollees who have been covered longer. As long as there is a reasonable stream of people entering and leaving the block, premiums can remain reasonably spread over the entire group. Insurers also can pool the expected total claims of each durational group of enrollees over their average expected length of enrollment. This requires charging new and early-duration enrollees for more than their expected costs during their early years, setting aside a portion of the premium (i.e., creating a reserve) that can be used to offset the higher costs for those who keep their policies for longer periods.
Some insurers, however, may not want to pool the lower costs of new entrants with the higher costs of longer-term enrollees. For example, insurers with larger and older blocks of business may find that they cannot compete well for new enrollees against insurers without as much existing business, because those insurers would have a higher proportion of new healthy enrollees and could have lower rates for new business, particularly if the new carrier is not reserving for the effects of underwriting wearing off. An insurer also might develop a new group of policies based on a new approach (for example, a policy where it shares risk with an Accountable Care Organization (ACO) network) where it does not want to pool experience with its existing policies in determining rates. An insurer also may want to increase its market share by being more competitive for new enrollees, which it might do by setting the premiums for new enrollees closer to their expected first year costs.
Insurers that want to reduce the pooling of newer and longer-term enrollees have several ways to do so. One is to use the duration of enrollment as an explicit rating factor. Insurers using durational rating can set initial rates relatively low for new enrollees, but will need to raise them relatively rapidly each year (on top of increases for rising health costs generally) for these enrollees to reflect their higher expected claims at later durations. Another option is for an insurer to stop selling policies in blocks of business to new enrollees, directing them to new policies in a new block of business without any existing enrollees. Because premiums are set based on the expected costs for specific policies or blocks of business, premiums for the new policies do not need to reflect the costs of the existing enrollees in the closed block, and future premiums for the closed block will reflect only relatively higher average costs of the existing enrollees.
Both of these practices end up harming enrollees who develop health problems. Enrollees facing the relatively higher premiums under durational rating or in a closed block will look for lower cost alternatives. Healthier enrollees who can pass medical screening will move to lower cost policies (essentially starting over as new entrants), while people with health problems who cannot move will have to stay and pay the higher premiums being charged. The new round of higher premiums will cause more of the healthier enrollees to leave, resulting in higher expected costs for those remaining and higher premiums, a cycle that will continue until most enrollees have left the block.
People without recent prior coverage applying for non-group coverage
There was a substantial number of people without health insurance prior to the ACA, many of whom had been without coverage for long periods of time.5 The primary reason people went without coverage was its cost, although in some cases people were unable to qualify for coverage due to their health.6 The two factors sometimes worked together; many states had high-risk pools or similar options for people with health problems who were denied non-group coverage, but the high premiums and other limitations could make these options difficult for people to afford and the pools had fairly low enrollment.
High-risk pools are being discussed as an important part of ACA replacement proposals. About 227,000 people were enrolled in 35 state high-risk pools at the end of 2011, including HIPAA-eligible individuals, which was equal to just over 2% of non-group market enrollment nationally.7 A few states with relatively lower premiums, such as Maryland, Wisconsin, Minnesota, and Oregon, covered somewhat higher shares of their people.8 Enrollment in state high-risk pools tapered off with the opening of the federal Pre-Existing Condition Insurance Pool, created and funded under the ACA, which served many of the people who previously would have been covered in the state pools.
State high-risk pools varied in terms of benefits, premiums, and funding.9 As noted above, in many states the high-risk pool served as the state-designated mechanism to cover HIPPA-eligible individuals. There were a few common themes: premiums generally were calculated as a percentage of estimated standard premiums in the non-group market (typically 125% to 200% of standard premiums); coverage for pre-existing conditions was limited for a period after enrollment; pools generally offered several benefit options, most states had lifetime benefit limits and a few had annual limits; premiums did not cover the cost of benefits, with the difference subsidized by state and federal payments (a few states had dedicated revenue sources) or assessments on insurers.
A combination of factors limited the attractiveness of pre-ACA state high-risk pools. The relatively high premiums made coverage difficult to afford for people with low or modest incomes, and only a couple of states had subsidies for lower-income enrollees. In addition, pools generally had pre-existing condition exclusion periods for enrollees who were not HIPAA-eligible individuals, which means that people were required to pay for coverage that would not cover the illnesses that had made them eligible for the high-risk pool in the first place for six months to a year or more (depending on the state). A few state pools also had annual limits on some or all benefits, and the majority had lifetime benefit limits. Given the populations served, these limits could affect those with high cost chronic conditions, such as the ongoing need for expensive prescriptions.
A few states addressed access for people with health problems by requiring all insurers (or in some cases, one or more designated insurers) to accept applicants even if they were in poor health. Premiums in these states tended to be much higher than premiums in states that permitted medical underwriting, which limited participation in non-group coverage significantly and made coverage even more difficult to afford for people with modest incomes.
Discussion
There were many aspects of the pre-ACA non-group market that made it difficult for people with health problems to get and keep non-group coverage. Any proposal for replacing the ACA will have to determine which, if any, of these previous insurance practices will once again be permitted. Medical screening was the most obvious barrier, combined with high premium costs for people who were HIPAA-eligible. Even people who purchased coverage when they were healthy sometimes were unable to keep it because certain rating approaches could cause their premiums to spiral. Returning to a less structured, less regulated non-group market raises questions about how people with health problems will be treated in terms of access to and cost of coverage. Health insurance underwriting and rating is complex, and reviewing how the pre-ACA market operated provides information about the types of issues that people with health problems may confront if the ACA market structure is replaced.
National Association of State Comprehensive Health Insurance Plans. Comprehensive Health Insurance for High-Risk Individuals: A State-by-State Analysis, 2010/2011. ↩︎
Annual maximum pharmacy benefits by state: AL: $10,000; MS: $100,000; NH: $10,000; NC: $100,000 applies to injectable drugs. ↩︎
National Association of State Comprehensive Health Insurance Plans. Comprehensive Health Insurance for High-Risk Individuals: A State-by-State Analysis, 2011/2012. ↩︎
This brief reviews children’s coverage today and examines what is at stake for children’s coverage in upcoming debates around funding for the Children’s Health Insurance Program (CHIP), repeal and replacement of the Affordable Care Act (ACA), and restructuring of Medicaid financing to a block grant or per capita cap.
Following decades of steady progress, largely driven by expansions in Medicaid and CHIP, the children’s uninsured rate has reached an all-time low of 5%. Medicaid and CHIP are key sources of coverage for our nation’s children, covering nearly four in ten (39%) children overall and over four in ten (44%) children with special health care needs. Medicaid serves as the base of coverage for the nation’s low-income children and covered 36.8 million children in fiscal year 2015. CHIP, which had 8.4 million children enrolled in fiscal year 2015, complements Medicaid by covering uninsured children above Medicaid eligibility limits.
There is much at stake for children’s coverage in upcoming debates. New legislative authority is needed to continue CHIP funding beyond September 30, 2017. In addition, the Administration and Republican leaders in Congress have called for repeal and replacement of the ACA and restructuring of Medicaid financing to a block grant or per capita cap. Loss of CHIP funding, repeal of the ACA, and capping Medicaid financing all have the potential to reverse the coverage gains achieved to date and increase the number of uninsured children. In addition, rollbacks in coverage for parents could contribute to coverage losses among children and increased financial instability among families.
Reductions in children’s coverage would lead to reduced access to care and other long-term effects for children and increase financial pressure on states and providers. Reductions in children’s coverage would result in fewer children accessing needed care, including preventive services such as well child visits and immunizations. Research also suggests that reductions in children’s coverage could have broader long-term negative effects on their health, education, and financial success as adults. In addition, loss of CHIP funding and reductions in federal Medicaid financing would create funding gaps that would increase financial pressure on states and providers.
Introduction
Following decades of progress, bolstered by the ACA, the children’s uninsured rate has reached an all-time low. This brief reviews children’s coverage today and examines what is at stake for children’s coverage in upcoming debates around CHIP funding, repeal and replacement of the ACA, and restructuring of Medicaid financing to a block grant or per capita cap. Appendix Tables 1 and 2 provide state data on coverage for children and the number of children enrolled in Medicaid and CHIP.
Coverage for Children Today
The uninsured rate among children has reached an all-time low of 5%. The uninsured rate among children has steadily decreased over time, with additional declines since implementation of the ACA in 2014. These coverage gains have stemmed from new coverage options for children through expansions of Medicaid and CHIP and the ACA Marketplaces and subsidies as well as from streamlining of enrollment and renewal processes and focused outreach and enrollment efforts. Children have had much larger gains in coverage than adults over the last two decades, largely reflecting the broader availability of Medicaid and CHIP coverage for children compared to adults (Figure 1).
Figure 1: Uninsured Rates Among Nonelderly Adults and Children, 1997-2016
Medicaid and CHIP are key sources of coverage for our nation’s children. Today, over half of children are covered through private insurance, including parents’ employer-sponsored plans and individual market plans. Medicaid and CHIP cover nearly four in ten (39%) children overall and play a larger role for children with low incomes and special health needs. Together, the programs cover two-thirds (66%) of children in low-income families (below 200% of the federal poverty level, FPL) and more than three-quarters (76%) of children in poor families (below 100% FPL).1 Moreover, the programs cover more than four in ten (44%) of children with special health care needs.2 Despite consistent coverage gains over time, 5% or about 4 million children remain uninsured. Children’s uninsured rates range across states from a 2% in Illinois to 13% in Arizona (Appendix Table 1).3 Most uninsured children are eligible for Medicaid and CHIP, but not enrolled.4
Figure 2: Health Insurance Coverage of Children, 2015
Health coverage provides children access to needed care and promotes improved health, education, and financial success over the long-term. Children with health coverage fare better on measures of access to care compared to uninsured children, and access for children with Medicaid and CHIP is comparable to access for children with private coverage along these measures (Figure 3). Studies also show that Medicaid and CHIP coverage contribute to long-term positive outcomes in health, school performance and educational attainment, and economic success.5 Moreover, parents say they are thankful for Medicaid and CHIP and have peace of mind knowing their children are covered.6 Polling data show that most adults (88%) would enroll a child in Medicaid if the child was eligible.7
Figure 3: Access to Care for Children by Health Insurance Status, 2015
The Role of Medicaid and CHIP for Children
All states have expanded eligibility for children through Medicaid and CHIP. Medicaid is the base of coverage for our nation’s low-income children. CHIP complements Medicaid by covering uninsured children in families with incomes above Medicaid eligibility levels. States provide CHIP by creating a separate CHIP program, expanding Medicaid, or adopting a combination approach. The ACA built on previous Medicaid expansions for children by establishing a minimum Medicaid eligibility level of 138% FPL for children of all ages. Prior to the ACA, this minimum was already in place for children below age 6, but the minimum for children ages 6 to 18 was 100% FPL. As a result of this change, 19 states transitioned coverage for older children from separate CHIP programs to Medicaid.8 All states have expanded children’s eligibility beyond the minimum through Medicaid and CHIP. As of January 2017, 49 states extend Medicaid/CHIP eligibility for children up to at least 200% FPL (Figure 4).
Figure 4: Income Eligibility Levels for Children in Medicaid/CHIP, January 2017
Medicaid and CHIP provide broad benefits designed for children. Children enrolled in Medicaid are covered for all medically necessary care through the Early and Periodic Screening, Diagnostic and Treatment (EPSDT) benefit. The benefit includes regular medical, vision, hearing, and dental screenings as well as the services necessary to “correct or ameliorate” physical or mental health conditions. Medicaid’s benefit package also includes long-term care services not typically covered by private insurance that help children with special health care needs remain at home with their families. The broad benefit package in Medicaid facilitates pediatricians’ ability to make treatment decisions for the children they serve. Moreover, the broad benefits help ensure children can access needed care, since families with children covered by Medicaid generally would not be able to afford services not covered by insurance. States have more flexibility around designing benefits in separate CHIP programs, but CHIP provides benefits designed for children’s needs, including dental care. Analysis shows that CHIP generally offers more comprehensive benefits at a much lower cost to families than private coverage.9
Premium and cost sharing protections in Medicaid and CHIP keep coverage and care affordable for low-income families. States generally are prohibited from charging premiums for children enrolled in Medicaid with family incomes under 150% FPL, and many children in Medicaid are exempt from cost-sharing. States have more flexibility to charge premiums and cost-sharing in separate CHIP programs compared to Medicaid. However, there are limits on costs that can be charged in CHIP, and analysis shows that CHIP is more affordable than employer-sponsored and Marketplace coverage.10 In focus groups, parents with children covered by CHIP say that they highly value the affordability of CHIP, that it is more important to them for their children to have coverage with comprehensive benefits and lower costs than to have their children in the same plan as them, and that they prefer to have their children in CHIP rather than private coverage because they would face higher costs with private coverage.11
Federal Medicaid and CHIP funding is central to supporting state capacity to cover low-income children. Under both programs, the federal government matches eligible state spending according to a formula that relies on states’ relative per capita income. To encourage participation among the states when CHIP was enacted in 1997, the federal government provided an enhanced (relative to Medicaid) matching rate for CHIP, which was further increased by 23 percentage points under the ACA. With this increase, the CHIP matching rate ranges from 88% to 100% across states.12 Under Medicaid, federal matching funds are guaranteed with no pre-set limits. Tied to this financing structure, Medicaid provides an entitlement to coverage and states are prohibited from imposing enrollment caps or waiting lists. In contrast, federal funds under CHIP are capped nationwide and each state operates under an allotment. Under separate CHIP programs, enrollees are not entitled to coverage and, at various times, states have imposed caps and waiting lists to limit CHIP spending. CHIP’s financing structure limits federal funding and makes federal funding more predictable, but it is not responsive to program needs, such as increased costs during economic downturns, and leads to challenges targeting funds and distributing funds across states.13
Key Issues at Stake for Children’s Coverage
New legislative authority is needed to continue CHIP funding beyond September 2017. Moreover, the Trump Administration and Republican leaders in Congress have called for repeal and replacement of the ACA and restructuring of Medicaid financing to a block grant or per capita cap. As debate in these areas unfolds, there is much at stake for children’s coverage.
Extension of CHIP Funding
New legislative authority is needed to continue CHIP funding beyond September 2017. As noted, unlike Medicaid, federal funding for CHIP is capped and provided as annual allotments to states. Since CHIP’s enactment in 1997, Congress has renewed federal funding for the program several times.14 Most recently, the Medicare Access and CHIP Reauthorization Act of 2015 (MACRA) extended funding through fiscal year 2017. Without further Congressional action, CHIP funding ends this fiscal year on September 30, 2017.
Loss of CHIP funding could put children’s coverage at risk and increase financial pressures for states. In fiscal year 2015, 8.4 million children were enrolled in CHIP (Appendix Table 2); 4.7 million were in CHIP-funded Medicaid expansion programs, while the remaining 3.7 million were in separate CHIP programs.15 If CHIP funding ends, states would be required to maintain coverage for children in CHIP-funded Medicaid expansion programs under the ACA maintenance of effort requirement, and state costs for this coverage would increase since states would receive the lower federal Medicaid match rate. States would not be required to maintain separate CHIP coverage if funding ends. Some children in separate CHIP programs could shift to parents’ employer-sponsored plans or Marketplace plans, but others would become uninsured. The Medicaid and CHIP Payment and Access Commission (MACPAC) estimates that if no new CHIP funds are provided, 1.1 million children would become uninsured.16
The implications of loss of CHIP funding would be even larger if combined with repeal of the ACA. If CHIP funding ends and Marketplace coverage is not available due to repeal of the ACA and/or the ACA maintenance of effort requirement is eliminated, coverage losses among children enrolled in CHIP could be even larger. The extent of further coverage losses would depend on what coverage may be available to these children under a replacement plan.
Given these potential risks and uncertainties, in January 2017, MACPAC recommended that Congress extend CHIP funding for five years, through 2022. MACPAC also recommended keeping the maintenance of effort requirement and 23 percentage point increase in the CHIP federal match rate through 2022. MACPAC notes that the extension would, “ensure that low- and moderate-income children retain access to affordable and comprehensive insurance coverage, maintaining the gain in coverage secured over the past 20 years.”17
Repeal of the ACA
Repeal of the ACA coverage expansions could lead to coverage losses for children. The ACA Marketplaces and subsidies provided a new coverage option for children in families who lack access to employer-based coverage and have incomes above CHIP eligibility levels. The ACA also expanded Medicaid eligibility for older children and contributed to increased enrollment among eligible children through new streamlined enrollment and renewal processes and outreach and enrollment efforts. Moreover, the ACA significantly increased coverage options for parents through its Medicaid expansion to adults up to 138% FPL (which 32 states, including DC, have implemented18 ) and the Marketplaces and subsidies. These coverage expansions for parents likely increased coverage among children, since research shows that children are more likely to be covered when their parent is covered.19 If the ACA coverage expansions were repealed along with the individual mandate, it is estimated that the number of uninsured children would increase by 4.4 million and the children’s uninsured rate would nearly double to just below 10% by 2019.20 However, the full extent of coverage losses would depend on what other coverage options might be available under a replacement plan.
Elimination of the ACA maintenance of effort provision could result in even larger coverage losses for children. The ACA protects existing coverage gains for children through a “maintenance of effort” provision that requires states to keep Medicaid and CHIP eligibility levels at least as high as those they had in place at the time the ACA was enacted through September 30, 2019. It is estimated that an additional 8.9 million children would be at risk for losing coverage if this requirement was eliminated and states reduced Medicaid and CHIP eligibility to the federal minimum.21 Combined with repeal of the coverage expansions and individual mandate, the number of uninsured children could rise by up to 16.5 million, with one in five uninsured, depending on what other coverage options might be available under a replacement plan.22
Repeal of the ACA insurance market reforms could weaken coverage for children in private plans. The ACA increased protections and enhanced coverage for children in private plans through insurance market reforms that apply to both the individual market and certain employer-sponsored plans. These reforms establish an essential health benefits package that includes dental and vision services for children and coverage of rehabilitative and habilitative services, which are particularly important for children with special health care needs. The reforms also provide for coverage of well-child visits, preventive screenings, and child immunizations with no cost sharing; prohibit lifetime limits on coverage and pre-existing condition exclusions; and cap out-of-pocket costs. Moreover, within the individual market, the ACA prohibits plans from denying coverage or charging higher premiums based on health status. If these reforms were repealed, children could face lifetime or annual caps on coverage, be subject to pre-existing condition exclusions, receive more narrow benefit packages, and be subject to cost sharing for preventive services and immunizations.
Restructuring of Medicaid
The Trump Administration and Republican leaders in Congress have called for fundamental changes that could limit federal Medicaid financing through a block grant or per capita cap. Unlike current law where eligible individuals have an entitlement to coverage and states are guaranteed federal matching dollars with no-preset limit, the proposals under consideration could eliminate both the entitlement and guaranteed match to achieve budget savings and to make federal funding more predictable. To achieve budget savings, federal funding caps would be set at levels below expected levels if current law were to stay in place. In exchange for a federal cap, proposals could allow states to eliminate the entitlement to coverage and impose enrollment caps or waiting lists, reduce eligibility levels, or offer states other increased flexibility to design and administer their programs. The effects of these proposals will depend on many factors including what happens to the ACA, the size of federal savings targets, how the base year for the block grant or cap would be established, and what flexibility would be provided to states.
Changes to Medicaid could have significant effects on large numbers of low-income children with significant health needs. In fiscal year 2015, 36.8 million children were covered by Medicaid (Appendix Table 2).23 Since the size and scope of Medicaid is much broader than CHIP, changes to Medicaid would have larger implications for children’s coverage. Changes to Medicaid would affect children with the lowest incomes and highest health care needs.
Capping federal financing for Medicaid through a block grant or per capita cap would shift risks and costs to states, enrollees, and providers and could result in reductions in coverage for children. Moving to a capped financing structure could lock historic spending patterns and variation in Medicaid programs in place and make the program less responsive to changes in economic conditions, public health needs, and changes in health care costs. Moreover, to respond to reductions in federal funding under a capped structure, states would need to increase state spending to maintain current programs or would need to identify ways to reduce program costs. Analysis suggests that even with increased program flexibility, states would need to reduce enrollment, benefits, or provider reimbursement levels if faced with large reductions in federal spending.24 Such changes could affect eligibility for children; the scope of coverage provided to children, including the EPSDT benefit; as well as the affordability of coverage and care.
Looking Ahead
The upcoming debates around CHIP, the ACA, and Medicaid are interrelated since outcomes in one area may affect another area. As proposals emerge, there is much at stake for children’s coverage:
Potential coverage losses for children. The uninsured rate for children has reached an all-time low of 5%, reflecting continued coverage gains over the last twenty years as a result of coverage expansions, streamlining of enrollment and renewal processes, and focused outreach and enrollment efforts. Loss of CHIP funding, repeal of the ACA, and broad restructuring of Medicaid all have the potential to move backward on these gains and significantly increase the number of uninsured children. Moreover, rollbacks of the ACA Medicaid and Marketplace coverage expansions for parents could negatively affect coverage of children, given that children are more likely to have coverage when their parent is insured.
More limited benefits and higher out-of-pocket costs for children’s coverage. Medicaid and CHIP have benefit packages designed to meet the needs of children, which provide more comprehensive benefits and cost protections compared to private plans. Medicaid’s EPSDT benefit provides children access to all medically necessary care, which facilitates pediatricians’ ability to make treatment decisions and supports children’s ability to access needed care. Changes that would move children from Medicaid or CHIP to private plans could result in them having more limited benefits and higher out-of-pocket costs. Moreover, if states are provided increased flexibility around benefits and premiums and cost sharing in Medicaid, children enrolled in Medicaid could receive more limited benefits and face higher costs. Such changes would have the most significant consequences for children with the highest medical needs, particularly if the changes affect the EPSDT benefit. Lastly, the ACA insurance market reforms enhanced benefits and cost protections for children enrolled in private plans. Repeal of those reforms could weaken coverage for children covered through private plans, potentially exposing them to narrower benefits, limits on coverage, and higher costs.
Reduced access to care for children and other long-term effects. Increases in the number of uninsured children and/or narrower benefit packages with higher cost sharing would result in fewer children accessing needed care, including preventive services such as well child visits and immunizations. Research further suggests that reductions in children’s coverage could also have broader long-term negative effects on their health, education, and financial success as adults. Coverage losses or reductions would also lead to increased stress and worry among parents and increased financial pressure on families.
Increased financial pressure on states and providers. The federal matching funds provided through Medicaid and CHIP are central to supporting state capacity to cover low-income children. Loss of CHIP funding would create funding gaps for states. Reductions in federal Medicaid financing could lead to even larger funding gaps given that it is much larger than CHIP. If there are significant reductions in federal funds, states would need to contribute more state funds to maintain existing coverage or make program reductions, which might include reductions in eligibility, benefits, or provider reimbursement levels. Moreover, any coverage losses among children could increase state costs in other areas of state budgets such as programs for uninsured individuals, behavioral health initiatives, and result in increases in uncompensated care costs.
Appendix
Appendix Table 1: Distribution of Children’s Coverage by State, 2015
State
Private
Medicaid/Other Public
Uninsured
United States
53%
41%
5%
Alabama
44%
44%
5%
Alaska
47%
40%
12%
Arizona
38%
46%
13%
Arkansas
41%
51%
6%
California
52%
44%
4%
Colorado
52%
40%
N/A
Connecticut
63%
35%
N/A
Delaware
53%
35%
6%
District of Columbia
45%
49%
4%
Florida
46%
47%
7%
Georgia
45%
45%
8%
Hawaii
47%
45%
5%
Idaho
53%
40%
6%
Illinois
59%
39%
2%
Indiana
55%
40%
5%
Iowa
57%
37%
N/A
Kansas
59%
33%
5%
Kentucky
52%
40%
6%
Louisiana
48%
44%
4%
Maine
47%
47%
N/A
Maryland
65%
28%
5%
Massachusetts
63%
34%
N/A
Michigan
58%
38%
3%
Minnesota
70%
24%
5%
Mississippi
37%
53%
8%
Missouri
64%
30%
5%
Montana
49%
45%
N/A
Nebraska
57%
30%
5%
Nevada
53%
39%
8%
New Hampshire
63%
26%
4%
New Jersey
60%
35%
3%
New Mexico
38%
50%
8%
New York
55%
40%
4%
North Carolina
48%
45%
7%
North Dakota
65%
23%
8%
Ohio
55%
40%
4%
Oklahoma
47%
39%
10%
Oregon
53%
42%
4%
Pennsylvania
58%
37%
4%
Rhode Island
71%
25%
N/A
South Carolina
50%
46%
5%
South Dakota
50%
32%
8%
Tennessee
48%
43%
4%
Texas
48%
43%
9%
Utah
70%
21%
8%
Vermont
53%
45%
N/A
Virginia
60%
33%
7%
Washington
53%
41%
4%
West Virginia
38%
53%
4%
Wisconsin
53%
36%
N/A
Wyoming
68%
26%
6%
NOTE: Estimates with relative standard errors >30% are listed as N/A. Other Public includes those covered under the military or Veterans Administration as well as nonelderly Medicare enrollees.SOURCE: KFF analysis of the March 2016 Current Population Survey, Annual Social and Economic Supplements.
Appendix Table 2: Number of Children Ever Enrolled in Medicaid and CHIP by State, FY 2015
Some of these children have both Medicaid and private insurance. In these cases, Medicaid provides wraparound benefits and cost sharing protections for the private coverage. Marybeth Musumeci, Medicaid and Children with Special Health Care Needs, (Washington, DC: Kaiser Family Foundation, January 2017), https://modern.kff.org/medicaid/issue-brief/medicaid-and-children-with-special-health-care-needs/. ↩︎
Kaiser Family Foundation estimates based on the Census Bureau’s March 2016 Current Population Survey (CPS: Annual Social and Economic Supplements) ↩︎
Michael Perry and Julia Paradise, Enrolling Children in Medicaid and SCHIP: Insights from Focus Groups with Low-Income Parents, (Washington, DC: Kaiser Commission on Medicaid and the Uninsured, May 2007), https://modern.kff.org/wp-content/uploads/2013/01/7640.pdf. ↩︎
Prior to the Affordable Care Act (ACA), people with HIV faced limited access to insurance coverage due to several barriers, including pre-existing condition exclusions, high costs, Medicaid eligibility limitations, and other challenges. Several key provisions of the ACA removed these barriers. With discussion underway about the future of the ACA, including repealing it in full or in part, it is important to understand how the ACA has changed coverage for people with HIV.
This brief provides the first national estimates of changes in insurance coverage among people with HIV since the implementation of the ACA.1,2 It is based on analysis of data from the Centers for Disease Control and Prevention (CDC). We find that coverage increased significantly for people with HIV due to the ACA’s Medicaid expansion; indeed, increased Medicaid coverage in expansion states drove a nationwide increase in coverage for people with HIV. In addition, the share relying on the Ryan White HIV/AIDS Program also increased. To the extent that ACA repeal efforts include elimination of the Medicaid expansion option for states, most people with HIV who gained this type of insurance could be at risk for losing coverage. In addition, elimination of private market protections- such as bans on preexisting condition exclusions and rate setting tied to health status- would also limit access for this population.
Background
Prior to the ACA, many people with HIV faced limited access to insurance coverage due primarily to three types of barriers:
Pre-existing conditions exclusions: Insurance issuers were able to deny individuals coverage based on pre-existing conditions (or perceived future conditions) including but not limited to being HIV positive, and HIV was generally considered an uninsurable condition.3 As a result, in most cases people with HIV were effectively barred from the individual market.
Cost barriers: Even if someone with HIV could obtain private insurance, it was often prohibitively expensive, as rates varied by health status and other factors. In addition, in both the individual and group markets, annual and lifetime limits on coverage posed a particular challenge for people with HIV given the high cost of HIV treatment.
Medicaid eligibility limitations: Prior to the ACA, to qualify for Medicaid in most states, an enrollee had to be both low income and “categorically eligible,” such as being disabled or pregnant, which excluded many low-income adults from coverage. This presented a “catch-22” for many low-income people with HIV who could not qualify for Medicaid until they were already quite sick and disabled, often as a result of advanced HIV and developing AIDS, despite the fact that early access to treatment could help stave off disability and prevent further transmission.4
Several key provisions of the ACA removed these barriers. These include: eliminating pre-existing conditions exclusions; prohibiting private insurers from denying coverage or charging higher premiums to individuals based on their health status; eliminating annual and lifetime benefits limits; and providing subsidies to assist with purchasing private coverage through the Marketplaces for those between 100% and 400% of the federal poverty level (FPL). In addition, the law required states to expand their Medicaid programs to cover eligible individuals below 138% of FPL, basing eligibility on income and residency status alone and addressing the catch-22 described above. Although a June 2012 US Supreme Court decision effectively made Medicaid expansion a state option, to date, 32 states (including DC) have expanded their programs (where an estimated 60% of people with HIV live).5 Still, the ruling meant that individuals who live in non-expansion states and are below 100% FPL fall into what is known as the “coverage gap” – neither eligible for the Medicaid program nor subsidies to make purchasing coverage through the Marketplaces more affordable. It is estimated that there are over 2.5 million individuals in the coverage gap, including thousands with HIV.6
To better understand how the ACA has affected coverage for people with HIV, we analyzed data from the CDC’s Medical Monitoring Project (MMP), a surveillance system that produces nationally representative information about people with HIV who are in care.7 Since the MMP currently surveys only individuals in care, data in this report is not representative of all people with HIV in the United States. We compared insurance coverage of people with HIV in care in 2012, before the implementation of major ACA expansion reforms, to 2014 (full methodology in Appendix B). In this analysis we looked at nationwide changes as well as changes within states that expanded Medicaid and those that did not expand. We also looked at whether the role of the Ryan White Program changed over this period. Since the major coverage reforms under the ACA were implemented in 2014, this data note provides an early glimpse of the insurance changes that have taken place among people with HIV in the ACA era. As was seen across the nation as a whole, it is likely that coverage gains have been greater in the subsequent years.8
Findings
Nationwide. Medicaid coverage of people with HIV in care increased significantly nationwide, rising from 36% in 2012 to 42% in 2014. The gains in Medicaid coverage were driven by those in Medicaid expansion states in the sample (where the uninsurance rate also dropped – see below). A similar increase in Medicaid coverage was not seen in non-expansion states. The share who were uninsured or with private coverage did not change significantly overall.
There were also changes for some subgroups, including by income level, race/ethnicity, and gender (detail available in Appendix A). For example, those below 100% FPL saw Medicaid coverage rates rise from 53% in 2012 to 60% in 2014, a group that also saw a decrease in uninsurance rates (falling from 22% in 2012 to 15% in 2014).
Figure 1: Coverage Changes Among People with HIV in Care, Nationwide, 2012-2014
Medicaid Expansion States. In the Medicaid expansion states sampled, Medicaid coverage rose significantly, from 39% in 2012 to 51% in 2014 and the share uninsured decreased from 13% to 7%.9 Significant differences were also observed among subgroups (see Figure 2, additional detail available in Appendix A).
Figure 2: Coverage Changes Among People with HIV in Care, Medicaid Expansion States Sampled, 2012-2014
Non-expansion States. Among the non-expansion states sampled,10 no significant gains in coverage or drops in the share of the uninsured occurred between 2012 and 2014, though those below 100% FPL saw gains in private insurance, rising from 5% in 2012 to 13% in 2014 (additional detail available in Appendix A).
Figure 3: Changes in Ryan White Reliance Among People with HIV in Care, Nationwide, 2012-2014
Ryan White. The role of the Ryan White Program has increased since implementation of the major coverage reforms under the ACA. Nationwide, the share of people with HIV in care relying on Ryan White rose from 42% in 2012 to 48% in 2014. In particular, the share of those with private insurance relying on the program rose from 23% in 2012 to 38% in 2014. Those with Medicaid also increased their reliance on Ryan White (from 31% in 2012 to 38% in 2014). While the uninsured did not see a significant change in reliance on Ryan White during this period, about 9 in 10 HIV positive uninsured individuals in care were already supported by the program in 2012. Additional coverage changes were observed among some subgroups (see Figure 3, additional detail available in Appendix A).
People with HIV in non-expansion also states saw a significant overall increase in reliance on Ryan White (rising from 42% in 2012 to 55% in 2014) and those with private insurance saw a particularly sharp increase in Ryan White support (rising from 17% to 38% over the same period). In the expansion states sampled, although there was no overall change in reliance on Ryan White, those with private insurance experienced increased reliance on Ryan White support, rising from 27% in 2012 to 39% in 2014.
Discussion
The ACA has played a significant role in increasing insurance coverage for people with HIV through Medicaid expansion. Even though not all states have expanded Medicaid, coverage increases for people with HIV in expansion states drove a nationwide increase. At the same time, there was no significant decrease overall in the share who were uninsured, although this drop was significant in expansion states. This is likely due to the fact that in 2014 53% of people with HIV in non-expansion states had incomes below 100% FPL and fell into the coverage gap11 . Of note, the share relying on Ryan White with Medicaid and private coverage increased, reflecting the program’s significant and growing role in assisting people with HIV who have insurance afford that coverage and providing services that may not be covered such as case management, transportation assistance, and longer more complex provider visits.12
Overall, this analysis suggests that the ACA has had a significant impact on coverage for people with HIV in the U.S., due to Medicaid expansion. To the extent that ACA repeal efforts include elimination of the Medicaid expansion option for states, most people with HIV who gained coverage would likely lose it unless states adopt alternative approaches to retaining the newly covered population in the program.
Appendix A: Tables
Table 1. Insurance Coverage Changes Among People with HIV, 2012-2014
Coverage Type
Nationwide
Medicaid Expansion
Non-Medicaid Expansion
2012
2014
2012
2014
2012
2014
Coverage Type, Overall
Uninsured
18%
14%
13%*
7%*
26%
23%
Private
31%
30%
34%
29%
26%
32%
Medicaid
36%*
42%*
39%*
51%*
31%
28%
Coverage Type, by Gender
Male
Uninsured
19%
14%
14%*
7%*
27%
24%
Private
35%
34%
37%
32%
31%
36%
Medicaid
30%*
37%*
34%*
47%*
24%
23%
Female
Uninsured
17%*
12%*
11%*
6%*
23%
17%
Private
19%
20%
23%
18%
15%*
23%*
Medicaid
52%
54%
57%
65%
47%
41%
Coverage Type, by Income
<100% FPL
Uninsured
22%*
15%*
16%*
7%*
30%
26%
Private
10%
11%
14%*
10%*
5%*
13%*
Medicaid
53%*
60%*
58%*
72%*
47%
43%
100-138% FPL
Uninsured
17%
13%
13%*
6%*
23%
24%
Private
17%
22%
18%
18%
16%
26%
Medicaid
45%
43%
51%
56%
37%*
24%*
139-399% FPL
Uninsured
17%
13%
13%*
8%*
23%
20%
Private
46%
48%
48%
46%
43%
51%
Medicaid
19%
21%
22%
28%
15%
11%
400%+ FPL
Uninsured
4%
–
–
–
7%
–
Private
87%
90%
87%
91%
86%
89%
Medicaid
–
4%
–
5%
–
–
Coverage Type, by Race/Ethnicity
White
Uninsured
12%*
7%*
8%*
2%*
19%
16%
Private
47%
44%
49%
45%
44%
44%
Medicaid
25%*
34%*
26%*
39%*
22%
24%
Black
Uninsured
21%*
14%*
13%*
5%*
29%*
22%*
Private
21%
25%
24%
19%
18%*
29%*
Medicaid
47%
48%
52%*
63%*
42%
35%
Hispanic
Uninsured
25%
22%
24%*
17%*
26%
30%
Private
22%
21%
23%
19%
20%
24%
Medicaid
32%
39%
41%*
52%*
17%
17%
* Indicates coverage changes statistically significant at p<.05
Note: Medicaid expansion and non-Medicaid expansion data only representative of states sampled and are not generalizable to all states with that expansion decision. Medicaid expansion states sampled are DE, IL, IN, MI, NJ, NY, OR, PA, WA, and CA. The non-expansion states sampled are FL, GA, MS, NC, VA, and TX.
Table 2. Ryan White Coverage Changes Among People with HIV, 2012-2014
Coverage Type
Nationwide
Medicaid Expansion
Non-Medicaid Expansion
2012
2014
2012
2014
2012
2014
Coverage Type, Overall
Uninsured
88%
91%
90%
88%
87%
92%
Private
23%*
38%*
27%*
39%*
17%*
38%*
Medicaid
31%*
38%*
32%
36%
30%
42%
Total
42%*
48%*
42%
43%
42%*
55%*
Coverage Type, by Gender
Male
Uninsured
89%
90%
91%
88%
87%
91%
Private
23%*
38%*
28%*
38%*
15%*
38%*
Medicaid
36%*
43%*
37%
42%
33%
47%
Female
Uninsured
89%
91%
85%
86%
91%
93%
Private
23%*
39%*
23%*
46%*
23%
34%
Medicaid
24%
27%
23%
23%
25%
34%
Coverage Type, by Income
<100% FPL
Uninsured
88%
92%
88%
87%
89%
93%
Private
33%*
56%*
31%*
52%*
40%*
60%*
Medicaid
28%
34%
29%
31%
26%*
42%*
100-138% FPL
Uninsured
87%
87%
86%
84%
87%
88%
Private
44%
61%
45%*
75%*
43%
47%
Medicaid
36%*
49%*
36%*
51%*
35%
41%
139-399% FPL
Uninsured
92%
89%
94%
88%
89%
90%
Private
31%*
45%*
37%*
49%*
21%*
41%*
Medicaid
44%
50%
46%
53%
–
42%
400%+ FPL
Uninsured
83%
100%
100%
100%
73%
100%
Private
8%
9%
12%
11%
–
–
Medicaid
44%
–
50%
–
–
–
Coverage Type, by Race/Ethnicity
White
Uninsured
91%
90%
91%*
70%*
91%*
96%*
Private
21%*
35%*
26%*
36%*
–
33%
Medicaid
40%*
54%*
41%
53%
–
58%
Black
Uninsured
87%
87%
87%
79%
88%
89%
Private
25%*
41%*
28%*
40%*
21%*
42%*
Medicaid
29%
33%
30%
29%
27%
39%
Hispanic
Uninsured
87%*
95%*
93%
94%
79%*
95%*
Private
24%*
40%*
25%*
45%*
23%
34%
Medicaid
27%
30%
26%
29%
–
38%
* Indicates coverage changes statistically significant at p<.05Note: Medicaid expansion and non-Medicaid expansion data only representative of states sampled and are not generalizable to all states with that expansion decision. Medicaid expansion and non-Medicaid expansion data only representative of states sampled and are not generalizable to all states with that expansion decision. Medicaid expansion states sampled are DE, IL, IN, MI, NJ, NY, OR, PA, WA, and CA. The non-expansion states sampled are FL, GA, MS, NC, VA, and TX.
Appendix B: Methods
DATA SOURCE:
This analysis relies on data from the Medical Monitoring Project (MMP), a CDC surveillance system designed to produce nationally representative estimates of behavioral and clinical characteristics of HIV-infected adults (those aged 18 and older) in the United States.13 During 2009–2014, MMP employed a three-stage, complex sampling design in which US states and territories were sampled, followed by facilities providing outpatient HIV clinical care in those jurisdictions, and then HIV-infected adults (aged 18 years and older) receiving care in those facilities. We used MMP data collected from adults with at least one HIV clinical care visit to participating facilities during January to April of 2013 and 2014. Findings describe adults receiving HIV clinical care during these time periods.
Data used in this analysis were collected via face-to-face interviews and medical record abstractions between June 1, 2012 and May 31, 2013 for the 2012 cycle and June 1, 2014 and May 31, 2015 for the 2014 cycle. All sampled states and territories participated in MMP. In 2012, of 548 sampled facilities within these states or territories, 467 participated in MMP (facility response rate 85%), and of 9,394 sampled persons, 4,901 completed both an interview and a linked medical record abstraction (adjusted patient-level response rate 53%)%.14 In 2014, of 561 sampled facilities within these states or territories, 485 participated in MMP (facility response rate 86%), and of 9,400 sampled persons, 5,154 completed both an interview and a linked medical record abstraction (adjusted patient-level response rate 56%).15 Data were weighted based on known probabilities of selection at state or territory, facility, and patient levels. In addition, data were weighted to adjust for non-response using predictors of patient-level response. Although characteristics associated with nonresponse varied over time, the following characteristics were generally associated with nonresponse and informed weighting classes: facility size, private practice, younger age, black and Hispanic race, and shorter time since HIV diagnosis. This analysis includes information on 4,901 participants in 2012 and 5,154 in 2014 who represent all HIV positive individuals receiving care in the United States and Puerto Rico during the time in which they were sampled.
ANALYSIS:
For all respondents in MMP, we examined self-reported insurance coverage as well as payment source for antiretroviral medicines using responses to the following questions “During the past 12 months, what were all the kinds of health insurance or health coverage you had?” and “During the past 12 months, what were the ways your antiretroviral medicines were paid for?” Response options included insurance programs (Medicaid, Medicare, private insurance, Veteran’s Administration, Tricare or CHAMPUS coverage, other public insurance, and other unspecified insurance) as well as medical care, medications and other services paid for by the Ryan White HIV/AIDS Program (Ryan White or the AIDS Drug Assistance Program). “Other specify” responses were extensively recoded to reflect the most accurate coverage type when possible. It is important to note that patients may not be aware of all the services they receive that are paid for by the Ryan White HIV/AIDS Program (the program provides funding directly to service organizations in many cases) and therefore, the estimates of the number of individuals who receive Ryan White HIV/AIDS Program services is likely an underestimate.
We estimated weighted percentages of individuals with the following types of health care coverage: no coverage (uninsured), private insurance, Medicaid, Medicare, and other (specified). Because respondents in MMP may indicate more than one type of coverage, we relied on a hierarchy to group people into mutually-exclusive coverage categories. Specifically, the hierarchy groups people into coverage types in the following order:
Private coverage
Medicaid coverage, including those dually eligible for Medicare
Medicare coverage only
Other public coverage, including Tricare/CHAMPUS, Veteran’s Administration, or city/county coverage
In most cases, this hierarchy classifies individuals according to the coverage source that serves as their primary payer. People who do not report any of the sources of insurance coverage above are classified as uninsured. As noted above, we separately assess weighted percentages of persons receiving assistance through the Ryan White HIV/AIDS Program by health coverage type. This analysis depicts coverage for those who are uninsured, covered by private insurance, or covered by Medicaid. Findings related to those with other coverage or Medicare were excluded from this analysis given that insurance changes within those categories would not have been impacted by the ACA provisions examined for this work.
We assessed distributions of health coverage type in 2012 compared to 2014, overall and by whether the participant lived in a Medicaid expansion or non-Medicaid expansion state (as of 2014). We further stratified the analysis to examine health coverage types by income, race/ethnicity, and gender. Income is presented as a share of the federal poverty level (FPL); race/ethnicity, and gender was self-reported. Statistical comparisons between the percentage of the population with a particular health coverage type and the percentage receiving Ryan White HIV/AIDS Program assistance in 2012 compared to 2014 were made using chi-square tests.
LIMITATIONS:
MMP is nationally representative only of those with HIV who are in care and does not include those who are diagnosed but not in care or those not yet diagnosed. (MMP is now including those who are diagnosed but not in care in the sample and that data will be available in the future).
MMP only allows for extrapolation to the national level when using the full sample. However, similar extrapolation is not possible when examining coverage changes in and contrasting Medicaid expansion states and non-expansion states. The Medicaid expansion and non-expansion coverage data presented here are representative only of the subset of states sampled that fell into each group.16
It is also important to note that these data reflect only the first two open enrollment periods of the ACA and therefore it is possible that coverage has continued to increase (as it has for the U.S. population overall).
The MMP categorized gender as male, female, or transgender based on self-identification. Participants are also classified as transgender if reported sex at birth and current reported gender differ. Findings by gender are presented only by male and female categories in this analysis due to the limited sample size of transgender individuals and the fact that no coverage changes among this population met statistical significance.
CDC, special data request, October 16, 2013 and Bradley H, Prejean J, Dawson L, Kates, J, Shouse RL. Health care coverage and viral suppression pre- and post-ACA implementation. Poster (#1012) presented at: the Conference on Retroviruses and Opportunistic Infections (CROI) 2017; February 14, 2017; Seattle, WA. ↩︎
A subset of the data presented here was also released at the 2017 annual Conference on Retroviruses and Opportunistic Infections (CROI) in February 2017. ↩︎
For the 2014 data, MMP only collected information on those in care. The MMP is now including those who are diagnosed but not in care in the sample and that data will be available in the future ↩︎
The Medicaid expansion states sampled by the MMP are Delaware, Illinois, Indiana, Michigan, New Jersey, New York, Oregon, Pennsylvania, Washington and California. ↩︎
The non-expansion states sampled by the MMP are Florida, Georgia, Mississippi, North Carolina, Virginia and Texas. ↩︎
An Institute of Medicine report commissioned by the White House recommended MMP to help identify data sources for monitoring the effects of the Affordable Care Act (ACA) on HIV care and coverage in the United States. See: IOM (Institute of Medicine). 2012. Monitoring HIV care in the United States: A strategy for generating national estimates of HIV care and coverage. Washington, DC: The National Academies Press. ↩︎
Centers for Disease Control and Prevention. Behavioral and Clinical Characteristics of Persons Receiving Medical Care for HIV Infection—Medical Monitoring Project, United States, 2014 Cycle (June 2014–May 2015). HIV Surveillance Special Report 17. December 2016. Available at: https://www.cdc.gov/hiv/pdf/library/reports/surveillance/cdc-hiv-hssr-mmp-2014.pdf. ↩︎
The Medicaid expansion states sampled by the MMP are Delaware, Illinois, Indiana, Michigan, New Jersey, New York, Oregon, Pennsylvania, Washington and California. The non-expansion states sampled by the MMP are Florida, Georgia, Mississippi, North Carolina, Virginia and Texas. ↩︎
As Congress moves to repeal the Affordable Care Act, a new analysis from the Kaiser Family Foundation provides the first national estimates of changes in health coverage for people with HIV since the law was implemented. It finds that rolling back the law’s Medicaid expansion could significantly impact coverage for people with HIV.
Nationwide, Medicaid coverage for people with HIV in care rose six percentage points between 2012 to 2014, when ACA coverage expansions took effect, the analysis finds. That increase was largely driven by states that expanded Medicaid, where Medicaid coverage rose by 12 percentage points over the same period. Those in Medicaid expansion states also saw the share of people with HIV who are uninsured drop from 13 percent to 7 percent. States that did not expand Medicaid saw no significant changes in coverage for people with HIV during this time.
The analysis also finds that an increasing share of people with HIV in care rely on the Ryan White HIV/AIDS Program, rising from 42 percent in 2012 to 48 percent in 2014. Ryan White reliance for those with private insurance increased by 15 percentage points, and by 7 percentage points for those with Medicaid, demonstrating the ongoing role of the program in the ACA era