KFF designs, conducts and analyzes original public opinion and survey research on Americans’ attitudes, knowledge, and experiences with the health care system to help amplify the public’s voice in major national debates.
Donor government funding to support HIV efforts in low- and middle-income countries decreased by US$511 million from US$7.5 billion in 2015 to US$7 billion in 2016, finds a new report from the Kaiser Family Foundation and the Joint United Nations Programme on HIV/AIDS (UNAIDS). This marks the second successive year of declines, and is the lowest level since 2010.
The decrease stems from actual cuts in funding (accounting for an approximate net 50% of the decline), exchange rate fluctuations (20%), and the timing of U.S. contributions to the Global Fund to Fight AIDS, Tuberculosis and Malaria (30%), due to U.S. law that limits its funding to one-third of total contributions to the Global Fund.
In 2016, bilateral funding decreased by slightly more than US$100 million, falling for nine of 14 donors profiled (seven of which declined in currency of origin). Multilateral contributions fell by US$400 million. As noted above, some of this was due to U.S. legislative limitations on Global Fund contributions. However, some was due to donor decisions to front-load their funding early in the 2014-2016 Global Fund pledge period.
“AIDS investments provide exceptional value for money. We have wisely invested in providing life-saving HIV treatment and prevention services for millions of people and are seeing the results of those investments today,” said Michel Sidibé, UNAIDS Executive Director. “Declining international resources will hamper our ability to reach the 17 million people who still need treatment.”
“Donor government funding for HIV continues to be on the decline,” said Kaiser Family Foundation Vice President Jen Kates, Director of Global Health and HIV Policy. “Recent proposed cuts from the U.S., amidst other competing demands on donor budgets, will likely contribute to an ongoing climate of uncertainty around funding for HIV going forward.”
The U.S. continued to be the largest donor to HIV efforts, providing US$4.9 billion in 2016, followed by the U.K., France, the Netherlands, and Germany. When standardized by size of its economy, however, the U.S. ranked third.
The new report, produced as a partnership between the Kaiser Family Foundation and UNAIDS, provides the latest data available on donor government funding based on data provided by governments. It includes their bilateral assistance to low- and middle-income countries and contributions to the Global Fund as well as UNITAID. “Donor government funding” refers to disbursements, or payments, made by donors. Donor contributions to multilateral organizations are counted as part of their disbursements.
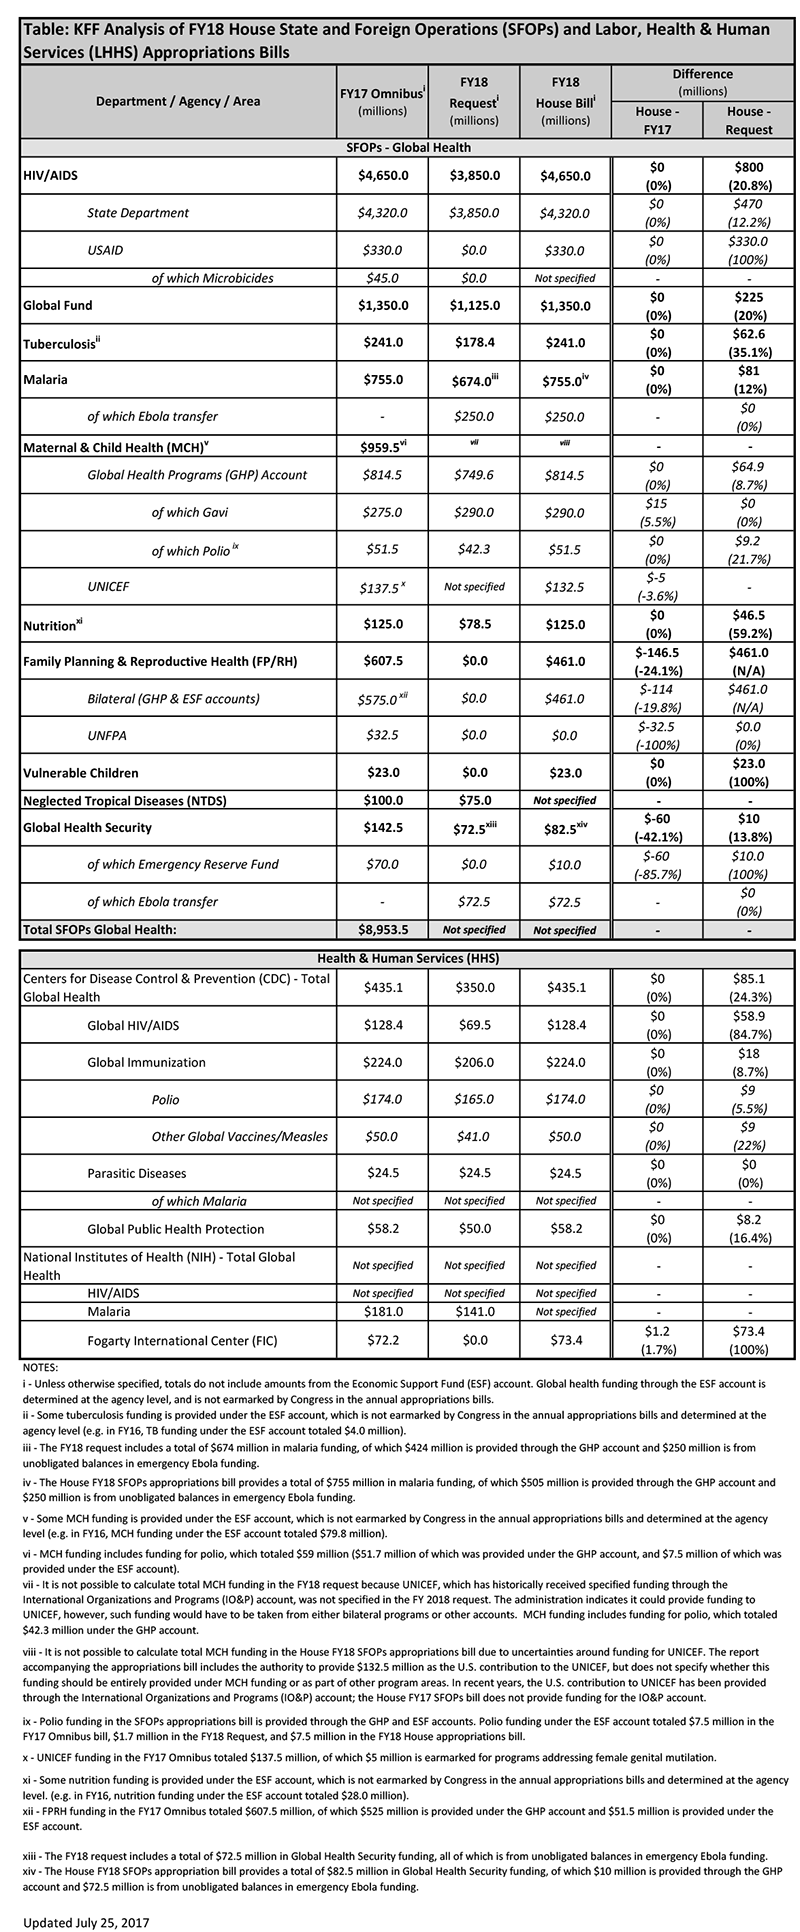
On July 19, 2017, the House Committee on Appropriations approved both the FY 2018 State & Foreign Operations (SFOPs) and the FY 2018 Labor, Health & Human Services (LHHS) appropriations bills. The SFOPs bill includes funding for U.S. global health programs at the State Department and the U.S. Agency for International Development (USAID), while the LHHS appropriations bill includes funding for global health programs at the Centers for Disease Control and Prevention (CDC) and the National Institutes of Health (NIH).[i]
Key highlights from the bills are as follows (see table for additional detail):
Funding provided to the State Department and USAID through the Global Health Programs (GHP) account, which represents the bulk of global health assistance, totaled $8.3 billion, $404 million (5%) below the FY17 enacted level and $1.8 billion (28%) above the President’s FY 2018 request. Some of this decrease was offset by transfers from unspent emergency Ebola funding.
Funding provided to CDC for global health matched the FY 2017 enacted level ($435.1 million) and was $85.1 million (24%) above the President’s FY 2018 request.
Funding for the Fogarty International Center (FIC) at the National Institutes of Health (NIH) totaled $73.4 million, a slight increase above the FY 2017 enacted levels ($72.5 million); FIC was eliminated in the FY18 Request.
Details on global health funding in the House SFOPs appropriations bill are as follows:
Funding for most global health programs at State and USAID remained flat in the House FY 2018 SFOPs appropriations bill compared to the FY 2017 enacted level; funding for all program areas were above the President’s FY 2018 Request.
Bilateral HIV funding through the President’s Emergency Plan for AIDS Relief (PEPFAR) is $4,650 million in the House FY18 bill, matching the FY17 level and $800 million above the President’s FY 2018 request.
The bill included $1,350 million as the U.S. contribution to the Global Fund to Fight AIDS, Tuberculosis and Malaria (Global Fund), matching the FY17 level and $225 million above the President’s FY 2018 request.
Funding for tuberculosis totaled $241 million, matching the FY17 level and $62.6 million above the FY 2018 request.
While the bill provides a total of $755 million for malaria activities, matching the prior year level; $250 million of this total is provided through a one-time transfer of unspent emergency Ebola funding.
The bill provides $82.5 million in total funding for Global Health Security (GHS), of which $72.5 million provided through a one-time transfer of unspent emergency Ebola funding. The FY18 GHS total funding level is $60 million below the FY17 level and $10 million above the FY18 Request.
The bill includes $814.5 billion for maternal and child health (MCH), matching the FY17 level and $65 million above the FY18 Request.
Gavi, the Vaccine Alliance, which is included under maternal and child health (MCH) funding, was $15 million above the FY 2017 enacted level ($275 million) and matched the President’s FY 2018 request ($290 million).
The bill includes the authority to provide $132.5 million as the U.S. contribution to the UNICEF, but does not specify whether this funding should be provided under MCH funding or as part of other program areas. In recent years, the U.S. contribution to UNICEF has been provided through the International Organizations and Programs (IO&P) account; the House FY17 SFOPs bill does not provide funding for the IO&P account.
Funding for nutrition totaled $125 million in the bill, matching the FY17 level and $46.5 million (59%) above the FY 2018 request.
Funding for vulnerable children totaled $23 million, matching the FY17 level. Funding for vulnerable children was eliminated in the FY 2018 request.
Funding for neglected tropical diseases (NTDs) was not specified in the bill.
Bilateral Family Planning and Reproductive Health (FP/RH) funding in the bill totaled $461 million from all accounts, which is $114 million below the FY17 enacted level ($575 million); funding for FP/RH was eliminated in the FY18 Request.
The SFOPs bill also included the following policy provisions:
Seeks to codify the expanded Mexico City Policy (also known as the “Global Gag Rule”) in law, as reinstated by President Trump via executive order on January 22, 2017.
Prohibits funding for the United Nations Population Fund (UNFPA). In FY17, Congress provided $32.5 million for the U.S. contribution to UNFPA, but the administration invoked the Kemp-Kasten amendment to withhold funding for UNFPA (see here for more information on Kemp-Kasten).
The table (.xls) below compares the FY 2018 House SFOPs and LHHS appropriations bills to the FY 2017 enacted funding amounts as outlined in the “Consolidated Appropriations Act, 2017” (P.L. 115-31; KFF summary here) and President’s FY 2018 request (KFF summary here).
[i] Total funding for global health is not currently available as some funding provided through USAID and DoD is not yet available.
The Senate recently considered legislation called the Better Care Reconciliation Act of 2017 (BCRA), proposed on June 22, 2017 and revised on July 13, 2017 and July 20, 2017. This bill differs in some ways from the American Health Care Act (AHCA) that passed in the House in May 2017 but maintains a similar overall framework in its treatment of Medicaid. While referred to as legislation to repeal and replace the Affordable Care Act (ACA), both the BCRA and the AHCA make more fundamental changes to Medicaid by phasing out the enhanced federal matching funds for the ACA Medicaid expansion and by setting a limit on federal funding through a per capita cap or, at state option, a block grant for some enrollees.
This brief provides national and state-by-state estimates of the reductions in federal spending for the period 2020-2029 and for 2029 in order to see the full effect of policy changes over a ten-year period. We chose these years because the major Medicaid policy provisions in BCRA begin in 2020, and the effect of federal funding policies changes over time. We analyze the effect of two main provisions of the BCRA:
The phase-out of enhanced federal funding for the ACA expansion from 90% to the state’s regular federal share of Medicaid spending (called the federal medical assistance percentage, or FMAP)
The use of a per enrollee cap on federal funds for most enrollees, including those covered through the ACA expansion.
We examine changes in federal spending under two possible scenarios of state responses to the BCRA: (1) states maintain their programs and fill in the loss of federal dollars, in which we show how much states would have to spend to make up the loss of federal dollars; and (2) states that expanded Medicaid under the ACA fully drop their expansions, in which we show the additional loss of federal dollars that the state would have received had it maintained its expansion. This analysis thus differs from the estimates produced by the Congressional Budget Office (CBO), which assumes future coverage expansions and accounts for varied behavioral responses from both individuals and states. An overview of the methods underlying the analysis is provided in the “Methods” box at the end of the brief.
Figure 1: Estimated Change in Federal Medicaid Spending under the BCRA, 2020-2029 (in billions)
We estimate that reductions in federal spending over the 2020-2029 period could be $519 billion if states maintain coverage and fill in gaps in federal funding reductions as a result of the decrease FMAP for the expansion and the imposition of a per enrollee cap. Of this amount, $302 billion is attributable to the phase-out of the enhanced FMAP for the expansion population and $218 billion from the per enrollee caps applied to all eligibility groups, including expansion adults (Figure 1). However, the relative contribution of the changes in FMAP and per enrollee cap changes over time, with the cap accounting for a larger share of the decline in federal dollars as per enrollee caps become more binding. State-by-state changes would vary greatly depending on the current size of the state’s Medicaid program, whether or not the state expanded Medicaid under the ACA, and the FMAP for the state (Table 1). In addition, if in response to the reduction in federal support for the expansion, all states fully roll back coverage for the expansion population, federal funding would decline by an additional $685 billion over the 2020-2029 period to reach a change in federal funds of -$1.2 trillion and result in the loss of coverage for 19 million enrollees covered through the expansion(Table 3). Though it is unlikely that all expansion states would immediately fully eliminate the expansion, these estimates provide a projection of the federal funds at risk.
While this analysis provides estimates of the potential scope of changes under the law, actual state experiences may differ if key factors, such as the inflation factors used under the BCRA or baseline Medicaid growth, differ from current predictions. In addition, it is difficult to predict how states would respond to the financing changes. We did not model additional behavioral responses, such as elimination of high cost coverage pathways, cuts in provider rates or changes in scope of benefits, that could result in further reductions in spending and coverage compared to current law. Alternatively, some states could opt for the block grant and implement more significant reductions in coverage or benefits compared to current law. This analysis did not examine the potential implications of the optional block grant for expansion and/or other adults or the provisions to equalize state per enrollee spending over time.
Issue Brief
Medicaid Changes under the BCRA and Possible State Responses
Our analysis examines the changes in the BCRA that would phase out the enhanced matching rate for the ACA Medicaid expansion and limit federal Medicaid spending to a capped amount per enrollee for five eligibility groups (expansion adults, other adults, children, the elderly and people with disabilities). First, under the BCRA, for states that adopted the expansion as of March 1, 2017, the enhanced federal match would phase out from 90% in 2020 to 85% in 2021, 80% in 2022, 75% in 2023 and then to the regular state match rate in 2024 and beyond. This phase out lowers federal Medicaid spending relative to current law, under which federal financing for the expansion population would remain at 90% in 2020 and in subsequent years.
Second, under the BCRA, federal Medicaid spending for most enrollees would be limited to a set amount per enrollee. To establish these limits, states would use data from FY 2014-2016 to develop base year per enrollee spending that would be inflated to 2019 based on the medical component of the consumer price index (CPI-M). Beginning in 2020, federal spending would be limited to the federal share of spending based on per enrollee amounts calculated by inflating the base year spending by CPI-M for children and adults and CPI-M plus one percentage point for the elderly and disabled. Beginning in 2025, all per enrollee limits would be increased by general inflation (CPI-U). Certain spending and populations would be excluded from the per enrollee caps, including enrollees who do not receive the full scope of Medicaid benefits.
States could respond to these changes in federal policy in several ways. We examine changes in federal Medicaid spending under two possible scenarios of state responses: (1) All states, both expansion states and non-expansion states, fill gaps in the loss of federal funding and maintain coverage, including the ACA Medicaid expansion coverage, and (2) states that expanded Medicaid under the ACA fully drop their expansions but maintain spending and coverage for other groups, resulting in declines in both federal and state spending. In the second scenario, we model the loss of federal dollars that the state would have received had it fully maintained its expansion.
Key Findings
Estimated Changes, 2020-2029
Our analysis shows that federal spending over the 2020-2029 period would be reduced by $519 billion if states fill in the loss of federal funds, a 10% reduction in federal funds compared to federal funding projections under current law. Of this amount, $302 billion is attributable to the phase-out of the enhanced FMAP for the expansion population and $218 billion from the per enrollee caps that apply to all enrollment groups, including expansion adults (Figure 2).
Figure 2: Estimated Change in Federal Medicaid Spending under the BCRA, 2020-2029 (in billions)
Examining the reductions by group shows that most of the federal reductions would be for spending for ACA expansion adults ($345 billion). This reduction is much larger than the reduction for other groups because it accounts for the phase-out of the enhanced matching funds as well as limiting growth on per enrollee spending. Together, these changes across all population groups would result in a 31% reduction in federal funds relative to spending under current law. Over the ten year period, per enrollee caps also would result in reductions in federal funding for all groups except for the aged (Figure 3).
Figure 3: Estimated Change in Federal Medicaid Spending under the BCRA, 2020-2029 (in billions)
Generally, prior to 2025, the per enrollee growth limits for the aged in the BCRA would be higher than anticipated growth in per enrollee costs under current law. This analysis assumes that states could use the higher amounts for the aged to offset lower spending in other groups. However, because states still need to match federal spending under the BCRA, it is unclear whether this will occur. If states do not provide additional state matching dollars to access these funds, then overall federal reductions could be $73.4 billion lower over the 2020-2029 period.
State-by-state changes would vary greatly depending on the current size of the state’s Medicaid program, its case mix of enrollment across eligibility groups, and whether or not the state expanded Medicaid under the ACA (Table 1).
Estimated Changes, 2029
In the last year of our analysis, 2029, we estimate that the reductions in federal funds would be $114 billion (a 16% decline) if states maintain their programs. Of this amount, $50 billion is attributable to the phase-out of the enhanced FMAP for the expansion population and $64 billion from the per enrollee caps for all groups, including the expansion population (Figure 4 and Table 2). The relative contribution of the changes in FMAP and per enrollee cap changes over time, with the cap accounting for a larger share of the decline in federal dollars as per enrollee caps become more binding. This result is similarly seen in the estimates by eligibility group under Scenario 1 (Figure 5), which show that the reductions across groups in the last year would be a higher percentage reduction than over the ten-year period for all groups except the aged. Limits or caps in per enrollee spending for the aged would still not be binding in 2029, although caps would likely become binding for this group very soon after 2029 as growth per enrollee is limited to the CPI-U inflation factor. (Figure 5)
Figure 4: Estimated Change in Federal Medicaid Spending under the BCRA, 2029 (in billions)Figure 5: Estimated Change in Federal Medicaid Spending under the BCRA, 2029 (in billions)
Estimated Changes if States Drop the ACA Medicaid Expansion
If states that expanded their Medicaid programs drop the expansion in response to the loss of enhanced federal financing, the change in federal funds to states relative to current law would be even larger. We estimate that states could forgo an additional $685 billion over the 2020-2029 period due to dropping their expansion (Figure 6 and Table 3), bringing the total decline in federal funds to $1.2 trillion. This total would be a 22% decline in federal spending relative to what would happen under current law. These estimates assume no other state responses to the law, such as cuts in provider rates or changes in scope of benefits; if states made other changes to their Medicaid programs, changes in federal spending relative to current law could be even larger. In 2029, states would forgo about an additional $80 billion in federal funds if they drop their expansion, leading to a total decline in federal funds of $194 billion. By 2029, we estimate that nearly 19 million people who would be covered in the expansion group could lose Medicaid coverage if states roll back the expansion, about a 19% drop in Medicaid enrollment. While some of these people may be able to purchase coverage through the individual market, it is likely that such coverage would have prohibitively high deductibles or cost sharing.
Figure 6: Loss of Federal Funds if All States Drop ACA Medicaid Expansion under BCRA ($ Billions), 2020-2029
Discussion
This analysis presents estimates of changes in federal Medicaid funds under the BCRA based on several assumptions. Actual outcomes under the proposed law may differ greatly due to a number of factors.
Uncertainty in inflation index projections. First, increases in federal per enrollee spending limits under the BCRA are based on the consumer price index. While we used current estimates of CPI-M and CPI-U in our analysis, there is uncertainty over what future inflation indices will actually be. If these inflation factors differ from current estimates, changes in federal Medicaid spending could be larger or smaller.
Uncertainty in future Medicaid growth. Similarly, there is substantial uncertainty around future growth rates in Medicaid under current law. We attempted to address this uncertainty by incorporating multiple projections of future growth in Medicaid enrollment and spending per enrollee by eligibility group into our estimates. One limitation of doing so is that existing projections for future Medicaid enrollment and spending are for all enrollees. Our analysis includes only full-benefit enrollees, as partial-benefit enrollees are exempt from the per enrollee caps under BCRA. In the past, per enrollee growth rates for full-benefit enrollees have been higher than those for all enrollees; if this pattern holds in the future as well, our estimates would be conservative, as future spending under current law would be higher than our estimates (leading to greater differences between current law and the BCRA).
We also applied the same growth rates to all states even though historical data indicates state variation in enrollment and spending growth rates. State-by-state changes in Medicaid spending are highly variable and reflect not only state environment but also one-time policy shifts; thus, future state-by-state changes in Medicaid spending are difficult to predict.
Other discretionary changes in BCRA. We do not model all Medicaid provisions in the BCRA, such as the exemption from the per enrollee cap for children who qualify for Medicaid based on a disability, the optional block grant for expansion and/or other adults, or the provisions to equalize state per enrollee spending over time. Several of these provisions give a great deal of discretion to states or to the Secretary, and it is difficult to predict how they will be implemented.
Additional behavioral responses. Finally, our analysis assumes no other changes in state Medicaid programs as a result of the BCRA other than those explicitly modeled. For example, if states spend over their federal limits under BCRA, they face subsequent penalties and thus have an incentive to stay within the limits. These incentives could lead states to make further reductions in Medicaid (in benefits or other spending) that we did not model. In addition, under a per capita cap, states have incentives to increase enrollment of “lower cost” enrollees in a given group and to decrease enrollment of “high-cost” enrollees. It is unclear how these incentives would affect overall Medicaid enrollment or spending patterns. While we examine two scenarios around the Medicaid expansion decision, it is possible that states would phase-out the expansion or end coverage at different times. These decisions would have national as well as state-by-state implications for federal funding.
While changes to Medicaid under the proposed legislation will be driven by choices at state level, state economies, and other factors going forward, these estimates provide a way to assess the policy challenges states would face if the BCRA provisions were enacted. In the early years of the new policy, declines in federal Medicaid dollars would be concentrated among expansion states largely due to the phase out of the enhanced funds for the ACA expansion. Over time, however, per enrollee caps become more binding, especially in later years when inflation rates are set at the same amount for all groups and all states, and cuts in federal spending affect all states.
Methodology
Methodology
This analysis is based on Kaiser Family Foundation estimates using data from the Medicaid Statistical Information System (MSIS), Medicaid Budget and Expenditure System (MBES), CMS-64, and CMS Office of the Actuary (OACT) and Congressional Budget Office (CBO) projections about future Medicaid spending. We combined these data sources to develop a baseline of future Medicaid enrollment and spending by state under current law; we then applied the policy changes proposed in BCRA—specifically, the phase-down of the enhanced match for expansion enrollees and the use of a per enrollee cap on federal funds for all beneficiaries—to project future spending. Last, we compared estimates for the baseline to the BCRA to estimate changes in federal spending under the bill. These estimates assume that states make no other policy changes to their Medicaid programs other than those explicitly modeled. They therefore differ from estimates from other groups such as the Congressional Budget Office (CBO), which assumes a behavioral response from both states and individuals as a result of the law. Additional details on the methods are provided below.
Baseline Medicaid Enrollment and Spending. We generated estimates of Medicaid enrollment and spending for full-benefit enrollees in FY2016 based on Kaiser Family Foundation analysis of the FY2015 MSIS. We adjusted MSIS spending to CMS-64 spending to account for MSIS undercounts of spending. Because FY2015 MSIS data was missing some or all quarters for some states, we also adjusted the enrollment data using secondary data to represent a full fiscal year of enrollment. We accounted for a state’s expansion status, the number of quarters of missing data, and the state’s historical patterns of spending and enrollment in making state-by-state adjustments, using similar methods we used for estimates forearlier years. Because MSIS does not identify adults who are eligible through the ACA expansion versus pre-ACA pathways, we used the FY2015 MBES data to break out enrollment and spending for Group VIII (ACA expansion) enrollees. We then inflated to FY2016 based on theOACT estimatesof annual changes in enrollment and spending by eligibility group, with the exception of enrollment for Group VIII, which was obtained from the available FY2016 MBES data. In some cases (e.g., states that expanded after FY2015), we made state-specific adjustments to the data.
We used the FY2016 base year data to project future Medicaid enrollment and spending by eligibility group. Because there is uncertainty around future growth rates in Medicaid and estimates vary widely, we used the average of OACT and CBO predictions of future growth in Medicaid enrollment and spending per enrollee by eligibility group. We applied the same growth rates to all states. We calculated the federal/state split in spending by enrollment group for each year based on the relevant FMAP for the eligibility group and year. For non-expansion groups, we used the most recent FMAPs available (FY2018) for all years; for expansion groups, we used the FMAPs for each year as specified under current law, though we did not account for differential match rates for Group VIII enrollees who are not newly eligible and may qualify for a different match rate. Since these projections use national data and uniform growth rates, individual state estimates may be based on state specific data.
Medicaid Spending Under BCRA. Our estimates of spending under BCRA first inflate FY2016 per enrollee spending to FY2019 based on CPI-M as specified in the bill. For FY2020 and on, we apply limits in growth in per enrollee spending as specified in the bill: from FY2020-2024, per enrollee growth is limited to CPI-M for adults and children and CPI-M+1 for aged and disabled; from FY2025 on, per enrollee growth is limited to CPI-U. We use estimates of CPI-M and CPI-U from the CBO.1,2 We calculate the federal/state split in spending by eligibility group for each year based on the FMAPs specified in the bill. For non-expansion groups, we use the most recent FMAPs available (FY2018) for all years; for expansion groups, we used the FMAPs for each year as specified under the bill, which phases down the enhanced matching rate for expansion enrollees over time. We assume no changes in Medicaid enrollment as a result of BCRA other than those explicitly modeled (i.e., some states dropping their ACA Medicaid expansion) and calculate the difference in federal spending compared to the baseline.
State Tables
Table 1: Estimated Change in Federal Medicaid Funds under BCRA, 2020-2029 ($ in millions)
State
Change Due to:
Total Change in Federal Funds
Phase Out of Enhanced Match for ACA Expansion
Per Enrollee Cap on All Groups
US Total
-301,832
-217,563
-519,395
Alabama
N/A
-2,032
-2,032
Alaska
-1,052
-776
-1,827
Arizona
-5,675
-6,129
-11,804
Arkansas
-3,325
-4,137
-7,463
California
-88,549
-31,281
-119,830
Colorado
-6,370
-2,799
-9,169
Connecticut
-6,202
-2,076
-8,278
Delaware
-1,616
-772
-2,389
DC
-785
-1,247
-2,032
Florida
N/A
-7,516
-7,516
Georgia
N/A
-6,634
-6,634
Hawaii
-2,057
-871
-2,929
Idaho
N/A
-930
-930
Illinois
-13,720
-6,141
-19,861
Indiana
-6,692
-4,352
-11,043
Iowa
-2,632
-1,880
-4,512
Kansas
N/A
-1,136
-1,136
Kentucky
-6,613
-5,010
-11,623
Louisiana
-4,264
-3,500
-7,764
Maine
N/A
-1,201
-1,201
Maryland
-7,050
-3,991
-11,042
Massachusetts
-7,582
-6,235
-13,817
Michigan
-9,758
-8,572
-18,330
Minnesota
-8,103
-4,340
-12,443
Mississippi
N/A
-2,458
-2,458
Missouri
N/A
-4,200
-4,200
Montana
-947
-656
-1,603
Nebraska
N/A
-636
-636
Nevada
-2,705
-1,550
-4,255
New Hampshire
-1,353
-663
-2,015
New Jersey
-11,567
-4,689
-16,256
New Mexico
-3,081
-3,229
-6,310
New York
-45,130
-14,139
-59,270
North Carolina
N/A
-6,973
-6,973
North Dakota
-675
-348
-1,023
Ohio
-10,781
-9,739
-20,520
Oklahoma
N/A
-2,580
-2,580
Oregon
-7,919
-3,340
-11,259
Pennsylvania
-17,292
-7,565
-24,857
Rhode Island
-1,911
-968
-2,879
South Carolina
N/A
-3,653
-3,653
South Dakota
N/A
-335
-335
Tennessee
N/A
-5,462
-5,462
Texas
N/A
-15,951
-15,951
Utah
N/A
-1,627
-1,627
Vermont
-1,068
-737
-1,805
Virginia
N/A
-2,899
-2,899
Washington
-13,864
-4,941
-18,805
West Virginia
-1,496
-1,890
-3,386
Wisconsin
N/A
-2,578
-2,578
Wyoming
N/A
-197
-197
NOTE: N/A: State did not expand Medicaid under the ACA. SOURCE: Kaiser Family Foundation estimates, July 2017
Table 2: Estimated Change in Federal Medicaid Funds under BCRA, 2029 ($ in millions)
State
Change Due to:
Total Change in Federal Funds
Phase Out of Enhanced Match for ACA Expansion
Per Enrollee Cap on All Groups
US Total
-49,850
-64,091
-113,941
Alabama
N/A
-539
-539
Alaska
-176
-210
-386
Arizona
-870
-1,794
-2,664
Arkansas
-505
-1,172
-1,677
California
-14,838
-10,232
-25,070
Colorado
-1,067
-879
-1,947
Connecticut
-1,039
-762
-1,801
Delaware
-266
-248
-514
DC
-120
-353
-474
Florida
N/A
-2,008
-2,008
Georgia
N/A
-1,511
-1,511
Hawaii
-340
-281
-621
Idaho
N/A
-232
-232
Illinois
-2,295
-1,937
-4,232
Indiana
-1,058
-1,387
-2,445
Iowa
-430
-568
-999
Kansas
N/A
-298
-298
Kentucky
-1,002
-1,605
-2,608
Louisiana
-681
-1,048
-1,729
Maine
N/A
-309
-309
Maryland
-1,181
-1,183
-2,365
Massachusetts
-1,270
-1,763
-3,033
Michigan
-1,550
-2,467
-4,017
Minnesota
-1,358
-1,303
-2,661
Mississippi
N/A
-634
-634
Missouri
N/A
-1,072
-1,072
Montana
-150
-198
-348
Nebraska
N/A
-171
-171
Nevada
-427
-504
-931
New Hampshire
-227
-203
-429
New Jersey
-1,938
-1,374
-3,312
New Mexico
-462
-955
-1,418
New York
-7,562
-5,351
-12,914
North Carolina
N/A
-1,689
-1,689
North Dakota
-113
-109
-222
Ohio
-1,730
-2,878
-4,609
Oklahoma
N/A
-616
-616
Oregon
-1,266
-1,113
-2,379
Pennsylvania
-2,885
-2,559
-5,444
Rhode Island
-319
-290
-610
South Carolina
N/A
-861
-861
South Dakota
N/A
-85
-85
Tennessee
N/A
-1,321
-1,321
Texas
N/A
-3,790
-3,790
Utah
N/A
-371
-371
Vermont
-177
-207
-385
Virginia
N/A
-745
-745
Washington
-2,323
-1,525
-3,848
West Virginia
-222
-568
-790
Wisconsin
N/A
-760
-760
Wyoming
N/A
-50
-50
NOTE: N/A: State did not expand Medicaid under the ACA. SOURCE: Kaiser Family Foundation estimates, July 2017
Table 3: Impact of Dropping ACA Medicaid Expansion under BCRA among States that Expanded Medicaid as of July 2017, 2020-2029($ Millions)
State
Loss of Federal Funds Due to Phase Out of Enhanced FMAP & Per Enrollee Cap
Additional Loss of Federal Funds if Drop ACA Expansion
Total Loss of Federal Funds
US Total
-519,395
-684,712
-1,204,107
Alaska
-1,827
-1,967
-3,795
Arizona
-11,804
-23,972
-35,775
Arkansas
-7,463
-14,778
-22,240
California
-119,830
-165,638
-285,468
Colorado
-9,169
-11,915
-21,084
Connecticut
-8,278
-11,601
-19,879
Delaware
-2,389
-3,814
-6,203
DC
-2,032
-3,336
-5,368
Hawaii
-2,929
-4,566
-7,494
Illinois
-19,861
-26,336
-46,197
Indiana
-11,043
-23,004
-34,047
Iowa
-4,512
-6,721
-11,233
Kentucky
-11,623
-29,858
-41,481
Louisiana
-7,764
-13,477
-21,241
Maryland
-11,042
-13,188
-24,230
Massachusetts
-13,817
-14,183
-28,000
Michigan
-18,330
-32,351
-50,682
Minnesota
-12,443
-15,157
-27,599
Montana
-1,603
-3,224
-4,827
Nevada
-4,255
-9,368
-13,623
New Hampshire
-2,015
-2,530
-4,545
New Jersey
-16,256
-21,637
-37,892
New Mexico
-6,310
-14,675
-20,985
New York
-59,270
-84,420
-143,689
North Dakota
-1,023
-1,262
-2,285
Ohio
-20,520
-32,774
-53,294
Oregon
-11,259
-24,956
-36,215
Pennsylvania
-24,857
-34,480
-59,337
Rhode Island
-2,879
-3,762
-6,641
Vermont
-1,805
-2,259
-4,064
Washington
-18,805
-25,934
-44,739
West Virginia
-3,386
-7,571
-10,956
NOTE: US Total includes spending in non-expansion states. Figures may not sum due to rounding.SOURCE: Kaiser Family Foundation estimates, July 2017.
Table 4: Impact of Dropping ACA Medicaid Expansion under BCRA among States that Expanded Medicaid as of July 2017, 2029
Loss of Federal Funds Due to Phase Out of Enhanced FMAP & Per Enrollee Cap($ Millions)
Additional Loss of Federal Funds if Drop ACA Expansion($ Millions)
Total Loss of Federal Funds($ Millions)
Change in Medicaid Enrollment Due to Dropping Expansion
% Change in Total Enrollment
US Total
-113,941
-79,724
-193,665
-18,679,000
-19%
Alaska
-386
-220
-607
-41,000
-19%
Arizona
-2,664
-3,024
-5,688
-526,000
-21%
Arkansas
-1,677
-1,872
-3,549
-382,000
-19%
California
-25,070
-18,547
-43,618
-4,448,000
-29%
Colorado
-1,947
-1,334
-3,281
-534,000
-30%
Connecticut
-1,801
-1,299
-3,100
-261,000
-24%
Delaware
-514
-447
-961
-85,000
-31%
DC
-474
-421
-895
-79,000
-23%
Hawaii
-621
-529
-1,151
-138,000
-31%
Illinois
-4,232
-2,966
-7,198
-855,000
-21%
Indiana
-2,445
-2,842
-5,287
-479,000
-31%
Iowa
-999
-798
-1,797
-188,000
-23%
Kentucky
-2,608
-3,788
-6,395
-557,000
-33%
Louisiana
-1,729
-1,649
-3,378
-510,000
-25%
Maryland
-2,365
-1,477
-3,841
-312,000
-21%
Massachusetts
-3,033
-1,588
-4,621
-500,000
-19%
Michigan
-4,017
-3,981
-7,997
-800,000
-25%
Minnesota
-2,661
-1,697
-4,358
-280,000
-19%
Montana
-348
-398
-746
-79,000
-31%
Nevada
-931
-1,158
-2,089
-256,000
-35%
New Hampshire
-429
-283
-713
-66,000
-26%
New Jersey
-3,312
-2,423
-5,735
-694,000
-33%
New Mexico
-1,418
-1,870
-3,287
-305,000
-28%
New York
-12,914
-9,453
-22,367
-2,714,000
-31%
North Dakota
-222
-141
-363
-27,000
-22%
Ohio
-4,609
-3,990
-8,599
-858,000
-21%
Oregon
-2,379
-3,052
-5,431
-692,000
-48%
Pennsylvania
-5,444
-3,915
-9,359
-883,000
-25%
Rhode Island
-610
-426
-1,036
-76,000
-21%
Vermont
-385
-260
-644
-79,000
-33%
Washington
-3,848
-2,904
-6,752
-747,000
-31%
West Virginia
-790
-969
-1,759
-227,000
-30%
NOTE: US Total includes spending in non-expansion states. Figures may not sum due to rounding.SOURCE: Kaiser Family Foundation estimates, July 2017.
The Senate is currently considering the Obamacare Repeal Reconciliation Act of 2017. While there are a number of provisions that affect Medicaid, the primary change would be the elimination of the statutory authority to cover childless adults up to 138% FPL ($16,643 for an individual in 2017) as well as an elimination of the enhanced match rate for the Medicaid expansion.
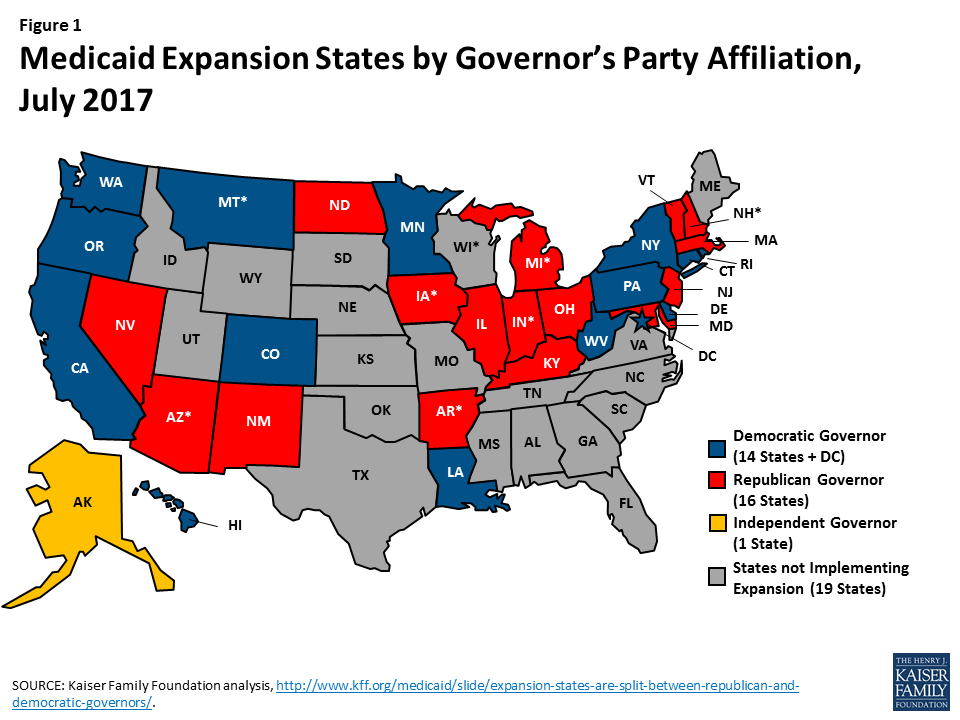
Figure 1: Medicaid Expansion States by Governor’s Party Affiliation, July 2017
A repeal of the Medicaid expansion would have significant coverage and financing implications for the 31 states and the District of Columbia that have implemented the expansion (Figure 1). We estimated changes in federal Medicaid funds and Medicaid coverage for adults covered through the ACA expansion, assuming that the Medicaid expansion would be repealed as of 2020. We assume all states drop all expansion/Group VIII coverage, and the analysis does not account for continuation of expansion coverage in states that had waivers prior to the ACA (more detail on the methods underlying the estimates is in the Methods box below).
Our analysis shows that states would see a $700 billion reduction in federal Medicaid funds over the 2020-2026 period due to the loss of the ACA expansion (Table 1). In the last year of this analysis, 2026, states would see a reduction in federal Medicaid funds of $121 billion and estimated reductions in coverage of 17.6 million (19% of total Medicaid enrollment that year). In 11 states, the loss of the expansion would reduce Medicaid enrollment by 30% or more in 2026. In the absence of other affordable coverage, it is likely that most of these people would become uninsured, which would affect their access to health care services.
Table 1: Potential Loss of Federal Medicaid $ and Medicaid Coverage Under Repeal of ACA Medicaid Expansion, 2020-2026
Loss of Federal $ for Expansion, 2020-2026
Loss of Federal $ for Expansion, 2026
Loss of Expansion Enrollment, 2026
State
$ Millions
$ Millions
#
% Change in Total Enrollment
US total
-700,250
-120,635
-17,627,000
-19%
Alaska
-2,143
-369
-39,000
-19%
Arizona
-21,043
-3,625
-496,000
-21%
Arkansas
-12,850
-2,214
-360,000
-19%
California
-180,423
-31,082
-4,198,000
-28%
Colorado
-12,979
-2,236
-504,000
-29%
Connecticut
-12,637
-2,177
-246,000
-24%
Delaware
-3,855
-664
-80,000
-31%
District of Columbia
-2,925
-504
-74,000
-23%
Hawaii
-4,701
-810
-130,000
-31%
Illinois
-28,432
-4,898
-807,000
-21%
Indiana
-21,078
-3,631
-452,000
-31%
Iowa
-6,639
-1,144
-177,000
-23%
Kentucky
-25,887
-4,460
-525,000
-32%
Louisiana
-12,592
-2,169
-481,000
-24%
Maryland
-14,365
-2,475
-294,000
-20%
Massachusetts
-15,448
-2,661
-472,000
-19%
Michigan
-29,889
-5,149
-755,000
-25%
Minnesota
-16,510
-2,844
-264,000
-18%
Montana
-2,960
-510
-75,000
-30%
Nevada
-8,569
-1,476
-242,000
-34%
New Hampshire
-2,756
-475
-63,000
-26%
New Jersey
-23,568
-4,060
-655,000
-32%
New Mexico
-12,603
-2,171
-288,000
-28%
New York
-91,955
-15,841
-2,562,000
-31%
North Dakota
-1,375
-237
-25,000
-22%
Ohio
-30,915
-5,326
-809,000
-21%
Oregon
-23,335
-4,020
-653,000
-47%
Pennsylvania
-36,748
-6,331
-833,000
-25%
Rhode Island
-4,027
-694
-72,000
-21%
Vermont
-2,362
-407
-75,000
-33%
Washington
-28,249
-4,867
-705,000
-31%
West Virginia
-6,436
-1,109
-214,000
-29%
NOTE: Assumes all states drop all expansion/Group VIII coverage starting in 2020. Does not account for any continuation of expansion coverage in states that had waivers prior to the ACA.
SOURCE: Kaiser Family Foundation estimates, July 2017.
Methods
This analysis is based on Kaiser Family Foundation estimates using data from the Medicaid Statistical Information System (MSIS), Medicaid Budget and Expenditure System (MBES), CMS-64, and CMS Office of the Actuary (OACT) and Congressional Budget Office (CBO) projections about future Medicaid spending.
2016 Base. We generated estimates of Medicaid enrollment and spending for expansion enrollees in FY2016 based on Kaiser Family Foundation analysis of the FY2015 MSIS. We adjusted MSIS spending to CMS-64 spending to account for MSIS undercounts of spending. Because FY2015 MSIS data was missing some or all quarters for some states, we also adjusted the enrollment data using secondary data to represent a full fiscal year of enrollment. We accounted for a state’s expansion status, the number of quarters of missing data, and the state’s historical patterns of spending and enrollment in making state-by-state adjustments, using similar methods we used for estimates for earlier years. Because MSIS does not identify adults who are eligible through the ACA expansion versus pre-ACA pathways, we used the FY2015 MBES data to break out enrollment and spending for Group VIII (ACA expansion) enrollees. We then inflated to FY2016 based on the OACT estimates of annual changes in enrollment and spending by eligibility group, with the exception of enrollment for Group VIII, which was obtained from the available FY2016 MBES data. In some cases (e.g., states that expanded after FY2015), we made state-specific adjustments to the data.
Baseline Projections. We used the FY2016 base year data to project future Medicaid enrollment and spending. Because there is uncertainty around future growth rates in Medicaid and estimates vary widely, we used the average of OACT and CBO predictions of future growth in Medicaid enrollment and spending per enrollee by eligibility group. We applied the same growth rates to all states. We calculated the federal/state split in spending by enrollment group for each year based on the relevant FMAP for the eligibility group and year. For non-expansion groups, we used the most recent FMAPs available (FY2018) for all years; for expansion groups, we used the FMAPs for each year as specified under current law, though we did not account for differential match rates for Group VIII enrollees who are not newly eligible and may qualify for a different match rate. Since these projections use national data and uniform growth rates, state individual state estimates may have more detailed data.
ACA Repeal. For purposes or repealing the ACA, we assume all spending and coverage in the expansion group (Group VIII) are eliminated starting in 2020. These estimates do not assume that states make other changes to maintain this coverage (even for states that had waiver coverage prior to the ACA).
This partnership poll from The Washington Post and the Kaiser Family Foundation examines the views and experiences of people living in small towns and rural areas across the United States, and how they are similar or different from those in urban and suburban settings. It is the 31st in a series of surveys dating back to 1995 that have been conducted as part of the Washington Post/Kaiser Family Foundation Survey Project. In part, the survey was designed to shed light on the political views of those living in rural counties where Donald Trump scored a 26-percentage-point victory over Hillary Clinton in the 2016 presidential election, a substantial increase from Mitt Romney’s 16-point margin over Barack Obama in 2012. In addition to politics, the survey gauges rural Americans’ views of their communities, their sense of shared values, their economic concerns, and their views on issues of race and immigration.
This brief explores where health care fits in rural residents’ political views and also examines how rural Americans’ health care experiences compare with their urban and suburban counterparts. In addition to the survey, Kaiser and The Post conducted two focus groups with rural voters in Ashtabula County, Ohio. Focus group findings related to health care are incorporated in this report; a Washington Post video compilation of the focus groups is available here.
In partnership with The Washington Post, the Kaiser Family Foundation conducted the Survey of Rural America to gauge the views and experiences of people living in small towns and rural areas across the United States, and how they are similar or different from those in urban and suburban settings. In part, the survey was designed to shed light on the political views of those living in rural counties where Donald Trump scored a 26-percentage-point victory over Hillary Clinton in the 2016 presidential election, a substantial increase from Mitt Romney’s 16-point margin over Barack Obama in 2012. In addition to the survey, Kaiser and The Post conducted two focus groups with rural voters: one with people who voted for Mr. Trump in the general election and one with people who voted for Mrs. Clinton or someone else.1 The groups were held in Ashtabula County, Ohio, a rural county that President Obama won by 12 percentage points in 2012 and President Trump won by 19 points in 2016.
This brief explores where health care fits in rural residents’ political views and also examines how rural Americans’ health care experiences compare with their urban and suburban counterparts.
Survey Findings
Health Care as a Problem Facing Rural Communities
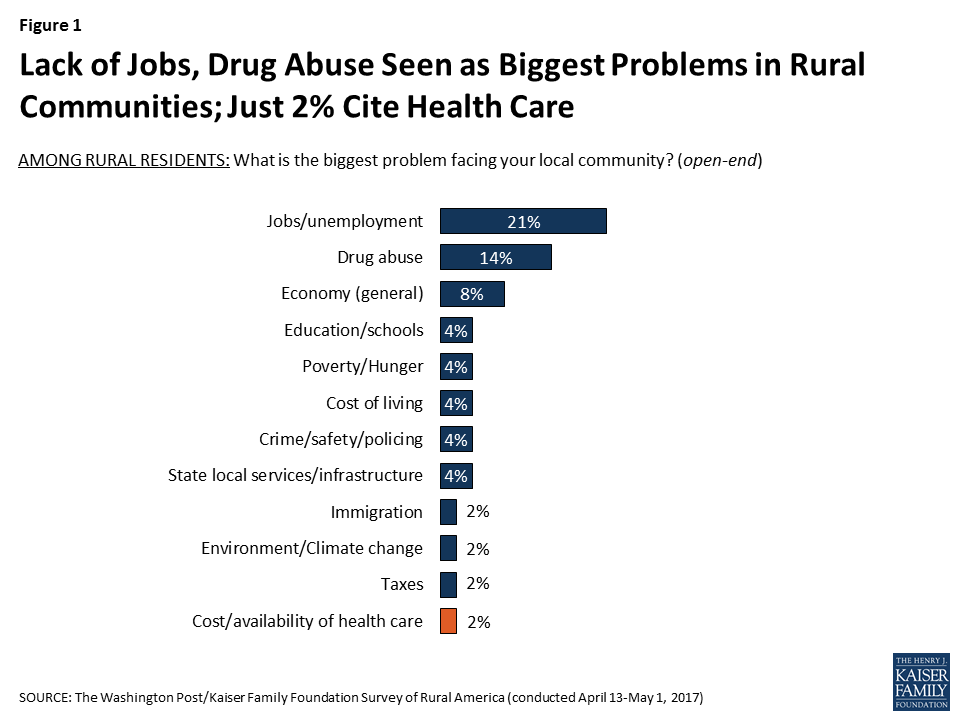
When residents of small towns and rural areas are asked about the biggest problem facing their communities, health care is not high on the list. Lack of jobs is overwhelmingly seen as the top problem in these areas (named by 21 percent in an open-ended question), followed by drug abuse (14 percent) and general concerns about the economy (8 percent). Just 2 percent name the cost or availability of health care as the most pressing problem.
Figure 1: Lack of Jobs, Drug Abuse Seen as Biggest Problems in Rural Communities; Just 2% Cite Health Care
This concern about lack of job opportunities and drug abuse as the main challenges for rural areas was echoed in the focus groups, where participants overwhelmingly mentioned economic decline and drug addiction as the biggest problems in their community. A common theme in both groups was the inability to find jobs paying more than minimum wage, and most participants said they knew someone who had problems with heroin or prescription painkillers.
Focus Group Participants on Job Opportunities:
“The blue-collar jobs are here. If you are a white-collar employee, then that’s not here. That’s not Ashtabula County. But if you are a blue-collar worker, you can get out and shovel sidewalks, you wash dishes, you clean barns…those jobs are there.” – Male, age 45, Trump voter
“Those are 25 hour or 30 hour a week jobs. Finding a 40 hour a week job is almost impossible.” – Male, age 57, Clinton voter
“Definitely in this area, that’s what you have. You have McDonald’s. You have Walmart, You have Family Dollar…you know all those little stores that pay minimum wage. And really, you need 2 or 3 minimum wage jobs to successfully grow your family.” – Female, age 52, Clinton voter
Focus Group Participants on Drug Addiction:
“Seems like everybody knows somebody who has a family member that overdosed on drugs, or in rehab, or something like that.” – Male, age 57, Clinton voter
“Some of the girls that I work with have friends that [say], oh this person had to go to this funeral, had to go to that funeral.” – Female, age 53, Trump voter
“It’s an epidemic, the heroin epidemic. It’s outrageous…It doesn’t matter where you live.” – Female, age 59, Clinton voter
“Why does the public have to pay for drug rehab?” – Male, age 64, Clinton voter
Another participant in response: “I understand what you are saying, but also you are probably just thinking of that stereotypical junkie… I went to a drug rehab and it was because I was prescribed prescription sleeping pills from my doctor and I got so addicted to them… I checked myself into a drug rehab facility cause I had to get that out of my system, and that was my doctor’s fault.” – Female, age 36, Clinton voter
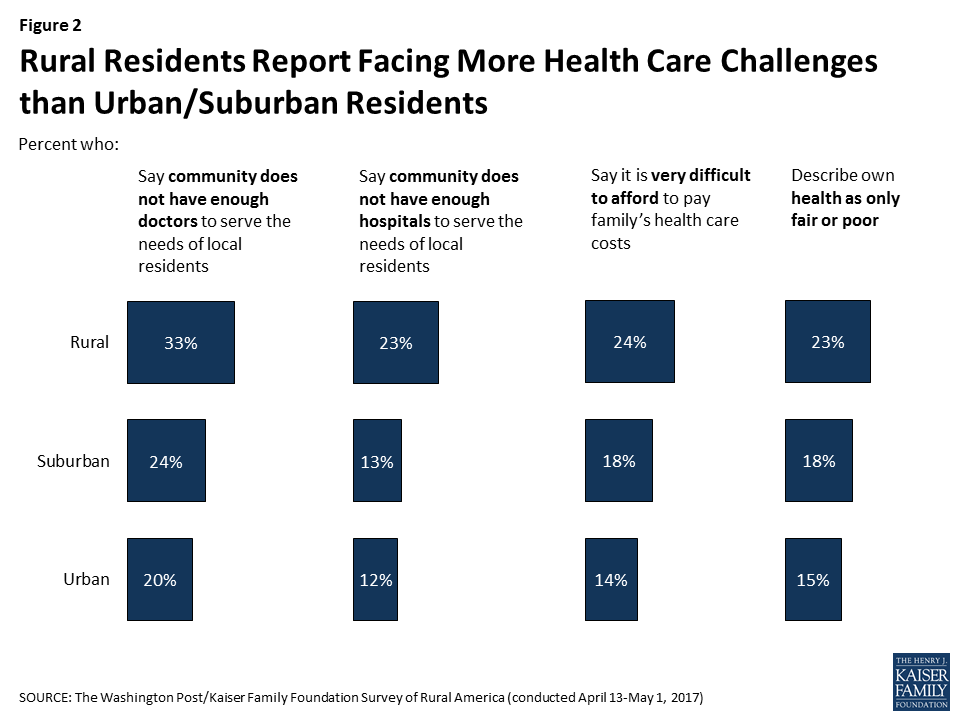
While health care access is not top-of-mind for most residents as the biggest problem in their community, people in small towns and rural areas are more likely than those in urban and suburban areas to report various health care challenges. For example, rural residents are more likely than other Americans to think that their community does not have enough doctors or enough hospitals to serve the needs of local residents2 , to say it is very difficult to afford to pay the cost of their family’s health care, and to describe their own health as only fair or poor. Within rural counties, the uninsured, those with lower incomes, and racial and ethnic minorities are more likely than their counter parts to report struggling with health care access and cost (see Appendix A).
Figure 2: Rural Residents Report Facing More Health Care Challenges than Urban/Suburban Residents
Economic anxiety about affording health care was also echoed in the focus groups.
Focus Group Participants on Health Care Affordability:
“The problem with the health care is that my copays, my deductible, the prescriptions… I pay outrageous amounts because I don’t get assistance.” – Female, age 59, Clinton voter
“I’m grateful I have insurance, but I just see the changes. I’ve seen coverage go from here [indicates a level high in the air] every year to here [indicates a lower level]. Deductibles are high.” – Female, age 50, Trump voter
“I haven’t had health insurance in over 10 years. I’ve only had maybe one or two instances that I’ve had to see somebody and that ended up being $100 out of pocket, which isn’t terrible. Luck’s been on my side at the same time. My son has Medicaid…but my wife doesn’t have anything. We’re just coasting along. I’m hoping to have a good job later on this year that’s going to cover everything.”- Male, age 41, Johnson voter
The Politics of Health Care and Support for ACA Repeal Efforts
Before examining rural Americans’ views on health care policy, it’s important to acknowledge that partisan identification tends to lean more Republican in rural areas than it does in the country as a whole. About three in ten (29 percent) rural residents identify as Republicans – higher than the shares in suburban and urban areas – while about a quarter (26 percent) of those in rural areas consider themselves Democrats (similar to suburban areas but significantly lower than the 37 percent of urban residents who call themselves Democrats).
Table 1: Political Party Affiliation by Urban, Suburban, and Rural Definitions
Generally speaking, do you usually think of yourself as:
Rural
Suburban
Urban
A Democrat
26%
28%
37%
A Republican
29
23
17
An Independent
34
40
32
Something else (Vol.)
5
8
10
Don’t know/Refused
6
1
4
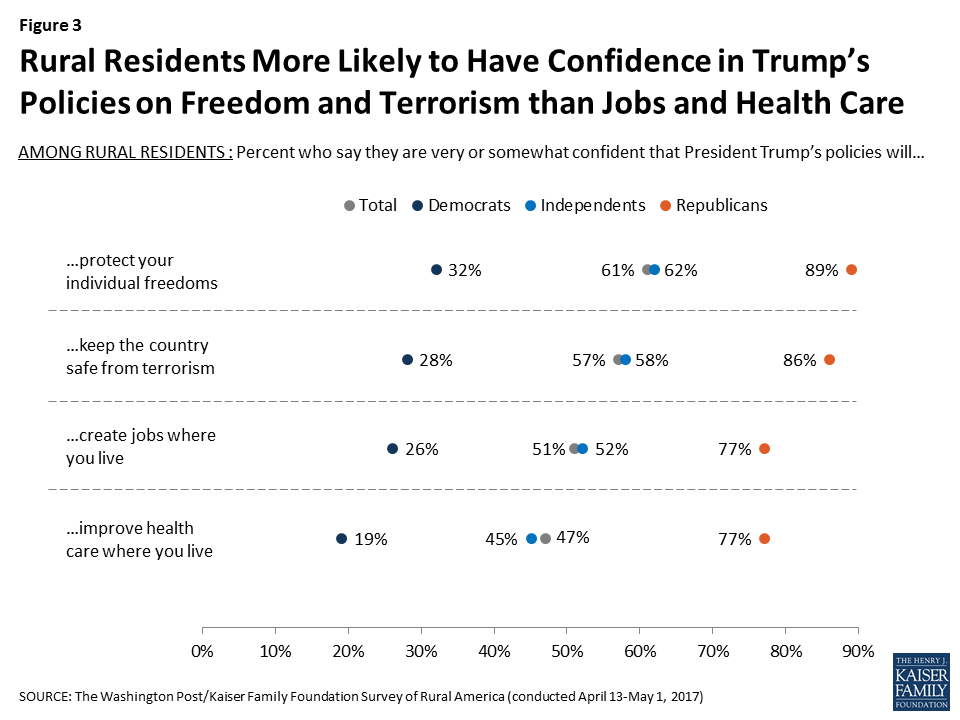
Not surprisingly given their differing partisanship, rural residents are more likely than urban and suburban residents to say they approve of the way Donald Trump is handling his job as president; 54 percent of those living in rural areas say they approve, compared with 44 percent in suburban areas and 32 percent in urban areas. However, rural residents express more confidence in the president’s policies when it comes to preserving freedoms and preventing terrorism than they do in the areas of jobs and health care. While six in ten rural residents say they are very or somewhat confident that President’s Trump’s policies will protect their individual freedoms (61 percent) and keep the country safe from terrorism (57 percent), fewer say they are confident his policies will create jobs (51 percent) or improve health care (47 percent) where they live. Not surprisingly, on each of these measures, Republicans in rural areas are much more likely than Democrats to say they are confident that President Trump’s policies will lead to improvements.
Figure 3: Rural Residents More Likely to Have Confidence in Trump’s Policies on Freedom and Terrorism than Jobs and Health Care
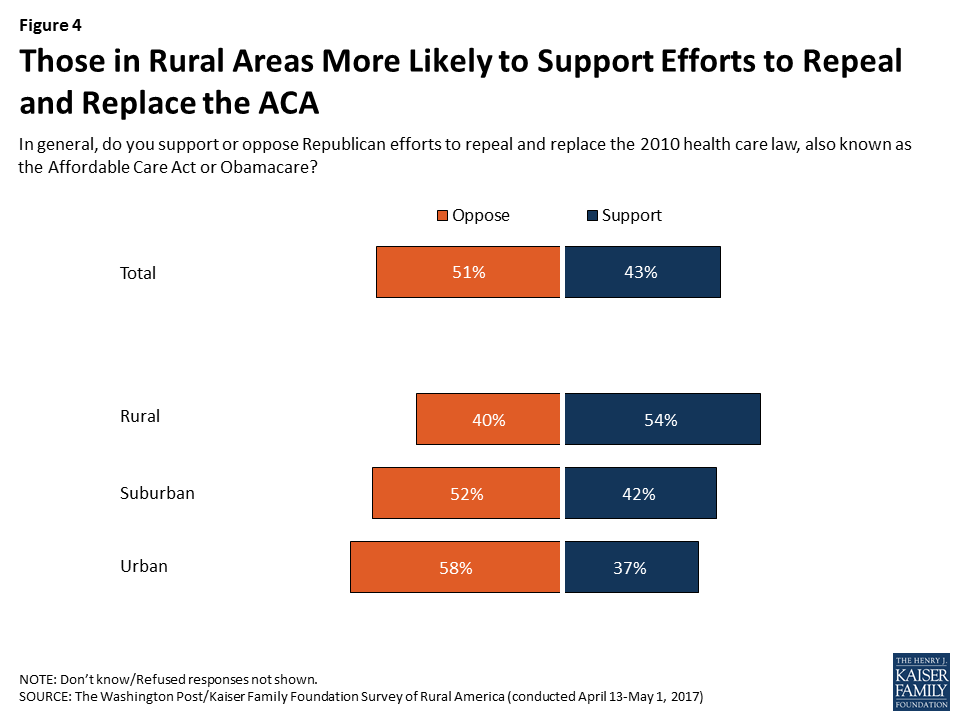
Reflecting their partisan orientation, rural residents are also more likely than urban and suburban residents to say they support Republican efforts to repeal and replace the Affordable Care Act (ACA).3 Just over half (54 percent) of rural Americans say they support such efforts, compared with closer to four in ten of those living in suburban and urban areas (42 percent and 37 percent, respectively).
Figure 4: Those in Rural Areas More Likely to Support Efforts to Repeal and Replace the ACA
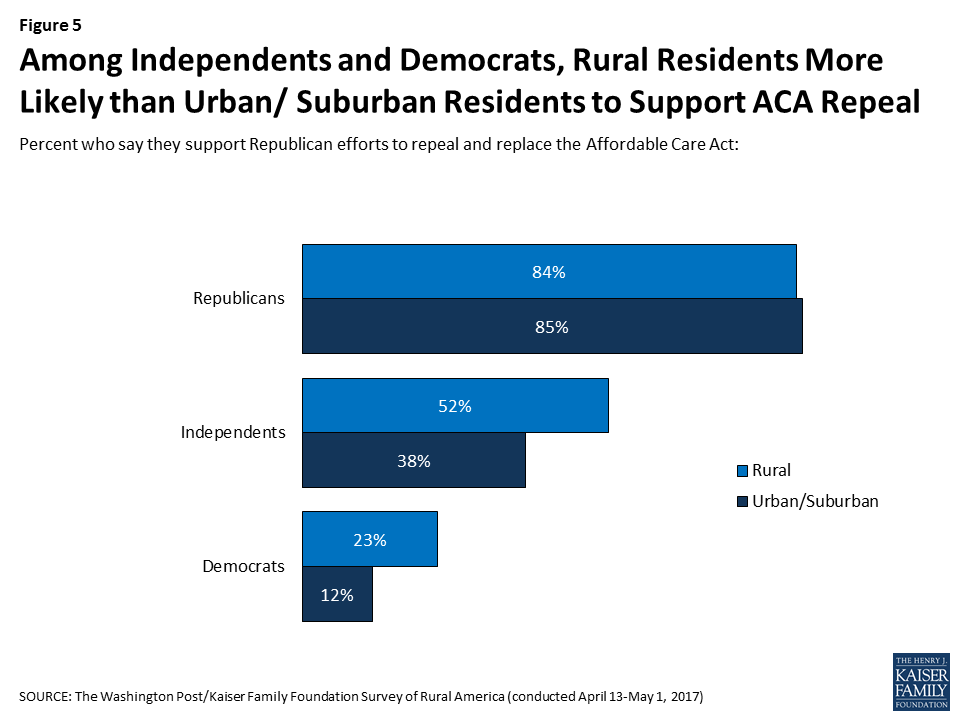
While partisanship is the biggest divider in how Americans view the ACA, the survey finds that among Democrats and independents, rural residents are more likely than their urban and suburban counterparts to support Republican efforts to repeal and replace the law. About half (52 percent) of rural independents say they support such efforts, compared with 38 percent of independents in urban and suburban areas. And while most Democrats are opposed, 23 percent of rural Democrats say they support the Republican efforts to repeal and replace the ACA compared with just 12 percent of urban and suburban Democrats.
Figure 5: Among Independents and Democrats, Rural Residents More Likely than Urban/ Suburban Residents to Support ACA Repeal
In the focus groups, which were held in the evening on the same day the House of Representatives passed the American Health Care Act, few participants were aware of any details about the Republican plan, and only one participant in each group knew that the House had voted that day. In the Trump voter group, frustration with the ACA centered around the high cost of premiums and high deductibles (though one Trump voter mentioned that he had coverage purchased through an ACA exchange and was very happy with the coverage).
Focus Group Participants on the ACA and Health Reform:
“[Obamacare] saved my wife’s life.” – Male, age 52, Trump voter
“I experienced the exact opposite of you with Obamacare. It was $2,300 for me and my six kids a month. I can’t afford that. I had a better rate from Blue Cross Blue Shield. It was only $850 a month… I still keep that because the Obamacare wouldn’t work for me.” – Male, age 45, Trump voter
“If you’re working at McDonalds, you can afford Obamacare. Because they will hook you up with that…it goes off your income.” – Male, age 52, Trump voter
“I had a friend who was very pro Obama…Her deductible was next to nothing. Everything was getting paid for. About a year later she said, yea I’m shopping for new coverage because it went through the roof…So that was kinda eye opening because she was one of his staunchest supporters. She turned. I don’t know if she turned against him, but against Obamacare anyway.” – Female, age 62, Trump voter
In reference to the Republican ACA replacement plan: “I know they’re trying to make it a little more fair. Lower the copays. Lower the annual payments you have to make. Hopefully they can do it. That’s a difficult job.” – Male, age 42, Trump voter
In reference to the Republican ACA replacement plan: “If you’re going to make it as affordable as car insurance I’ll climb aboard.” – Male, age 41, Johnson voter
“I think it’s luck that Congress took 7 years fighting the Affordable Health Care Act and now they’re saying, oh now we gotta fix it. You really didn’t want to fix it. You just wanted to say you wanted to fix it. It’s just lip service so far.” – Male, age 52, Clinton voter
Rural Residents’ Views of Medicaid
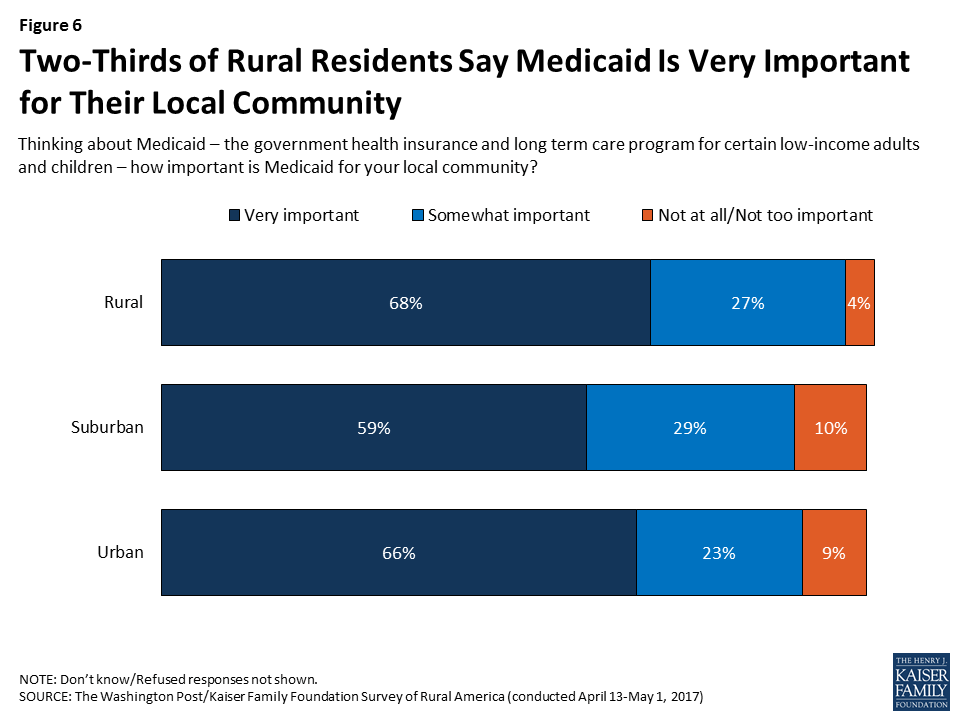
Other research has shown that Medicaid plays a central role in helping to fill gaps in health insurance coverage in rural areas.4 The survey finds that rural residents perceive this importance, with two-thirds (68 percent) saying that Medicaid is “very important” for their local community and another 27 percent saying it is “somewhat important.” The share saying Medicaid is very important is somewhat higher in rural areas than in suburban areas (59 percent) but similar to urban areas (66 percent).
Figure 6: Two-Thirds of Rural Residents Say Medicaid Is Very Important for Their Local Community
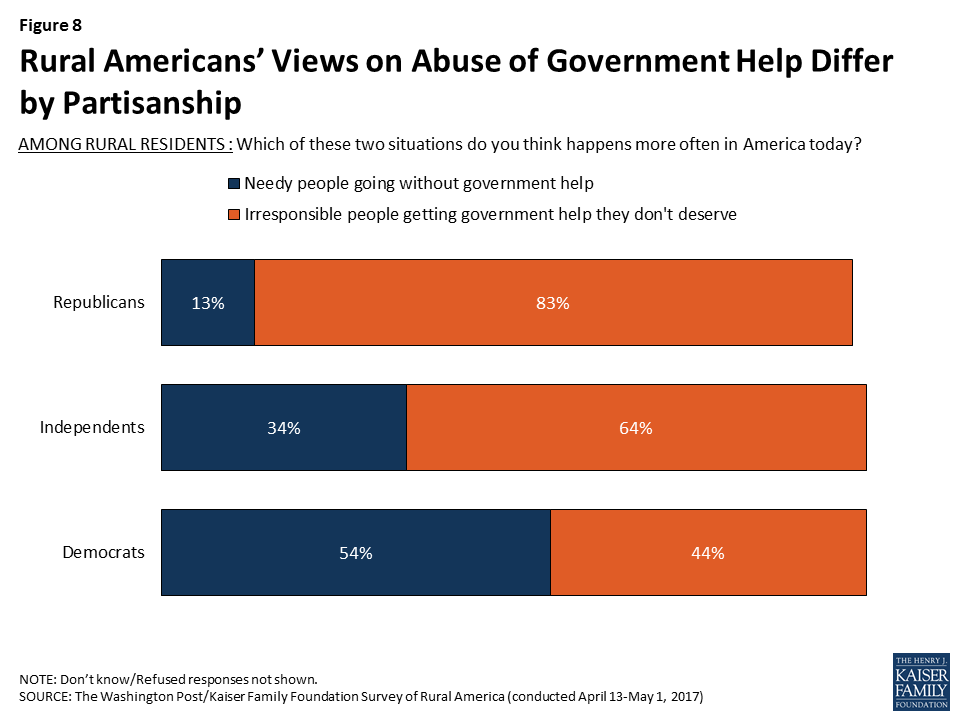
At the same time that rural residents see Medicaid as important for their community, they also express concerns about abuse of government benefits in general. Roughly two-thirds (64 percent) of rural residents say it is more common in America for irresponsible people to get government help they don’t deserve, while one-third (32 percent) say it’s more common for needy people to go without government help. Suburban residents also lean towards thinking it is more common for irresponsible people to get undeserved help (55 percent versus 40 percent), while urban residents are more evenly split (48 percent versus 47 percent).
Figure 7: Rural Residents More Likely to Say Irresponsible People Often Get Government Help They Don’t Deserve
The concern about abuse of government benefits in rural areas is largely driven by Republicans, 83 percent of whom say it is more common for irresponsible people to get government help they don’t deserve. Still, about two-thirds (64 percent) of rural independents and over four in ten (44 percent) rural Democrats express the same view.
Figure 8: Rural Americans’ Views on Abuse of Government Help Differ by Partisanship
Concern about abuse of government benefits in general – and in Medicaid in particular – was expressed in the focus groups by both those who voted for President Trump and those who did not.
Focus Group Participants on Medicaid and Abuse of Government Benefits:
“My husband has a job and we have health care through him. But the deductibles are high. Somebody that’s getting welfare, they’ve got a cough, and [say] oh I’m going to the doctor. I better be dead before I go to the doctor because I’ve got to pay for it.” – Female, age 50, Trump voter
“A lot of [people on Medicaid] will get medicine and go out and sell that medicine for a lot of money. Then they’ll take their EBT card, go see certain people, 50 cents on a dollar, you want to go shop! It happens all day long.” – Male, age 52, Trump voter
“A lot people are still working under the table on [Medicaid]. They’re making $10 an hour, tax deferred, not have to pay tax…not have to file income tax. And getting all the benefits for free!” – Male, age 64, Clinton voter
“I was off of work. Now, I’m covered by the state [Medicaid]. And I have the best medical coverage ever. So every single thing that I needed to have done, I’m trying to get it done right now while I’m off of work because by the time I go back to work, I’m gonna have my huge deductible, huge copay… [The people on Medicaid] have the very best insurance that none of the rest of us can afford.” – Female, age 36, Clinton voter
Conclusion
Rural Americans express deep concerns about forces they see as eroding their communities, including economic decline, job losses, and an increase in drug abuse and addiction. Health care does not top their list of concerns, yet there are signs that residents of rural counties face particular struggles when it comes to health care access and costs. While partisanship divides rural residents’ views on health care policy just as it does in the rest of the country, rural Democrats and independents appear more open to Republican plans to repeal and replace the ACA than their counterparts in urban and suburban areas. This may be due in part to a more conservative orientation among rural Americans and their relatively greater concern about abuse of government benefits. For example, focus group participants across partisan lines expressed frustration about lower-income people being able to access Medicaid while those with slightly higher incomes struggle to afford coverage. Focus group findings also suggest that while partisanship divides rural residents on questions of health care politics, they are more united in their concern about the high cost of health care, a finding that echoes the results of many previous Kaiser surveys of the nation as a whole.5
Appendices: Appendix A: Personal Experiences With Health Care Access And Cost In Rural Areas
Table A1: Usual Source of Care in Rural Areas by Insurance Status, Race/Ethnicity, and Income
AMONG THOSE IN RURAL AREAS: Today, what kind of place, if any, do you usually go when you are sick or when you need advice about your health?
Total Rural
Insurance Status
Race/Ethnicity
Income
Insured Ages 18-64
Uninsured Ages18-64
White
Black
Hisp.
<$20K
$20K-$49.9K
$50K-$74.9K
$75K+
A hospital emergency room/No usual place of care (NET)
17%
15%
49%
15%
33%
29%
31%
18%
10%
12%
A hospital emergency room
7
7
14
4
26
10
16
7
1
2
No usual place of care
11
8
35
11
7
19
15
11
9
10
A neighborhood clinic or health center
27
31
32
27
21
36
32
26
32
23
A private doctor’s office
52
51
14
54
43
33
36
49
58
62
Some other place
3
3
4
3
2
1
1
6
<1
2
Don’t know/Refused
1
<1
2
<1
1
2
0
<1
0
1
Table A2: Affordability of Health Care Costs in Rural Areas by Insurance Status, Race/Ethnicity, and Income
AMONG THOSE IN RURAL AREAS: In general, how easy or difficult is it for you to afford to pay your family’s health care costs?*
Total Rural
Insurance Status
Race/Ethnicity
Income
Insured Ages 18-64
Uninsured Ages18-64
White
Black
Hisp.
<$20K
$20K-$49.9K
$50K-$74.9K
$75K+
Easy (NET)
50%
54%
18%
53%
30%
31%
33%
44%
53%
73%
Very easy
20
23
7
21
14
9
12
17
20
38
Somewhat easy
30
31
11
32
16
22
21
27
32
36
Difficult (NET)
48
46
76
45
69
67
63
55
47
25
Somewhat difficult
24
23
27
23
29
40
24
30
26
16
Very difficult
24
23
49
22
40
27
39
26
20
9
Don’t know/Refused
2
1
6
2
1
2
4
1
1
2
*Question wording included “including the cost of insurance and any other costs you have to pay out of your own pocket” for those who are insured
Table A3: Postponing Needed Care in Rural Areas by Insurance Status, Race/Ethnicity, and Income
AMONG THOSE IN RURAL AREAS: In the past 12 months, have you or another family member living in your household skipped or postponed getting any type of health care you needed, including doctor visits, prescriptions, dental care, or mental health services?
Total Rural
Insurance Status
Race/Ethnicity
Income
Insured Ages 18-64
Uninsured Ages18-64
White
Black
Hisp.
<$20K
$20K-$49.9K
$50K-$74.9K
$75K+
Yes, have skipped/ postponed care
37%
39%
61%
37%
39%
41%
45%
42%
42%
25%
Not being able to afford the cost was a reason
28
28
47
28
28
28
33
34
30
17
Not being able to find a doctor or get an appointment was a reason
9
9
16
8
17
11
15
10
10
4
Difficulty traveling to the doctor’s office, clinic, or pharmacy was a reason
7
6
14
5
13
12
14
7
4
1
No, have not skipped/ postponed care
62
61
39
63
60
57
54
58
58
74
Don’t know/Refused
<1
<1
0
<1
1
2
1
<1
0
<1
Appendices: Appendix B: How We Defined Rural Areas And Who Lives There
Researchers use different definitions of urban and rural areas depending on the purpose of their research. For this project, we used the National Center for Health Statistics’ Urban-Rural Classification Scheme for Counties, which was developed for use in studying associations between urbanization and health, and for monitoring the health of urban and rural residents.6 The classification breaks counties into 6 categories, ranging from the most urban to the most rural. For purposes of this analysis, the 3 most rural categories (noncore, micropolitan, and small metro) were considered rural or small town (in this report, the term “rural” encompasses both rural areas and small towns).7 Just under one-quarter (23 percent) of the U.S. population lives in counties meeting this definition.
Compared with those living in urban and suburban areas, rural residents are more likely to be ages 65 and older, and less likely to have a 4-year college degree. They are also less racially diverse than urban and suburban residents; roughly eight in ten are non-Hispanic whites.
The survey also finds that those who live in rural areas report somewhat poorer health than their urban counterparts. Almost six in ten urban residents (58 percent) rate their own health as “excellent” or “very good” compared with 47 percent of those in rural areas, while rural residents are more likely than urban residents to say their health is “only fair” or “poor” (23 percent versus 15 percent).
Methodology
Survey Methodology
The Washington Post/Kaiser Family Foundation Survey Project is a partnership combining survey research and reporting to better inform the public. The Post-Kaiser Survey of Rural America, the 31st in this series, was conducted by telephone April 13 – May 1, 2017, among a random representative sample of 1,070 adults age 18 and older living in rural counties, 303 adults in urban counties, and 307 in other counties that were considered suburban. Interviews were administered in English and Spanish, combining random samples of both landline and cellular telephones. Sampling, data collection, weighting and tabulation were managed by SSRS in close collaboration with The Washington Post and Kaiser Family Foundation researchers.
Respondents’ metropolitan status was operationalized using the CDC’s 2013 NCHS Urban-Rural Classification Scheme for Counties. Respondents were asked for their county of residence (or zip code if they were unsure) and classified into one of 6 codes in the classification scheme. Those in groups 4-6 (Small Metropolitan, Micropolitan, and Noncore) were considered Rural, those in group 1 (Large Central Metropolitan) were considered Urban, and the rest (Large Fringe Metropolitan, Medium Metropolitan) were considered Suburban.
The sampling procedures were designed to oversample those living in rural areas, with minimum goals for reaching rural residents who were between the ages of 18-34; Hispanic; black residents of Southern states; and residents of the rust belt states of Iowa, Michigan, Minnesota, Ohio, Pennsylvania, and Wisconsin. Some respondents were reached by calling back those living in rural areas who had previously completed an interview on the SSRS Omnibus poll and indicated they fit one of these oversample criteria. The dual frame landline and cellular phone sample was generated by Marketing Systems Group (MSG) using random digit dial (RDD) procedures.
All respondents were screened to verify that they belonged to the correct metropolitan classification. For the landline sample, respondents were selected by asking for the youngest adult male or female currently at home based on a random rotation. If no one of that gender was available, interviewers asked to speak with the youngest adult of the opposite gender. For the cell phone sample, interviews were conducted with the adult who answered the phone.
A multi-stage weighting design was applied to ensure an accurate representation of the population of each race group, within each of the three metropolitan areas and for both the cell phone and landline frames. The first stage of weighting involved corrections for sample design, including accounting for non-response for the re-contact sample. In the second weighting stage, demographic adjustments were applied to account for systematic non-response along known population parameters. Population parameters included gender, age, race, Hispanicity, education, region, and phone status (cell phone only or reachable by landline). The rural sample was also weighting based on metropolitan subgroup (category NCHS code 4, 5, or 6). Population parameters were derived using Census-based estimates provided by Nielsen Pop-Facts through Marketing Systems Group. Estimates of phone status were derived from the SSRS Omnibus 2016-2017 data.
All sampling error margins and tests of statistical significance have been adjusted to account for the survey’s design effect, which is 2.5 for results based on the full sample. The design effect is a factor representing the survey’s deviation from a simple random sample, and takes into account decreases in precision due to sample design and weighting procedures. Sample sizes and margin of sampling errors for key groups are shown below; other subgroups are available by request. Note that sampling error is only one of many potential sources of error in this or any other public opinion poll.
Table A4: Number of respondents and Margin of Sampling Error
Group
N (unweighted)
Margin of sampling error(percentage points)
Total
1686
±4
Urban
303
±7
Suburban
307
±6.5
Rural
1070
±3.5
This questionnaire was administered with the exact questions in the exact order as appears in the survey topline document. If a question was asked of a reduced base of the sample, a parenthetical preceding the question identifies the group asked. Some questions were only asked of those in rural areas.
Since some of the demographic questions could be sensitive and due to the nature of the survey content, interviewers were given specific instructions on how to cope with respondents who refused questions, including a statement reaffirming that answers were recorded confidentially for the sole purpose of research.
The Washington Post and the Kaiser Family Foundation each contributed financing for the survey, and representatives of each organization worked together to develop the survey questionnaire and analyze the results. Each organization bears the sole responsibility for the work that appears under its name. The project team from the Kaiser Family Foundation included: Mollyann Brodie, Ph.D., Liz Hamel, and Bryan Wu. The project team from The Washington Post included: Scott Clement and Emily Guskin. Both The Washington Post and the Kaiser Family Foundation public opinion and survey research are charter members of the Transparency Initiative of the American Association for Public Opinion Research.
Focus Group Methodology
As part of this project, the Kaiser Family Foundation and The Washington Post conducted two focus groups in Ashtabula County, Ohio. Participants were residents of Ashtabula County who reported voting in the 2016 presidential election. One group of 8 participants reported voting for Donald Trump and the second group of 8 participants reported voting for Hillary Clinton or another candidate (in the final group selected, 7 participants reported voting for Mrs. Clinton and one reported voting for Gary Johnson). Respondents were recruited by telephone, and screening criteria were used to exclude those who:
had lived in the county for less than one year;
themselves or a family member were employed by an elected official, political campaign, market research company, or media organization;
had participated in a focus group in the previous three months;
had an annual household income of $100,000 or more;
reported a race other than white if they were a Trump voter; or
reported a score lower than 7 when asked how comfortable they were voicing their opinions in a group setting on a scale from 1 to 10.
Each session was held at a restaurant in Jefferson, Ohio on May 4, 2017, and each lasted approximately one hour and 40 minutes. Each respondent received $100 for their participation. Both sessions were audio and video recorded for reporting purposes. The groups were moderated by Kaiser Family Foundation staff, and both Kaiser and The Post contributed financing for the recruiting and recording. The group discussion guide is available upon request.
Endnotes
All participants in the second group reported voting for Mrs. Clinton with the exception of one who voted for Gary Johnson. ↩︎
The survey was in the field April 13-May 1, after the House of Representatives began discussing the American Health Care Act but before the bill passed the House on May 4. ↩︎
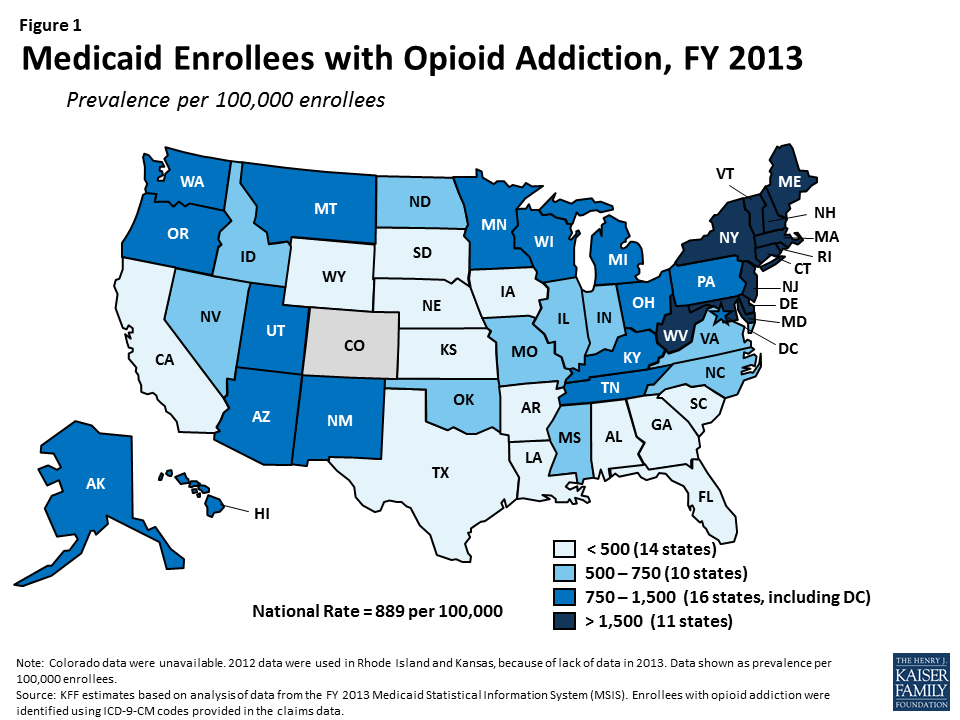
The United States is facing an unprecedented opioid epidemic. In 2015, over 2 million people had a prescription opioid addiction and 591,000 had a heroin addiction.1 The epidemic has resulted in increased health care services utilization and a surge in opioid overdose deaths throughout the country, particularly in Appalachia and New England.
Medicaid plays an important role in addressing the epidemic, covering 3 in 10 people with opioid addiction in 2015. Medicaid facilitates access to a number of addiction treatment services, including medications delivered as part of medication-assisted treatment, and it allows many people with opioid addiction to obtain treatment for other health conditions. As of July 2017, 32 states have expanded Medicaid, with enhanced federal funding, to cover adults up to 138% of the federal poverty level ($16,643/year for an individual in 2017). This expanded Medicaid coverage has enabled many states to provide addiction treatment and other health services to low-income adults with opioid addiction who were previously ineligible for coverage.
However, the GOP’s Better Care Reconciliation Act (BCRA) proposes to restructure the Medicaid program through a per capita cap or block grant, to phase out the enhanced federal funding for the Medicaid expansion population, and to remove the requirement that Medicaid expansion plans cover addiction treatment. The BCRA also appropriates $4.972 billion each year over 9 years for state grants for substance use disorder and mental health treatment and recovery support services. However, even with the additional grant funding, the reduced federal funding for Medicaid could lead to reductions in Medicaid eligibility and coverage of services, affecting state efforts to address the opioid epidemic.
This issue brief provides information on the number of Medicaid enrollees with opioid addiction, Medicaid spending on these enrollees, and the implications of the BCRA as states work to combat this public health crisis. Drawing on state-level data available for FY 2013, this brief provides insight into Medicaid’s role, but from a time predating the expansion and current focus on the opioid epidemic. Thus effects shown here will undoubtedly understate Medicaid’s role today, but provide insight into the scope of Medicaid’s impact on the opioid addiction challenge.
How many Medicaid enrollees have opioid addiction?
In FY 2013, there were 636,000 people enrolled in Medicaid with opioid addiction2, amounting to a prevalence of 889 per 100,000 (Table 1 and Figure 1). The number of Medicaid enrollees with opioid addiction ranged from a low in South Dakota of under 300 people to a high in New York of over 114,000 people. The prevalence of opioid addiction within the Medicaid population also varied across states, ranging from fewer than 300 per 100,000 enrollees in Arkansas, South Dakota, Texas, Nebraska, and California to over 3,000 per 100,000 enrollees in Vermont, Connecticut, Maine, and Massachusetts (Table 1). However, these counts are from before Medicaid expansion took effect; since the expansion likely extended coverage to many people with opioid addiction, a larger number of people with this problem are likely now covered by Medicaid in states that expanded their programs.
Figure 1: Medicaid Enrollees with Opioid Addiction, FY 2013
How much does Medicaid spend on enrollees with opioid addiction?
Medicaid covers a broad range of services for people with opioid addiction, spending $9.4 billion on their care in FY 2013. Medicaid provides both addiction treatment services, such as inpatient detoxification, intensive outpatient treatment, and medication-assisted treatment, as well as other services for health conditions either associated with or independent from opioid addiction.3 Many of these services are complex and often expensive. Approximately one-third (31.9%) of this spending was for payments to Medicaid managed care organizations. The remaining spending was through fee-for-service (FFS) arrangements and included inpatient treatment (21.4%); outpatient treatment (14.5%); prescription drugs (9.7%); long-term care (8.3%); physician, laboratory, and x-ray services (5.8%); and other FFS acute care services (8.5%) (Figure 2). Because these data are also from before the Medicaid expansion, total Medicaid spending on enrollees with opioid addiction has likely increased since 2013 as more people with the problem gained coverage in recent years.
Figure 2: Medicaid Spending on Enrollees with Opioid Addiction by Service, FY 2013
How would the BCRA affect states’ ability to address the opioid epidemic?
Medicaid remains on the front lines for treatment of opioid addiction providing $9.4 billion in spending for enrollees with opioid addiction in 2013 and undoubtedly more today as the epidemic increases and coverage of the expansion population boosts Medicaid’s role. On July 13th 2017, the Senate released a revised discussion draft of the BCRA, which would change the structure of the Medicaid program substantially. Currently, the federal government matches state Medicaid spending with no pre-set limit. The BCRA would significantly reduce federal spending provided to states for the Medicaid program through a per capita cap, or at the state option, a block grant for expansion adults and other non-elderly non-disabled adults.4 It would also phase out enhanced federal financing for the Medicaid expansion population and remove the requirement that all Medicaid expansion plans cover addiction treatment. These changes will likely lead to decreases in eligibility, coverage, provider payments, and access to care.
In 2015, 1 out of 5 people with opioid addiction were uninsured, in part because many of these people lived in states that had not expanded Medicaid.5 Ending the federal enhanced support for the expansion and imposing a per capita cap on Medicaid will not facilitate expanding coverage to the uninsured. The Senate proposed $4.972 billion appropriation per year for 9 years will likely not fill this hole.
In addition to the Medicaid provisions, the BCRA also appropriates $4.972 billion each year from FY 2018 through FY 2026 to provide grants to states for substance use disorder treatment and recovery support services for individuals with substance use disorder or mental illness.6 The $4.972 billion per year for 9 years is an increase from $2 billion for state grants for FY 2018 alone, as proposed in the original draft of the BCRA released in June 2017. Several senators from states more heavily hit by the opioid epidemic had taken issue with the $2 billion appropriation in the BCRA, saying that it would not meet the amount needed to adequately address this public health crisis.7 These funds would increase capacity to address the epidemic but will likely fall short of the financing that accompanies increased coverage through Medicaid or other means.
People with opioid addiction often have health issues that abetted in, have been borne from, or are independent from their substance use and misuse. These include heart conditions, hypertension, asthma, hepatitis, sexually transmitted infections, and mental illnesses, such as depression.8 The $9.4 billion that Medicaid spent in FY 2013 was for a broad range of services, not solely for addiction treatment, reflecting the complex health profile of a person with opioid addiction. However, state grants from the appropriation are intended only for addressing substance use disorder treatment services and recovery support services for substance use disorders and mental illness, and would most likely be awarded to providers that are unable to address other health issues.
Of particular note, the $9.4 billion that Medicaid spent on enrollees with opioid addiction in FY 2013 does not include any of the very expensive drugs that effectively cure hepatitis C, such as Sovaldi, Harvoni, and Viekira Pak, as these drugs launched after FY 2013. Because these drugs cost tens of thousands of dollars per treatment per person and because the disease is prevalent among those addicted to opioids,9 spending on people with opioid addiction is very likely higher in FY 2014 than in FY 2013, even before taking into account the increase in the number of people with opioid addiction during this period. Hepatitis C is a blood borne virus, most frequently now spread through shared intravenous needles.10 Although drugs are now on the market that effectively cure hepatitis C, a person can contract the virus again if reintroduced, allowing the virus to continue to spread.11 As a result, addressing hepatitis C without addressing the opioid epidemic will allow the virus to live on, not only allowing for unfavorable health outcomes, but adding avoidable costs to the entire health care system.
Looking Ahead
The opioid epidemic has led to substantial health complications, increased health care services utilization, and considerable societal costs. Medicaid has played a critical role in addressing the epidemic by facilitating access to addiction treatment services, including medication-assisted treatment. Medicaid has also facilitated access to other health services for enrollees with opioid addiction, many of whom have complex health and psychosocial needs.
However, proposed changes to the Medicaid program in the BCRA could significantly affect states’ ability to combat this issue. In response to decreases to federal Medicaid financing, states may limit Medicaid eligibility, trim benefit packages and remove optional services, or decrease provider payment rates, all of which may limit access to medical, mental health, and addiction treatment services for individuals with opioid addiction. Although the BCRA allots additional funding for addiction treatment and recovery support services, this funding may not adequately compensate for the decreases in Medicaid spending proposed in the bill. As a result, there may be substantial unmet need for treatment among individuals with opioid addiction, further exacerbating this public health crisis.
Methodology
This analysis is based on KFF estimates from the 2013 Medicaid Statistical Information System (MSIS) and Urban Institute estimates from CMS-64 reports. We adjusted MSIS spending to CMS-64 spending to account for MSIS undercounts of spending. Due to differences in the way CMS-64 and MSIS handle spending for managed long-term services and supports (MLTSS) and increased use of MLTSS in Medicaid, we have revised our methodology of adjusting MSIS to CMS-64. As a result, spending in this note are not comparable to previously published KFF analysis of Medicaid spending amounts from the MSIS.
Because FY 2013 MSIS data were unavailable for Rhode Island, and only one quarter was available for Kansas, we used 2012 MSIS for both of these states, aligned to 2013 CMS-64 spending. Data for Colorado were unavailable.
We used the following ICD-9-CM codes in the non-prescription drug claims data to identify beneficiaries diagnosed with opioid addiction: 304.0X (opioid type dependence), 304.7X (combination of opioid type drug with any other drug dependence), 305.5X (nondependent opioid abuse), and 965.0X (poisoning by opiates and related narcotics). Because ICD-9-CM codes identify diagnosed health problems, it is possible that we are undercounting the true number of beneficiaries with opioid addictions. Additionally, although it is possible that we are including beneficiaries with serious opioid use problems who may not be addicted, we included them in this analysis, because we are interested with Medicaid’s interaction with the opioid epidemic overall.
Table 1: Medicaid Enrollees with Opioid Addiction, FY 2013
State
Medicaid Enrollees with Opioid Addiction (Count rounded to nearest 100)
Medicaid Enrollees with Opioid Addiction (Prevalence Per 100,000)
Expanded Medicaid
Alaska
1,200
881
Arizona
14,900
894
Arkansas
1,100
159
California
35,700
292
Colorado
N/A
N/A
Connecticut
27,600
3,255
Delaware
7,200
2,781
District of Columbia
2,500
984
Hawaii
2,700
872
Illinois
18,500
604
Indiana
9,300
718
Iowa
2,100
321
Kentucky
9,500
1,007
Louisiana
6,500
488
Maryland
33,400
2,834
Massachusetts
55,900
3,553
Michigan
20,500
889
Minnesota
15,900
1,379
Montana
1,100
777
Nevada
2,700
651
New Hampshire
3,200
1,867
New Jersey
19,300
1,549
New Mexico
6,700
993
New York
114,200
1,886
North Dakota
500
607
Ohio
34,300
1,261
Oregon
10,100
1,320
Pennsylvania
23,100
901
Rhode Island
3,300
1,696
Vermont
6,400
3,094
Washington
10,700
753
West Virginia
7,500
1,723
Did Not Expand Medicaid
Alabama
5,200
463
Florida
18,700
433
Georgia
6,900
347
Idaho
1,600
530
Kansas
1,700
392
Maine
12,700
3,396
Mississippi
3,900
501
Missouri
7,600
668
Nebraska
700
249
North Carolina
13,300
707
Oklahoma
6,600
665
South Carolina
3,500
319
South Dakota
300
200
Tennessee
13,500
864
Texas
10,500
202
Utah
3,200
823
Virginia
6,000
524
Wisconsin
12,200
957
Wyoming
300
390
SOURCE: KFF estimates based on analysis of data from the FY 2013 Medicaid Statistical Information System (MSIS). Colorado data were unavailable. 2012 data used for Rhode Island and Kansas. See Methodology for details.
The BCRA does allow the HHS Secretary to exclude up to $5 billion of spending nationally on public health emergencies from the allotted amounts calculated through states’ per capita caps from 2020 through 2024, although the Secretary of HHS must declare both the emergency as applicable and the amount excluded as appropriate. This amount is shared among all states and among all types of public health emergencies. ↩︎
Intensity Gap: Democrats are Twice as Enthusiastic about the ACA than Republicans are About Its Replacement
Two-Thirds of Public Oppose Major Medicaid Cuts as Part of Repeal and Replace Plan
As the U.S. Senate continues to debate their plan to repeal and replace the 2010 Affordable Care Act, the latest Kaiser Family Foundation tracking poll finds the public souring on the effort with a growing majority opposed to the plan.
This month’s poll finds 61 percent of the public now hold an unfavorable view of the Congress’ plan, up slightly from 55 percent in June. The opposition is also growing more intense, with 44 percent of the public now viewing the plan “very” unfavorably, up from 38 percent in June. In contrast, relatively few view the plan favorably (28%), including just one in 10 (9%) who view it “very” favorably.
While majorities of Democrats (86%) and independents (63%) view the repeal and replace plan unfavorably, most Republicans (60%) and supporters of President Trump (54%) continue to view it favorably. The intensity of Republican support is modest: One quarter of Republicans (25%) view the plan “very” favorably.
In contrast, this month half (50%) of the public hold a favorable view of the Affordable Care Act itself, while somewhat fewer (44%) hold an unfavorable view. These shares have largely been stable the past few months, meaning the 2010 law continues to be more popular than Congress’ plan to replace it.
The poll also finds that Democrats are far more enthusiastic about the current law than Republicans are about its replacement. Half (52%) of Democrats now view the Affordable Care Act “very” favorably, twice the share of Republicans who say the same about the replacement plan.
Relatively few (16%) people say the current plan fulfills all or most of the promises President Trump has made about health care. Far more (71%), including majorities of Republicans (56%) and President Trump’s supporters (58%), say it fulfills some or none of President Trump’s health care promises.
Two- thirds of the public (65%) oppose major reductions to Medicaid as part of a plan to repeal and replace the Affordable Care Act, while three in ten (28%) support such reductions. A large majority of Democrats (88%) and most independents (63%) oppose major Medicaid cuts, while a narrow majority of Republicans (54%) and President Trump’s supporters (51%) favor them.
Arguments commonly made for and against reductions in Medicaid funding change opinions only modestly. For example, about one-fourth of those opposed to major Medicaid cuts (17% of the public overall) change their minds after hearing that this would give states more flexibility and control over their Medicaid programs. A similar share of those who support funding reductions (28%, and 8% of the public overall) change their mind after hearing that it would make it harder for states to address the nation’s prescription painkiller epidemic.
The ongoing debate in Washington may be hardening some people’s views against the repeal and replace plan. While most people (66 percent) say that they have not changed their views in the past month, a quarter (24%) say their views have become negative, three times the share (7%) who say their views have become more positive.
Another potential challenge for the bill’s supporters are the Congressional Budget Office’s estimates about the potential impact of repeal-and-replace plans on the uninsured and people’s health care costs expected to be released next week.
While only a third of the public has heard or read anything about the CBO’s recent initial report on the Senate bill, at least half of the public say that hearing certain statistics about the impact of the Senate legislation from the C.B.O. may make them “less likely” to support the plan. For example, six in ten say that that hearing it would increase premiums for people who purchase their own insurance on the marketplace would make them “less likely” to support it.
The poll also finds a large majority of the public (71%) would rather see Congressional Republicans work with Democrats to make improvements to the Affordable Care Act but not repeal the law, compared to one-fourth (23%) who say they would want Republicans to continue working on their own plan to repeal and replace the law.
While Democrats (91%) and independents (72%) overwhelmingly favor the bipartisan approach, a narrow majority of Republicans (54%) want Congressional Republicans to continue working on their own plan. President Trump’s supporters are more divided, with similar shares wanting Republicans to continue to work on their own plan (47%) as saying they want a bipartisan approach (46%).
The poll finds relatively scant support for another strategy floated by President Trump and some Congressional Republicans to repeal parts of the Affordable Care Act now and work out details of a replacement plan later if Congress is unable to agree on a full replacement plan.
About one-fourth of the public (26%) say Congress should vote to repeal the parts of the law they can immediately and try to work out the replacement plan later, fewer than say they want Congress to wait to vote on repeal until they work out a replacement plan (37%) or that Congress shouldn’t repeal the Affordable Care Act at all (33%). Once again, there is a large partisan divide on this question, with about half of Republicans (52%) and President Trump’s supporters (45%) favoring immediate repeal.
Designed and analyzed by public opinion researchers at the Kaiser Family Foundation, the poll was conducted from July 5 – 10 among a nationally representative random digit dial telephone sample of 1,187 adults. Interviews were conducted in English and Spanish by landline (407) and cell phone (776). The margin of sampling error is plus or minus 3 percentage points for the full sample. For results based on subgroups, the margin of sampling error may be higher.
The July Kaiser Health Tracking Poll finds that most Americans (61 percent) continue to hold unfavorable views of the plan to repeal and replace the Affordable Care Act (ACA), including over four in ten (44 percent) who say they have “very unfavorable” view. The share of the public with negative views of the law has increased slightly in the past month, from 55 percent to 61 percent. Views of the Republican plan to repeal and replace the ACA continue to vary widely by party and a large intensity gap remains, with Democrats being nearly three times as likely to hold a “very unfavorable” view as Republicans are to hold a “very favorable” view (71 percent versus 25 percent, respectively).
Nearly two-thirds of the public opposes (65 percent) major reductions in federal funding for Medicaid as part of a plan to repeal and replace the ACA, and most continue to oppose these reductions even after hearing arguments in support of them. About half of Republicans and those who approve of President Trump support major reductions in federal funding for Medicaid.
Seven in ten (71 percent) Americans would rather see Republicans in Congress work with Democrats to make improvements to the ACA but not repeal the law, while one-fourth (23 percent) say they would rather Republicans continue working on their own plan to repeal and replace the ACA. Large shares of Democrats (91 percent) and independents (72 percent) would like to see Republicans in Congress work across the aisle to make improvements to the ACA. Trump supporters are divided with similar shares saying Republicans in Congress should continue working on their own plan (47 percent) as saying they want them to work with Democrats on improving the ACA (46 percent). Slightly more than half of Republicans (54 percent) want Congressional Republicans to continue working on their own plan to repeal and replace the 2010 health care law.
The majority of the public thinks the current replacement plan being discussed does not fulfill most of the promises President Trump has made about health care.
About one-third (35 percent) of the public say they have heard or read about the report by the C.B.O. in the past month concerning the proposed health care plan that would repeal and replace the ACA, and few are aware of the details of the C.B.O. report. For example, just about one in five are aware that the report said the Senate health plan would increase the number of people without insurance and one in ten are aware that it would decrease the federal budget deficit over the next ten years. However, at least half of the public say that hearing certain estimates about the impact of the Senate legislation from the C.B.O. may make them “less likely” to support the plan.
Repealing and Replacing the Affordable Care Act
As the U.S. Senate continues to debate their plan to repeal and replace the 2010 Affordable Care Act, the majority of the public (61 percent) continues to hold unfavorable views of the replacement plan, up slightly from 55 percent in June. This increase is driven by a rise in the share who say they have “very unfavorable” view, up from 38 percent in June to 44 percent in this month’s poll.
Figure 1: Growing Majority of the Public Holds an Unfavorable View of the ACA Replacement Plan
Attitudes Towards Repeal Efforts Vary by Partisanship, Support for President Trump
A majority of Republicans (60 percent) and those who say they approve of President Trump (54 percent) report favorable views of the replacement plan, while large majorities of Democrats and those who do not approve of President Trump hold unfavorable views (86 percent and 82 percent, respectively). In addition, independents are more than twice as likely to report unfavorable views of the replacement plan as favorable ones (63 percent versus 28 percent). Rifts in the intensity of opinion remain with seven in ten Democrats (71 percent) reporting a “very unfavorable” opinion of the replacement plan compared to one-fourth of Republicans reporting a “very favorable” view. A similar pattern holds for Trump supporters and opponents.
Figure 2: Republicans and Trump Supporters More Likely to Hold Favorable than Unfavorable Views of ACA Replacement Plan
The shares of Republicans and Trump supporters with favorable views of the replacement plan have not changed substantially this month after falling between May and June.
Figure 3: Over Half of Republicans and Trump Supporters Still Hold Favorable Views of the Replacement Plan
Why the Public Holds Favorable or Unfavorable Views of the Replacement Plan
When asked the reasons behind their views of the plan to repeal and replace the ACA (both favorable and unfavorable), one-third (32 percent) of those who favor the plan say it is because they generally disapprove of the ACA and the replacement plan repeals the ACA. This is followed by 21 percent who say they have a favorable view because they support insurance reform, more broadly, and 19 percent who say they think the replacement plan will make health care more affordable. Among those who hold unfavorable views of the plan, one-fourth (23 percent) say it is because they think the replacement plan will have a negative impact on people, or because of financial or cost considerations (22 percent). Similar shares (15 percent) say they hold unfavorable views because it repeals or doesn’t fix the ACA or becauses it decreases access to health care or health insurance.
Figure 4: Favorable Views of Replacement Plan Are Because It Repeals the ACA, Unfavorable Views Are Due to Negative Impact on People
Is the Public Becoming More Negative in Their Views of the ACA Replacement Plan?
Public opinion toward major pieces of legislation can shift as debate unfolds and details of plans are released. Most Americans (69 percent) say they have been following discussions in Washington about efforts to repeal and replace the 2010 health care law at least somewhat closely, and while overall views of the plan remain negative, when the public is explicitlyasked how their own opinions of the plan to repeal and replace the ACA have changed over the past month, two-thirds of the public – including a majority of Democrats, independents, and Republicans – say their opinion has not changed. About one-fourth (24 percent) say their opinion has become “more negative” while a smaller share (7 percent) say their opinion has become “more positive.” Among those who have been following the repeal and replace discussions closely, a larger share of Republicans (20 percent) say their opinions have become “more positive” over the past 30 days, which is similar to the share of Trump supporters (16 percent) who say their views of the replacement plan has become “more positive.” Nearly half of Democrats who have been following the debate closely say their views have become “more negative” in the past 30 days.
Figure 5: More of the Public Says Views of the ACA Replacement Plan Are Becoming Increasingly Negative
More Americans View The ACA Favorably Than The Replacement Plan
The Kaiser Family Foundation has been tracking public opinion on the ACA since its passage in 2010 and this month’s survey continues to find the public is more favorable than unfavorable in their views of the 2010 health care law, with 50 percent expressing a favorable view of the ACA compared to 44 percent expressing an unfavorable view.
Figure 6: More of the Public Have Favorable Views than Unfavorable Views of ACA
As seen in previous months, more of the public views the ACA favorably than the plan to replace the 2010 health care law (50 percent compared to 28 percent).
Figure 7: More View the ACA Favorably than View the Replacement Plan Favorably
In addition, Democrats are far more enthusiastic about the ACA than Republicans are about its replacement. Half (52 percent) of Democrats view the Affordable Care Act “very” favorably, twice the share of Republicans (25 percent) who say so about the replacement plan.
While Attitudes Toward ACA and Replacement Plan Are Driven by Partisanship, There Is a Partisan Intensity Gap
Next Steps for Repeal and Replace
Continue Working on Repeal or Work With Democrats on ACA Fixes
With the future of the current plan to repeal and replace the ACA uncertain, Senate Majority Leader Mitch McConnell and other Republicans leaders have suggested two ways forward for repeal and replacement efforts by either halting their own repeal efforts and working with Democrats on fixing the current problems facing the ACA or by continuing the Republican effort to repeal and replace the law. The majority of the public (71 percent) would rather see Republicans in Congress work with Democrats to make improvements to the ACA but not repeal the law, compared to one-fourth (23 percent) who say they would rather Republicans continue working on their own plan to repeal and replace the ACA.
Attitudes towards both of these proposed legislative avenues are largely partisan with the majority of Democrats (91 percent) and independents (72 percent) wanting Republicans in Congress to work with Democrats to make improvements to the ACA, while slightly more than half of Republicans (54 percent) want Congressional Republicans to continue working on their own plan to repeal and replace the 2010 health care law. Trump supporters are divided with similar shares saying Republicans in Congress should continue working on their own plan (47 percent) as saying they want them to work with Democrats on improving the ACA (46 percent).
Figure 9: Trump Supporters Split on if Republicans Should Keep Up Effort to Replace and Replace ACA or Work with Democrats on Fixes
Repeal Now and Replace Later or Continue Work on Replacement
Alternatively, some have suggested that Republicans go ahead and repeal the parts of the ACA they can immediately and then work on the replacement plan later. When asked what Congress should do, nearly four in ten say they want Congress to wait to vote to repeal the ACA until the details of a replacement plan have been worked out (37 percent), which is similar to the share who say they do not want Congress to repeal the ACA and would rather they move on to other priorities (33 percent). A smaller share – about one-fourth (26 percent) – say Congress should vote to repeal the parts of the law they can immediately and try to work out the replacement plan later – a strategy put forth by some Republican lawmakers.
Figure 10: More Want Congress to Wait to Vote or Not Vote at all, than Want Congress to Repeal Immediately
About half of Republicans (52 percent) want Congress to repeal the parts of the law they can repeal immediately and try to work out the details of a replacement plan later, while 55 percent of Democrats want them to not vote to repeal the ACA and move on to other priorities. Trump supporters are split between wanting Congress to wait to repeal the parts of the law they can repeal immediately (45 percent) and wanting Congress to wait to vote until the details of a replacement plan have been worked out (40 percent). Fewer (10 percent) want them not to vote to repeal the ACA and move on to other priorities.
Figure 11: About Half of Republicans, Trump Supporters Want Congress to Immediately Repeal the ACA and Work to Replace it Later
Few See Replacement Plan As Fulfilling President Trump’s Promises About Health Care
The majority of the public thinks the current replacement plan being discussed does not fulfill most of the promises President Trump has made about health care while 16 percent say it fulfills most or all of his promises.
Figure 12: Few Think the ACA Replacement Plan Fulfills All or Most of President Trump’s Promises on Health Care
This viewpoint is shared regardless of party identification with majorities of Democrats (81 percent), independents (75 percent), Republicans (56 percent), and Trump supporters (58 percent) saying the current plan fulfills some or none of the promises President Trump has made about health care.
Table 1: Majorities of Democrats, Independents, and Republicans Do Not Think the ACA Replacement Plan Fulfills Most of President Trump’s Health Care Promises
Do you think that the current plan being discussed fulfills all, most, some, or none of the promises President Trump has made about health care?
Democrats
Independents
Republicans
Trump Supporters
All/Most (NET)
10%
10%
34%
29%
All
3
3
8
7
Most
7
7
26
22
Some/None (NET)
81
75
56
58
Some
29
39
50
49
None
51
36
6
8
Don’t know/Refused
10
15
10
13
In addition, the majority of the public (70 percent) – including most Democrats (75 percent), independents (73 percent), and Republicans (59 percent) – say that when it comes to health care, things in this country have pretty seriously gotten off on the wrong track. Fewer, about one in four (24 percent), say things are headed in the right direction. The share who say health care has pretty seriously gotten off on the wrong track is up slightly from earlier this year.
Figure 13: More Now Say When It Comes to Health Care, Things Have Gotten Off on the Wrong Track
The share of Republicans who say health care is headed in the right direction is up slightly from April (37 percent compared to 29 percent), while the share of Democrats and independents who say it has pretty seriously gotten off on the wrong track has also increased (75 percent vs. 60 percent, 73 percent vs. 62 percent, respectively).
Figure 14: Growing Share of Republicans Say Health Care Is Headed in Right Direction
Impact of the Congressional Budget Office’s Report
As lawmakers propose plans to repeal and replace the ACA, the independent Congressional Budget Office (the C.B.O.) estimates how proposals could affect the uninsured rate and health care costs for people and for the nation as a whole. About one-third (35 percent) of the public say they have heard or read about the report by the C.B.O. in the past month. Among these individuals, 44 percent (15 percent of the public overall) say what they heard made them “less likely” to support the replacement while 7 percent (2 percent of public overall) said it made them “more likely” to support it. About half (16 percent of the public overall) say it did not have much effect either way.
Figure 15: A Third of the Public Has Heard About the C.B.O Report, Few Say It Affects Views
Few are Aware of the Specifics from Most Recent C.B.O. Report
Among those who say they have heard or read anything about the C.B.O. report, half (53 percent, or 18 percent of the public overall) are aware that the report said the Senate health plan would increase the number of people without insurance over the next ten years and about one-third (11 percent of the public overall) are aware it would decrease the federal budget deficit over the next ten years.
Figure 16: Few Aware of C.B.O. Report Findings
Half Say New C.B.O. Estimates May Make Them Less Likely to Support
While the majority of the public has not heard or read anything about the most recent C.B.O. report and many are unaware of the specifics about the most recent estimates; at least half of the public say that hearing certain estimates about the impact of the Senate legislation from the C.B.O. may make them “less likely” to support the plan. The majority of Democrats and independents, as well as about half of Republicans say that they would be “less likely” to support the Senate health plan if they heard it would increase premiums for most people who purchase their own insurance on the marketplace. Overall, fewer – but still a majority of Democrats – say hearing that the Senate health plan would increase the number of uninsured people (either by about 15 million or more than 20 million) would make them “less likely” to support the plan. About half also say that hearing it would increase deductibles for people who purchase their own insurance on the marketplace would make them “less likely” to support it.
Table 2: Many Say C.B.O. Estimates of ACA Replacement Plan Impacts Could Make Them Less Likely to Support
Percent who said hearing each of the following from the C.B.O. will make them less likely to support the Senate health care plan:
Total
Democrats
Independents
Republicans
The Senate health plan would increase premiums for most people who purchase their own insurance on the marketplace.
58%
66%
62%
47%
The Senate health plan would increase the number of uninsured by more than 20 million people.
50
64
48
34
The Senate health plan would increase deductible for most people who purchase their own insurance on the marketplace.
49
57
53
37
The Senate health plan would increase the number of uninsured by about 15 million people.
48
62
47
32
Note: Some items asked of separate half-samples. Question wording abbreviated. See topline for full question wording.
Even among Republicans and Trump supporters, about one-fourth say they currently hold favorable views of the replacement plan and would be “less likely” to support the Senate health plan if they heard from the C.B.O. that it would increase premiums for those who buy insurance on the individual marketplace. Slightly smaller shares say they currently hold favorable views of the replacement plan and would be “less likely” to support the Senate health plan if they heard it increased the number of uninsured people or increased deductibles for those who buy insurance on the marketplace.
Figure 17: Of Republicans and Trump Supporters Who Are Favorable of ACA Replacement Plan, Opinions May Change
Medicaid
Over the past few months, Kaiser Health Tracking Polls have consistently found that a majority of the public hold favorable views of Medicaid and oppose changes to the current Medicaid program including scaling back the Medicaid expansion.1 This month’s poll finds that about half of the public are aware that the proposed health plan makes major reductions to Medicaid and the majority of the public oppose such a reduction.
Awareness of Changes to Medicaid
The current plan being discussed by Republicans proposes significant cuts and changes to the current Medicaid program. About half (45 percent) of the public are aware that the current replacement plan makes “major reductions” in federal funding for Medicaid over the next ten years. An additional one-fourth (26 percent) say the health care plan makes “minor reductions” to Medicaid, while 12 percent say it makes “no reductions.” A considerable share (16 percent) say they don’t know if the replacement plan makes any reductions in federal funding for Medicaid or not. The share who are aware the current replacement plan makes “major reductions” in federal funding for Medicaid is up slightly from the June Kaiser Health Tracking Poll (38 percent).
Figure 18: Nearly Half of the Public Are Aware the Current ACA Replacement Plan Makes Major Reductions to Medicaid
The Majority of the Public Oppose Major Reductions to Medicaid
When told about the reduction in federal funding for Medicaid, the majority of the public oppose (65 percent) major reductions to Medicaid as part of a plan to repeal and replace the ACA, while three in ten (28 percent) support such reductions. A large majority of Democrats (88 percent) and individuals who do not approve of President Trump (83 percent) oppose reducing Medicaid funding, as do a majority of independents (63 percent). Slightly more than half of Republicans (54 percent) and half of supporters of President Trump (51 percent) support a major reduction in federal funding for Medicaid as part of a plan to repeal and replace the ACA, while about four in ten do not.
Figure 19: Support for Reducing Federal Funding for Medicaid Varies by Party Identification and Support for Trump
Attitudes Towards Reducing Federal Funding for Medicaid are Somewhat Stable, With State Flexibility Being the Strongest Argument
Attitudes towards reducing federal funding for Medicaid are somewhat stable with some being persuaded from their opinions after hearing arguments for and against reducing federal funding. Among those opposed to a major reduction in federal funding for Medicaid as part of a plan to repeal and replace the ACA, about one-fourth (17 percent of the public overall) change their mind after hearing that this would decrease the amount of money given to states but would also give states more flexibility and control over their Medicaid programs. Fewer, 16 percent (11 percent overall) change their mind after hearing this would decrease the federal budget deficit and decrease federal spending in the future.
Figure 20: Two-Thirds Oppose Major Reduction in Federal Funding for Medicaid; Views Are Somewhat Stable
On the other hand, a small share of those who initially support a major reduction in federal funding for Medicaid shift their opinion after hearing that the majority of federal Medicaid spending was for nursing home care for low-income seniors and health care services for low-income people with disabilities (11 percent). A similar share (about one in ten overall) now oppose reducing federal funding after hearing that it could make it more difficult for states to address the prescription painkiller addiction epidemic.
Figure 21: Three in Ten Support Major Reductions in Federal Funding for Medicaid; Views Are Stable Despite Counter-Arguments
Methodology
This Kaiser Health Tracking Poll was designed and analyzed by public opinion researchers at the Kaiser Family Foundation (KFF). The survey was conducted July 5-10, 2017, among a nationally representative random digit dial telephone sample of 1,183 adults ages 18 and older, living in the United States, including Alaska and Hawaii (note: persons without a telephone could not be included in the random selection process). Computer-assisted telephone interviews conducted by landline (407) and cell phone (776, including 463 who had no landline telephone) were carried out in English and Spanish by SSRS of Media, PA. Both the random digit dial landline and cell phone samples were provided by Marketing Systems Group (MSG). For the landline sample, respondents were selected by asking for the youngest adult male or female currently at home based on a random rotation. If no one of that gender was available, interviewers asked to speak with the youngest adult of the opposite gender. For the cell phone sample, interviews were conducted with the adult who answered the phone. KFF paid for all costs associated with the survey.
The combined landline and cell phone sample was weighted to balance the sample demographics to match estimates for the national population using data from the Census Bureau’s 2015 American Community Survey (ACS) on sex, age, education, race, Hispanic origin, and region along with data from the 2010 Census on population density. The sample was also weighted to match current patterns of telephone use using data from the July- December 2016 National Health Interview Survey. The weight takes into account the fact that respondents with both a landline and cell phone have a higher probability of selection in the combined sample and also adjusts for the household size for the landline sample. All statistical tests of significance account for the effect of weighting.
The margin of sampling error including the design effect for the full sample is plus or minus 3 percentage points. Numbers of respondents and margins of sampling error for key subgroups are shown in the table below. For results based on other subgroups, the margin of sampling error may be higher. Sample sizes and margins of sampling error for other subgroups are available by request. Note that sampling error is only one of many potential sources of error in this or any other public opinion poll. Kaiser Family Foundation public opinion and survey research is a charter member of the Transparency Initiative of the American Association for Public Opinion Research.
A new analysis from the Kaiser Family Foundation estimates that 1.5 million people with pre-existing conditions could face higher premiums under an amendment suggested by Sen. Ted Cruz to the Better Care Reconciliation Act (BCRA), the Senate’s proposed replacement for the Affordable Care Act (ACA).
The amendment, which is being discussed but has not been introduced, reportedly would allow insurers in the non-group market to sell some policies that don’t follow all ACA market rules – including the requirement to provide coverage for ACA-defined essential health benefits, such as maternity care, drugs to treat cancer or HIV, or therapies to treat mental health and substance abuse disorders. Without the essential health benefits requirement for some plans, ACA-compliant plans would attract sicker people who need those benefits, while more healthy people would purchase non-compliant plans. In addition, some reports suggest non-compliant plans could turn people down or charge them more based on health status. As a result, premiums for compliant plans would rise significantly, while premiums for non-compliant plans would be substantially lower.
Under the Senate health bill, people with incomes below 350 percent of the federal poverty level are eligible for tax credits to defray premium costs; people with incomes above this threshold who have pre-existing conditions would be at risk of paying full, unaffordable rates for plans that covered their health needs.
The new Foundation analysis estimates that 1.5 million people in the non-group insurance market with incomes of 350 percent of the federal poverty level or higher had a pre-existing condition that would have been considered automatically deniable by insurers prior to the ACA. If these individuals could buy cheaper, non-compliant plans, they could still be left with unaffordable medical bills for uncovered care. Millions of others could have other types of pre-existing conditions that were not considered automatically declinable.