KFF designs, conducts and analyzes original public opinion and survey research on Americans’ attitudes, knowledge, and experiences with the health care system to help amplify the public’s voice in major national debates.
House Passes Minibus That Includes Global Health Funding In FY 2020 State & Foreign Operations (SFOPs) and Health & Human Services (HHS) Appropriations Bills
On June 19, 2019, the House passed a package of FY 2020 appropriations bills (minibus), which included global health funding for the U.S. Department of State, U.S. Agency for International Development (USAID), and U.S. Department of Health and Human Services (HHS). Global health funding amounts in the minibus bill matched those provided in FY 2020 appropriations bills previously passed by the House Appropriations Committee. Please see the KFF summaries on the House Appropriations Committee approval of the FY 2020 State & Foreign Operations (SFOPs) and Health & Human Services (HHS) appropriations bills for more details.
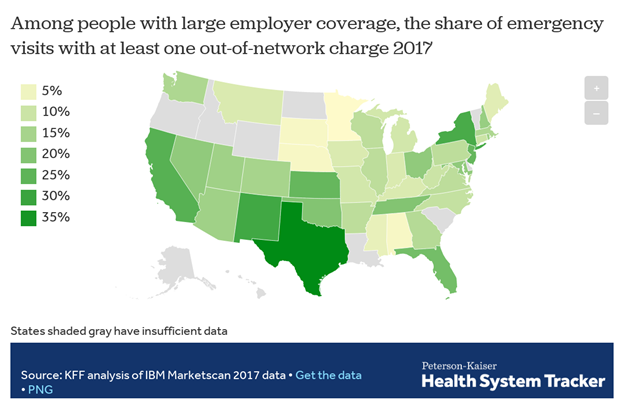
In roughly 1 of every 6 emergency room visits and inpatient hospital stays in 2017, patients came home with at least one out-of-network medical bill, a new KFF analysis finds.
More specifically, 18 percent of all emergency visits and 16 percent of in-network hospital stays had at least one out-of-network charge, leaving patients at risk for surprise medical bills, according to the analysis of claims data from large employer plans. The analysis also finds the incidence of such charges varied greatly by state, for both emergency visits and hospital stays. For instance, emergency care visits were more likely to result in at least one out-of-network charge in Texas, New Mexico, New York, California and Kansas, and less likely in Minnesota, South Dakota, Nebraska, Alabama and Mississippi.
The findings come at a time when policymakers of both major political parties in Washington have vowed to pass legislation to protect consumers against surprise medical bills. At the same time, more than a dozen states have enacted or implemented comprehensive laws to combat the problem for people enrolled in state-regulated plans. Due to limits imposed by federal law, it remains the case that people with large employer coverage generally are not protected by state surprise billing laws if their plan is self-insured. The analysis summarizes key provisions in states’ laws and describes the major features of bipartisan federal legislation under consideration in the House and Senate.
Surprise medical bills generally arise in two forms. In one, the patient is required to pay a greater share of costs under her health plan because the medical services performed were out-of-network. In the other, an out-of-network physician or other provider “balance bills” the patient in an attempt to collect the difference between the amount the provider charged for services and the amount the health plan was willing to pay. Surprise bills are the result of situations beyond a patient’s control, such as emergency care or treatment by an out-of-network provider at an in-network facility. Most of the potential surprise out-of-network emergency charges observed in this study were from doctors and other out-of-network professionals, rather than from the hospital or emergency facility. Due to limitations in the available data, KFF researchers were not able to estimate the dollar amounts of surprise bills.
KFF polling has shown that two-thirds of Americans says they are either “very worried” (38%) or “somewhat worried” (29%) about being able to afford their own or a family member’s unexpected medical bills. More than three quarters of Americans want the federal government to take action to address surprise bills, though opinion is divided over who should shoulder the cost – providers, insurers or both.
This analysis examines how often patients get hit with surprise medical bills, what circumstances tend to give rise to them and what proposals are being considered to protect consumers from this problem. The study of claims data from large employer health plans finds that in roughly 1 of every 6 emergency room visits and inpatient hospital stays in 2017, patients came home with at least one out-of-network medical bill. More specifically, 18 percent of all emergency visits and 16 percent of in-network hospital stays had at least one out-of-network charge, leaving patients at risk for surprise medical bills. The risk of getting a surprise bill is much greater in some states. For instance, emergency care visits were more likely to result in at least one out-of-network charge in Texas, New Mexico, New York, California and Kansas, and less likely in Minnesota, South Dakota, Nebraska, Alabama and Mississippi. The analysis is part of the Peterson-Kaiser Health System Tracker, an online information hub dedicated to monitoring and assessing the performance of the U.S. health system.
Health care is leading the list of possible topics Democrats and Democratic-leaning independents want to hear the 2020 Democratic presidential candidates talk about during their upcoming debates, with nearly nine in ten (87 percent) saying it is very important for candidates to talk about health care. This is closely followed by eight in ten who say it is very important for candidates to discuss issues affecting women, perhaps reflecting recent news attention on these issues. Health care and women’s issues rank ahead of other top issues for Democrats and Democratic-leaning independents such as climate change (73 percent), gun policy (72 percent), income inequality (70 percent), the economy (69 percent), and immigration (66 percent).
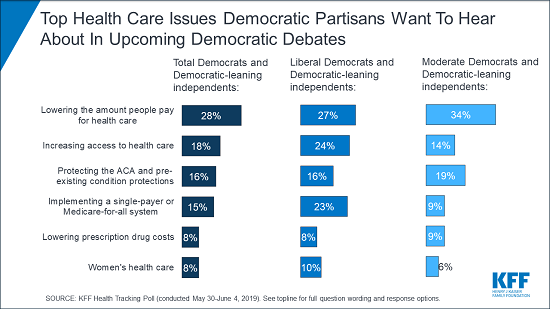
When asked to say in their own words which health care issues they want to hear candidates discuss, affordability emerges as a top issue with nearly three in ten Democrats and Democratic-leaning independents mentioning lowering the amount people pay for health care (28 percent). A further eight percent mention lowering the cost of prescription drugs. Access to health care also emerges as a key topic with one in five mentioning increasing access to health care (18 percent) while an additional 15 percent explicitly mention implementing a single-payer or Medicare-for-all system.
Poll: Most Americans don’t realize how dramatically the leading Medicare-for-all proposals would restructure the nation’s health care system
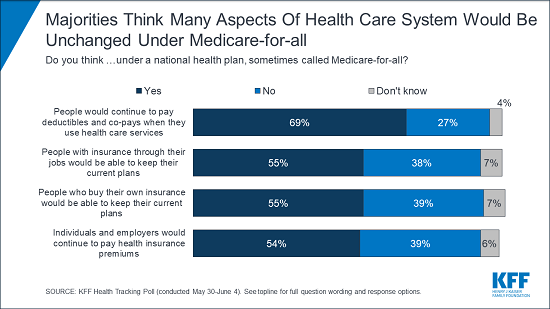
The most recent KFF Health Tracking Poll finds majorities across partisans think taxes for most people would increase under a national health plan, sometimes called Medicare-for-all (78 percent), and about half (53 percent) think private health insurance companies would no longer be the primary way Americans would get health coverage under such a plan. However, when it comes to other key changes that the leading Medicare-for-all bills introduced by Sen. Bernie Sanders and Rep. Pramila Jayapal would bring, large shares are unaware of how the current health care system may be affected. For example, majorities say people would continue to pay deductibles and co-pays (69 percent) and continue to pay premiums (54 percent) under a Medicare-for-all plan. Likewise, majorities say people with employer-sponsored or self-purchased insurance would be able to keep their plans (55 percent each) under a Medicare-for-all plan.
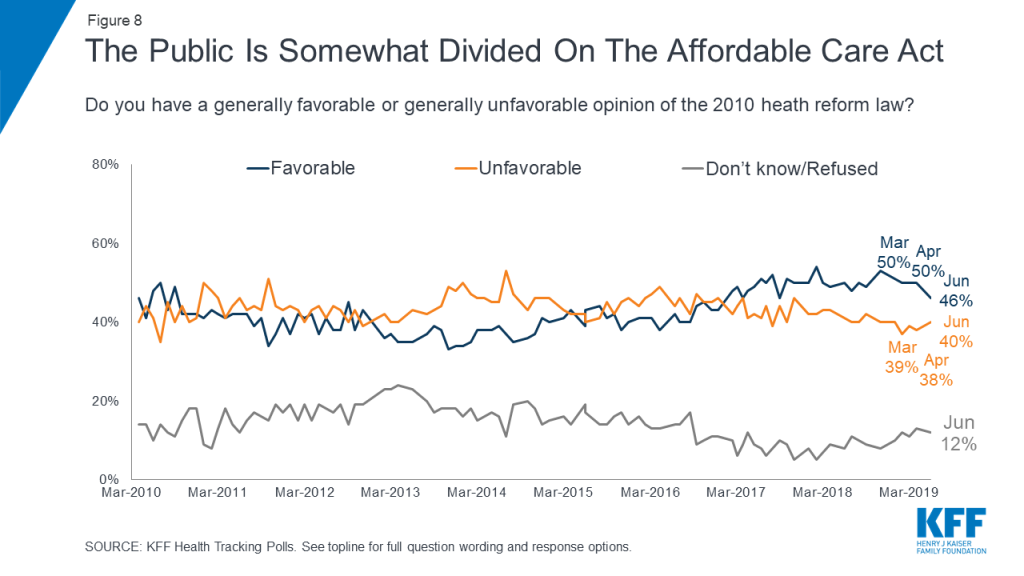
Overall, nearly half of the public (46 percent) hold favorable views of the 2010 Affordable Care Act while four in ten hold unfavorable views. Majorities of Democrats continue to hold favorable views towards the law while majorities of Republicans hold unfavorable views. Independents are more divided with similar shares holding favorable and unfavorable views. To see the shifts in public attitudes towards the law over time, check out the KFF interactive.
Health Care in The Democratic Primary
What do Democrats want their 2020 presidential candidates to talk about heading into the primary debates? Health care and issues affecting women top their priority list in this @KaiserFamFound poll
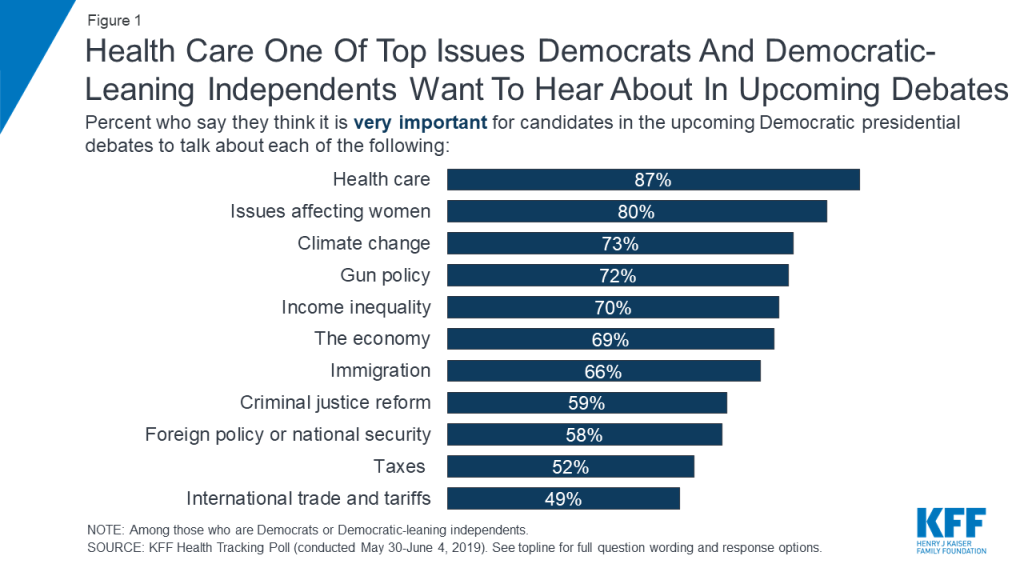
Less than one month before the first 2020 Democratic presidential primary debate, KFF polling finds health care is among the top issues that Democrats and Democratic-leaning independents want to hear the candidates talk about during the upcoming debates. Nearly nine in ten Democrats and Democratic-leaning independents (87 percent) say it is “very important” for the candidates to talk about health care during the upcoming Democratic presidential debates. This is followed by eight in ten who say it is “very important” for the candidates to discuss issues that affect women, an issue that garnered recent media attention.
Figure 1: Health Care One Of Top Issues Democrats And Democratic-Leaning Independents Want To Hear About In Upcoming Debates
About seven in ten say it is “very important” for the candidates to discuss climate change (73 percent), gun policy (72 percent), income inequality (70 percent), the economy (69 percent), and immigration (66 percent). These are followed by criminal justice reform (59 percent), foreign policy or national security (58 percent), and about half say it is “very important” for the candidates to talk about taxes (52 percent) and international trade and tariffs (49 percent) in the upcoming Democratic debates.
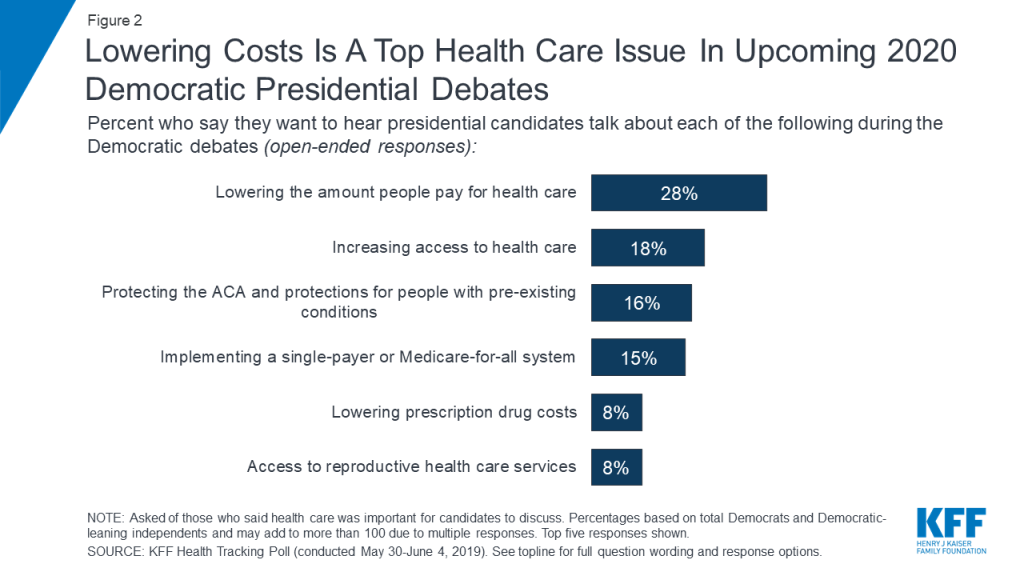
When those who say health care is at least somewhat important for 2020 Democratic presidential candidates to discuss in upcoming debates are asked to offer in their own words what specifically about health care they want to hear about, nearly three in ten Democrats and Democratic-leaning independents overall offer responses related to lowering the amount people pay for health care (28 percent) and another eight percent explicitly mention lowering prescription drug costs. To learn more about Americans’ experiences with health care costs, check out this data note.
Access to health care also emerges as a key issue with one in five (18 percent) offering responses related to increasing access to health care and an additional 15 percent explicitly mentioning implementing a single-payer or Medicare-for-all system. The 2010 Affordable Care Act is also still on the minds of Democrats and Democratic-leaning independents with one in six mentioning protecting the Affordable Care Act and protections for people with pre-existing conditions (16 percent) as the top health care issue they want to hear about during the upcoming presidential debates. An additional one in ten (8 percent) offer access to reproductive health care services.
Figure 2: Lowering Costs Is A Top Health Care Issue In Upcoming 2020 Democratic Presidential Debates
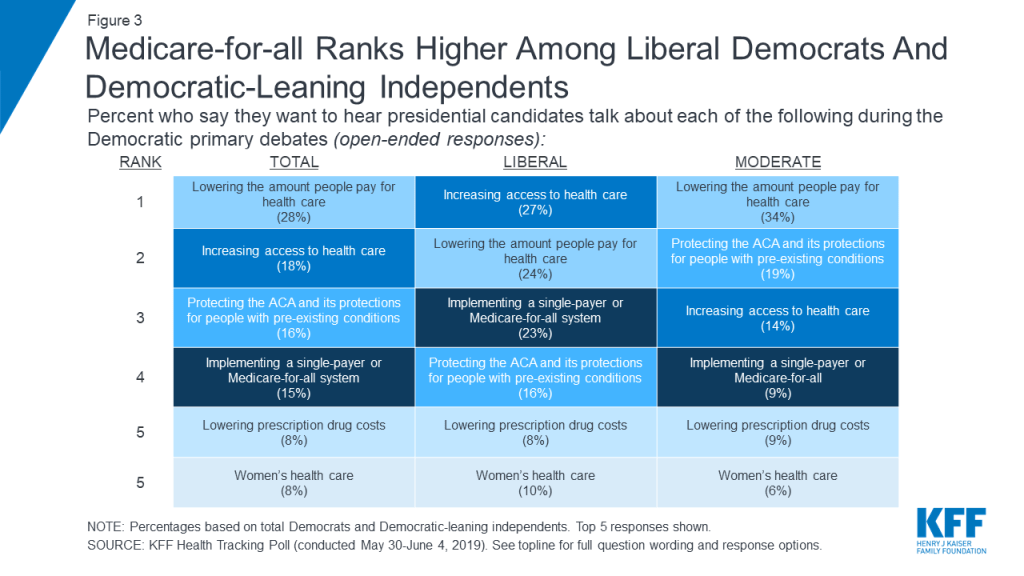
Though lowering costs and increasing access emerge as the top issues that Democrats and Democratic-leaning independents want to hear presidential candidates talk about, there are some notable differences between liberals and moderates. One-fourth of liberal Democrats and Democratic-leaning independents (23 percent) offer implementing a single-payer or Medicare-for-all system when asked what health care issue they want to hear the candidates discuss, making it among the top health care issues offered by this group along with increasing access (27 percent) and lowering the amount people pay for health care (24 percent). Among moderate Democrats and Democratic-leaning independents, more than three times as many offer lowering the amount people pay for health care (34 percent) than implementing a Medicare-for-all system (9 percent).
Figure 3: Medicare-for-all Ranks Higher Among Liberal Democrats And Democratic-Leaning Independents
Kaiser Family Foundation Focus GroupsDuring the spring of 2019, Kaiser Family Foundation conducted a series of 6 focus groups with a total of 56 participants in Texas, Florida, and Pennsylvania, examining voters’ top health care issues and their views of various national health care proposals. The groups included Republicans, Democrats, independents, seniors, and young adults, and found a disconnect between what the public is talking about when it comes to health care compared to the political discussions happening in Washington, D.C. and on the 2020 campaign trail. Read Drew Altman’s takeaways from the KFF focus groups here.
A National Health Plan or Medicare-for-all
Implementing a national health plan, sometimes called Medicare-for-all, has been a dominant issue during the 2020 Democratic primary. Previous KFF polling has found that a slight majority supports the idea of a national health plan, but attitudes towards such a proposal are fairly malleable with significant shares, on either side of the debate, shifting their opinion once they hear counter-arguments. With several bills being introduced in the 116th Congress that would expand the role of public programs in health, this month’s Kaiser Health Tracking Poll examines the public’s awareness on key aspects of Medicare-for-all plans including Sen. Sanders’ Medicare for All Act of 2019 and Rep. Japayal’s bill of the same name.1
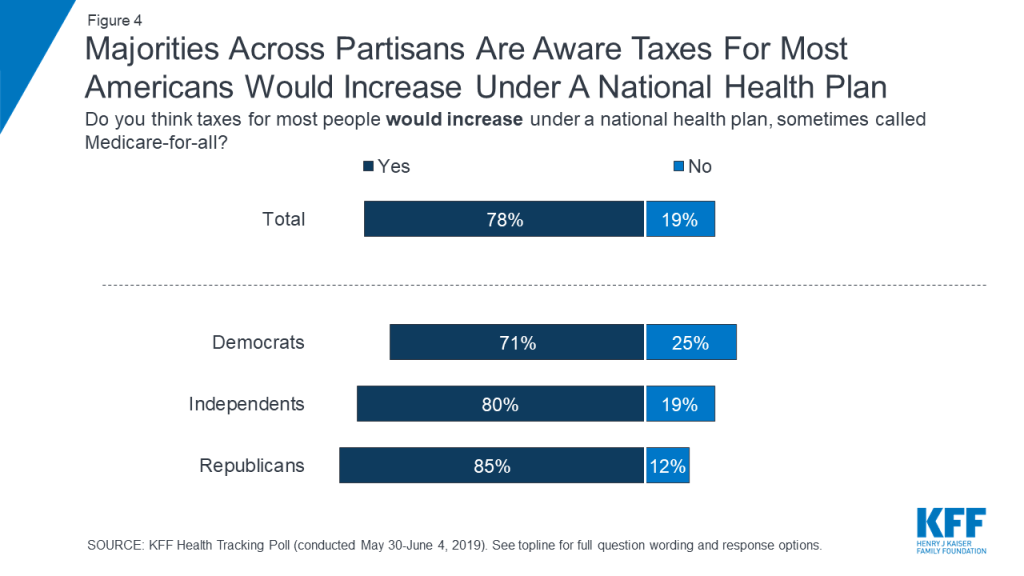
Eight in ten (78 percent) think that under a national health plan, sometimes called Medicare-for-all, taxes for most people would increase. Majorities of Democrats (71 percent), independents (80 percent), and Republicans (85 percent) say that taxes for most Americans would increase under a national health plan.
Figure 4: Majorities Across Partisans Are Aware Taxes For Most Americans Would Increase Under A National Health Plan
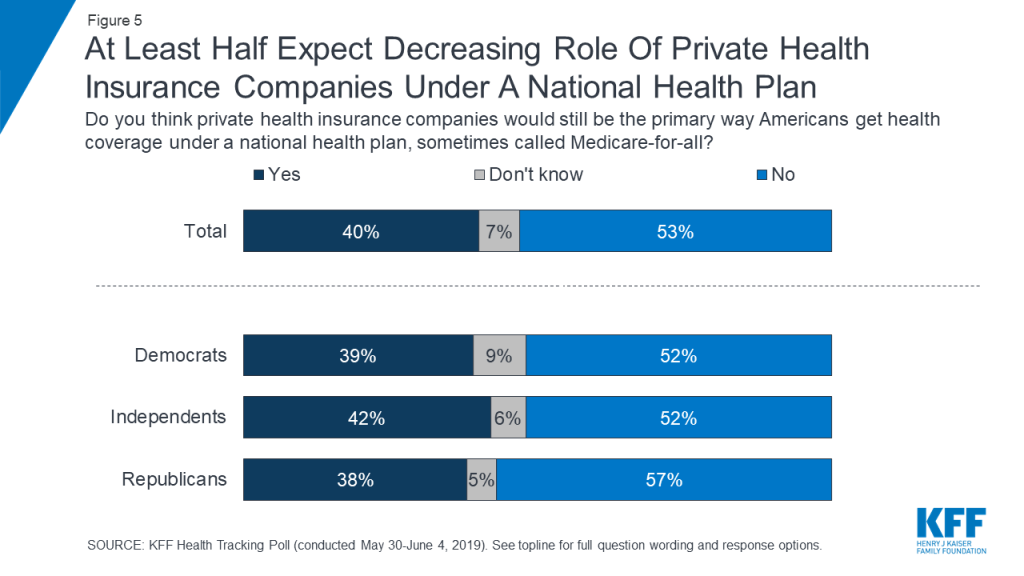
In addition, about half of Americans (53 percent) – including half of Democrats and independents (52 percent each) and most Republicans (57 percent) – think that under a national health plan, private health insurances would no longer be the primary way Americans would get health coverage. Still, a substantial four in ten of the public believe that under such a plan, private health insurance companies would still be the primary source of coverage for most Americans and an additional seven percent say they do not know what would happen under a national health plan.
Figure 5: At Least Half Expect Decreasing Role Of Private Health Insurance Companies Under A National Health Plan
In focus groups, many participants expressed skepticism about the idea that private insurance companies would cease to exist under a Medicare-for-all plan. Some thought these companies were just too powerful, and others thought they would continue to exist for people who want to buy extra coverage beyond what a national plan would offer.
In their own words: Focus group participants on private insurance
[Moderator: Do you think Medicare-for-all means that private health insurance companies will go away?]
“No, because they’d be running Medicare-for-all.” (Houston, independent)
“Or even those individuals who can afford to have the type of coverage they want, they wouldn’t want a basic burger. No, they want to add all of the extra fixings because they can afford it.” (Houston, independent)
“They’re going to take a hit obviously but I don’t think that they’re really going to go away. They’re too powerful.” (Harrisburg, Democrat)
“I don’t think for a second that private insurance would go away, even if you implemented this. There will always be the Cadillac plan that is available, because as long as somebody—the market will react.” (Orlando, Democrat)
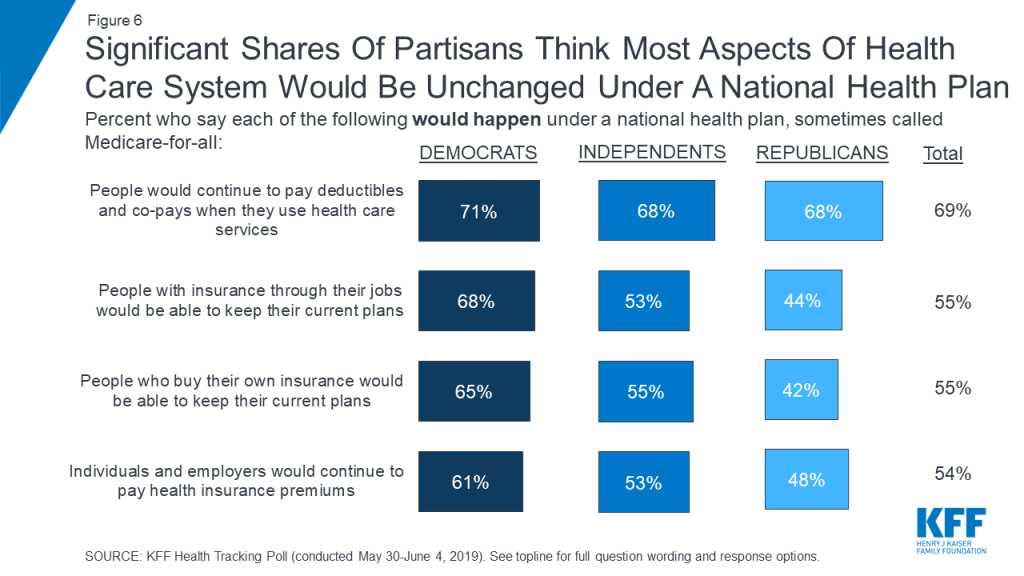
When it comes to other potential impacts of a national health plan, many Americans say most aspects of the current health care system would remain unchanged. Majorities of Democrats, independents, and Republicans say people would continue to pay deductibles and co-pays when they use health care services (71 percent, 68 percent, and 68 percent, respectively). In addition, majorities of both Democrats and independents also believe people with employer-sponsored insurance would be able to keep their current coverage (68 percent and 53 percent), people who purchase their own plans would be able to keep their current coverage (65 percent and 55 percent), and individuals and employers would continue to pay health insurance premiums (61 percent and 53 percent). At least four in ten Republicans also say each of these things would happen under a national health plan. Small shares of the public overall say they don’t know whether each of these things would happen under such a plan (4 percent say they don’t know if people would continue to pay deductibles and co-pays, 7 percent say they don’t know for the other changes included).
Figure 6: Significant Shares Of Partisans Think Most Aspects Of Health Care System Would Be Unchanged Under A National Health Plan
Focus group findings also indicate that many people don’t believe a Medicare-for-all plan would result in the elimination of health insurance premiums or cost-sharing.
In their own words: Focus group participants on premiums and cost-sharing
[Moderator: Do you think Medicare-for-all means that there would be no more co-pays or deductibles when people use care?]
“No, I think there’d probably still be co-pays and deductibles, but just be affordable.” (Houston, independent)
“It wouldn’t make sense to you that you wouldn’t have to pay [co-pays and deductibles] because it wouldn’t feel sustainable.” (Houston, independent)
“My mom is on Medicare and she has to pay co-pays.” (Houston, independent)
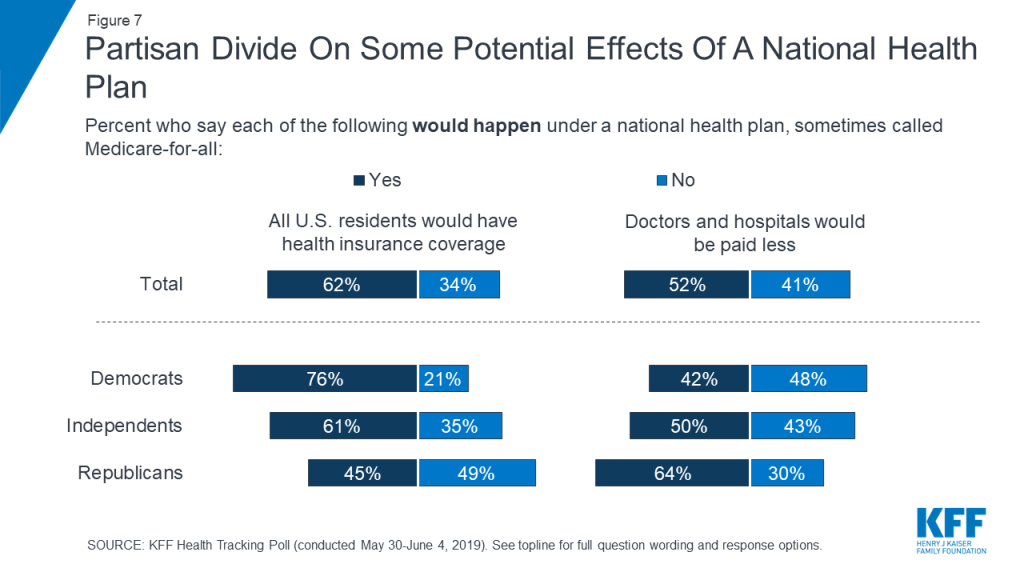
There is a partisan divide on some aspects of how a national health plan would affect people and health care providers. Three-fourths of Democrats (76 percent) say that all U.S. residents would have health insurance coverage under a national health plan while about half of Republicans say this would not happen (49 percent). On the other hand, most Republicans say a national health plan would lead to doctors and hospitals being paid less (64 percent) while about half of Democrats say this would not happen (48 percent). Large shares of independents believe both of these things would happen, with six in ten (61 percent) saying all U.S. residents would get health coverage and half saying doctors and hospitals would be paid less.
Figure 7: Partisan Divide On Some Potential Effects Of A National Health Plan
Table 1: Partisans Disagree On Some Basic Implications of a National Health Plan
Percent who think each of the following would happen under a national plan, sometimes called Medicare-for-all:
Total
Democrats
Independents
Republicans
Taxes for most people would increase
78%
71%
80%
85%
All U.S. residents would have health insurance coverage
62
76
61
45
Private health insurance companies would NOT be the primary way Americans get health coverage
53
52
52
57
Doctors and hospitals would be paid less
52
42
50
64
People who buy their own insurance would NOT be able to keep their current plans
39
24
40
53
Individuals and employers would NOT continue to pay health insurance premiums
39
31
42
45
People with employer-sponsored insurance would NOT be able to keep their current plans
38
25
42
47
People would NOT continue to pay deductibles and co-pays when they use health care services
27
25
29
28
Public Views of The ACA
While the public still holds largely partisan views over the Affordable Care Act and opinions have remained relatively unchanged for the past two years since the Republican efforts to repeal the law, views are down slightly this month. Nearly half of the public (46 percent) hold favorable opinions of the ACA while four in ten hold a negative opinion of the law. Across partisans, nearly eight in ten Democrats (79 percent) have a favorable view of the ACA compared to nearly half of independents (47 percent), and about one-sixth of Republicans (16 percent).
Figure 8: The Public Is Somewhat Divided On The Affordable Care Act
Methodology
This KFF Health Tracking Poll was designed and analyzed by public opinion researchers at the Kaiser Family Foundation (KFF). The survey was conducted May 30th–June 4th 2019, among a nationally representative random digit dial telephone sample of 1,206 adults ages 18 and older, living in the United States, including Alaska and Hawaii (note: persons without a telephone could not be included in the random selection process). The sample included 265 respondents reached by calling back respondents that had previously completed an interview on the KFF Tracking poll at least nine months ago. Computer-assisted telephone interviews conducted by landline (298) and cell phone (908, including 615 who had no landline telephone) were carried out in English and Spanish by SSRS of Glen Mills, PA. To efficiently obtain a sample of lower-income and non-White respondents, the sample also included an oversample of prepaid (pay-as-you-go) telephone numbers (25% of the cell phone sample consisted of prepaid numbers) as well as a subsample of respondents who had previously completed Spanish language interviews on the SSRS Omnibus poll (n=10). Both the random digit dial landline and cell phone samples were provided by Marketing Systems Group (MSG). For the landline sample, respondents were selected by asking for the youngest adult male or female currently at home based on a random rotation. If no one of that gender was available, interviewers asked to speak with the youngest adult of the opposite gender. For the cell phone sample, interviews were conducted with the adult who answered the phone. KFF paid for all costs associated with the survey.
The combined landline and cell phone sample was weighted to balance the sample demographics to match estimates for the national population using data from the Census Bureau’s 2017 American Community Survey (ACS) on sex, age, education, race, Hispanic origin, and region along with data from the 2010 Census on population density. The sample was also weighted to match current patterns of telephone use using data from the January-June 2018 National Health Interview Survey. The weight takes into account the fact that respondents with both a landline and cell phone have a higher probability of selection in the combined sample and also adjusts for the household size for the landline sample, and design modifications, namely, the oversampling of prepaid cell phones and likelihood of non-response for the re-contacted sample. All statistical tests of significance account for the effect of weighting.
The margin of sampling error including the design effect for the full sample is plus or minus 3 percentage points. Numbers of respondents and margins of sampling error for key subgroups are shown in the table below. For results based on other subgroups, the margin of sampling error may be higher. Sample sizes and margins of sampling error for other subgroups are available by request. Note that sampling error is only one of many potential sources of error in this or any other public opinion poll. Kaiser Family Foundation public opinion and survey research is a charter member of the Transparency Initiative of the American Association for Public Opinion Research.
Group
N (unweighted)
M.O.S.E.
Total
1,206
±3 percentage points
Registered voters
1,020
±4 percentage points
Party Identification
Democrats
346
±6 percentage points
Republicans
322
±6 percentage points
Independents
404
±6 percentage points
Democrats/Democratic-leaning independents/Independents with no leaning
As Congress and the Democratic presidential candidates continue to discuss Medicare-for-all and other proposals to expand public health coverage, most Americans know little about how the leading Medicare-for-all proposals would reshape the way all Americans get and pay for health care.
This month’s KFF Health Tracking Poll probes the public’s awareness of key elements of proposals to create a national health plan, including the leading Medicare-for-all bills introduced by Sen. Bernie Sanders and Rep. Pramila Jayapal.
While half (53%) think that Medicare-for-all would mean private health insurance would no longer be the primary way Americans get health coverage, a substantial share believe that under such a system, private insurers would continue to cover most Americans (40%) or don’t know (7%). In addition, while 62% think that Medicare-for-all would result in all U.S. residents having health coverage, a significant share (34%) do not think this would happen.
On most other major features of the Medicare-for-all proposals, majorities of Americans are unaware of the kind of dramatic changes that the plans would bring to the nation’s health care system. For example:
69% say that people would continue to pay deductibles and co-pays when they use health care services, though the leading Medicare-for-all bills propose eliminating that kind of cost-sharing;
55% say people who are covered through their jobs would be able to keep that coverage, though a new national health plan would replace that coverage under Medicare-for-all;
55% say people who buy their own insurance would be able to keep their current plans, though they also would be included in a new national plan under Medicare-for-all; and
54% say individuals and employers would continue to pay health insurance premiums, though the Medicare-for-all bills would eliminate such premiums.
One aspect of the leading Medicare-for-all proposals is widely understood: Its impact on taxes. The survey finds eight in 10 Americans (78%) are aware that taxes would increase for most people under such a plan.
There is a partisan divide on some aspects of how a national health plan would affect people and health care providers.
Three-fourths of Democrats (76%) say that all U.S. residents would have health insurance coverage under a national health plan compared to 45% of Republicans. On the flip side, almost two-thirds of Republicans (64%) say a national health plan would lead to doctors and hospitals being paid less, while fewer Democrats (42%) say this would happen. Large shares of independents believe both of these things would happen, with six in 10 (61%) saying all U.S. residents would get health coverage and half saying doctors and hospitals would be paid less.
With the first Democratic presidential debates set for June 26 and 27, the poll also probes what Democrats and Democratic-leaning independents most want to hear the candidates discuss. Health care emerges as the top issue, with 87% saying it is “very important” for candidates to discuss in the debates.
Amid news coverage about abortion restrictions and the #MeToo movement, issues affecting women ranks second among Democrats and Democratic-leaning independents, with 80% saying this is “very important” for candidates to talk about. Other top issues for Democrats include climate change (73%), gun policy (72%), income inequality (70%), the economy (69%) and immigration (66%).
When asked specifically what aspect of health care that they want to hear about, nearly three in 10 Democrats and Democratic leaners (28%) mention concerns around lowering the amount people pay people for health care. Another 8% mention lowering the cost of prescription drugs.
Somewhat fewer mention increasing access to health care (18%) while an additional 15% explicitly mentioning implementing a single-payer or Medicare-for-all system. One in six mention protecting the Affordable Care Act (16%), and a smaller share mentions access to reproductive health services (8%).
The issue of Medicare-for-all resonates more with liberal Democrats than with moderate ones. Among liberal Democrats and Democratic-leaning independents, a quarter (23%) explicitly name implementing a single-payer or Medicare-for-all system as their top health care issue. Among moderate Democrats and Democratic-leaning independents, just 9% cite Medicare-for-all as their top health care issue, while three times as many cite lowering the amount people pay for health care (34%).
Designed and analyzed by public opinion researchers at KFF, the poll was conducted May 30-June 4, 2019 among a nationally representative random digit dial telephone sample of 1,206 adults. Interviews were conducted in English and Spanish by landline (298) and cell phone (908). The margin of sampling error is plus or minus 3 percentage points for the full sample. For results based on subgroups, the margin of sampling error may be higher.
Providing treatment to people with addiction who are involved with the criminal justice system can help address the epidemic of opioid use disorder (OUD) and increasing rates of overdose in the U.S. Many people with OUD and other substance use disorders (SUD) are involved with the criminal justice system. The period that immediately follows incarceration poses extremely high health risks for them. The ACA Medicaid expansion provided new opportunities to connect individuals leaving incarceration to coverage and services that can mitigate these risks and help people successfully transition into the community with services to support recovery and treatment.
The ACA Medicaid expansion provided new opportunities to connect individuals with addiction who are leaving incarceration to health coverage & services. KFF looked at efforts in four states, with a focus on people with opioid use disorder. #MO #OH #NM #RI
This issue brief identifies key lessons learned from how four states (Missouri, Ohio, New Mexico, Rhode Island) are connecting people leaving the criminal justice system to Medicaid coverage and services, with a focus on medication-assisted treatment (MAT) and supports for people with OUD. It builds on previous briefs that assessed state efforts to connect people involved in the justice system to Medicaid coverage.1 It is based on interviews conducted in late 2018 and early 2019 with state Medicaid, behavioral health, and corrections officials in the four states and in Bernalillo County, New Mexico, as well as interviews with managed care organizations, providers, and advocates in those states and published information on the states’ experiences. In sum, it finds:
Medicaid expansion has served as a key impetus for re-entry efforts. It significantly increased opportunities to provide coverage to individuals moving into and out of incarceration and to connect individuals to services to address their health and recovery needs as they transition back into the community. Re-entry initiatives are a key component of broad statewide strategies to address the opioid epidemic given the high rates of SUD among the justice-involved population and the elevated risk of death upon release into the community.
States can facilitate connections to coverage for individuals transitioning into and out of incarceration by suspending eligibility for those that enter incarceration with Medicaid coverage and providing enrollment assistance prior to release. Experiences from the study states show that initiating enrollment efforts early, establishing automated processes, and providing peer supports can help overcome challenges associated with enrolling eligible individuals as they move into and out of incarceration. The study states that expanded Medicaid have realized significant increases in coverage rates among justice-involved individuals and positive impacts on state budgets. As a result of increases in Medicaid coverage, some have been able to redirect state and local resources to support services not covered by Medicaid. In addition, corrections departments reported savings due to Medicaid coverage for inpatient care provided to incarcerated individuals.
States are advancing coordination of care and access to services, including MAT, to support successful re-entry. The study states are utilizing Medicaid Managed Care Organizations (MCOs) and providers to facilitate connections to care for individuals as they transition back into the community by coordinating care prior to release. The study states also are supporting treatment and recovery and transitions into the community by providing access to Medication Assisted Treatment (MAT) while individuals are incarcerated or just prior to release and linking individuals to MAT providers in the community. Experiences from the study states point to improvements in access to care and promising impacts on health and recidivism from efforts to connect individuals to care in the community, but data on impacts remain limited.
Even with enrollment and care coordination efforts in place, there remain gaps and challenges in covering justice-involved individuals and connecting them to care as they transition back into the community. One major challenge is the lack of behavioral and SUD providers within the community, particularly in rural areas. States also are working to overcome operational obstacles like systems compatibility and unpredictable release dates. In addition, ongoing stigma associated with SUD and OUD, as well as stigma with justice system involvement, remain key challenges for supporting recovery initiatives and efforts, particularly MAT.
Background
People in the justice system have significant health needs, including high rates of OUD and other SUDs.2,3 When people with SUD leave incarceration, they are at extremely high risk of overdose and death.4 Opioid overdoses are the leading cause of death among people who are formerly incarcerated.5 Providing evidence-based treatment to people with OUD, including MAT, as they leave incarceration can help reduce the risk of overdose in this population. MAT, which is the evidence-based standard for OUD, refers to the provision of one of three medications (methadone, buprenorphine, and naltrexone), in conjunction with behavioral health services, such as counseling. Evidence is emerging that it also reduces recidivism and criminal justice costs.6
Medicaid coverage provides individuals access to treatment and services to address OUD and other SUDs, including MAT. Medicaid coverage of mental health and SUD treatment has expanded since 2010.7 Currently, all state Medicaid programs cover at least one of the three Food and Drug Administration (FDA)-approved MAT medications. States are also expanding access to MAT through section 1115 demonstrations that establish a continuum of care for people with SUD.8 The SUPPORT Act, enacted last year, requires states to cover MAT between 2020 and 2025, unless a state faces substantial provider shortages.
A growing number of states are adopting policies and approaches to facilitate connections to Medicaid coverage and care for people transitioning into and out of incarceration. State efforts to connect justice-involved individuals to Medicaid coverage increased following the Affordable Care Act (ACA) since it expanded Medicaid eligibility to many low-income adults previously excluded from the program. The expansion made coverage available to more people involved in the criminal justice system. Previously, few adults involved with the criminal justice system qualified for Medicaid due to restrictions that excluded low-income adults without dependent children from the program.
Key Findings
Factors Driving Re-Entry Initiatives
The Medicaid expansion was a key driving factor behind re-entry initiatives in the study states that implemented the expansion. The three study states that expanded Medicaid—New Mexico, Ohio, and Rhode Island—launched re-entry programs in 2014, when the Medicaid expansion was initially implemented. Respondents noted that the re-entry work was spurred by the increased opportunities to secure Medicaid payments for inpatient care provided to incarcerated individuals and to provide coverage to individuals as they transition back into the community. New Mexico passed a state law in 2014 that requires eligibility to be suspended rather than terminated for individuals entering incarceration with Medicaid coverage. The law also allows individuals who enter incarceration to apply for Medicaid if they are not already enrolled, and enhanced data sharing across agencies, including county and state correctional facilities, juvenile and adult prisons, jails and detention centers. In contrast, Missouri did not implement the Medicaid expansion, and eligibility for justice-involved individuals remains very limited.
Re-entry initiatives are a key component of broad statewide strategies to address the opioid epidemic. Respondents noted that re-entry initiatives play a major role in broad efforts to address the opioid epidemic given the high rates of SUD among the justice-involved population and the elevated risk of death upon release into the community. Officials in Rhode Island indicated that the Governor created an opioid addiction prevention task force focused on re-entry in 2015 due to high rates of overdose death and began increasing the budget for OUD in 2016. Missouri’s re-entry work grew from a 2002 grant to address recidivism, and has since been spurred by the Governor’s focus on addressing the opioid epidemic and the recognition that most of the prison population is incarcerated due to drug-related offenses.
Respondents universally pointed to leadership and collaboration as the most important factors contributing to successful efforts to strengthen connections to Medicaid coverage and promote use of treatment and other services at re-entry. They noted that leadership support and coordination at the agency cabinet level is key for resolving operational challenges and promoting a consistent message about the states’ efforts to address SUD. Some noted that it is important to set a common goal across agencies and to promote buy-in of staff at all levels of the organization, particularly in corrections departments. It was noted that identifying how re-entry initiatives can support safer environments with lower rates of recidivism can help garner support from partners in corrections. Respondents also emphasized that translating leadership commitment to agency operations and fostering cross-agency alignment through memorandums of understanding (MOUs) and other arrangements improves coordination and smooths operations.
Strategies to Connect Individuals to Coverage
Individuals who are incarcerated and meet eligibility criteria can enroll or remain enrolled in Medicaid. However, under federal policy, Medicaid does not pay for health services to people who are in jail or prisons, with the exception of inpatient treatment. To facilitate coverage among individuals transitioning into and out of incarceration, federal policy encourages state agencies to suspend, rather than terminate, Medicaid eligibility during incarceration. It also assigns states responsibility to accept applications and renew eligibility while an individual is incarcerated. As of 2018, 38 states suspend rather than terminate Medicaid eligibility for people in prison, and 36 suspend Medicaid coverage for individuals in jail.9
Suspending eligibility has enabled the states to access Medicaid payments for inpatient care provided to incarcerated individuals and facilitate reinstatement of full Medicaid coverage for individuals upon release. New Mexico, Ohio, and Rhode Island each maintain coverage for individuals that enter incarceration with Medicaid coverage, but suspend it or change it to a limited status to reflect that payment is only available for inpatient care while incarcerated. These states use automated processes that rely on data sharing between Medicaid and corrections facilities, which minimizes administrative efforts required by eligibility workers and facilitate individuals’ access to full coverage upon release. For example, in New Mexico and Rhode Island full coverage is automatically reinstated as individuals are released. Respondents also indicated that use of suspension policies enhances states’ ability to access Medicaid payments for inpatient care provided to an individual while incarcerated. In contrast to the other study states, Missouri terminates Medicaid coverage for individuals when they become incarcerated. As such, a new application must be completed to access payment for inpatient care or coverage when an individual transitions back into the community.
The states are providing enrollment assistance prior to release to help ensure individuals have full Medicaid coverage in place when they transition back into the community. All four study states have processes to enroll eligible individuals into Medicaid coverage as they transition from incarceration into the community. However, the scope and approach of these efforts varies across the states. New Mexico initiates enrollment efforts when individuals first enter incarceration, which helps the state connect with individuals even if they have short stays. The other states begin their enrollment efforts about 90-120 days prior to release. New Mexico and Rhode Island target their efforts broadly to individuals leaving both prison and jail, while Ohio’s efforts thus far focus on prisons. In Missouri, which has not expanded Medicaid, assistance is focused on individuals who are over age 65 or who have a serious health condition, since eligibility remains limited to elderly adults and adults with disabilities. The states educate individuals about Medicaid coverage and assist in completing and submitting an application as well as selecting a Managed Care Organization (MCO). Individuals either leave with their Medicaid card or it is mailed to their home. These efforts are primarily conducted by corrections staff who are trained as presumptive eligibility determiners; Ohio also has trained some inmates to serve as peer navigators.
The expansion study states have realized significant increases in coverage rates among justice-involved individuals and positive impacts on state budgets. New Mexico estimates that 70% of people entering incarceration are enrolled in Medicaid. Ohio estimates that it enrolls between 800 and 1,000 people each month. Ohio reports that more than 40,000 incarcerated people have applied for Medicaid and 35,000 have been enrolled in a plan. In New Mexico, more than 80 percent of people leaving incarceration are enrolled in Medicaid. In contrast, in Missouri, a small share of individuals moving into and out of incarceration are eligible for Medicaid because the state has not implemented the Medicaid expansion. The increases in coverage among justice-involved individuals also have had positive impacts on the expansion study states’ budgets. For example, some respondents noted that Medicaid coverage replaced state and local programs, which allowed them to redirect those resources to meet other needs, such as housing and other support services not covered by Medicaid. In addition, corrections departments reported savings due to Medicaid coverage for inpatient care provided to incarcerated individuals. For example, Ohio estimates that $20 million per year has been shifted from corrections to Medicaid and New Mexico estimates that state and federal Medicaid spending produced Department of Corrections (DOC) savings of about $1.5 million per year.
Even with enrollment efforts in place, the states continue to face gaps and challenges in covering justice-involved individuals. For example, Rhode Island suspends coverage for individuals who enter incarceration with Medicaid, and Ohio enrolls people in a limited inpatient benefit. However, individuals in these states typically lose coverage at renewal if they are incarcerated at the time of redetermination. In contrast, New Mexico primarily relies on administratively renewing incarcerated individuals’ coverage to prevent these coverage losses. In addition, respondents indicated that creating automated processes to suspend and reinstate coverage is challenging and requires overcoming major technology hurdles and addressing variations in systems and processes across agencies and corrections facilities. These challenges limit the participation of some facilities in these processes. For example, several counties in New Mexico have not yet been able to implement the automated processes to suspend and reinstate coverage due to technology limitations. Respondents also emphasized that unpredictable release dates and connecting people with short stays to coverage are ongoing challenges. New Mexico waits 30 days and Rhode Island waits 5 days to place people in suspension status to minimize coverage transitions among individuals with short stays. Finally, respondents pointed to challenges reaching people in community supervision arrangements, including those in halfway houses or under parole or probation.
Connecting Individuals to Care Upon Release
The Medicaid expansion increased opportunities to connect individuals to services to address their health and behavioral needs as they transition from incarceration back into the community. Prior to the Medicaid expansion, many individuals were uninsured when they were released from jail or prison, leaving them with access to limited services through a patchwork of localized programs. With the Medicaid expansion, a larger share of individuals can transition back into the community with Medicaid, which provides coverage for a broad array of services to address their physical and behavioral health needs and support recovery and treatment for OUD or other SUDs, including MAT. Medicaid also covers non-emergency transportation and other supportive services, which often are vital for helping individuals access needed health services. See Box 1 on findings on how Ohio’s pre-release program has facilitated access to and utilization of care and broader benefits for individuals.
Box 1: Impacts of Ohio’s Pre-Release Medicaid Program
In 2018, Ohio published survey, focus group, and administrative data on the impact of its Medicaid pre-release enrollment program, which began in 2014. Ohio’s report found:
Individuals in the pre-release program face significant health challenges. They reported being significantly more likely to smoke, binge drink, and have significant mental health conditions than did Ohio’s Medicaid expansion population as a whole. More than one in five (22%) people in the pre-release program had Hepatitis C. Rates of incidence of other major chronic conditions measured were generally similar between the Medicaid expansion population and those in the pre-release program.
Individuals in the pre-release program face economic and social challenges. Relative to the overall Ohio Medicaid expansion group, people in the pre-release program were disproportionately male, black, and possessed low levels of education. Roughly one in five is a caregiver to a child and/or family member with a health condition. Respondents described significant economic stress. More than one in ten reported being homeless, 58% do not have a computer, and more than a third do not have a vehicle.
Medicaid facilitated access to care and benefited the health of people in the pre-release program. Nearly 94% of people in the pre-release program said that Medicaid was beneficial to their physical health; just under 85% said it was beneficial to their mental health. One respondent said, “To me, [Medicaid] gives me a reason to get up. I am a member of society and it gives me purpose.” Nearly one-third of respondents in the pre-release program reported participating in substance use treatment post-incarceration, and 88% of those who received treatment said that Medicaid facilitated access to it. One respondent said, “Medicaid helps me stay out of trouble and stay in treatment, and pays for counseling and groups. If I didn’t have it, I wouldn’t be clean right now.” More than 9 in 10 people in the pre-release program with OUD received MAT or psychosocial treatment according to state administrative data. People in the pre-release program with OUD were less likely to receive MAT but received psychosocial services at equal or greater rates than those in the overall Medicaid expansion group.
Two thirds of pre-release program respondents said having Medicaid made it less likely that they would return to prison or jail. Respondents indicated that Medicaid helped reduce their risk of recidivism by providing relief from health care costs and enabling them to access care that helps them manage their health. One said, “[Life was] a rollercoaster ride but now [because of Medicaid] I have balance and stability. My therapist sees it, my case manager sees it, my pastor sees it, and everyone I associate with sees it. And I’m still getting better, this is the first time I’ve been out over a year and a half in 10 years, I’ve hit my mile marker and I have no intent on going back.”
A majority of pre-release program respondents (55%) were working or looking for work and, of those, most indicated that having Medicaid made it easier to continue working (89%) or to search for work (60%). Four in ten described facing challenges with low paying, piecemeal work, and irregular hours. Some also anecdotally reported coercive tactics such as employers charging employees high fees for equipment rentals. Ohio is one of 14 states with proposed or approved 1115 waivers from CMS to require Medicaid beneficiaries to work or volunteer as a condition of receiving Medicaid coverage.10
The study states are facilitating connections to care in the community by initiating care coordination efforts prior to release. Ohio and New Mexico have established contracting requirements for their Medicaid MCOs to coordinate care for individuals transitioning out of incarceration. In Ohio, the efforts focus on enrollees transitioning from prison with two or more chronic conditions, including mental illness and a history of SUD, while New Mexico has begun implementing a broad statewide effort.11 Care managers meet with individuals prior to release to assess needs, develop transition plans, establish appointments with community providers, and link individuals to social support services. In Ohio, these meetings take place via telemedicine. The care managers also follow-up with individuals post-release. Rhode Island also began providing additional care management and support when it implemented the Medicaid expansion in 2014. In Rhode Island, discharge planners within the DOC meet with individuals prior to release to conduct a needs assessment and make appointments with community providers. State officials indicate that the goal is for a discharge planner to meet with everyone prior to release, but there currently is not sufficient capacity to accomplish this goal and discharge planning services are prioritized for people with health needs, including SUD. Once in the community, individuals may also receive care management through MCO health homes.
Missouri faces challenges connecting individuals to care in the community due to limited availability of services for uninsured individuals. In Missouri, the prison medical provider helps to set up appointments for individuals prior to release. The state also has a re-entry project for individuals with severe mental illness that seeks to provide a warm hand-off for individuals to community providers and a justice reinvestment initiative through which probation and parole officers assess needs and seek to link individuals to behavioral and mental health services. However, access to services in the community remains limited. Respondents noted that individuals cannot be placed into residential treatment or nursing facilities without coverage. The state is trying to shift resources from institutional treatment to community treatment to expand the availability of care in the community.
The study states are facilitating access to MAT as people transition into and out of incarceration to support treatment and recovery. Each of the study states is providing access to MAT while individuals are incarcerated or just prior to release. Rhode Island offers all three FDA-approved MAT medications to individuals in prisons and jails. Upon incarceration, individuals are assessed to determine whether to continue or begin MAT. Treatment begins within two days of intake, enabling people to start even if they have a short stay. When individuals leave incarceration, they can continue treatment at one of eight community sites operated by the corrections MAT provider or apply to a different provider. Respondents indicated that having the same provider within facilities and in the community supports continuity of care. Some community providers are centers of excellence in opioid treatment or integrated health homes for people with complex conditions, including OUD. These programs facilitate connections to health services as well as community resources like food, shelter, housing and employment. In New Mexico, three counties operate a pilot project to provide methadone treatment during incarceration. People identified with OUD at entry can continue methadone treatment or be induced while incarcerated and are transitioned to community-based methadone clinics upon release. One of the counties also established a re-entry center to help link people with behavioral health needs and SUD to health and support services in the community. Ohio and Missouri offer individuals the option to receive MAT just prior to release. As of 2018, Ohio began offering Vivitrol to individuals at release. Ohio also operates a pilot project offering Naloxone at release from institutions that serve female inmates; this will be expanded to male correctional facilities this summer. The corrections department notifies the individual’s MCO that the individual received a Vivitrol shot, and the MCO is responsible for making post-release follow up appointments. Missouri operates a pilot project in four state prisons for individuals who have been sentenced to prison-based treatment. Individuals can elect to receive one Vivitrol injection 3 days before release and a second shot post-release. The MAT provider in the prisons has reentry specialists that call probation/parole officers and treatment providers to minimize gaps in treatment and plan for housing and other needs as individuals are released. Post-release, parole officers are responsible for ensuring that individuals receive second Vivitrol shots.
Experiences from the study states point to improvements in access to care and promising impacts on health and recidivism from re-entry efforts, but data on impacts remain limited. Respondents reported that the increased Medicaid coverage among individuals leaving incarceration along with enhanced efforts to link them to care have increased the ability of individuals to obtain more consistent and broader care and services to address their health needs and opened up new opportunities to address population health. Ninety-four percent of enrollees in Ohio with a primary diagnosis of opioid use disorder received one or more types of substance use treatment, and early data show positive impacts on recidivism. Rhode Island officials estimate that 78% of individuals who receive MAT while incarcerated continue to receive treatment in the community. Research evaluating the first year of the program’s implementation estimated that post-incarceration opioid deaths fell 61% and that, as a result, the opioid death rate in Rhode Island fell 12%.12 Primary care visits for the SUD population leaving incarceration have increased 7%.Officials in Missouri indicate that since implementing their broader efforts to address the opioid epidemic, they have seen a significant reduction in overdose death rates. They also report that the re-entry project has helped reduce recidivism rates among individuals with severe mental illness and that individuals receiving MAT are more likely to stay in treatment longer.
States are making progress in coordinating care at re-entry, but they also face many challenges to coordination. Respondents pointed to difficulties meeting with individuals prior to release to assess needs and coordinate care, including insufficient resources in facilities to provide for telehealth and/or in-person visits and varied facility schedules and policies that make scheduling visits challenging. Moreover, they emphasized that Medicaid payment currently is not available for any assessment or coordination services provided prior to release due to the limitations on Medicaid financing for incarcerated individuals. Representatives from MCOs and states indicated that they recognize the value and longer-term benefits on health and costs of providing the upfront planning. However, some respondents suggested that policy changes to allow for Medicaid coverage of services for a defined period of time prior to release would help support transition efforts. Respondents also described challenges engaging with individuals post-release due to inaccurate contact information, unpredictable release dates, data lags, and other issues. In addition, respondents indicated that social challenges, including homelessness and lack of transportation, make it difficult to connect with people post-release. Moreover, respondents reported that gaps or delays in reinstatement of full Medicaid coverage or enrollment into an MCO when a person is released can lead to delays in accessing services. For example, Rhode Island had encountered some difficulties accessing residential treatment programs for individuals upon release because there often is a 24-hour gap between release and Medicaid activation and a delay in MCO enrollment and residential programs are not covered by fee-for-service Medicaid. The state now expedites enrollment for people who need residential treatment to address these issues. Some respondents also indicated that federal privacy and data sharing rules make it difficult to share information between facility and community providers, particularly information related to behavioral health and SUD.
The states face challenges linking individuals to services to due major gaps in availability of behavioral and SUD providers within the community. One major obstacle respondents identified is the lack of sufficient community providers to meet individuals’ needs, particularly MAT providers in rural areas. Some respondents indicated that this challenge is exacerbated by onerous policies associated with becoming a MAT provider or prescribing via telemedicine. Respondents in Missouri also expressed concern that federal limits on buprenorphine prescribing contribute to MAT access challenges. Ohio is seeking to address some of these challenges by offering broader certification to providers to offer MAT. In addition, the state recently carved behavioral health services into its managed care contracts, which respondents indicated would expand the network of behavioral health providers for Medicaid enrollees. In Missouri, respondents reported that a bias for institutional care and lack of funding for community-based behavioral care has led to limited access to community-based services. The state currently is working to transition a greater share of treatment beds from prisons and jails into community treatment.
Respondents across the study noted that addressing ongoing stigma associated with SUD and OUD remains important for successful recovery initiatives and efforts. They suggested that it is necessary to educate both the corrections community and providers about use of MAT as an evidence-based model of treatment. Moreover, they stressed that use of peer supports can help build trust and support individuals in seeking treatment. Ohio also developed a broad public facing campaign to help individuals understand OUD and SUD through a chronic disease lens. Rhode Island sponsors public events celebrating recovery.
Looking Ahead
Together these findings illustrate that some states have achieved major progress connecting justice-involved individuals with OUD to Medicaid coverage and care, building on increased opportunities created by the Medicaid expansion. These efforts are translating into increased rates of coverage and enhanced access to care and treatment services as individuals re-enter the community, which are anticipated to lead to long-term improvements in health and recovery and reduced recidivism rates, although data on these broader outcomes is limited to date. Although states have achieved significant success through these initiatives, many challenges remain to connecting individuals to coverage and care. Looking ahead, it will be important to enhance enrollment efforts to address remaining gaps for some individuals and to explore policies and approaches that may further support and smooth efforts to coordinate and connect individuals to care as they transition from incarceration to the community, including strategies that make it easier for plans and providers to meet with individuals prior to release and facilitate sharing of information between facilities and community providers. In addition, expanding the availability of providers in the community, particularly MAT and behavioral health providers, will be key for addressing treatment and recovery needs and ultimately improving health and reducing recidivism.
Vikki Wachino is Principal, Viaduct Consulting, LLC and Samantha Artiga is with the Kaiser Family Foundation. The authors thank the state officials, and plan and provider representatives in each of the four states who generously provided information, time and expertise to make this report possible. They also thank Misty Downey for outstanding research assistance and the staff of Community Oriented Correctional Health Services for providing input into the development of this report.
Jennifer Bronson, et al., “Drug Use, Dependence and Abuse among State Prisoners and Jail Inmates, 2007-2009,” Bureau of Justice Statistics,2017, Washington, D.C. The rate of drug dependence and abuse in the general population age 18 and over is five percent. ↩︎
A North Carolina study estimated that the state’s post release overdose death rate outpaced that of the general population by a factor of 40. Shabbar I. Ranapurwala et al., “Opioid Overdoes Mortality Among Former North Carolina Inmates,” Journal of the American Public Health Association, 108, no. 9 (2018). In Washington State, researchers estimated that former prisoners were 129 times more likely to die of overdose in the immediate post-release period than the general population, Ingrid Binnswanger et al., “Release from Prison –a High Risk of Death for Former Inmates,” the New England Journal of Medicine, 356, no. 2 (2007). ↩︎
Larney, Sarah, Natasa Gisev, Michael Farrell, Timothy Dobbins, Lucinda Burns, Amy Gibson, Jo Kimber, and Louisa Degenhardt. “Opioid Substitution Therapy as a Strategy to Reduce Deaths in Prison: Retrospective Cohort Study.” BMJ Open 4, no. 4 (2014): e004666. https://doi.org/10.1136/bmjopen-2013-004666; Mancuso, David, and Barbara E.M. Felver. “Providing Chemical Dependency Treatment to Low-Income Adults Results in Significant Public Safety Benefits.” Olympia, Washington: Department of Social and Health Services, Research and Data Analysis Division, February 2009. https://www.dshs.wa.gov/sites/default/files/SESA/rda/documents/research-11-140.pdf; National Sheriff’s Association and National Commission on Correctional Health Care, 2018. ↩︎
The ACA required coverage of mental health and SUD services for people in Medicaid expansion, and regulatory and other administrative changes have also strengthened mental health and substance use coverage. See Application of Mental Health Parity Requirements to Coverage Offered by Medicaid Managed Care Organizations, the Children’s Health Insurance Program, and Alternative Benefit Plans, Final Rule, Federal Register vol. 81, no. 61 (March 30, 2016) https://www.govinfo.gov/content/pkg/FR-2016-03-30/pdf/2016-06876.pdf; Medicaid Managed care, CHIP delivered in managed care, and revisions related to third party liability, Federal Register,vol. 81, no. 61 (May 1, 2016) https://www.govinfo.gov/content/pkg/FR-2016-05-06/pdf/2016-09581.pdf. In addition, the SUPPORT Act permits states to cover 30 days of residential treatment for SUD in a calendar year. ↩︎
According to Ohio, individuals automatically qualify for pre-release transition assistance if they have HIV, Hepatitis-C, are pregnant or have delivered a baby during incarceration, or are receiving MAT in the corrections department. In addition, individuals with at least two of the following also qualify: severe and persistent mental illness, recovery services (highest acuity level) or a chronic condition. Written communication from Ohio Medicaid staff, May 17, 2019. ↩︎
Traci C. Green, Jennifer Clarke, Lauren Brinkley-Rubinstein, “Postincarceration Fatal Overdoses After Implementing Medications for Addiction Treatment in a Statewide Correctional System,” research letter published in JAMA Psychiatry 2018. ↩︎
Walgreens and Greater Than AIDS Partner with Health Departments and Local HIV Organizations Across the Nation to Offer Free Testing on National HIV Testing Day
This year brings together the highest number of participating partners, cities and Walgreens stores to educate about effective HIV prevention and treatment options
DEERFIELD, Ill.& San Francisco, Calif., June 17, 2019 – Walgreens and Greater Than AIDS are working with health departments, HIV/AIDS service organizations, and other community organizations to provide free HIV testing and information at select Walgreens stores in more than 260 cities on National HIV Testing Day (NHTD), Thursday, June 27 between 10 am – 7 pm (local time). Click here for a map of all participating locations.
HIV testing is recommended as part of routine health care, yet many Americans are not being tested as often as advised. According to the Centers for Disease Control and Prevention (CDC), one in seven people living with HIV in the U.S. today are unaware of their status.
“Walgreens continues to support HIV testing since it is a critical first step in developing effective prevention and care strategies, regardless of status,” said Glen Pietrandoni, senior director, patient care and advocacy, Walgreens. “With more than 3,000 HIV-trained Walgreens pharmacists in communities across the nation, we can uniquely support HIV testing, education and care, working towards an end to HIV/AIDS.”
In addition to offering on-site free and fast HIV testing, counselors from local agencies will answer questions about HIV prevention and treatment options, including PrEP. No appointment is required.
The use of antiretroviral (ARV) medications to prevent HIV transmission, as well as PrEP, a daily pill to protect against HIV, offer new pathways to ending HIV. Based on the strength of the scientific advances, the White House and many states have set ambitious goals of significantly reducing HIV infections over the next decade.
“Public knowledge has not always kept up with the science,” said Tina Hoff, senior vice president and director of Health Communications and Media Partnerships at KFF (Kaiser Family Foundation). “Public-private partnerships like this help to close the knowledge gaps about HIV and connect people with services in their communities to get the care they need.”
According to a recent national survey by KFF, which runs Greater Than AIDS, fewer than half of Americans know about PrEP, and many understate the health and preventative benefits of HIV treatment.
The National HIV Testing Day community partnership is part of an ongoing commitment by Walgreens and Greater Than AIDS to extend the reach of HIV testing and information to non-traditional settings and support the outreach of local agencies. More than 48,000 free HIV tests have been provided since 2011 as part of the annual event.
BioLytical Laboratories, Chembio Diagnostics, and OraSure Technologies, Inc. are contributing donated test kits and Abbott Rapid Diagnostics is providing support for outreach for the 2019 activation.
For a complete list of participating Walgreens locations and supporting partners for this year’s National HIV Testing Day, as well as additional information about HIV testing, including year-round testing sites, visit www.greaterthan.org/walgreens.
About Walgreens
Walgreens (walgreens.com), one of the nation’s largest drugstore chains, is included in the Retail Pharmacy USA Division of Walgreens Boots Alliance, Inc. (NASDAQ: WBA), the first global pharmacy-led, health and wellbeing enterprise. Approximately 8 million customers interact with Walgreens in stores and online each day, using the most convenient, multichannel access to consumer goods and services and trusted, cost-effective pharmacy, health and wellness services and advice. As of Aug. 31, 2018, Walgreens operates 9,560 drugstores with a presence in all 50 states, the District of Columbia, Puerto Rico and the U.S. Virgin Islands, along with its omni-channel business, Walgreens.com. Approximately 400 Walgreens stores offer Healthcare Clinic or other provider retail clinic services.
About Greater Than AIDS
Greater Than AIDS is a leading national public information response from KFF focused on communities most affected. Through targeted media messages and community outreach, Greater Than AIDS and its partners works to increase knowledge, reduce stigma and promote actions to stem the spread of the disease.
Filling the need for trusted information on national health issues, the Kaiser Family Foundation is a nonprofit organization based in San Francisco, California.
Medicaid is an essential source of coverage for medical and long-term services and supports (LTSS) for many seniors and nonelderly adults and children with disabilities. Aside from the core group of SSI beneficiaries, pathways to full Medicaid eligibility based on old age or disability are provided at state option. This issue brief presents the latest state-level data on Medicaid financial eligibility criteria and adoption of key age and disability-related pathways (Figure 1). It also analyzes state choices about whether to adopt these optional age and disability-related pathways in light of states’ Affordable Care Act (ACA) expansion status. Findings are based on a survey of the 50 states and the District of Columbia. Appendix Tables contained detailed state-level data. Key findings include the following:
Figure 1: State Adoption of Key Medicaid Eligibility Pathways Based on Old Age or Disability, 2018
While adoption of the major optional age and disability-related Medicaid eligibility pathways varies substantially across states, state choices about these pathways have remained stable since the time of our last survey in 2015. All states except Alabama elect at least one state plan optional pathway to full Medicaid eligibility based on old age or disability.
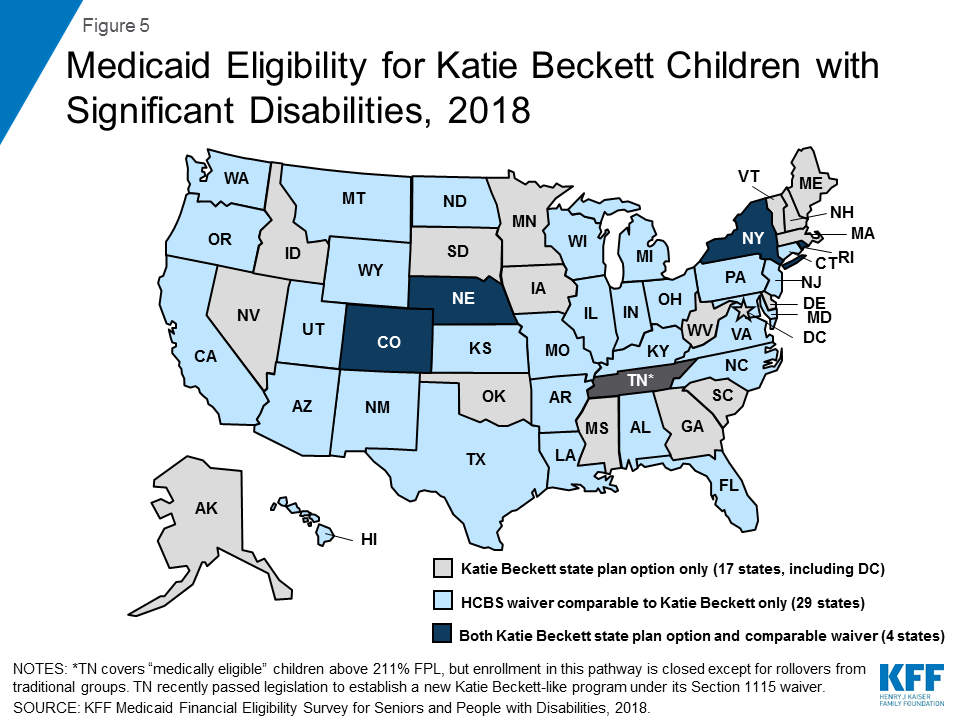
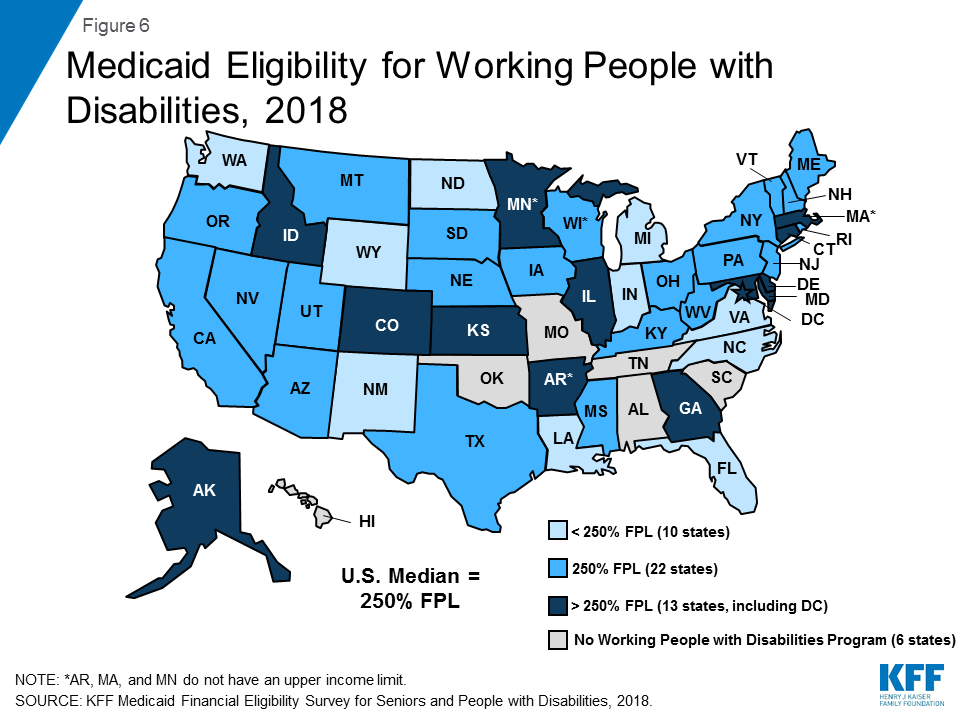
The income limits associated with the age and disability-related pathways vary across states but generally remain low, with a notable minority of states opting to eliminate asset tests in certain pathways. The median income limit was 74% of the federal poverty level (FPL, $771/month in 2019) for individuals eligible based on old age or disability, 48% FPL ($500/month) for individuals eligible as medically needy, and 250% FPL ($2,602/month) for working people with disabilities. All states except Tennessee offer the Katie Beckett state plan option or a comparable waiver to cover at least some children with significant disabilities regardless of household income.
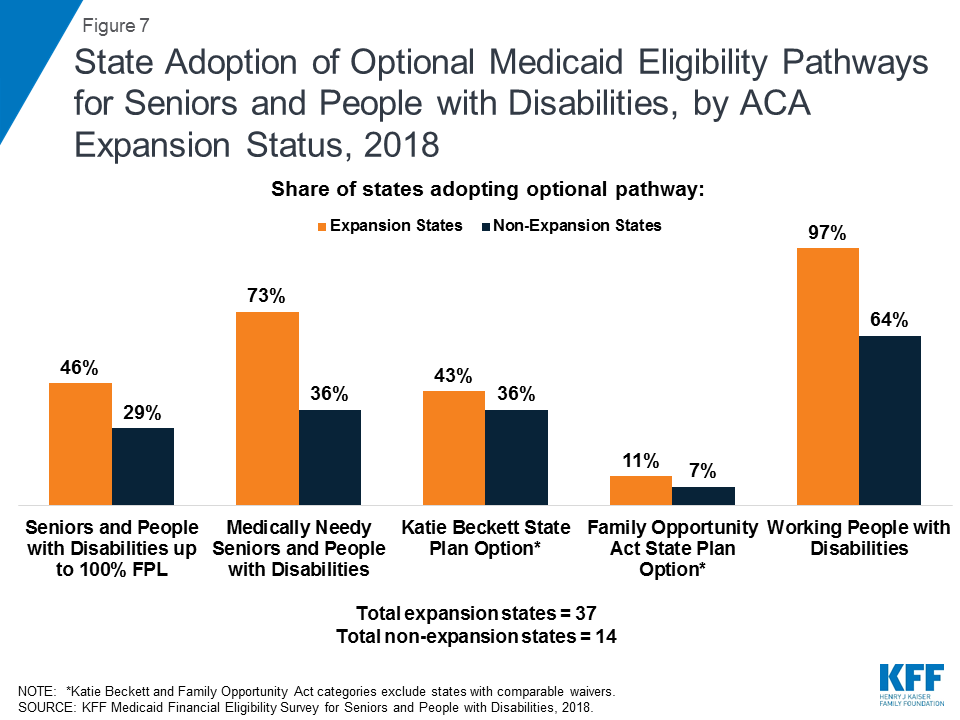
Greater shares of states that have adopted the ACA Medicaid expansion also have adopted key optional age and disability-related pathways, compared to non-expansion states. Since the time of our last survey in 2015, expansion states generally have not scaled back age or disability-related pathways, while non-expansion states generally have not increased eligibility in age and disability-related pathways.
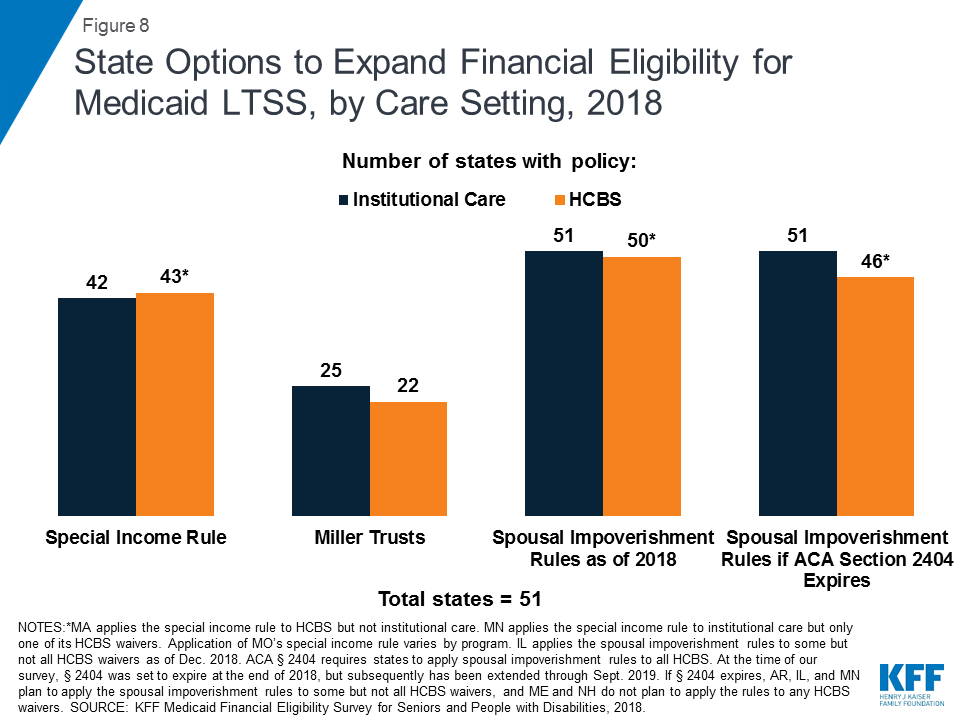
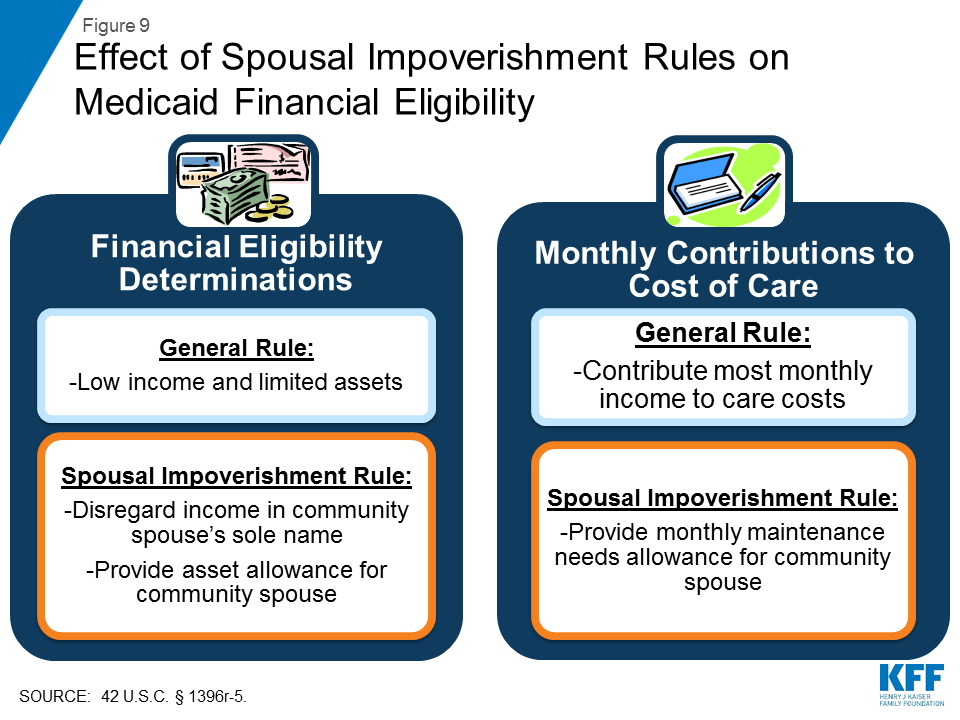
All states elect at least some options to expand financial eligibility for Medicaid LTSS. While most states apply the same rules regardless of care setting, there are a few states in which financial eligibility rules for home and community-based services (HCBS) are more restrictive and could be aligned with rules for institutional care to eliminate programmatic bias and increase community integration. Nearly all states are applying the spousal impoverishment rules to HCBS as required by ACA Section 2404; these rules protect a portion of income and assets to support a spouse when an individual receives Medicaid LTSS. However, five states report plans to scale back or stop doing so and more could follow if Congress allows Section 2404 to expire on September 30, 2019.
All states offer Medicare Savings Programs (MSPs) in which Medicaid covers some or all out-of-pocket costs for low-income Medicare beneficiaries. Few states expand MSP financial eligibility beyond the federal minimum limits, although nine states have opted to eliminate MSP asset limits.
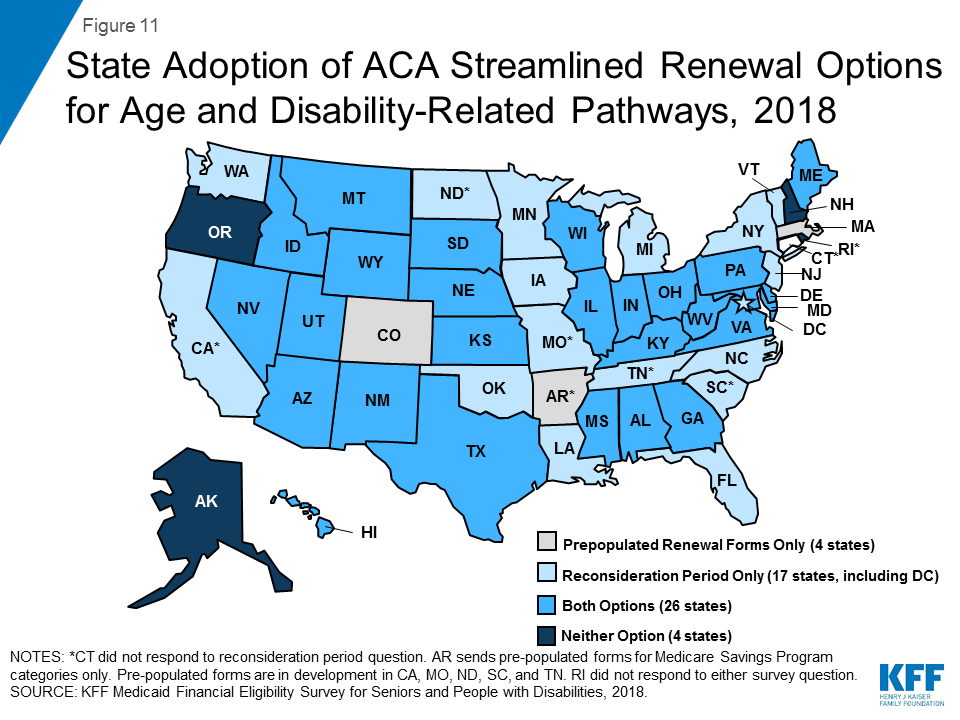
An increasing number of states are opting to apply the ACA’s streamlined eligibility renewal provisions to age and disability-related pathways, which can help retain eligible people in coverage and strengthen continuity of care. Thirty states now use prepopulated forms to facilitate eligibility renewals and 43 states offer reconsideration periods for these pathways.
Looking ahead, state and federal policy choices that affect Medicaid eligibility for seniors and people with disabilities will remain important areas to watch. As more states have adopted the ACA Medicaid expansion, state choices about optional age and disability-related pathways generally have remained stable. Expanding coverage for children with significant disabilities is the subject of recent legislation in Louisiana and Tennessee. States’ progress in advancing community integration could be at risk if spousal impoverishment rules are scaled back for HCBS but remain in place for institutional care if Congress allows ACA Section 2404 to expire this fall. In addition, Medicaid eligibility in age and disability-related pathways could be affected by a change to the inflation measure that is used to determine the annual federal poverty line, which the federal government is considering. Using a lower inflation measure would result in smaller increases in the poverty line each year compared to the current measure, which would slow the annual increase in Medicaid income limits based on the FPL over time, with fewer people eligible for Medicaid as a result. These and other policy changes in the years ahead will influence the extent to which seniors and people with disabilities can gain and maintain Medicaid eligibility and access to needed preventive, physical, behavioral health, and long-term services and supports.
Issue Brief
Introduction
Medicaid is an important source of health and long-term care coverage for seniors and people with disabilities. Over 6.9 million Medicaid beneficiaries are age 65 or older.1 Medicaid also covers more than three in 10 (nearly 7 million) nonelderly adults with disabilities2 and, together with the Children’s Health Insurance Program (CHIP), about half (47%, or about 6.1 million) of children with special health care needs.3 Medicaid beneficiaries with disabilities include individuals with physical conditions such as multiple sclerosis, epilepsy, and blindness; HIV/AIDS; spinal cord and traumatic brain injuries; disabling mental health conditions such as depression and schizophrenia; intellectual and developmental disabilities such as Down syndrome and autism; and functional limitations resulting from chronic illnesses. For all of these populations, Medicaid makes coverage affordable and covers a range of medical and long-term services and supports (LTSS), many of which are not covered at all or only available in limited amounts through private insurance or Medicare.
Medicaid pathways in which eligibility for full benefits is based on old age or disability include the core group of Supplemental Security Income (SSI) beneficiaries, which all states that choose to participate in Medicaid must cover, and an array of additional groups that can be covered at state option (Figure 2 and Appendix Table 1). In addition to these pathways, some people with disabilities are eligible for Medicaid based solely on their low income in a poverty-related pathway,4 including the Affordable Care Act’s (ACA) Medicaid expansion.
Figure 2: State Adoption of Key Medicaid Eligibility Pathways Based on Old Age or Disability, 2018
This issue brief presents state-level data on Medicaid financial eligibility criteria5 and adoption of the major coverage pathways related to old age and disability as of 2018. It includes mandatory and optional pathways to full Medicaid eligibility, options to expand Medicaid eligibility for institutional and home and community-based LTSS, and the Medicare Savings Programs that state Medicaid programs must offer to assist low-income Medicare beneficiaries with out-of-pocket costs. It also considers state choices about whether to adopt various optional pathways related to old age and disability in light of states’ ACA expansion status and state adoption of optional streamlined eligibility renewal procedures. The findings are based on a survey of the 50 states and the District of Columbia conducted by the Kaiser Family Foundation’s Program on Medicaid and the Uninsured in fall 2018.6 The Appendix Tables contain detailed state-level data.
Pathways to Full Medicaid Eligibility Based on Old Age or Disability
SSI Beneficiaries
States generally must provide Medicaid to people who receive federal Supplemental Security Income (SSI) benefits.7 To be eligible for SSI, beneficiaries must have low incomes, limited assets, and an impaired ability to work at a substantial gainful level as a result of old age or significant disability. The SSI federal benefit rate is $750 per month for an individual and $1,125 for a couple8 in 2018,9 which is 74 percent of the federal poverty level (FPL). The effective SSI income limit is somewhat higher than 74% FPL in four states, due to state supplemental payments and/or additional income disregards: 80% FPL in Idaho, 83% FPL in New York and Wisconsin, and 87% FPL in Missouri (Appendix Table 2). Box 1 provides more information about disregards. SSI beneficiaries also are subject to an asset limit of $2,000 for an individual and $3,000 for a couple.
A minority of states (8 of 51) elect the Section 209 (b) option to apply Medicaid eligibility rules to SSI beneficiaries that are different from those under the federalSSI program (Appendix Table 2). SSI is administered by the Social Security Administration (SSA). If states do not want to accept SSA’s determination of an SSI beneficiary’s income, assets, and/or disability status when determining Medicaid eligibility, states can use different rules under Section 209 (b). States can use financial and/or functional eligibility criteria that are more restrictive than the federal SSI rules, as long as the state’s rules are no more restrictive than the rules it had in place in 1972, when the SSI program was established.10 States with Section 209 (b) programs include Connecticut, Hawaii, Illinois, Minnesota, Missouri, New Hampshire, North Dakota, and Virginia. Among these states, Connecticut applies a more restrictive income limit (63% FPL) but also uses a more generous general income disregard than the federal SSI rules ($339 vs $20).11 Illinois also applies a slightly more generous income disregard ($25 vs. $20), while New Hampshire uses a more restrictive income disregard ($13 vs. $20). Two states (CT and NH) have a more restrictive asset limit ($1,600 and $1,500 for an individual, respectively), and three states (MN, MO, and ND) have a more generous asset limit ($3,000 for an individual) compared to the federal SSI rule ($2,000 for an individual).
Optional Pathways
Seniors and people with disabilities up to 100% FPL
Over 40 percent of states (21 of 51) elect the option to expand Medicaid to seniors and people with disabilities whose income exceeds the SSI limit but is below the federal poverty level ($1,012 per month for an individual in 2018)12 (Figure 3 and Appendix Table 2).13 Eighteen of these states set the income limit at 100% FPL, the federal maximum for this pathway. In the other three states electing this option, the eligibility limit is 80% FPL in Arkansas, 81% FPL in Virginia, and 88% FPL in Florida. Twenty of the 21 states electing this option cover both seniors and people with disabilities, while Arkansas only covers seniors.
Figure 3: Medicaid Eligibility for Seniors and People with Disabilities, 2018
Arizona is the only state electing the seniors and people with disabilities option that does not apply an asset limit to this pathway (Appendix Table 2). Over half (12) of the 21 states electing this option use the SSI asset limit of $2,000 for an individual and $3,000 for a couple. The other eight states have asset limits higher than the SSI amount: $3,000 for an individual in Minnesota; $4,000 in DC, Nebraska, New Jersey, and Rhode Island; $5,000 in Florida; and $7,560 in Arkansas and South Carolina.
Box 1: Countable Income and Assets in Determining Financial Eligibility
States have rules about which sources of income and assets are included or “countable” when determining Medicaid financial eligibility. Many states use the federal SSI financial methodology to determine Medicaid eligibility in pathways based on old age or disability. Under the SSI rules, an individual’s home, one car used for household transportation, and a certain amount of funds for prepaid burial expenses are examples of assets that are excluded from the limit of $2,000 for an individual and $3,000 for a couple.
Additionally, states may apply rules that disregard a portion of an individual’s income. Under the federal SSI rules, $20 is typically subtracted from a person’s monthly income before comparing the remaining amount to the relevant income limit for a Medicaid coverage group. Other disregards also may apply, depending on the income source. For example, earned income may be subject to an additional disregard of $65 plus half of the remaining amount under the federal SSI rules. Consequently, a person may have actual income that exceeds the limit for a certain pathway but still be eligible for Medicaid as a result of disregards that reduce countable income.
Medically Needy Populations
Two-thirds of states (34 of 51) adopt the medically needy option to extend Medicaid to people with high medical expenses who would be eligible in a categorically needy pathway except that their income and/or asset exceeds the maximum limit for that pathway (Figure 4 and Appendix Table 3). Box 2 explains the distinction between categorically and medically needy pathways and provides more detail about establishing eligibility under the medically needy option. All states electing the medically needy pathway must cover pregnant women and children. These states also may extend medically needy coverage to other groups: 32 of 34 states (all but TN and TX) cover medically needy seniors and people with disabilities, and 26 of 34 states (all but CT, HI, MA, TN, TX, VA, WA, and WI) cover medically needy low income parents.14
Figure 4: Medicaid Eligibility for Medically Needy Populations, 2018
The median medically needy income limit is 48% FPL, or $488 per month for an individual in 2018 (Figure 4 and Appendix Table 3).15 Medically needy income limits vary across states16 but are typically very low.17 Nine states set their medically needy income limit at or above the federal SSI benefit level ($750 per month for an individual in 2018,18 74% FPL), and 25 states set their medically needy income limit below the SSI level.
Over half of states (19 of 34) set their medically needy asset limit at the SSI level ($2,000 for an individual and $3,000 for a couple) (Appendix Table 3). Connecticut has a more restrictive medically needy asset limit ($1,600 for an individual and $2,400 for a couple). The other 14 states have more generous medically needy asset limits for individuals and couples (DC, FL, IA, MN, NE, NH, NJ, NY, ND, PA, and RI), only for individuals (MD), or only for couples (GA, KY), compared to the SSI limit, ranging from $2,400 for an individual in Pennsylvania to $15,150 in New York. Four of these states (DC, NE, NJ, and RI) use $4,000, double the SSI limit for an individual. Asset limits for an individual are $2,500 in two states (MD and NH), $3,000 in two states (MN and ND), $5,000 in Florida, and $10,000 in Iowa.
Nearly three-quarters of states covering medically needy populations (25 of 34) expand access to Medicaid institutional LTSS by including nursing facility services in their medically needy benefit package (Appendix Table 3). States have the option to provide a more limited benefit package to people who qualify for Medicaid in a medically needy, as opposed to categorically needy, pathway. Under federal law, states must include nursing facility services in the benefit package for categorically needy populations but can choose whether to include these services in their medically needy benefit package. In states electing this option, the medically needy pathway can be an important means of expanding coverage for those with overwhelming medical and/or LTSS expenses.
Box 2: Categorically Needy vs. Medically Need Pathways
Before the ACA, Medicaid eligibility was limited to certain categories of people.19 These “categorically needy” groups include children, pregnant women, low-income parents, seniors, and people with disabilities. The ACA eliminated the need to fit into one of these categories by expanding Medicaid to nearly all adults with incomes up to 138% FPL ($1,396 per month for an individual in 2018).20 In states that have not adopted the ACA Medicaid expansion, people still must fit into one of the specified categories to qualify for coverage today. In addition, these categories remain relevant to determining Medicaid eligibility under the “medically needy” option because beneficiaries who qualify as “medically needy” must fit into one of the traditional categories. States cannot use the medically needy option to cover people who do not fit into one of the traditional categories, regardless of how poor they are or how extensive their medical needs are.
There are two ways that individuals can qualify for Medicaid through a medically needy pathway.21 First, people with income above the categorically needy income limit associated with a certain population but below the state’s medically needy income limit may be eligible as medically needy. Second, people who “spend down” to the state’s medically needy income limit by subtracting incurred medical or LTSS expenses from their income may qualify. States select a budget period between one and six months during which an individual must incur enough expenses to decrease their income below the medically needy limit. Most states use a budget period of either one month (11 states) or six months (13 states)22 (Appendix Table 3). Using a longer budget period may be administratively simpler for states and enrollees and provide continuity of coverage.
Katie Beckett Children with disabilites
All states except Tennessee opt to provide Medicaid for at least some “Katie Beckett” children up to age 19 with significant disabilities living at home, without regard to household income (Figure 5 and Appendix Table 1). These children must meet SSI medical disability criteria and otherwise qualify for an institutional level of care according to functional eligibility criteria set by the state. States can target different populations based on the type of institutional care (hospital, skilled nursing facility, intermediate care facility, intermediate care facility for individuals with “mental disease,”23 intermediate care facility for individuals with intellectual or developmental disabilities) that would be required if the child was not receiving Medicaid services in the community.
Figure 5: Medicaid Eligibility for Katie Beckett Children with Significant Disabilities, 2018
Katie Beckett income limits are generally 300% of SSI ($2,250 per month in 2018),24 with a $2,000 asset limit, considering only the child’s own income and assets. There is no notable state variation in Katie Beckett income and asset limits across states, including those with the state plan option and those with comparable waivers. Under the Katie Beckett pathway, parental income and assets are disregarded when determining Medicaid eligibility for children with disabilities living at home, just as they are for children with disabilities residing in an institution. This option makes it possible for children to receive necessary care while remaining at home with their families.
Over half of Katie Beckett states (29 of 50) cover these children solely through a waiver, under which enrollment can be capped, while about one-third of Katie Beckett states (17 of 50) elect to cover all eligible children under the state plan option (Figure 5 and Appendix Table 1).25 Four states (CO, NE, NY, and RI) cover some Katie Beckett children through the state plan option and others through a comparable waiver. Box 3 describes recent legislation to establish a Katie Beckett waiver program in the remaining state (TN). In addition, Louisiana, which currently has a Katie Beckett-like waiver, recently passed legislation to adopt the Katie Beckett state plan option, which is estimated to cover 1,613 children in FY 2021.26 Katie Beckett children can be covered through the optional state plan coverage group or through a home and community-based services (HCBS) waiver.27 Providing coverage through a waiver allows states to cap enrollment, which can result in waiting lists and is not permitted under state plan authority.
Just over 10 percent of Katie Beckett states (6 of 50) report charging premiums or monthly fees for these children. These include two states electing the Katie Beckett state plan option (ME and MN) and four states with comparable waivers (AR, CT, ND and NV). Maine reports charging premiums for all Katie Beckett enrollees, which vary on a sliding scale based on income and whether the child also has private health insurance. Minnesota reports charging a monthly fee based on family size and income for some enrollees. Arkansas charges premiums for children in households with income above 150% FPL; the premium amount varies based on family income. In North Dakota, premiums are 5% of gross income and begin at 83% FPL. The income level at which premiums begin in Nevada varies based on household size, income, and deductions.
Box 3: Legislation to Create a Katie Beckett Waiver Program in Tennessee
Tennessee is the only state that does not report covering Katie Beckett children through the state plan option or a comparable waiver in 2018. Instead, Tennessee’s Section 1115 waiver currently covers “medically eligible” children” in households with income at or above 211% FPL with no asset test, although enrollment in this pathway is closed except for rollovers from those losing coverage in a traditional group.28 Tennessee’s Section 1115 waiver also provides Medicaid HCBS to a capped number of children with intellectual or developmental disabilities who meet an institutional level of care with incomes up to 300% SSI.29
Recent legislation in Tennessee directs the state to amend its Section 1115 waiver to establish a Katie Beckett-like program that will provide Medicaid without regard to household income and assets to children who are not served under an existing HCBS waiver, have severe functional limitations, qualify for an institutional level of care, and meet SSI medical disability criteria.30 Tennessee proposes that applications will be limited to open enrollment periods, and enrollment would prioritize children with the most significant or complex needs. Families may be required to purchase private or employer sponsored insurance for the child and to pay Medicaid premiums based on a sliding scale. The legislation also calls for a “Medicaid diversion plan” to be established under Tennessee’s waiver that would offer a limited benefit package and use Medicaid funds as premium assistance to purchase private coverage for children who meet functional needs criteria and qualify for an institutional level of care or are at risk of doing so. The amount of premium assistance would be determined using a sliding fee scale based on parental income. The legislation is expected to provide Medicaid to 300 children and serve another 2,700 children under the diversion program.31
Family Opportunity Act children with disabilities
Five states elect the Family Opportunity Act (FOA) state plan option for children with significant disabilities living at home (CO, IA, LA, ND, and TX), and one state (MA) provides comparable coverage through a waiver (Appendix Table 1). The FOA pathway allows states to cover children who meet SSI medical disability criteria in families with incomes up to 300% FPL ($5,195 per month for a family of three in 2018).32 Assets are not considered when determining a child’s FOA eligibility. Both FOA and the Katie Beckett pathway (described above) apply to children with significant disabilities living in the community. Unlike the Katie Becket pathway which only considers the child’s own income, the FOA option considers household income. The Katie Beckett pathway requires the child to meet both SSI medical disability criteria and an institutional level of care, while the FOA pathway only requires SSI medical disability criteria. Table 1 below outlines key differences in eligibility criteria between these two pathways.
Table 1: Eligibility Criteria in Key Optional Coverage Pathways for Children with Disabilities
Katie Beckett
Family Opportunity Act
What are the income requirements?
Only considers child’s income (up to 300% SSI)
Considers household income (up to 300% FPL)
What are the asset requirements?
Only considers child’s assets
Does not consider assets
What are the functional eligibility criteria?
Child must meet both SSI medical disability criteria and an institutional level of care
Only requires SSI medical disability criteria
Three FOA states (CO, IA, and LA) extend coverage to the federal maximum of 300% FPL. North Dakota and Texas cover children up to 200% FPL and 150% FPL, respectively. Massachusetts’ FOA-like waiver does not have an enrollment cap or an income limit.33
Nearly all (5 of 6) states with the FOA option or a comparable waiver choose to charge premiums. Under the FOA option, states are permitted to charge premiums equal to no more than 5% of the family’s monthly gross countable income ($260 per month for a family of three with income at 300% FPL34 ). Iowa is the only FOA state that does not charge premiums. Colorado charges premiums of $70 per month beginning at 134% FPL, Texas charges $90 per month beginning at 151% FPL, North Dakota charges 5% of gross family income beginning at 200% FPL, and Louisiana charges $15 per month beginning at 201% FPL. Under Massachusetts’ FOA-like waiver, sliding scale premiums apply to children in families with income over 150% FPL, beginning at $12 per month.35
Working People with disabilities
Nearly 90% of states (45 of 51) expand Medicaid to working individuals with disabilities whose income and /or assets exceed the limits for other eligibility pathways (Figure 6 and Appendix Table 4).36 This option enables people with disabilities to retain access to the medical and LTSS they need as their income increases. Medicaid often is especially important to working people with disabilities because private insurance typically does not cover all of the services and supports they need to live independently and to work.37
Figure 6: Medicaid Eligibility for Working People with Disabilities, 2018
The median working people with disabilities income limit was $2,530 per month, or 250% FPL for an individual38 in 2018 (Figure 6 and Appendix Table 4). Three states (AR, MA, and MN) do not have an income limit for this pathway. Virginia requires individuals to have income at or below 80% FPL ($809/month for an individual in 2018)39 to become eligible in this pathway, but once enrolled, individuals can have earnings up to $75,000 per year ($6,250 per month) as long as they are deposited into a qualifying account.
A minority of states (8 of 45) do not have an asset limit for the working people with disabilities pathway (Appendix Table 4). These states include Arizona, Arkansas, Colorado, Delaware, DC, Massachusetts, Washington, and Wyoming. Among states that do have an asset limit for this pathway, the median was $10,000 for an individual and $15,000 for a couple, substantially higher than the SSI limits of $2,000 and $3,000, respectively. Increasing or eliminating these asset limits recognizes that enrollees are likely to incur expenses, such as those related to work or community living, and enables them to accrue some savings to meet future expenses.
Three-quarters of states (34 of 4540) charge premiums in the working people with disabilities pathway (Appendix Table 4). Premium amounts in most states are on a sliding scale based on income. Some states charge a flat dollar amount, while others charge a certain percentage of income. The 10 states that do not charge premiums include DC, Florida, Kentucky, Louisiana, Michigan, New Mexico, New York, South Dakota, Vermont, and Virginia.
Section 1915 (i) for People AT Risk of institutional Care
Ohio has joined Indiana as the only states using Section 1915 (i) as an independent Medicaid eligibility pathway since this option became available under the ACA (Appendix Table 1). The ACA amended Section 1915 (i) to allow states to provide full Medicaid benefits to people who are not otherwise eligible and who meet financial and functional eligibility criteria.41 States can cover (1) people up to 150% FPL with no asset limit who meet functional eligibility criteria; and/or (2) people up to 300% SSI who would be eligible for Medicaid under an existing HCBS waiver. States can target Section 1915 (i) services to a particular population. Indiana uses Section 1915 (i) to provide Medicaid eligibility to adults with mental health conditions up to 150% FPL.42 Ohio uses Section 1915 (i) to provide Medicaid eligibility to adults with certain mental health or physical health disabilities.43 Section 1915 (i) functional eligibility requires people to have needs that are less than what is required to qualify for an institutional level of care, which enables states to offer HCBS as preventive services in efforts to delay or foreclose the need for costlier future care or institutionalization. Unlike waivers, states are not permitted to cap enrollment or maintain a waiting list for Section 1915 (i) HCBS. However, states can manage enrollment under Section 1915 (i) by restricting functional eligibility criteria if the state will exceed the number of beneficiaries that it anticipated serving. Fourteen other states use Section 1915 (i) to authorize HCBS44 but require beneficiaries to be otherwise eligible for Medicaid through another coverage pathway.
State Adoption of Optional Eligibility Pathways Based on Old Age or Disability and the ACA Medicaid Expansion
Greater shares of states that have adopted the ACA Medicaid expansion also have adopted key optional eligibility pathways based on old age or disability, compared to non-expansion states (Figure 7 and Table 2 below). To date, 37 states (including DC) have adopted the ACA Medicaid expansion, and 14 have not.45 Just under half of expansion states46 elect the option to cover seniors and people with disabilities up to 100% FPL, compared to less than one-third of non-expansion states.47 Nearly three-quarters of expansion states48 also offer the optional medically needy pathway for seniors and people with disabilities, while just over one-third of non-expansion states49 do so. Over two in five expansion states50 elect the Katie Beckett state plan option for children with significant disabilities,51 compared to just over one-third of non-expansion states.52 Nearly all expansion states53 also elect the option to cover working people with disabilities, compared to less than two-thirds of non-expansion states.54 The two states opting to use Section 1915 (i) as an independent eligibility pathway are both expansion states. All states adopt at least one of these optional age and disability-related state plan options, with the exception of Alabama. (Alabama does cover Katie Beckett children through a waiver; waiver coverage is excluded from this analysis as, unlike state plan coverage groups, waiver enrollment can be capped.)
Figure 7: State Adoption of Optional Medicaid Eligibility Pathways for Seniors and People with Disabilities, by ACA Expansion Status, 2018
Table 2: Adoption of Optional Medicaid Eligibility Pathways for Seniors and People with Disabilities, by ACA Expansion Status, 2018
Optional Eligibility Pathway
Expansion States (37 states)
Non-Expansion States (14 states)
Number Adopting
Share of Expansion States
Number Adopting
Share ofNon-Expansion States
Seniors and People with Disabilities up to 100% FPL
17
46%
4
29%
Medically Needy Seniors and People with Disabilities1
27
73%
5
36%
Katie Beckett State Plan Option2
16
43%
5
36%
Family Opportunity Act State Plan Option2
4
11%
1
7%
Working People with Disabilities
36
97%
9
64%
Section 1915 (i) HCBS as an Independent Eligibility Pathway
2
5%
0
0%
NOTES: 1Excludes 2 non-expansion states (TN and TX) which limit the medically needy pathway to pregnant women and children and does not include seniors and people with disabilities. 2Katie Beckett and Family Opportunity Act categories exclude states with comparable waivers. SOURCE: KFF Medicaid Financial Eligibility Survey for Seniors and People with Disabilities, 2018.
State Options to Expand Medicaid LTSS Financial Eligibility
All states elect at least some options to expand financial eligibility for people who need Medicaid LTSS. Medicaid LTSS includes nursing home and other institutional services as well as home and community-based services (HCBS). Medicaid remains the primary payer for LTSS, as Medicare does not cover long-term care, private insurance coverage is limited, and out-of-pocket costs often are unaffordable.55 Medicaid also is an important source of federal funds to support states in meeting their community integration obligations under the Americans with Disabilities Act and the Olmstead decision.56 State policy choices about key financial eligibility rules for Medicaid LTSS are described below.
Special Income Rule
Nearly 85 percent of states (43 of 51) allow people with functional needs that require an institutional level of care to qualify for Medicaid institutional and/or home and community-based LTSS with income up to 300% SSI ($2,250 per month for an individual in 201857) under the “special income rule” (Appendix Table 5).58 Forty-one of these states use the federal maximum of 300% SSI. Delaware’s limit is 250% FPL, and the income limit in Missouri varies by program. States also apply an asset limit under the special income rule, usually the SSI amount of $2,000 for an individual and $3,000 for a couple.
Nearly all of the states using the special income rule apply it to both people in institutions, such as nursing homes, and people receiving services in the community59 (Figure 8 and Appendix Table 5). Minnesota applies the special income rule to institutional services and to seniors living in the community but not to other groups seeking HCBS. Missouri’s rules vary by program. By contrast, Massachusetts applies the special income rule only to HCBS and not to institutional care. Aligning financial eligibility rules across long-term care settings is important to eliminating programmatic bias toward institutional care. If people can qualify for institutional services at higher incomes than required to qualify for community-based services, they may choose to enter a nursing facility when they need care instead of going without necessary care while spending down to the lower HCBS income limit.
Figure 8: State Options to Expand Financial Eligibility for Medicaid LTSS, by Care Setting, 2018
Qualified Income or “Miller” Trusts
About half (25 of 51) of states allow an individual residing in an institution to qualify for Medicaid LTSS with income higher than 300% of SSI if their excess income is administered through a special type of trust, called a qualified income or Miller trust60 (Figure 8 and Appendix Table 6).61 Eighteen of these states do not cap the amount that can be put into a Miller trust when establishing eligibility for institutional LTSS. Income from a Miller trust can be used to fund the Medicaid beneficiary’s personal needs allowance as well as a monthly allowance for the beneficiary’s spouse who remains in the community under the spousal impoverishment rules (both discussed below). Any additional income from the trust goes toward the beneficiary’s cost of care, and states can recover funds remaining in the trust after the individual’s death to reimburse the cost of care.
Nearly all states allowing Miller Trusts for institutional care (22 of 25) also allow individuals to use Miller trusts to qualify for Medicaid HCBS (Figure 8 and Appendix Table 6). The three states that offer Miller trusts for institutional care but not for HCBS are Alabama, Nevada, and Wyoming. Fourteen of the 22 states that offer Miller trusts for HCBS do not cap the amount that can be put into the trust. Among the states that do cap Miller trust amounts for HCBS, four states (AZ, KY, OK, and SD) set the same dollar amount cap for HCBS as for institutional care.62 The remaining state (IA) sets a cap of 125% of the average nursing facility cost for individuals receiving HCBS but does not cap the trust amount for individuals in institutions. As noted above, using the same financial eligibility rules for institutional care and HCBS helps alleviate bias toward intuitional care.
Supplemental Needs and Pooled Income Trusts
Nearly all states (48 of 51) allow individuals to qualify for Medicaid LTSS using supplemental needs63 and pooled income64 trusts (Appendix Table 6). The three states that do not report recognizing these types of trusts are Alabama, Hawaii, and Illinois. Both of these types of trusts contain assets for the benefit of non-elderly people with disabilities that are excluded from Medicaid financial eligibility determinations. The trust beneficiary must have a disability based on SSI criteria. Both types of trusts can be established by the individual’s parent, grandparent, legal guardian or a court and must provide that the state can receive any amount remaining in the trust upon the beneficiary’s death to cover the cost of Medicaid services provided. Pooled income trusts are established and managed by a non-profit association, with a separate account for each beneficiary, but assets are combined for purposes of fund investment and management. This option can enable individuals with relatively small trust amounts to benefit from economies of scale by being part of a larger pool of funds for investment and management purposes. Twenty-two states do not cap the amount that can be placed in a supplemental needs trust,65 and 20 states do not cap the amount that can be placed in a pooled income trust. The two states that apply caps to pooled income trusts but not supplemental needs trusts are Illinois and Tennessee.
ABLE Accounts for Disability-Related Expenses
All states have authorized Achieving a Better Life Experience (ABLE) accounts, which allow people with disabilities and their families to save money to fund disability-related expenses that is disregarded when determining Medicaid eligibility (Appendix Table 6).66 Federal legislation in 2014 enabled states to establish ABLE programs for people with significant disabilities with onset before age 26.67 Annual account contributions are generally limited to the federal gift tax exclusion amount ($15,000 per year in 2018). In addition, ABLE account beneficiaries who work can contributed earned income in an amount equal to 100% FPL for a household of one ($12,140 per year in 2018)68 if they do not receive employer contributions to a workplace retirement savings account.69 These accounts seek to equalize the treatment of savings for future expenses for people with disabilities, similar to 529 plans for higher education expenses.
The median ABLE account maximum lifetime limit is $400,000, and ranges from $235,000 in Mississippi, to $511,758 in Pennsylvania (Appendix Table 6).70 ABLE account contributions and investment earnings can be used for disability-related expenses, such as education, housing, transportation, employment training and support, assistive technology, personal support services, health, financial management, legal fees, and other expenses approved by the Treasury Secretary. In the preamble to the proposed implementing regulations, the IRS noted that qualified ABLE account expenses “should be broadly construed to permit the inclusion of basic living expenses and should not be limited to expenses for items for which there is a medical necessity. . . .”71
Home Equity Limits
Over three-quarters of states (40 of 51) limit home equity to the federal minimum of $552,000 for Medicaid beneficiaries seeking eligibility for LTSS, while nine states allow the upper limit of $858,000 (Appendix Table 6).72 Wisconsin limits home equity to $750,000, and California has no limit on home equity for the individual’s principal residence.
Personal/Maintenance Needs Allowance
The median personal needs allowance for an individual residing in an institution is $50 per month (Appendix Table 7). Three states (AL, NC, and SC) set their personal needs allowance at the federal minimum of $30 per month. The state with the highest personal needs allowance in the continental U.S. is Florida ($130 per month). Alaska is an outlier with a personal needs allowance of $1,396 per month. Once eligible for Medicaid, individuals in institutions generally must contribute most of their monthly income to the cost of their care, with the exception of a small allowance used to pay for personal needs that are not covered by Medicaid, such as clothing.73
The median maintenance needs allowance for a Medicaid beneficiary residing in the community is $1,840 per month.74 These amounts ranged from a low of $100 per month in Montana to a high of $2,250 per month (300% of SSI) in 20 states (Appendix Table 7). Four states (IL,75 MO, NM, and NC) do not report a maintenance needs allowance of any amount for Medicaid HCBS beneficiaries. Six states (HI, ID, MD, NH, NJ, and OR) report that maintenance needs allowances vary by waiver program and/or living arrangement. Certain Medicaid beneficiaries receiving HCBS76 must contribute a portion of their income to their cost of care, although states generally allow them to retain a monthly maintenance needs allowance that exceeds the institutional personal needs allowance described above, recognizing that individuals living in the community must pay for room and board. There is no federal minimum HCBS maintenance needs allowance; instead, states may use any amount as long as it is based on a “reasonable assessment of need” and subject to a maximum that applies to all enrollees under the HCBS waiver.77 The maintenance needs allowances established by states play a critical role in determining whether individuals can afford to remain in the community and avoid or forestall institutional placement.
Spousal Impoverishment Rules
When a married Medicaid beneficiary is receiving nursing facility or other institutional LTSS, 14 states allow the spouse remaining in the community to retain $2,05878 in income per month (the federal minimum, 150% FPL for a household of two), and 19 states permit $3,09079 per month (the federal maximum) (Appendix Table 7). The remaining 18 states establish a level between the federal minimum and maximum. This protected income is called the spouse’s “monthly maintenance needs allowance” and is a feature of the spousal impoverishment rules (Figure 9). Congress created the spousal impoverishment rules in 1988 to protect a portion of a married couple’s income and assets and ensure that the “community spouse” is able to meet their living expenses when the other spouse seeks Medicaid LTSS. The spousal impoverishment rules supersede rules that would otherwise require Medicaid financial eligibility determinations to account for a spouse’s financial responsibility for a Medicaid applicant or beneficiary by contributing to their cost of care.80
Figure 9: Effect of Spousal Impoverishment Rules on Medicaid Financial Eligibility
Eighteen states allow the community spouse to retain $123,60081 in assets (the federal maximum) when the other spouse is receiving Medicaid-funded nursing facility or other institutional LTSS (Appendix Table 7). Two states (KY and UT) elect the federal minimum ($24,720).82 This is known as the “community spouse resource allocation.” Most states apply a formula that allows the community spouse to retain an amount of protected assets that is the greater of either the federal minimum ($24,720) or one-half of the couple’s total combined resources but not to exceed the federal maximum ($123,600).
As of 2018, 50 states were applying the spousal impoverishment rules to HCBS waivers as required by ACA Section 2404 (Figure 8 and Appendix Table 7).83 The remaining state (IL) applied the rules to some but not all HCBS waivers.84 States must apply the spousal impoverishment rules to institutional care, but prior to the ACA, states had the option to apply the spousal impoverishment rules when a married individual sought home and-community based waiver services.85 Beginning on January 1, 2014, ACA Section 2404 required states to apply the spousal impoverishment rules to HCBS waivers.86 At the time of our survey, Section 2404 was set to expire at the end of 2018, but Congress subsequently extended it through March 2019,87 and again through September 201988 (Figure 10).
Figure 10: Application of Medicaid Spousal Impoverishment Rules
If ACA Section 2404 expires, 46 states reported plans as of the end of 2018 to continue to apply the spousal impoverishment rules to all of their HCBS waivers as of the end of 2018; five states reported plans to scale back or discontinue application of the rules to HCBS, and others could follow (Figure 8 and Appendix Table 7).89 Arkansas and Illinois plan to scale back by applying the rules to some but not all HCBS waivers if Section 2404 is not reauthorized. Arkansas will apply the rules to two of its four waivers.90 Illinois plans to scale back application of the rules if Section 2404 is not extended by applying the rules in full to one of nine HCBS waivers and in part (for financial eligibility but not post-eligibility treatment of income) to two waivers.91 Minnesota plans to apply the rules to one of five HCBS waivers.92 Maine93 and New Hampshire do not plan to apply the rules to any HCBS waivers if Congress does not reauthorize ACA Section 2404.
Medicare Savings Programs for Dual Eligible Beneficiaries94
States must offer Medicare Savings Programs (MSPs) through which low-income Medicare beneficiaries receive Medicaid assistance with some or all of their Medicare out-of-pocket costs.95 Medicare beneficiaries include seniors as well as nonelderly people with disabilities receiving Social Security Disability Insurance, generally after a 24-month waiting period. Medicare’s out-of-pocket costs, including premiums, deductibles, and other cost-sharing, can be high. For example, Medicare Part A, which covers inpatient hospital services, has an annual deductible of $1,340 in 2018.96 Medicare Part B, which covers outpatient services, requires a monthly premium of $134 for most beneficiaries in 2018.97 Part B also requires an annual deductible of $183 in 201898 and co-insurance of 20% of the Medicare-approved cost of services after the deductible is met.99 Box 4 describes the MSP pathways.
Box 4: MSP Pathways
To help low-income enrollees afford Medicare’s out-of-pocket costs, state Medicaid programs must offer three MSPs:
Qualified Medicare Beneficiaries (QMBs) generally have incomes up to 100% FPL ($1,012 per month for an individual and $1,372 for a couple in 2018).100 Medicaid pays Medicare Parts A and B premiums and cost-sharing for QMBs.
Specified Low-Income Medicare Beneficiaries (SLMBs) have slightly higher incomes (100-120% FPL) and receive help with Medicare Part B premiums only.101 Most states set their SLMB income limits at 120% FPL ($1,214 per month for an individual and $1,646 for a couple in 2018).102
Qualified Individuals (QIs) are eligible for Medicaid assistance with Medicare Part B premiums through an expansion of the SLMB program passed by Congress in 1997. The QI program covers Medicare beneficiaries with incomes up to 135% FPL ($1,366 per month for an individual and $1,852 for a couple in 2018).103 However, unlike other Medicaid pathways, because Congress only appropriates a limited amount of funds to each state to pay for the QI program, once a state’s QI appropriation is spent, additional individuals who meet the eligibility criteria cannot receive help.
Four states set their MSP income limits higher than the federal minimum (Appendix Table 8). These states include Connecticut, DC,104 Indiana, and Maine, with Indiana joining this group since the time of our last survey in 2015. Three states (ME, MS, IL) apply income disregards higher than the $20 SSI general disregard.
Nine states have no MSP asset limits (Appendix Table 8). These states include Alabama, Arizona, Connecticut, Delaware, DC, Mississippi, New York, Oregon, and Vermont, with Oregon joining this group in 2016. Most states have MSP asset limits within the federal guideline amounts of $7,560 for an individual and $11,340 for a couple. A few states have slightly higher limits ($9,060 for an individual and $14,340 for a couple in CO and NM, and $10,000 for an individual and $18,000 for a couple in MN). Maine’s MSP asset limit is substantially higher at $58,000 for an individual and $87,000 for a couple.
State Option to Adopt Streamlined Renewal Procedures for Pathways Based on Old Age or Disability
Nearly all states (47 of 51) have adopted at least one of the ACA’s streamlined processes for Medicaid beneficiaries renewing coverage through an age or disability-related pathway, and over 60% (31 of 51) have adopted both options (Figure 11 and Appendix Table 9). Aside from the Medicaid expansion, the ACA introduced other reforms that simplify and modernize Medicaid eligibility and enrollment processes. All states must adopt these reforms for poverty-related coverage pathways, and states can choose whether to apply them to age and disability-related pathways.105 Streamlined renewal polices can facilitate continuous coverage among eligible individuals, which helps prevent gaps in care and protects individuals from out-of-pocket costs that might be incurred if they experience a break in coverage. We surveyed states about whether they opt to send pre-populated eligibility renewal forms and whether they offer reconsideration periods for eligibility renewals in pathways related to old age or disability. The states that have not adopted either of these options are Alaska, New Hampshire, and Oregon.106
Figure 11: State Adoption of ACA Streamlined Renewal Options for Age and Disability-Related Pathways, 2018
About 70 percent of states (30 of 51) are using prepopulated forms to facilitate eligibility renewals in age and disability-related pathways (Figure 11 and Appendix Table 9).107 Five of these states (CT, ME, NM, OH, and VA) newly report that they have adopted this option since our last survey in 2015. Another five states (CA, MO, ND, SC, and TN) report that they are planning to implement this reform (Appendix Table 9). Three of the states that are not sending prepopulated forms for age and disability pathway eligibility renewals also are not doing so for poverty-related pathways (FL, LA, and OK).108 Sending prepopulated forms can simplify the eligibility renewal process for beneficiaries and help retain eligible people in coverage, which in turn strengthens continuity of care.
Almost 85 percent of states (43 of 51) offer a reconsideration period, allowing those in age and disability-related pathways to renew coverage without a new application within a certain period of time after termination (Figure 11 and Appendix Table 9).109 Nine of these states (DC, HI, LA, MO, MT, NM, NC, OK, and WV) newly report that they have adopted this option since our last survey in 2015. The ACA’s streamlining reforms for poverty-related pathways call for the reconsideration period to be 90 days from the date of Medicaid termination. Our survey did not ask states for the length of the reconsideration period for age and disability-related pathways, but nine states (IN, IA, NV, NJ, OH, SC, UT, VT, and WY) volunteered that they use 90 days, consistent with the period for poverty-related pathways. DC’s reconsideration period is 30 days, and Maryland uses 120 days. If a person whose coverage has been terminated for lack of response to an eligibility renewal form subsequently does return the form within the reconsideration time period, coverage can be renewed without requiring a new application.110
Looking Ahead
Medicaid remains an essential – and often the sole – source of medical and LTSS coverage for many seniors and nonelderly adults and children with disabilities. Aside from the core group of SSI beneficiaries, pathways to full Medicaid eligibility based on old age or disability are provided at state option. Consequently, there is substantial variation among states regarding which optional pathways are available and the associated financial eligibility limits.
While adoption of the major optional age and disability-related Medicaid eligibility pathways varies substantially across states, state choices about these pathways have remained stable since the time of our last survey in 2015. All states except Alabama elect at least one state plan optional pathway to full Medicaid eligibility based on old age or disability. (Alabama does offer a waiver to cover some Katie Beckett-like children.) Since the time of our last survey, Ohio and Oklahoma have stopped electing the Section 209 (b) option and instead follow federal rules for SSI beneficiaries, and no states have added or discontinued the optional pathway to cover seniors and people with disabilities up to 100% FPL. State choices about pathways to cover children with significant disabilities have remained stable overall, with Tennessee, the sole state without any Katie Beckett coverage, recently enacting legislation to establish a waiver pathway for these children; Louisiana recently passing legislation to adopt the Katie Beckett state plan option in addition to its current waiver coverage; and no states newly adopting or discontinuing the FOA pathway. Florida has joined 44 other states that cover working people with disabilities, and Ohio has adopted Section 1915 (i) as an independent coverage pathway.
The income limits associated with age and disability-related pathways vary across states but generally remain low. The median income limit was 74% FPL for individuals eligible based on old age or disability, 48% FPL for individuals eligible as medically needy, and 250% FPL for working people with disabilities. Medicaid eligibility in these pathways could be affected by a change to the inflation measure that is used to determine the annual federal poverty line, which the federal government is considering.111 Using a lower inflation measure would result in smaller increases in the poverty line each year compared to the current measure, which would slow the annual increase in Medicaid income limits based on the FPL over time, with fewer people eligible for Medicaid as a result.
A notable minority of states have opted to eliminate asset tests in certain age and disability-related pathways. To date, Arizona remains the only state without an asset test for the seniors and people with disabilities option to 100% FPL, eight states do not have asset tests for their working people with disabilities buy-in, and nine states do not have asset tests for MSP pathways. No states that have eliminated asset tests have sought to reinstate them since the time of our last survey in 2015. Eliminating asset tests aligns these age and disability-related pathways with newer disability-related pathways (FOA and Section 1915 (i)) that do not have asset tests and with poverty-related pathways, in which asset tests were eliminated by the ACA.
State choices about optional age and disability-related pathways have remained relatively stable, even as states have adopted the ACA Medicaid expansion, with greater shares of expansion states also adopting key age and disability-related pathways compared to non-expansion states. At the time of our last survey in 2015, key open questions were whether and how the availability of the ACA Medicaid expansion pathway might affect state choices about optional age and disability-related pathways. To date, ACA Medicaid expansion states generally have not sought to decrease or eliminate eligibility in age and disability-related pathways. On the other hand, a few ACA expansion states have taken steps to expand eligibility in age and disability-related pathways. As noted above, Louisiana recently passed legislation to adopt the Katie Beckett state plan option, in addition to its Katie Beckett-like waiver program and Ohio adopted the Section 1915 (i) eligibility pathway. Indiana has increased its MSP income limits, and Oregon eliminated its MSP asset test. States that have not adopted the ACA Medicaid expansion also generally have not sought to increase eligibility in age and disability-related pathways. As noted above, the exceptions are Florida, which newly reports covering the working people with disabilities pathway since 2015, and Tennessee, which recently passed legislation authorizing a capped Katie Beckett-like waiver program.
All states elect at least some options to expand financial eligibility for Medicaid LTSS. Medicaid remains the primary payer for LTSS and an important source of federal funds to support states in meeting their community integration obligations under the Americans with Disabilities Act and the Olmstead decision. State flexibility in setting LTSS financial eligibility rules can be used to counter the historical program bias in favor of institutional care over HCBS. While most states that expand financial eligibility for Medicaid nursing home and other institutional care also apply those same rules to HCBS, there are a few states in which HCBS financial eligibility rules are more restrictive and could be aligned with those for institutional care to eliminate bias in favor of institutional care. Relatedly, if Congress does not re-authorize ACA Section 2404, which is currently set to expire on September 30, 2019, the spousal impoverishment rules will revert to a state option for HCBS while remaining in place for institutional care. Allowing Section 2404 to expire could slow or begin to reverse states’ progress in expanding access to HCBS, while extending Section 2404 would provide stability for states and enrollees receiving HCBS. If ACA Section 2404 expires, five states reported plans as of the end of 2018 to scale back or discontinue application of the rules to HCBS, and others could follow.
All state Medicaid programs include MSPs in which Medicaid covers some or all out-of-pocket costs for low-income Medicare beneficiaries. Few states expand MSP financial eligibility beyond the federal minimum limits, although nine states have opted to eliminate MSP asset tests.
An increasing number of states are opting to apply the ACA’s streamlined eligibility renewal provisions to age and disability-related pathways, which can help retain eligible people in coverage and strengthen continuity of care. Thirty states now use prepopulated forms to facilitate eligibility renewals, with five states newly electing this option since the time of our last survey in 2015, and another five states reporting plans to implement this option. Forty-three states offer reconsideration periods, with nine of these states newly adopting this option since our last survey.
Looking ahead, state and federal policy choices that affect Medicaid eligibility for seniors and people with disabilities will remain important areas to watch. Policy changes in the years ahead will influence the extent to which seniors and people with disabilities can gain and maintain Medicaid eligibility and access to needed preventive, physical, behavioral health, and long-term services and supports.
Appendix Tables
Appendix Table 1: State Adoption of Key Optional Pathways to Full Medicaid Eligibility Based on Old Age or Disability, 2018
Appendix Table 2: Medicaid Eligibility for SSI Beneficiaries and Optional Pathway for Seniors and People with Disabilities Up to 100% FPL, 2018
Appendix Table 3: Medicaid Eligibility Through the Medically Needy Pathway, 2018
Appendix Table 4: Medicaid Eligibility for Working People with Disabilities, 2018
Appendix Table 5: Medicaid Special Income Rule for Long-Term Services and Supports Eligibility, 2018
Appendix Table 6: Medicaid Long-Term Services and Supports Trusts and Home Equity Limits, 2018
Appendix Table 7: Medicaid Long-Term Services and Supports Post-Eligibility Treatment of Income and Spousal Impoverishment Standards, 2018
Appendix Table 8: Eligibility for Medicaid’s Medicare Savings Programs, 2018
Appendix Table 9: State Adoption of Selected ACA Streamlined Medicaid Eligibility Renewal Provisions, 2018
Appendix Table 1: State Adoption of Key Optional Pathways to Full Medicaid Eligibility Based on Old Age or Disability, 2018
State
Seniors and People with Disabilities up to 100% FPL
Medically Needy
Katie Beckett Children with Significant Disabilities Living at Home4
Family Opportunity Act Buy-in for Children with Significant Disabilities
Buy-in for Working People with Disabilities
Section 1915 (i) HCBS as an Independent Eligibility Pathway7
TOTAL
21
34
50
6
45
2
Alabama
✓, waiver
Alaska
✓, SPA
✓
Arizona
✓
✓, waiver
✓
Arkansas
✓1, 2
✓
✓, waiver
✓
California
✓
✓
✓, waiver
✓
Colorado
✓, both
✓
✓
Connecticut
✓
✓, waiver
✓
Delaware
✓, SPA
✓
DC
✓
✓
✓, SPA
✓
Florida
✓1
✓
✓, waiver
✓
Georgia
✓
✓, SPA
✓
Hawaii
✓
✓
✓, waiver
Idaho
✓, SPA
✓
Illinois
✓
✓
✓, waiver
✓
Indiana
✓
✓, waiver
✓
✓
Iowa
✓
✓, SPA
✓
✓
Kansas
✓
✓, waiver
✓
Kentucky
✓
✓, waiver
✓
Louisiana
✓
✓, waiver
✓
✓
Maine
✓
✓
✓, SPA
✓
Maryland
✓
✓, waiver
✓
Massachusetts
✓
✓
✓, SPA
✓6
✓
Michigan
✓
✓
✓, waiver
✓
Minnesota
✓
✓
✓, SPA
✓
Mississippi
✓, SPA
✓
Missouri
✓, waiver
Montana
✓
✓, waiver
✓
Nebraska
✓
✓
✓, both
✓
Nevada
✓, SPA
✓
New Hampshire
✓
✓, SPA
✓
New Jersey
✓
✓
✓, waiver
✓
New Mexico
✓, waiver
✓
New York
✓
✓, both
✓
North Carolina
✓
✓
✓, waiver
✓
North Dakota
✓
✓, waiver
✓
✓
Ohio
✓, waiver
✓
✓
Oklahoma
✓
✓, SPA
Oregon
✓, waiver
✓
Pennsylvania
✓
✓
✓, waiver
✓
Rhode Island
✓
✓
✓, both
✓
South Carolina
✓
✓, SPA
South Dakota
✓, SPA
✓
Tennessee
✓3
5
Texas
✓3
✓, waiver
✓
✓
Utah
✓
✓
✓, waiver
✓
Vermont
✓
✓, SPA
✓
Virginia
✓1
✓
✓, waiver
✓
Washington
✓
✓, waiver
✓
West Virginia
✓
✓, SPA
✓
Wisconsin
✓
✓, waiver
✓
Wyoming
✓, waiver
✓
NOTES: Unless otherwise indicated, table excludes Medicaid eligibility pathways available through HCBS waivers. 1 AR, FL, and VA do not elect the maximum of 100% FPL. 2 AR extends coverage beyond SSI limits for seniors only. 3 In TN and TX, the medically needy pathway is limited to pregnant women and children and does not include seniors and people with disabilities. 4 States can cover Katie Beckett children through state plan amendments (SPAs) and/or comparable waivers. 5 TN provides waiver coverage to “medically eligible” children in households with incomes at or above 211% FPL, although enrollment in this pathway is currently closed except for rollovers for those losing coverage under traditional groups; recent legislation directs the state to establish a Katie Beckett-like waiver program. 6 Massachusetts has a Section 1115 waiver program comparable to the FOA option. 7 Other states use Section 1915 (i) to offer HCBS to people who are otherwise Medicaid eligible.
SOURCE: Kaiser Family Foundation, Medicaid Financial Eligibility Survey for Seniors and People with Disabilities, 2018.
Appendix Table 2: Medicaid Eligibility for SSI Beneficiaries and Optional Pathway for Seniors and People with Disabilities Up To 100% FPL, 2018
State
Monthly Income Limit
Income Disregard
% FPL
Asset Limit
Individual
Couple
Individual
Couple
MEDIAN
$750
$1,125
$20
74%
$2,000.00
$3,000.00
Alabama
$750
$1,125
$20
74%
$2,000
$3,000
Alaska
$750
$1,125
$20
74%
$2,000
$3,000
Arizona
$1,012
$1,372
$20
100%
No limit
No limit
Arkansas
$804
$1,083
$20
80%
$7,560
$11,340
California
$1,012
$1,372
$230 individual/ $310 couple
100%
$2,000
$3,000
Colorado
$750
$1,125
$20
74%
$2,000
$3,000
Connecticut1,2
$523
$696
$339
63%
$1,600
$2,400
Delaware
$750
$1,125
$20
74%
$2,000
$3,000
DC
$1,012
$1,372
$20 individual/ $100 couple
100%
$4,000
$6,000
Florida
$891
$1,208
$20
88%
$5,000
$6,000
Georgia
$750
$1,125
$20
74%
$2,000
$3,000
Hawaii1
$1,164
$1,578
$20
100% Hawaii poverty line
$2,000
$3,000
Idaho
$803
$1,145
$20
80%3
$2,000
$3,000
Illinois1
$1,012
$1,372
$25
100%
$2,000
$3,000
Indiana
$1,012
$1,372
$20
100%
$2,000
$3,000
Iowa
$750
$1,125
$20
74%
$2,000
$3,000
Kansas
$750
$1,125
$20
74%
$2,000
$3,000
Kentucky
$750
$1,125
$20
74%
$2,000
$3,000
Louisiana
$750
$1,125
$20
74%
$2,000
$3,000
Maine
$1,012
$1,372
$75
100%
$2,000
$3,000
Maryland
$750
$1,125
$20
74%
$2,000
$3,000
Massachusetts
$1,012
$1,372
$20
100%
$2,000
$3,000
Michigan
$1,012
$1,372
$20
100%
$2,000
$3,000
Minnesota1
$1,012
$1,372
$20
100%
$3,000
$6,000
Mississippi
$750
$1,125
$20
74%
$2,000
$3,000
Missouri1
$880
$1,186
$20
87%3
$3,000
$6,000
Montana
$750
$1,125
$20
74%
$2,000
$3,000
Nebraska
$1,012
$1,372
$20
100%
$4,000
$6,000
Nevada
$750
$1,125
$20
74%
$2,000
$3,000
New Hampshire1
$750
$1,125
$13 individual/$20 couple
74%
$1,500
$1,500
New Jersey
$1,012
$1,372
$20
100%
$4,000
$6,000
New Mexico
$750
$1,125
$20
74%
$2,000
$3,000
New York
$837
$1,229
$20
83%3
$2,000
$3,000
North Carolina
$1,012
$1,372
$20
100%
$2,000
$3,000
North Dakota1
$750
$1,125
$20
74%
$3,000
$6,000
Ohio
$750
$1,125
$20
74%
$2,000
$3,000
Oklahoma
$1,012
$1,372
$20
100%
$2,000
$3,000
Oregon
$750
$1,125
$20
74%
$2,000
$3,000
Pennsylvania
$1,012
$1,372
$20
100%
$2,000
$3,000
Rhode Island
$1,012
$1,372
$20
100%
$4,000
$6,000
South Carolina
$1,012
$1,372
$20
100%
$7,560
$11,340
South Dakota
$750
$1,125
$20
74%
$2,000
$3,000
Tennessee
$750
$1,125
$20
74%
$2,000
$3,000
Texas
$750
$1,125
$20
74%
$2,000
$3,000
Utah
$1,012
$1,372
$20
100%
$2,000
$3,000
Vermont
$750
$1,125
$20
74%
$2,000
$3,000
Virginia1
$810
$1,098
$20
81%
$2,000
$3,000
Washington
$750
$1,125
$20
74%
$2,000
$3,000
West Virginia
$750
$1,125
$20
74%
$2,000
$3,000
Wisconsin
$834
$1,257
$20
83%3
$2,000
$3,000
Wyoming
$750
$1,125
$20
74%
$2,000
$3,000
NOTES: States generally must provide Medicaid to SSI beneficiaries (equivalent to 74% FPL in 2018) and have the option to extend eligibility for seniors and people with disabilities up to 100% FPL. 1 Eight states elect the Section 209 (b) option, which allows states to use financial and functional eligibility criteria that differ from the federal SSI rules, as long as they are no more restrictive than the rules the state had in place in 1972. 2 Table includes data for regions B & C. Region A income limit is $633/single and $805/couple. All regions offer a boarding home disregard of $246.70 and a shared living disregard of $406.90. 3 In ID, MO, NY, and WI, the effective SSI income limit is higher than 74% FPL due to state supplemental payments and/or additional income disregards.
SOURCE: Kaiser Family Foundation, Medicaid Financial Eligibility Survey for Seniors and People with Disabilities, 2018.
Appendix Table 3: Medicaid Eligibility Through the Medically Needy Pathway, 2018
State
Medically Needy Populations Covered
Monthly Income Limit
% FPL4
Asset Limit
Budget Period
Benefit Package Includes Nursing Facility Services
Pregnant Women
Children
Seniors
People with Disabilities
Low-Income Parents
Individual
Couple
Individual
Couple
TOTAL/MEDIAN
34
34
32
32
26
$488
$559
48%
$2,000
$3,000
N/A
25
Arkansas
✓
✓
✓
✓
✓
$108
$217
11%
$2,000
$3,000
3 months
No response
California
✓
✓
✓
✓
✓
$600
$934
59%
$2,000
$3,000
1 month
✓
Connecticut1,2
✓
✓
✓
✓
$523
$696
52%
$1,600
$2,400
6 months
✓
DC
✓
✓
✓
✓
✓
$652
$652
64%
$4,000
$6,000
1-6 months
✓
Florida
✓
✓
✓
✓
✓
$180
$241
18%
$5,000
$6,000
1 month
Georgia
✓
✓
✓
✓
✓
$317
$375
32%
$2,000
$4,000
1 month
Hawaii
✓
✓
✓
✓
$469
$632
40%
$2,000
$3,000
1 month
✓
Illinois
✓
✓
✓
✓
✓
$1,012
$1,372
100%
$2,000
$3,000
1 month
✓
Iowa
✓
✓
✓
✓
✓
$483
$483
48%
$10,000
$10,000
2 months
✓
Kansas
✓
✓
✓
✓
✓
$475
$475
47%
$2,000
$3,000
6 months
✓
Kentucky
✓
✓
✓
✓
✓
$235
$291
24%
$2,000
$4,000
1-3 months
Louisiana 1,3
✓
✓
✓
✓
✓
$100
$192
10%
$2,000
$3,000
3 months
✓
Maine
✓
✓
✓
✓
✓
$315
$341
32%
$2,000
$3,000
6 months
✓
Maryland
✓
✓
✓
✓
✓
$350
$392
35%
$2,500
$3,000
6 months
✓
Massachusetts
✓
✓
✓
✓
$522
$650
52%
$2,000
$3,000
6 months
✓
Michigan
✓
✓
✓
✓
✓
$1,012
$1,372
100%
$2,000
$3,000
1 month
✓
Minnesota
✓
✓
✓
✓
✓
$810
$1,098
80%
$3,000
$6,000
6 months
✓
Montana
✓
✓
✓
✓
✓
$525
$525
52%
$2,000
$3,000
1 month
Nebraska
✓
✓
✓
✓
✓
$392
$392
39%
$4,000
$6,000
1 month
✓
New Hampshire
✓
✓
✓
✓
✓
$591
$675
58%
$2,500
$4,000
1 or 6 months
New Jersey
✓
✓
✓
✓
✓
$367
$434
37%
$4,000
$6,000
6 months
New York
✓
✓
✓
✓
✓
$842
$1,233
84%
$15,150
$22,200
6 months
✓
North Carolina
✓
✓
✓
✓
✓
$242
$317
24%
$2,000
$3,000
6 months
✓
North Dakota
✓
✓
✓
✓
✓
$840
$1,139
83%
$3,000
$6,000
1 month
✓
Pennsylvania
✓
✓
✓
✓
✓
$425
$442
42%
$2,400
$3,200
6 months
✓
Rhode Island
✓
✓
✓
✓
✓
$903
$947
88%
$4,000
$6,000
6 months
✓
Tennessee
✓
✓
$241
$258
24%
$2,000
$3,000
1 month
✓
Texas
✓
✓
$104
$216
11%
$2,000
$3,000
1-3 months
Utah
✓
✓
✓
✓
✓
$1,012
$1,372
100%
$2,000
$3,000
1 month
✓
Vermont1
✓
✓
✓
✓
✓
$1,041
$1,041
110%
$2,000
$3,000
1 or 6 months5
✓
Virginia1
✓
✓
✓
✓
$493
$659
49%
$2,000
$3,000
1 or 6 months 5
✓
Washington
✓
✓
✓
✓
$750
$750
75%
$2,000
$3,000
3 or 6 months
✓
West Virginia
✓
✓
✓
✓
✓
$200
$275
20%
$2,000
$3,000
6 months
Wisconsin
✓
✓
✓
✓
$592
$592
59%
$2,000
$3,000
6 months
✓
NO PROGRAM
Alabama
Alaska
Arizona
Colorado
Delaware
Idaho
Indiana
Mississippi
Missouri
Nevada
New Mexico
Ohio
Oklahoma
Oregon
South Carolina
South Dakota
Wyoming
NOTES: 1 CT, LA, VA, and VT vary their medically needy income standard by region. 2 Table includes data for regions B & C. Region A income limit is $633/individual and $805.09/couple. 3 Table includes data for urban regions. Rural income limit is $92/individual and $192/couple. 4 States reported a single income limit across populations. 5 Budget period of 6 months applies to those living in the community.
SOURCE: Kaiser Family Foundation, Medicaid Financial Eligibility Survey for Seniors and People with Disabilities, 2018.
Appendix Table 4: Medicaid Eligibility for Working People with Disabilities, 2018
State
Monthly Income Limit
% FPL
Asset Limit
Monthly Income at Which Premiums Begin
Monthly Premium Amount
Individual
Couple
MEDIAN
$2,530
250%
$10,000
$15,000
N/A
N/A
Alaska
$3,163
313%
$10,000
$15,000
100% FPL
No more than 10% of annual family income
Arizona
$2,530
250%
None
None
50% FPL ($500)
$10 – $35
Arkansas
None
None
None
None
No response
No response
California
$2,530
250%
$2,000
$3,000
0% FPL
$20/individual; $30/couple
Colorado
$4,553
450%
None
None
41% FPL
$25 – $200
Connecticut
$3,083
305%
$10,000
$15,000
200% FPL
10% of income, minus any health insurance premiums between 200-250% FPL; No more than 7.5% of income above 250% FPL
Delaware
$2,782
275%
None
None
100% FPL
$25
DC
$3,036
300%
None
None
No premium
No premium
Florida
$2,024
200%
$5,000
$6,000
No premium
No premium
Georgia
$3,036
300%
$4,000
$6,000
150% FPL
$35
Idaho
$5,080
502%
$10,000
$15,000
133% FPL
$10-259
Illinois
$3,433
339%
$25,000
$25,000
25% FPL ($251)
$19
Indiana
$2,024
200%
$2,000
$3,000
150% FPL
$48
Iowa
$2,530
250%
$12,000
$13,000
> 150% FPL
$34/$47/$56
Kansas
$3,035
300%
$15,000
$15,000
100% FPL
$55 – $205
Kentucky
$2,530
250%
$5,000
$10,000
No premium
No premium
Louisiana
$1,012
100%
$10,000
$10,000
No premium
No premium
Maine
$2,530
250%
$8,000
$12,000
150%
$10 -$20
Maryland
$3,036
300%
$10,000
$15,000
101%
$25/$40/$55
Massachusetts
None
None
None
None
> 150% FPL
Varies based on income
Michigan
$2,023
200%
$4,000
Excludes spouse
No premium
No premium
Minnesota
None
None
$20,000
Excludes spouse
0% FPL
$35 minimum
Mississippi
$2,530
250%
$24,000
$26,000
150% FPL
5% of countable income
Montana
$2,530
250%
$15,000
$30,000
100% FPL or less
$35 and above
Nebraska
$2,530
250%
$4,000
$6,000
200% FPL
Sliding scale based on income
Nevada
$2,529
250%
$15,000
$15,000
0% FPL
Sliding scale based on income
New Hampshire
$2,530
250%
$28,568
$42,849
150% FPL
No more than 7.5% of total income
New Jersey
$2,530
250%
$20,000
$30,000
150% FPL
$25
New Mexico
$1,519
150%
$10,000
$15,000
No premium
No premium
New York
$2,530
250%
$20,000
$30,000
No premium
No premium
North Carolina
$2,024
200%
$2,000
$3,000
150% FPL
No response
North Dakota
$2,277
225%
$13,000
$16,000
225% FPL
5% of gross income
Ohio
$2,530
250%
$11,901
Excludes spouse
150% FPL
Varies by family size and income
Oregon
$2,530
250%
$5,000
Excludes spouse
75% FPL
$50
Pennsylvania
$2,530
250%
$10,000
$10,000
0% FPL
5% of net income2
Rhode Island
$2,529
250%
$10,000
$20,000
150% FPL
No response
South Dakota
$2,530
250%
$8,000
Excludes spouse
No premium
No premium
Texas
$2,530
250%
$5,000
Excludes spouse
150% FPL
$20
Utah
$2,529
250%
$15,000
$15,000
100% FPL
5%-15% of countable net income
Vermont
$2,530
250%
$10,000
$15,000
No premium
No premium
Virginia1
$810
80%
$2,000
$3,000
No premium
No premium
Washington
$2,226
220%
None
None
6.5% FPL ($65)
No more than 7.5% of total income
West Virginia
$2,530
250%
$2,000
$3,000
0% FPL
$15 – $129.50
Wisconsin
$2,529
250%
$15,000
Excludes spouse
150% FPL
Depends on income
Wyoming
$2,250
222%
None
None
0% FPL ($1)
Premium based on 7.5% of gross monthly income
NO PROGRAM
Alabama
Hawaii
Missouri
Oklahoma
South Carolina
Tennessee
NOTES: 1 To enter VA’s buy-in, individuals must have incomes at or below 80% FPL and assets limited to $2,000. However, once enrolled, individuals can have earnings up to $75,00 per year or ($6,250 per month) as long as they are deposited in a qualifying account. 2 In PA, the premium does not have to be paid if it is calculated to be less than $10 per month or if the individual shows good cause not to pay it.
SOURCE: Kaiser Family Foundation, Medicaid Financial Eligibility Survey for Seniors and People with Disabilities, 2018.
Appendix Table 5: Medicaid Special Income Rule for Long-Term Services and Supports Eligibility, 2018
State
Special Income Rule
Special Income Rule Asset Limit
Applies to Institutions
Applies to HCBS
Individual
Couple
TOTAL/MEDIAN
42
43
$2,000
$3,000
Alabama
✓
✓
$2,000
$3,000
Alaska
✓
✓
$2,000
$3,000
Arizona
✓
✓
$2,000
$3,000
Arkansas
✓
✓
$2,000
$3,000
Colorado
✓
✓
$2,000
$3,000
Connecticut
✓
✓
$1,600
$2,400
Delaware1
✓
✓
$2,000
$3,000
DC
✓
✓
$4,000
$6,000
Florida
✓
✓
$2,000
$3,000
Georgia
✓
✓
$2,000
$3,000
Idaho
✓
✓
$2,000
$3,000
Indiana
✓
✓
$2,000
$3,000
Iowa
✓
✓
$2,000
$3,000
Kansas
✓
✓
$2,000
N/A2
Kentucky
✓
✓
$2,000
N/A2
Louisiana
✓
✓
$2,000
$3,000
Maine
✓
✓
$2,000
$3,000
Maryland
✓
✓
$2,000
$3,000
Massachusetts
✓
$2,000
N/A3
Michigan
✓
✓
$2,000
$3,000
Minnesota
✓
✓ Aged only
$3,000
$6,000
Mississippi
✓
✓
$4,000
$6,000
Missouri1
✓
✓
Varies by program
Varies by program
Nevada
✓
✓
$2,000
$3,000
New Hampshire
✓
✓
$2,500
N/A2
New Jersey
✓
✓
$2,000
$3,000
New Mexico
✓
✓
$2,000
N/A2
Ohio
✓
✓
$2,000
$3,000
Oklahoma
✓
✓
$2,000
$3,000
Oregon
✓
✓
$2,000
N/A2
Pennsylvania
✓
✓
$2,000
$3,000
Rhode Island
✓
✓
$4,000
$6,000
South Carolina
✓
✓
$2,000
N/A2
South Dakota
✓
✓
$2,000
$3,000
Tennessee
✓
✓
$2,000
N/A2
Texas
✓
✓
$2,000
$3,000
Utah
✓
✓
$2,000
$3,000
Vermont
✓
✓
$2,000
$3,000
Virginia
✓
✓
$2,000
N/A2
Washington
✓
✓
$2,000
$3,000
West Virginia
✓
✓
$2,000
$3,000
Wisconsin
✓
✓
$2,000
$3,000
Wyoming
✓
✓
$2,000
$3,000
NO PROGRAM
California
Hawaii
Illinois
Montana
Nebraska
New York
North Carolina
North Dakota
NOTES: 1 All but two states (DE & MO) reported setting the eligibility standard at 300% of SSI ($2,250 per month). DE’s limit is 250% of SSI and in MO, the limit varies by program. 2 All institutionalized individuals are single person households once eligibility is established.3 In MA, the asset limit for a couple is the aggregate of the $2,000 limit for the applicant and the community spouse limit of $123,600.
SOURCE: Kaiser Family Foundation, Medicaid Financial Eligibility Survey for Seniors and People with Disabilities, 2018.
Appendix Table 6: Medicaid Long-Term Services and Supports Trusts and Home Equity Limits, 2018
State
Miller Trust (maximum amount, if any)
Supplemental Needs Trust
Is Trust Amount Limited?
Pooled Income Trust
Is Trust Amount Limited?
ABLE Program (maximum lifetime amount)
Home Equity Limit
For Institutional Care
For HCBS
TOTAL/MEDIAN
25
22
48
21
48
19
51
$572,000
Alabama
✓
✓, $400,000
$572,000
Alaska
✓
✓
✓
No limit
✓
No limit
✓, no response
$572,000
Arizona
✓, $7,134 urban; $6,307 rural
✓, $7,134 urban; $6,307 rural
✓
No limit
✓
No limit
✓, $486,000
$572,000
Arkansas
✓
✓
✓
✓
✓, $366,000
$572,000
California
✓
✓
✓, $529,000
No Limit on Principal Residence
Colorado
✓, regional caps
✓, regional caps
✓
✓
✓, $350,000
$572,000
Connecticut
✓
Varies
✓
Varies
✓, $300,000
$858,000
Delaware1
✓
✓
✓
No limit
✓
No limit
✓, 350,000
$572,000
DC
✓
✓
✓, $500,000
$858,000
Florida
✓
✓
✓
✓
✓, $418,000
$572,000
Georgia
✓
✓
✓
No limit
✓
No limit
✓, $468,000
$572,000
Hawaii
✓, $305,000
$858,000
Idaho
✓
✓
✓
✓
✓, no response
$858,000
Illinois
✓, $400,000
$572,000
Indiana
✓
✓
✓
✓
✓, $450.000
$572,000
Iowa
✓
✓, 125% of avg. cost of facility
✓
No limit
✓
✓, $420,000
$572,000
Kansas
✓
✓
✓, $365,000
$572,000
Kentucky
✓, $2,250
✓, $2,250
✓
✓
✓, $468,000
$572,000
Louisiana
✓
✓
✓, $500,000
$572,000
Maine
✓
✓
✓, $400,000
$858,000
Maryland
✓
✓
✓, $350,000
$572,000
Massachusetts
✓
No limit
✓
No limit
✓, $400,000
$858,000
Michigan
✓
✓
✓, $500,000
$572,000
Minnesota
✓
No limit
✓
No limit
✓, $350,000
$572,000
Mississippi
✓, income cannot exceed cost of private pay rate for nursing facility
✓, $3,035
✓
No limit
✓
No limit
✓, $235,000
$572,000
Missouri1
✓, varies
✓, varies
✓
Varies
✓
Varies
✓, $468,000
$572,000
Montana
✓
No limit
✓
No limit
✓, $400,000
$572,000
Nebraska
✓
No limit
✓
No limit
✓, $400,000
$572,000
Nevada
✓
✓
✓
✓, $370,000
$572,000 – 858,000
New Hampshire
✓
✓
✓, $468,000
$572,000
New Jersey
✓
✓
✓
✓
✓, $305,000
$858,000
New Mexico
✓
✓
✓
✓
✓, $468,000
$572,000
New York
✓
✓
✓, $100,000
$858,000
North Carolina
✓
✓
✓, $420,000
$572,000
North Dakota
✓
No limit
✓
No limit
✓, $269,000
$572,000
Ohio
✓
✓
✓
✓
✓, $468,000
$572,000
Oklahoma
✓, $4,365
✓, $4,365
✓
✓
✓, $468,000
$572,000
Oregon
✓
✓
✓
No limit
✓
No limit
✓, $400,000
$572,000
Pennsylvania
✓
No limit
✓
No limit
✓, $511,758
$572,000
Rhode Island
✓
✓
✓, $395,000
$572,000
South Carolina
✓
✓
✓
✓
✓, $462,000
$572,000
South Dakota
✓, $2,250
✓, $2,250
✓
No limit
✓
No limit
✓, $350,000
$572,000
Tennessee
✓
✓
✓
No limit
✓
✓, $350,000
$572,000
Texas
✓
✓
✓
No limit
✓
No limit
✓, $370,000
$572,000
Utah
✓
No limit
✓
No limit
✓, $416,000
$572,000
Vermont
✓
No limit
✓
No limit
✓, $468,000
$572,000
Virginia
✓
✓
✓, $500,000
$572,000
Washington
✓
No limit
✓
No limit
✓, $500,000
$572,000
West Virginia
✓
No limit
✓
No limit
✓, $468,000
$572,000
Wisconsin
✓
✓
✓, $330,000
$750,000
Wyoming
✓
✓
No limit
✓
No limit
✓, $464,000
$572,000
SOURCE: Kaiser Family Foundation, Medicaid Financial Eligibility Survey for Seniors and People with Disabilities, 2018.
Appendix Table 7: Medicaid Long-Term Services and Supports Post-Eligibility Treatment of Income and Spousal Impoverishment Standards, 2018
State
Monthly Personal Needs Allowance
Spousal Impoverishment Standards for Institutional Care
For Institutional Care
For HCBS
Monthly Community Spouse Needs Allowance 4
Community Spouse Asset Limit 5
Applies to HCBS Waiver Participants
Will Apply to HCBS if ACA § 2404 Expires 6
TOTAL/MEDIAN
$50
$2,024
$3,090
$123,600
51
49
Alabama
$30
$2,250
$2,058
$25,000 – 123,600
✓
✓
Alaska
$1,396
$1,656
$3,090
$123,600
✓
✓
Arizona
$113
$2,250
$2,058
$123,600
✓
✓
Arkansas
$40
$2,250
$2,058 – 3,090
$24,720 – 123,600
✓
✓ Some
California
$35
$600
$3,090
$123,600
✓
✓
Colorado
$84
$2,250
$2,058
$123,600
✓
✓
Connecticut
$60
$2,024
$2,058 – 3,090
$24,720 – 123,600
✓
✓
Delaware
$50
$2,030
$2,058 – 3,090
$25,000
✓
✓
DC
$70
$2,250
$3,090
$24,720 – 123,600
✓
✓
Florida
$130
$1,012
$2,058
$123,600
✓
✓
Georgia
$65
$750
$3,090
$123,600
✓
✓
Hawaii
$50
$469 or $1,164
$3,090
$123,600
✓
✓
Idaho
$40
$750 or $1,3501
$2,058 – 3,090
$24,720 – 123,600
✓
✓
Illinois
$60
N/A2
$3,090
$123,600
✓ Some
✓ Some
Indiana
$52
$2,250
$2,058
$24,720 – 123,600
✓
✓
Iowa
$50
$2,250
$3,090
$24,720 – 123,600
✓
✓
Kansas
$62
$727
$2,058 – 3,090
$24,720 – 123,600
✓
✓
Kentucky
$40
$770
$2,058
$24,720
✓
✓
Louisiana
$38
$2,250
$3,090
$123,600
✓
✓
Maine
$40
$2,024
$2,058
$123,600
✓
Maryland
$80
Varies by waiver
$2,058 – 3,090
$24,720 – 123,600
✓
✓
Massachusetts
$73
$2,250
$2,058 – 3,090
$123,600
✓
✓
Michigan
$60
$2,250
$2,058 – 3,090
$24,720 – 123,600
✓
✓
Minnesota
$99
$1,003
$2,058
$123,600
✓
✓ Some
Mississippi
$44
$2,250
$3,090
$123,600
✓
✓
Missouri
$50
N/A
$2,058 – 3,090
$24,720 – 123,600
✓
✓
Montana
$50
$100
$2,058
$24,720 – 123,600
✓
✓
Nebraska
$60
$392
$2,058 – 3,090
$24,720 – 123,600
✓
✓
Nevada
$35
$2,250
$2,058 – 3,090
$24,720 – 123,600
✓
✓
New Hampshire
$70
$70-$2,250 3
$3,090
$24,720 – 123,600
✓
New Jersey
$50
$112 or $2,250
$2,058
$24,720 – 123,600
✓
✓
New Mexico
$72
N/A
$2,058
$31,290
✓
✓
New York
$50
$842
$3,090
$123,600
✓
✓
North Carolina
$30
N/A
$3,090
$24,720 – 123,600
✓
✓
North Dakota
$65
$840
$2,550
$24,720 – 123,600
✓
✓
Ohio
$50
$1,463
$3,090
$24,720 – 123,600
✓
✓
Oklahoma
$50
$1,101
$3,090
$25,000 – 123,600
✓
✓
Oregon
$61
$750 or $1,750
$2,058 – 3,090
$24,720 – 123,600
✓
✓
Pennsylvania
$45
$2,250
$2,058 – 3,090
$24,720 – 123,600
✓
✓
Rhode Island
$50
$1,012
$3,090
$24,720 – 123,600
✓
✓
South Carolina
$30
$2,250
$3,090
$66,480
✓
✓
South Dakota
$60
$750
$2,058
$123,600
✓
✓
Tennessee
$50
$2,250
$2,058 – 3,090
$24,720 – 123,600
✓
✓
Texas
$60
$2,250
$3,090
$24,720 – 123,600
✓
✓
Utah
$45
$1,012
$2,058
$24,720
✓
✓
Vermont
$48
$1,125
$2,058 – 3,090
$123,600
✓
✓
Virginia
$40
$1,238
$2,058
$24,720 – 123,600
✓
✓
Washington
$58
$1,012
$3,090
$123,600
✓
✓
West Virginia
$50
$2,250
$2,058 – 3,090
$24,720 – 123,600
✓
✓
Wisconsin
$45
$930
$2,743 – 3,090
$50,000 – 123,600
✓
✓
Wyoming
$50
$2,250
$3,090
$123,600
✓
✓
NOTES: 1 In ID, amounts vary by marital status and housing situation; single (not responsible for rent/mortgage): $750; single (responsible for rent/mortgage): $1,350; married (not responsible for rent/mortgage): $1,125; married (responsible for rent/mortgage): $1,350. 2 With the exception of IL’s Section 1915 (c) waiver for seniors, IL does not recognize a monthly personal needs allowance for waiver enrollees who remain in their homes.3 NH amount varies by waiver and living situation. 4 CMS uses $2,057.50, while most states reported the minimum as $2,058. 5 States with an asset limit range apply a formula that allows the community spouse to retain an amount of protected assets that is the greater of either the federal minimum ($24,720) or one-half of the couple’s total combined resources but not to exceed the federal maximum ($123,600). 6 States reported plans about whether to continue to apply spousal impoverishment rules to HCBS waivers if ACA § 2404 expired in Dec. 2018; Congress subsequently extended ACA § 2404 through Sept. 2019.
SOURCE: Kaiser Family Foundation, Medicaid Financial Eligibility Survey for Seniors and People with Disabilities, 2018.
Appendix Table 8: Eligibility for Medicaid’s Medicare Savings Programs, 2018
State
Qualified Medicare Beneficiaries (QMB)
Specified Low-Income Savings Programs (SLMB)
Qualified Individuals (QI)
Monthly Income Limit
% FPL
Asset Limit
Monthly Income Limit
% FPL
Asset Limit
Monthly Income Limit
% FPL
Asset Limit
Individual
Couple
Individual
Couple
Individual
Couple
Individual
Couple
Individual
Couple
Individual
Couple
MEDIAN
$1,012
$1,372
100%
$7,560
$11,340
$1,214
$1,646
120%
$7,560
$11,340
$1,366
$1,852
135%
$7,560
$11,340
Alabama
$1,012
$1,392
100%
none
none
$1,214
$1,646
120%
none
none
$1,366
$1,852
135%
none
none
Alaska
$1,265
$1,715
100%
$7,560
$11,340
$1,518
$2,058
120%
$7,560
$11,340
$1,708
$2,316
135%
$7,560
$11,340
Arizona
$1,012
$1,372
100%
none
none
$1,214
$1,646
120%
none
none
$1,366
$1,852
135%
none
none
Arkansas
$1,012
$1,372
100%
$7,560
$11,340
$1,214
$1,646
120%
$7,560
$11,340
$1,366
$1,852
135%
$7,560
$11,340
California
$1,012
$1,372
100%
$7,560
$11,340
$1,214
$1,646
120%
$7,560
$11,340
$1,366
$1,852
135%
$7,560
$11,340
Colorado
$1,012
$1,372
100%
$9,060
$14,340
$1,214
$1,646
120%
$9,060
$14,340
$1,366
$1,852
135%
$9,060
$14,340
Connecticut
$2,136
$2,895
211%
none
none
$2,338
$3,170
231%
none
none
$2,490
$3,376
246%
none
none
Delaware
$1,012
$1,372
100%
none
none
$1,214
$1,646
120%
none
none
$1,366
$1,852
135%
none
none
DC1
$3,035
$4,115
300%
none
none
N/A
N/A
N/A
N/A
N/A
N/A
N/A
N/A
N/A
N/A
Florida
$1,012
$1,372
100%
$7,560
$11,340
$1,214
$1,646
120%
$7,560
$11,340
$1,366
$1,852
135%
$7,560
$11,340
Georgia
$1,012
$1,372
100%
$7,560
$11,340
$1,214
$1,646
120%
$7,560
$11,340
$1,366
$1,852
135%
$7,560
$11,340
Hawaii
$1,164
$1,578
100%
$7,560
$11,340
$1,396
$1,893
120%
$7,560
$11,340
$1,571
$2,130
135%
$7,560
$11,340
Idaho
$1,012
$1,392
100%
$7,560
$11,340
$1,214
$1,646
120%
$7,560
$11,340
$1,366
$1,852
135%
$7,560
$11,340
Illinois
$1,012
$1,372
100%
$7,560
$11,340
$1,214
$1,646
120%
$7,560
$11,340
$1,366
$1,852
135%
$7,560
$11,340
Indiana2
$1,518
$2,058
150%
$7,560
$11,340
$1,720
$2,332
170%
$7,560
$11,340
$1,872
$2,538
185%
$7,560
$11,340
Iowa
$1,012
$1,372
100%
$7,560
$11,340
$1,214
$1,646
120%
$7,560
$11,340
$1,366
$1,852
135%
$7,560
$11,340
Kansas
$1,012
$1,372
100%
$7,560
$11,340
$1,214
$1,646
120%
$7,560
$11,340
$1,366
$1,852
135%
$7,560
$11,340
Kentucky
$1,012
$1,372
100%
$7,560
$11,340
$1,214
$1,646
120%
$7,560
$11,340
$1,366
$1,852
135%
$7,560
$11,340
Louisiana
$1,012
$1,372
100%
$7,560
$11,340
$1,214
$1,646
120%
$7,560
$11,340
$1,366
$1,852
135%
$7,560
$11,340
Maine3
$1,417
$1,921
140%
$58,000
$87,000
$1,619
$2,195
160%
$58,000
$87,000
$1,771
$2,401
175%
$58,000
$87,000
Maryland
$1,012
$1,372
100%
$7,560
$11,340
$1,214
$1,646
120%
$7,560
$11,340
$1,366
$1,852
135%
$7,560
$11,340
Massachusetts
$1,012
$1,372
100%
$7,560
$11,340
$1,214
$1,636
120%
$7,560
$11,340
$1,366
$1,852
135%
$7,560
$11,340
Michigan
$1,012
$1,372
100%
$7,560
$11,340
$1,214
$1,646
120%
$7,560
$11,340
$1,366
$1,852
135%
$7,560
$11,340
Minnesota
$1,012
$1,372
100%
$10,000
$18,000
$1,214
$1,646
120%
$10,000
$18,000
$1,366
$1,852
135%
$10,000
$18,000
Mississippi
$1,012
$1,372
100%
none
none
$1,214
$1,646
120%
none
none
$1,366
$1,852
135%
none
none
Missouri
$1,012
$1,372
100%
$7,560
$11,340
$1,214
$1,646
120%
$7,560
$11,340
$1,366
$1,852
135%
$7,560
$11,340
Montana
$1,012
$1,372
100%
$7,560
$11,340
$1,215
$1,647
120%
$7,560
$11,340
$1,366
$1,852
135%
$7,560
$11,340
Nebraska
$1,012
$1,372
100%
$7,560
$11,340
$1,214
$1,646
120%
$7,560
$11,340
$1,366
$1,852
135%
$7,560
$11,340
Nevada
$1,012
$1,372
100%
$7,560
$11,340
$1,214
$1,646
120%
$7,560
$11,340
$1,366
$1,852
135%
$7,560
$11,340
New Hampshire
$1,012
$1,372
100%
$7,560
$11,340
$1,214
$1,646
120%
$7,560
$11,340
$1,366
$1,852
135%
$7,560
$11,340
New Jersey
$1,012
$1,372
100%
$7,560
$11,340
$1,214
$1,646
120%
$7,560
$11,340
$1,366
$1,852
135%
$7,560
$11,340
New Mexico
$1,012
$1,372
100%
9,060
$14,340
$1,214
$1,646
120%
9,060
$14,340
$1,366
$1,852
135%
$9,060
$14,340
New York
$1,012
$1,372
100%
none
none
$1,214
$1,646
120%
none
none
$1,366
$1,852
135%
none
none
North Carolina
$1,012
$1,372
100%
$7,560
$11,340
$1,214
$1,646
120%
$7,560
$11,340
$1,366
$1,852
135%
$7,560
$11,340
North Dakota
$1,012
$1,372
100%
$7,560
$11,340
$1,214
$1,646
120%
$7,560
$11,340
$1,366
$1,852
135%
$7,560
$11,340
Ohio
$1,012
$1,372
100%
$7,560
$11,340
$1,214
$1,646
120%
$7,560
$11,340
$1,366
$1,852
135%
$7,560
$11,340
Oklahoma
$1,012
$1,372
100%
$7,560
$11,340
$1,214
$1,646
120%
$7,560
$11,340
$1,366
$1,852
135%
$7,560
$11,340
Oregon
$1,012
$1,372
100%
none
none
$1,214
$1,646
120%
none
none
$1,366
$1,852
135%
none
none
Pennsylvania
$1,012
$1,372
100%
$7,560
$11,340
$1,214
$1,646
120%
$7,560
$11,340
$1,366
$1,852
135%
$7,560
$11,340
Rhode Island
$1,012
$1,372
100%
$7,560
$11,340
$1,214
$1,646
120%
$7,560
$11,340
$1,366
$1,852
135%
$7,560
$11,340
South Carolina
$1,012
$1,372
100%
$7,560
$11,340
$1,214
$1,646
120%
$7,560
$11,340
$1,366
$1,852
135%
$7,560
$11,340
South Dakota
$1,012
$1,372
100%
$7,560
$11,340
$1,214
$1,646
120%
$7,560
$11,340
$1,366
$1,852
135%
$7,560
$11,340
Tennessee
$1,012
$1,372
100%
$7,560
$11,340
$1,214
$1,646
120%
$7,560
$11,340
$1,366
$1,852
135%
$7,560
$11,340
Texas
$1,012
$1,372
100%
$7,560
$11,340
$1,214
$1,646
120%
$7,560
$11,340
$1,366
$1,852
135%
$7,560
$11,340
Utah
$1,012
$1,372
100%
$7,560
$11,340
$1,214
$1,646
120%
$7,560
$11,340
$1,366
$1,852
135%
$7,560
$11,340
Vermont
$1,012
$1,372
100%
none
none
$1,214
$1,646
120%
none
none
$1,366
$1,852
135%
none
none
Virginia
$1,012
$1,372
100%
$7,560
$11,340
$1,214
$1,646
120%
$7,560
$11,340
$1,366
$1,852
135%
$7,560
$11,340
Washington
$1,012
$1,372
100%
$7,560
$11,340
$1,214
$1,646
120%
$7,560
$11,340
$1,366
$1,852
135%
$7,560
$11,340
West Virginia
$1,012
$1,372
100%
$7,560
$11,340
$1,214
$1,646
120%
$7,560
$11,340
$1,366
$1,852
135%
$7,560
$11,340
Wisconsin
$1,012
$1,372
100%
$7,560
$11,340
$1,214
$1,646
120%
$7,560
$11,340
$1,366
$1,852
135%
$7,560
$11,340
Wyoming
$1,012
$1,372
100%
$7,560
$11,340
$1,214
$1,646
120%
$7,560
$11,340
$1,366
$1,852
135%
$7,560
$11,340
NOTES: Most state have a standard $20 general income disregard; exceptions include: Maine ($75), Mississippi ($50), and Illinois ($25). 1DC’s disregard effectively increases the QMB income limit to 300% FPL; as a result, the SLMB and QI categories are moot. 2IN disregards the amount of income from 100-150% FPL for QMBs, 120-170% for SLMBs, and 135-185% FPL for QIs.3ME’s MSP income thresholds are at the federal limits, but the state’s disregards are updated annually to effectively increase the income limit to 140% FPL for QMBs, 160% FPL for SLMBs, and 175% FPL for QIs; asset limits are for liquid assets only.
SOURCE: Kaiser Family Foundation, Medicaid Financial Eligibility Survey for Seniors and People with Disabilities, 2018.
Appendix Table 9: State Adoption of Selected ACA Streamlined Medicaid Eligibility Renewal Provisions, 2018
State
Sends Pre-populated Forms for Age and Disability-Related Pathway Eligibility Renewals
Offers Reconsideration Period for Age and Disability Eligibility Pathway Renewals
TOTAL
30
43
Alabama
✓
✓
Alaska
Arizona
✓
✓
Arkansas
✓ (for MSP categories)
California
In development
✓
Colorado
✓
Connecticut
✓
No response
Delaware
✓
✓
DC
✓, 30 days
Florida
✓
Georgia
✓
✓
Hawaii
✓
✓
Idaho
✓
✓
Illinois
✓
✓
Indiana
✓
✓, 90 days
Iowa
✓, 90 days
Kansas
✓
✓
Kentucky
✓
✓
Louisiana
✓
Maine
✓
✓
Maryland
✓
✓, 120 days
Massachusetts
✓
Michigan
✓
Minnesota
✓
Mississippi
✓
✓
Missouri
In development
✓
Montana
✓
✓
Nebraska
✓
✓
Nevada
✓
✓, 90 days
New Hampshire
New Jersey
✓, 90 days
New Mexico
✓
✓, only for waivers
New York
✓
North Carolina
✓
North Dakota
In development
✓
Ohio
✓
✓, 90 days
Oklahoma
✓
Oregon
Pennsylvania
✓
✓
Rhode Island
No response
No response
South Carolina
In development
✓, 90 days
South Dakota
✓
✓
Tennessee
In development
✓
Texas
✓
✓
Utah
✓
✓, 90 days
Vermont
✓, 90 days
Virginia
✓
✓
Washington
✓
West Virginia
✓
✓
Wisconsin
✓
✓
Wyoming
✓
✓, 90 days
SOURCE: Kaiser Family Foundation, Medicaid Financial Eligibility Survey for Seniors and People with Disabilities, 2018.
Medicaid eligibility pathways based on old age or disability include two general components: financial eligibility rules that limit income and sometimes assets and functional eligibility rules that determine the degree of a person’s need for services and supports. State variation in functional eligibility criteria associated with these pathways is beyond the scope of this brief. ↩︎
Arkansas and Rhode Island did not respond to the survey. Data for these two states were obtained from state Medicaid agency websites and Medicaid.gov. ↩︎
42 U.S.C. § 1396a (a)(10)(A)(i)(II); but see 42 U.S.C. § 1396a (f). ↩︎
The couple rate applies when both individuals qualify for SSI. ↩︎
$771 for an individual and $1,157 for a couple in 2019. ↩︎
Section 209 (b) states must allow SSI beneficiaries to establish Medicaid eligibility through a spend-down by deducting unreimbursed out-of-pocket medical expenses from their countable income (described later in this brief). Section 209 (b) states also must provide Medicaid to children who receive SSI and who meet the financial eligibility rules for the state’s Aid to Families with Dependent Children program as of July 16, 1996. 42 U.S.C. § 1396a (f); see also 42 U.S.C. § 1396a (a)(10)(C)(i)(III) and (ii); 42 C.F.R. § 435.121 (d). ↩︎
The federal SSI rules also include additional disregards for earned income. See Box 1 in the text. ↩︎
100% FPL for an individual in 2019 is $1,041/month in the continental U.S. 100% FPL for an individual in Hawaii is $1,163 in 2018, and $1,198 in 2019. ↩︎
$500/month for an individual in 2019. States reported a single medically needy income limit across covered populations. ↩︎
Additionally, four states (CT, LA, VA, and VT) vary medically needy income limits by region to account for variation in cost of living in different geographic areas. ↩︎
States’ medically needy income limits are so low because they are tied to the Aid to Families with Dependent Children (AFDC) payment levels that were in place in 1996. Federal rules require medically needy income levels to be no higher than 133 1/3% of the state’s maximum AFDC payment level for a family of two without any income or assets as of July 16, 1996. States can raise their medically needy income limits if they increase their TANF income standards, but few states have done so (TANF replaced AFDC in 1996). 42 U.S.C. § § 1396b (f)(1)(B)(i); 1396u-1 (b), (f)(3). ↩︎
Another four states report using one or six months, with two of those states (VA and VT) specifying that a six month period is used for individuals living in the community. ↩︎
This pathway covers children up to age 21 and also includes children who do not currently meet, but are at risk of meeting, an institutional level of care. TennCare II Special Terms and Conditions, supra. n.28 at paragraph 22 (f), p. 36 and Table 2c. ↩︎
42 U.S.C. § § 1396a (a)(10)(A)(ii)(XIX); 1396a (cc)(1). 300% FPL is $5,333/month for a family of three in 2019. ↩︎
Under Massachusetts’ waiver, state plan “base populations” include all infants under age one (based solely on income) through 200% FPL and children with disabilities under age 19 through 150% FPL. Waiver expansion populations include “higher income children with disabilities” with no income limit. CMS Special Terms and Conditions, MassHealth Medicaid Section 1115 Demonstration, #11-W-00030/1,Table A, p. 10, 16, 21 (approved July 1, 2017-June 30, 2022, amended June 27, 2018), https://www.medicaid.gov/Medicaid-CHIP-Program-Information/By-Topics/Waivers/1115/downloads/ma/ma-masshealth-ca.pdf. ↩︎
$267/month for a family of three at 300% FPL in 2019. ↩︎
Indiana offers Section 1915 (i) services targeted to multiple populations with mental illness (differentiated by age) and uses Section 1915 (i) as an independent pathway to Medicaid eligibility for one of these populations. Findings in this section have been supplemented by data reported from KFF’s annual Medicaid HCBS survey. See Kaiser Family Foundation, Key State Policy Choices About Medicaid Home and Community-Based Services (April 2019), https://modern.kff.org/medicaid/issue-brief/key-state-policy-choices-about-medicaid-home-and-community-based-services/. ↩︎
See Miller v. Ibarra, 746 F. Supp. 19 (D. Colo. 1990). ↩︎
This option is not available in medically needy states unless they do not offer nursing facility services to medically needy populations. 42 U.S.C. § 1396p (d)(4)(B). ↩︎
CO reports unspecified regional caps. MS caps trust income for those in institutions at the nursing facility private pay rate and at $3,035 for those receiving HCBS. MO reports that caps vary. ↩︎
Two other states (CT and MO) have cap policies that vary by program. ↩︎
One state (Hawaii) reported that its ABLE program was enacted but not yet active. For more information about ABLE Accounts, see generally CMS, State Medicaid Director Letter #17-002, Implications of the ABLE Act for State Medicaid Programs (Sept. 7, 2017), https://www.medicaid.gov/federal-policy-guidance/downloads/smd17002.pdf. Two states (AK and ID) did not respond to this question. ↩︎
Income earned in ABLE accounts generally is not subject to federal income tax, similar to Section 529 college savings accounts. 26 U.S.C. § 529A. A person with a disability may open an account in the ABLE program in their state of residence or in another state, if permitted by that state’s program; the majority of state ABLE programs allow out-of-state enrollment. ABLE National Resource Center, Step #5 –How Do I Enroll? (last accessed May 8, 2019), http://ablenrc.org/step-5-how-do-i-enroll. ↩︎
42 C.F.R. § 435.726. States use different methodologies to determine the monthly maintenance needs allowances for HCBS beneficiaries. For example, Maryland allows individuals to deduct housing costs from income. Most states allow individuals to deduct their uncovered medical bills from income. ↩︎
Such individuals are eligible for Medicaid by reason of a Section 1915 (c) HCBS waiver because they would be eligible under the Medicaid state plan if institutionalized, meet an institutional level of care, and would be institutionalized if not receiving waiver services. 42 U.S.C. § 1396a (a)(10)(A)(ii)(VI). They sometimes are referred to as the “217-group,” because they are described in 42 C.F.R. § 435.217. ↩︎
Same amount through June 2019. While the community spouse maximum income maintenance allowance and minimum and maximum asset allowances are adjusted each January, the community spouse minimum monthly maintenance needs allowance is adjusted as of July 1st. CMCS Informational Bulletin, Updated 2019 Spousal Impoverishment Standards (May 30, 2019), https://www.medicaid.gov/federal-policy-guidance/downloads/cib053019.pdf . Most states reported this amount as $2,058, but CMS lists the federal minimum as $2,057.50. Starting July 2019, $2,113.75 per month for all states except Alaska and Hawaii. $2,641.25 per month in Alaska and $2,432.50 per month in Hawaii. ↩︎
Specifically, states could opt to apply the rules to individuals who are eligible for Medicaid by reason of a Section 1915 (c) HCBS waiver, under 42 U.S.C. § 1396a (a)(10)(A)(ii)(VI) (describing individuals who would be eligible under the Medicaid state plan if institutionalized, meet an institutional level of care, and would be institutionalized if not receiving waiver services, sometimes referred to as the “217-group,” because they also are described in 42 C.F.R. § 435.217). 42 U.S.C. § 1396r-5 (h)(1)(A). ↩︎
Section 2404 also expanded the spousal impoverishment rules to the Section 1915 (i) HCBS state plan option, Community First Choice (CFC) attendant care services and supports, and individuals eligible through a medically needy spend down. ↩︎
AR will apply the rules to its waivers for seniors/adults with physical disabilities and assisted living but not to its waivers for autism and intellectual/developmental disabilities. Waiver approval documents on Medicaid.gov indicate that AR’s excluded waivers do cover the 217-group. ↩︎
Waiver approval documents on Medicaid.gov indicate that ME’s seven waivers do cover the 217-group. ↩︎
Dual eligible beneficiaries qualify for both Medicare and Medicaid. All dual eligible beneficiaries qualify for Medicaid assistance with their Medicare out-of-pocket costs through one of the Medicare Savings Programs (MSP) described in this section. Additionally, Medicare beneficiaries who independently qualify for Medicaid through another poverty or disability-related pathway also receive full Medicaid benefits. These “full duals” may receive Medicaid services that Medicare does not cover, such as LTSS, eyeglasses, dental care, or hearing aids. Medicare beneficiaries who qualify only for an MSP are known as “partial duals” and receive Medicaid assistance only with Medicare premiums and/or cost-sharing. See generally Kaiser Family Foundation, Medicaid’s Role for Medicare Beneficiaries (Feb. 2017), https://modern.kff.org/medicaid/issue-brief/medicaids-role-for-medicare-beneficiaries/. ↩︎
Medicare Part D, which covers prescription drugs, has financial assistance for low-income beneficiaries (the Low-Income Subsidy program) built into the program instead of being available through Medicaid. See generally, Kaiser Family Foundation, An Overview of the Medicare Part D Prescription Drug Benefit (Oct. 2018), https://modern.kff.org/medicare/fact-sheet/an-overview-of-the-medicare-part-d-prescription-drug-benefit/. ↩︎
$1,249/month for an individual and $1,691/month for a couple in 2019. ↩︎
42 U.S.C. § 1396a (a)(10)(E)(iv). $1,405/month for an individual and $1,902/month for a couple in 2019. ↩︎
DC’s effective QMB income limit is 300% FPL ($3,035 per month for an individual in 2018, $3,123/month in 2019) after applying income disregards, which means that all MSP beneficiaries in DC receive QMB premium and cost-sharing assistance, and none are covered in the less generous SLMB or QI programs. ↩︎
Note: An English-language version of this document is available here.
Este resumen ofrece una descripción general del estado de los sistemas de atención médica y los programas de Medicaid en Puerto Rico y las Islas Vírgenes de los EE.UU. (USVI) aproximadamente un año y medio después que los huracanes Irma y María azotaran las islas, en septiembre de 2017. Los huracanes exacerbaron los desafíos económicos y de atención médica ya existentes en los territorios, acelerando la migración de sus residentes y proveedores de salud, destruyendo hogares, escuelas, instalaciones médicas y otras infraestructuras. Después de las tormentas, los programas de Medicaid de los territorios han servido como recursos importantes para atender las necesidades de atención médica de los residentes, pero han operado bajo desafíos financieros de larga data. Este resumen se enfoca en esos desafíos e incluye el análisis de KFF de las consecuencias para las finanzas de los programas de Medicaid de los territorios, ya que la mayoría de los fondos federales de Medicaid provistos a través de la Ley de Cuidado de Salud a Bajo Precio (ACA), y la asistencia para desastres, expirarán a fines de septiembre de 2019. Los otros territorios de los EE.UU. (Samoa Americana, el Commonwealth de las Islas Marianas del Norte y Guam) también enfrentan retos relacionados con el vencimiento programado de los fondos de ACA. Este resumen se basa en trabajos anteriores y en informes públicos recientes, y en entrevistas con funcionarios de los territorios en los lugares afectados, con proveedores, con responsables de planes de salud de Puerto Rico y beneficiarios.
Destacados clave: consecuencias del abismo de financiamiento de Medicaid para Puerto Rico y USVI
Los fondos temporales de Medicaid de ACA y la Ley de Presupuesto Bipartidista de 2018 (BBA) han brindado apoyo crítico a Puerto Rico y USVI para la atención médica, pero la gran mayoría de estos fondos expiran a fines de septiembre de 2019.
A pesar de un aumento en los fondos federales temporales de Medicaid, los sistemas de atención médica de Puerto Rico y USVI son frágiles y están en transición, a la vez que los residentes enfrentan importantes desafíos de salud mental y otras necesidades de salud.
La expiración de los fondos federales temporales de Medicaid, sin una legislación para proporcionar fondos adicionales, resultaría en un déficit significativo de fondos y tendría consecuencias graves para los presupuestos del territorio, la cobertura y los sistemas de atención médica en general.
Las opciones para que el Congreso aborde los problemas de financiamiento de Medicaid en Puerto Rico y USVI incluyen aumentar o eliminar el límite de financiamiento y mantener o aumentar la tasa de equiparación federal (porcentaje de asistencia médica federal o FMAP).
Resultados clave
Los fondos federales temporales de Medicaid de ACA y la BBA han brindado apoyo crítico a Puerto Rico y USVI para atención de salud, pero la gran mayoría de estos fondos vencen a fines de septiembre de 2019. A diferencia de los estados, Puerto Rico y USVI reciben fondos federales para Medicaid limitados, y un FMAP fijo (55%) que es sustancialmente más bajo que la tasa del 83% basada en el ingreso per cápita que recibirían si fueran estados. Desde 2011, los fondos de ACA han abarcado una parte significativa de los fondos generales de Medicaid de los dos territorios, y la BBA posterior al huracán brindó apoyo adicional para Medicaid y eliminó temporalmente las cuotas locales de Puerto Rico y USVI sobre los gastos de Medicaid. Los prolongados desafíos económicos y de salud anteriores a los huracanes empeoraron después de las tormentas. Los territorios han usado los fondos de ACA y de la BBA para aliviar la presión sobre los presupuestos locales de Medicaid, para expandir y apoyar la cobertura, y para abordar las deficiencias del sistema de salud, mejorando las tasas de reembolso de los proveedores, ampliando la capacidad clínica, y realizando mejoras de infraestructura.
A pesar de un aumento en los fondos federales temporales de Medicaid, los sistemas de atención de salud de Puerto Rico y USVI son frágiles y están en transición, a la vez que los residentes luchan con importantes desafíos de salud mental y otras necesidades de salud. Algunas infraestructuras de atención médica, en particular los hospitales de USVI y las clínicas del Departamento de Salud, y las instalaciones en las islas costeras de Puerto Rico, aún no se han recuperado completamente de los huracanes. Además de las instalaciones de atención de salud física, las tormentas exacerbaron los problemas de larga data con el reclutamiento y la retención de proveedores. Ambos territorios luchan por atender las necesidades de salud mental de los residentes, que empeoraron y permanecen elevadas después de los huracanes. Mientras continúan trabajando en la recuperación luego de los huracanes, los territorios también están avanzando con las reformas del sistema de prestación. Puerto Rico está comprometido con importantes reformas del sistema de atención administrada y prestación de servicios, que han generado desafíos para las organizaciones de atención administrada (MCOs), proveedores y beneficiarios, durante su período de implementación. Las iniciativas para centrarse en las poblaciones de “alta necesidad y alto costo” generalmente requieren inversiones iniciales y una mayor estandarización por parte de los planes y proveedores para generar resultados a largo plazo. En USVI, los líderes del territorio están comprometidos con esfuerzos continuos para mejorar la atención, particularmente los servicios de salud del comportamiento y la coordinación de la atención.
La expiración de los fondos federales temporales de Medicaid, sin una legislación para proporcionar fondos adicionales, resultaría en un déficit significativo de fondos y tendría consecuencias graves para los presupuestos del territorio, la cobertura y los sistemas de atención médica en general. Los gobiernos locales en Puerto Rico y USVI no podrían compensar la pérdida de fondos federales y, por ende, no podrían mantener los niveles de servicio actuales. Algunos funcionarios y proveedores del territorio describieron los efectos potenciales de la expiración del financiamiento como “devastadores”, “catastróficos” y “aterradores”. Suponiendo que se volviera al financiamiento federal con un límite, y un FMAP del 55% después que expiren los fondos de ACA restantes, Puerto Rico podría experimentar un déficit de $1,000 millones en el año fiscal 2020 y de $1,5 mil millones en el año fiscal 2021 (que representan el 36% y el 52% del gasto total proyectado, respectivamente). Las estimaciones preparadas por la Comisión de Pago y Acceso de Medicaid y CHIP (MACPAC) muestran que este déficit de fondos podría desencadenar pérdidas de cobertura de un tercio a la mitad de los niveles actuales de inscripción en Puerto Rico, que es de aproximadamente 1.2 millones de personas. El déficit federal podría alcanzar los $31.3 millones en USVI, o el 40% del gasto del programa. Los funcionarios de Medicaid de USVI afirman que tales carencias podrían poner a los 18,000 afiliados sumados con la expansión de ACA en riesgo de perder la cobertura (de un total de casi 28,000 afiliados)1 . En ambos territorios, la falta de fondos adicionales agravaría los desafíos en el reclutamiento y la retención de proveedores, y la incertidumbre sobre la disponibilidad y la cantidad de apoyo federal ya ha obstaculizado la capacidad de los territorios para avanzar en las reformas en la atención médica.
El Congreso podría considerar opciones para abordar el déficit de financiamiento según las proyecciones actuales, y para proporcionar fondos adicionales al elevar el FMAP o el límite (o ambos). Las estimaciones del déficit de financiamiento reflejan las proyecciones actuales para el gasto del programa y del territorio con un FMAP del 55%. El análisis de KFF muestra que, para Puerto Rico, el financiamiento federal adicional de $2.8 mil millones en el año fiscal 2021 podría ayudar a resolver el déficit proyectado ($1.5 mil millones), aumentar el FMAP a 83% y aumentar las tasas por miembro por mes (PMPM) en un 50% ($1.3 mil millones adicionales para los aumentos de FMAP y PMPM). Para USVI, el análisis de KFF muestra que abordar el déficit y elevar el FMAP al 83% podría proporcionar $45.9 millones en fondos federales, mientras que los fondos adicionales podrían respaldar un aumento en el límite legal. Elevar el FMAP podría reducir la participación requerida por los territorios para acceder a los fondos federales, mientras que aumentar el límite más allá de los niveles establecidos para el programa podría ayudar a abordar las brechas en los beneficios y aumentar las tasas de reembolso de los proveedores. Las opciones que abordarían la financiación por un período más largo (o una solución permanente) podrían proporcionar una estabilidad a más largo plazo para los sistemas de atención de salud de los territorios, y evitar soluciones de corto plazo, año a año, que resulten en abismos de financiación e incertidumbre.
Para el Congreso, los próximos pasos pueden incluir considerar apoyo fiscal a corto plazo para los programas de Medicaid en los territorios mientras se continúan explorando cambios de financiamiento a largo plazo, más permanentes. El 1 de mayo de 2019, el gobernador de Puerto Rico, Ricardo Rosselló, envió una carta al Congreso solicitando $15.1 mil millones en fondos federales para Medicaid con un FMAP de 83% para los próximos cinco años. La solicitud establece que los fondos brindarán estabilidad a Puerto Rico para avanzar con las reformas del sistema de prestación y las medidas destinadas a frenar la migración de proveedores, y mejorar el acceso a los servicios, mientras los legisladores trabajan en reformas de financiamiento a más largo plazo. La incertidumbre sobre el financiamiento contribuye a la inestabilidad en los sistemas de atención de salud de los territorios, al requerir recursos administrativos para establecer planes de contingencia, crear confusión para los proveedores y afiliados, y limitar la capacidad de los territorios para avanzar con reformas complejas del sistema de prestación. Los gobernadores de los territorios solicitaron un apoyo federal de Medicaid más adecuado y permanente, y los delegados elegidos para el Congreso, que no tienen derecho a voto, presentaron una legislación que permitiría que los territorios recibieran un tratamiento similar para Medicaid que el de los estados: sin un límite legal de financiamiento y con un cálculo de FMAP basado en el ingreso per cápita.
Informe
Introducción
Este resumen ofrece una descripción general del estado de los sistemas de atención médica y los programas de Medicaid en Puerto Rico y USVI, aproximadamente un año y medio después de las tormentas. El resumen se enfoca en estos desafíos e incluye el análisis de KFF de las implicaciones para las finanzas del programa de Medicaid de los territorios, ya que la mayoría de los fondos federales de Medicaid provistos a través de la Ley de Cuidado de Salud a Bajo Precio (ACA) y la asistencia para desastres expirarán a fines de septiembre de 2019. El resumen se basa en trabajos anteriores, informes públicos recientes y entrevistas con funcionarios del territorio en los lugares afectados, proveedores, planes de salud de Puerto Rico y beneficiarios.2
Antecedentes
Históricamente, Puerto Rico y USVI han experimentado una amplia gama de disparidades de salud, cobertura e infraestructura de atención médica en comparación con los estados. En Puerto Rico, la población de 3.3 millones3 tiene tasas más altas de salud regular/deficiente, ataque cardíaco/enfermedad cardíaca, diabetes y mortalidad infantil que los Estados Unidos en general. La población de USVI de 107,0004 tiene tasas más altas de diabetes y mortalidad infantil en comparación con los Estados Unidos en general. Además, el 47% de la población total de Puerto Rico está inscrita en Medicaid, 13 puntos porcentuales más que la tasa del estado más alto (Nuevo México, con un 34%). En USVI, más de la mitad de la población no tiene seguro de salud (30%) o está inscrita en Medicaid (22%), en comparación con las tasas de personas sin seguro de Puerto Rico (7%) y el resto de los Estados Unidos (12%). Además, Puerto Rico y USVI tienen el desafío de una infraestructura de atención médica que aún se está recuperando después de los huracanes, así como la continua emigración de los proveedores, situación que ha empeorado después de las tormentas.
Antes de los huracanes de 2017, Puerto Rico y USVI ya enfrentaban desafíos económicos de larga data, incluidas altas tasas de deuda, pobreza y desempleo. En respuesta a la crisis de la deuda en Puerto Rico, en junio de 2016, el Congreso aprobó la Ley de Supervisión, Gestión y Estabilidad Económica de Puerto Rico (PROMESA) para permitir que Puerto Rico reestructure sus deudas y administre sus ingresos y gastos. PROMESA creó la Junta de Supervisión y Administración Financiera (FOMB), que en parte requiere que el gobierno de Puerto Rico presente un plan fiscal que obtenga la aprobación de la FOMB. USVI también ha enfrentado desafíos financieros, ya que su economía disminuyó en más del 30% entre 2008 y 2016, junto con la pérdida de población y de empleos en ciertas industrias5 . Los huracanes de septiembre de 2017 exacerbaron estos desafíos al acelerar la emigración de los residentes y los proveedores de atención médica y al destruir hogares, escuelas, negocios y otras infraestructuras.
A diferencia de los estados, Puerto Rico y USVI reciben fondos federales de Medicaid con un límite máximo y una tasa fija federal para Medicaid, que es inferior a la tasa que recibirían si fueran estados. Los 50 estados y DC reciben fondos federales de Medicaid de forma abierta, con una tasa federal equivalente (porcentaje de asistencia médica federal o FMAP) que varía según el ingreso per cápita del estado. En contraste, el financiamiento federal anual de Medicaid para los territorios está sujeto a un límite legal con un FMAP fijo del 55%. Si Puerto Rico y USVI fueran tratados como estados, sus FMAP serían la tasa máxima permitida de 83%6 . Los límites de financiamiento dejan a los territorios con una cantidad significativamente menor de fondos de la que necesitan para operar sus programas de Medicaid. Por ejemplo, si no fuera por los fondos temporales, los fondos federales con límite máximo de Puerto Rico en el año fiscal 2018 habrían cubierto aproximadamente el 13% del costo del programa7 . Puerto Rico y USVI también basan la elegibilidad de Medicaid en los niveles locales de pobreza en lugar del nivel federal de pobreza, lo que lleva a un umbral de elegibilidad más bajo que el que existe en los estados. En Puerto Rico, la transición reciente a los métodos de determinación de elegibilidad de Medicaid ajustados por ingresos brutos modificados (MAGI) exigidos por ACA ha afectado la elegibilidad de algunas personas, lo que derivó en la pérdida de cobertura.
El gobierno federal puso a disposición fondos adicionales de Medicaid para todos los territorios en virtud de la Ley de Cuidado de Salud a Bajo Precio (ACA) y para Puerto Rico y USVI después de los huracanes bajo la Ley de Presupuesto Bipartidista de 2018 (BBA), pero la mayoría de estos fondos expirarán a fines de septiembre de 2019. La asignación de ACA consiste en $6.3 mil millones disponibles entre julio de 2011 y septiembre de 2019 y otros $1,000 millones —proporcionados a los territorios en lugar de tener sus propios mercados de seguros de salud— que vencen a fines de diciembre de 2019. De estos $7.3 mil millones combinados, Puerto Rico recibió la gran mayoría ($6,3 mil millones) y USVI recibió aproximadamente $300 millones. Los fondos de ayuda para huracanes de la BBA incluyeron $4,800 millones para Puerto Rico y $142,5 millones para USVI. Estos fondos no requieren un equiparamiento local, y también expirarán a fines de septiembre de 2019. El vencimiento de los fondos de ACA y BBA hará que los territorios vuelvan a sus niveles de financiamiento pre-ACA con el 55% de FMAP hasta el límite legal; más allá de ese punto, los territorios son completamente responsables de los costos del programa.
Resultados clave
¿Cuál es el papel de los fondos federales de Medicaid en los sistemas de atención médica de los territorios?
Tanto para Puerto Rico como para USVI, los fondos de ACA y de la BBA han sido fundamentales para apoyar los servicios de atención médica y aliviar la presión sobre el financiamiento local de Medicaid. Históricamente, antes de recibir los fondos federales, ambos territorios habían gastado recursos más allá del límite acordado para respaldar sus programas, poniendo presión sobre las economías locales. Una vez que los fondos de ACA estuvieron disponibles, los territorios se apoyaron en estos fondos como una parte importante de la ayuda federal para sus programas de Medicaid (Gráfico 1; Gráfico 2). Después del azote de los huracanes, en septiembre de 2017, los territorios enfrentaron un aumento en las necesidades de atención médica de los residentes, la pérdida de ingresos por un turismo y actividad económica reducidos y la infraestructura de atención médica dañada. Los fondos de la BBA y el FMAP temporal del 100% brindaron un apoyo crucial para los programas de Medicaid y los sistemas de atención médica de los territorios, ya que los recursos locales limitados dificultaron la financiación dela participación del estado para acceder a los dólares federales de Medicaid.
Gráfico 1: Gasto de Puerto Rico en Medicaid, años fiscales de 2011 a 2019 (en mil millones)Gráfico 2: Gasto de USVI en Medicaid, años fiscales de 2014 a 2019 (en millones)
Los territorios han utilizado fondos federales de Medicaid de ACA y de la BBA para expandir y respaldar la cobertura. Tanto Puerto Rico como USVI ampliaron la elegibilidad para Medicaid bajo ACA, y la inscripción aumentó aún más inmediatamente después de los huracanes8 . En USVI, la elegibilidad y el Medicaid ampliado han aumentado a más del doble la inscripción desde 2013, hasta casi 28,000 personas desde marzo de 20199 . Se estima que 20,000 personas siguen siendo elegibles, pero no están inscritas en la cobertura10 . USVI ha estado realizando actividades de divulgación con estas personas y tratando de ampliar el uso de la presunta elegibilidad para aumentar la inscripción. Si bien la presunta elegibilidad es efectiva a corto plazo, funcionarios y proveedores de Medicaid del territorio enfatizaron la necesidad de garantizar que las personas completen el proceso de determinación completo para permanecer en el programa y no perder la cobertura. Las tasas de personas sin seguro y las cargas de atención no compensadas siguen siendo mucho más altas en USVI en comparación con Puerto Rico, en donde Medicaid cubre a una mayor proporción de la población.
Funcionarios del territorio también han recurrido a fondos adicionales para apoyar las tasas de reembolso mejoradas para los proveedores, la capacidad de las clínicas y las mejoras de infraestructura. Las clínicas en Puerto Rico dependen en gran medida de los ingresos de Medicaid, al igual que los hospitales de la red de seguridad en USVI debido a la alta proporción de residentes sin seguro en el territorio y los altos niveles correspondientes de atención no compensada. Medicaid representa el 51% de los ingresos de los centros de salud comunitarios en Puerto Rico (comparado con el 45% en los Estados Unidos continental en general), mientras que las subvenciones federales de la Sección 330 representan el 31% (comparado con el 18%). Con los fondos federales adicionales, los funcionarios de Puerto Rico han ajustado temporalmente las tasas límite para alinearse más estrechamente con las tasas de Medicare, y USVI también aumentó las tasas de reembolso de los proveedores y se mejoraron las actividades de reclutamiento, especialmente para enfermeras. Los niveles más altos de reembolso ayudan a respaldar los salarios, servicios clínicos adicionales y expansiones de infraestructura. Como resultado, estos aumentos también apoyan a la economía en general.
¿Cuál es el estatus de los sistemas de atención de salud de los territorios y las reformas del sistema de prestación de servicios?
Incluso con fondos federales adicionales de Medicaid, la infraestructura de atención médica del territorio aún no se ha recuperado completamente de los huracanes, particularmente en USVI. En Puerto Rico, los problemas de recuperación de infraestructura son en gran medida geográficos, con la región central de la isla, y las islas costeras de Vieques y Culebra, enfrentando los mayores desafíos por la disponibilidad de proveedores y las instalaciones adecuadas para diálisis y otros servicios. En USVI, los hospitales no han regresado a la capacidad anterior a la tormenta y apenas están comenzando a reconstruirse. Vea el Recuadro 1 para más detalles sobre los hospitales en USVI.
Recuadro 1: Actualización de infraestructura hospitalaria en USVI
El hospital principal en St. Thomas, Schneider Regional Medical Center, está operando para la mayoría de los servicios, excepto para radiación oncología, ya que su centro de cáncer permanece cerrado por los daños que sufrió. Sin embargo, el censo promedio de pacientes de Schneider ha disminuido en un 30% (de 65,000 a 45,000), y los ingresos han disminuido en un 45% después de las tormentas. El hospital todavía necesita transferir a unos 15 a 20 pacientes diariamente de la isla para recibir servicios de traumatología, cáncer y cardiología. Después de muchos retrasos, el hospital recibió la aprobación para seguir adelante con una importante reconstrucción a largo plazo en su ubicación actual, que tendrá lugar en etapas y se encuentra actualmente en su fase de diseño.
El hospital Juan F. Luis en St. Croix sufrió daños más extensos y aún está esperando una determinación de FEMA sobre la reconstrucción. A finales de febrero de 2019, las unidades modulares diseñadas para proporcionar servicios de emergencia temporales y diálisis estaban cerca de comenzar a funcionar, después de muchas demoras. Las unidades modulares requirieron de modificaciones y ajustes costosos para recibir la certificación, que fueron difíciles de completar con los recursos limitados de la isla. Mientras que las unidades de diálisis están operando y la mayoría de los pacientes han regresado a St. Croix, los pacientes de diálisis aún necesitan otros servicios generales, incluidos alojamiento y transporte, para que el tratamiento sea exitoso.
La disponibilidad de proveedores sigue siendo un desafío tanto en Puerto Rico como en USVI. Las tormentas exacerbaron los problemas de larga data con la disponibilidad de proveedores en Puerto Rico y USVI. Debido a la crisis de la deuda y el reembolso limitado antes de los huracanes, la emigración de proveedores ha provocado escasez en ciertas especialidades, así como con el personal de enfermería. Los territorios han tratado de enfrentar estos desafíos mediante la contratación de personal temporal, aumentando las tasas de reembolso, mejorando el reclutamiento local, maximizando el uso de asistentes médicos certificados (en lugar de enfermeras registradas más caras y enfermeras con licencia) y modificando los procedimientos de concesión de licencias. Sin embargo, la incapacidad de los territorios para competir con los estados con respecto al salario, la disponibilidad limitada de viviendas y escuelas, el acceso limitado a la infraestructura y tecnología de atención médica de vanguardia y la incertidumbre sobre la disponibilidad de apoyo de fondos federales hacen que sea difícil reclutar, y retener, proveedores.
La salud mental sigue siendo un área de necesidad crítica en Puerto Rico y USVI. La salud mental en ambos territorios sigue siendo un desafío, ya que las crecientes necesidades posteriores a la tormenta ponen una presión adicional sobre la ya limitada capacidad de servicios. En Puerto Rico, las personas inscritas en Medicaid describieron estados de ansiedad y trauma post-huracán persistentes, junto con largos tiempos de espera para las referencias y citas de salud mental. USVI tiene proveedores psiquiátricos limitados, con un solo psiquiatra en St. Thomas y St. Croix, sin capacidad de internación para atención de salud mental a largo plazo y servicios limitados para pacientes ambulatorios. La escasez de servicios ambulatorios hace que sea difícil dar de alta a los pacientes con episodios psiquiátricos agudos para que reciban atención continua en la comunidad. En este escenario, los servicios de salud del comportamiento y abuso de sustancias de USVI operan bajo un decreto de consentimiento del gobernador. Un grupo asesor se reúne semanalmente e incluye proveedores y agencias como los Departamentos de Salud, Correcciones y Educación. Los esfuerzos para mejorar esto incluyen planes para encontrar opciones para servicios a largo plazo y construir una unidad hospitalaria de salud conductual para el cuidado de transición. Las clínicas están trabajando para ampliar el acceso a los servicios de salud mental a través de la telemedicina y el uso de trabajadores sociales clínicos certificados o asistentes médicos. Debido a los principales daños causados por las tormentas en las instalaciones del Departamento de Salud de USVI, otras clínicas han intervenido para abordar las necesidades de salud del comportamiento.
Más allá de la salud mental, los territorios están experimentando otras necesidades de salud críticas, así como cambios demográficos que podrían afectar el tamaño y el perfil de sus poblaciones de Medicaid. Las clínicas en Puerto Rico informaron sobre la exacerbación de las afecciones más comunes que tratan, en particular la diabetes, las enfermedades cardiovasculares, la hipertensión y la obesidad. En USVI, estas condiciones también se encuentran entre las necesidades comunes, así como las de atención dental, que están generalizadas ya que los pacientes se enfrentan con una escasez de dentistas que participen en el programa de Medicaid del territorio. En Puerto Rico, las tendencias y proyecciones recientes muestran una disminución esperada en la inscripción de Medicaid de 1.5 millones a 1.2 millones de 2017 a 2020 debido a la expiración de un período de re determinación demorado, la emigración, la recuperación económica que puede aumentar los ingresos de los residentes lo suficiente para que no sean elegibles para Medicaid, transición a los métodos de determinación de elegibilidad de MAGI Medicaid y cierta confusión derivada de las reformas de atención administrada11 . La tasa de natalidad de Puerto Rico también ha disminuido, ya que un hospital de Puerto Rico que solía atender más de 300 partos por mes informó que ahora, en un buen mes, hay 190 nacimientos. Las clínicas de Puerto Rico también informaron que atienden a una población cada vez más mayor, y sobre los esfuerzos para reclutar más proveedores geriátricos.
Los proveedores y funcionarios tanto en Puerto Rico como en USVI describieron la necesidad de una educación de salud más amplia. Los proveedores indicaron que muchos pacientes no entienden cómo usar los servicios preventivos y la atención primaria, o cómo manejar las afecciones de salud. Los proveedores señalaron que podría ser necesario un mayor enfoque en la educación para la salud, dada la alta prevalencia de personas que sufren de obesidad, diabetes y que tienen caries. En Puerto Rico, el hospital en donde nacen la mayor proporción de bebés en la isla informó haber trabajado con March of Dimes en programas de educación para pacientes sobre atención prenatal y posnatal. Algunos proveedores informaron problemas con la adherencia de los pacientes a los planes de tratamiento, debido en parte a la capacidad limitada para las actividades de administración de casos, así como a la falta de educación del paciente sobre la necesidad de seguimiento. Describieron un enfoque en la educación preventiva y primaria, y la alfabetización en salud, como algunos de los determinantes sociales más importantes en sus comunidades. Además, algunos proveedores notaron el alto costo de las frutas y verduras frescas, contribuyendo a condiciones de salud que son prevenibles.
En el contexto de las presiones fiscales y los esfuerzos de recuperación de huracanes, ambos territorios están comprometidos con esfuerzos de reforma del sistema de prestación para abordar los problemas clave de acceso y financiamiento. En Puerto Rico, las reformas de atención administrada, llamadas Vital, se implementaron en 2018 y tienen como objetivo reducir el gasto en atención de salud y racionalizar los costos administrativos (Recuadro 1). Las reformas en USVI son más amplias que las de Medicaid y están diseñadas para mejorar el acceso y la atención coordinada. Muchas reformas de USVI se están produciendo a través de varias fuentes de fondos federales (por ejemplo, subvenciones de SAMHSA, CDC y FEMA). Estos esfuerzos incluyen un nuevo programa de “Atención de paramedicina comunitaria” para pacientes en el hogar, un comité directivo de salud del comportamiento y un grupo de trabajo de administración de la atención. Consulte el recuadro 2 para obtener más información sobre las reformas de atención médica administrada en Puerto Rico.
Recuadro 2: Reformas de atención administrada en Puerto Rico
Las reformas de atención administrada en Puerto Rico incluyen una transición de un esecenario en el que una MCO operaba en cada una de las nueve regiones, al nuevo sistema llamado Vital. En Vital, cinco MCOs compiten por los beneficiarios en todo el territorio. ASES, la agencia de seguros de salud de Puerto Rico, promovió que Vital ofreciera a los pacientes más opciones de planes, mejorando el acceso a los proveedores a través de un modelo para todo el territorio y reduciendo los costos a través de la competencia y la administración simplificada.
Las reformas de la atención médica administrada forman parte de un conjunto más amplio de reformas incluidas en el plan fiscal que FOMB aprobó en octubre de 2018, que impone importantes recortes al programa de Medicaid. En marzo de 2019, el FOMB revisó los objetivos para el año fiscal 2023 de $826 millones a $671 millones para evitar “dificultades excesivas para la población de Medicaid en forma de reducciones de servicios”12 ; sin embargo, la FOMB y el gobierno de Puerto Rico continúan las discusiones sobre los niveles y las implicaciones de estos objetivos. Además de la transición a Vital, el plan fiscal exige medidas de contención de costos de Medicaid, como pagos reducidos a las MCO por miembro por mes (PMPM); nuevos programas de atención para beneficiarios de alta necesidad que requieren de atención de alto costo (HCHN); mecanismos de reducción de fraude y abuso; y reducciones en las tarifas de los proveedores13 . Si no se alcanzan los objetivos de ahorro, podrían producirse recortes adicionales de beneficios, o aumentos en los copagos de los beneficiarios.
Desde el inicio de la inscripción abierta el 1 de noviembre de 2018, la implementación de Vital en Puerto Rico ha creado desafíos para las MCOs. Al momento de las entrevistas para este informe, los pacientes aún podían cambiarse de plan después que la inscripción abierta terminara el 31 de enero de 2019. Las MCOs no estaban seguras de los pagos totales límites porque no sabían qué planes elegirían los miembros, y qué tarifas se les asignaría. Debido a esta incertidumbre, las MCOs no pudieron determinar las tasas de reembolso de los proveedores. Las MCOs también describieron los desafíos en la construcción de redes de proveedores en todo el territorio después de haber operado en una región limitada durante años, y la necesidad de dedicar recursos para construir programas en nuevas regiones que pueden tener solo unos pocos afiliados. Las MCOs informaron sentirse limitadas por el índice de pérdida médica (MLR) del 92% de Vital, dado los requisitos para gastar recursos en nuevos modelos de atención para sus afiliados de HCHN; si bien el programa HCHN puede ayudar a mejorar la atención y reducir los costos a largo plazo, requiere inversiones iniciales. En términos más generales, las MCOs expresaron su preocupación sobre los objetivos para reducir los costos, ya que las tasas de PMPM ya son bajas, y también sobre cómo cumplir con las altas expectativas de los pacientes sobre las reformas.
Los proveedores y los afiliados también han experimentado desafíos con el lanzamiento de Vital. Para los proveedores, estos desafíos incluyeron tratar con múltiples MCOs, tasas y modelos de atención de HCHN. Sin saber las tasas de reembolso de MCO, fue difícil para las clínicas y los hospitales reclutar médicos. Los proveedores también describieron la incertidumbre sobre el estado de cobertura de sus pacientes, y los proveedores más pequeños, algunos sin sistemas tecnológicos (IT) sofisticados, informaron dificultades para recopilar datos de los pacientes (utilizados por ASES para asignar a los pacientes a los 37 nuevos rangos de tarifas). Algunas clínicas más pequeñas se agruparon para abordar los problemas de contratación, reembolso y clasificación de pacientes. Los beneficiarios expresaron confusión relacionada con la inscripción automática en los nuevos planes, las formas de cambiar los planes para mantener a los proveedores existentes y los nuevos procesos para obtener referencias para servicios especializados o para acceder a recetas. Es posible que algunos afiliados hayan perdido sus beneficios de Medicaid, pensando que la elección de un nuevo plan había reemplazado la necesidad de completar el proceso de re determinación. ASES informó responder a estos desafíos al estandarizar los procesos de referencia y autorización previa, simplificando los procesos de re determinación de elegibilidad y estableciendo ciertas garantías de precios durante la transición.
¿Cuáles son las posibles consecuencias de que ninguna acción federal aborde la expiración de los fondos federales temporales de Medicaid?
Es probable que la expiración de los fondos federales temporales de Medicaid genere presiones fiscales o déficits sustanciales para los presupuestos de los territorios. Los fondos de ACA y de la BBA han apoyado los presupuestos y la cobertura, por lo que la expiración de estos fondos dará lugar a brechas fiscales significativas. Los funcionarios de Puerto Rico proyectan que el retorno a la financiación tradicional después de septiembre de 2019 significaría que los fondos federales del territorio para el año fiscal 2020 se agotarían en marzo o abril de ese año14 . Ambos territorios han indicado que sería imposible utilizar los recursos del territorio para compensar la pérdida de fondos federales. Previendo la reducción de los fondos federales y la necesidad de mitigar los aumentos en los fondos locales, el plan fiscal de la FOMB contempla la reducción de los gastos y las reformas en Puerto Rico (consulte el recuadro 2).
Los gastos de Medicaid proyectados para los años fiscales 2020 y 2021 muestran que, sin fondos federales adicionales, Puerto Rico y USVI enfrentarían un déficit de fondos de entre un tercio y la mitad de los costos del programa. Por ejemplo, si el FMAP de Puerto Rico regresara al 55% en octubre de 2019 y el territorio no recibiera fondos federales adicionales más allá del límite legal y los fondos de ACA restantes entre septiembre y diciembre de 2019, los fondos disponibles no alcanzarían para los costos proyectados del programa de $1,000 millones en el año fiscal 2020 (Gráfico3). En el año fiscal 2021, después que todos los fondos federales suplementarios expiraran, Puerto Rico experimentaría un déficit de $1.5 mil millones, o la mitad de los costos proyectados del programa. En USVI, los gastos proyectados para el año fiscal 2020 muestran que un retorno al financiamiento tradicional con el FMAP del 55% dejaría el territorio con un déficit de aproximadamente $31.3 millones, aproximadamente el 40% de los costos proyectados del programa (Gráfico 5).
El vencimiento de los fondos federales podría ocasionar graves pérdidas de cobertura, recortes de beneficios y aumentos en la atención no compensada. Funcionarios del territorio expresaron temor de no poder compensar la pérdida de fondos federales vencidos con fondos locales, lo que tendría graves implicaciones para la cobertura, los beneficios y los proveedores. Algunos funcionarios del territorio describieron los efectos potenciales como “devastadores”, “catastróficos” y “aterradores”. El MACPAC estima que, sin fondos federales adicionales, Puerto Rico debería reducir la inscripción total de Medicaid de aproximadamente 1.2 millones en aproximadamente un tercio a la mitad, según las contribuciones del territorio15 , y los funcionarios predicen un gran aumento de la población sin seguro. Además, las estimaciones de MACPAC muestran que incluso la eliminación completa de la cobertura de servicios dentales y medicamentos recetados de Puerto Rico (dado que los medicamentos representan la mayor parte de los costos del programa del territorio) no generarían suficientes ahorros al programa para compensar la pérdida de los fondos federales16 . En USVI, la expiración de la financiación podría requerir que el territorio recorte a 18,000 afiliados de una población actual de casi 28,00017 . En ambos territorios, los proveedores están preocupados por la pérdida de los ingresos de Medicaid y los aumentos en la atención no compensada en caso de que expiraran los fondos federales. Para los hospitales de la red de seguridad en USVI, el vencimiento de la financiación significaría más atención no compensada y más visitas a las salas de emergencia, agotando sus recursos, amenazando la solvencia y poniendo en riesgo el posible cierre del hospital.
Para las personas inscritas en Medicaid, la pérdida de cobertura resultaría en un acceso restringido a los servicios de atención médica, así como también inestabilidad financiera. Los beneficiarios de Medicaid en ambos territorios describieron la importancia del programa para sus vidas, salud y estabilidad financiera. Si bien algunos describieron los desafíos relacionados con la escasez de proveedores, los tiempos de espera para las citas y los procedimientos de referencia confusos, describieron a Medicaid como “vital” y “la única opción” de cobertura de atención médica. Muchos afiliados, tanto en Puerto Rico como en USVI, citaron el acceso a los medicamentos recetados como una de sus necesidades y beneficios más críticos de la cobertura de Medicaid. Otros servicios que mencionaron como razones para necesitar cobertura de Medicaid incluyen salud mental, exámenes de detección y servicios preventivos, servicios de laboratorio y de especialistas, y atención de emergencia. Algunos beneficiarios habían escuchado rumores de posibles recortes de fondos al programa y afirmaron que, si como resultado perdieran la cobertura, se verían obligados a tomar medidas como buscar un tercer empleo, pagar los costos de atención médica de su bolsillo o utilizar remedios naturales. Señalaron que la pérdida de cobertura afectaría más seriamente a los adultos mayores y a las personas con afecciones de salud, ya que esas personas a menudo dependen de Medicaid para el tratamiento de condiciones crónicas.
Las agencias de Medicaid de los territorios reconocieron la necesidad de planes de contingencia en caso que los fondos federales expiren, señalando que estos planes pueden generar ansiedad entre los beneficiarios y proveedores, y desviar la atención de la implementación de nuevas iniciativas. Similar a la experiencia que muchos estados tuvieron con la expiración de los fondos para CHIP en 2018, las agencias de Medicaid necesitarían gastar energía administrativa en el desarrollo de anuncios para restringir los beneficios o la cobertura muchos meses antes que los fondos expiren. Estos esfuerzos podrían crear confusión para los afiliados, proveedores y planes en Puerto Rico y aumentar la emigración, lo cual sería innecesario si el Congreso finalmente aprueba nuevos fondos. En medio de esta incertidumbre, las MCOs todavía están trabajando para invertir en sus poblaciones de pacientes e implementar programas para los miembros de HCHN. Las MCOs trabajaban en estrecha colaboración con el gobierno de Puerto Rico para desarrollar planes para el escenario potencial en el que tengan que enfrentarse fondos insuficientes para financiar la prestación de servicios. En USVI, esta planificación si expirara el financiamiento va en contra de los esfuerzos en curso para llevar a cabo actividades de extensión de inscripción para aquellos actualmente elegibles pero que no tienen Medicaid.
¿Cuáles son las opciones para la acción federal?
Las opciones del Congreso para abordar los problemas de financiamiento de Medicaid en Puerto Rico y USVI (así como en los otros territorios) incluyen aumentar o eliminar el límite de financiamiento y mantener o aumentar el FMAP. Aumentar el límite de financiación podría incluir una opción para agregar una asignación adicional similar al financiamiento proporcionado a través de ACA o la BBA. Un aumento en el FMAP podría significar aumentar el FMAP legal o permitir que el FMAP se calcule en función del ingreso per cápita, como se calcula en los estados. Un 83% del FMAP es el máximo permitido legalmente y reflejaría los ingresos per cápita más bajos en los territorios. El Congreso también decidiría si la financiación federal adicional es permanente o por tiempo limitado. Los gobernadores de los territorios declararon ante el Comité de Recursos Naturales del Senado en febrero de 2019 sobre la necesidad de un apoyo federal de Medicaid más adecuado y permanente, describiendo el posible “daño catastrófico” del abismo fiscal de septiembre de 2019.
Las opciones específicas para Puerto Rico incluyen la legislación federal propuesta, así como una solicitud del gobernador. El 1 de mayo de 2019, el gobernador de Puerto Rico, Ricardo Rosselló, envió una solicitud formal al Congreso de $15.1 mil millones en fondos de Medicaid durante cinco años, sujeto a un FMAP del 83%18 . En apoyo de su solicitud, el gobernador Rosselló presentó cinco medidas de sostenibilidad necesarias para estabilizar el programa de Medicaid y el sistema de atención médica de Puerto Rico, y señaló que los fondos solicitados ayudarían a implementar estas medidas19 . Estas medidas incluyen la retención de proveedores, la cobertura de medicación contra la hepatitis C, el apoyo para los hospitales de Puerto Rico, la cobertura de la Parte B de Medicare para los afiliados con doble elegibilidad, y los cambios de elegibilidad para abordar las diferencias entre los niveles de pobreza locales y federales20 . La solicitud de Rosselló enfatiza la necesidad de financiamiento plurianual para brindar estabilidad en el sistema de atención médica de Puerto Rico, lo que permitiría a los legisladores trabajar en reformas de financiamiento a más largo plazo que podrían terminar con las diferencias estructurales entre el financiamiento estatal y territorial de Medicaid y alcanzar la paridad en términos de financiamiento sin un monto límite. Además, la representante de Puerto Rico Jenniffer González-Colón presentó la R.2306, que eliminaría permanentemente el FMAP del 55% a partir del año fiscal 2020 y aumentaría el límite a $2.65 mil millones para el año fiscal 2020 y 2021.
Otra legislación propuesta abordaría la financiación de Medicaid para los cinco territorios de los Estados Unidos, incluida Samoa Americana, el Commonwealth de las Islas Marianas del Norte y Guam. Por ejemplo, la HR 1354, la Ley de Equidad en la Salud de los Territorios de 2019, brindaría una opción a más largo plazo o permanente para alcanzar el límite de financiamiento de Medicaid y eliminar el FMAP del 55% a partir del año fiscal 2020. Bajo la HR 1354, los territorios recibirían fondos federales para Medicaid sin un tope límite, sujetos a un FMAP calculado como se calcula para los estados. El Congreso también podría considerar opciones más limitadas para abordar el déficit de fondos y/o el FMAP, así como otras opciones para aumentar aún más el apoyo federal.
Estimaciones de las opciones federales para Puerto Rico
Aumentar el financiamiento federal para abordar el déficit en el financiamiento del programa, que ocurriría si este financiamiento volviera a una tener un límite legal establecido en un FMAP del 55%, más un aumento del FMAP del 83%, podría proporcionar $1.9 mil millones en fondos federales adicionales para Puerto Rico en el año fiscal 2021. Los gastos de Medicaid proyectados para los años fiscales 2020 y 2021 muestran que, sin fondos federales adicionales, Puerto Rico enfrentaría un déficit de fondos de $1,000 millones en el año fiscal 2020 y de $1.5 mil millones en el año fiscal 2021, la mitad de los costos proyectados para el programa. Las estimaciones de estos déficits reflejan las proyecciones actuales para el gasto del programa y el gasto del territorio a un FMAP de 55%. Además de abordar el déficit con nuevos fondos federales, aumentar el FMAP a un 83%, la tasa que recibiría Puerto Rico si fuera un estado, proporcionaría fondos federales adicionales y reduciría las contribuciones requeridas del territorio. Abordar el déficit, además de aumentar el FMAP al 83%, le otorgaría a Puerto Rico $1.4 mil millones en nuevos dólares federales en el año fiscal 2020 y $1.9 mil millones en el año fiscal 2021 (Gráfico 3).
Gráfico 3: Gasto proyectado de Medicaid en Puerto Rico para los años fiscales 2020 y 2021 con un FMAP de 55% vs 83% (en mil millones)
Además de los nuevos fondos federales para abordar el déficit y aumentar el FMAP, el Congreso podría considerar otorgar fondos federales adicionales para que Puerto Rico pueda abordar las deficiencias en los reembolsos o los beneficios. Los análisis de MACPAC muestran que el gasto actual en Puerto Rico por persona inscrita es considerablemente más bajo comparado con los estados. Puerto Rico tendría que aumentar su gasto en un 56% para igualar el gasto por beneficiario con el del estado que tiene el gasto más bajo21 . Con suficiente financiamiento federal, Puerto Rico podría aumentar su gasto por beneficiario para mejorar las bajas tasas de reembolso a los proveedores, y el acceso a ciertos servicios o recetas, como medicamentos para el tratamiento de la hepatitis C. Estos cambios resultarían en un mayor gasto de PMPM. El análisis de KFF de los datos de ASES y MACPAC muestra que un aumento del 50% en el PMPM, con un FMAP del 83%, proporcionaría $2.8 mil millones en nuevos fondos federales en el año fiscal 2021 ($1.5 mil millones para abordar el déficit en el mantenimiento del programa actual al 55% de FMAP y $1.3 mil millones adicionales para aumentar el FMAP y el gasto de PMPM) (Gráfico 4). Abordar cambios en la elegibilidad u otros cambios al programa podrían requerir de fondos federales adicionales.
Gráfico 4: Gasto proyectado de Medicaid en Puerto Rico para los años fiscales 2020 y 2021 con ajustes de PMPM bajo un FMAP de 83% (en mil millones)
Estimaciones de opciones federales para USVI
USVI tiene opciones similares para aumentar el financiamiento federal y el FMAP. En USVI, los gastos proyectados para el año fiscal 2020 muestran que un regreso al financiamiento tradicional con el FMAP del 55% y el límite legal dejaría a USVI con un déficit de aproximadamente $31.3 millones, alrededor del 40% de los costos proyectados del programa. El aumento del FMAP al 83% podría requerir $45.9 millones en fondos federales por encima de los niveles actualmente asignados ($14.6 millones más que el déficit proyectado de referencia) (Gráfico 5). Al igual que las estimaciones en Puerto Rico, el apoyo federal adicional, más allá de abordar el déficit, y el FMAP de 83% podrían ayudar al territorio a abordar las tasas de reembolso a proveedores o ampliar los beneficios de Medicaid.
Gráfico 5: Gasto proyectado de Medicaid en USVI en el año fiscal 2020 con un FMAP de 55% vs 83% (en millones)
¿Qué viene después?
A principios de mayo de 2019, los funcionarios electos del territorio estaban impulsando una legislación para apoyar la ayuda en casos de desastre y el Programa de Asistencia Nutricional de Puerto Rico (NAP), para el cual el financiamiento federal expiró a fines de marzo de 2019. Al igual que su programa Medicaid, el NAP de Puerto Rico difiere de los Programas de Asistencia de Nutrición Suplementaria (SNAP) de los estados, en la medida en que NAP es un beneficio limitado y depende de las asignaciones del Congreso. Aproximadamente un tercio de los puertorriqueños están inscritos en NAP22 , y Puerto Rico comenzó a recortar los servicios para estos beneficiarios a principios de marzo, a medida que los fondos comenzaron a disminuir23 . El financiamiento para NAP se ha incluido en los amplios proyectos de ley de la Cámara de Representantes y el Senado para el alivio de desastres, pero las propuestas han diferido en el nivel de fondos de recuperación de desastres para Puerto Rico más allá de NAP. Cuando el Congreso regresó del receso, en mayo de 2019, continuaron el debate sobre la ayuda en casos de desastre, ya que un nuevo proyecto de ley del Senado incluyó $300 millones en fondos adicionales para Puerto Rico. Los proyectos de ley de ayuda en casos de desastre no incluyen disposiciones sobre el financiamiento de Medicaid.
Si el Congreso no aborda el abismo de financiamiento de Medicaid, Puerto Rico y USVI enfrentarán graves déficits de financiamiento. Entre las opciones de acción del Congreso se encuentra la solicitud del Gobernador Rosselló, de cinco años de mayor financiamiento federal con un FMAP del 83%, así como la consideración de opciones a más largo plazo o permanentes, como la HR1354, la Ley de Equidad en la Salud de los Territorios de 2019. El Congreso también podría considerar opciones más limitadas para abordar el déficit de financiamiento y/o FMAP, así como otras opciones para aumentar aún más el apoyo federal.
Conclusión
A medida que Puerto Rico y USVI continúan con sus procesos de reconstrucción luego de los huracanes de septiembre de 2017, que devastaron sus economías y sistemas de atención médica, el vencimiento programado para septiembre de 2019 de la mayoría de los fondos federales temporales de Medicaid podría causar importantes déficits de fondos que afectarían la cobertura de Medicaid y el acceso de los residentes a servicios de atención de salud. Las opciones para que el Congreso aborde los problemas de financiamiento de Medicaid en Puerto Rico y USVI incluyen aumentar o eliminar el límite de financiamiento y mantener o aumentar el FMAP. Los funcionarios electos del territorio y los miembros del Congreso están considerando propuestas de leyes para evitar el abismo fiscal de Medicaid y estabilizar los programas de Medicaid en los territorios a corto plazo, mientras abordan soluciones permanentes a largo plazo para los problemas de financiamiento. Sin embargo, mientras tanto, la incertidumbre sobre este financiamiento contribuye a la inestabilidad en el sistema de atención de salud, requiriendo recursos administrativos para establecer planes de contingencia, creando confusión para los proveedores y beneficiarios, y limitando las capacidades de los territorios para avanzar con reformas complejas del sistema de prestación. Si bien la expiración del financiamiento para desastres es exclusiva de Puerto Rico y USVI, los otros territorios de los Estados Unidos (Samoa Americana, el Commonwealth de las Islas Marianas del Norte y Guam) también enfrentan el vencimiento de los fondos de ACA. Por ende, las reformas de financiamiento de Medicaid que examinan los problemas en torno al límite y el FMAP podrían considerarse para todos los territorios.
Endnotes
KFF Interview with USVI Medicaid Director, Department of Human Services (Feb. 26, 2019). ↩︎
The Kaiser Family Foundation worked with PerryUndem Research/Communication to help organize and conduct the focus groups with enrollees and key on-the-ground interviews. ↩︎
After this initial increase, Puerto Rico’s Medicaid enrollment was trending downward beginning in mid-2018 due to expiration of a delayed redetermination period, outmigration, economic recovery that may increase residents’ incomes enough to make them ineligible for Medicaid, transition to MAGI Medicaid eligibility determination methods, and some confusion stemming from the managed care reforms. ↩︎
U.S. Virgin Islands Department of Human Services, “Medicaid & CHIP Programs in the U.S. Virgin Islands” (Feb. 26, 2019). ↩︎
Puerto Rico Gov. Ricardo Rosselló letter to Chairman and Ranking Member, Committee on Energy & Commerce, U.S. House of Representatives (Washington, DC: May 1, 2019); Puerto Rico Gov. Ricardo Rosselló letter to Chairman and Ranking Member, Committee on Finance, U.S. Senate (Washington, DC: May 1, 2019). ↩︎
KFF Interview with USVI Medicaid Director, Department of Human Services (Feb. 26, 2019). ↩︎
Puerto Rico Gov. Ricardo Rosselló letter to Chairman and Ranking Member, Committee on Energy & Commerce, U.S. House of Representatives (Washington, DC: May 1, 2019); Puerto Rico Gov. Ricardo Rosselló letter to Chairman and Ranking Member, Committee on Finance, U.S. Senate (Washington, DC: May 1, 2019). ↩︎
Puerto Rico Gov. Ricardo Rosselló, “Critical Sustainability Measures to Provide Essential Health Services to Puerto Rico’s Medicaid Recipients,” Enclosure with letters to U.S. Senate and U.S. House of Representatives (Washington, DC: May 2019). ↩︎
MACPAC, “Medicaid in Puerto Rico: Financing and Spending Data Analysis and Projections” (Washington, DC: March 2019 Public Meeting), https://www.macpac.gov/wp-content/uploads/2019/03/Medicaid-in-Puerto-Rico-Financing-and-Spending-Data-Analysis-and-Projections.pdf, p.11. The MACPAC per-enrollee spending calculations include both federal and state funds and exclude long-term services and supports, since those services are not covered in Puerto Rico’s Medicaid program. The MACPAC analyses also adjust for differences in enrollment mix. ↩︎