Poll Finding

KFF Health Tracking Poll – October 2019: Health Care In The Democratic Debates, Congress, And The Courts

Published: Oct 15, 2019

KFF Health Tracking Poll – October 2019: Health Care In The Democratic Debates, Congress, And The Courts

Findings

Key Findings:

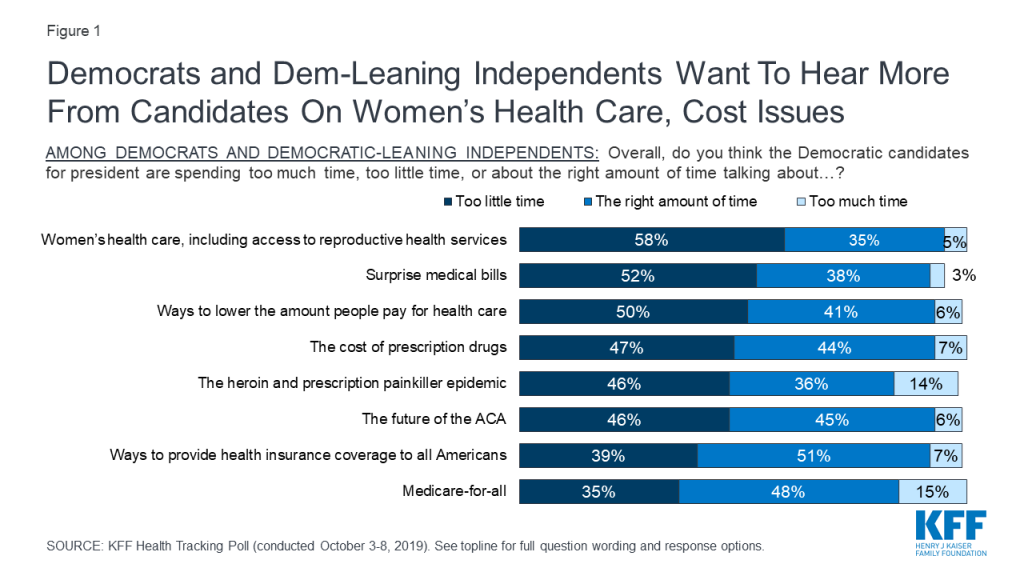
  • In the lead up to the fourth round of Democratic primary debates, majorities of Democrats and Democratic-leaning independents say Democratic candidates for president are spending too little time talking about women’s health care and surprise medical bills, while most feel they are spending the right amount or too much time talking about coverage expansions and Medicare-for-all.
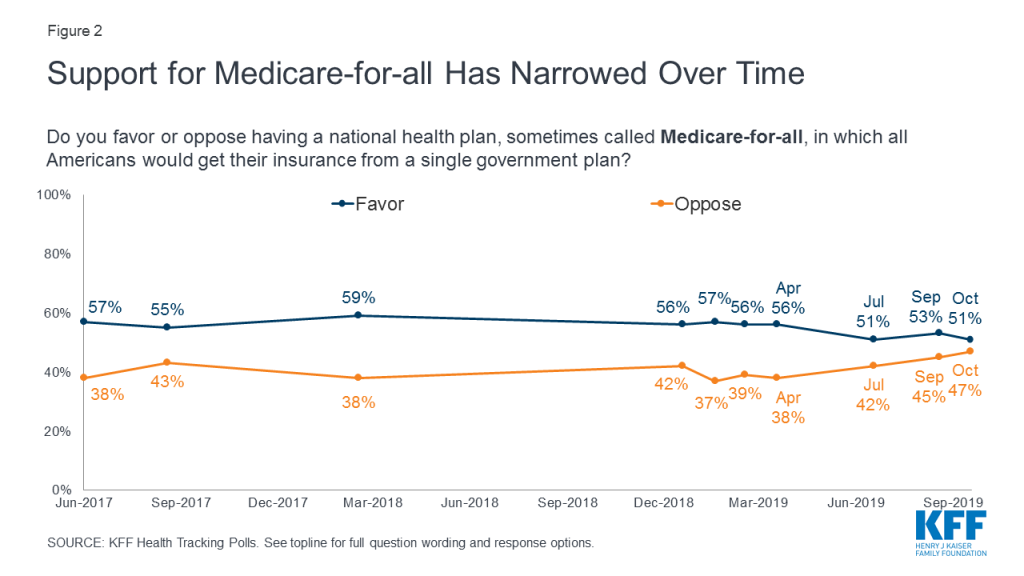
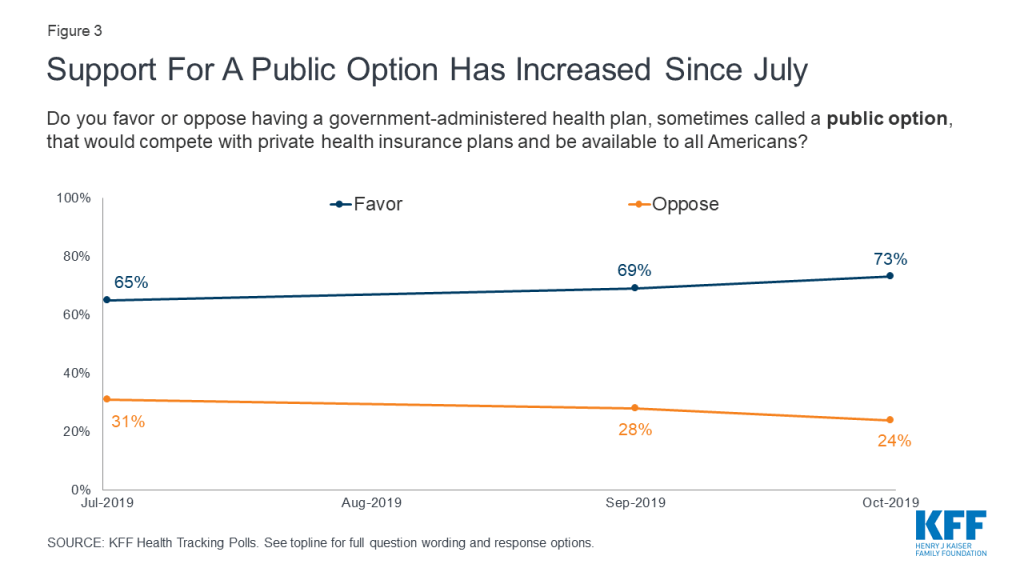
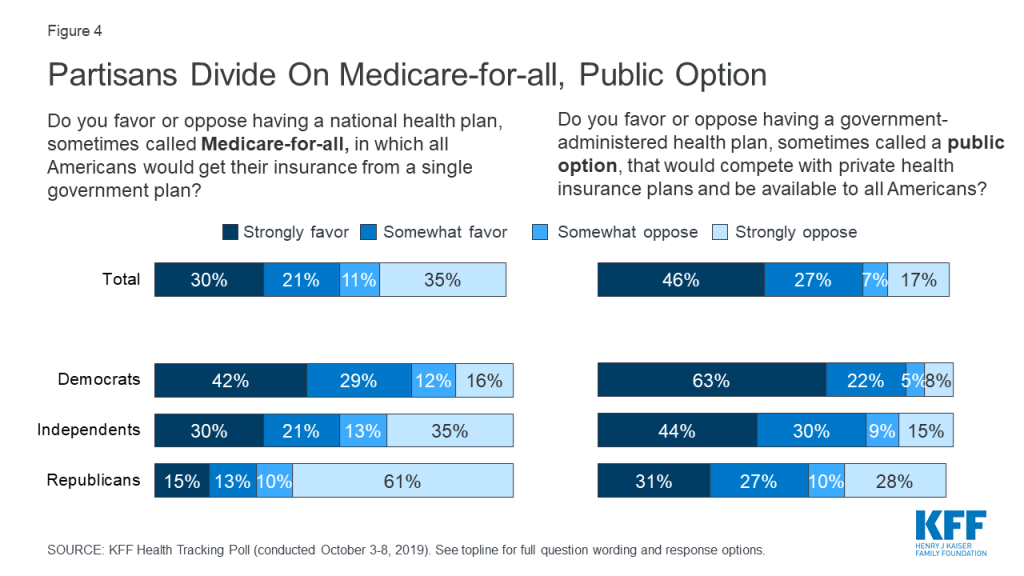
  • Support for Medicare-for-all has narrowed in recent months, with 51% now saying they favor a national health plan and 47% opposed. At the same time, support for a public option has inched up since July, with 73% now saying they favor a government plan that would compete with private health care plans and 24% opposed.
  • Fewer than four in ten adults (37%) are aware that President Trump has promised to release a health care plan to replace the Affordable Care Act, while most say the president has not promised such a plan or are unsure. Most (62%) are not too confident or not at all confident that the president will be able to deliver on his promise that Americans will get better health care at a lower cost under his plan.
  • Following House Speaker Nancy Pelosi’s announcement of a formal impeachment inquiry into President Trump, the public is divided on whether an impeachment investigation will keep Congress from addressing key health care issues (47%) or whether Congress can work on impeachment and pass legislation to address issues such as prescription drug costs and surprise medical bills at the same time (45%). Partisans diverge, but among independents, more think that working on impeachment will keep Congress from passing legislation than say Congress can work on both at the same time (53% vs. 40%).
  • Large majorities of the public favor various policy options aimed at lowering the cost of prescription drugs, including over eight in ten who favor allowing the federal government to negotiate with drug companies to get a lower price on medications for people with Medicare and allowing negotiations that would apply to both Medicare and private insurance. However, support can shift with arguments for and against government negotiation of drug prices.

Health Care And The 2020 Election

Democratic Presidential Primary Debates

In recent KFF Health Tracking Polls health care has consistently emerged as a top issue that Democrats and Democratic-leaning independents want to hear the 2020 Democratic presidential candidates address. This month’s tracking poll, conducted in the week prior to the fourth round of Democratic presidential debates, finds a majority of Democrats and Democratic-leaning independents say the Democratic candidates for president are spending too little time talking about women’s health care (58%) and surprise medical bills (52%) and half say the candidates are spending too little time discussing ways to lower health care costs (50%). Nearly half say candidates are spending too little time discussing the cost of prescription drugs (47%), the opioid epidemic (46%), and the future of the ACA (46%). The upcoming debates present an opportunity for Democratic candidates to address other health care issues that Democrats and Democratic-leaning independents want to hear more about as most say the candidates have spent the right amount of time or too much time talking about Medicare-for-all and ways to provide health insurance coverage to all Americans—two topics which have dominated health care discussions in the past three rounds of Democratic debates.

Figure 1: Democrats and Dem-Leaning Independents Want To Hear More From Candidates On Women’s Health Care, Cost Issues

Support For Medicare-for-all Narrows, While Support For Public Option Grows

Support for a national health plan, or Medicare-for-all, appears to have narrowed somewhat in recent months. This month’s poll finds about half the public (51%) favors a national Medicare-for-all plan while 47% are opposed. This is the narrowest gap between those who favor and oppose such a plan measured in KFF polls since 2017, and represents a 5-percentage point drop in the share in favor and an 8-percentage point increase in the share opposed since April.

Figure 2: Support for Medicare-for-all Has Narrowed Over Time

By contrast, support for a so-called “public option” plan in which a government-administered plan would compete with private health insurance appears to be inching up. Since July, there has been an 8-percentage point increase in the share in favor of such a plan, from 65% to 73%.

Figure 3: Support For A Public Option Has Increased Since July

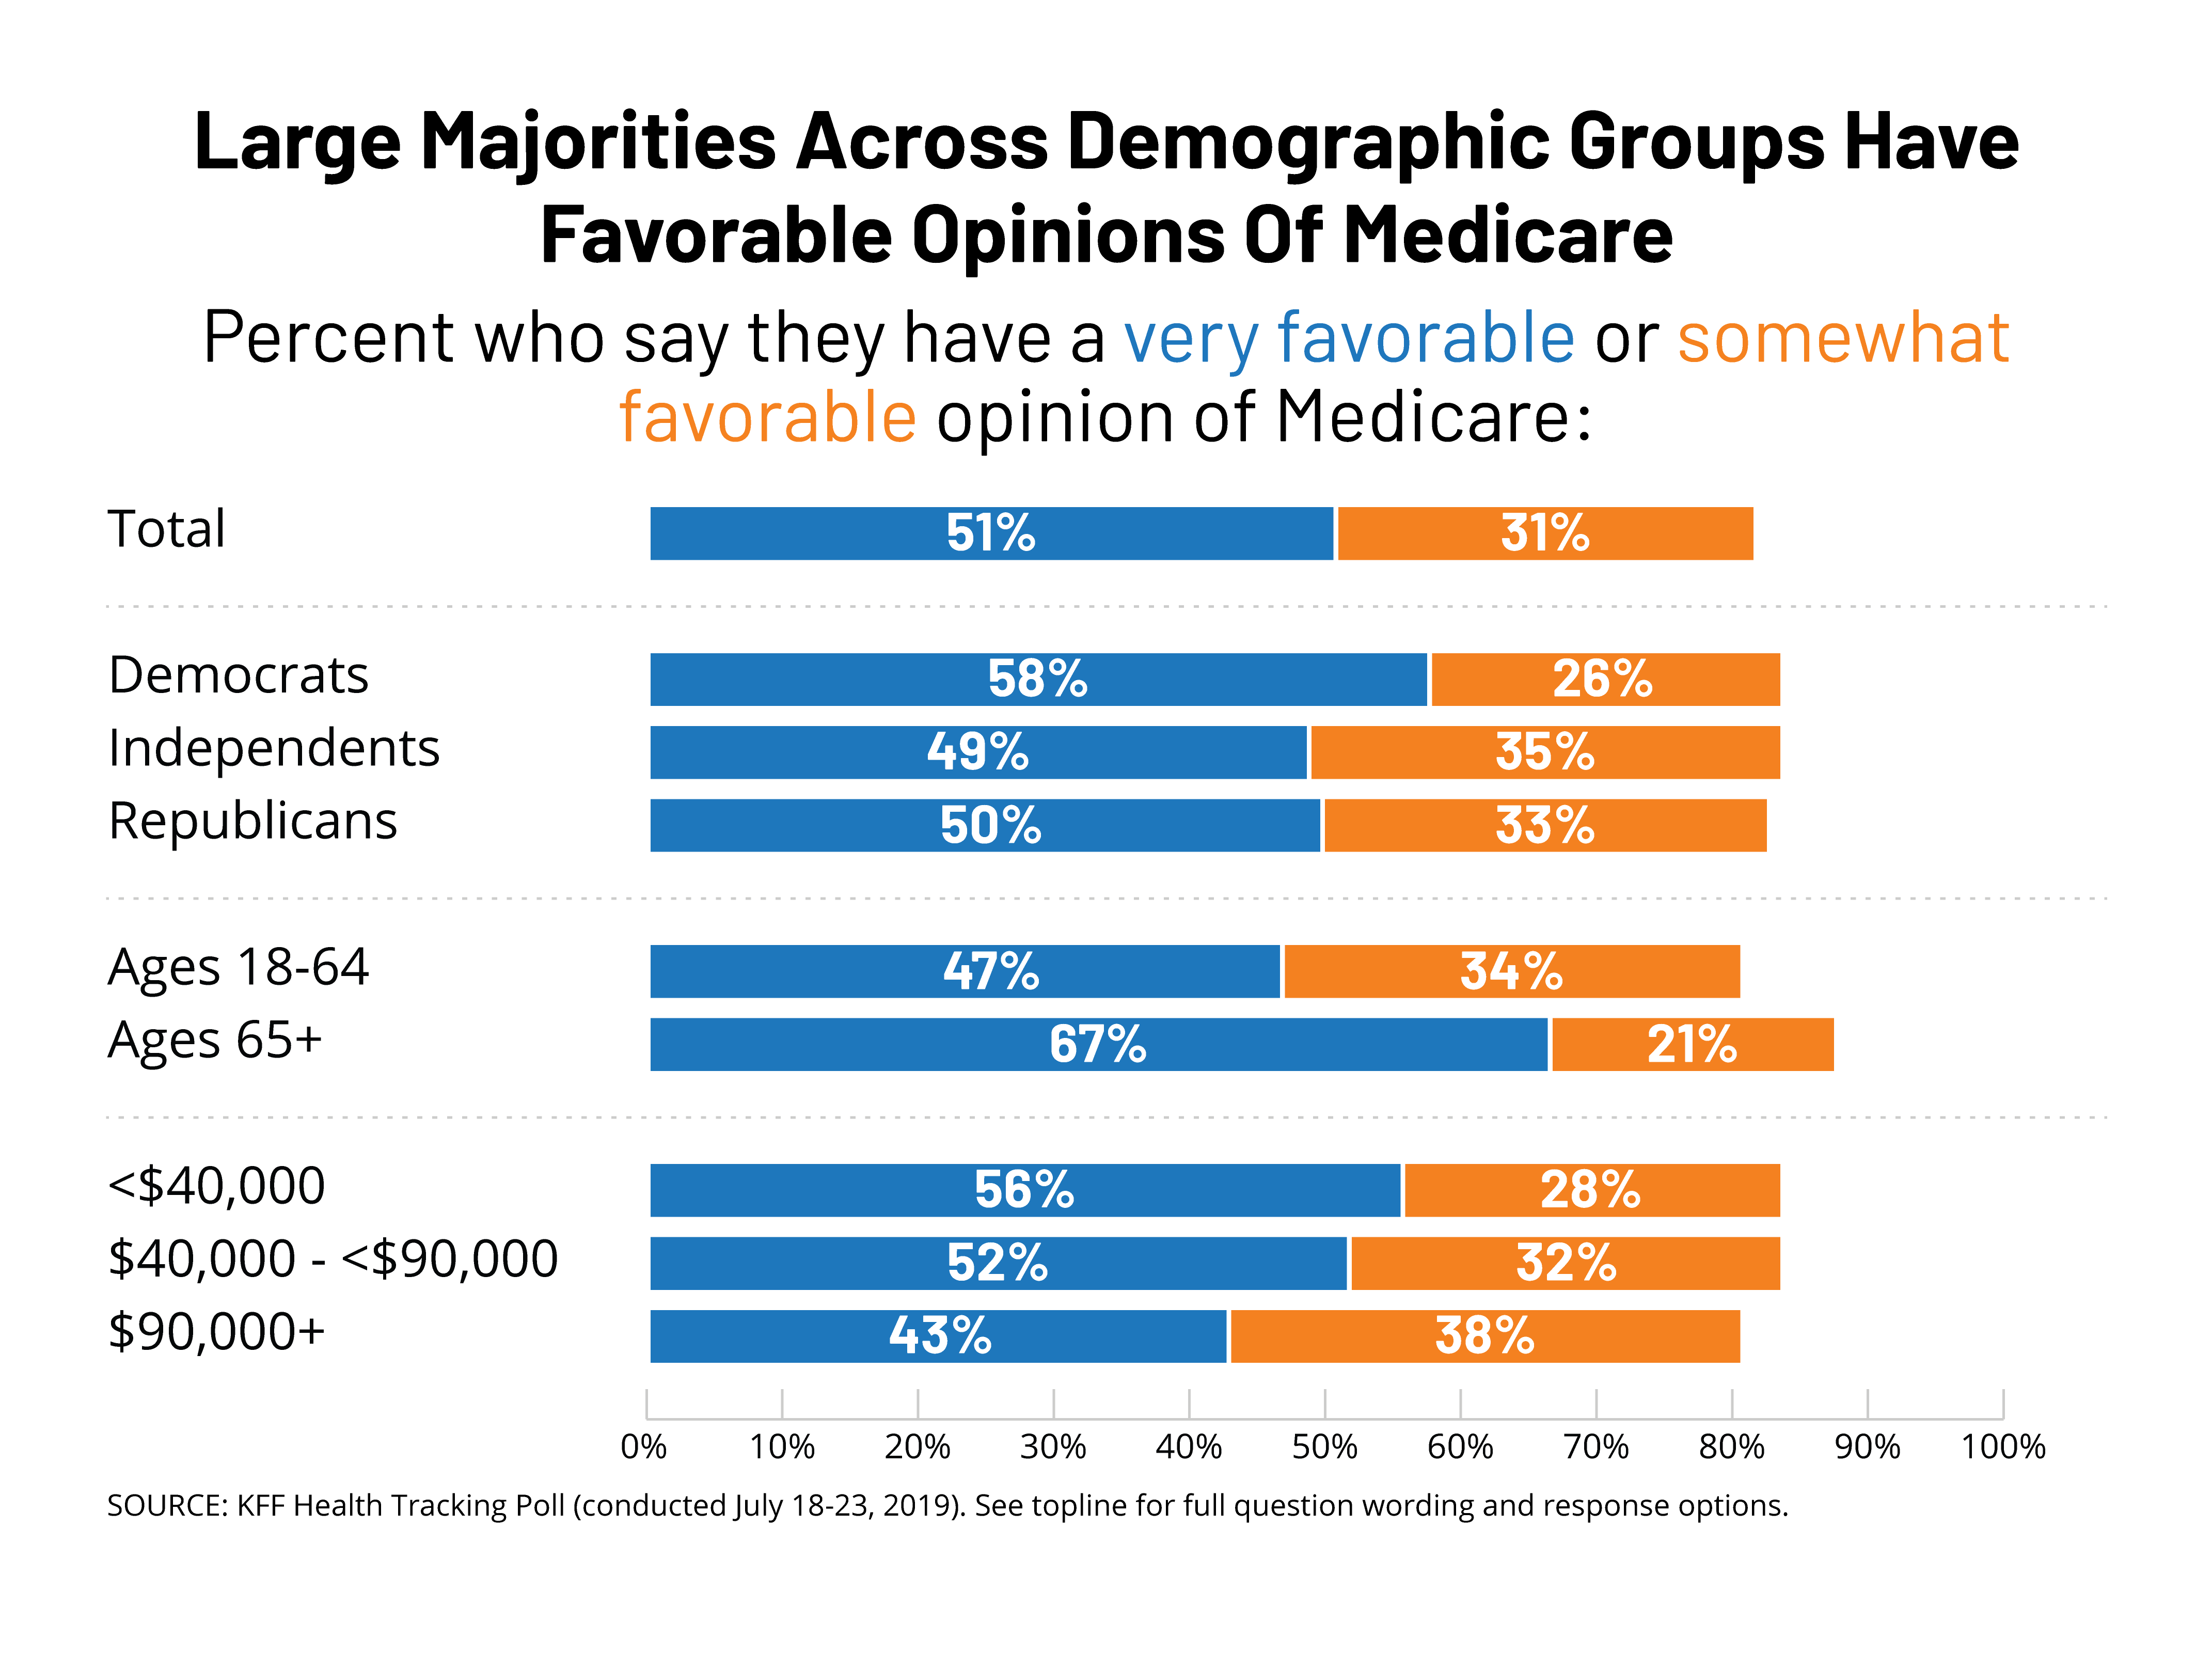
Large majorities of Democrats continue to favor both Medicare-for-all (71%) and a public option (85%). While a Medicare-for-all proposal is less popular among independents (50%) and Republicans (28%), majorities in both groups favor a public option that would compete with private health insurance plans (73% of independents and 58% of Republicans).

Figure 4: Partisans Divide On Medicare-for-all, Public Option

President Trump’s Health Care Plan

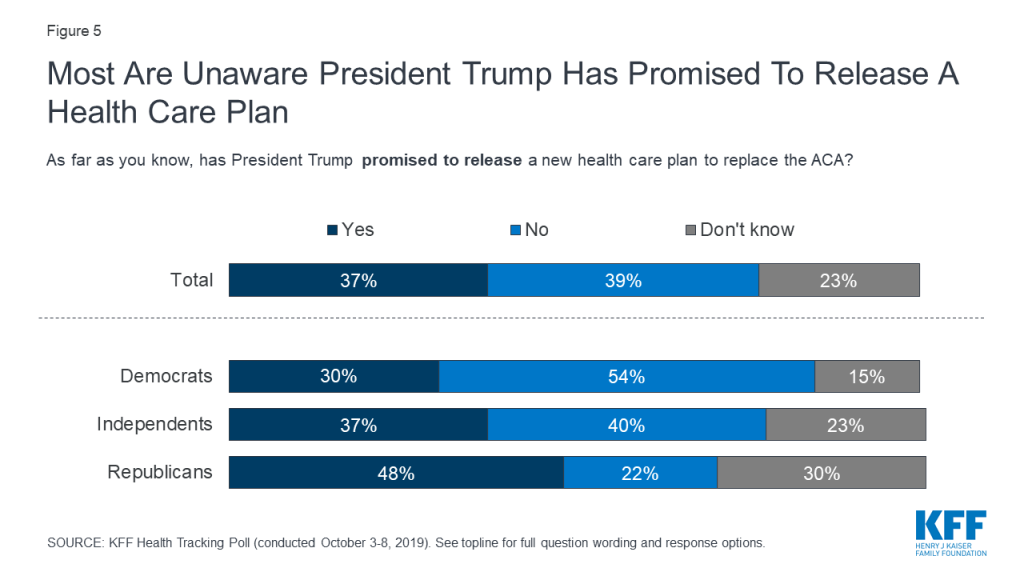
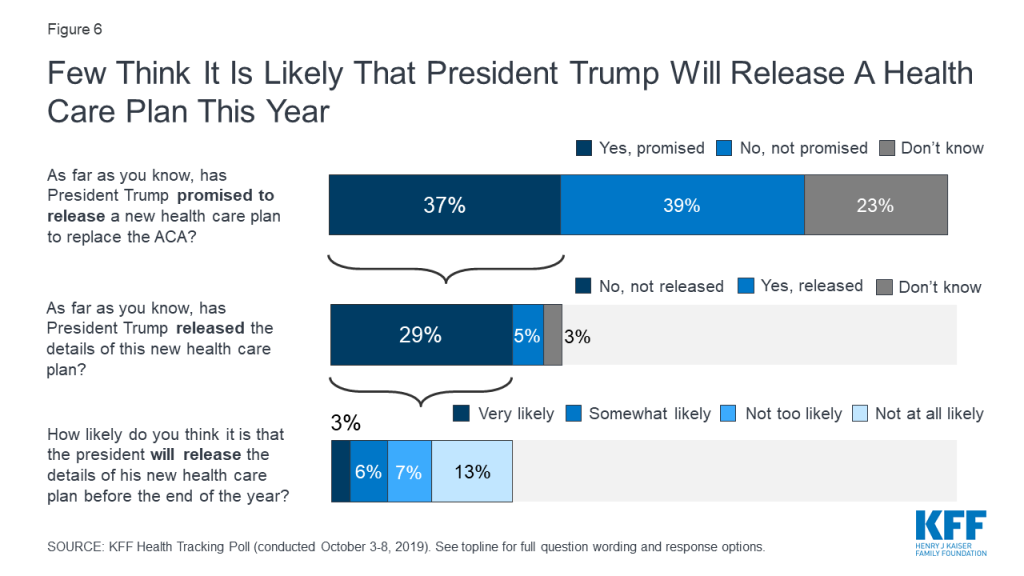
In March, President Trump stated that the Republican Party will become “the party of health care.”1  In April, he indicated that a Republican health care plan was forthcoming and that a vote would be planned following the 2020 election.2  Fewer than four in ten adults (37%) are aware that President Trump has promised to release a health care plan to replace the Affordable Care Act, while most say he has not promised to release a plan (39%) or they are unsure (23%). Notably, Republicans are more likely than Democrats and independents to know that President Trump has promised to release a health care plan to replace the ACA.

Figure 5: Most Are Unaware President Trump Has Promised To Release A Health Care Plan

About three in ten (29%) know that President Trump has promised to release a health care plan and that he has not yet released the details of his plan. Moreover, only 9% of adults think it is very or somewhat likely that Trump will release the details of his promised health care plan to replace the ACA by the end of the year.

Figure 6: Few Think It Is Likely That President Trump Will Release A Health Care Plan This Year

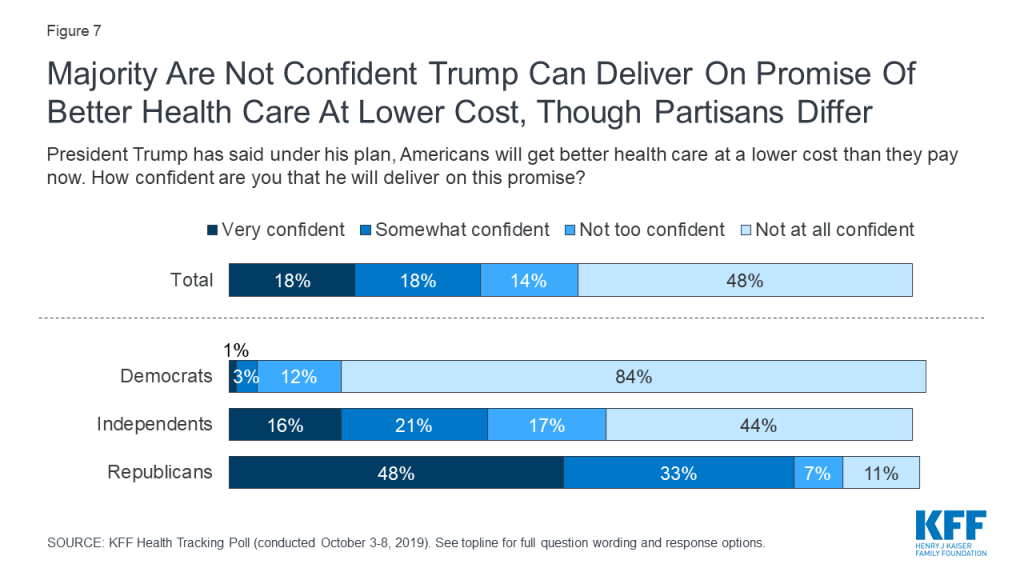
President Trump has stated that under his health care plan, Americans will get better health care at a lower cost than they currently pay3 . About three in ten adults are very or somewhat confident the President will deliver on his promise while a majority (62%) say they are not too confident or not at all confident. While most Republicans are either very confident (48%) or somewhat confident (33%) that President Trump will be able to deliver on his promise, majorities of Democrats and independents say they are not confident that the President will be able to deliver on this.

Figure 7: Majority Are Not Confident Trump Can Deliver On Promise Of Better Health Care At Lower Cost, Though Partisans Differ

Public More Likely To Trust Democratic Party On Health Care

When it comes to health care, the public continues to give the Democratic Party the edge over the Republican Party. Larger shares say they trust the Democrats than the Republicans when it comes to handling health care (44% vs. 29%), lowering the cost of prescription drugs (49% vs. 30%), determining the future of Medicare (47% vs. 35%), and making sure seniors on Medicare are able to get the health care they need (51% vs. 32%). Unsurprisingly, majorities of partisans trust their own party to do a better job on each of these issues. While independents are more likely to trust the Democratic Party than the Republican Party, nearly one third (32%) say they trust neither party when it comes to handling health care.

Figure 8: Public More Likely to Trust Democrats Than Republicans On Health Care, Medicare

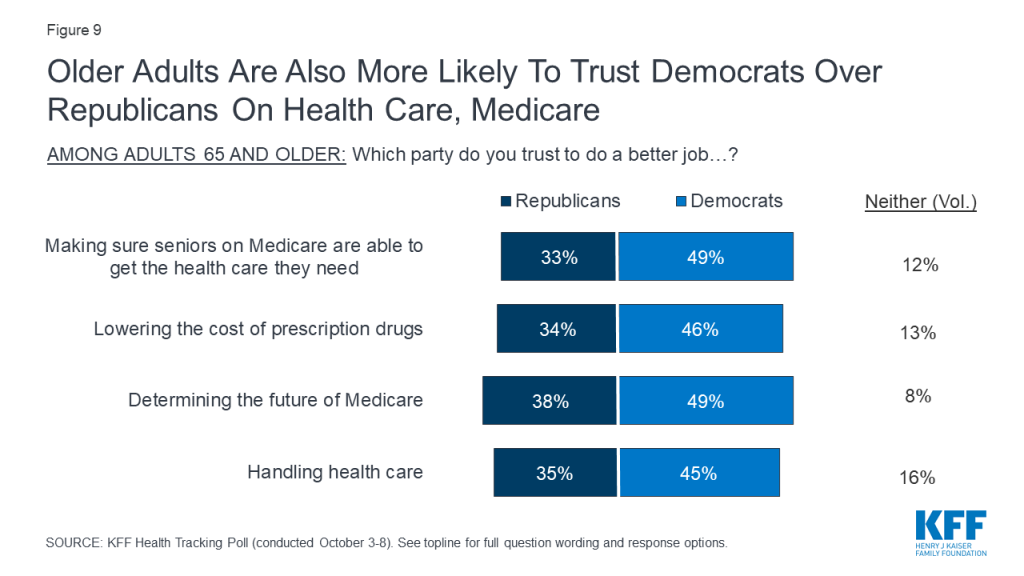
Despite President Trump’s health care speech in Florida earlier this month telling older adults that Democrats would harm their health care4 , those ages 65 and older are more likely to trust the Democratic Party than the Republican Party to do a better job handling health care (45% vs. 35%), making sure seniors are able to get the health care they need (49% vs. 33%), and lowering the cost of prescription drugs (46% vs. 34%).

Figure 9: Older Adults Are Also More Likely To Trust Democrats Over Republicans On Health Care, Medicare

Health Care And The Congress: Impeachment And Lowering Prescription Drug Prices

Public Divided On Whether Impeachment Will Prevent Congressional Action On Prescription Drugs, Surprise Bills

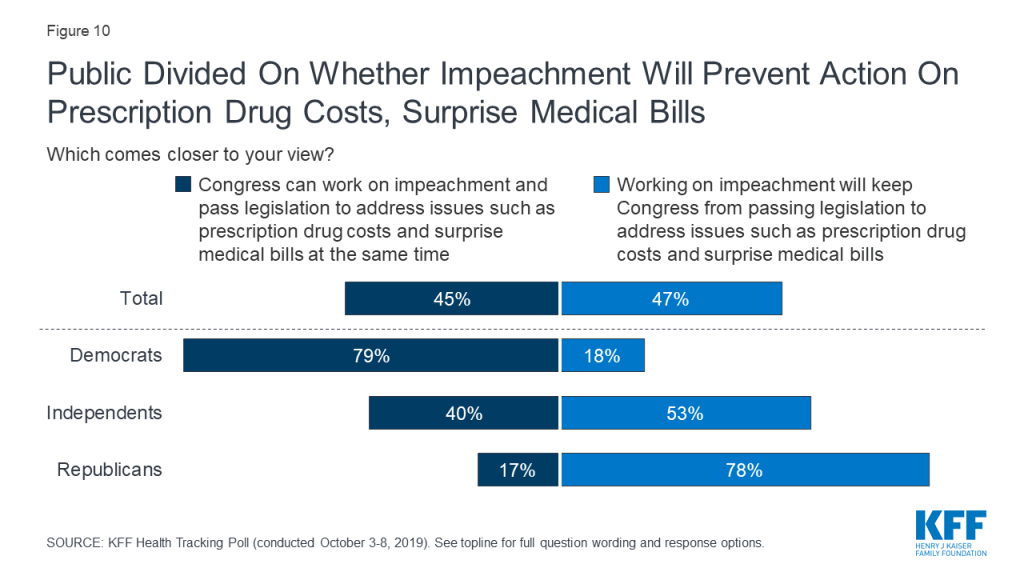
On September 24th, House Speaker Nancy Pelosi announced the House would begin a formal impeachment inquiry into President Trump. The public is divided on whether the recently launched impeachment investigation will keep Congress from addressing key health care issues. Forty-five percent of adults say Congress can work on impeachment and pass legislation to address issues such as prescription drug costs and surprise medical bills at the same time, while a similar proportion (47%) say impeachment will keep Congress from passing legislation to address these issues.

There are stark partisan differences, with nearly eight in ten Republicans (78%) saying impeachment will keep Congress from addressing health care issues while a similar share of Democrats (79%) say Congress can both work on impeachment and pass legislation at the same time. Independents are more likely to say that impeachment will keep Congress from passing legislation than to say they can do both (53% vs. 40%).

Figure 10: Public Divided On Whether Impeachment Will Prevent Action On Prescription Drug Costs, Surprise Medical Bills

Majorities Support Various Approaches To Lowering Drug Costs, But Support Is Malleable

KFF’s September Health Tracking Poll found that lowering prescription drug costs remain a priority for the public, with majorities across parties saying this was an important issue for Congress to address. This issue has been a focus of lawmakers, with hearings held in both the House and Senate, proposals put forward by the Trump administration, and most recently a prescription drug policy proposal unveiled by House Speaker Nancy Pelosi. About eight in ten Americans (78%) say the cost of prescription drugs is unreasonable and majorities favor most of policy options aimed at lowering the cost of prescription drugs included in this month’s survey.

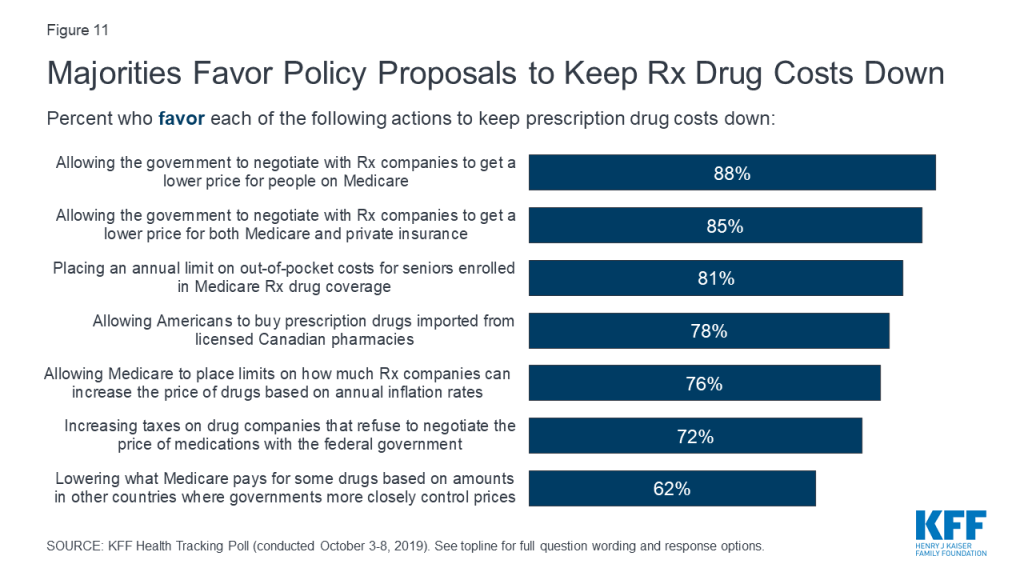
Nearly nine in ten Americans favor allowing the federal government to negotiate with drug companies to get a lower price on medications for people on Medicare (88%). A similar proportion favor allowing the federal government to negotiate prices with drug companies that would apply to both Medicare and private insurance (85%). Both of these policy proposals are supported by large majorities of Democrats, independents, and Republicans. Moreover, seven in ten adults (72%) favor increasing taxes on drug companies that refuse to negotiate with the federal government, including majorities of Democrats (79%), independents (71%), and Republicans (69%).

Figure 11: Majorities Favor Policy Proposals to Keep Rx Drug Costs Down

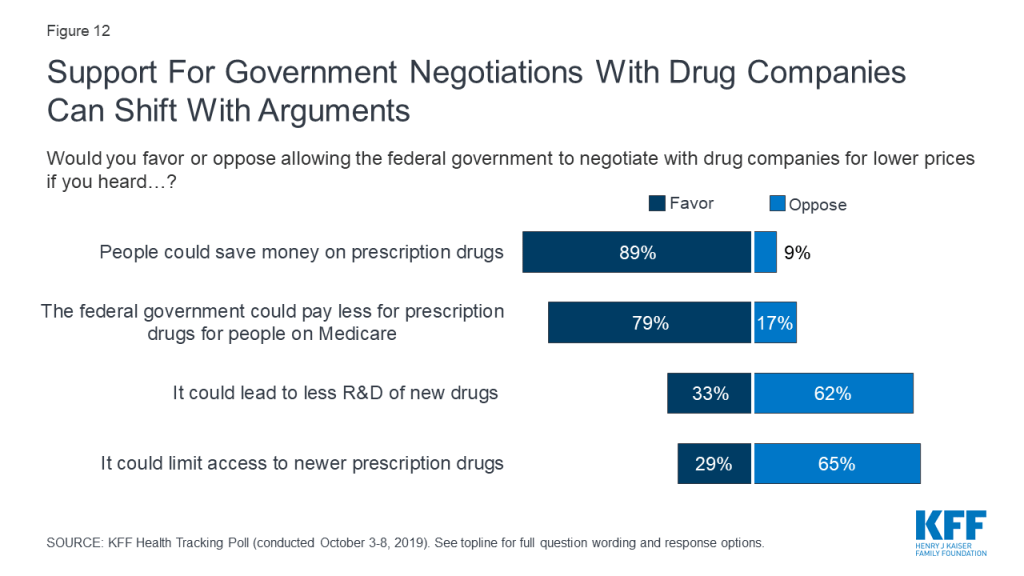
While allowing the federal government to negotiate prices with prescription drug companies is a popular policy proposal, attitudes can shift after hearing potential arguments that have been made both in favor and against the proposal. Support for government negotiations is 89% after hearing the argument that this could help people save money on their prescription drugs. In contrast, opposition is as high as two-thirds after hearing the argument that allowing government negotiation could limit access to new prescription drugs. It is important to note that these arguments do not include specific details about different approaches and constraints that could be imposed on potential negotiations, details of which may influence the public’s attitudes.

Figure 12: Support For Government Negotiations With Drug Companies Can Shift With Arguments

Other proposals aimed at lowering prescription drug costs are also popular among the public. At least three in four favor allowing Medicare to place limits on how much drug companies can increase the price of drugs every year based on annual inflation rates (76%), allowing Americans to buy drugs imported from licensed Canadian pharmacies (78%), and placing an annual limit on out-of-pocket costs for seniors enrolled in Medicare prescription drug coverage (81%). About six in ten (62%) favor lowering what Medicare pays based on amounts paid in other countries where governments more closely control prices. Notably, majorities of Democrats, Republicans and independents favor each of these proposals.

The ACA And The Courts

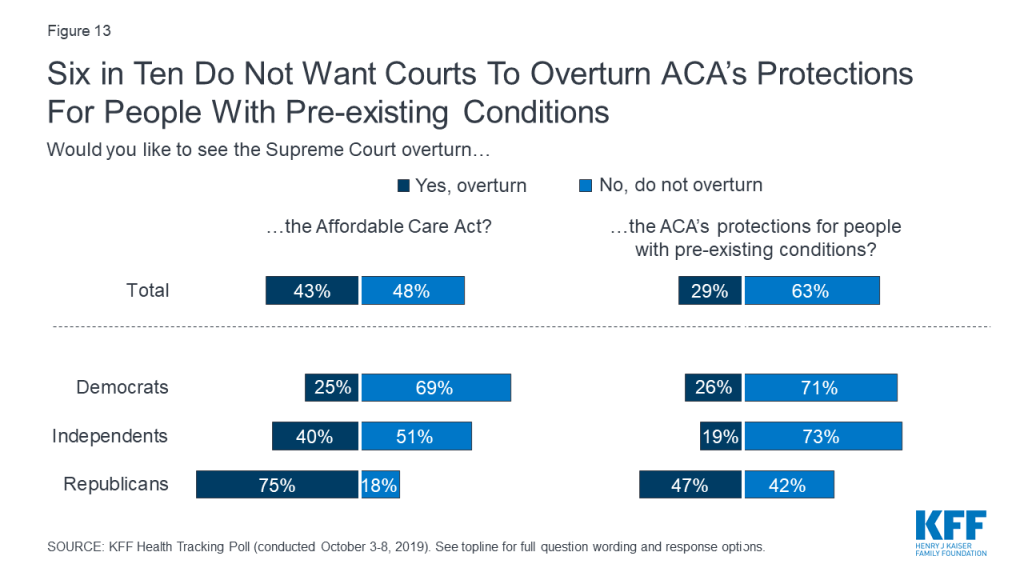
In December 2018, a federal district court judge in Texas issued a ruling siding with Republican state attorneys general that declared the Affordable Care Act invalid since Congress zeroed out the penalty for not having health insurance. In March 2019, the Trump administration filed a brief stating that the administration supports the federal judge’s ruling that all of the ACA is invalid. The Trump administration had previously stated that as part of the lawsuit known as Texas v. United States, it will no longer defend the ACA’s protections for people with pre-existing medical conditions.

Overall, 63% of the public do not want to see the Supreme Court overturn the ACA’s pre-existing condition protections; yet the public is more divided on whether they want the Court to overturn the entire law (43% would like to see it overturned and 48% would not). While about seven in ten Democrats and about half of independents do not want to see the 2010 health care law overturned, three in four Republicans say they would like to see the courts overturn the law. However, fewer than half of Republicans (47%) want to see the ACA’s protections for people with pre-existing conditions overturned.

Figure 13: Six in Ten Do Not Want Courts To Overturn ACA’s Protections For People With Pre-existing Conditions

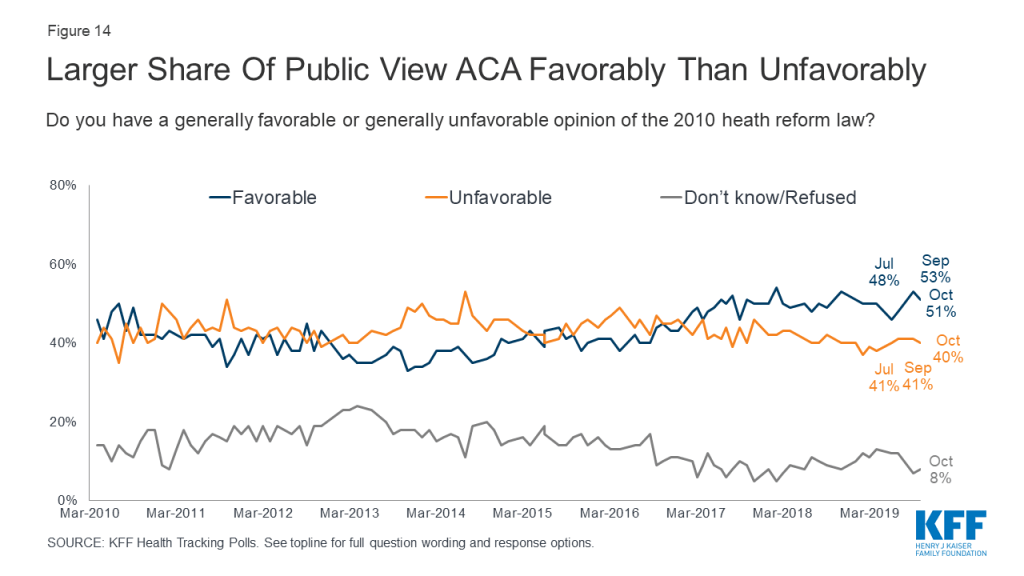
Overall opinions of the Affordable Care Act have remained relatively unchanged for the past two years since the Republican efforts to repeal the law. Half of the public (51%) this month hold favorable opinions of the ACA while four in ten hold a negative opinion of the law. The public still holds largely partisan views of the ACA as eight in ten Democrats (81%) have a favorable view of the ACA compared to half of independents (51%) and about one-sixth of Republicans (15%).

Figure 14: Larger Share Of Public View ACA Favorably Than Unfavorably

Methodology

This KFF Health Tracking Poll was designed and analyzed by public opinion researchers at the Kaiser Family Foundation (KFF). The survey was conducted October 3rd – 8th 2019, among a nationally representative random digit dial telephone sample of 1,205 adults ages 18 and older, living in the United States, including Alaska and Hawaii (note: persons without a telephone could not be included in the random selection process). The sample included 290 respondents reached by calling back respondents that had previously completed an interview on the KFF Tracking poll at least nine months ago. Computer-assisted telephone interviews conducted by landline (300) and cell phone (905, including 623 who had no landline telephone) were carried out in English and Spanish by SSRS of Glen Mills, PA. To efficiently obtain a sample of lower-income and non-White respondents, the sample also included an oversample of prepaid (pay-as-you-go) telephone numbers (25% of the cell phone sample consisted of prepaid numbers) as well as a subsample of respondents who had previously completed Spanish language interviews on the SSRS Omnibus poll (n=10). Both the random digit dial landline and cell phone samples were provided by Marketing Systems Group (MSG). For the landline sample, respondents were selected by asking for the youngest adult male or female currently at home based on a random rotation. If no one of that gender was available, interviewers asked to speak with the youngest adult of the opposite gender. For the cell phone sample, interviews were conducted with the adult who answered the phone. KFF paid for all costs associated with the survey.

The combined landline and cell phone sample was weighted to balance the sample demographics to match estimates for the national population using data from the Census Bureau’s 2017 American Community Survey (ACS) on sex, age, education, race, Hispanic origin, and region along with data from the 2010 Census on population density. The sample was also weighted to match current patterns of telephone use using data from the July-December 2018 National Health Interview Survey. The weight takes into account the fact that respondents with both a landline and cell phone have a higher probability of selection in the combined sample and also adjusts for the household size for the landline sample, and design modifications, namely, the oversampling of prepaid cell phones and likelihood of non-response for the re-contacted sample. All statistical tests of significance account for the effect of weighting.

The margin of sampling error including the design effect for the full sample is plus or minus 3 percentage points. Numbers of respondents and margins of sampling error for key subgroups are shown in the table below. For results based on other subgroups, the margin of sampling error may be higher. Sample sizes and margins of sampling error for other subgroups are available by request. Note that sampling error is only one of many potential sources of error in this or any other public opinion poll. Kaiser Family Foundation public opinion and survey research is a charter member of the Transparency Initiative of the American Association for Public Opinion Research.

GroupN (unweighted)M.O.S.E.
Total1,205±3 percentage points
Party Identification
Democrats355±6 percentage points
Republicans301±7 percentage points
Independents447±6 percentage points
Democrats/Democratic-leaning independents/Independents with no leaning659±5 percentage points
Democrats and Democratic-leaning independents564±5 percentage points

Endnotes

  1. Sanger-Katz, M. (2019, October). Trump Is Being Vague About What He Wants to Replace Obamacare. But There Are Clues. The New York Times. https://www.nytimes.com/2019/04/05/upshot/trump-replacing-obamacare-insurance.html ↩︎
  2. Sanger-Katz, M. (2019, October). Trump Is Being Vague About What He Wants to Replace Obamacare. But There Are Clues. The New York Times. https://www.nytimes.com/2019/04/05/upshot/trump-replacing-obamacare-insurance.html ↩︎
  3. Transcript: ABC News’ George Stephanopoulos’ exclusive interview with President Trump. (2019, June). ABC News https://abcnews.go.com/Politics/transcript-abc-news-george-stephanopoulos-exclusive-interview-president/story?id=63749144 ↩︎
  4. Olorunnipa, T., Goldstein, A. (2019, October). Trump attacks Democrats’ health care plans and pledges to protect Medicare during political speech to Florida retirees. The Washington Post. https://www.washingtonpost.com/health/trump-to-expand-private-sector-version-of-medicare/2019/10/03/cd7b15aa-e562-11e9-b403-f738899982d2_story.html   ↩︎
News Release

Poll: Democrats Say They Are Hearing Enough From Presidential Candidates About Medicare-for-All and Expanding Coverage, But Want Them to Talk More about Health Costs and Women’s Health Care

More Seniors Trust Democrats than Republicans on Medicare, Drug Costs and Other Health Issues; Large Majority of Public Initially Favors Government Drug Price Negotiations, But Counterarguments Dampen Support

Published: Oct 15, 2019

Heading into tonight’s Democratic primary debate, most Democrats and Democratic-leaning independents say the candidates are spending the right amount or too much time talking about ways to provide coverage to more Americans and Medicare-for-all, two topics that have dominated health care discussions in the past three rounds of Democratic debates, the latest KFF Health Tracking Poll finds.

In contrast, large shares of Democrats and Democratic-leaning independents say that the presidential candidates are spending too little time on other health care issues such as women’s health care, including reproductive health services (58%), surprise medical bills (52%), and lowering the amount people pay for health care (50%).

Medicare-for-all and other approaches to expand public coverage have gotten substantial attention at prior debates, and critics have focused their attacks on Medicare-for-all, which would create a single government health plan that would cover all Americans.

Amidst this attention, the new poll finds about half (51%) of the public now favors a Medicare-for-all plan, down 5 percentage points since April. Nearly as many (47%) now oppose a Medicare-for-all plan, up significantly since April (38%).

The poll also finds more than seven in 10 (73%) now favor a government-run “public option” plan available to all Americans that would compete with private health insurers, while one in four (24%) are opposed.

More Americans, Including Seniors, Trust Democrats than Republicans on Health Care

President Trump warned seniors in an Oct. 3 speech in Florida that Democrats would harm their health care. Fielded after the President’s speech, the poll finds more seniors trust the Democratic Party than the Republican Party on health care overall (45% v. 35%), as well as on making sure seniors can get needed care (49% v. 33%), and lowering drug costs (46% v. 34%).

The broader public also trust Democrats more than Republicans on health care overall (44% v. 29%), as well as on the future of Medicare (47% v. 35%), making sure seniors can get needed care (51% v. 32%), and lowering drug costs (49% v. 30%).

Not surprisingly, majorities of partisans trust their own party to do a better job on each of these issues. Independents are more likely to trust the Democrats than Republicans, though about a third (32%) say they don’t trust either party when it comes to handling health care.

Large Majorities across Parties Favor Government Negotiations to Lower Drug Prices, Though Counterarguments Significantly Dampen Support

As Congress weighs options to lower what people pay for prescription drugs, large majorities continue to favor a range of actions, including allowing the government to negotiate with drug companies to get a lower price for people with Medicare (88%), or for both people with Medicare and private insurance (85%). This includes large majorities of Democrats, Republicans and independents.

About seven in 10 (72%) – including a similar share of Republicans (69%) also favor increasing taxes on drug companies that refuse to negotiate with the government.

The poll also tests common arguments made for and against allowing the federal government to negotiate with drug companies to obtain lower prices and finds that some arguments can significantly affect public support.

For example, two thirds (65%) say they oppose government negotiations after hearing the argument that it could limit access to new prescription drugs, and nearly as many (62%) oppose it after hearing it could lead to less research and development of new drugs. On the flip side, support is as high as 89% when people are told that government negotiations could help people save on their drug costs.

Other proposals aimed at lowering prescription drug costs are also popular, including: placing an annual limit on out-of-pocket costs for seniors in Medicare drug plans (81%); allowing Americans to buy drugs imported from licensed Canadian pharmacies (78%); allowing Medicare to limit drug companies’ price increases based on annual inflation rates (76%); and setting Medicare prices based on prices in other countries with more government control (62%). Majorities of Democrats, independents and Republicans favor each of these options.

The public is divided on whether Congress can pass legislation on issues such as drug costs and surprise medical bills at the same time it is working on impeachment, with nearly equal shares saying Congress can do both (45%) as saying impeachment will prevent action on those issues (47%). Most Republicans (78%) and just over half of independents (53%) say impeachment will keep Congress from passing such legislation, while most Democrats (79%) say Congress can do both.

Nearly Two Thirds of the Public Do Not Want the Courts to Overturn the ACA’s Pre-Existing Condition Protections, Though Nearly Half of Republicans Do

The poll also looks at the public’s views on a pending court case that could overturn all or parts of the Affordable Care Act. A federal judge in Texas last year ruled in favor of conservative state attorneys general that the entire law was invalid since Congress zeroed out the penalty. The Trump Administration subsequently expressed its support for eliminating the entire ACA, including the provisions that prevent insurance companies from discriminating against people with pre-existing conditions. An appeals court is now weighing its decision in the case, and the results could eventually end up before the Supreme Court.

The poll finds the public narrowly divided on whether the Supreme Court should overturn the entire ACA, with 43% favoring such a decision and 48% opposing it. This reflects partisan views of the law itself, with most Republicans (75%) wanting it overturned, most Democrats (69%) wanting to keep it, and independents falling in between (51% want to keep it, 40% want it overturned).

At the same time, most (63%) do not want to see the Supreme Court overturn the law’s protections for people with pre-existing condition protections. This includes most Democrats (71%) and independents (73%). Among Republicans, 47% say they want the court to overturn those protections and 42% say they do not.

The poll finds half (51%) of the public views the ACA favorably this month, while 40% view it unfavorably. The split is similar to other KFF polls over the past two years since President Trump and Republicans in Congress attempted to repeal the 2010 law.

Designed and analyzed by public opinion researchers at KFF, the poll was conducted October 3-8, 2019 among a nationally representative random digit dial telephone sample of 1,205 adults. Interviews were conducted in English and Spanish by landline (300) and cell phone (905). The margin of sampling error is plus or minus 3 percentage points for the full sample. For results based on subgroups, the margin of sampling error may be higher.

News Release

Medicare Part D Beneficiaries Who Reach the Catastrophic Coverage Limit Can Expect to Pay More Out-of-Pocket for Their Prescription Drugs Next Year

Published: Oct 11, 2019

Medicare Part D enrollees with relatively high out-of-pocket expenses can expect see their costs rise in 2020, according to a new KFF analysis. This is mainly due to an increase in how much enrollees will pay out of pocket for their prescription drugs in the Part D benefit coverage gap phase before they qualify for catastrophic coverage.

The analysis finds that out-of-pocket drug costs will increase by nearly $400 — from $2,275 in 2019 to $2,652 in 2020 — for Part D enrollees who take only brand-name drugs and have annual total drug costs that reach the catastrophic coverage threshold.

Between 2019 and 2020, this catastrophic threshold will increase by $1,250, or nearly 25 percent, rising from $5,100 in 2019 to $6,350 in 2020.

For enrollees who take only brand-name drugs, about a quarter of this increase will be paid out-of-pocket, with the remainder covered by drug manufacturers in the form of a price discount for brands in the coverage gap phase. Those who take only generics will pay the entire increase out-of-pocket. The relatively large increase in 2020 is due to the expiration of the Affordable Care Act (ACA) provision that slowed the growth rate in the catastrophic threshold between 2014 and 2019.

In 2017, the most recent year for which claims data is available, 4.9 million enrollees who were not eligible for low-income subsidies reached the Part D coverage gap, including 1 million who reached the catastrophic threshold. Had the threshold been higher in 2017, fewer than 1 million enrollees would have qualified for catastrophic coverage that year, meaning a larger number of enrollees would have remained in the coverage gap in 2017, where they pay a larger share of their total costs than in the catastrophic phase.

The analysis of higher out-of-pocket costs that Part D enrollees will face in 2020 comes at a time when lawmakers in Congress are considering proposals to address concerns about prescription drug costs. Proposals from the Senate Finance Committee, Speaker Pelosi, and the Trump Administration each include changes to the standard Medicare Part D benefit, including a hard cap on out-of-pocket costs for Part D enrollees and a reallocation of liability above the catastrophic threshold.

How Will The Medicare Part D Benefit Change Under Current Law and Leading Proposals?

Published: Oct 11, 2019

Since 2006, Medicare beneficiaries have had access to prescription drug coverage through Part D, where private plan sponsors contract with Medicare to provide the drug benefit. In recent years, policymakers have expressed concerns about the absence of a hard cap on out-of-pocket spending for Part D enrollees, the significant increase in Medicare spending for enrollees with high drug costs, and the relatively weak financial incentives faced by Part D plan sponsors to control high drug costs. Recent proposals aim to address these concerns, including the Trump Administration’s Fiscal Year 2020 budget, the bipartisan prescription drug bill passed by the Senate Finance Committee, and H.R.3, the prescription drug bill recently announced by Speaker Pelosi (D-CA). This brief describes how the Medicare Part D benefit will change in 2020 under current law and proposed changes that would affect what beneficiaries, plans, manufacturers, and Medicare pay for drug costs under Part D in the future.

How Are Total Drug Costs Under Part D Divided Up?

The Medicare Part D standard benefit has different phases where enrollees, Part D plan sponsors, drug manufacturers, and Medicare pay varying shares of total drug costs. These phases include a deductible, an initial coverage phase, a coverage gap phase (once known as the “doughnut hole”), and catastrophic coverage (Figure 1). The allocation of costs in each benefit phase was spelled out in the Medicare Modernization Act of 2003 (the law establishing the Part D program), and has been modified through subsequent legislation.

Figure 1: The Medicare Part D Standard Benefit Parameters Will Increase in 2020
  • In the deductible phase, Part D enrollees who do not receive low-income subsidies (LIS) pay 100% of their drug costs.
  • After the deductible, in the initial coverage phase, enrollees pay 25% and Part D plans pay 75%.
  • After reaching the initial coverage limit but before reaching the catastrophic threshold:
    • For brand-name drugs, enrollees pay 25% of drug costs, plans pay 5%, and drug manufacturers provide a 70% price discount.
    • For generic drugs, enrollees pay 37% of drug costs and plans pay 63% in 2019.
  • When enrollees’ annual out-of-pocket spending—including what they pay directly and the value of the manufacturer discount on brand-name drugs in the coverage gap—exceeds the catastrophic coverage threshold, they pay 5% of their total drug costs, plans pay 15%, and Medicare pays 80%.

Originally, non-LIS Part D enrollees were responsible for paying 100% of their total drug costs in the coverage gap phase. The Affordable Care Act (ACA) included provisions to phase out the coverage gap by 2020 by gradually reducing the share of total drug costs paid by non-LIS enrollees to 25%, requiring drug manufacturers to provide a 50% discount on the price of brand-name drugs, and increasing the share of total drug costs paid by plans to 25% for brands and 75% for generics. The Bipartisan Budget Act of 2018 (BBA) made additional changes to expedite the closing of the coverage gap, beginning in 2019, by reducing beneficiary coinsurance for brands from 30% to 25% in 2019, increasing the manufacturer discount from 50% to 70%, and reducing plans’ share of costs for brand from 25% to 5%.

What’s Changing in Part D for 2020 Under Current Law?

In 2020, Medicare Part D enrollees are facing a relatively large increase in out-of-pocket drug costs before they qualify for catastrophic coverage (Figure 2). This is due to the expiration of the ACA provision that constrained the growth in out-of-pocket costs for Part D enrollees by slowing the growth rate in the catastrophic threshold between 2014 and 2019; in 2020 and beyond, the threshold will revert to the level that it would have been using the pre-ACA growth rate calculation. For 2020, the out-of-pocket spending threshold will increase by $1,250, from $5,100 to $6,350.

Figure 2: The ACA Slowed the Growth Rate in the Annual Out-of-Pocket Threshold Between 2014 and 2019; in 2020, the Threshold Will Increase by $1,250

Part D enrollees will also face higher out-of-pocket costs in 2020 for the deductible and in the initial coverage phase, as they have in prior years. The standard deductible is increasing from $415 in 2019 to $435 in 2020, while the initial coverage limit is increasing from $3,820 in 2019 to $4,020 in 2020. For costs in the coverage gap phase, beneficiaries will pay 25% for both brand-name and generic drugs, with plans paying the remaining 75% of generic drug costs—which means that, effective in 2020, the Part D coverage gap will be fully phased out.

For non-LIS Part D enrollees who take only brand-name drugs and whose annual total drug costs reach the catastrophic coverage limit, these changes in the Part D benefit amounts will increase their annual out-of-pocket costs. Costs for Part D plan sponsors and drug manufacturers will also increase in dollar terms—but in terms of the share of total drug costs up to the catastrophic threshold, Part D plan sponsors will pay a smaller share in 2020 than in 2019, while manufacturers will pay a larger share (Figure 3).

Figure 3: Part D Plans Will Pay a Smaller Share of Total Drug Costs Up to the Catastrophic Threshold in 2020 Than in 2019
  • Part D enrollees who takes only brand-name drugs and have annual total drug costs that reach the catastrophic coverage limit, will pay nearly $400 more in 2020 than in 2019, from $2,275 in 2019 to $2,652 in 2020. This includes a $20 increase in the deductible, a $45 increase in costs in the initial coverage phase, and a $312 increase in out-of-pocket costs in the coverage gap phase. (Enrollees who take only generic drugs will pay the entire $1,250 increase out-of-pocket.)
  • Part D plans will pay a smaller share of total drug costs up to the catastrophic threshold for enrollees who take only brands in 2020 (32%) than in 2019 (35%) due to the increase in the out-of-pocket threshold in 2020 and the reduction in plan liability for brand-name drug costs in the coverage gap which took effect in 2019. The actual dollar increase in liability for total drug costs in 2020 is smaller for Part D plan sponsors ($197) than for Part D enrollees themselves ($377).
  • Drug manufacturers will be responsible for a larger share of total drug costs up to the catastrophic threshold in 2020 (40%) than in 2019 (36%) because of the 70% discount on the price of brand-name drugs in the coverage gap benefit phase, the amount of which will increase due to the higher out-of-pocket threshold for 2020. The actual dollar increase in total annual covered drug costs will be significantly larger for drug manufacturers ($873) than for Part D plan sponsors ($197).

Under current law, Part D plan liability for drug costs are expected to rise (in dollars) during the coverage gap phase, but their liability for catastrophic coverage could potentially decline. The increase in plan liability during the coverage gap phase is due to the increase in the out-of-pocket spending threshold, which means plans will pay 5% of total drug costs in that phase over a much longer span in 2020 than in 2019. This change, alone would increase premiums to the extent that it increases plan liability. However, the majority of Part D enrollees do not have drug costs high enough to reach the coverage gap phase, and because fewer enrollees are expected to qualify for catastrophic coverage in 2020 (where plans pay 15% of total drug costs), total plan costs could go down, on net, which would result in lower premiums.

How Many Part D Enrollees Could Be Affected By These Changes?

While there are no precise estimates of the number of Part D enrollees who will be affected by the increase in the out-of-pocket threshold for 2020, the increase will directly affect Part D enrollees with very high out-of-pocket drug costs. In 2017 (the most current year of Part D claims data available), 4.9 million non-LIS enrollees reached the coverage gap phase; of that total, 1 million non-LIS enrollees had out-of-pocket drug costs that exceeded the catastrophic threshold (Figure 4). Had the threshold been higher in 2017, fewer than 1 million enrollees would have qualified for catastrophic coverage that year. This means that a larger number of enrollees would have remained in the coverage gap in 2017, where they pay a larger share of their total costs than in the catastrophic phase.

Figure 4: A Small Share of Medicare Part D Enrollees Had High Out-of-Pocket Drug Costs in 2017

Proposed Changes to the Medicare Part D Benefit Design

Lawmakers have introduced several proposals to address concerns about the lack of a hard cap on out-of-pocket spending for Part D enrollees and the significant increase in Medicare spending for catastrophic coverage in recent years, by adding a cap on out-of-pocket drug costs and shifting more of the responsibility for catastrophic coverage costs to Part D plans and drug manufacturers (Figure 5).

Figure 5: Comparison of Proposals to Modify the Allocation of Catastrophic Coverage Costs Under Medicare Part D

In its FY 2020 budget, the Trump Administration proposed establishing an out-of-pocket spending limit in Part D by phasing down beneficiary coinsurance in the catastrophic phase from 5% to 0% over four years, beginning in 2020. The Administration also proposed to increase Part D plans’ share of catastrophic coverage costs from 15% to 80%, and decrease Medicare’s share from 80% to 20%.

In July 2019, the Senate Finance Committee approved legislation that includes a proposal to establish a cap on out-of-pocket drug spending under Part D and reallocate liability for costs above the catastrophic threshold, as part of a larger package of drug price proposals. The cap on beneficiary out-of-pocket spending would be set at $3,100 in 2022. For costs above the catastrophic threshold, the proposal reduces Medicare payments from 80% to 20%, increases plans’ share from 15% to 60%, and requires drug manufacturers to pay 20%, instead of providing discounts in the coverage gap, which would be phased out. The proposed changes to the Medicare benefit design would be phased in over a three-year period, from 2022 to 2024.

In September 2019, Speaker Nancy Pelosi (D-CA) announced legislation that includes a proposal to restructure the Part D benefit, among other provisions. This proposal would establish a hard cap on out-of-pocket spending that would initially be set at $2,000. For costs above the catastrophic threshold, the proposal reduces Medicare payments from 80% to 20%, increases plans’ share from 15% to 50%, and requires drug manufacturers to pay 30%. In addition, the House proposal would also phase out the coverage gap and modify the allocation of costs in the initial coverage phase, by requiring manufacturers to pay 10% of costs. The proposed changes would take effect in 2022.

Conclusion

In the absence of a change in law, Medicare Part D enrollees can expect to face an increase in their out-of-pocket drug costs in 2020. Costs for Part D plan sponsors and drug manufacturers will also increase in dollar terms—but in terms of the share of total drug costs up to the catastrophic threshold, Part D plan sponsors will pay a smaller share in 2020 than in 2019, while manufacturers will pay a larger share. These changes are also likely to affect Part D premiums in 2020 and future years.

Proposed changes to the Part D benefit design would help to mitigate out-of-pocket drug cost increases for Medicare beneficiaries, particularly for those with high drug costs who currently face no limit in their annual out-of-pocket expenses, with Part D plan sponsors and drug manufacturers potentially picking up much of the additional cost.

President Trump’s Proclamation Suspending Entry for Immigrants without Health Coverage

Published: Oct 10, 2019

Introduction

On October 4, 2019, President Trump released a proclamation suspending entry of immigrants into the United States unless they provide proof of health insurance within 30 days of entry or have financial resources to pay for reasonably foreseeable health insurance costs. The proclamation indicates that the suspension is necessary to protect the health care system and taxpayers from uncompensated care costs. This brief provides an overview of the proclamation and data on health coverage and health care use for immigrants.

Overview of Proclamation

Effective November 3, 2019, the proclamation would suspend entry of immigrants unless they can prove they will be covered by approved health insurance within 30 days of entry into the U.S. or that they have financial resources to pay for reasonably foreseeable medical costs.

Approved health coverage. Under the proclamation, approved health insurance would include employer-sponsored and other private coverage, including unsubsidized coverage through the ACA Marketplaces, short-term plans, traveler plans, or catastrophic plans. Subsidized Marketplace coverage and Medicaid coverage for adults would not count as approved coverage. State or local programs and other programs, like Ryan White, are also not included as approved coverage in the proclamation.

Individuals subject to suspension. The suspension would apply to individuals seeking an immigrant visa on or after November 3, 2019. The new requirement would primarily affect family-based immigrants. It would not apply to refugees, asylees, people entering as non-immigrants, and certain other groups. Children under age 18 are subject to suspension if they are traveling with a parent who is also subject to the suspension.

Individuals subject to the proclamation will need to establish that they meet its requirements to the satisfaction of a consular officer before an immigrant visa is issued. The proclamation indicates that the Secretary of State may establish standards and procedures for these determinations.

An earlier regulation from the Trump administration made changes to public charge policies that will make it harder for immigrants to adjust to lawful permanent resident status or get a green card if they are low-income, sick, or likely to enroll in Medicaid. It is likely that the confusion and chilling effect surrounding the regulation will lead to declines in Medicaid and CHIP coverage among immigrant families beyond those directly affected by the changes and increase the uninsured rate among immigrant families.

Health Coverage and Health Care for Immigrants

In 2017, there were 22 million noncitizens residing in the United States, accounting for about 7% of the total U.S. population.1  About six in ten noncitizens were estimated to be lawfully present immigrants, while the remaining four in ten were estimated to be undocumented immigrants:2  Many individuals live in mixed immigration status families that may include lawfully present immigrants, undocumented immigrants, and/or citizens.

Noncitizens are more likely to be uninsured than citizens, but citizens account for the majority of the total uninsured. Noncitizens, including lawfully present and undocumented immigrants, are significantly more likely to be uninsured than citizens, reflecting limited eligibility for coverage options and enrollment barriers. As of 2017, among the total nonelderly population, 23% of estimated lawfully present immigrants and more than four in ten (45%) estimated undocumented immigrants were uninsured compared to fewer than one in ten (8%) citizens (Figure 1). Despite the higher uninsured rate among noncitizens, citizens still accounted for three-quarters of the total 27.4 million uninsured.

Figure 1: Uninsured Rates and Distribution of the Uninsured among the Nonelderly Population by Immigration Status, 2017

The higher uninsured rates among noncitizens reflect limited access to employer-sponsored coverage; eligibility restrictions for Medicaid, CHIP, and ACA Marketplace coverage; and barriers to enrollment among eligible individuals.

  • Although most nonelderly noncitizens live in a family with a full-time worker, they face gaps in access to private coverage. Nonelderly noncitizens are more likely than nonelderly citizens to live in a family with at least one full-time worker, but they also are more likely to be low-income (Figure 2). They have lower incomes because they are often employed in low-wage jobs, and they work in industries that are less likely to offer employer-sponsored coverage. Further, given their lower incomes, noncitizens face increased challenges affording employer-sponsored coverage when it is available or purchasing coverage through the individual market.
Figure 2: Employment and Income among the Nonelderly Population by Citizenship Status, 2017
  • Lawfully present immigrants may qualify for Medicaid and CHIP but are subject to certain eligibility restrictions. In general, lawfully present immigrants must have a “qualified” immigration status to be eligible for Medicaid or CHIP and many, including most LPRs or “green card” holders, must wait five years after obtaining qualified status before they may enroll. States have an option to eliminate the five-year wait for lawfully residing immigrant children and pregnant women, and half of states (24) apply the option to both children and pregnant women, while ten states use it for children only, and one state (Wyoming) uses it only for pregnant women.3  Lawfully present immigrants can purchase coverage through the ACA Marketplaces and may receive subsidies for this coverage within the five-year waiting period. Undocumented immigrants are not eligible to enroll in Medicaid or CHIP or to purchase coverage through the ACA Marketplaces.
  • Many lawfully present immigrants who are eligible for coverage remain uninsured because immigrant families face a range of enrollment barriers, including fear, confusion about eligibility policies, difficulty navigating the enrollment process, and language and literacy challenges.

Research shows immigrants tend to be younger and healthier and to use less health care than U.S born individuals. Data show that immigrants spend less on health care, compared to their U.S. born counterparts, and make larger out-of-pocket health care payments compared to nonimmigrants.4  Immigrants have lower spending, in part, because they use less care due to their low coverage rates and limited access to care.5  They also tend to be younger and healthier than nonimmigrants, although this health difference decreases over time as immigrants spend longer in the United States.6 

Though uninsured people are less likely to access care than those with coverage, when they do seek care they are typically billed for these services. Most uninsured people do not receive health services for free or at reduced charge, and many are asked to pay in full up front before they receive care.7  As a result, when uninsured people use care, they are at risk of incurring medical debt. Like other uninsured individuals, many immigrants without coverage can obtain low-cost care through community health centers. Moreover, under federal law, hospitals are required to screen and stabilize every patient who seeks emergency care.

Some of the cost of care for uninsured people is converted to uncompensated care for providers, but uncompensated care costs have declined in recent years and immigrants likely account for a small share of uncompensated care costs. When uninsured people are unable to pay their bills, providers absorb some of the cost of care for the uninsured. Some uncompensated care is offset by private or public programs specifically for this purpose. In recent years, uncompensated care costs have declined due to coverage expansions under the Affordable Care Act (ACA).8  Further, there is limited evidence that uncompensated care for uninsured patients is associated with hospitals charging higher prices for those who are privately insured.9  Given that immigrants account for a small share of the total uninsured population and that they use less care compared to the U.S. born, they likely account for a small share of total uncompensated care costs.

  1. Kaiser Family Foundation analysis of 2017 American Community Survey (ACS), 1-Year Estimates. ↩︎
  2. The estimate of the total number of non-citizens in the US is based on the 2017 American Community Survey (ACS). The ACS does not include a direct measure of whether a non-citizen has legal status or not. We impute documentation status by drawing on methods underlying the 2013 analysis by the State Health Access Data Assistance Center (SHADAC) and the recommendations made by Van Hook et. al.. This approach uses the second wave of the 2008 Survey of Income and Program Participation (SIPP) to develop a model that predicts immigration status for each person in the sample; it then applies the model to a second data source, controlling to state-level estimates of total undocumented population as well as the undocumented population in the labor force from the Pew Research Center. See, “U.S. Unauthorized Immigrant Total Dips to Lowest Level in Decade,” available here: http://www.pewhispanic.org/2018/11/27/u-s-unauthorized-immigrant-total-dips-to-lowest-level-in-a-decade/. ↩︎
  3. Tricia Brooks, Lauren Roygardner, and Samantha Artiga. Medicaid and CHIP Eligibility, Enrollment, and Cost Sharing Policies as of January 2019: Findings from a 50-State Survey. (Washington, DC: The Kaiser Family Foundation, 2019), https://modern.kff.org/report-section/medicaid-and-chip-eligibility-enrollment-and-cost-sharing-policies-as-of-january-2019-findings-from-a-50-state-survey-medicaid-and-chip-eligibility/ ↩︎
  4. Lila Flavin, Leah Zallman, Danny McCormick, and J. Wesley Boyd, Medical Expenditures on and by Immigrant Populations in the United States: A Systematic Review, (Boston, MA: Tufts University School of Medicine, 2018), https://doi.org/10.1177%2F0020731418791963 ↩︎
  5. Ibid. ↩︎
  6. Ibid. ↩︎
  7. Kaiser Family Foundation analysis of the 2015 Kaiser Family Foundation/New York Times Medical Bills Survey. ↩︎
  8. Larisa Antonisse, Rachel Garfield, Robin Rudowitz, and Madeline Guth. The Effects of Medicaid Expansion under the ACA: Updated Findings from a Literature Review. (Washington, DC: The Kaiser Family Foundation, 2019), https://modern.kff.org/medicaid/issue-brief/the-effects-of-medicaid-expansion-under-the-aca-updated-findings-from-a-literature-review-august-2019/ ↩︎
  9. Teresa A. Coughlin, John Holahan, Kyle Caswell, and Megan McGrath. Uncompensated Care for the Uninsured in 2013: A Detailed Examination. (Washington, DC: The Kaiser Family Foundation, 2014),   https://modern.kff.org/uninsured/report/uncompensated-care-for-the-uninsured-in-2013-a-detailed-examination/ ↩︎

Nearly 4 in 10 Adults With Mental Illness Reporting Thoughts of Suicide Did Not Receive Needed Care

Published: Oct 10, 2019

Source

State Health Facts: Mental Health and Substance Use

News Release

Nearly 54 Million Americans Have Pre-Existing Conditions That Would Make Them Uninsurable in the Individual Market without the ACA

Published: Oct 4, 2019

Almost Half of Non-Elderly Families have At Least One Adult with a Pre-Existing Condition

An updated KFF analysis estimates that almost 54 million people – or 27% of all adults under 65 —have pre-existing health conditions that would likely have made them uninsurable in the individual markets that existed in most states before the Affordable Care Act.

The share of adults under 65 with such declinable pre-existing conditions varies significantly across states, from at least a third in West Virginia (37%), Arkansas (34%), Kentucky (34%), and Mississippi (34%) to a little more than one in five in Colorado (22%).

Older working-age Americans (ages 55-64) are the most likely age group to have declinable pre-existing conditions (44%), more than twice the share (18%) among the youngest age group (18-34). Women are more likely than men to have declinable conditions (30% compared to 24%).

Almost half (45%) of non-elderly families include at least one adult with a medical condition who might not be able to buy individual insurance without the ACA’s prohibition of medical underwriting.

The analysis comes as the Fifth Circuit Court of Appeals weighs a decision in the Texas v. Azar case, which seeks to overturn the entire Affordable Care Act, including the provisions that prohibit insurers from denying coverage or charging more to people with pre-existing conditions. The Trump administration has joined the conservative state Attorneys General in arguing that the ACA should be invalidated.

While most people with pre-existing conditions are covered now through employers or public programs such as Medicaid, people may look to the individual market for coverage during periods of transition, such as losing or changing a job, leaving a job due to illness, starting a business, aging off a parent’s policy, retiring before age 65, or losing Medicaid eligibility.

Before the ACA protections took effect in 2014, private insurers in the individual market could use applicants’ health status, history and other risk factors to determine whether and under what terms to issue coverage. Some conditions that could lead to automatic denials of coverage at the time include cancer, diabetes, epilepsy, heart disease, and pregnancy.

Using 2018 data from two large government surveys, the analysis estimates the total number of nonelderly adults in each state with a health condition that could lead to a denial of coverage in the individual insurance market, based on pre-ACA field underwriting guides for brokers and agents. The estimates do not include people with other health conditions that would not necessarily cause a denial, but could lead to higher insurance costs based on underwriting.

Whether and how people with pre-existing conditions could be affected if they seek coverage on the individual market in the future depends on the outcome of the ongoing court challenge, and how federal and state lawmakers respond to the court’s decision.

Pre-Existing Condition Prevalence for Individuals and Families

Authors: Gary Claxton, Cynthia Cox, Anthony Damico, Larry Levitt, and Karen Pollitz
Published: Oct 4, 2019

The impending decision by the Fifth Circuit Court of Appeals in the Texas v. Azar case raises the prospect that insurers will once again be able to return to using people’s health status in determining their eligibility and premiums for health insurance, at least for coverage obtained from the non-group, or individual insurance, market.  In the case, the plaintiff states’ Attorneys General and the Trump Administration are arguing that the Affordable Care Act is unconstitutionally structured and should be invalidated in its entirety.  This would include overturning provisions that guarantee that people with pre-existing health conditions cannot be denied coverage or charged higher premiums due to their health status.

Given the significant barriers to coverage that may reemerge if these provisions in the ACA were to be invalidated, we are updating our prior work looking at the share of nonelderly adults with health conditions that would likely to have caused them to be denied coverage if they applied for non-group health insurance prior to the effective date of the ACA.  And because the financial consequences of these changes would potentially affect the whole family, we extend our analysis to estimate the percent of nonelderly families with at least one adult who has one or more declinable conditions.

Consistent with our previous analysis, we estimate that 27% of nonelderly adults have a declinable health condition, which is about 53.8 million people in 2018.  We further estimate that 45% of nonelderly families have at least one nonelderly adult member with a declinable health condition.  Finally, we update our state-based estimates of the prevalence of declinable pre-existing conditions with the most current data available, showing that the share of non-elderly adults with pre-existing conditions ranges from 22% in Colorado to 37% in West Virginia.

People with pre-existing health conditions were often denied coverage or charged higher premiums for individual market coverage before the ACA took effect in 2014.  While most of people with pre-existing health conditions are covered currently by employer-based coverage or public programs, such as Medicaid, the non-group market is where they may need to look for coverage in times of transition, for example, if they lose a job, change jobs, start a business, divorce, age-off of a parent’s policy, retire before age 65, leave employment due to serious illness, get a job and lose Medicaid, or otherwise lose their eligibility for work-based or public coverage. While we cannot predict how the court would fashion relief if these ACA provisions were overturned, access to individual market insurance for people with pre-existing conditions could be seriously reduced.

Use of Health Status in Underwriting and Rating Before the ACA

Table 1: Examples of Declinable Conditions In the Medically Underwritten Individual Market, Before the Affordable Care Act
Condition
AIDS/HIVLupus
Alcohol abuse/ Drug abuse with recent treatmentMental disorders (severe, e.g. bipolar, eating disorder)
Alzheimer’s/dementiaMultiple sclerosis
Arthritis (rheumatoid), fibromyalgia, other inflammatory joint diseaseMuscular dystrophy
Cancer within some period of time (e.g. 10 years, often other than basal skin cancer)Obesity, severe
Cerebral palsyOrgan transplant
Congestive heart failureParaplegia
Coronary artery/heart disease, bypass surgeryParalysis
Crohn’s disease/ ulcerative colitisParkinson’s disease
Chronic obstructive pulmonary disease (COPD)/emphysemaPending surgery or hospitalization
Diabetes mellitusPneumocystic pneumonia
EpilepsyPregnancy or expectant parent
HemophiliaSleep apnea
Hepatitis (Hep C)Stroke
Kidney disease, renal failureGender Dysphoria
SOURCE: Kaiser Family Foundation review of field underwriting guidelines from Aetna (GA, PA, and TX), Anthem BCBS (IN, KY, and OH), Assurant, CIGNA, Coventry, Dean Health, Golden Rule, Health Care Services Corporation (BCBS in IL, TX) HealthNet, Humana, United HealthCare, Wisconsin Physician Service.  Conditions in this table appeared on declinable conditions list in half or more of guides reviewed.

 NOTE: Many additional, less-common disorders also appearing on most of the declinable conditions lists were omitted from this table.

Estimates of the Share of Adults with Pre-Existing Conditions

We used data from the National Health Interview Survey (NHIS) to estimate that 27% of nonelderly adults had a declinable health condition in 2018, the same percentage that we found in our earlier analysis for 2015. The NHIS has a number of questions about whether the respondent has ever been diagnosed with a number of the health conditions that would have been declinable in the pre-ACA non-group market. While we cannot duplicate the underwriting processes carried out by insurers, we feel that our approach is reasonable and may be conservative because the NHIS does not contain information about all of the conditions (e.g.,  AIDS/HIV) used by insurers and does not provide information on prescriptions that insurers also used to decline applicants for coverage.

Although each family member would have been separately underwritten in the pre-ACA non-group market, the economic consequences of having a member of the family denied coverage or surcharged due to their health would likely be felt by all members of the family. To look at the number of people that might be affected, we extended our previous methods and estimate that, in 2018, 45% of non-elderly families included a non-elderly adult with a declinable condition. Individuals living in households without a relative are considered to be a family of one person for this analysis.

A larger share of non-elderly adult women (30%) than men (24%) have declinable pre-existing conditions in 2018, unchanged from 2015.  We estimate that 23.7 million men have a pre-existing condition that would have left them uninsurable in the individual market pre-ACA, compared to 30.1 million women. Pregnancy explains part (about 2 million women) but not all of this difference.

The prevalence of declinable conditions also increases with age among non-elderly adults: ranging from 18% of those in the 18-34 age group to 44% for those in the 55-64 age group.

Table 2 Share of Non-Elderly People with Declinable Condition
Age GroupShare with Declinable Condition
18-3418%
35-4424%
45-5429%
55-6444%

The rates of declinable pre-existing conditions continue to vary from state to state. On the low end, in Colorado, at least 22% of non-elderly adults have conditions that would likely be declinable if they were to seek coverage in the individual market under pre-ACA underwriting practices.  Rates are higher in other states – particularly in the South – such as Arkansas (34%), Kentucky (34%), Mississippi (34%), and West Virginia (37%), where at least a third of the non-elderly population would have declinable conditions.

Table 3: Estimated Number and Percent of Non-Elderly People with Declinable Pre-Existing Conditions Under Pre-ACA Practices, 2018
StatePercent of Non-Elderly Population Number of Non-Elderly Adults
Alabama33%957,000
Alaska26%119,000
Arizona28%1,145,000
Arkansas34%597,000
California25%6,093,000
Colorado22%789,000
Connecticut24%529,000
Delaware28%160,000
District of Columbia23%113,000
Florida28%3,526,000
Georgia28%1,805,000
Hawaii25%212,000
Idaho26%259,000
Illinois26%2,045,000
Indiana30%1,210,000
Iowa25%466,000
Kansas27%465,000
Kentucky34%890,000
Louisiana33%932,000
Maine28%225,000
Maryland27%1,019,000
Massachusetts23%975,000
Michigan29%1,753,000
Minnesota23%790,000
Mississippi34%593,000
Missouri30%1,079,000
Montana24%152,000
Nebraska26%295,000
Nevada26%487,000
New Hampshire28%233,000
New Jersey25%1,359,000
New Mexico28%337,000
New York26%3,200,000
North Carolina28%1,762,000
North Dakota25%113,000
Ohio29%1,983,000
Oklahoma31%718,000
Oregon28%701,000
Pennsylvania27%2,105,000
Rhode Island27%175,000
South Carolina30%914,000
South Dakota24%123,000
Tennessee32%1,302,000
Texas28%4,794,000
Utah24%438,000
Vermont24%92,000
Virginia26%1,349,000
Washington25%1,154,000
West Virginia37%382,000
Wisconsin25%883,000
Wyoming25%86,000
US27%53,884,000
SOURCE: Kaiser Family Foundation analysis of data from National Health Interview Survey and the Behavioral Risk Factor Surveillance System.NOTE: Five states (MA, ME, NJ, NY, VT) had broadly applicable guaranteed access to insurance before the ACA. What protections might exist in these or other states under a repeal and replace scenario is unclear.

Discussion

Since the effective date of the ACA market changes in January of 2014, people with pre-existing health conditions have not had to worry about their health conditions affecting their access to health insurance or increasing the premiums that they pay. The legislation assures people access to individual market coverage with comprehensive benefits through a variety of changes in their work and life circumstances.  This could change quite quickly if the ACA market protections for people with pre-existing conditions were invalidated.  While many adults with pre-existing conditions have Medicaid or employer coverage that would still provide protection, over a quarter of nonelderly adults have a health condition that would jeopardize their access to non-group coverage without the ACA market protections, potentially affecting almost one-half of non-elderly families in the country.  For these families, an invalidated ACA could fundamentally affect future access to health care.

Methods

To calculate nationwide prevalence rates of declinable health conditions, we reviewed the survey responses of nonelderly adults for all question items shown in Methods Table 1 using the CDC’s 2018 National Health Interview Survey (NHIS).  Approximately 27% of 18-64 year olds, or 54 million nonelderly adults, reported having at least one of these declinable conditions in response to the 2018 survey.  The CDC’s National Center for Health Statistics (NCHS) relies on the medical condition modules of the annual NHIS for many of its core publications on the topic; therefore, we consider this survey to be the most accurate means to estimate both the nationwide rate and weighted population.

Since the NHIS does not include state identifiers nor sufficient sample size for most state-based estimates, we constructed a regression model for the CDC’s 2018 Behavioral Risk Factor Surveillance System (BRFSS) to estimate the prevalence of any of the declinable conditions shown in Methods Table 1 at the state level.  This model relied on three highly significant predictors: (a) respondent age; (b) self-reported fair or poor health status; (c) self-report of any of the overlapping variables shown in the left-hand column of Methods Table 1.  Across the two data sets, the prevalence rate calculated using the analogous questions (i.e. the left-hand column of Methods Table 1) lined up closely, with 21% of 18-64 year old survey respondents reporting at least one of those declinable conditions in the 2018 NHIS and 23% of 18-64 year olds in the 2018 BRFSS.  Applying this prediction model directly to the 2018 BRFSS microdata yielded a nationwide prevalence of any declinable condition of 29%, a near match to the NHIS nationwide estimate of 27%.

In order to align BRFSS to NHIS overall statistics, we then applied a Generalized Regression Estimator (GREG) to scale down the BRFSS microdata’s prevalence rate and population estimate to the equivalent estimates from NHIS, 27% and 54 million.  Since the regression described in the previous paragraph already predicted the prevalence rate of declinable conditions in BRFSS by using survey variables shared across the two datasets, this secondary calibration solely served to produce a more conservative estimate of declinable conditions by calibrating BRFSS estimates to the NHIS.  After applying this calibration, we calculated state-specific prevalence rates and population estimates off of this post-stratified BRFSS sample.

Methods Table 1: Declinable Medical Conditions Available in Survey Microdata
Declinable Condition Questions Available in both the 2018 National Health Interview Survey and also the 2018 Behavioral Risk Factor Surveillance SystemDeclinable Condition Questions Available in only the 2018 National Health Interview Survey
Ever had CHDMelanoma Skin Cancer
Ever had AnginaAny Other Heart Condition
Ever had Heart AttackStomach Duodenal or Peptic Ulcer
Ever had StrokeDifficulty Due to Mental Retardation
Ever had COPDDifficulty Due to Cerebral Palsy
Ever had EmphysemaDifficulty Due to Senility
Chronic Bronchitis in past 12 monthsDifficulty Due to Depression
Ever had Non-Skin CancerDifficulty Due to Endocrine Problem
Ever had DiabetesDifficulty Due to Blood Forming Organ Problem
Weak or Failing KidneysDifficulty Due to Drug / Alcohol / Substance Abuse
BMI > 40Difficulty Due to Schizophrenia, ADD, or Bipolar Disorder
Pregnant

To calculate nationwide prevalence rates of declinable health conditions at the family-level, we imputed person-level presence of any condition onto the NHIS person file using the main 2018 NHIS sample adult estimate.  This model relied on three highly significant predictors: (a) respondent age; (b) self-reported fair or poor health status; (c) self-report of any health-related activity limitation, disability, hospitalization, or high rate of physician visits.  Since all individuals responding to the NHIS sample adult questionnaire also respond to the NHIS person component of the survey, these factors produced a reasonably predictive estimate, matching 27% of non-elderly adults with pre-existing conditions for all individuals participating in the survey.  Unlike the NHIS sample adult file, the NHIS person file allows for analyses of family-wide characteristics.  This prediction yielded 53% of non-elderly adults having a declinable condition themselves or co-habiting with a non-elderly adult family member with a declinable condition; using the NHIS family weights, this results in 45% of non-elderly families (families having at least one non-elderly adult family member) having one or more adults with a declinable condition.  In total, approximately 54 million non-elderly adults may have a pre-existing condition and almost as many non-elderly adults without pre-existing conditions live with a family member that does.

The programming code, written using the statistical computing package R v.3.6.1, is available upon request for people interested in replicating this approach for their own analysis.

News Release

Kaiser Health News (KHN) Wins Prestigious Barlett & Steele Investigative Journalism Award

Published: Oct 2, 2019

SAN FRANCISCO – KFF is pleased to announce that Kaiser Health News (KHN), its editorially independent health news service, has won a top prize Wednesday in the 13th annual Barlett & Steele Awards for Investigative Journalism.

KHN Senior Correspondent Christina Jewett discovered that for nearly 20 years, the FDA was striking deals with medical device makers to keep millions of malfunction and injury reports out of the public database known as MAUDE – and instead letting device makers submit reports to a secret database, hidden from public view.

KHN’s “Hidden Harm” investigative series also revealed that the FDA granted special reporting exemptions that were so obscure that safety experts, doctors and even a recent FDA commissioner were not aware they existed.

The hidden database included 500,000 reports of injuries or malfunctions tied to breast implants; 66,000 surgical stapler malfunctions and more than 50,000 incidents tied to the Sprint Fidelis, a device implanted in the chest to shock a patient’s heart back to normal.

Citing KHN’s work, device-safety experts called on the FDA to open up the hidden reports of harm. That triggered FDA Commissioner Dr. Scott Gottlieb to tweet that the reports would be open to the public:  “We’re now prioritizing making ALL of this data available,” Gottlieb wrote. On June 21, the FDA published its entire hidden database online, revealing 5.7 million device-related injuries or malfunctions for the first time.

“We established KHN to do truly important and impactful journalism just like this – getting out the facts, holding government accountable, and most of all helping people,”  said Drew Altman, KFF’s President and CEO and Founding Publisher of KHN.

“It’s so gratifying to publish an investigation that has such rapid impact and will make medical care safer for millions of patients,” said KHN editor-in-chief Elisabeth Rosenthal. “‘Transparency’ is all the rage in health care. But as Christina showed, it often take relentless reporting to expose the truth.”

The KHN series was one of two “Gold” award winners in the Barlett & Steele Awards, administered by the Donald W. Reynolds National Center for Business Journalism at Arizona State University.  Other winners announced Wednesday include The Wall Street Journal, the International Consortium of Investigative Journalists, NBC News, The Associated Press and The Oregonian.

The awards are named for the investigative team of Don Barlett and Jim Steele, whose honors included two Pulitzer prizes.

About The Henry J. Kaiser Family Foundation and Kaiser Health News:

Filling the need for trusted information on national health issues, KFF (the Kaiser Family Foundation) is a nonprofit organization based in San Francisco, California.  KHN is an editorially independent program of KFF and is the nation’s leading and largest health and health policy newsroom, producing stories that run on kffhealthnews.org and are published by hundreds of news organizations across the country.