Medicaid Enrollment & Spending Growth: FY 2019 & 2020

Authors: Robin Rudowitz, Elizabeth Hinton, Maria Diaz, Madeline Guth, and Marina Tian
Published: Oct 18, 2019

Issue Brief

States reported declines in Medicaid enrollment and modest growth in total Medicaid spending for state fiscal year (FY) 2019 and budgeted for nearly flat enrollment growth but a return to more typical rates of spending growth for FY 2020. These Medicaid changes fall against the backdrop of robust state economies marked by strong revenue growth and low unemployment. This brief analyzes Medicaid enrollment and spending trends for FY 2019 and FY 2020 based on interviews and data provided by state Medicaid directors as part of the 19th annual survey of Medicaid directors in all 50 states and the District of Columbia. The methodology used to calculate enrollment and spending growth as well as additional information about Medicaid financing can be found at the end of the brief. Key findings are described below and in a companion report.

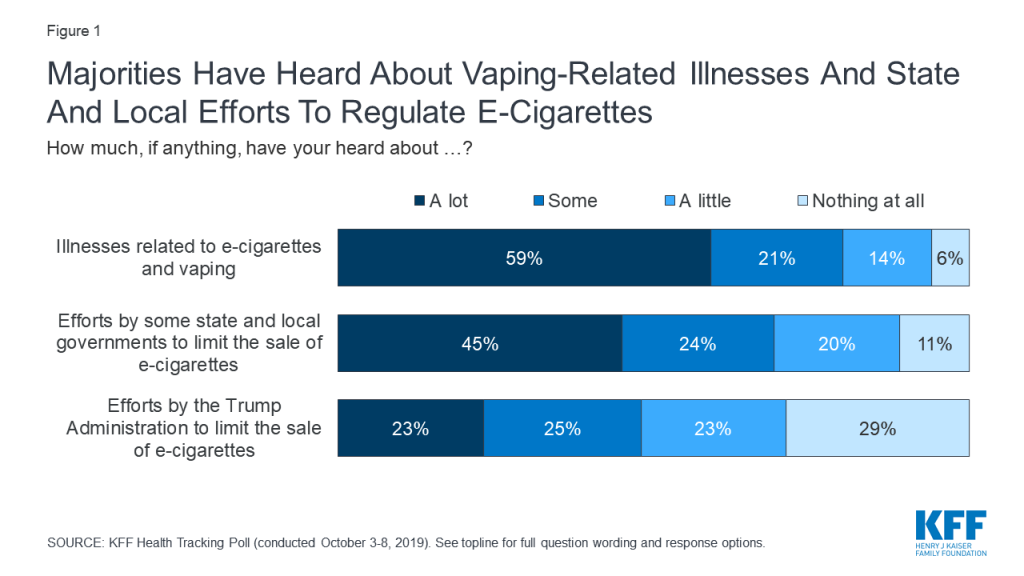
Enrollment: States largely attributed enrollment declines in FY 2019 (-1.7%) and relatively flat enrollment growth in FY 2020 (0.8%) to a stronger economy (Figure 1). A number of states, however, also pointed to changes in renewal processes, new functionality of upgraded eligibility systems, and enhanced verifications and data matching efforts as contributing to enrollment declines.

Figure 1: Medicaid enrollment and spending growth in state fiscal year 2019 and projected for FY 2020

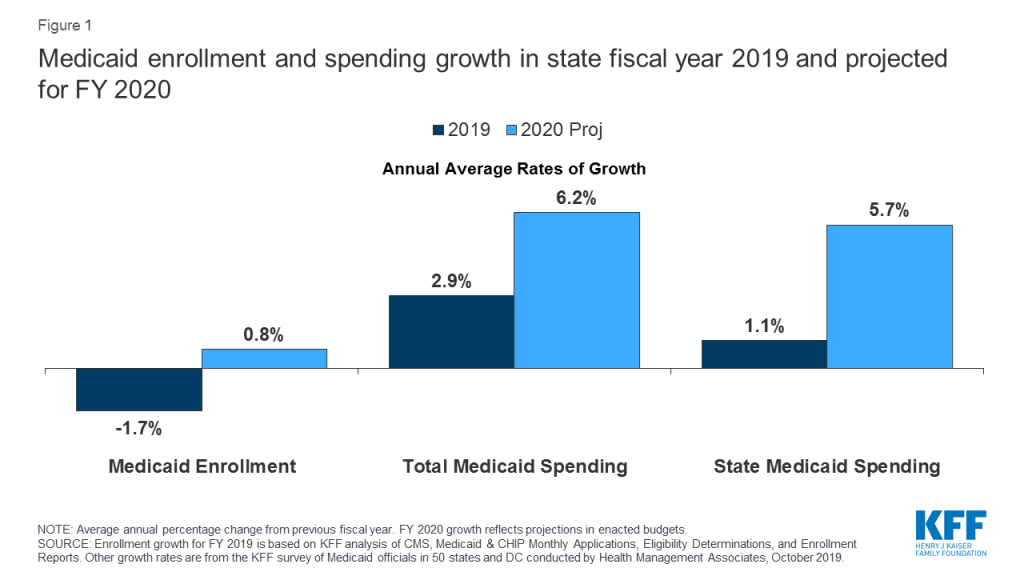
Total Spending: Total spending growth slowed to 2.9% in FY 2019 primarily due to enrollment declines. For FY 2020, however, states adopted budgets with projected growth returning to more typical levels of 6.2% as higher costs for prescription drugs, provider rate increases, and costs for the elderly and people with disabilities (including increased utilization of long-term services and supports) are expected to put upward pressure on total Medicaid spending.

State Spending: Despite an increase in the state share of financing for the Affordable Care Act’s (ACA’s) Medicaid expansion (from 6% in 2018 to 7% in 2019 and 10% in FY 2020 – midway through the state fiscal year), growth in the state share of Medicaid costs was lower than total spending growth in FY 2019 and budgeted to be similarly lower in FY 2020. Most expansion states reported relying on general fund support to finance the ACA Medicaid expansion, but a number of states also reported relying on provider taxes or other savings from the expansion.

Looking ahead: Looking ahead beyond FY 2020, economic conditions and the outcomes of federal and state elections in November 2020 are likely to have major implications for Medicaid, state budgets, and enrollees as debate about Medicaid expansion, demonstration waivers, the ACA, and broader health reform continue to be a major focus for candidates and voters.

Context

Medicaid (together with CHIP) provided coverage to about one in five Americans, or about 72 million people, as of July 2019.1  Total Medicaid spending was $593 billion in FY 2018 with 62.5% paid by the federal government and 37.5% financed by states.2  Medicaid accounts for one in six dollars spent in the health care system and more than half of spending on long-term services and supports.3  Since the end of the Great Recession, a steadily improving economy in most states has led to lower unemployment and improving state revenues. These trends can mitigate Medicaid enrollment growth while robust state revenue growth can support program expansions or enhancements such as benefit expansions or provider rate increases.  According to the National Association of State Budget Officers (NASBO), FY 2020 will likely mark the tenth straight year of state general fund spending increases following two years of decline in FY 2009 and FY 2010.4  Another key factor affecting Medicaid spending and enrollment is the implementation of the ACA’s coverage expansions beginning in 2014. As of October 2019, 37 states (including DC) have adopted the ACA Medicaid expansion with implementation expected in January 2020 in Idaho, in October 2020 in Nebraska (FY 2021) and in July 2020 in Utah if waiver options are not approved before then (also FY 2021).5 

State revenue performance in FY 2019 was strong. NASBO reported that most states entered FY 2019 with budget surpluses from robust revenue growth in FY 2018. In its June report, NASBO estimated nominal general fund revenue growth of 7.0% in FY 2018 and 2.7% in FY 2019.6  Strong revenue growth allowed states to increase general fund spending by an average of 5.8% in FY 2019 and also bolster reserve funds.7 

FY 2020 state budgets include increases for a variety of state priorities. By July 1, 2019, seven states (Massachusetts, New Hampshire, North Carolina, Ohio, Oregon, Rhode Island, and Wisconsin) had not adopted a FY 2020 budget (compared to two states that had not adopted a FY 2019 budget at the same time last year). These budget impasses were primarily driven by policy disagreements rather than weak fiscal conditions.8 ,9  Across states, adopted budgets for FY 2020 increased spending for priority programs (early education, K-12 and higher education, and workforce development), provided one-time spending for infrastructure projects, and directed more dollars to build up state rainy day funds.10  Other areas for increased spending included Medicaid expansion (in a few states), child welfare services, behavioral health, affordable housing, corrections, expansion of broadband internet, water quality and clean energy initiatives, additional pension funding, and state employee pay raises and bonuses.11 

Fiscal conditions vary across states but remain strong overall. Underneath national trends lies considerable state variation in fiscal conditions. For example, eight states reported flat or negative revenue growth in FY 2019 while 11 states experienced growth of 5% or more. Unemployment also varied across states with Alaska, Arizona, DC, Mississippi, and New Mexico reporting the highest state unemployment rates in August 2019, exceeding the national rate by one percentage point or more.12  Overall, the national unemployment rate remained steady at 3.7% in August 2019.13 

Key Findings

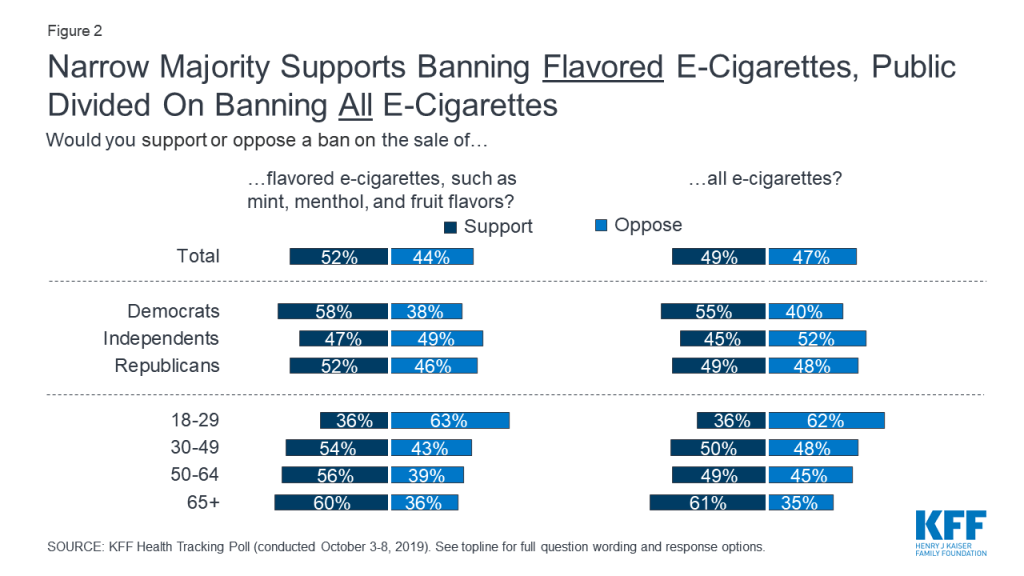
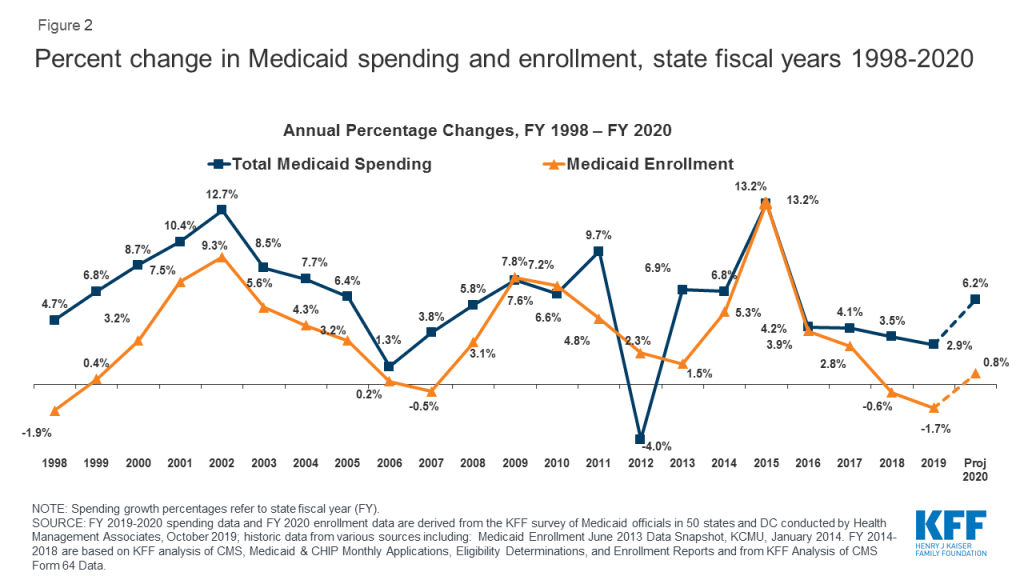
Medicaid enrollment declined in FY 2019 and is expected to be flat in FY 2020. Medicaid enrollment growth peaked in FY 2015 due to the implementation of the ACA and has tapered each year since, dropping to -0.6% in FY 2018 and -1.7% in FY 2019. For FY 2020, states project nearly flat enrollment growth of 0.8% overall (Figure 2) with fewer states (11 states) expecting enrollment declines compared to FY 2019 (35 states). States were more likely to report enrollment declines for children compared to other groups (expansion adults, seniors and people with disabilities, other adults) (data not shown).

Figure 2: Percent change in Medicaid spending and enrollment, state fiscal years 1998-2020

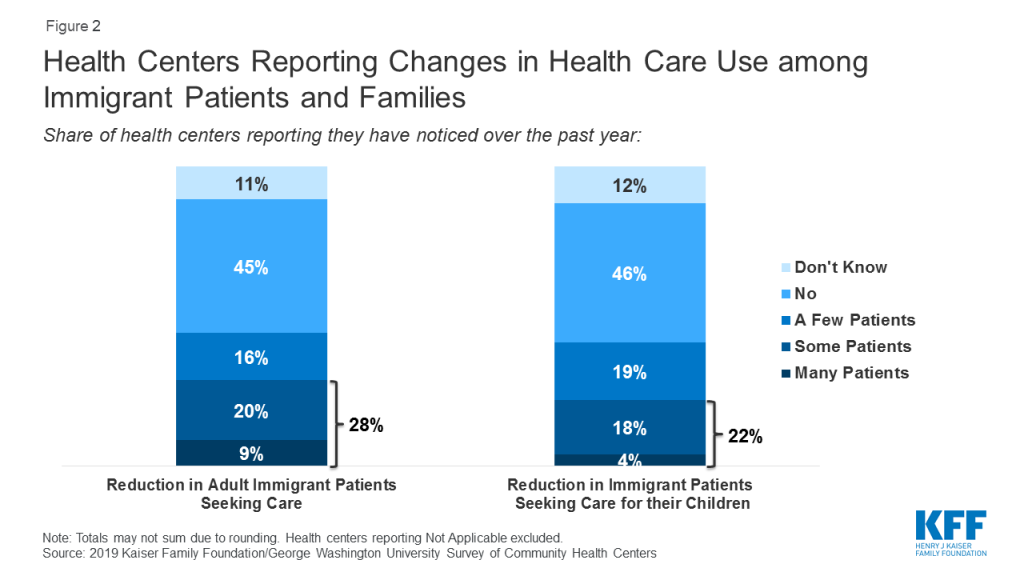
States largely attribute Medicaid enrollment declines to improving economic conditions. Increased incomes generated by the strong economy may have resulted in Medicaid coverage losses for some low-income enrollees. However, recent Census Bureau data show an increase in the number of uninsured in the U.S., suggesting that some people losing Medicaid coverage may not gain access to employer-based health benefits and are not buying their own insurance.14  Some states also pointed to process and systems changes including changes to renewal processes, upgraded eligibility systems, and enhanced data matching efforts to verify eligibility as putting a downward pressure on enrollment.15  At least one state mentioned changes driven by the Centers for Medicare and Medicaid Services (CMS) guidance instructing states to tighten procedures related to verifying income changes as a cause of enrollment declines. In June 2019, CMS issued guidance to state Medicaid agencies outlining practices “to ensure that program resources are reserved for those who meet eligibility requirements.” The guidance spotlights use of periodic data matching between annual renewals to verify eligibility throughout the year.16  In line with other research,17  a few states also noted that the recently finalized public charge rule is expected to have a chilling effect on Medicaid enrollment of immigrant families, deterring eligible individuals from enrolling (or causing eligible individuals to disenroll).

Enrollment declines were mitigated by enrollment growth in some states. Eleven states reported enrollment growth in FY 2019 while 31 states are projecting enrollment growth in FY 2020, including a few states newly implementing or planning to implement the ACA Medicaid expansion in FY 2019 or FY 2020. Overall, states reported a higher median enrollment growth rate for the elderly and people with disabilities compared to other groups (expansion adults, other adults, and children) or as compared to the overall growth rate (data not shown). Higher enrollment growth for these high-cost enrollees contributes to a higher acuity case-mix, which will tend to increase spending per enrollee.

Growth in total Medicaid spending slowed in FY 2019, but is expected to resume to more typical growth rates in budgets adopted for FY 2020. High rates of enrollment growth, tied first to the Great Recession and later to the implementation of the ACA, were the primary drivers of total Medicaid spending growth over the last decade. Similarly, declining enrollment driven by a strong economy was the primary driver identified by states for slow spending growth in FY 2019. While flat enrollment is projected to continue as a mitigating factor on spending in FY 2020, Medicaid officials identified increasing costs for prescription drugs (particularly for specialty drugs), rate increases (most often for managed care organizations, hospitals, and nursing facilities), as well as pressures from an aging population and a higher acuity case-mix as key upward pressures on total Medicaid spending. Some states noted that medical inflation, which trends higher than general inflation, results in higher Medicaid spending growth compared to other state programs. It is worth noting that actual spending growth for FY 2019 was lower than what was included in the FY 2019 budgets, so it is possible that actual spending for FY 2020 might be higher or lower than budgeted. During economic downturns, states may spend more than budgeted amounts and face shortfalls, requiring the need for supplemental funding.

Thirty states reported per enrollee growth was higher for certain groups, and about half of those pointed to higher growth for the elderly and people with disabilities (data not shown). A smaller number of states pointed to higher per enrollee growth for expansion adults. One of these states noted that broader enrollment declines in the expansion adult group resulted in a higher acuity level and higher per person cost for the remaining enrollees while another state commented that opioid treatment costs were especially high for expansion adults. The remaining states reporting higher growth in some groups were mixed with a few pointing to higher growth for children, pregnant women, or other more specific groups.

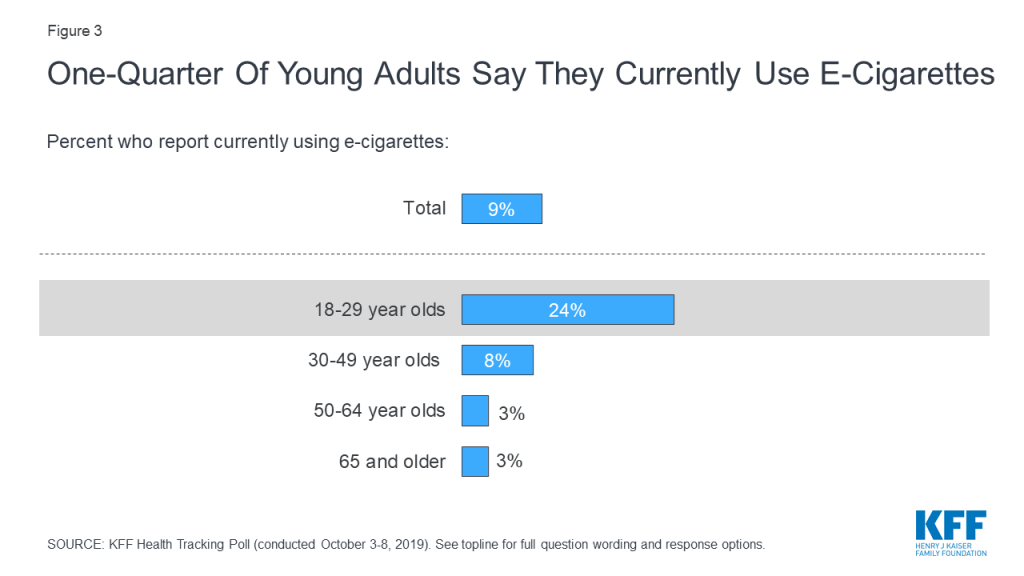
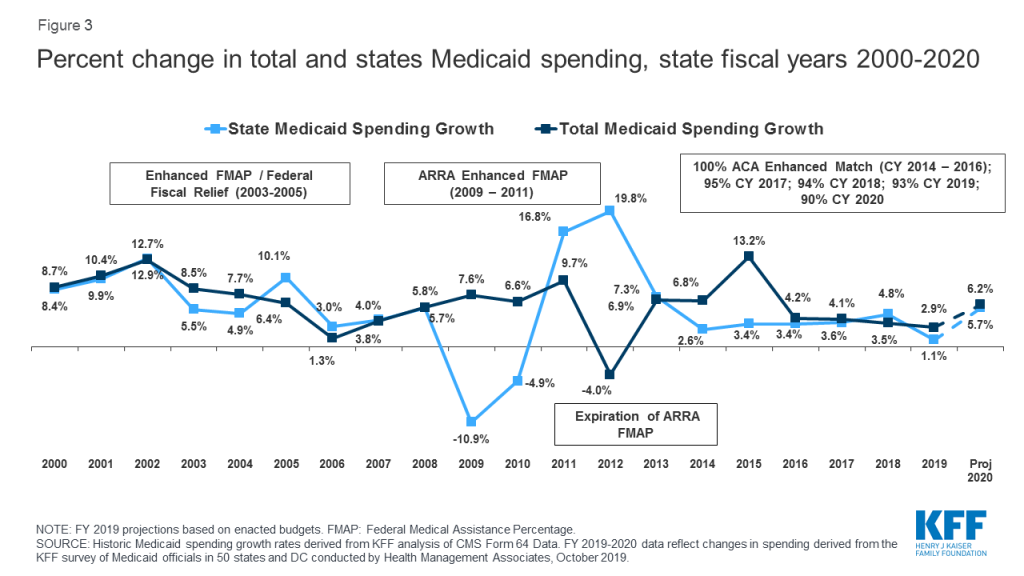
The state share of Medicaid spending typically grows at a similar rate to total Medicaid spending growth, unless there is a change in the federal matching rate. Following the implementation of the ACA, the enrollment of millions of expansion adults at a 100% federal match rate resulted in lower overall state spending growth compared to total spending growth. Mid-way through FY 2017, expansion states began paying 5% of the costs of the new group, and this amount increased to 6% in January 2018 and 7% in January 2019. In FY 2018, the first full state fiscal year states were responsible for paying for a share of the Medicaid expansion, state Medicaid spending growth slightly outpaced total Medicaid spending growth. This could be because the increase in 2017 was from 0% state share to 5% (comparatively larger than later, more incremental increases). In FY 2019, however, state spending growth was lower than total Medicaid spending growth (1.1% compared to 2.9%), despite the increase in the required state matching rate to 7%. In January 2020, the state share of costs for the expansion group will increase to 10% where it will stay in future years. Similar to FY 2019, states project that state spending growth will be slightly lower than total spending growth in FY 2020. Average state spending growth may be slower than total spending in FY 2019 and FY 2020 because of the marginally smaller increases in the state share of expansion costs (compared to the earlier jump from 0% to 5%); however, our survey data do not provide an explanation. In both FY 2019 and FY 2020, state Medicaid spending growth is moving in the same direction as total Medicaid spending growth (Figure 3).

Figure 3: Percent change in total and states Medicaid spending, state fiscal years 2000-2020

In FY 2019, state spending growth for Medicaid was lower than overall general fund expenditure growth. State spending growth for Medicaid typically outpaces overall state general fund growth as medical costs have historically grown faster than inflation. During the first three years of ACA implementation (2014-2016), however, state spending for Medicaid grew at a slower pace compared to overall state general fund growth, likely due to the enhanced federal match rate for expansion adults that covered the full cost of the expansion in those years as well as slower growth in health costs generally, and the improving economy. While data in this report reflect state spending from general fund and other state sources, states reported estimated state Medicaid spending growth of only 1.1% in FY 2019 compared to 5.8% general fund expenditure growth (as reported by NASBO18 ). NASBO data also show state Medicaid general fund spending growing at a slower rate (3.6%) compared to total general fund spending (5.8%).

A number of states use provider taxes or savings from expansion to finance the state share of expansion costs. A large majority of states use general revenue to finance the state share of Medicaid expansion costs; however, 11 states use increases in existing or new provider taxes and seven states identified savings from expansion (e.g., in other state health programs) to finance these costs. Indiana and Louisiana reported using cigarette taxes or tobacco taxes to finance the expansion. Several expansion states reported multiple sources of financing.

Conclusion and Looking Ahead

A stronger economy as well as new enrollment systems and enhanced verifications contributed to declines in Medicaid enrollment in FY 2019 and flat growth projections for FY 2020. Enrollment declines accounted for low Medicaid spending growth in FY 2019, with state revenues increasing faster than state spending on Medicaid. Rising costs for prescription drugs, provider rate increases, and costs tied to the elderly and people with disabilities (including increased utilization of long-term services and supports) were cited as factors contributing to expected upward spending growth in FY 2020, even as enrollment growth is expected to remain flat. Looking ahead, the factors driving Medicaid spending growth are likely to continue and could be exacerbated in the event of a future economic downturn that would likely have significant effects on Medicaid enrollment and spending. As the debate heats up for the November 2020 elections, health care remains a key issue for candidates and voters at both the state and federal levels. At the state level, continued debates about Medicaid expansion, drug costs, and Section 1115 demonstration waivers will be important to watch. At the federal level, the health care debate is far-reaching. Democratic presidential candidates are proposing to further expand coverage while the Trump Administration continues to support policies that would eliminate the ACA and fundamentally restructure Medicaid with less federal funding. A strong economy and lower Medicaid enrollment growth relieve some fiscal pressure on states, but a future economic downturn as well as the outcomes of the elections could have significant implications for the Medicaid program, state budgets, and for Medicaid enrollees.


Methods

Definition of Medicaid Spending. Total Medicaid spending includes all payments to Medicaid providers for Medicaid-covered services provided to enrolled Medicaid beneficiaries. Medicaid spending also includes special disproportionate share hospital (DSH) payments that subsidize uncompensated hospital care for persons who are uninsured and unreimbursed costs of care for persons on Medicaid. Not included in total Medicaid spending are Medicaid administrative costs and federally mandated state “Clawback” payments to Medicare (to help finance the Medicare Part D prescription drug benefit for Medicaid beneficiaries who are also enrolled in Medicare). States are also asked to exclude costs for the Children’s Health Insurance Program (CHIP). Total Medicaid spending includes payments financed from all sources, including state funds, local contributions, and federal matching funds. Historical state Medicaid spending refers to all non-federal spending, which may include local funds and provider taxes and fees as well as state general fund dollars.

Methodology. The Kaiser Family Foundation (KFF) commissioned Health Management Associates (HMA) to survey Medicaid directors in all 50 states and DC to identify and track trends in Medicaid spending, enrollment, and policymaking. Given differences in the financing structure of their programs, the U.S. territories were not included in this analysis. This is the 19th annual survey, conducted at the beginning of each state fiscal year from FY 2002 through FY 2020. The KFF/HMA Medicaid survey for this report was sent to each Medicaid director in June 2019. Medicaid directors and staff responded to the written survey and participated in follow-up telephone interviews from June through September 2019. All 50 states and DC participated in this year’s survey (although Maryland was not available to complete a follow-up interview).

For FY 2019 and FY 2020, annual rates of growth for Medicaid spending were calculated as weighted averages across all states. Weights for spending were derived from the most recent state Medicaid expenditure data for FY 2018, based on estimates prepared for KFF by the Urban Institute using CMS Form 64 reports, adjusted for state fiscal years. These CMS-64 data were also used for historic Medicaid spending. For FY 2018, state spending for New York was adjusted to reflect growth reported on the 2019 state survey due to unexplained anomalies in the CMS-64 data.

Medicaid average annual growth rates for enrollment were calculated using weights based on Medicaid and CHIP monthly enrollment data for June 2019 published by CMS. Historical enrollment trend data for FY 1998 to FY 2013 reflects the annual percentage change from June to June of monthly enrollment data for Medicaid beneficiaries collected from states. Enrollment trend data for FY 2014 to FY 2019 reflects growth in average monthly enrollment based on KFF analysis of the Medicaid & CHIP Monthly Applications, Eligibility Determinations, and Enrollment Reports from CMS. The data reported for FY 2019 and FY 2020 for Medicaid spending and FY 2020 for Medicaid enrollment are weighted averages, and therefore, data reported for states with larger enrollment and spending have a greater effect on the national average. Additional information collected in the survey on policy actions taken during FY 2019 and FY 2020 can be found in the companion report.

Appendix

Background on Medicaid Financing

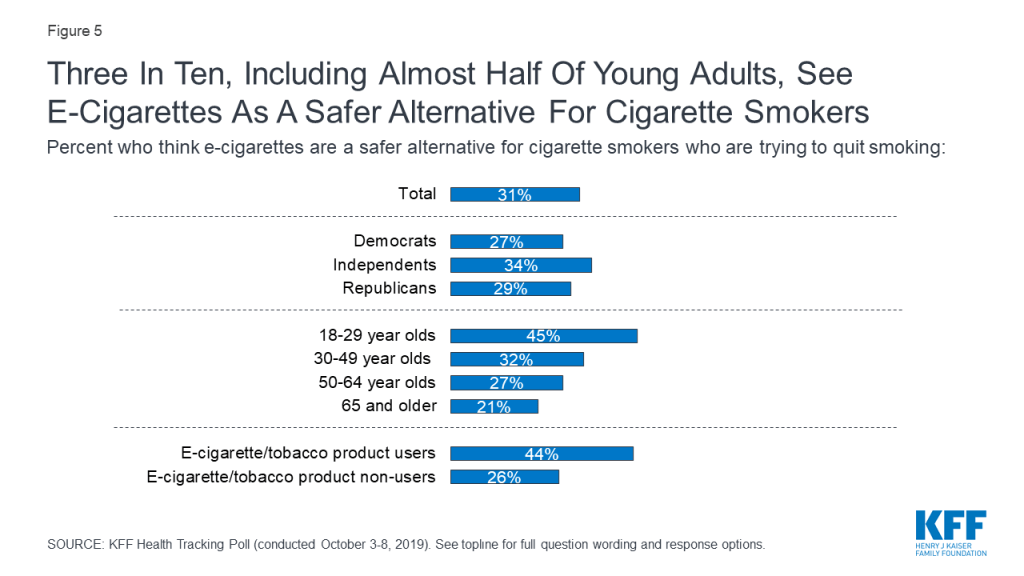
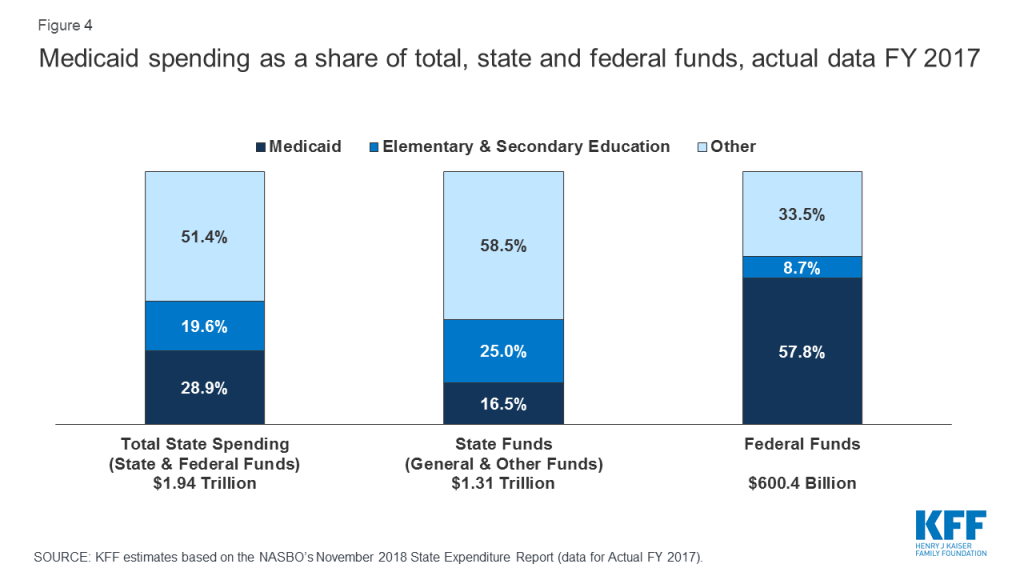
Medicaid Financing Structure. The federal government jointly funds the Medicaid program with states by matching qualifying state Medicaid expenditures. The federal match rate (known as the Federal Medical Assistance percentage, or FMAP) is calculated annually for each state using a statutory formula based on a state’s average personal income relative to the national average which results in higher FMAP rates for poorer states. The FMAP formula relies on three years of lagged personal income data, so data for federal fiscal years (FFYs) 2015 to 2017 was used to calculate FFY 2020 FMAP rates which range from a floor of 50% (applicable to 13 states) to a high of 77% (for Mississippi).19  Because of the federal matching structure, Medicaid is both a state budget expenditure item and a source of federal revenue for states. In FY 2017 (the latest year of actual data), Medicaid accounted for 28.9% of total state spending, but 16.5% of state funds (general fund plus other state funds), a far second to spending on K-12 education (25.0% of state funds). Medicaid is the largest single source of federal funds for states, accounting for over half (57.8%) of all federal funds for states (Figure 4).20 

Figure 4: Medicaid spending as a share of total, state and federal funds, actual data FY 2017

Medicaid and the Economy. Medicaid is a countercyclical program. During economic downturns, more people qualify and enroll in Medicaid, increasing program spending at the same time that state tax revenues may be stagnating or falling. To mitigate these budget pressures, Congress has twice passed temporary FMAP increases to help support states during economic downturns, most recently in 2009 as part of the American Recovery and Reinvestment Act (ARRA). The ARRA-enhanced FMAP rates provided states over $100 billion in additional federal funds over 11 quarters, ending in June 2011.21 

Medicaid and the ACA. Effective January 1, 2014, the ACA expanded Medicaid eligibility to millions of non-elderly adults with income at or below 138% of the federal poverty level (FPL) –$17,236 per year for an individual in 2019. 22  The law also provided 100% federal funding for expansion adults through 2016, phasing down to 90% in 2020 and future years. The June 2012 Supreme Court ruling on the ACA effectively made the Medicaid expansion optional for states; as of October 2019, 37 states (including DC) had adopted the expansion.

Endnotes

  1. The Kaiser Family Foundation State Health Facts. Total Monthly Medicaid and CHIP Enrollment July 2019 (accessed October 2019) https://modern.kff.org/health-reform/state-indicator/total-monthly-medicaid-and-chip-enrollment/?currentTimeframe=0&sortModel=%7B%22colId%22:%22Location%22,%22sort%22:%22asc%22%7D. ↩︎
  2. The Kaiser Family Foundation analysis of Centers for Medicare and Medicaid Services, Federal and State Share of Medicaid Spending, accessed September 2019 https://modern.kff.org/medicaid/state-indicator/federalstate-share-of-spending/?currentTimeframe=0&sortModel=%7B”colId”:”Location”,”sort”:”asc”%7D. ↩︎
  3. Kaiser Family Foundation estimates based on 2017 National Health Expenditure Accounts data from CMS, Office of the Actuary; The Kaiser Family Foundation, Medicaid in the United States Fact Sheet, October 2019 (accessed October 2019). http://files.kff.org/attachment/fact-sheet-medicaid-state-US. ↩︎
  4. National Association of State Budget Officers, Summaries of FY 2020 Proposed & Enacted Budgets, (NASBO, September 6, 2019), https://higherlogicdownload.s3.amazonaws.com/NASBO/9d2d2db1-c943-4f1b-b750-0fca152d64c2/UploadedImages/Issue%20Briefs%20/FY20_Summary_of_Proposed_and_Enacted_Budgets.pdf. ↩︎
  5. The Kaiser Family Foundation State Health Facts. Status of State Action on the Medicaid Expansion Decision (accessed August 2019). https://modern.kff.org/health-reform/state-indicator/state-activity-around-expanding-medicaid-under-the-affordable-care-act/?currentTimeframe=0&sortModel=%7B%22colId%22:%22Location%22,%22sort%22:%22asc%22%7D. ↩︎
  6. National Association of State Budget Officers, The Fiscal Survey of the States, (Washington, DC: NASBO, Spring 2019), https://higherlogicdownload.s3.amazonaws.com/NASBO/9d2d2db1-c943-4f1b-b750-0fca152d64c2/UploadedImages/Fiscal%20Survey/NASBO_Spring_2019_Fiscal_Survey_of_States_-_S.pdf. ↩︎
  7. National Association of State Budget Officers, The Fiscal Survey of the States, (Washington, DC: NASBO, Spring 2019), https://higherlogicdownload.s3.amazonaws.com/NASBO/9d2d2db1-c943-4f1b-b750-0fca152d64c2/UploadedImages/Fiscal%20Survey/NASBO_Spring_2019_Fiscal_Survey_of_States_-_S.pdf. ↩︎
  8. National Association of State Budget Officers, Summaries of FY 2020 Budgets, (NASBO, September 6, 2019), https://www.nasbo.org/resources/communityblogs. ↩︎
  9. National Conference of State Legislatures, FY 2020 State Budget Status, (NCSL, July 26, 2019), http://www.ncsl.org/research/fiscal-policy/fy-2020-state-budget-status.aspx. ↩︎
  10. Brian Sigritz, Summaries of FY 2020 Budgets, (Washington, DC: NASBO, September 7, 2019) http://budgetblog.nasbo.org/budgetblogs/blogs/brian-sigritz/2019/09/06/summaries-of-fy2020-budgets. ↩︎
  11. National Association of State Budget Officers, Summaries of Fiscal Year Proposed & Enacted Budgets (Washington, DC: NASBO, September 6, 2019), https://higherlogicdownload.s3.amazonaws.com/NASBO/9d2d2db1-c943-4f1b-b750-0fca152d64c2/UploadedImages/Issue%20Briefs%20/FY20_Summary_of_Proposed_and_Enacted_Budgets.pdf ↩︎
  12. Bureau of Labor Statistics, Unemployment Rates for States, Seasonally Adjusted, (Washington, DC: U.S. Bureau of Labor Statistics, August 2019), https://www.bls.gov/web/laus/laumstrk.htm. ↩︎
  13. Bureau of Labor Statistics, Labor Force Statistics from the Current Population Survey: Unemployment Rate, (Washington, DC: U.S: Bureau of Labor Statistics, October 2019), https://data.bls.gov/timeseries/lns14000000. ↩︎
  14. United States Census Bureau, Health Insurance Coverage in the United States: 2018, (Washington, DC: U.S Census Bureau, September 10, 2019), https://www.census.gov/library/publications/2019/demo/p60-267.html. ↩︎
  15. Samantha Artiga and Olivia Pham, Recent Medicaid/CHIP Enrollment Declines and Barriers to Maintaining Coverage, (Washington, DC: Kaiser Family Foundation, September 2019), https://modern.kff.org/medicaid/issue-brief/recent-medicaid-chip-enrollment-declines-and-barriers-to-maintaining-coverage/. ↩︎
  16. CMCS Informational Bulletin, Oversight of State Medicaid Claiming and Program Integrity Expectations (June 20, 2019), https://www.medicaid.gov/federal-policy-guidance/downloads/cib062019.pdf. ↩︎
  17. Samantha Artiga, Rachel Garfield, and Anthony Damico, Estimated Impacts of Final Public Charge Inadmissibility Rule on Immigrants and Medicaid Coverage (Washington, DC: Kaiser Family Foundation, September 2019), https://modern.kff.org/disparities-policy/issue-brief/estimated-impacts-of-final-public-charge-inadmissibility-rule-on-immigrants-and-medicaid-coverage/. ↩︎
  18. National Association of State Budget Officers, The Fiscal Survey of the States, (NASBO, Spring 2019), https://higherlogicdownload.s3.amazonaws.com/NASBO/9d2d2db1-c943-4f1b-b750-0fca152d64c2/UploadedImages/Fiscal%20Survey/NASBO_Spring_2019_Fiscal_Survey_of_States_-_S.pdf. ↩︎
  19. The Kaiser Family Foundation State Health Facts. Federal Medical Assistance Percentage (FMAP) for Medicaid and Multiplier: FY 2020. Data Source: Federal Register, November 28, 2018 (Vol 83, No. 229), pp 61159. https://modern.kff.org/medicaid/state-indicator/federal-matching-rate-and-multiplier/?currentTimeframe=0&sortModel=%7B%22colId%22:%22FMAP%20Percentage%22,%22sort%22:%22desc%22%7D. ↩︎
  20. Kaiser Family Foundation estimates based on the data reported in: National Association of State Budget Officers, State Expenditure Report – Fiscal Years 2016-2018 (Washington, DC: National Association of State Budget Officers, November 2018), https://higherlogicdownload.s3.amazonaws.com/NASBO/9d2d2db1-c943-4f1b-b750-0fca152d64c2/UploadedImages/SER%20Archive/2018_State_Expenditure_Report_S.pdf. ↩︎
  21. To be eligible for ARRA funds, states could not restrict eligibility or tighten enrollment procedures in Medicaid or CHIP. Vic Miller, Impact of the Medicaid Fiscal Relief Provisions in the American Recovery and Reinvestment Act (ARRA) (Washington, DC: Kaiser Commission on Medicaid and the Uninsured, October 2011), http://kff.org/medicaid/issue-brief/impact-of-the-medicaid-fiscal-relief-provisions/. ↩︎
  22. U.S. Department of Health & Human Services, Office of the Assistant Secretary for Planning and Evaluation. U.S. Federal Poverty Guidelines Used to Determine Financial Eligibility for Certain Federal Programs (January 2019), https://aspe.hhs.gov/poverty-guidelines ↩︎

ACA Open Enrollment: If You Shop on Private Websites Instead of HealthCare.gov

Published: Oct 17, 2019

New alternatives to HealthCare.gov

The Trump Administration permits, and now promotes, the sale of Marketplace plans through private websites.  These are sometimes described as “direct enrollment” sites or “certified enrollment partner” sites.  Private websites may be operated by a health insurance company, such as Blue Cross, Cigna, Ambetter, or Molina.  Other private enrollment websites are operated by web brokers.  Examples of these include GetInsured.com, Health Serpa, iWebQuotes, GoHealth Insurance, Weltheos, and others.

State-run Marketplaces do not permit these competing, alternative sites, but they are available in all HealthCare.gov states.  Depending on the site, you may also be able to complete an application for financial assistance (premium tax credits and cost sharing reductions) for marketplace plans.

At this time, Navigators (professional in-person assisters, certified and funded by the Marketplace) are not permitted to use private enrollment websites.  However, many insurance brokers and agents (professionals funded by commissions from insurance companies) will use private enrollment websites with their clients.  These private alternatives can differ from HealthCare.gov in other ways, described below.  Keep these differences in mind as you shop.  You are always free to use HealthCare.gov to shop for health coverage, explore all of the marketplace plan options, and apply for health insurance.

Plans offered on alternative sites

Private insurance companies that sell Marketplace plans generally will only display their own policies, not those of competing insurers’ Marketplace plans.

By contrast, private web broker sites generally will display plans offered by multiple insurers.  However, web broker sites won’t necessarily display Marketplace plan information in the same way you would find on HealthCare.gov.  For example, private sites may display more prominently the plans that pay higher commissions.

In addition, alternative sites can and sometimes do sell other kinds of plans that don’t meet all the standards for Marketplace plans.  For example, they may sell short-term policies that are cheaper because they cover fewer benefits, exclude coverage of pre-existing conditions, and can refuse to renew coverage if you get sick.  Alternative sites are not allowed to display these non-compliant plans on the same screen as Marketplace plans; if you aren’t sure, you can always check HealthCare.gov to confirm the policy you’re viewing is a Marketplace plan.

Applying for financial help through private sites

Some private websites will connect you back to HealthCare.gov to complete an application for financial assistance.  Other websites, designated as “full service partners” have features that let you apply for financial assistance directly on that site. However, experts who have spent time testing these sites online and with ‘secret shoppers’ have raised some concerns.  For example, when tested, several sites did not correctly identify children in low-income families who might be eligible for Medicaid or CHIP.

Not all certified enrollment partner websites have such problems.  If you have questions or concerns about information provided by these sites, you can check the Marketplace website, HealthCare.gov, to be sure.

Other differences from HealthCare.gov

Some private enrollment websites will ask you questions about your health status (for example, your height, weight, and whether you have pre-existing conditions).  Some ask whether you are seeking short-term or long-term coverage.  Some sites will display certain plan options – such as those paying higher commissions to the web broker – more prominently or with more complete information compared to other plans that pay lower commissions.  And some sites will use personal and health information that you provide to call or send you recorded messages or texts about other products they sell; some will share information with their business partners so they can send you promotional and marketing information.

Finally, in the past, some consumers who enrolled in Marketplace plans through private enrollment websites encountered problems if the Marketplace later needed to communicate with them, but the consumer didn’t have a HealthCare.gov account.

ACA Open Enrollment: If You Buy Health Coverage in the Individual Market

Published: Oct 17, 2019

If you buy your health plan on your own (rather than getting coverage through an employer), you may purchase a 2021 plan either through your state’s health insurance marketplace or in the individual market outside the marketplace. If you are low-income, you may be eligible for Medicaid coverage.

What’s Covered?

All plans in the individual market must be comprehensive, covering doctor visits, hospitalization, prescription drugs and maternity care without restrictions for physical or mental illnesses or conditions that existed before coverage began. Preventive services like immunizations, screenings and birth control, are covered with no additional out-of-pocket cost. Insurers cannot charge you more based on your medical history or because you are a woman. Insurers can only vary premiums based on your age, the number of the people in your family covered by the policy, and whether you use tobacco.

What About Deductibles?

Plans sold both through the marketplace and outside of state marketplaces come in four levels – bronze, silver, gold and platinum.  The metal levels signify differences in the amount of deductibles and other-out-of-of pocket costs they require for covered benefits. In general, bronze plans tend to have the highest deductibles and lowest premiums, while gold plans generally have lower deductibles but charge higher monthly premiums. All plans are required to have an annual out-of-pocket limit on your cost sharing for covered services in-network. That limit can be no higher than $8,550 per person in 2021 ($17,100 in a family policy.) If you are under 30, you may be able to get a “catastrophic” insurance plan that charges the highest possible deductible ($8,550), with monthly premiums that are even lower than under bronze plans.

Deadline for 2021 Plan Signup

Open enrollment for plans on or off marketplaces runs from Nov. 1 to Dec. 15 of this year in most states, including those using healthcare.gov. Coverage takes effect on Jan. 1, 2021. After Dec. 15, you may only sign up for a plan under special circumstances. Open enrollment in states that run their own marketplaces depends on the state. Seven states – California, Colorado, D.C., Massachusetts, Minnesota, New York, and Rhode Island – have extended open enrollment beyond Dec. 15, 2020. Check with your state marketplace for details.

Help With Premiums and Cost Sharing

If you buy a plan through the marketplace, you may be eligible for financial assistance based on your income to help cover premiums. In general, you may be eligible if you are single and your annual 2021 income is between $12,740 to $51,040 or if your household income is between $26,200 to $104,800 for a family of four (the lower income limits are higher in states that expanded Medicaid). The range differs for families of different sizes. Although premiums for marketplace plans increase from year to year, if you qualify for premium tax credits, the tax credit should cover most or nearly all of the cost increase. You may find plans that are offered outside the marketplace, but unless you purchase plans through the marketplace,  you won’t be eligible for financial assistance.

You can also qualify for help with cost sharing if you buy a plan through the marketplace and your income is between $12,760 and $31,900 ($26,200 to $65,500 for a family of four). Special modified silver plans are available with lower deductibles, copays, and annual out-of-pocket limits on cost sharing.

Where to Sign Up

In most states, you can sign up for a marketplace plan using the federal website, www.healthcare.gov. In 15 states – California, Colorado, Connecticut, District of Columbia, Idaho, Maryland, Massachusetts, Minnesota, Nevada, New Jersey, New York, Pennsylvania, Rhode Island, Vermont and Washington – you can get marketplace coverage through state-run websites. New Jersey and Pennsylvania will transition to a state-based marketplace for 2021 coverage; previously New Jersey and Pennsylvania residents used healthcare.gov.

What to Expect at Open Enrollment

If you intend to apply for financial help, you will need to have information about yourself and other household members who need insurance (names, birth dates, social security numbers, or document numbers for immigrants), information about your household income (copy of most recent tax return, or paystubs, etc.), and information about any employer coverage you might be offered.  If you are renewing coverage, you can remain in your current plan if it continues to be offered. Generally, the marketplace will automatically renew you into your current coverage if you do nothing, but it is best to review all plan choices and update your application, even if you decide to remain in your current plan, so you will receive the most accurate financial assistance.

Questions

If you have questions, you can call the federal government’s toll-free 24-hour hotline at 1-800-318-2596. To find in-person help, go to https://localhelp.healthcare.gov. Further information is available at www.healthcare.gov and at https://www.kff.org/health-reform/faq/health-insurance-marketplace-aca/.

News Release

Poll: About Half of Public Supports a Ban on Both Flavored and All E-Cigarettes, Though Most Young Adults Are Opposed 

Four in Five Americans Say Teenagers Who Would Not Otherwise Smoke Use Flavored e-Cigarettes

Published: Oct 17, 2019

With more than 1,000 lung injuries and two dozen deaths nationally associated with vaping and e-cigarettes, a new KFF poll finds a narrow majority (52%) of the public supports a ban on the sale of fruit- and other flavored e-cigarettes, while 44% oppose it.

When asked whether all e-cigarettes should be banned, including those that aren’t flavored, the public is almost evenly divided, with 49% favoring such a step and 47% opposing it. Majorities of younger adults (ages 18-29) oppose both a ban on flavored e-cigarettes (63%) and a ban on all e-cigarettes (62%).

The findings come as the Trump administration, Massachusetts, Michigan, Utah and other state and local governments are seeking to limit or ban the sale of e-cigarettes in response to the multi-state outbreak of lung injuries and concerns about teenagers’ use of the products.

Eight in 10 (80%) Americans say they have heard at least something about illnesses related to e-cigarettes and vaping, and about seven in 10 (69%) say they have heard at least some about state and local efforts to limit sales. Fewer (47%) say they heard at least something about Trump administration efforts to limit the sales of e-cigarettes.

The poll also finds a large majority (81%) believe teenagers who would otherwise not smoke cigarettes are using flavored e-cigarettes. This includes similar shares across parties and age groups.

At the same time, three in 10 (31%) of adults say they believe e-cigarettes are a safer alternative for tobacco smokers who are trying to quit. This includes nearly half (45%) of those under 30 years old.

These attitudes intertwine with people’s views on banning e-cigarettes. Majorities of those who say that teenagers who otherwise have not smoked are vaping or that they are not a safer alternative to tobacco support a ban, while most who hold the opposite views oppose a ban.

Designed and analyzed by public opinion researchers at KFF, the poll was conducted October 3-8, 2019 among a nationally representative random digit dial telephone sample of 1,205 adults. Interviews were conducted in English and Spanish by landline (300) and cell phone (905). The margin of sampling error is plus or minus 3 percentage points for the full sample. For results based on subgroups, the margin of sampling error may be higher.

Data Note: Public Views on Vaping and E-Cigarettes

Published: Oct 17, 2019

Findings

Using data from the October 2019 KFF Health Tracking Poll, this data note examines the public’s attitudes about e-cigarettes and vaping. The findings come amid growing concerns about vaping-related lung illnesses and as the Trump administration and a growing number of states are seeking to limit or ban the sale of e-cigarettes in response. Many of these proposals target the sale of flavored e-cigarettes, which have come under fire for their potential appeal to teenagers. The poll finds that most of the public is aware of the reports of vaping-related illnesses, and that a narrow majority supports a ban on flavored e-cigarettes. The poll also finds that younger adults have distinctly different attitudes and beliefs than older adults when it comes to e-cigarettes and vaping. For example, younger adults are more likely than older adults to oppose a ban and are more likely to see e-cigarettes as a safer alternative for cigarette smokers trying to quit.

Vaping and E-Cigarettes

Earlier this month, the Centers for Disease Control and Prevention announced they “are investigating a multistate outbreak of lung injury associated with use of e-cigarette, or vaping, products”1 . In response to more than 1,000 reported cases of vaping-related illnesses and the growing use of e-cigarettes and vaping products among teenagers, the Trump Administration along with some state governments, including Massachusetts, Michigan, and Utah have sought to limit or ban the sale of e-cigarettes.2 

The poll finds that eight in ten adults have heard a lot (59%) or some (21%) about illnesses related to e-cigarettes and vaping. Awareness about local and state government efforts to limit the sales of e-cigarettes is also high with about seven in ten adults saying they have heard a lot (45%) or some (24%) about such efforts. Fewer adults say they have heard a lot or some about efforts by the Trump administration to limit the sales of e-cigarettes (23% have heard a lot and 25% have heard some).

Figure 1: Majorities Have Heard About Vaping-Related Illnesses And State And Local Efforts To Regulate E-Cigarettes

A narrow majority of adults (52%) support a ban on the sale of flavored e-cigarettes while 44% oppose such a ban. The public is more closely divided on a proposed ban on the sale of all e-cigarettes (49% support, 47% oppose). Majorities of Democrats support both types of bans, while independents and Republicans are more divided in their views. Notably, majorities of younger adults ages 18-29 oppose both a ban on flavored e-cigarettes (63%) as well as a ban on all e-cigarettes (62%).

Figure 2: Narrow Majority Supports Banning Flavored E-Cigarettes, Public Divided On Banning All E-Cigarettes

One possible reason younger adults are more likely to oppose a ban on e-cigarettes may be due to their higher rates of usage of these products. Roughly one in four adults ages 18 to 29 (24%) say they currently use e-cigarettes, while reported use is much lower among those ages 30 and older.

Figure 3: One-Quarter Of Young Adults Say They Currently Use E-Cigarettes

The poll also explored the public’s views on the safety of e-cigarettes and their use by teenagers. Amid concerns about flavored vaping products being marketed to teens, eight in ten (81%) Americans think teenagers who would otherwise not smoke cigarettes are using flavored e-cigarettes. Notably, more than three in four across partisanship and age groups think e-cigarettes are being used by teenagers who would otherwise not be smoking. Majorities of both e-cigarette and tobacco product users (76%) and non-users (82%) say that teenagers who wouldn’t otherwise smoke are using flavored e-cigarettes.

Figure 4: Large Majorities Think Teenagers Who Would Not Smoke Cigarettes Are Using Flavored E-Cigarettes

Last month, the Food and Drug Administration criticized e-cigarette companies for marketing their products as a safer alternative to smoking regular tobacco cigarettes.3  Three in ten (31%) adults think e-cigarettes present a safer alternative for smokers who are trying to quit. However, younger adults ages 18-29 are more likely than their older counterparts to say e-cigarettes are a safer alternative for smokers. About four in ten adults who use e-cigarettes or tobacco products say e-cigarettes are a safer alternative for cigarette smokers who are trying to quit compared to about one in four non-users who say the same.

Figure 5: Three In Ten, Including Almost Half Of Young Adults, See E-Cigarettes As A Safer Alternative For Cigarette Smokers

The poll finds that attitudes about teenage use are associated with different levels of support for vaping bans. Slight majorities of adults who think teenagers who would otherwise not smoke are using flavored e-cigarettes support a ban on the sale of flavored e-cigarettes (56%) and a ban on the sale of all e-cigarettes (52%). Among those who do not think e-cigarettes are being used by teenagers who would otherwise not smoke, about a third support a ban on flavored e-cigarettes (34%) and ban on all e-cigarettes (37%).

Figure 6: Majority Of Those Who Think E-Cigarettes Are Attracting Teens Support A Ban

Views on e-cigarettes as a safer alternative for cigarette smokers who are trying to quit are also associated with different levels of support for e-cigarette bans. Almost eight in ten adults (78%) who see e-cigarettes as a safer alternative oppose a ban on all e-cigarettes while 65% of those who do not see it as safer support a ban. Similarly, 68% of those who see e-cigarettes as a safer alternative for smokers oppose a ban on flavored e-cigarettes while a similar proportion of those who do not think it is safer support a ban (64%).

Figure 7: Those Who See E-Cigarettes As A Safer Alternative For Smokers Oppose Bans on Flavored, All E-Cigarettes

Endnotes

  1. Centers for Disease Control and Prevention. (2019, October). Outbreak of Lung Injury Associated with E-Cigarette Use, or Vaping. https://www.cdc.gov/tobacco/basic_information/e-cigarettes/severe-lung-disease.html ↩︎
  2. Thomas, K., Kaplan, S. (2019, October). E-Cigarettes Went Unchecked in 10 Years of Federal Inaction. The New York Times. https://nyti.ms/2Bc05tE ↩︎
  3. Perrone, M. (2019, September). Juul warned over claims e-cigarette safer than smoking. AP News. https://www.apnews.com/3aa106fc85c04cf9bd344222a2875da8   ↩︎
News Release

Many Community Health Centers Report That Immigrant Patients Are Declining to Enroll in Medicaid or Renew Their Coverage Amid Concerns About Changes to Public Charge Rules

Published: Oct 15, 2019

Nearly half (47%) of community health centers report that many or some immigrant patients declined to enroll themselves in Medicaid in the past year, according to a new KFF survey, and nearly a third (32%) of centers say that some patients dropped or decided not to renew such coverage.

Interviews with health center staff report similar findings and indicate that fear and confusion surrounding recent immigration policy contribute to these changes. The findings come at a time when the Trump administration is tightening “public charge” rules under which immigrants can be denied entry to the U.S. or legal permanent resident status if federal officials determine they are likely to rely on public programs such as Medicaid and certain housing and nutrition programs.  The final rule change to “public charge” inadmissibility policies was scheduled to take effect October 15, but a federal judge in New York issued a temporary injunction blocking it

The survey and interviews — which are based on the perceptions of health center staff about the patients they serve who are immigrants — also find some changes in health care utilization. According to survey data, nearly three in ten (28%) health centers report declines among many or some adult immigrant patients in seeking health care in the past year. More than one in five (22%) centers reported reductions in health care use among some or many children in immigrant families. Interviews with health centers reveal that these changes include pregnant women and people with chronic conditions.

Nationally, 1,362 health centers provide care to 28 million patients in medically underserved rural and urban areas each year, often serving patients with low incomes and who lack health insurance. The survey of community health centers, which covered a broad range of topics, was conducted from May to July 2019 and designed and analyzed by researchers at KFF and the Geiger Gibson Program in Community Health Policy at the George Washington University.

The findings in the new issue brief, Impact of Shifting Immigration Policy on Medicaid Enrollment and Utilization of Care among Health Center Patients, also are based on structured phone interviews with health center directors and senior staff conducted by KFF researchers in California, Massachusetts, Missouri and New York.

Health center officials report that they are training staff to answer questions about the public charge rule and are working to ensure access to care for their patients, for instance by providing home visits and free medication delivery to some patients.

Other recent work by KFF on immigrants and health care includes an issue brief on estimated impacts of the final public charge rule on immigrations and Medicaid coverage, and a fact sheet on President Trump’s proclamation suspending entry for immigrants without health coverage.

News Release

Visualizing Health Policy: US Public’s Perspective on Prescription Drug Costs

Published: Oct 15, 2019

This Visualizing Health Policy infographic examines public opinion on prescription drug costs in the United States (US). Over the past 20 years, US drug spending has increased by 330% compared to a 208% increase in total US health expenditures. A large majority (78%) of the public see drug company profits as the top contributor to higher health care spending. Lowering drug costs is the public’s top health policy priority for the US Congress.  While most adults (59%) say prescription drugs have made their lives better, many (79%) also say the cost is unreasonable. Three in 10 report they have not taken medications as prescribed in the past year because of the cost. Across political affiliation, the public supports many actions to lower drug costs. Requiring drug companies to include list prices in ads, making it easier for generics to come to market, and allowing the government to negotiate with drug companies were among the most popular strategies.

Visualizing Health Policy is an infographic series produced in partnership with the Journal of the American Medical Association (JAMA). The full-size infographic is freely available on JAMA’s website and is published in the print edition of the journal.

Visualizing Health Policy: US Public’s Perspective on Prescription Drug Costs

Published: Oct 15, 2019

This Visualizing Health Policy infographic examines public opinion on prescription drug costs in the United States (US). Over the past 20 years, US drug spending has increased by 330% compared to a 208% increase in total US health expenditures. A Large majority (78%) of the public see drug company profits as the top contributor to higher health care spending. Lowering drug costs is the public’s top health policy priority for the US Congress.  While most adults (59%) say prescription drugs have made their lives better, many (79%) also say the cost is unreasonable. Three in 10 report they have not taken medications as prescribed in the past year because of the cost. Across political affiliation, the public supports many actions to lower drug costs. Requiring drug companies to include list prices in ads, making it easier for generics to come to market, and allowing the government to negotiate with drug companies were among the most popular strategies.

Visualizing Health Policy is an infographic series produced in partnership with the Journal of the American Medical Association (JAMA). The full-size infographic is freely available on JAMA’s website and is published in the print edition of the journal.


Impact of Shifting Immigration Policy on Medicaid Enrollment and Utilization of Care among Health Center Patients

Authors: Jennifer Tolbert, Samantha Artiga, and Olivia Pham
Published: Oct 15, 2019

Executive Summary

Executive Summary

On August 14, 2019, the Trump administration published a final rule to broaden the programs the federal government will consider in public charge determinations to include Medicaid coverage for non-pregnant adults and certain previously excluded nutrition and housing programs. To learn about the possible early effects of the public charge rule and other immigration policies on patients at community health centers, this brief draws on interviews and survey data to capture health center directors’ and staff’s perceptions of changes in coverage and service use among their patients who are immigrants. Key findings include:

  • Health centers reported that, in recent months, immigrant patients have declined to enroll or reenroll themselves and/or their children in Medicaid for fear of public charge. At some health centers interviewed, these changes were widespread with many patients dropping Medicaid while at others, the changes were occurring among only a small number of patients. Respondents noted those dropping Medicaid include immigrants not subject to the public charge rule, such as pregnant women.
  • Health center respondents reported patients are confused about the new rule and are afraid to provide identifying information. Patients are not sure which programs the new rules apply to and who is subject to them. Respondents also noted immigrant patients are hesitant to provide any identifying information that could jeopardize their status.
  • According to respondents, the public charge rule is creating a “chilling” effect, leading to decreased enrollment in other programs not subject to public charge. Health centers reported that in addition to declining to sign up for Medicaid, patients are also not signing up for WIC and other state and local food assistance programs which are not subject to the public charge rule.
  • About half of health centers reported a drop in utilization by immigrant patients, especially among pregnant women. They noted declines in use of services by patients with chronic conditions, such as diabetes and HIV, and those needing preventive care. Health centers expressed particular concerns regarding pregnant women, who they say are initiating prenatal care later in pregnancy and are attending fewer prenatal care visits due to fears around public charge.
  • Health centers are training staff to answer questions on public charge and are working to ensure access to care for their patients. Some respondents said they are now providing home visits and free medication delivery to ensure their patients continue to get care.

Issue Brief

Introduction

Since taking office, the Trump Administration has implemented a range of policy changes focused on enhancing immigration enforcement and limiting immigration. Most recently, on August 14, 2019, the administration published a final rule to change “public charge” policies that govern how the use of public benefits may affect individuals’ ability to enter the U.S. or adjust to legal permanent resident (LPR) status (i.e., obtain a “green card”). The rule, which was proposed in October 2018, broadens the programs that the federal government will consider in public charge determinations to include previously excluded health, nutrition, and housing programs, including Medicaid coverage for non-pregnant adults for a wide range of health care needs. The rule will likely lead to decreased enrollment in Medicaid, CHIP, and other programs broadly among immigrant families, beyond individuals directly impacted by the rule. Prior to this final rule, there were growing reports of individuals disenrolling or choosing not to enroll themselves or their children in Medicaid and CHIP due to growing fears and uncertainty stemming from the shifting immigration policy environment.1  The final rule was scheduled to go into effect on October 15, 2019, but on October 11th a nationwide preliminary injunction was issued, blocking implementation.

Community health centers are often on the front lines of policy changes affecting Medicaid coverage. They serve a diverse, predominantly low-income patient population, including low-income immigrants in many communities, and nearly three-quarters of health center patients are covered by Medicaid or are uninsured. Given their role serving immigrant families, the experiences of health centers and their patients can provide early insight into the potential effects the public charge rule and other immigration policies are having on health coverage and use of services by immigrant patients.

To learn about these possible early effects, this brief draws on interviews and survey data to capture health center directors’ and staff’s perceptions of changes in coverage and service use among patients who are immigrants. It relies on interviews with 16 directors and senior staff at health centers in four states—California, Massachusetts, Missouri, and New York– conducted in September 2019, after the final public charge rule was issued. The interviews asked about perceived trends in health coverage of immigrant patients and their families as well as changes in utilization of health care and social services. It also includes results from the 2019 KFF/George Washington University Community Health Center Survey about perceived changes in Medicaid enrollment and health care use among immigrant patients and their families. The survey of staff from 511 health centers was fielded from May through July 2019, after the administration had released the proposed rule to make changes to public charge policy but prior to it being finalized.

Key Findings

Changes in Medicaid Enrollment

Based on findings from the health center survey, nearly half (47%) of health centers reported that many or some immigrant patients declined to enroll themselves in Medicaid in the past year (Figure 1). In addition, nearly one-third (32%) said that many or some immigrant patients disenrolled from or declined to renew Medicaid coverage. Health centers also report enrollment declines among children in immigrant families. More than a third of (38%) health centers reported that many or some immigrant patients were declining to enroll their children in Medicaid over the past year, while nearly three in ten (28%) reported many or some immigrant patients were disenrolling or deciding not to renew Medicaid coverage for their children.

Figure 1: Health Centers Reporting Changes in Medicaid Enrollment among Immigrant Patients and Families

Follow-up interviews with health center staff are consistent with these survey findings of declining Medicaid enrollment among immigrant patients and their families. Staff at all health centers reported that, in recent months, immigrant patients have declined to enroll or reenroll themselves and/or their children in Medicaid. Health centers do not collect data on immigration status of patients, so these observations (as well as the survey results) are based on health centers’ perceptions of who they believe to be immigrant families using available information. Immigrant families generally view health center staff as a trusted resource, and in turn, are willing to discuss their immigration status with these staff and clinicians. In addition, enrollment staff who assist patient in applying for Medicaid and other coverage have access to this information as part of the application process. At some health centers interviewed, these changes were widespread with many patients dropping Medicaid while at others, the changes were occurring among only a small number of patients. Health center directors at two health centers cited shifts in their payer mix data, with the share of uninsured health center patients increasing, as possible evidence of these changes. Others cited data and information reported by frontline enrollment staff. Even health center directors who noted few patients at their health centers were dropping coverage recounted conversations they had with patients who declined to enroll in Medicaid. Health centers serving smaller shares of immigrant patients were more likely to report that only a few patients were choosing not enroll in Medicaid.

Our patient navigation team which is multilingual and multiethnic used to work with upwards of 10 people a day to get them signed up for coverage… men, women, children, etc. Now they’re down to 2 to 3 clients a day if they’re lucky. (Health Center CEO, MO)

Our insurance companies… we have Healthfirst at all of our sites to enroll folks. And they’re seeing that folks aren’t re-enrolling. They’re actually coming up to our sites to do a public charge information session for all the folks because they’re seeing disenrollments. (Health Center President, NY)

We had one lady who came in and she said, ‘I’m going to apply for my children because they are citizens, but I’m not, so I am not going to apply.’ (Intake/Outreach Supervisor, MA)

According to health center interview respondents, immigrant patients are confused by the new rules and many are receiving misinformation. All respondents reported confusion among their immigrant patients over new the new rules. They said patients are asking questions of health center staff and noted that many patients are not sure which programs the new rules apply to and who is subject to them. Based on reports from patients and their own conversations with advocates and the legal community, several health center directors noted that some of the confusion stems from some immigration lawyers advising clients to avoid all public programs and services out of an abundance of caution. At the same time, they also said rumors and misinformation spread quickly through communities. For example, a health center director in California recounted how misinformation was quickly spread through WeChat, a social media and messaging app which is commonly used in the predominantly Asian immigrant community served by the health center.

What we have heard from our staff on the front line, the folks who interface with our patients around the enrollment, they are hearing that people are afraid around disclosing more information about their families who would not even be impacted, but because there’s a lot of misinformation out in the community… they’re not clear in terms of how that’s going to impact them. (Health Center Compliance Officer, CA)

Health center respondents reported that immigrant patients are increasingly afraid to disclose personal information. Interview respondents across all health centers reported that some immigrant patients have become reluctant to disclose any personal information out of fear that the health center would share that information with authorities. This information is necessary not only to assess eligibility for Medicaid and other federal programs, but also for state and local social services programs. According to respondents, the fear stems from multiple sources—fear of deportation among immigrants who lack legal status and fear that sharing any information could jeopardize their or a family member’s efforts to obtain a green card or citizenship.

The reason provided is fear and uncertainty related to immigration and customs enforcement agents potentially showing up and carting them away as they enter or leave the building or the federal government getting the information they provide us. (Health Center President, MO)

People are not generally going to feel comfortable providing their name and information, so we’re going to be thoughtful about how we collect that information from our patients, so that we’re not also making them afraid to give information about their own status – we’ll serve them regardless. (Health Center CEO, CA)

Health center interview respondents reported that the patients disenrolling or declining to enroll in Medicaid are a broader group of immigrants than those targeted by the public charge rule. Health center respondents reported that some patients declining to enroll in Medicaid already have Lawful Permanent Status (LPR), and therefore would not be subject to the new public charge rule. They noted these decisions may stem from fear that the patients will lose their current lawful status or that they may be barred from applying for citizenship if they receive any services. Another explanation offered is that these patients are concerned that they will jeopardize the safety or status of a family member. Respondents also reported that patients have expressed concerns that enrolling their children in these programs, even if their children were born in the United States, may jeopardize their status or the status of family members. In addition, although pregnant women are categorically eligible for Medicaid and would be unaffected by public charge if they enroll in Medicaid, health center respondents reported that pregnant women are declining to enroll in Medicaid or disenrolling, in some cases out of fear of risking future opportunities for residency or citizenship.

Approximately 10% of those foreign born women who were pregnant will tell us they do not intend to, they do not want to apply for Medicaid… because they are afraid. Their fears range from being deported, to future opportunities for residency or citizenship. It’s a wide range of things they are afraid of, but ultimately it’s jeopardizing their status. (Health Center Vice President, MO) 

Fear of public charge implications extends beyond Medicaid to other health and social service programs, including some that are not included in the public charge rule. In addition to helping patients enroll in Medicaid and other health coverage programs, most health centers also assist patients with enrollment in a range of social service programs, including food and housing assistance programs, job training programs, and education programs. Based on this enrollment assistance experience, some interview respondents reported immigrants are avoiding housing and food assistance programs. While the public charge rule includes some housing assistance programs and the Supplemental Nutrition Assistance Program (SNAP), it does not include other key nutrition programs such as WIC and school lunch. A major concern among respondents was data suggesting that immigrant pregnant women are refusing WIC services. Several respondents noted that their WIC caseloads are down and attributed the trend to public charge fears. Respondents in California and Missouri also noted that immigrant patients are declining to enroll in or accept referrals for state and local food assistance programs, even though these programs are not subject to public charge. A health center serving New York City reported that patients with HIV or AIDS are hesitating to enroll in or are disenrolling from the city-run HIV/AIDS Services Administration (HASA) program out of fear that the program’s services fall under the public charge rule.

We began to see a decline in people coming in for their basic health screenings, for nutrition services. Even if they were hungry, they were not telling us, so we had to change. As we saw the WIC numbers [decline]… we started asking questions as part of their visit. (Health Center President, MA)

Changes in Health Care utilization

According to the survey, nearly three in ten (28%) health centers reported declines among many or some adult immigrant patients in seeking health care in the past year. Over one in five (22%) reported reductions in health care use among some or many children in immigrant families (Figure 2).

Figure 2: Health Centers Reporting Changes in Health Care Use among Immigrant Patients and Families

The findings from the interviews were consistent with findings from the health center survey about changing utilization among immigrant patients and their families. For example, health center directors in Massachusetts and Missouri described significant drops in utilization as evidenced by an increase in appointment cancellations and no shows by immigrant patients. Another health center director noted that, while their patient base remains strong, patient encounters have declined, so much so that their clinicians are working at only about 80% capacity. At the same time, other health center directors in Massachusetts and Missouri have observed little change in service use by their immigrant patients. A health center director in California said, while they are seeing utilization changes, it is too early to attribute those changes solely to the public charge rule and that other factors, including increased ICE enforcement activities, may be playing a role.

We are extremely worried about the trend we’ve noticed over the last 6-8 months, which is that people are afraid to keep their appointments, to sign up for appointments, to come into the buildings or the various clinical sites and fill out basic paperwork, or even provide their address or ID or other personal information. (Health Center President, MO)

Our overall number of patients we serve remains pretty steady. Our actual encounters have gone down… In the past, say 5 years ago, you couldn’t get an appointment because we were so packed. Now, I would say the majority doctors are 80 percent full. (Health Center President, CA)

Health center interview respondents reported that pregnant women are delaying prenatal care or seeking care less frequently. Nearly all respondents that provide obstetric care noted that immigrant pregnant women are initiating prenatal care later in their pregnancies. They indicated that efforts to educate pregnant women often are insufficient to overcome fears about enrollment and that many women continue to decline to enroll in Medicaid or access care even after being told they are exempt from the public charge rule. Respondents expressed particular concerns about the potential consequences of this trend on health outcomes, noting that it was eroding years of work and progress to encourage pregnant women to access prenatal care early in their pregnancies.

We have a seen a decline in our pregnant visits… insured or otherwise. When we drill down and actually talk to them – “Why did you wait until your sixth month to come in?” they say ,”Oh because I’m afraid.” (Health Center CEO, NY)

Health center directors reported that some of their patients with chronic conditions are foregoing care and others are not getting preventive care. In particular, respondents whose programs offer group sessions for diabetes patients noted a drop in participation in their Spanish-language group sessions. A health center in New York reported a decline in the use of PrEP among their immigrant patients at risk for exposure to HIV. Respondents also suggested that fear of using services may prevent patients with acute care needs from getting care. One respondent pointed out that, during the height of the flu season last winter, visits at an urgent care clinic in California dropped significantly and coincided with rumors related to the public charge rule spreading on social media.

One of the central tenets of diabetes care for example is that, in addition to managing the person’s medical condition, we do group education sessions for them to teach them how to shop healthy, eat healthy… that is critical to the health status outcomes to the diabetes patients. We have seen a steady drop in attendance and participation (Health Center CEO, MO)

This action [public charge] totally undermines the work that we’re trying to do around managing population health. I think when you’re really going to see it is around flu season. (Health Center CEO, CA)

Effects on health center patients, staff and operations

Health center interview respondents reported their staff are observing increased rates of anxiety and stress-related conditions among their immigrant patients. As a result, behavioral health counselors are getting more requests for counseling and therapy. Respondents also expressed significant worries about the effects on children, describing their pediatric patients as being traumatized by what is happening to their families and in their communities.

The children are terrified… One pediatrician relayed his conversation with a 7-year-old when the mother went outside to take a phone call. The child said, “Can you give something to my mother because she’s afraid all the time. She doesn’t want to let me out…” (Health Center CEO, NY)

Several respondents said they were implementing new protocols and services to ensure the highest need patients continue to receive care despite growing fears. A health center director in Massachusetts reported that case managers will contact the highest risk patients and will arrange for home visits and free delivery of medications if patients are too afraid to come to the clinic. A health center in New York serving a large migrant community sends staff out to farms in rural areas to deliver babies and treat injuries for patients who will not come to the health center or other providers out of fear of jeopardizing their ability to continue working in the US.

They had a person that was severely injured on the farm and they could not get him to go to the hospital because of the fear of going out there… (Health Center President, NY)

Nearly all health center interview respondents said they are training staff, starting with frontline staff, but working through the organization to include clinicians and others, to ensure they understand the new rules and can respond accurately to patient questions. Respondents operating large programs noted the difficulty associated with training all staff and worried about patients potentially getting conflicting information from different staff, which could possibly lead to an erosion of trust between the patient and the health center. At the same time, several respondents voiced concerns over the effect of the challenging environment facing immigrants on their staff, many of whom are immigrants themselves and live in the communities served by the health centers.

We can’t get information out fast enough to alleviate the fears. Just getting our own staff trained to understand all the nuances of this, it’s incredibly difficult. (Health Center President, CA)

Giving staff lists on what public benefits are impacted, frequently asked questions so they can orient both the patients and they can orient themselves on what they can tell our patients and not continue the fear and chill factor that we’re seeing. We’re also going to do trainings with our HSF folks, the frontline level staff so they feel comfortable responding to these questions. (Health Center Compliance Officer, CA)

Several health center interview respondents reported the decline in patients covered by Medicaid combined with an increase in the number of uninsured patients and an overall drop in patient visits has led to revenue losses. For some, the revenue declines have been manageable, but two respondents reported experiencing operating losses this year that they attribute to immigration policies. A respondent in Missouri noted that as patients drop Medicaid and move onto the sliding fee scale, they often struggle to make those payments, increasing financial pressures on the families and on the health center. Respondents were clear in noting that not all of these effects are attributable solely to the public charge and that there are multiple factors.

Because of what’s going on and the reluctance of people to sign up for Medicaid even when they are fully eligible… they are switching to self-pay. That means that percentage of self-pay is going up. That hits our bottom line. If the [percentage of] self-pay comes up to 50 percent, you know your health center is suffering financially… We’re not making enough to pay our own bills. (Health Center CEO, MO)

My revenue is down so significantly because… the lack of reenrollment for Medicaid benefits and uptick in uninsured visits is one-to-one. What we realized is that … patients are coming in, but they’re not coming in and using their Medicaid benefits. (Health Center CEO, NY)

Conclusion

Consistent with other recent research, these findings reporting the perceptions and experiences of community health centers suggest that shifting immigration policies are leading to decreased participation in Medicaid among some immigrant families and their children who use services at community health centers. Health center directors and staff reported that declines in Medicaid coverage are occurring broadly among immigrant patients and their children, beyond those targeted by the public charge rule and including those who are explicitly exempt, such as pregnant women. These findings also indicate that growing fear and uncertainty among immigrant families in response to shifting immigration policy are contributing to declines in health care use among some immigrant patients and their families, including among pregnant women. Decreased coverage and declines in health care use could have a negative impact on the health and well-being of families and children, and will likely have longer-term consequences. Moreover, these changes carry the potential for broader, community-wide implications as decreases in coverage increase financial strain on health centers, thereby adding to challenges to providing care.

Methods

The findings in this brief are based on structured phone interviews with health center directors and senior staff conducted by Kaiser Family Foundation in four states: California, Massachusetts, Missouri, and New York. In total, we conducted interviews with 16 health centers across the four states—two each in California, Massachusetts, and Missouri, and ten in New York. Health centers were selected to represent a mix of characteristics, including location in urban vs. rural areas, size, and share of immigrant patients served. The health centers’ patient populations ranged in size from 15,000 – 91,000 total patients and estimates of immigrant patients served ranged from 10% to over 80%. The interviews were conducted in September 2019.

The brief also reports findings from the 2019 Kaiser Family Foundation/George Washington University Survey of Community Health Centers. The survey was designed and analyzed by researchers at KFF and GWU, and conducted by the Geiger Gibson Program in Community Health Policy at GWU. It was fielded from May to July 2019 and was emailed to 1,342 CEOs of federally funded health centers in the 50 states and the District of Columbia identified in the 2017 Uniform Data System. The response rate was 38%, with 511 responses from 49 states and DC.

Additional support for the survey was provided by the RCHN Community Health Foundation as part of its ongoing research collaborative with the Geiger Gibson Program.

2019 Survey of Community Health Centers

(Questions 1-15 and 17-34 reserved for future release)

Q16.     Over the past year, has your health center noticed any of the following among your immigrant patients and their family members?

Please indicate whether the following have been seen among many patients, some patients, a few patients, no patients, not applicable, or don’t know.

Patients who refuse to enroll in Medicaid for themselves

Patients who refuse to enroll in Medicaid for their children

Patients who disenroll or refuse to renew their own Medicaid coverage

Patients who disenroll or refuse to renew Medicaid coverage for their children

A reduction in the number of adult patients seeking care from the health center

A reduction in the number of patients seeking care for their children from the health center

Endnotes

  1. Samantha Artiga and Petry Ubri, Living in an Immigrant Family in America: How Fear and Toxic Stress are Affecting Daily Life, Well-Being, & Health, (Washington, DC: Kaiser Family Foundation, December 2017), https://modern.kff.org/disparities-policy/issue-brief/living-in-an-immigrant-family-in-america-how-fear-and-toxic-stress-are-affecting-daily-life-well-being-health/; Samantha Artiga and Barbara Lyons, Family Consequences of Detention/Deportation: Effects on Finances, Health, and Well-Being (Washington, DC: Kaiser Family Foundation, September 2018),https://modern.kff.org/disparities-policy/issue-brief/family-consequences-of-detention-deportation-effects-on-finances-health-and-well-being/; and Hamutal Bernstein, Dulce Gonzalez, Michael Karpman, and Stephen Zuckerman, With Public Charge Rule Looming, One in Seven Adults in Immigrant Families Reported Avoiding Public Benefit Programs in 2018, (Washington, DC: Urban Institute, May 2019), https://www.urban.org/urban-wire/public-charge-rule-looming-one-seven-adults-immigrant-families-reported-avoiding-public-benefit-programs-2018 ↩︎