How Many Uninsured Are in the Coverage Gap and How Many Could be Eligible if All States Adopted the Medicaid Expansion?
Issue Brief
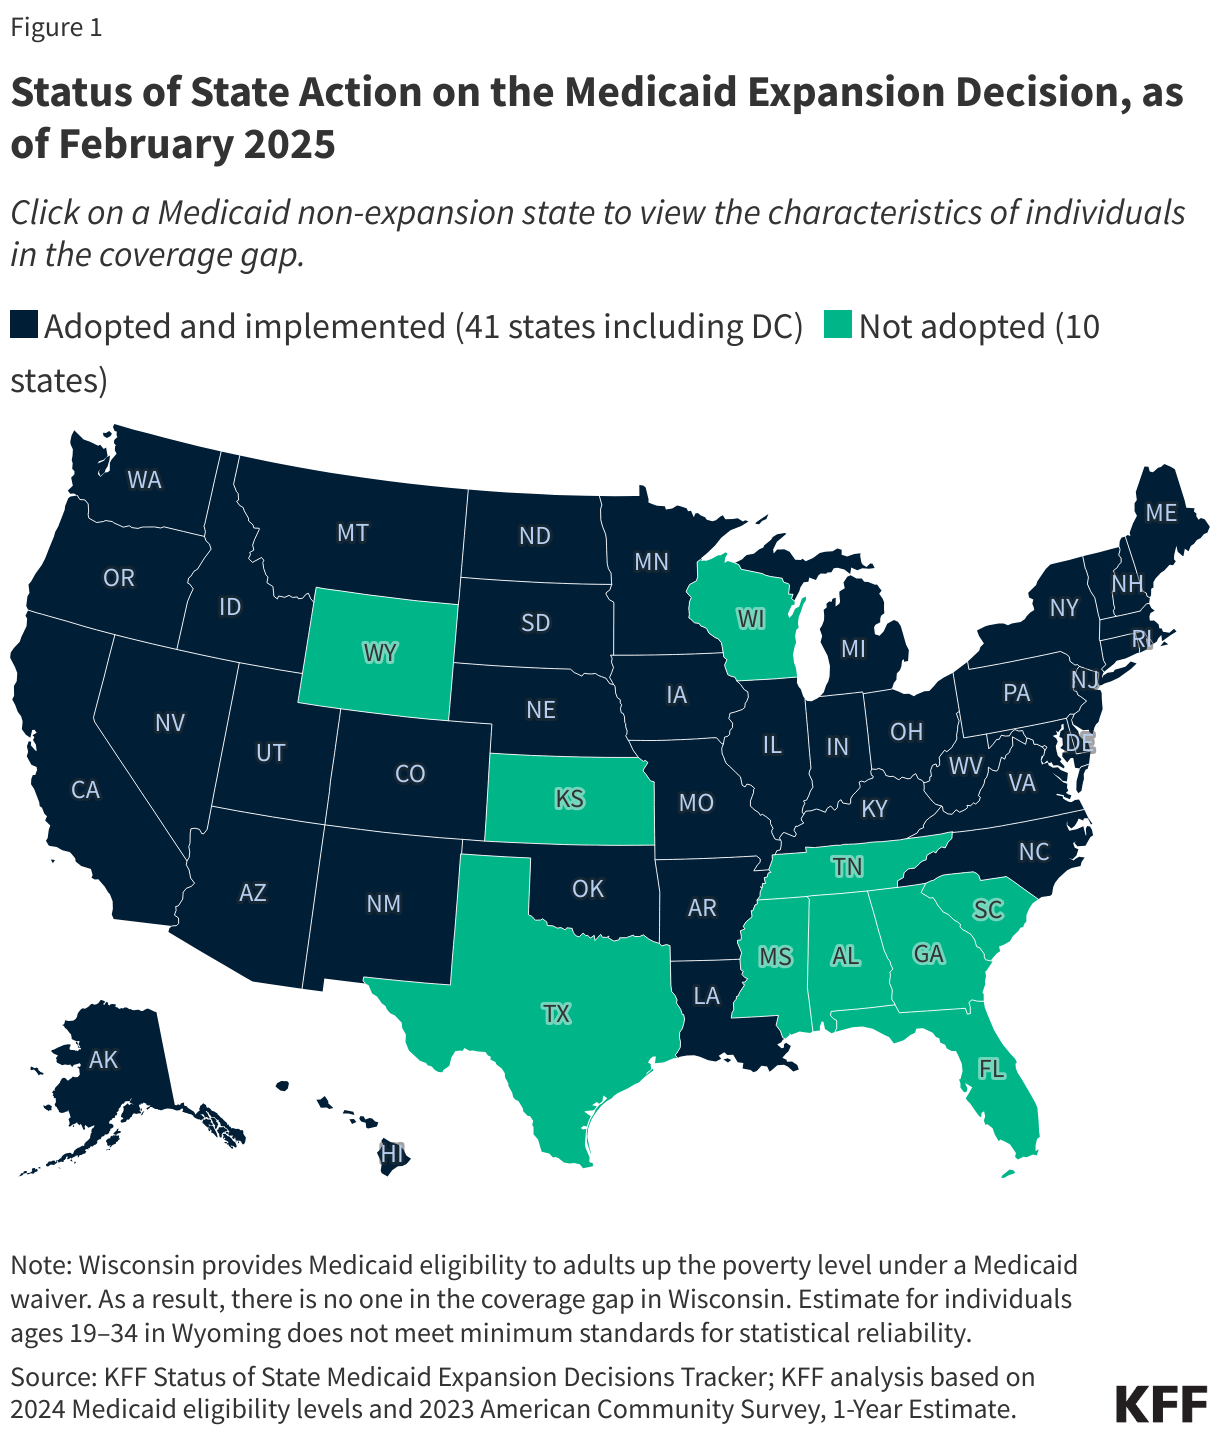
Since implementation of the Affordable Care Act’s (ACA) Medicaid expansion in 2014, all but ten states have adopted the expansion to cover adults on Medicaid with income up to 138% of the federal poverty level (FPL) helping to drive the uninsured rate among the population under age 65 to record low levels. While the number of people who fall into the coverage gap has declined as more states implemented the expansion, 1.4 million uninsured individuals remain in the coverage gap in the ten states that have not expanded Medicaid.
Limited Medicaid eligibility in non-expansion states leaves many adults without children, people of color, and those with disabilities without coverage. Most adults in the coverage gap are in working families, though about one in six have a disability that requires ongoing health care and may limit their ability to work. Using data from 2023, this brief estimates the number and characteristics of uninsured individuals in these ten non-expansion states who could gain coverage if Medicaid expansion were adopted.
The future of the Affordable Care Act’s (ACA) Medicaid expansion is uncertain as Congress considers significant changes to Medicaid financing. Some proposals under consideration would eliminate the enhanced 90 percent federal matching rate for the expansion population or make other changes to federal payments to states for this group. Any cuts in federal funding for expansion enrollees would likely lead a number of states to rollback coverage for this population and would increase the number of people who fall into the coverage gap and become uninsured.
How many people are in the coverage gap?
The coverage gap exists in states that have not adopted the ACA’s Medicaid expansion. Under the ACA, Medicaid was expanded to cover adults ages 19 to 64 with incomes up to 138% FPL (or $21,597 for an individual in 2025). This income threshold applied to parents and to adults without dependent children who were previously not eligible for Medicaid. While the ACA intended to require all states to implement the Medicaid expansion, a 2012 Supreme Court ruling made expansion optional for states. As of February 2025, 41 states, including the District of Columbia, have adopted Medicaid expansion (Figure 1).
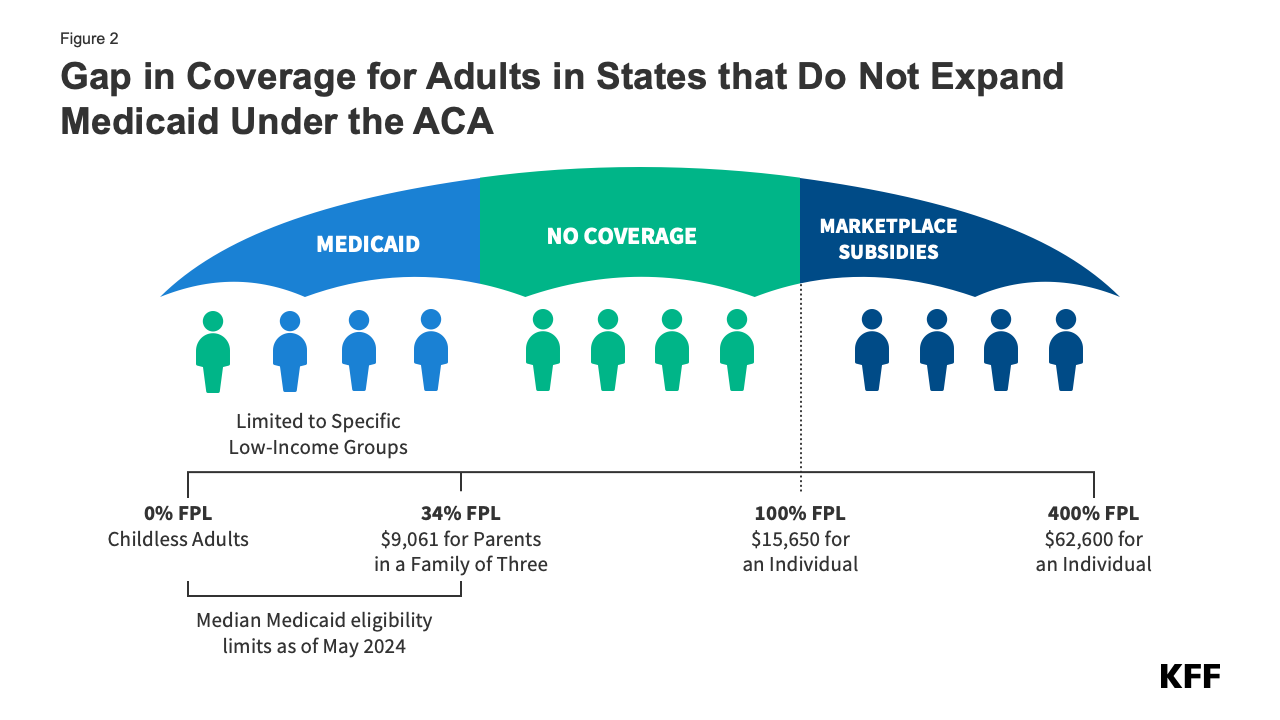
In the ten states that have not adopted Medicaid expansion, an estimated 1.4 million individuals remain in the coverage gap. These adults have incomes above their state’s Medicaid eligibility threshold but below the poverty level, making them ineligible for ACA Marketplace subsidies (Figure 2). Because the Medicaid expansion was expected to be mandatory for states, the ACA did not provide eligibility for subsidies in the Marketplaces for people below poverty.
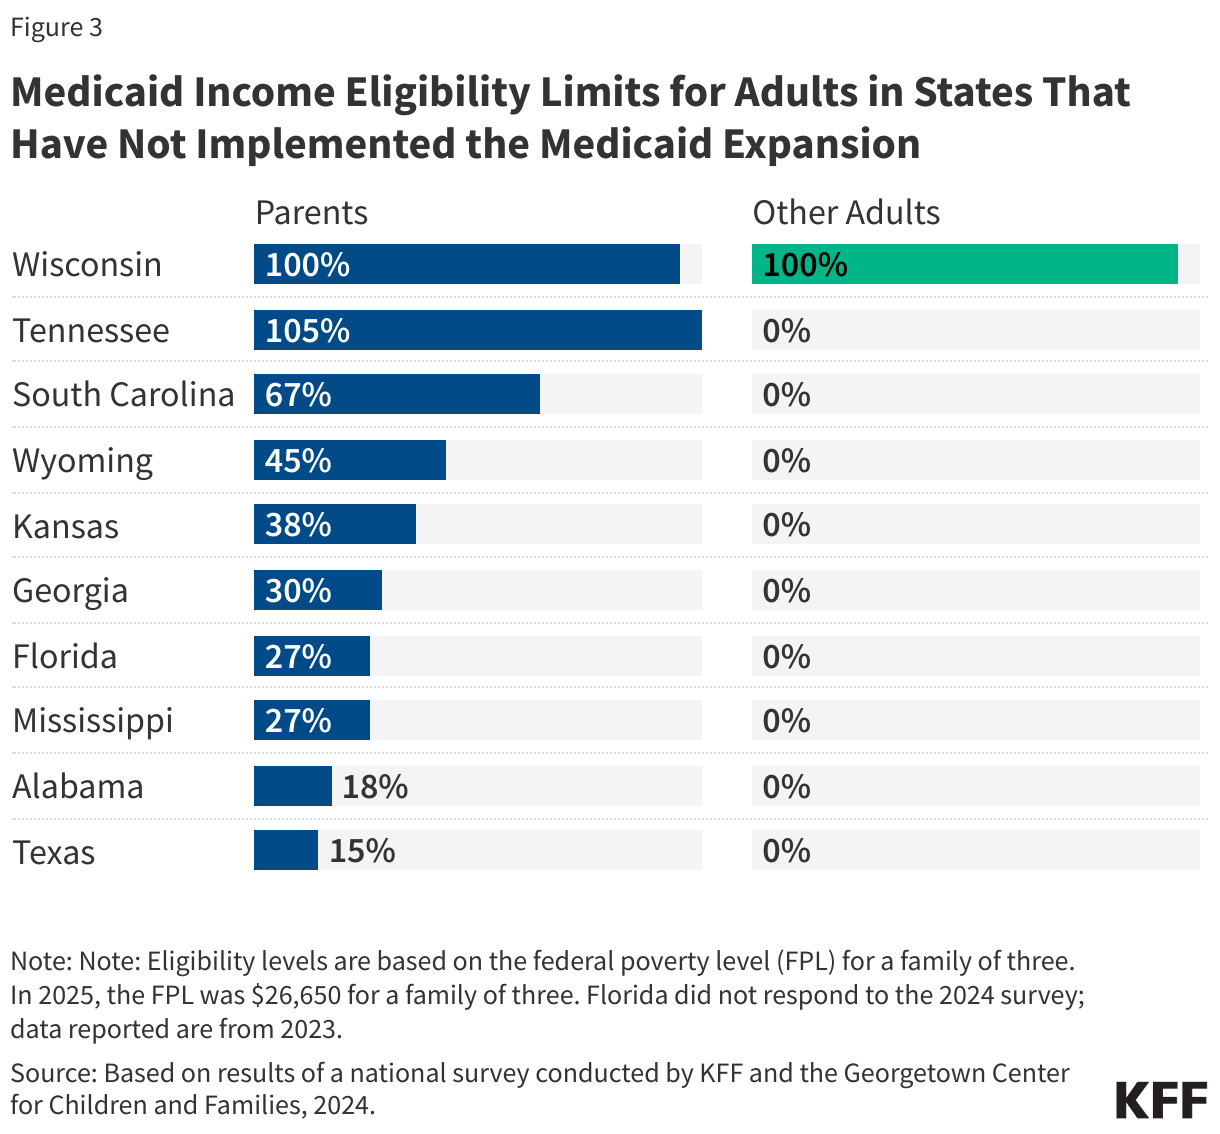
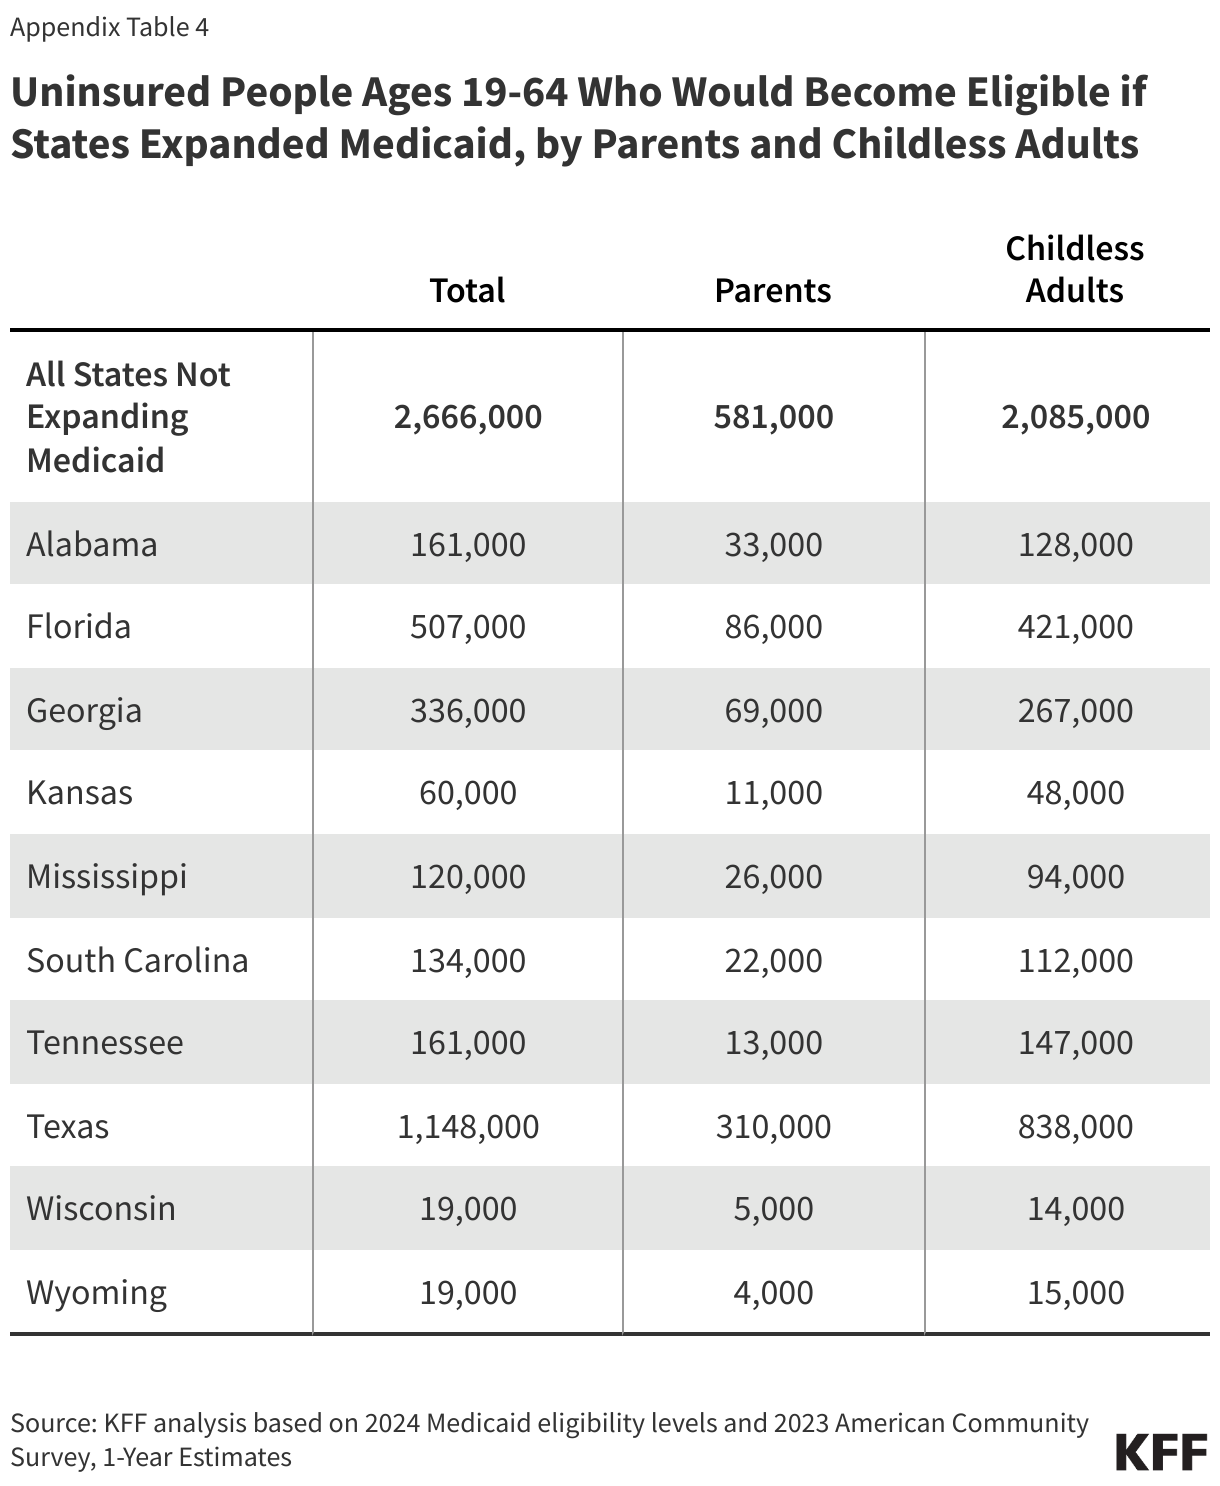
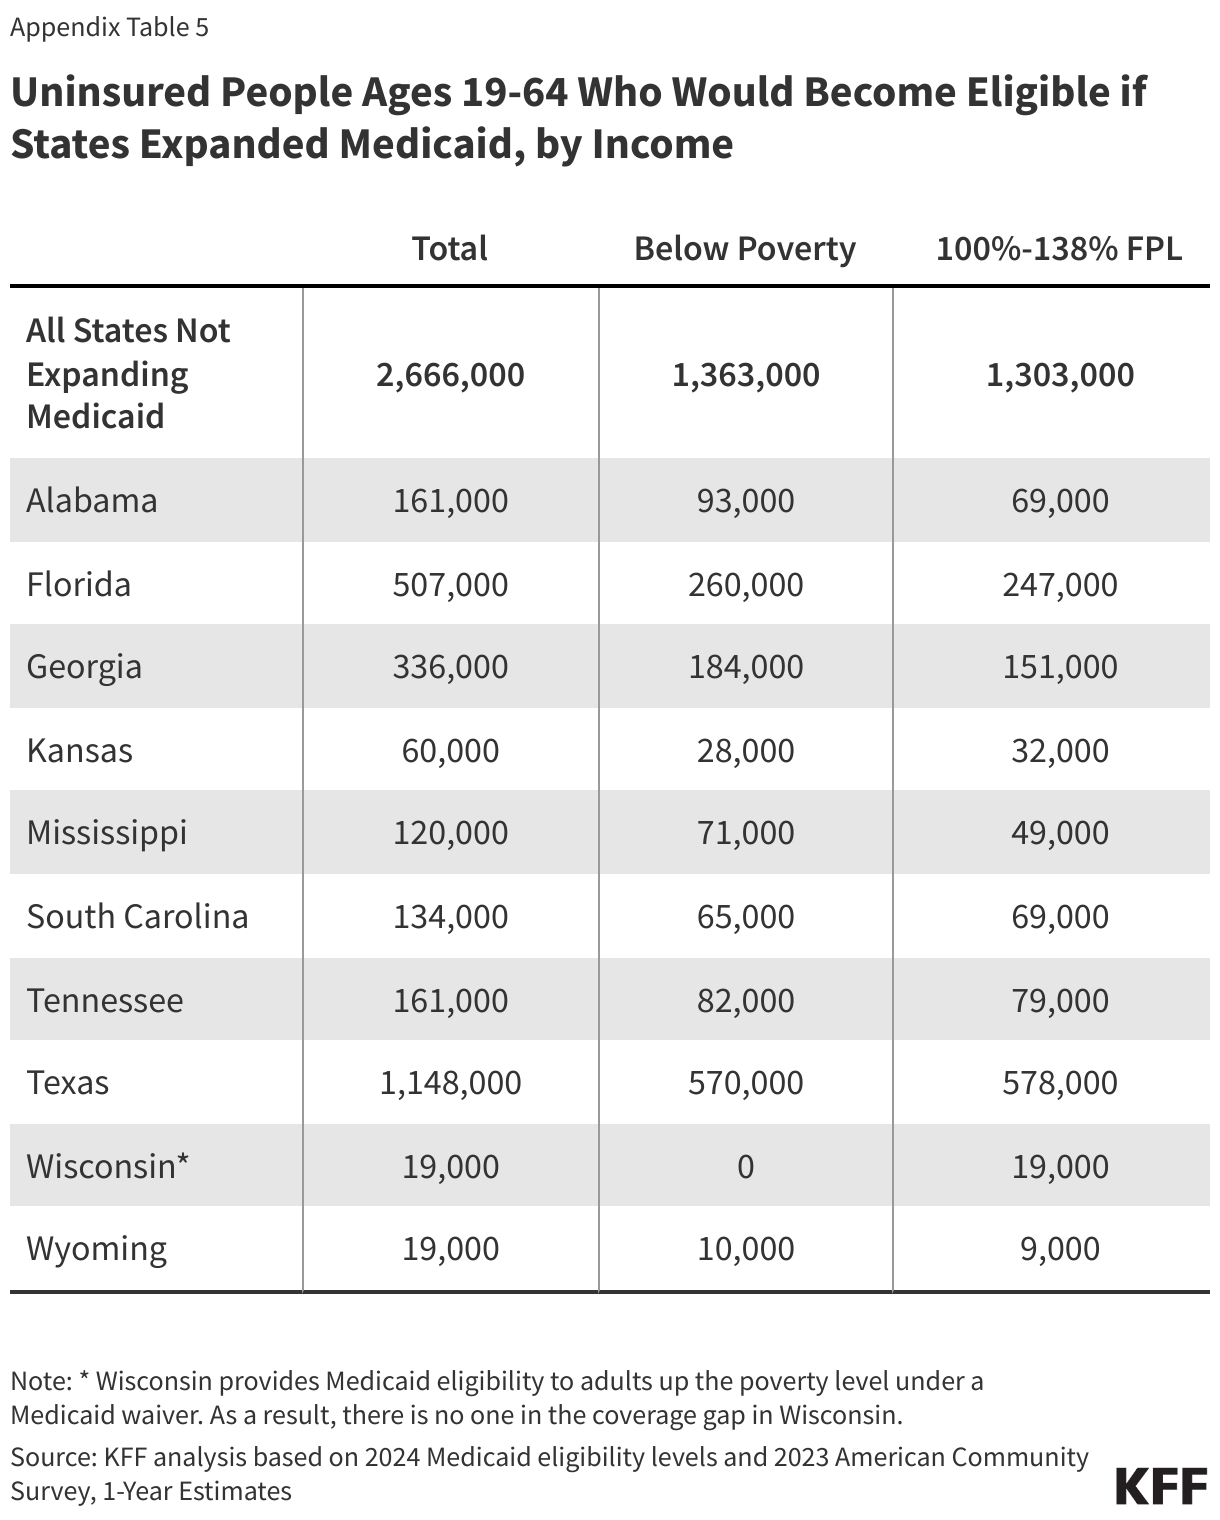
Medicaid eligibility remains limited in states that have not expanded their programs. All non-expansion states, except Wisconsin (which provides coverage through a waiver), do not offer Medicaid to adults without children, regardless of their income (Figure 3). As a result, 80% of the individuals in the coverage group are adults without dependent children.
Uninsured rates in states without Medicaid expansion are nearly twice as high as those in expansion states (14.1% vs. 7.6%). People without insurance have more difficulty accessing care, with almost one in four uninsured adults in 2023 not receiving needed medical treatment due to cost. Uninsured individuals are also less likely than those with insurance to receive preventive care and treatment for major health conditions and chronic diseases.
What are the characteristics of people in the coverage gap?
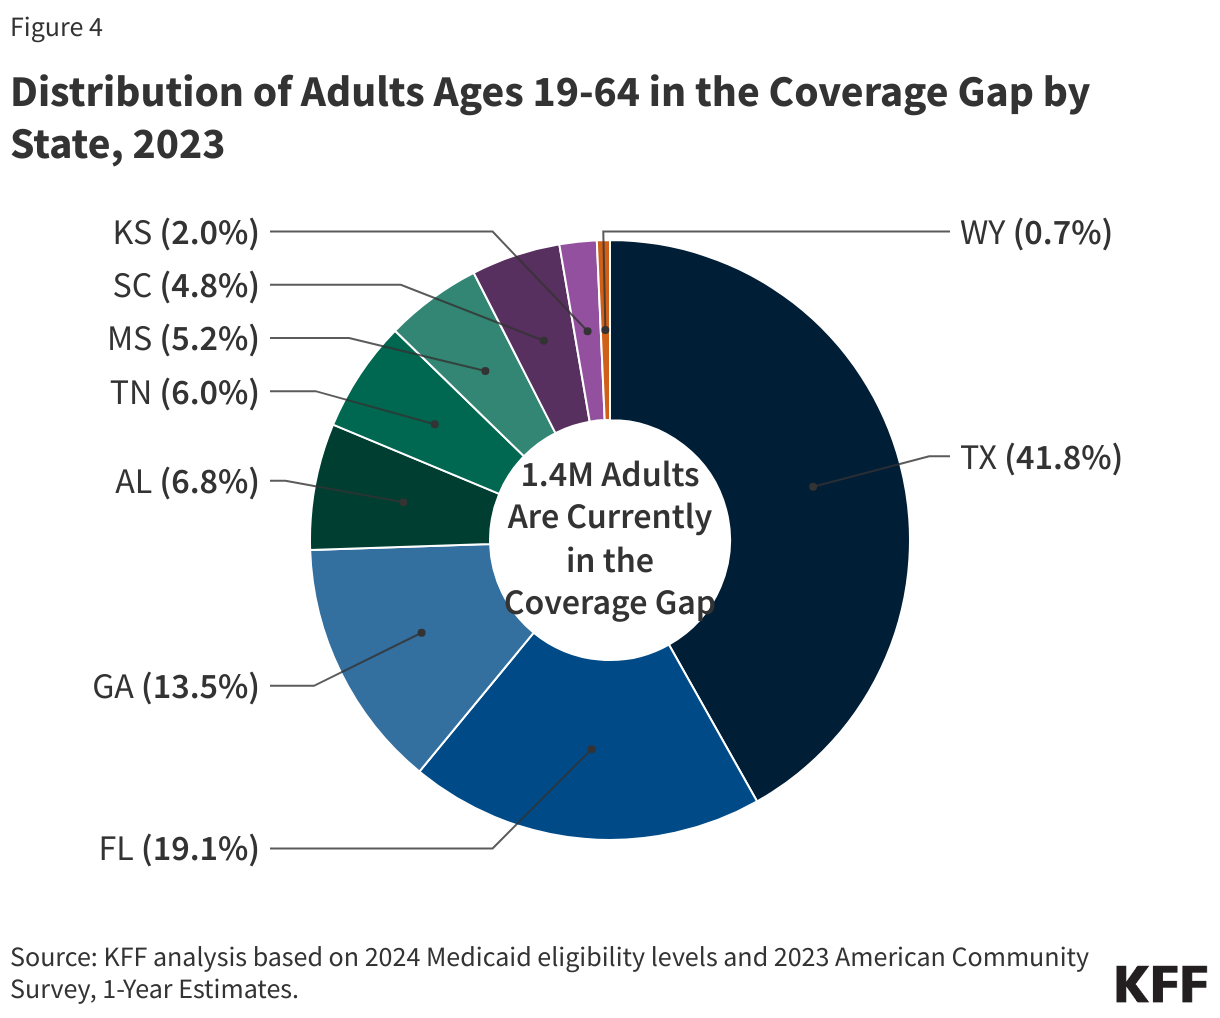
Nearly three-quarters of adults in the coverage gap live in just three Southern states. Texas accounts for 42% of individuals in the coverage gap, the highest share of any state, while Florida and Georgia account for an additional 19% and 14%, respectively (Figure 4). Overall, 97% of those in the coverage gap live in the South. Of the 16 states in the region, seven have not adopted Medicaid expansion.
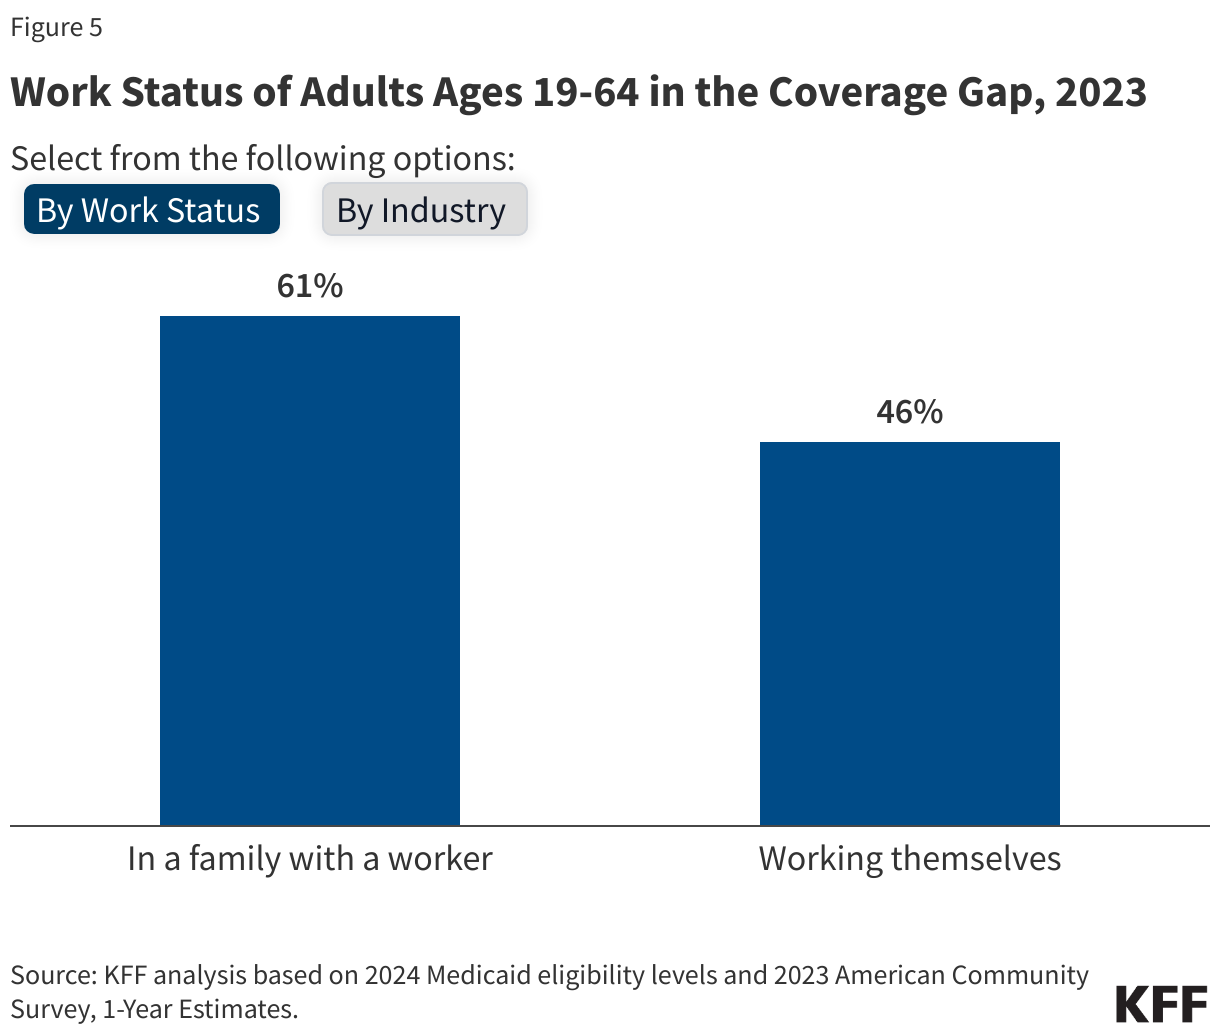
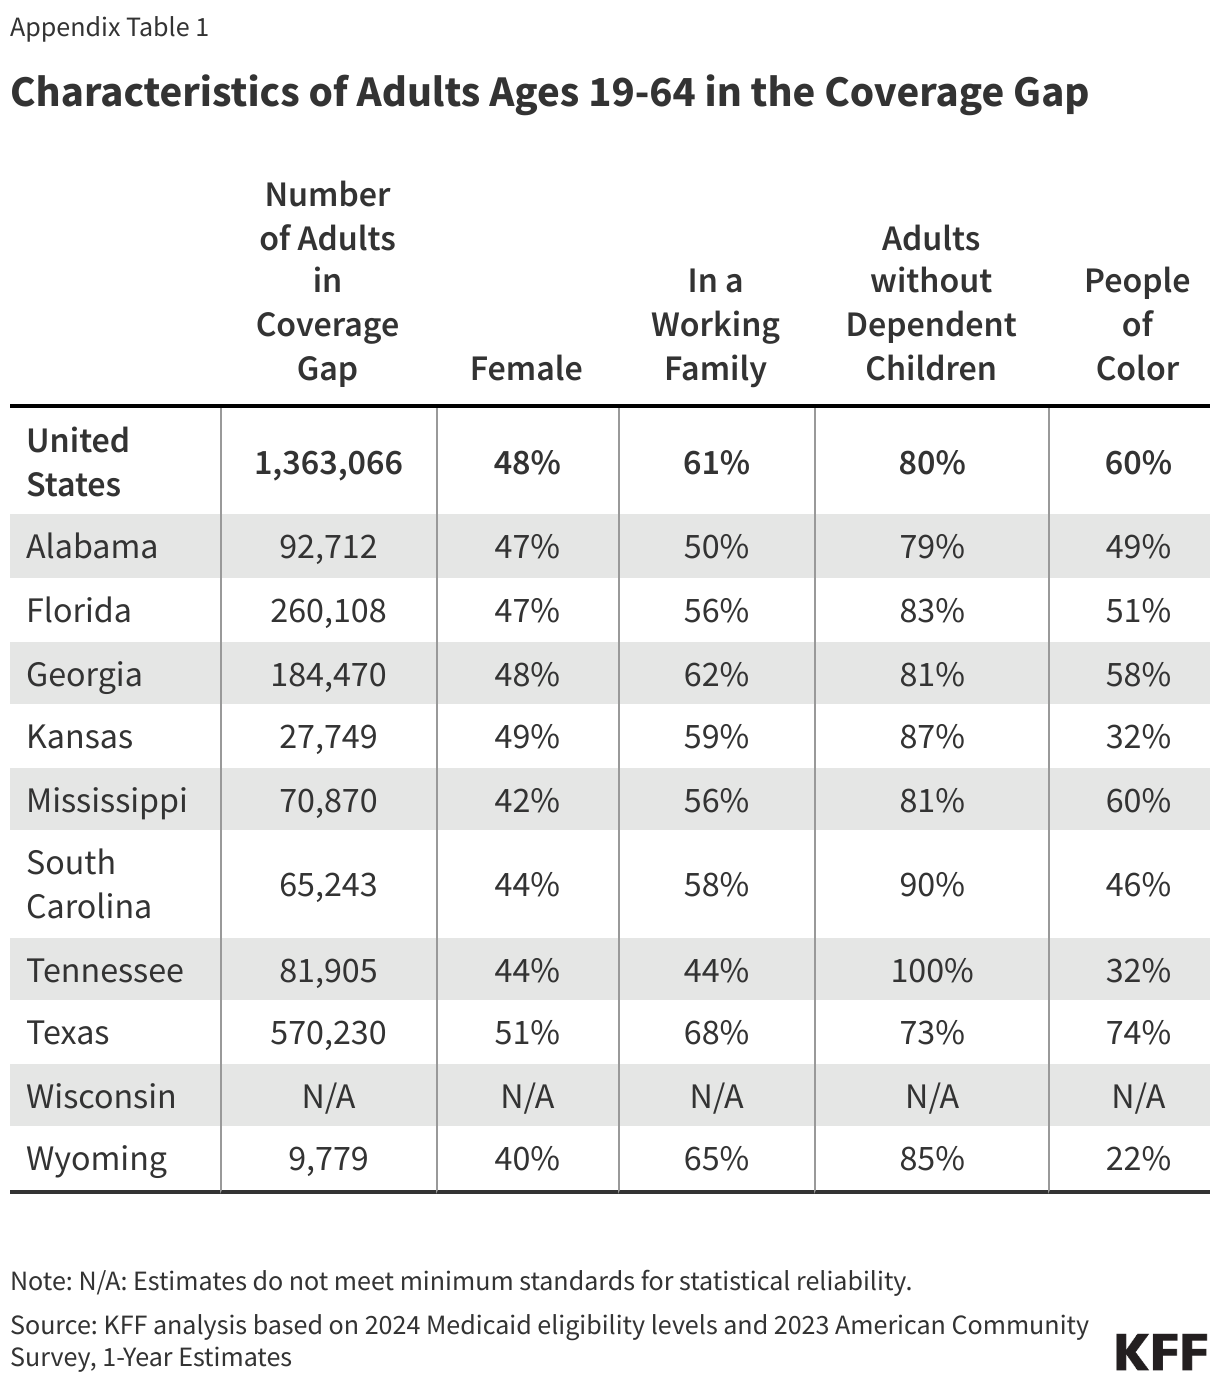
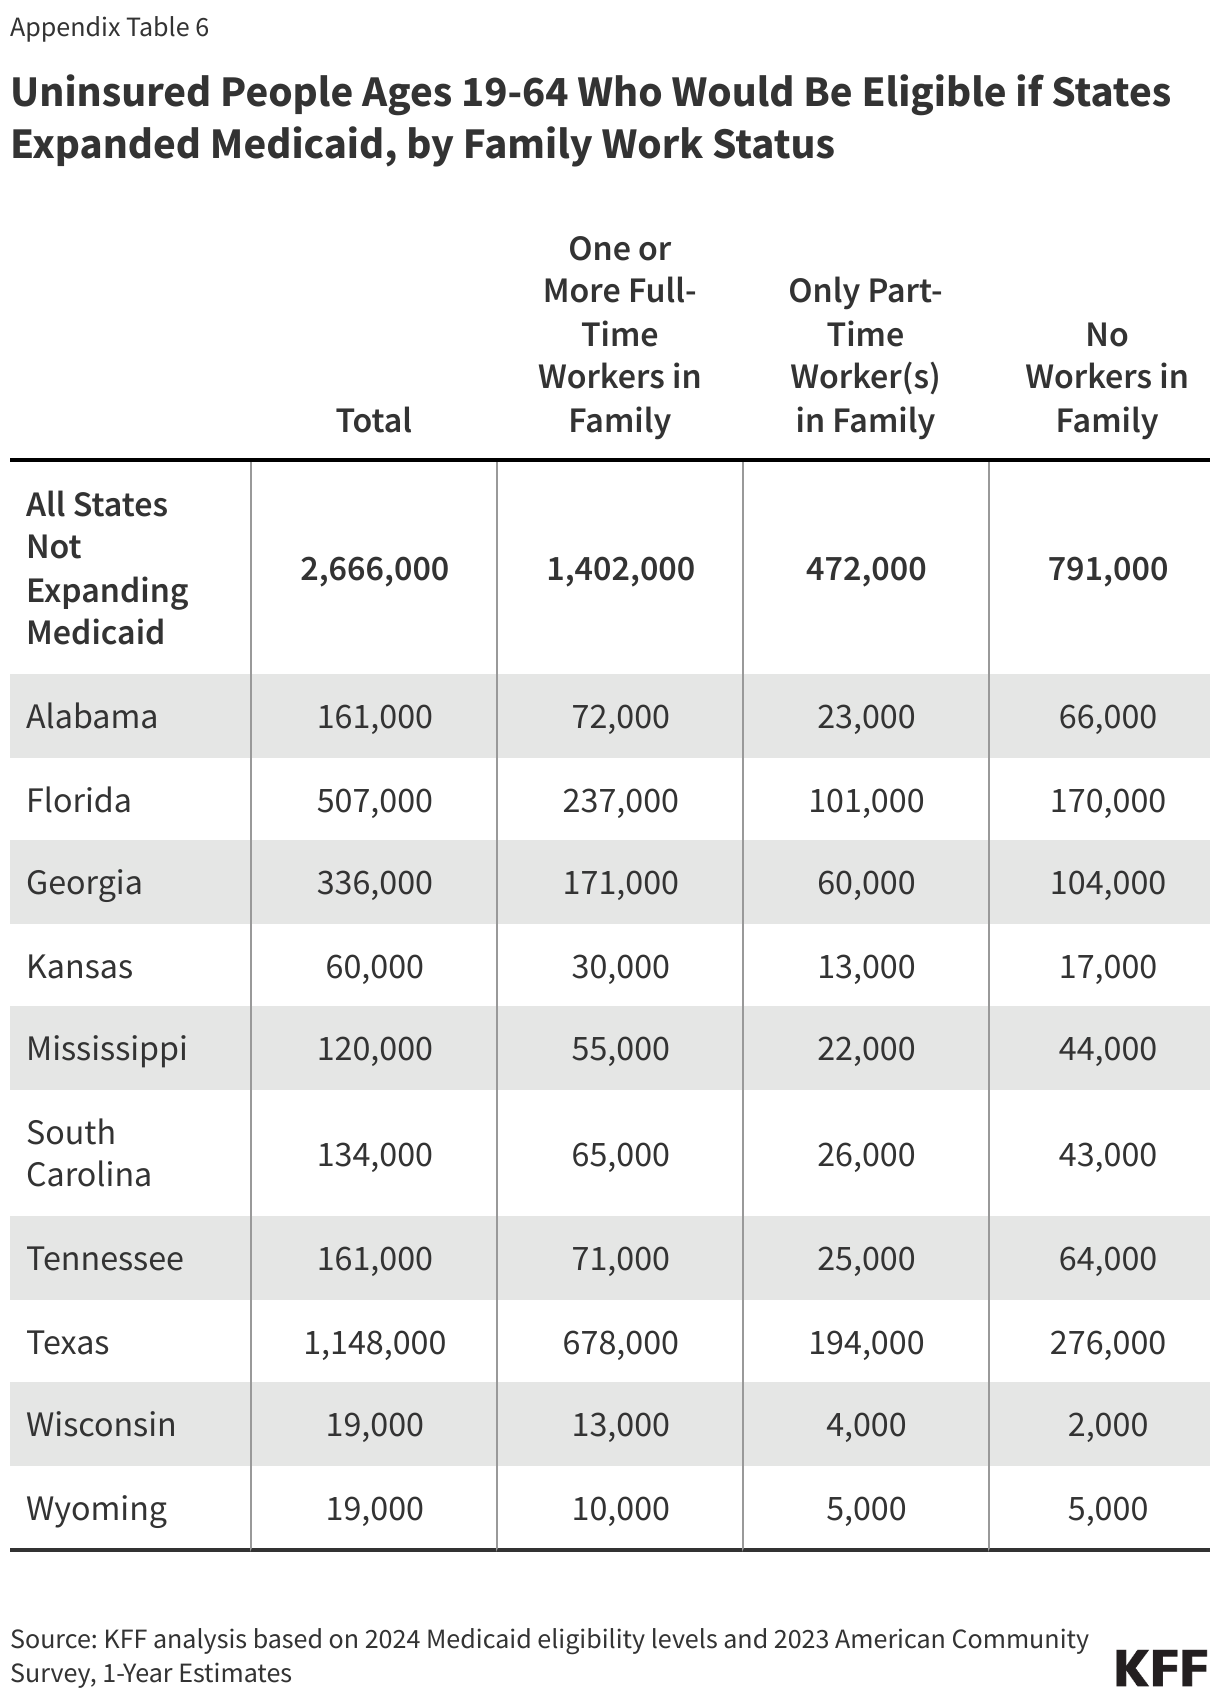
Nearly six in ten people in the coverage gap are in a family with a worker and over four in ten are working themselves. (Figure 5). However, these individuals work in low-wage jobs that leave them below the poverty level and often work for employers that do not offer affordable job-based insurance. Over half (53%) of workers in the coverage gap are in the service, retail, and construction industries, with common jobs including cashiers, cooks, servers, construction laborers, housekeepers, retail salespeople, and janitors. In non-expansion states, even part-time work can make parents ineligible for Medicaid.
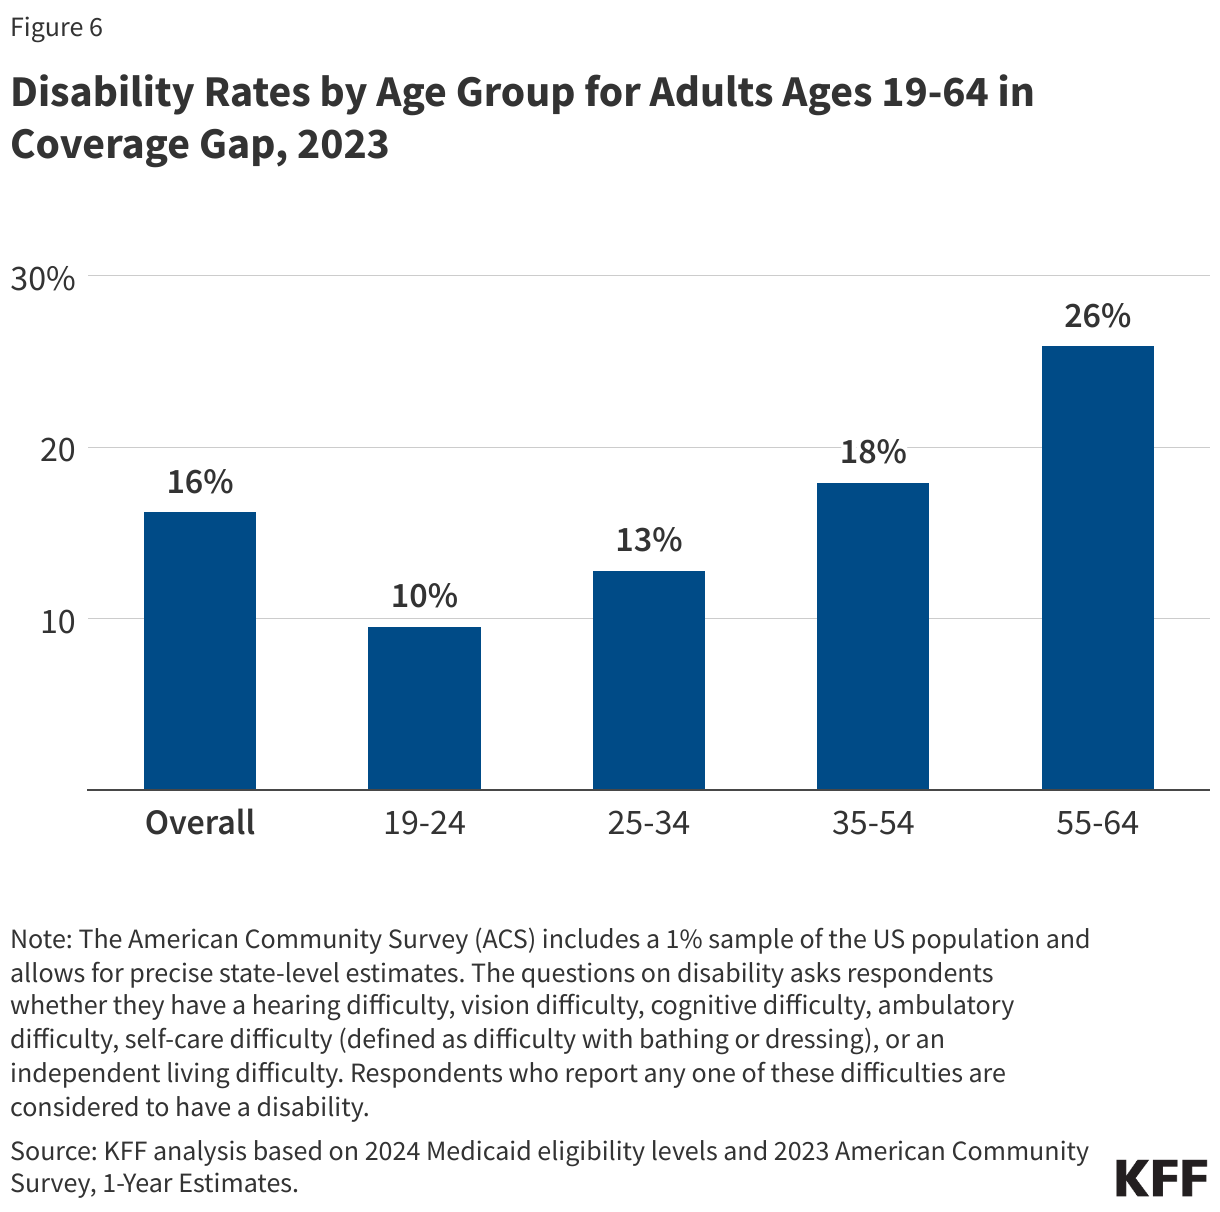
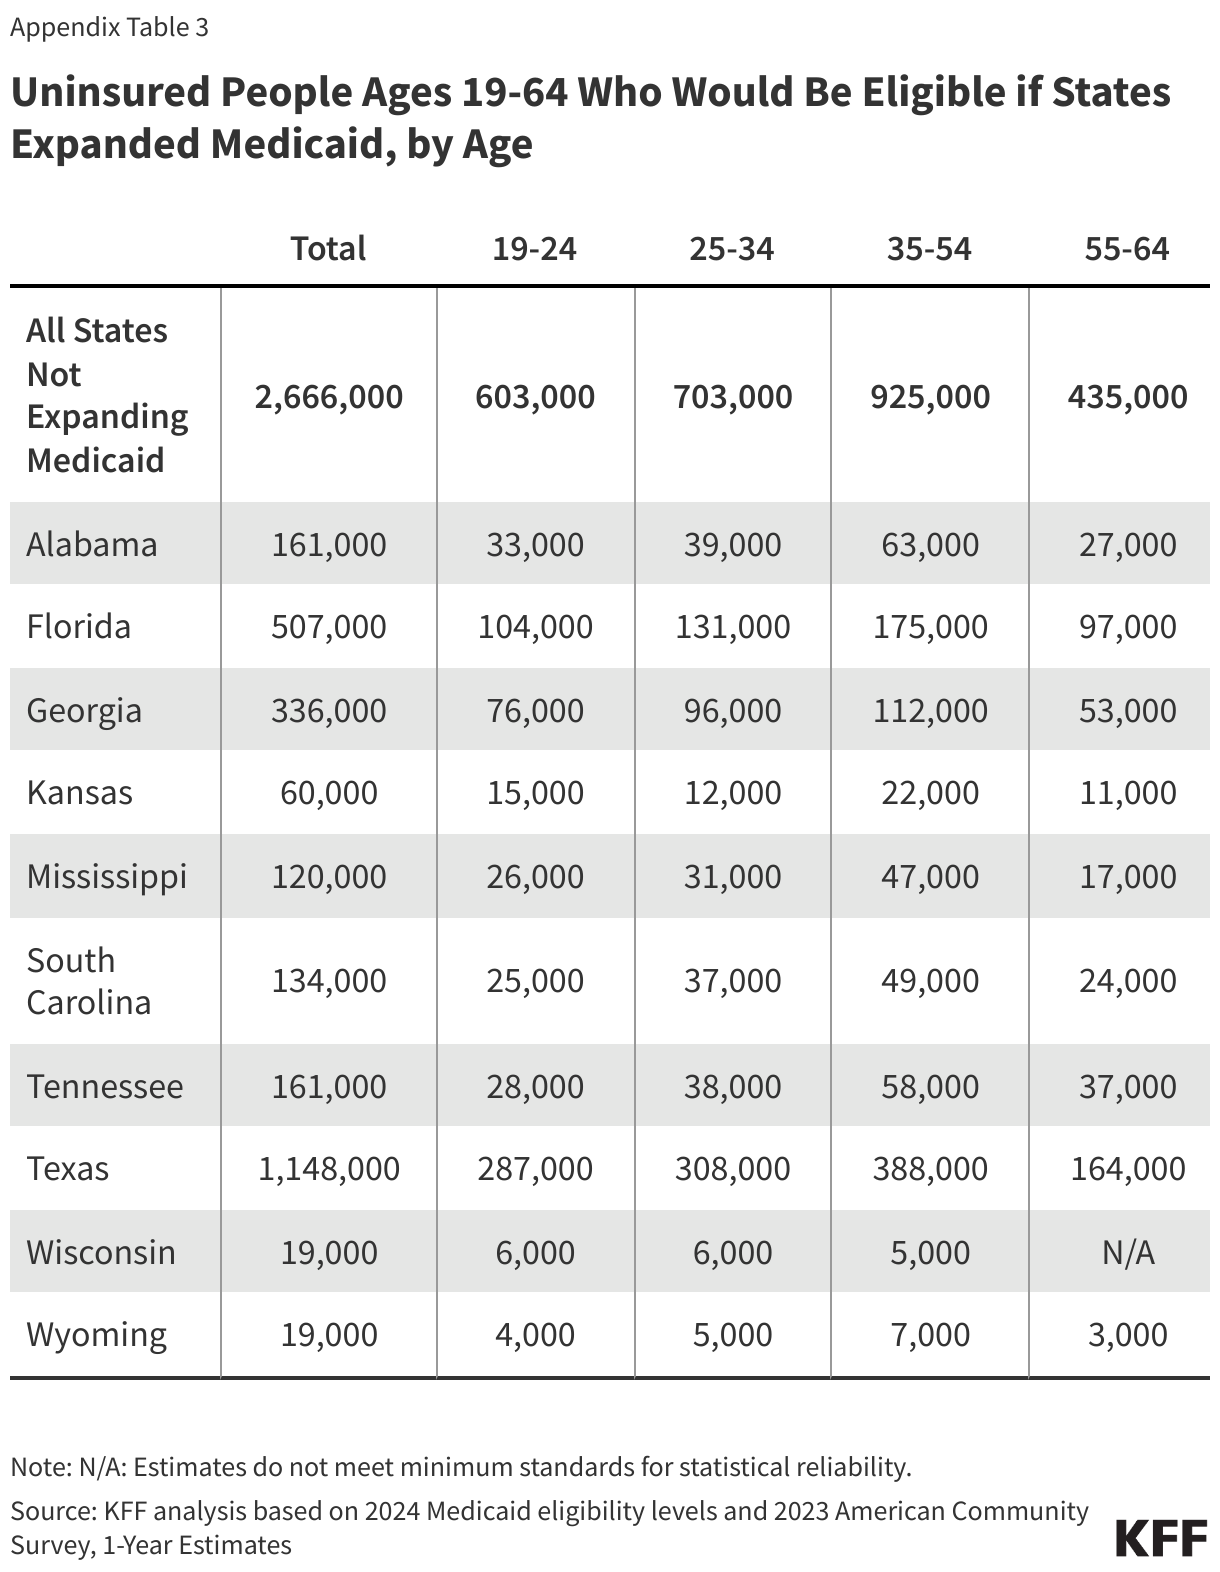
About one in six (16%) people in the coverage gap have a functional disability. The share of people in the coverage gap with disabilities increases with age (Figure 6). Over a quarter (26%) of adults ages 55 to 64 in the coverage gap have a disability compared to one in ten adults under age 25. Adults ages 55 to 64, who often face increased health care needs, account for 17% of all people in the coverage gap. Despite these challenges, many of these individuals do not qualify for Medicaid through a disability pathway, leaving them uninsured. Research shows that uninsured people in this age group may delay necessary care until they become eligible for Medicare at 65.
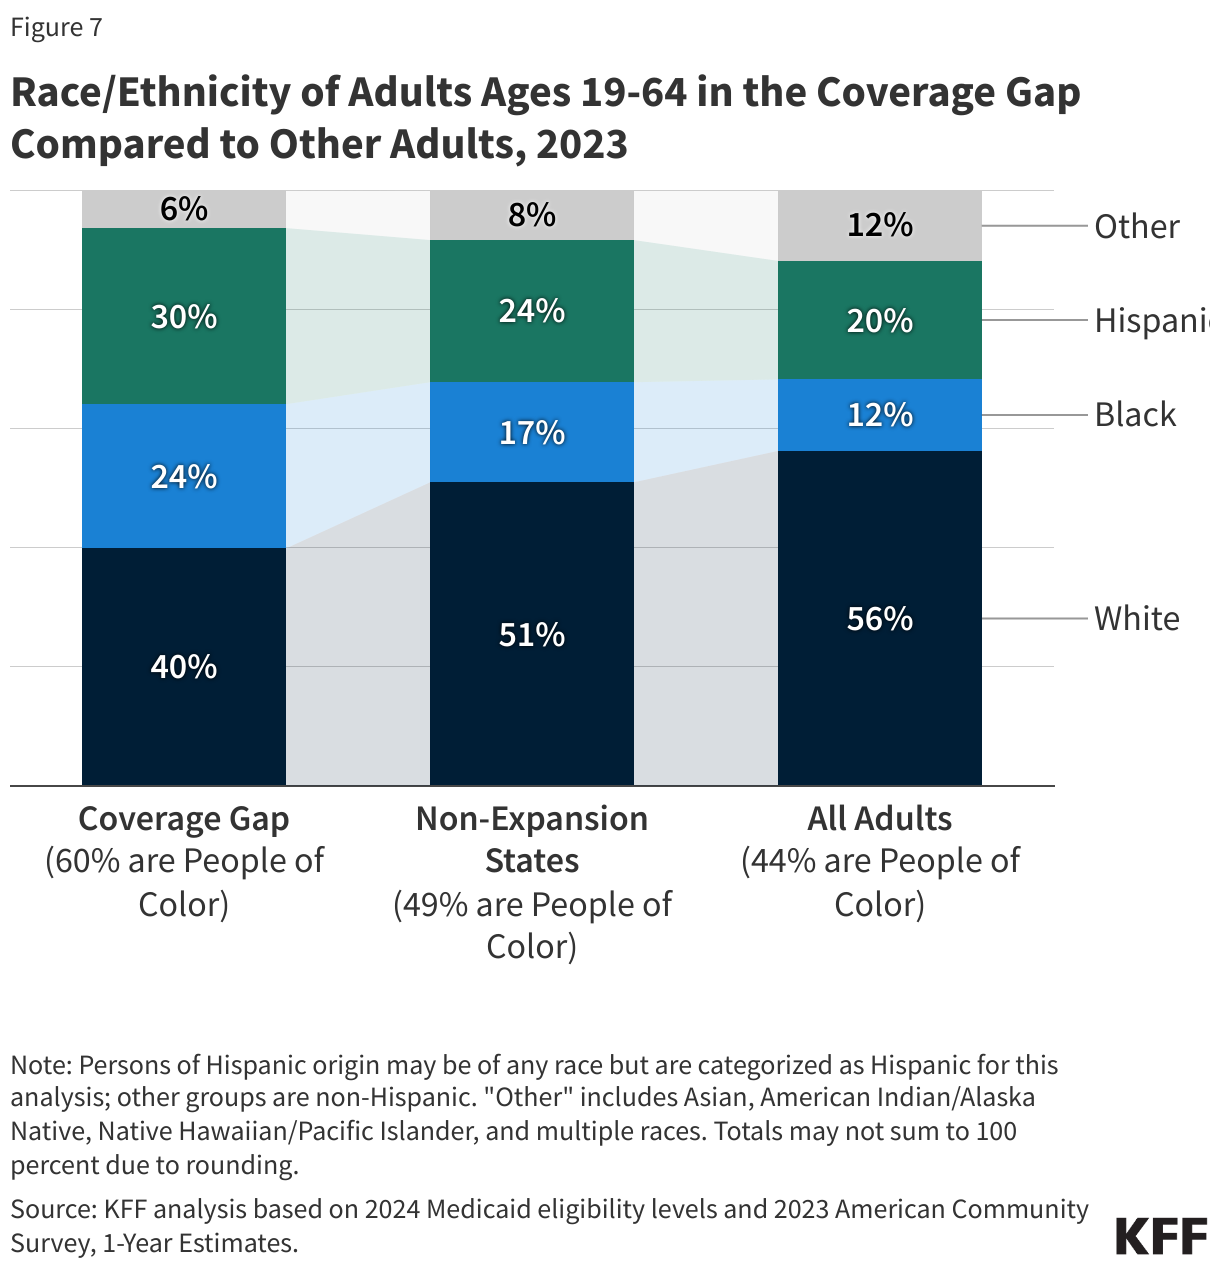
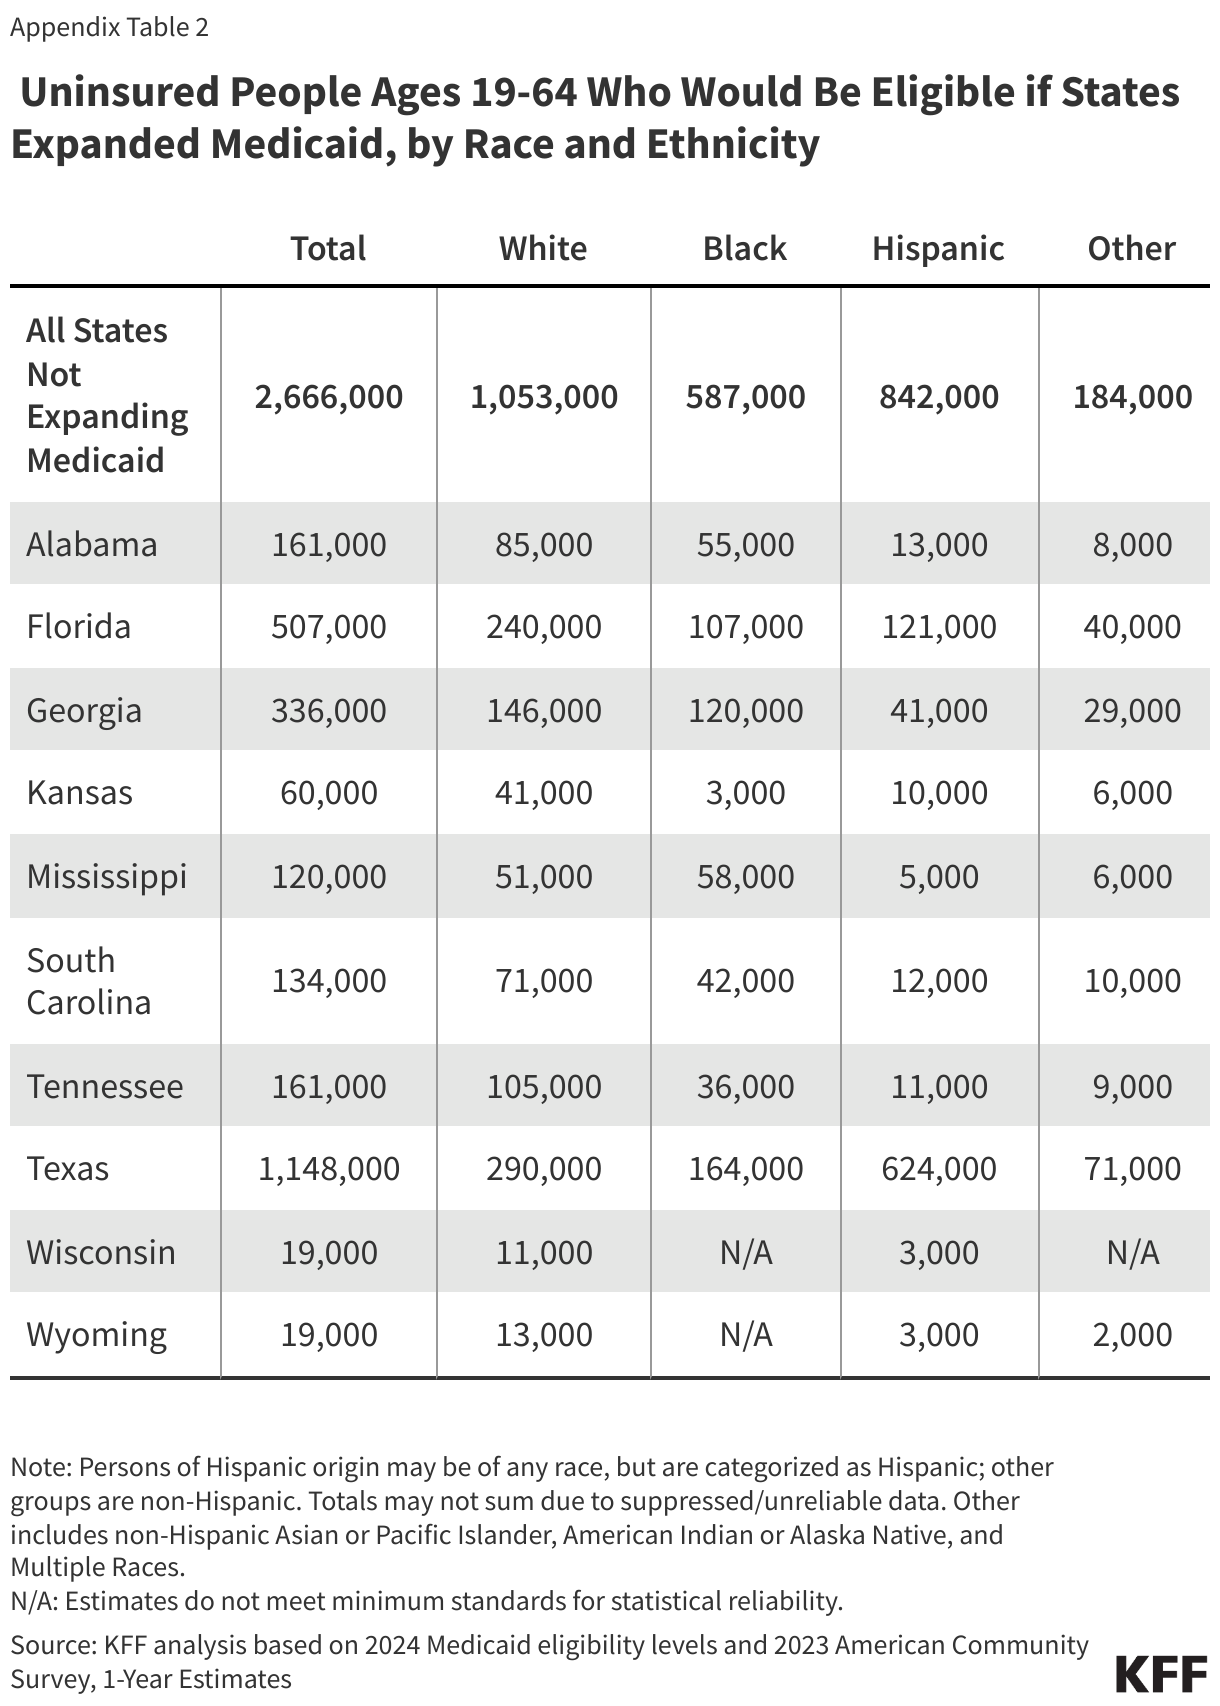
People of color make up a disproportionate share of individuals in the coverage gap. Six in ten people in the coverage gap are people of color, a higher share than among adults in non-expansion states (49%) and nationwide (44%) (Figure 7). These differences in part explain persisting disparities in health insurance coverage across racial and ethnic groups.
How many uninsured could gain coverage if all states adopted the Medicaid expansion?
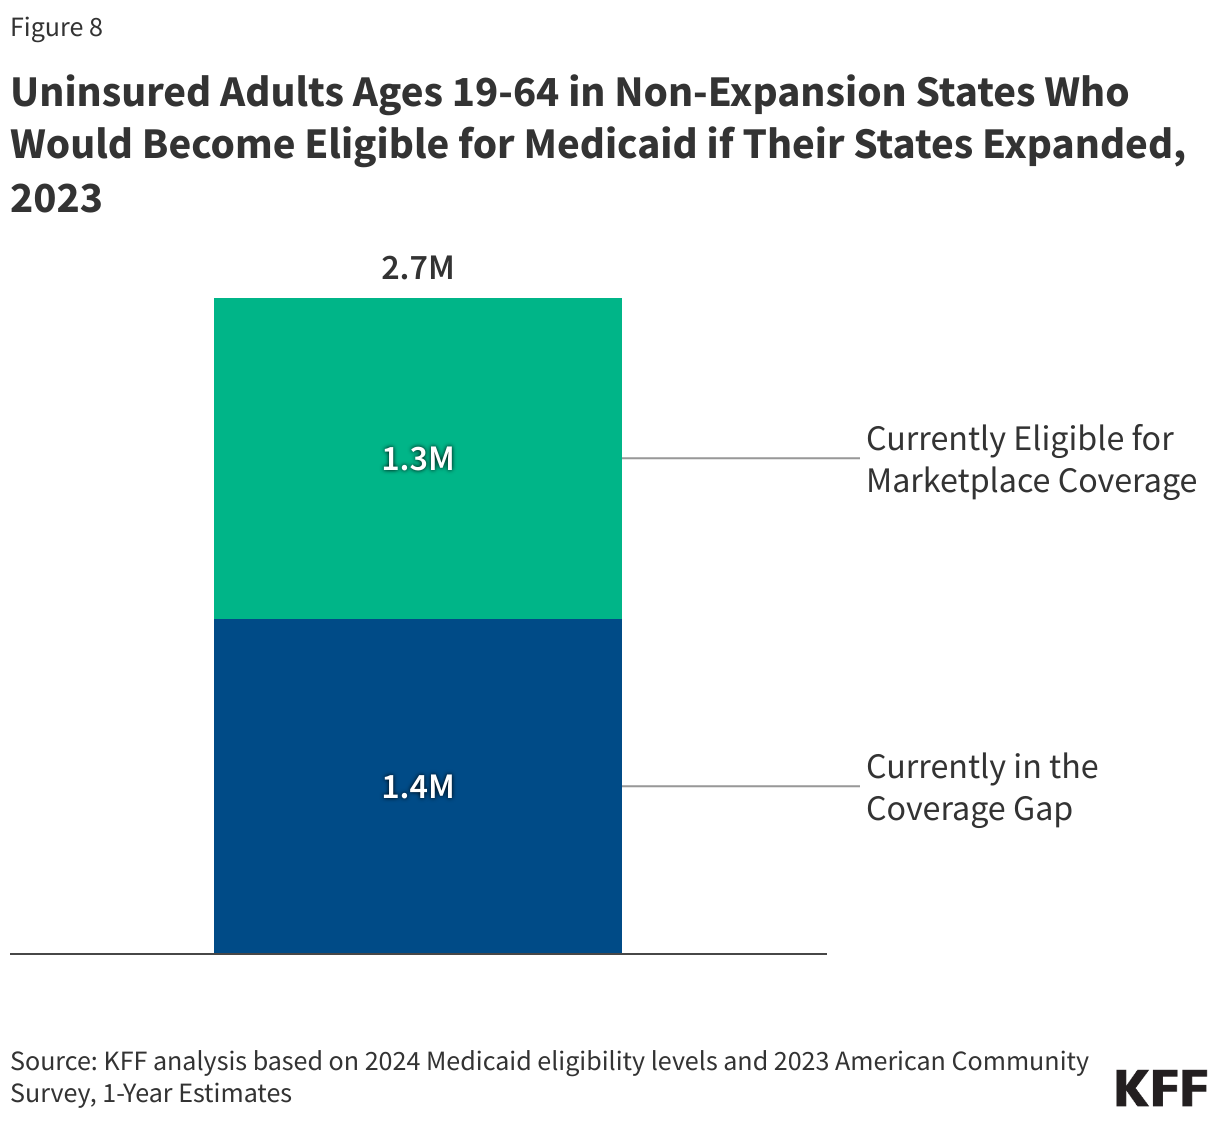
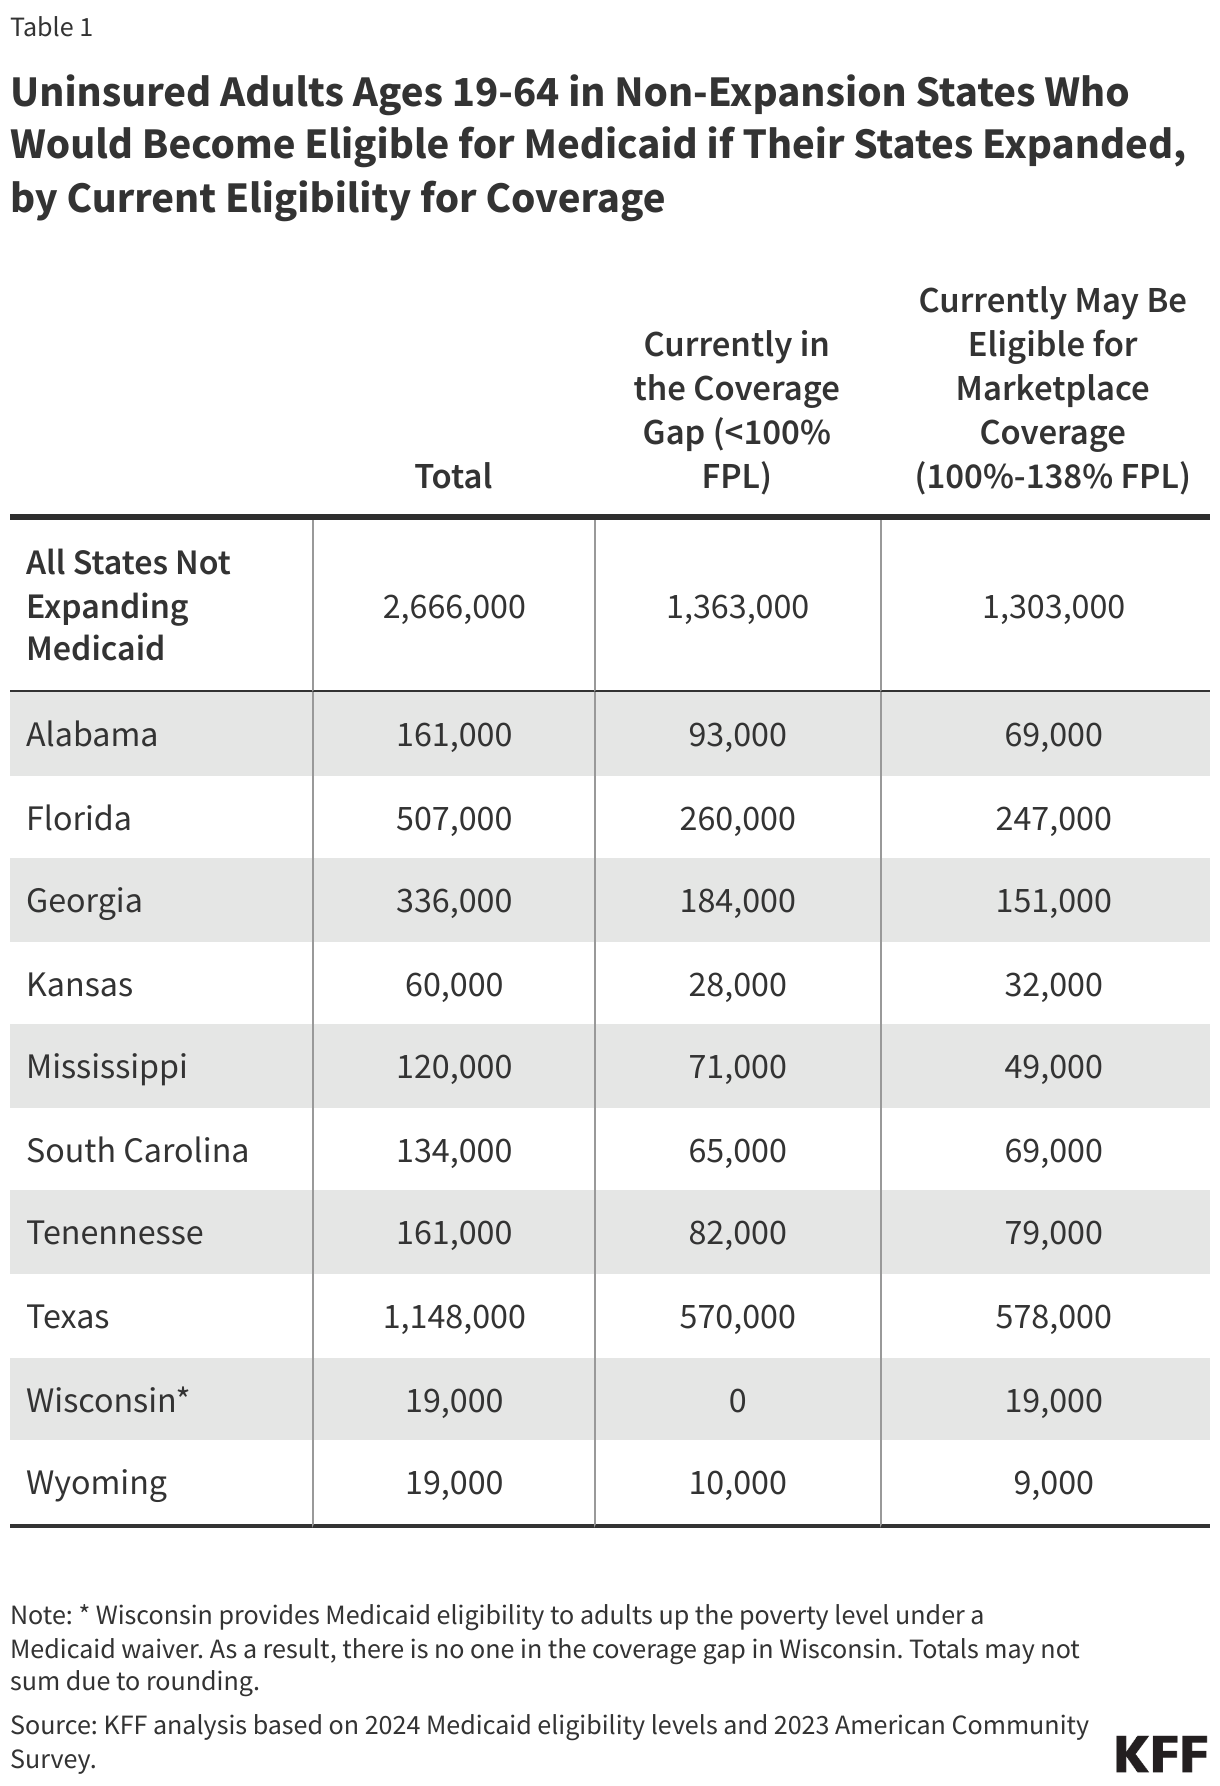
Approximately 2.7 million uninsured adults would gain coverage if all states adopted Medicaid expansion. This includes 1.4 million people in the coverage gap and 1.3 million uninsured adults with incomes between 100% and 138% of the FPL, most of whom are eligible for Marketplace coverage but not enrolled (Figure 7 and Table 1). While many of these adults above poverty qualify for zero-premium Marketplace plans, Medicaid generally provides more comprehensive benefits with lower out-of-pocket costs. The potential number of people who could gain coverage through expansion varies by state.
Sammy Cervantes, Clea Bell, and Jennifer Tolbert are with KFF. Anthony Damico is an independent consultant.
Appendix Tables
Data And Methods
This analysis uses data from the 2023 American Community Survey (ACS). The ACS provides socioeconomic and demographic information for the United States population and specific subpopulations. Importantly, the ACS provides detailed data on families and households, which we use to determine income and household composition for ACA eligibility purposes.
Medicaid and Marketplaces have different rules about household composition and income for eligibility. The ACS questionnaire captures the relationship between each household resident and one household reference person, but not necessarily each individual to all others. Therefore, prior to estimating eligibility, we implement a series of logical rules based on each person’s relationship to that household reference person in order to estimate the person-to-person relationships of all individuals within a respondent household to one another. We then assess income eligibility for both Medicaid and Marketplace subsidies by grouping individuals into household insurance units (HIUs) and calculate HIU income using the rules for each program. For more detail on how we construct person-to-person relationships, aggregate Medicaid and Marketplace households, and then count income, see the detailed Technical Appendix A.
Undocumented immigrants are ineligible for federally-funded Medicaid and Marketplace coverage. Since ACS data do not directly indicate whether an immigrant is lawfully present, we draw on the methods underlying the 2013 analysis by the State Health Access Data Assistance Center (SHADAC) and the recommendations made by Van Hook et. Al.1 ,2 This approach uses the 2023 KFF/LA Times Survey of Immigrants to develop a model that predicts immigration status for each person in the sample. We apply the model to ACS, controlling to state-level estimates of total undocumented population as well as the undocumented population in the labor force from the Pew Research Center. For more detail on the immigration imputation used in this analysis, see the Technical Appendix B.
Individuals in tax-filing units with access to an affordable offer of Employer-Sponsored Insurance (ESI) are still potentially MAGI-eligible for Medicaid coverage, but they are ineligible for advance premium tax credits in the Health Insurance Exchanges. Since ACS data do not designate policyholders of employment-based coverage nor indicate whether workers hold an offer of ESI, we developed a model that predicts both the policyholder and the offer of ESI based on the Current Population Survey (CPS). Additionally, for families with a Marketplace eligibility level below 250% FPL, we assume any reported worker offer does not meet affordability requirements and therefore does not disqualify the family from Tax Credit eligibility on the Exchanges. For more detail on the offer imputation used in this analysis, see the Technical Appendix C.
As of January 2014, Medicaid financial eligibility for most adults ages 19-64 is based on modified adjusted gross income (MAGI). To determine whether each individual is eligible for Medicaid, we use each state’s reported eligibility levels as of May 2024, updated to reflect 2025 Federal Poverty Levels. Some adults ages 19-64 with incomes above MAGI levels may be eligible for Medicaid through other pathways; however, we only assess eligibility through the MAGI pathway.3
An individual’s income is likely to fluctuate throughout the year, impacting his or her eligibility for Medicaid. Our estimates are based on annual income and thus represent a snapshot of the number of people in the coverage gap at a given point in time. Over the course of the year, a larger number of people are likely to move in and out of the coverage gap as their income fluctuates.
Starting with our estimates of ACA eligibility in 2017, we transferred our core modeling approach from relying on the Current Population Survey (CPS) Annual Social and Economic Supplement (ASEC) to the American Community Survey (ACS). ACS includes a 1% sample of the US population and allows for precise state-level estimates as well as longer trend analyses. Since our methodology excludes a small number of individuals whose poverty status could not be determined, our ACS-based population totals appear slightly below CPS-based totals and some ACS population totals published by the Census Bureau. This difference is in large part attributable to students who reside in college dormitories. Comparing the two survey designs, CPS counts more of these individuals in the household of their parent(s) than ACS does.
Technical Appendix A: Household Construction
In KFF’s estimates of eligibility for ACA coverage, income eligibility for both Medicaid and Marketplace subsidies is assessed by grouping people into “health insurance units” (HIUs) and calculating HIU income according to Medicaid and Marketplace program rules. HIUs group people according to how they are counted for eligibility for health insurance, versus grouping people according to who they live with (e.g., “households”) or are related to (e.g., “families”). HIU construction is an important step in assessing income as a share of the federal poverty line (FPL) because it impacts whose income is counted (and thus the total income for the unit) and how many people share that income (and thus the corresponding FPL to use for comparison, since FPL varies by family size). Our HIUs are designed to match ACA eligibility rules for both Medicaid and Marketplaces. Below we describe how we construct HIUs for this analysis. The programming code, written using the statistical computing package R v.4.4.1, is available upon request for people interested in replicating this approach for their own analysis.
Person to Person Relationships
We construct spousal and parent-to-child person-to-person linkage variables within each household of the microdata. The American Community Survey (ACS) includes only the relationship of each person in a household to one central reference person. Using the household reference person’s known relationships to all other individuals within each household, we iterate through every pair of individuals present in each household to determine probable person to person links for possible mother, father, and spousal pairs. Our approach to determining probable family interrelationship linkages closely follows the construction documented by IPUMS-USA with the notable exception of unmarried partner relationships.4 We intentionally diverge from IPUMS-USA because the presence of an unmarried partner relationship does not impact federal program eligibility. Among individuals designated as married with a spouse present in the household, our constructed spousal pointer matches the IPUMS SPLOC variable 99% of the time in the 2013 microdata. Our construction of mother and father pointers match the IPUMS MOMLOC, POPLOC, MOMLOC2, and POPLOC2 variables for more than 99% of all person-records.
Family Aggregation
Separate from person-to-person linkage variables, we assemble individual records into family units reproducing the Census Bureau’s Family Poverty Ratio (POVPIP) variable. Although the Census Bureau does not include a unique family identifier on the ACS microdata, we approximate the groupings used to generate the ACS income-to-poverty ratio variable with the following steps:
- Both non-relatives of the household reference person (RELP of 11-17) and all individuals in non-family households (HHT of 4-7) are categorized as single-person families.
- Married couples and other family households without subfamilies (PSF of 0) are categorized into single-family households.
- Married couples and other family households with subfamilies (PSF of 1) are categorized based on their subfamily number (SFN).
This family identifier is used in estimating family-wide statistics, such as the percent of the uninsured Americans in a family below poverty or the count of Medicaid-enrollees with one or more workers in their family. This family aggregation matches the groupings used to determine the income-to-poverty ratio variable, and estimates of health insurance presented by family poverty categories align with Census Bureau publications based on the ACS.5 Since many family members obtain health coverage separately from one another (for example, an elderly parent cohabiting with their working-age child might hold Medicare coverage and Employer Sponsored Insurance, respectively), descriptive statistics focused on family attributes rely on this family identifier but Medicaid and Marketplace eligibility determinations do not.
Overview of KFF-HIUS
We construct two different HIUs for everyone in the sample: a Medicaid HIU and a Marketplace HIU. We use two HIUs because the rules for counting families and income differ between the two programs. For example, in Medicaid, children with unmarried parents have both parents’ income counted toward their income, whereas under Marketplace rules, only the income of the parent who claims the child on his/her taxes counts. In another example, certain tax dependents (e.g., a parent) are treated differently for Medicaid eligibility than they are for Marketplace eligibility. To account for these rules, we developed an algorithm for sorting people into HIUs. We construct HIUs and HIU incomes separately for each person in a household and take into account the family relationships and income of the other people in the person’s household. People in the same household or in the same family may not have the same HIU composition or income for determining either Medicaid eligibility or eligibility for tax credits.
In simplest terms, the HIU algorithm sorts people into tax filing units. For all people in the data set, the algorithm assesses whether they are likely to be a tax filer themselves and, if so, who they are likely to claim or, if not, who is likely to claim them. It also captures whether someone is neither a tax filer nor claimed as a dependent by someone else. Importantly, the HIU construction considers all relationships for each person within the household. This step is particularly important in correctly classifying people in non-nuclear families (e.g., households with more than one generation, with unmarried partners, or with relatives outside the nuclear family such as an aunt or uncle), which may contain either one or multiple tax filing units.
In counting income for both Medicaid and Marketplace HIUs, we use modified adjusted gross income (MAGI), corresponding to the ACA rules. MAGI differs from total income in that some sources of income (e.g., cash assistance payments from TANF or SSI) do not count toward MAGI. We calculate HIU income as a share of poverty using the Health and Human Services Poverty Guidelines.6
For a small number of people, Medicaid HIU income as a share of poverty does not match Marketplace HIU income as a share of poverty due to the different rules between the programs. This analysis first calculates Medicaid HIU and classifies anyone who meets Medicaid eligibility into that category (including most individuals below 138% FPL in the Medicaid expansion states). We then calculate Marketplace HIU; anyone meeting subsidy eligibility is grouped into that category (above Medicaid and also above 100% FPL up to 400% FPL for most individuals). This approach follows the eligibility rules in the ACA, which specify that people are eligible for tax credits only if they are ineligible for Medicaid.
Steps in Calculating KFF-HIUS
Before we group people into HIUs, we first calculate annual MAGI for each respondent. We compare each person’s income to IRS filing requirements for being a tax filer7 and for being a qualifying relative claimed by someone else.8
We then group people into HIUs. We begin this process by grouping everyone within a household who is related into “cohabitating families.” Cohabitating families include all family relations; they also include unmarried cohabitating partners and relatives of each cohabitating partner.
Within each cohabitating family, we assess whether any individual is eligible to claim any other individual as a tax dependent. People are eligible to claim others as tax dependents if their income is above the IRS filing threshold for a head of household or, if married, for a married couple. People are eligible to be claimed by others if (a) they are a child (under age 19 or, for tax credits, 23 if a full-time student), and someone else in the cohabitating family has at least twice their income, or (b) they are below the limit to be a tax filer, have income below the qualifying relative limit, and someone else in the cohabitating family has at least twice their income. Within each cohabitating family, we assess who is likely to claim whom, using the assumptions that:
- People who are claimed by others are more likely to be claimed by close relatives (e.g., a parent) than by others (e.g., a grandparent).
- Married couples (who file) file jointly
- If more than one person in a cohabitating family is eligible to claim others within that cohabitating family, the wealthiest person claims the eligible dependents.
Once we determine who within the cohabitating family is likely to claim each other, we know the HIU size and are able to apply income rules for the HIU. We apply Medicaid and Marketplace rules for whose income counts in calculating Medicaid HIUs and Marketplace HIUs, respectively.9 People who are filers but are not eligible to claim someone else or to be claimed by someone else are an HIU of 1. People who are not filers and are not claimed by filers have their HIU size and income counted according to Medicaid non-filer rules.10
Inflation Factors
In order to determine ACA eligibility during calendar year 2023, we compared tax filing unit income against the most current premiums available, for open enrollment 2025.11 We relied on the Bureau of Labor Statistics Employment Cost Index (ECI), Private Wages and Salaries to inflate the income of each HIU by approximately 8.0% to align 2023 incomes to 2025 premiums.12 Since most state Medicaid eligibility determinations through the MAGI pathway are calculated as a percent of HHS Poverty Guidelines for that year and not a fixed dollar amount, inflation was not necessary to assess the Medicaid eligibility of individuals.
After inflating 2023 tax filing unit incomes to match 2025 premiums, we similarly inflated 2023 IRS thresholds for both filing requirements13 and for qualifying relative tests14 by the same factor so that these thresholds aligned with the inflated income amounts.
Limitations
As with any analysis, there are some limitations to our approach due to the level of detail that we can obtain from available survey data. Key limitations to bear in mind include:
- We currently are not able to appropriately group anyone who lives outside the household with a household that claims them as a tax dependent. For example, we are not able to connect students living away from home or children with a non-custodial parent with the people who may be claiming them (and whose income should count to their HIU). We are also not able to determine married people who file separately.
- To group people into tax filing units, we have to make assumptions about how people are likely to file their taxes. We assume that tax filers claim qualifying relatives they are able to claim. We make this assumption based on the fact that Medicaid and Marketplace eligibility rules are determined not by who is actually claimed on the tax return but by who is allowed to be claimed. However, people may sort themselves into different tax filing units than we estimate.
Technical Appendix B: Immigration Status Imputation
To impute documentation status, we draw on the methods underlying the 2013 analysis by the State Health Access Data Assistance Center (SHADAC) and the recommendations made by Van Hook et. al..15 ,16 This approach uses the 2023 KFF/LA Times Survey of Immigrants to develop a model that predicts immigration status for each person in the sample.17 We apply the model to a second data source, controlling to state-level estimates of total undocumented population as well as the undocumented population in the labor force from the Pew Research Center.18 Below we describe how we developed the regression model and applied it to the American Community Survey (ACS). We also describe how the model may be applied to other data sets. The programming code, written using the statistical computing package R v.4.4.1, is available upon request for people interested in replicating this approach for their own analysis.
Data Sources
We used the 2023 KFF/LA Times Survey of Immigrants l data to build the regression model. The 2023 Survey of Immigrants dataset contains questions on citizenship and legal status at the person level. The KFF/LA Time Survey of Immigrants19 is a probability-based survey exploring the immigrant experience in the U.S. and draws on three different sampling frames including an address-based sample (ABS), a random digit dial (RDD) sample of pre-paid cell phone numbers, and callbacks to an RDD sample in which the individual did not speak English or Spanish. The survey includes interviews with 3,358 immigrant adults and was offered in ten different languages.
The regression model is designed to be applied to other datasets in order to impute legal immigration status in surveys that do not ask about migration status. The code mentioned above includes programming to apply the model to either the Survey of Income and Program Participation (SIPP) Core files, ACS, or the Current Population Survey (CPS). Because the SIPP Core file contains different survey questions and variable specifications from the ACS and CPS, we create unique regression models to apply the model to each dataset. For the analysis underlying this brief and other KFF estimates of eligibility for ACA coverage, we apply the regression model to the 2013 ACS and then each subsequent year of the ACS.
Due to underreporting of legal immigration status in survey datasets, in imputing immigration status we control to state and national-level estimates of the total undocumented population and also the undocumented population in the labor force from the Pew Research Center. Pew reports these estimates for all states and the District of Columbia.20
Construction of Regression Model
We use the 2023 Survey of Immigrants to create a binomial, dependent variable that identifies a respondent as a potential unauthorized immigrant. The dependent variable is constructed based on the following factors:
- Respondent was not a United States (US) citizen,
- Respondent did not have permanent resident status or a valid work or student visa, , and
- Respondent does not have other indicators that imply legal status.21
We use the following independent variables to predict unauthorized immigrant status:
- Year of US entry,
- Job industry classification,
- State of residence,
- Household Income,
- Ownership or rental of residence,
- Number of occupants in the household (< or >= six occupants),
- Whether all household occupants are related,
- Health insurance coverage status,
- Sex, and
- Ethnicity.
The regression model was sub-populated to remove respondents who could not be considered unauthorized. People who could not be considered unauthorized include people who are US citizens or have other indicators that imply legal status.
Imputing Unauthorized Immigrants in Other Datasets
We use the Pew estimates as targets for the total number of unauthorized immigrants that the imputation generates. We first apply this strategy to the 2013 ACS, which contains health insurance information prior to the ACA’s coverage expansions. We stratify the targets by state and the District of Columbia and by participation in the labor force. We impute immigration status within each of these 102 strata.22
To generate the imputed immigration status variable, we first calculated the probability that each person in the dataset was unauthorized based on the 2023 Survey of Immigrants regression model. Next, we isolated the dataset to each individual stratum described above. Within each stratum, we sampled the data using the probability of being unauthorized for each person. After sampling, we summed the person weights until reaching the Pew population estimate for each stratum. The records that fell within the Pew population estimate were considered to be unauthorized immigrants. We repeated the process of sampling using the probability of being unauthorized and subsequently summing the person weights to reach Pew targets five times, creating five different unauthorized variables per record. These five imputed authorization status variables were then incorporated into a standard multiple imputation algorithm, closely matching the imputed variable analysis techniques used by the Centers for Disease Control and Prevention for the National Health Interview Survey.23
We used this first pass on the ACS 2013 to inform our sampling targets for the latest available microdata (ACS 2023). Looking at the results of our undocumented imputation on the ACS 2013, we calculated the share of undocumented immigrants lacking health insurance within each of those 102 strata prior to the ACA’s coverage expansions and transferred that information into a new dimension of sampling strata for the ACS 2023. We split each of the 102 sampling strata used on the pre-ACA ACS 2013 into uninsured versus insured categories, resulting in 204 sampling strata for subsequent years. We then repeated our imputation on the ACS 2023 with the newly-divided strata, allowing for a small decline in the undocumented uninsured rate based off of the percent drop in the uninsured rate among citizens.24
To easily apply the regression model to other data sets, we created a function that applies this approach to a chosen data set. The function first loads the dataset of choice, then standardizes the data to match the independent variables from the 2023 Survey of Immigrants regression model, and finally applies the multiple imputation to generate a variable for legal immigration status.
Technical Appendix C: Imputation Of Offer Of Employer-sponsored Insurance
An integral part of determining ACA eligibility is assessing whether workers without employer-sponsored insurance (ESI) hold an offer through their workplace that they decline to take up. In most cases, an affordable offer of ESI disqualifies members of the tax filing unit of the worker from receiving subsidized coverage on the ACA Health Insurance Marketplace. The American Community Survey (ACS) does not ask about employer offers of ESI; however, the Current Population Survey Annual Social and Economic Supplement (CPS-ASEC) includes questions about whether each worker received an offer of ESI from his or her employer at the time of interview. We use the CPS-ASEC offer of ESI variable to inform a regression-based multiple imputation of whether each tax filing unit constructed in the ACS had at least one offer at work, and also assess affordability for the employee and, separately, for any potential dependents within the unit. Since the health insurance coverage variables available in the CPS-ASEC 2024 capture sources of coverage at any point during calendar year 2023 (versus at the time of survey, as with the offer rate variable), a subset of sampled individuals had a change in their employer-based coverage status across the two distinct time periods.25 Therefore, among workers who potentially experienced a shift in offer status across the two time periods, we recoded or imputed offer rates in 2023 using the offer status in 2024. After constructing this revised offer variable for workers in CPS, we aggregated the results at the tax filing unit level to create a prediction model to apply to the ACS. Below we describe these recodes and imputation. The programming code, written using the statistical computing package R v.4.4.1, is available upon request for people interested in replicating this approach for their own analysis.
Recoding and Imputing Offer Rate Data in the CPS
As a first step in our analysis, we divided CPS-ASEC survey respondents into five distinct groups:
- All individuals who did not work during 2023 and also did not hold an offer of ESI in 2024 were assumed not to have an offer in 2023.
- All individuals who reported being an ESI policyholder (that is, anyone reporting having taken-up their offer of ESI) during 2023 and also reported holding an offer of ESI during early 2024 were assumed to have an offer in 2023.
- All workers in 2023 who held their own ESI policies during 2023 but then reported not holding an offer during 2024 were re-coded as holding an offer of ESI in 2023.
- All non-workers during 2023 who reported holding an offer during 2024 were re-coded as not holding an offer of ESI in 2023.
- Some workers during 2023 who did not report being ESI policyholders but did report holding an offer of ESI during early 2024 were imputed to not have an offer of ESI during 2023.
For many groups, including those in groups (1) and (2) listed above, the offer status did not change across the two time periods. In contrast, we recoded offer status for people in groups (3) and (4): every non-offered worker in group (3), which includes people who held ESI policies in their own name in 2023, were considered to have an offer of ESI in 2023, and offered workers in group (4), which includes people who did not work themselves in 2023, were considered to not have their offer of ESI in 2023. Last, we implemented a probability-based random sample imputation of offers of ESI for people in group (5), described in more detail below. Only a subset of the group was re-coded from holding an offer in 2024 to not holding an offer in 2023.The number of workers selected from this population was equal to the population size of (3) subtracted by the population size of (4), thereby assuming an unchanging offer rate for the total worker population across the period.
Imputing Offer Rates for CPS Respondents with Ambiguous Offer Rate Status
The CPS-ASEC worker-level regression model was designed to be applied to a single dataset where ESI offer status is known at one point in time but not another. The code mentioned above includes programming to apply the model to the Current Population Survey (CPS-ASEC) (for years 2014 on). For the analysis underlying KFF’s current estimates of ACA eligibility, we apply the regression model to workers in the 2024 CPS-ASEC.
We use the 2024 point-in-time worker offer variable provided by the US Census Bureau26 to create a binomial, dependent variable that identifies a respondent as a recipient of an offer of employer-sponsored insurance at his or her workplace in early 2024. The dependent variable was constructed at the worker-level based on individuals not holding their own ESI policy at time of interview and also reporting an ESI offer or eligibility to be covered that was then voluntarily declined.
We use the following independent variables to predict offer status in 2023 among workers not covered by their own ESI during both 2023 and early 2024 but potentially holding an offer of ESI in 2023:
- Any public coverage,
- Any nongroup coverage,
- Worker earnings among all jobs,
- Full-time versus part-time status,
- Age of worker,
- Work within the construction industry.
The regression model was sub-populated to remove respondents already covered by their own ESI and also to remove non-workers. Since this imputation does not account for the affordability of the offer or whether it meets the minimum value test, we included an assumption that workers in tax filing units with a MAGI below 250% FPL do not hold affordable offers of ESI and therefore might be eligible to purchase subsidized coverage on the Exchanges.27
As mentioned above, we assume an unchanging offer rate for the total worker population across the two time periods. We determined the needed size of the population to impute by subtracting the population of (4) from the population of (3) to ensure an equivalent number of offers were gained and lost. This left only workers who reported holding an offer of ESI during early 2024, since (3) represented a larger count of workers than (4). We then calculated the probability that each worker in the dataset was offered ESI during calendar year 2023 based on our 2024 CPS-ASEC regression model. Next, we selected workers within the potential population (5) using the sampling probabilities resultant from our model.
Construction and Application of ACS Regression Model
For the analysis underlying KFF estimates of ACA eligibility, we construct a prediction model of having an offer of ESI using the 2024 CPS-ASEC and then apply this regression to tax filing units in the 2023 ACS to estimate who has an ESI offer in ACS.
We aggregate the worker offer variables constructed the 2024 CPS-ASEC as described above to create a binomial, dependent variable that identifies each tax filing unit as either holding or not holding an affordable offer of employer-sponsored insurance.
We use the following independent variables to predict offer status among tax filing units:
- Any senior citizen in the household,
- Oldest member of the tax-filing unit,
- Any member of the tax-filing unit has employer-sponsored insurance coverage,
- Any member of the tax-filing unit has nongroup coverage,
- Any uninsured individuals in the tax filing unit,
- Share of adults working full-time and part-time, and
- Highest worker earnings.
Since the imputation of documentation status (discussed in Technical Appendix B) required a multiply-imputed approach, this secondary imputation and subsequent worker sampling was only conducted once per implicate, keeping the number of ACS implicates to five.
Endnotes
- State Health Access Data Assistance Center. 2013. “State Estimates of the Low-income Uninsured Not Eligible for the ACA Medicaid Expansion.” Issue Brief #35. Minneapolis, MN: University of Minnesota. Available at: http://www.rwjf.org/content/dam/farm/reports/issue_briefs/2013/rwjf404825. ↩︎
- Van Hook, J., Bachmeier, J., Coffman, D., and Harel, O. 2015. “Can We Spin Straw into Gold? An Evaluation of Immigrant Legal Status Imputation Approaches” Demography. 52(1):329-54. ↩︎
- Non-MAGI pathways for nonelderly adults include disability-related pathways, such as SSI beneficiary; Qualified Severely Impaired Individuals; Working Disabled; and Medically Needy. We are unable to assess disability status in the ACS sufficiently to model eligibility under these pathways. However, previous research indicates high current participation rates among individuals with disabilities (largely due to the automatic link between SSI and Medicaid in most states, see Kenney GM, V Lynch, J Haley, and M Huntress. “Variation in Medicaid Eligibility and Participation among Adults: Implications for the Affordable Care Act.” Inquiry. 49:231-53 (Fall 2012)), indicating that there may be a small number of eligible uninsured individuals in this group. Further, many of these pathways (with the exception of SSI, which automatically links an individual to Medicaid in most states) are optional for states, and eligibility in states not implementing the ACA expansion is limited. ↩︎
- Steven Ruggles, Sarah Flood, Ronald Goeken, Josiah Grover, Erin Meyer, Jose Pacas, and Matthew Sobek. IPUMS USA: Version 8.0 [dataset]. Minneapolis, MN: IPUMS, 2018. https://doi.org/10.18128/D010.V8.0 For a detailed description of how IPUMS constructs family interrelationships variables, see https://usa.ipums.org/usa/chapter5/chapter5.shtml ↩︎
- According to the Public Use Microdata Sample (PUMS) documentation, “Estimates generated with PUMS microdata will be slightly different from the pretabulated estimates for the same characteristics published on data.census.gov. These differences are due to the fact that the PUMS files include only about two-thirds of the cases that were used to produce estimates on data.census.gov, as well as additional PUMS edits.” ↩︎
- Medicaid eligibility in 2024 is based on 2025 poverty guidelines, available at: U.S. Department of Health and Human Services, Office of The Assistant Secretary for Planning and Evaluation, Poverty Guidelines. https://aspe.hhs.gov/topics/poverty-economic-mobility/poverty-guidelines. Tax credit eligibility in 2025 is based on 2024 poverty guidelines, available at: U.S. Department of Health and Human Services, Office of The Assistant Secretary for Planning and Evaluation, 2024 Poverty Guidelines https://aspe.hhs.gov/topics/poverty-economic-mobility/poverty-guidelines/prior-hhs-poverty-guidelines-federal-register-references. ↩︎
- See Internal Revenue Service, Publication 501, Table 1.2023: Filing Requirements Chart for Most Taxpayers. Available at: https://www.irs.gov/publications/p501#en_US_2023_publink1000270109. ↩︎
- See Internal Revenue Service, Publication 501, Qualifying Relative. Available at: https://www.irs.gov/publications/p501#en_US_2023_publink1000220939. ↩︎
- A detailed explanation of Medicaid and Marketplace income counting rules can be found in Center on Budget and Policy Priorities webinar available at: http://www.healthreformbeyondthebasics.org/wp-content/uploads/2013/08/Income-Definitions-Webinar-Aug-28.pdf ↩︎
- A detailed explanation of Medicaid and Marketplace HIU size calculations can be found in the Center on Budget and Policy Priorities webinar available at http://www.healthreformbeyondthebasics.org/wp-content/uploads/2013/08/Household-Definitions-Webinar-7Aug13.pdf ↩︎
- This is the same underlying data as the 2024 Health Insurance Marketplace Calculator. Available at: https://modern.kff.org/interactive/subsidy-calculator/ ↩︎
- See Congressional Budget Office, Economic Projections. Available at: https://www.cbo.gov/system/files/2024-06/51135-2024-06-Economic-Projections.xlsx. ↩︎
- See Internal Revenue Service, Publication 501, Table 1.2023: Filing Requirements Chart for Most Taxpayers. Available at: https://www.irs.gov/publications/p501#en_US_2023_publink1000270109. ↩︎
- See Internal Revenue Service, Publication 501, Qualifying Relative. Available at: https://www.irs.gov/publications/p501#en_US_2023_publink1000220939. ↩︎
- State Health Access Data Assistance Center. 2013. “State Estimates of the Low-income Uninsured Not Eligible for the ACA Medicaid Expansion.” Issue Brief #35. Minneapolis, MN: University of Minnesota. Available at: http://www.rwjf.org/content/dam/farm/reports/issue_briefs/2013/rwjf404825. ↩︎
- Van Hook, J., Bachmeier, J., Coffman, D., and Harel, O. 2015. “Can We Spin Straw into Gold? An Evaluation of Immigrant Legal Status Imputation Approaches” Demography. 52(1):329-54. ↩︎
- This data source is a change from previous KFF analyses, which used microdata from the 2008 Panel of the Survey of Income and Program Participation (SIPP) ↩︎
- This data source is a change from previous KFF analyses, which used estimates from the Department of Homeland Security. ↩︎
- More information about the survey methods is available at https://modern.kff.org/report-section/understanding-the-u-s-immigrant-experience-the-2023-kff-la-times-survey-of-immigrants-methodology/ ↩︎
- Pew updates these estimates periodically. We use the most recent estimates available at the time of our analysis, and in some cases incorporate estimates received from correspondence with researchers at Pew prior to their publication – however we do not release these numbers ourselves. We draw on Pew directly for all published data and interpolate years missing from their trend. Our analysis uses the year applicable to the year for the data sets to which we apply the regression model. The most recent estimates as of the time of our analysis were: J Passel, J Krogstad. What we know about unauthorized immigrants living in the U.S.. (Pew Research Center), July 2024. Available at: https://www.pewresearch.org/short-reads/2024/07/22/what-we-know-about-unauthorized-immigrants-living-in-the-us/. ↩︎
- Indicators that imply legal status include: (i) respondent entered the US prior to 2000, (ii) respondent is enrolled in Medicare or military health insurance, or (iii) respondent reports Medicaid coverage but resides in a state that does not offer coverage to the undocumented population beyond CHIP’s From-Conception-to-End-of-Pregnancy (FCEP) option. ↩︎
- For more information, see SHADAC 2013, footnote 1. The table created for this function contains estimates of the undocumented across 2013-2023. ↩︎
- For more detail, see documentation available at: National Health Interview Survey. 2023 Imputed Income Files. Available at: https://www.cdc.gov/nchs/nhis/documentation/2023-nhis.html. ↩︎
- As an example of this calculation, we found that approximately 66% of undocumented uninsured individuals did not have health coverage in 2013. We allow the undocumented rate to drop slightly after 2013. We base the percent drop in the uninsured rate among the undocumented on the drop for citizens (half the scale of the drop for citizens) each year until 2023, resulting in the final undocumented uninsured rate of 51% in calendar year 2023. Prior to implementing this new sampling dimension, we found unrealistic drops in the uninsured rate of the undocumented population that we largely attributed to our prediction model’s inability to discern this group from legally-present non-citizens, many of whom are eligible for assistance under the ACA’s coverage expansions. Although a few states have implemented programs that allow for coverage of the undocumented population, these programs are state-funded and relatively small in scale compared to the nationwide coverage expansions accompanying the ACA. ↩︎
- For example, anyone who did not work during 2023 who then held an offer of ESI in early 2024 would appear incongruous in our CPS-based eligibility model. In the other direction, workers covered by health insurance through their own employer in 2023 who lost their offer of ESI during the early months of 2024 (perhaps due to a job change) would also appear incongruous due to the discrepancy across the two time periods. ↩︎
- Available at: https://www.census.gov/data/datasets/time-series/demo/health-insurance/cps-asec-research-files.html. For more detail about these microdata, see: J. Abramowitz, B. O’Hara. New Estimates of Offer and Take-up of Employer-Sponsored Insurance (US Census Bureau), 2016. Available at: https://www.census.gov/library/working-papers/2016/demo/Abramowitz-2016.html. ↩︎
- For an explanation of affordability, see: KFF. Employer Responsibility Under the Affordable Care Act. February 2024. Available at: https://modern.kff.org/infographic/employer-responsibility-under-the-affordable-care-act/. ↩︎
