A Look at Waiting Lists for Medicaid Home- and Community-Based Services from 2016 to 2025
Medicaid is the primary payer for long-term care (LTC) in the United States, and pays for more than two-thirds of the LTC delivered in home- and community-based settings. Most home care (also known as “home and community-based services” or HCBS) is optional for states to provide and is frequently offered through “waivers,” which allow states to cover a wide range of benefits and to choose—and limit—the number of people who receive services. KFF estimates that 5.1 million Medicaid enrollees use home care, and that about half of people are using home care through waivers. States’ ability to cap the number of people enrolled in home care waivers can result in waiting lists when the number of people seeking services exceeds the number of waiver slots available.
On July 4, President Trump signed the 2025 reconciliation law, once called the “One Big, Beautiful Bill,” that includes significant changes to the Medicaid program. The Congressional Budget Office (CBO) estimates that the new law will reduce federal Medicaid spending over a decade by $911 billion. Given the substantial share of Medicaid spending that pays for home care, and the optional nature of most home care programs, cuts to home care programs could occur as states look for ways to respond to the reductions in federal spending. If states cut home care by reducing the number of people who can receive waiver services, waiting lists could increase. Waiting lists could also increase on account of changes to immigration policy in states that use waiting lists to manage shortages of home care workers, one-in-three of whom are immigrants. The Trump Administration has made notable changes to immigration policy focused on restricting entry at the border and increasing interior enforcement efforts to support mass deportation. Those changes place increased pressure on the home care workforce, a sector that was already facing workforce shortages.
This data note provides new information about waiting lists in Medicaid home care before many of the provisions in the reconciliation law go into effect. Waiting lists are an incomplete measure of unmet need (Box 1) and are not necessarily comparable across states or over time. Because of those considerations, the number of people on waiting lists could either increase or decrease in response to the federal Medicaid cuts. The data come from the 23rd KFF survey of officials administering Medicaid home care programs in all 50 states and the District of Columbia (hereafter referred to as a state), which states completed between April and July 2025. The survey was sent to each state official responsible for overseeing home care benefits (including home health, personal care, and waiver services for specific populations such as people with physical disabilities). All states except Florida responded to the 2025 survey. Survey findings are reported by state and waiver target population, although states often offer multiple waivers for a given target population. Key takeaways include:
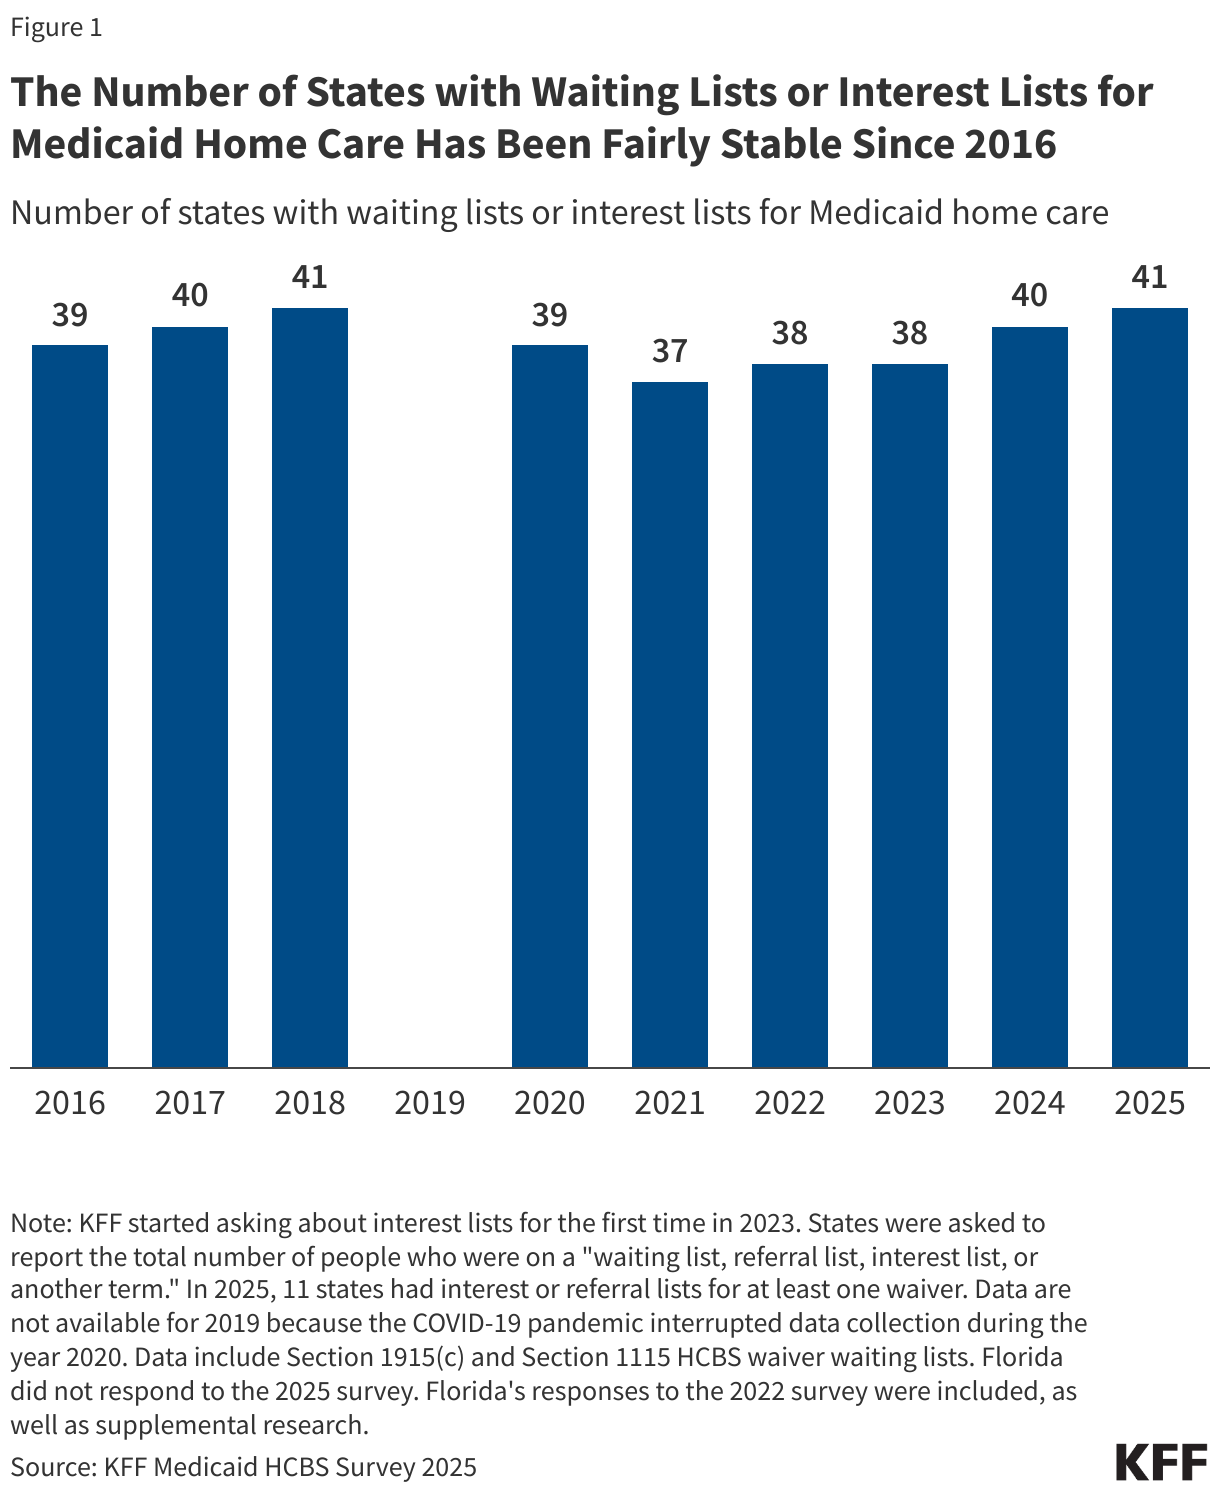
- Forty-one states maintain waiting lists or interest lists for people who would like to receive home care, a number that fluctuated little between 2016 and 2025.
- In all years since 2016, there have been at least 0.5 million people on waiting lists or interest lists, with a total of over 600,000 in 2025.
- In 2025, 12 states reported having at least one new waiting list (across 20 waivers), and 29 states reported an increase in the number of people on waiting lists or interest lists compared with only 12 states reporting a decrease.
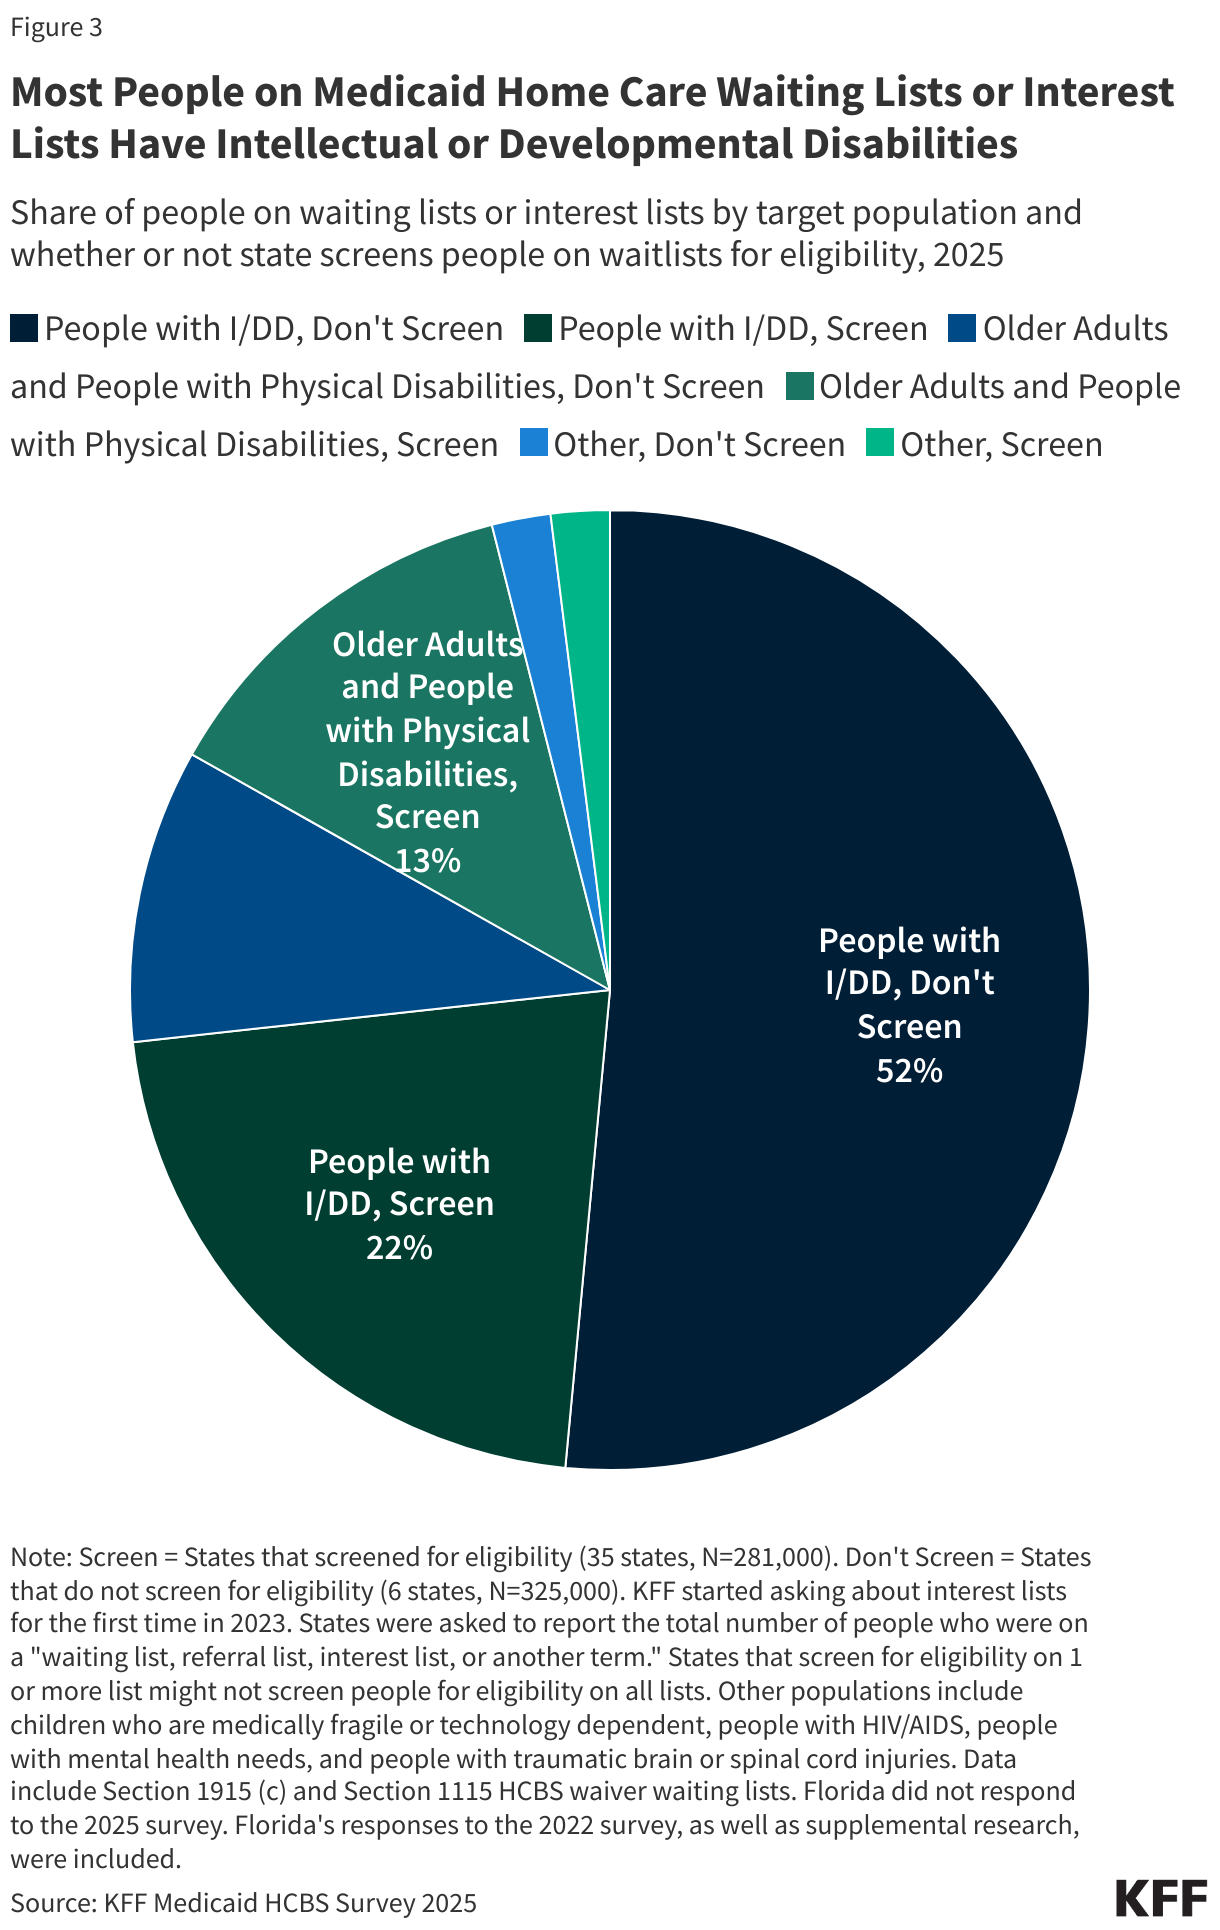
- Most people on waiting lists or interest lists have intellectual or developmental disabilities (I/DD) and most live in states that do not screen any people for eligibility prior to adding them to waiting lists.
- Most people on waiting lists or interest lists are eligible for personal care provided through states’ regular Medicaid programs or for services provided through specialized state plan home care benefits.
KFF also recently updated the waiting list indicators on State Health Facts which show data by state and target population.
Box 1. Why do waiting lists provide an incomplete measure of unmet need and why is it difficult to compare waiting lists across states?
Waiting lists provide an indication of people who may need services they are not receiving, but they are an incomplete measure of unmet need for several reasons. Waiting lists reflect the populations a state chooses to serve, the services it decides to provide, the resources it commits, and the availability of workers to provide services. Waiting lists do not include people with unmet needs in the following types of circumstances:
- States do not cover the applicable services (and therefore, have no waiting list),
- States allow all eligible people to enroll but restrict service provision to manage total spending in the waiver, and
- Eligible people are enrolled but providers have no excess capacity (and in some cases, the home care providers maintain their own waiting lists).
It is difficult to compare waiting lists across states because states’ approaches to managing waiting lists differ in how they prioritize and screen for eligibility. Some waiting lists include only eligible individuals while others include people for whom eligibility has not been determined. The availability of non-waiver services for people on waiting lists also varies. Although people may wait a long time to receive waiver services—32 months on average in 2025—most people are eligible for other types of home care while they wait.
Starting in 2027, states will be required to report the number of people on waiting lists as required under a final rule on access to Medicaid services, but it is unclear whether such reporting will address these data limitations on waiting lists. The data will include the number of people who are waiting to enroll in a waiver program, information on whether the people on the list have been screened for eligibility, the average amount of time people newly enrolled in the waiver over the past 12 months spent waiting to enroll, the average length of time between approval for services and service start dates, and the percent of authorized hours of care that were provided. Although the regulation does not mention interest lists, referral lists, or registries, the preamble to the rule indicates CMS’ intent for states to report all types of lists.
Despite the enhanced data states will be required to report, waiting list and waiver information will remain imperfect measures of unmet need. None of the new data will reflect how long it takes for people to receive home care provided through the Medicaid state plan, or how comprehensive services are. The new data also do not capture the number of people whose authorized services are below needed levels because of hourly or dollar caps on the amount of home care they can receive.
How Many States Have Waiting Lists for Home Care?
Between 2016 and 2025 the number of states with waiting lists has fluctuated between 37 and 41 and is currently at 41 states (Figure 1). While some Affordable Care Act (ACA) opponents have cited waiver waiting lists to argue that expanding Medicaid diverts funds from older adults and people with disabilities, research shows that ACA Medicaid expansion has led to gains in coverage for people with disabilities and chronic illnesses. Waiting lists for home care predate the ACA Medicaid expansion, which became effective in most states in 2014, and both expansion and non-expansion states have waiting lists. Waiver enrollment caps have existed since home care waiver authority was added to federal Medicaid law in the early 1980s.
While the overall number of states with waiting lists did not change much from 2024 to 2025, there were more changes in waiting lists for specific types of waivers. Twelve states (across 20 waivers) reported new waiting lists, with the largest number of new waiting lists for people with intellectual or developmental disabilities (I/DD). For example, five states (Illinois, Louisiana, Missouri, Utah, and Wisconsin) reported new waiting or interest lists for waivers targeting individuals with I/DD.
Several of the new waiting lists reflect instances where states undertook efforts to increase access to care. For example, Wisconsin has a new collaborative effort with counties to identify children who are eligible for but not receiving services under the state’s waivers. This has resulted in a list of nearly 9,000 children who are deemed eligible for services but have not yet been enrolled in waivers. Indiana established a new waiver for older adults that also resulted in a new waiting list of nearly 8,000 people.
How Many People Are on Waiting Lists for Home Care?
Between 2024 and 2025, total enrollment in waiting lists and interest lists increased by 14%, and is over 600,000 in 2025 (Figure 2). Overall, there was an increase in the number of people on waiting or interest lists in 29 states and a decrease in 12 states. Most of the largest increases in waiting lists were in states that reported new waiting lists—often which represented new waivers or efforts to more proactively enroll eligible participants, as described above. Maryland reported one of the biggest decreases in waiting lists because the state increased the number of waiver slots for their program serving older adults and people with disabilities, reducing the number of people on the waiting list by over 2,000 people.
One factor that contributes to changes over time—especially the notable decline between 2018 and 2020—is that not all states screen for Medicaid eligibility prior to adding people to waiting lists and changes in this policy may result in changes in waiting list volumes. For example, between 2018 and 2020, the total number of people on waiting lists decreased by 155,000 or 19%. However, nearly half of that change came from Ohio’s implementation of a waiting list assessment of waiver eligibility, which reduced the size of the state’s waiting list by nearly 70,000 people. In 2025, most states (35) with waiting lists screen individuals for waiver eligibility among at least one waiver, but even among those states, seven do not screen for all waivers. The six states that do not screen for eligibility among any waivers (Florida, Iowa, Oklahoma, Oregon, South Carolina, and Texas) account for more than half (325,000) of all people on waiting lists.
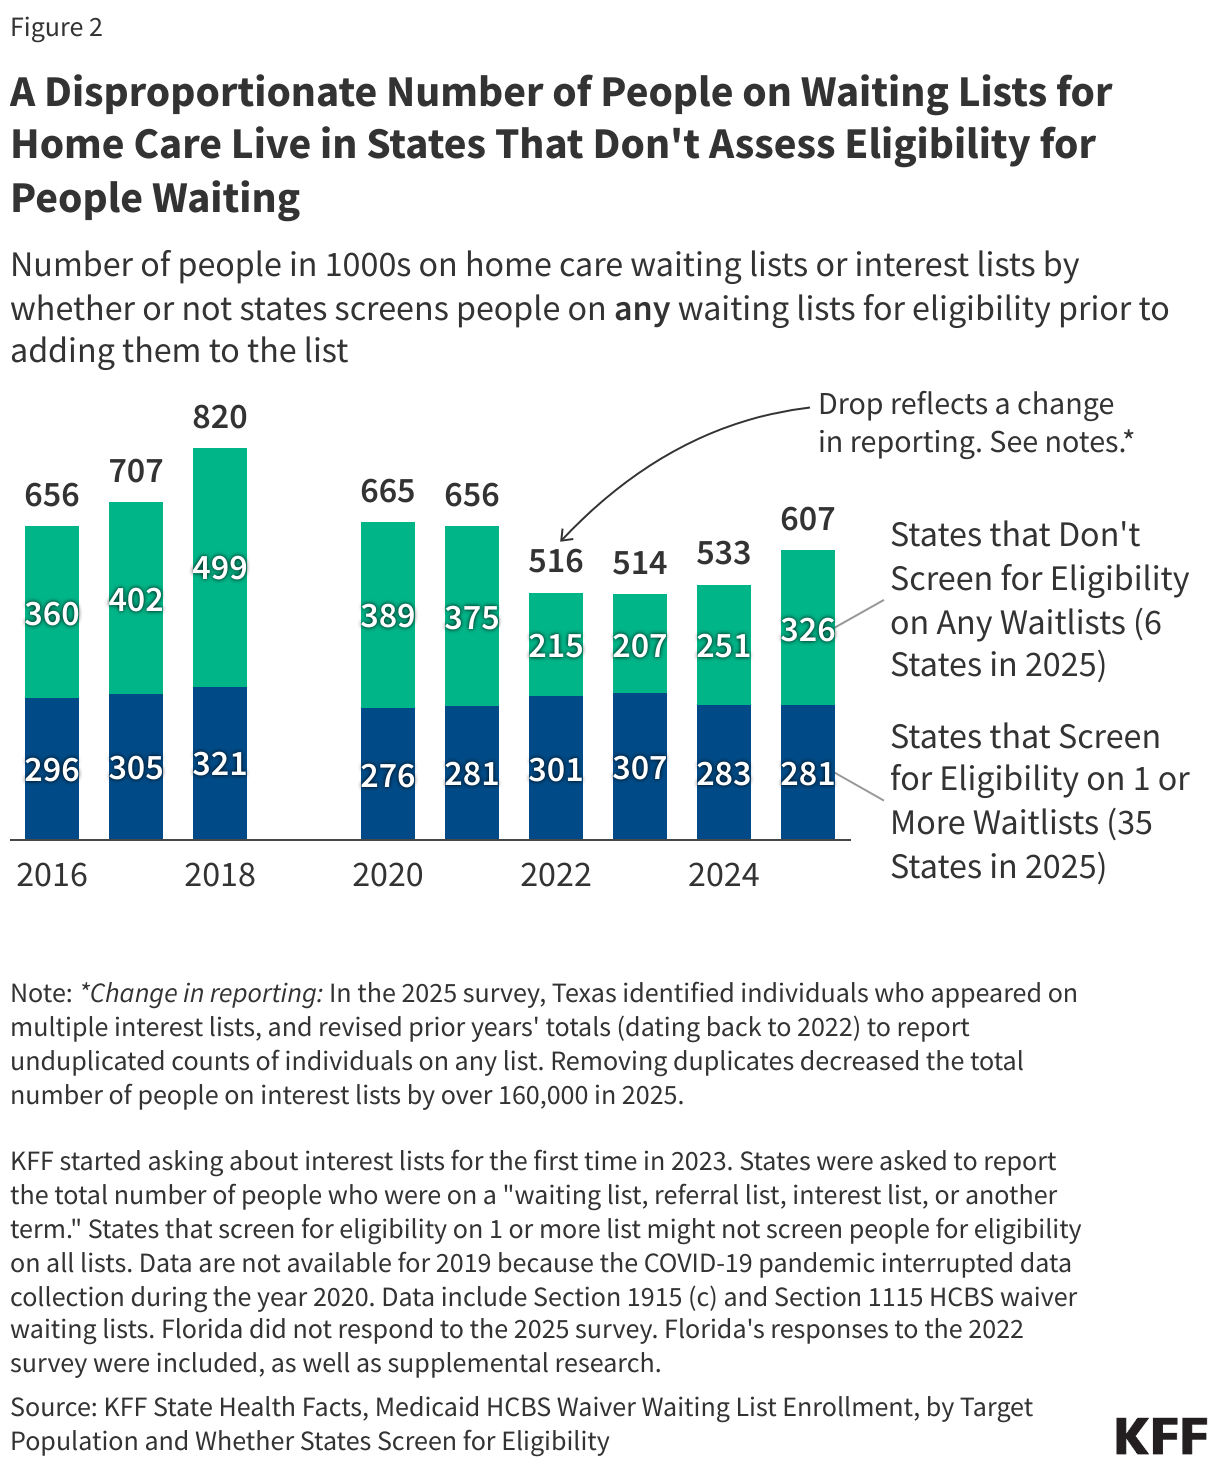
In 2025 and earlier years, a disproportionate number of people on home care waiting lists or interest lists lived in states that did not screen people on waiting lists for eligibility. One reason waiting lists provide an incomplete picture of need is that not all people on waiting lists will be eligible for services. The number of states that don’t screen for eligibility on any waiting lists ranged from six to eight states between 2022 and 2025, yet the share of individuals on waiting lists in these states ranged from 40% to 54%. Interviews about home care waiting lists found that when waiver services are provided on a first-come, first-served basis, people enrolled in waiting lists are in anticipation of future need. That study found that in some states, families would add their children to waiting lists for people with I/DD at a young age, assuming that by the time they reached the top of the waiting list, their children would have developed the immediate need for services. Many of those waivers offer comprehensive home care packages that include supported employment, supportive housing, or round-the-clock services. Among the six states that do not screen people for eligibility on any lists, three have only waiting lists, Texas has only interest lists, and two use both. (Illinois does not establish eligibility until selection but does a preliminary evaluation of eligibility prior to placing someone on the list.)
Who Is on Waiting Lists for Home Care?
Most people on waiting lists have I/DD, particularly in states that do not screen for waiver eligibility before placing someone on a waiting list. People on waiting lists for waivers serving people with I/DD (which include waivers specific to people who have autism) comprise 81% of waiting lists in states that do not screen for waiver eligibility, compared with 55% in states that do determine waiver eligibility before placing someone on a waiting list (Figure 3). People with I/DD comprise almost three-quarters (74%) of the total waiver waiting list population. Older adults and adults with physical disabilities account for nearly one-quarter (23%), while the remaining share (4%) includes children who are medically fragile or technology dependent, people with traumatic brain or spinal cord injuries, people with mental illness, and people with HIV/AIDS. People who are on home care waiting lists are generally not representative of the Medicaid population or the population that uses home care. Most people on waiting lists have I/DD, but KFF analysis shows that people with I/DD comprise fewer than half of the people served through 1915(c) waivers (the largest source of Medicaid home care spending).
How Long Are People on Waiting Lists for Home Care?
In 2025, people on the waiting or interest lists accessed services after an average of 32 months (33 of 41 states responding), down from 40 months in 2024. People with I/DD wait 37 months on average. The average waiting period for other waiver populations ranged from 15 months for waivers targeting older adults and people with physical disabilities to 63 months for waivers that serve people with autism. People with I/DD residing in states that do not screen for eligibility wait longer for services than people with I/DD residing in states that do screen for waiver eligibility (49 months versus 32 months, on average).
Most people on waiting or interest lists are eligible to receive other types of home care while they wait. Among the 607,000 people on lists for waiver services in 2025, living arrangements are unknown for more than 445,000. Among the people whose living arrangements are known, 96% (154,000) live in the community and 4% (7,000) live in institutional settings. Although most people on waiting lists live in the community, that may not be true for all waivers. In one California waiver for older adults and people with disabilities, nearly 5,000 of the roughly 6,500 people on the waiting list are living in institutions.
While waiting for waiver services, people living in the community are likely to be eligible for other home care through Medicaid state plans. Of the over 5 million people who use home care, KFF estimates that roughly half use services provided through the Medicaid state plan, such as personal care to help with bathing or preparing meals, therapies to help people regain or acquire independent living skills, and assistive technology. States may not use waiting lists to restrict the number of people eligible to use such services and over 80% of people on home care waiting lists are eligible for personal care or other state plan services. They would not, however, have access to more specialized services such as supported employment or adult day care. People on waiting lists who receive state plan services may also have fewer hours of personal care than they would in a waiver program, or they may not have assistance with some of the activities they need help with such as bathing, dressing, preparing meals, or managing medication.